Article

Land-Use Changes in the Sele River Basin Landscape (Southern Italy) between 1960 and 2012: Comparisons and Implications for Soil Erosion Assessment

Department of Sciences and Technologies, University of Sannio, via F. de Sanctis s.n.c., 82100 Benevento, Italy
*
Author to whom correspondence should be addressed.
Submission received: 29 October 2021 / Revised: 18 November 2021 / Accepted: 20 November 2021 / Published: 23 November 2021
(This article belongs to the Special Issue Early Career Scientists’ (ECS) Contributions to Geographies)

Abstract

:
In river basins, the deep interrelationships between land-use changes, soil erosion and rivers and shoreline dynamics are clearer than at a national or regional scale. Southern Italy is an ecologically fragile, desertification-prone territory where land-use changes in the last decades were significant. Notwithstanding this, studies dealing with multidecadal land-use changes in large-sized river basins of Southern Italy and their implications on soil erosion are missing. In this study, we assessed the land-use changes that occurred between 1960 and 2012 in the 3245 km2-wide Sele River basin. We carried out GIS-aided comparisons and analysis of two land-use maps and interpreted the results in terms of soil erosion intensity based on a detailed review of the scientific literature. The results confirmed the trend of the inner areas of Italy and, in particular, of the Campania region moving towards more pristine conditions, with an increase in forest cover, mainly at the expense of grasslands. Agricultural areas remained substantially unchanged, while the area of urban settlements increased. The diffuse afforestation of slopes suggested an overall decrease in soil erosion intensity, which was fully coherent with the geomorphological evolution of both the Sele River and local shoreline reported in literature.

1. Introduction

Studies dealing with land-use changes have a great importance in geographical and geo-environmental research, as proved by the large number of papers on this topic [1,2,3]. First, they provide information about the type and the intensity of human impact on the physical landscape [4,5,6]. Such impacts have important implications on local economies [7]. Land-use changes, together with climate change, also play a central role in controlling soil erosion [8,9], as different land uses affect both the degree of protection of soil against erosional processes and soil properties, including soil erodibility [10,11]. In areas whose economy largely or totally depends on agriculture, the knowledge, control and quantification of soil erosion factors (e.g., land-use changes) and rates is of utmost importance, as the soil represents the physical and chemical support for plants and allows the perpetuation of the agricultural activity [12,13,14]. In turn, vast literature proves that soil erosion processes and rates control the sediment supply to the rivers, which is a key driving factor in their dynamics and geomorphological changes [15,16,17,18]. The knowledge of these changes is also a fundamental starting point in correctly determining flood hazard and risk, i.e., the impact of the river dynamics on the economy of alluvial plains [19,20,21]. Furthermore, the variations of river sediment discharge, which, as stated above, land-use changes significantly and indirectly control, have deep impacts on the shoreline dynamics [22]. For example, land-use changes such as afforestation and constructions of dams generally reduce the sediment supply to the shoreline by the rivers, often resulting in shoreline retreat, which has consequences, among others, on economies based on coastal and maritime tourism [22]. Finally, land-use changes have important implications in biodiversity dynamics [1,23].
Researchers carried out studies dealing with land-use changes at different scales, i.e., at the morphoclimatic regions [24,25,26,27,28,29], continental [30], national [23,31,32,33,34] and regional scale [35,36,37,38]. However, it is at the basin scale that the above-mentioned relationships between land-use changes, soil erosion processes, river solid discharges and, in coastal areas, shoreline dynamics are clearer [39,40,41,42]. In all these studies, GIS analysis and processing of remotely sensed data proved to be fundamental [42,43,44,45,46,47,48].
Southern Italy is an ecologically fragile, desertification-prone territory, whose economy is largely based on agriculture [49]. According to what is stated above, studies dealing with land-use changes in this area would be of main importance, especially at the basin scale. Despite this, a lack of scientific literature on land-use changes at the basin scale in this area exists. The few pre-existing papers exclusively focused on several small- and medium-sized river basins. In particular, D’Ippolito et al. [50] and Ricca and Guagliardi [51] analyzed land-use changes over fifty years in two small-sized basins located in the Calabria region. Apollonio et al. [21] and Romano et al. [52] investigated these changes over periods of 27 and 24 years, respectively, in two medium-sized watersheds at the boundary between Apulia and Campania regions and their implications on floods and river sediment load, respectively. Thus, most of the river basins of Southern Italy remain uninvestigated in terms of land-use changes. In particular, analyses of land-use changes in larger river basins at a multidecadal scale in this area are totally missing.
This study is a first attempt to fill this gap. The land-use changes that occurred over a period of ~50 years (i.e., 1960–2012) in a relatively large-sized watershed (i.e., the Sele River basin), mostly located in the Campania region (Southern Italy), were analyzed by means of a quantitative comparison between raster and vectorial land-use maps in the GIS environment. Furthermore, given the deep interrelationships between land-use changes and soil erosion processes ([30], and references therein), a preliminary subdivision of the basin area into zones with expected different dynamics (i.e., increase/decrease) of soil erosion intensity induced by land-use changes in the investigated period was also proposed.

2. Materials and Methods
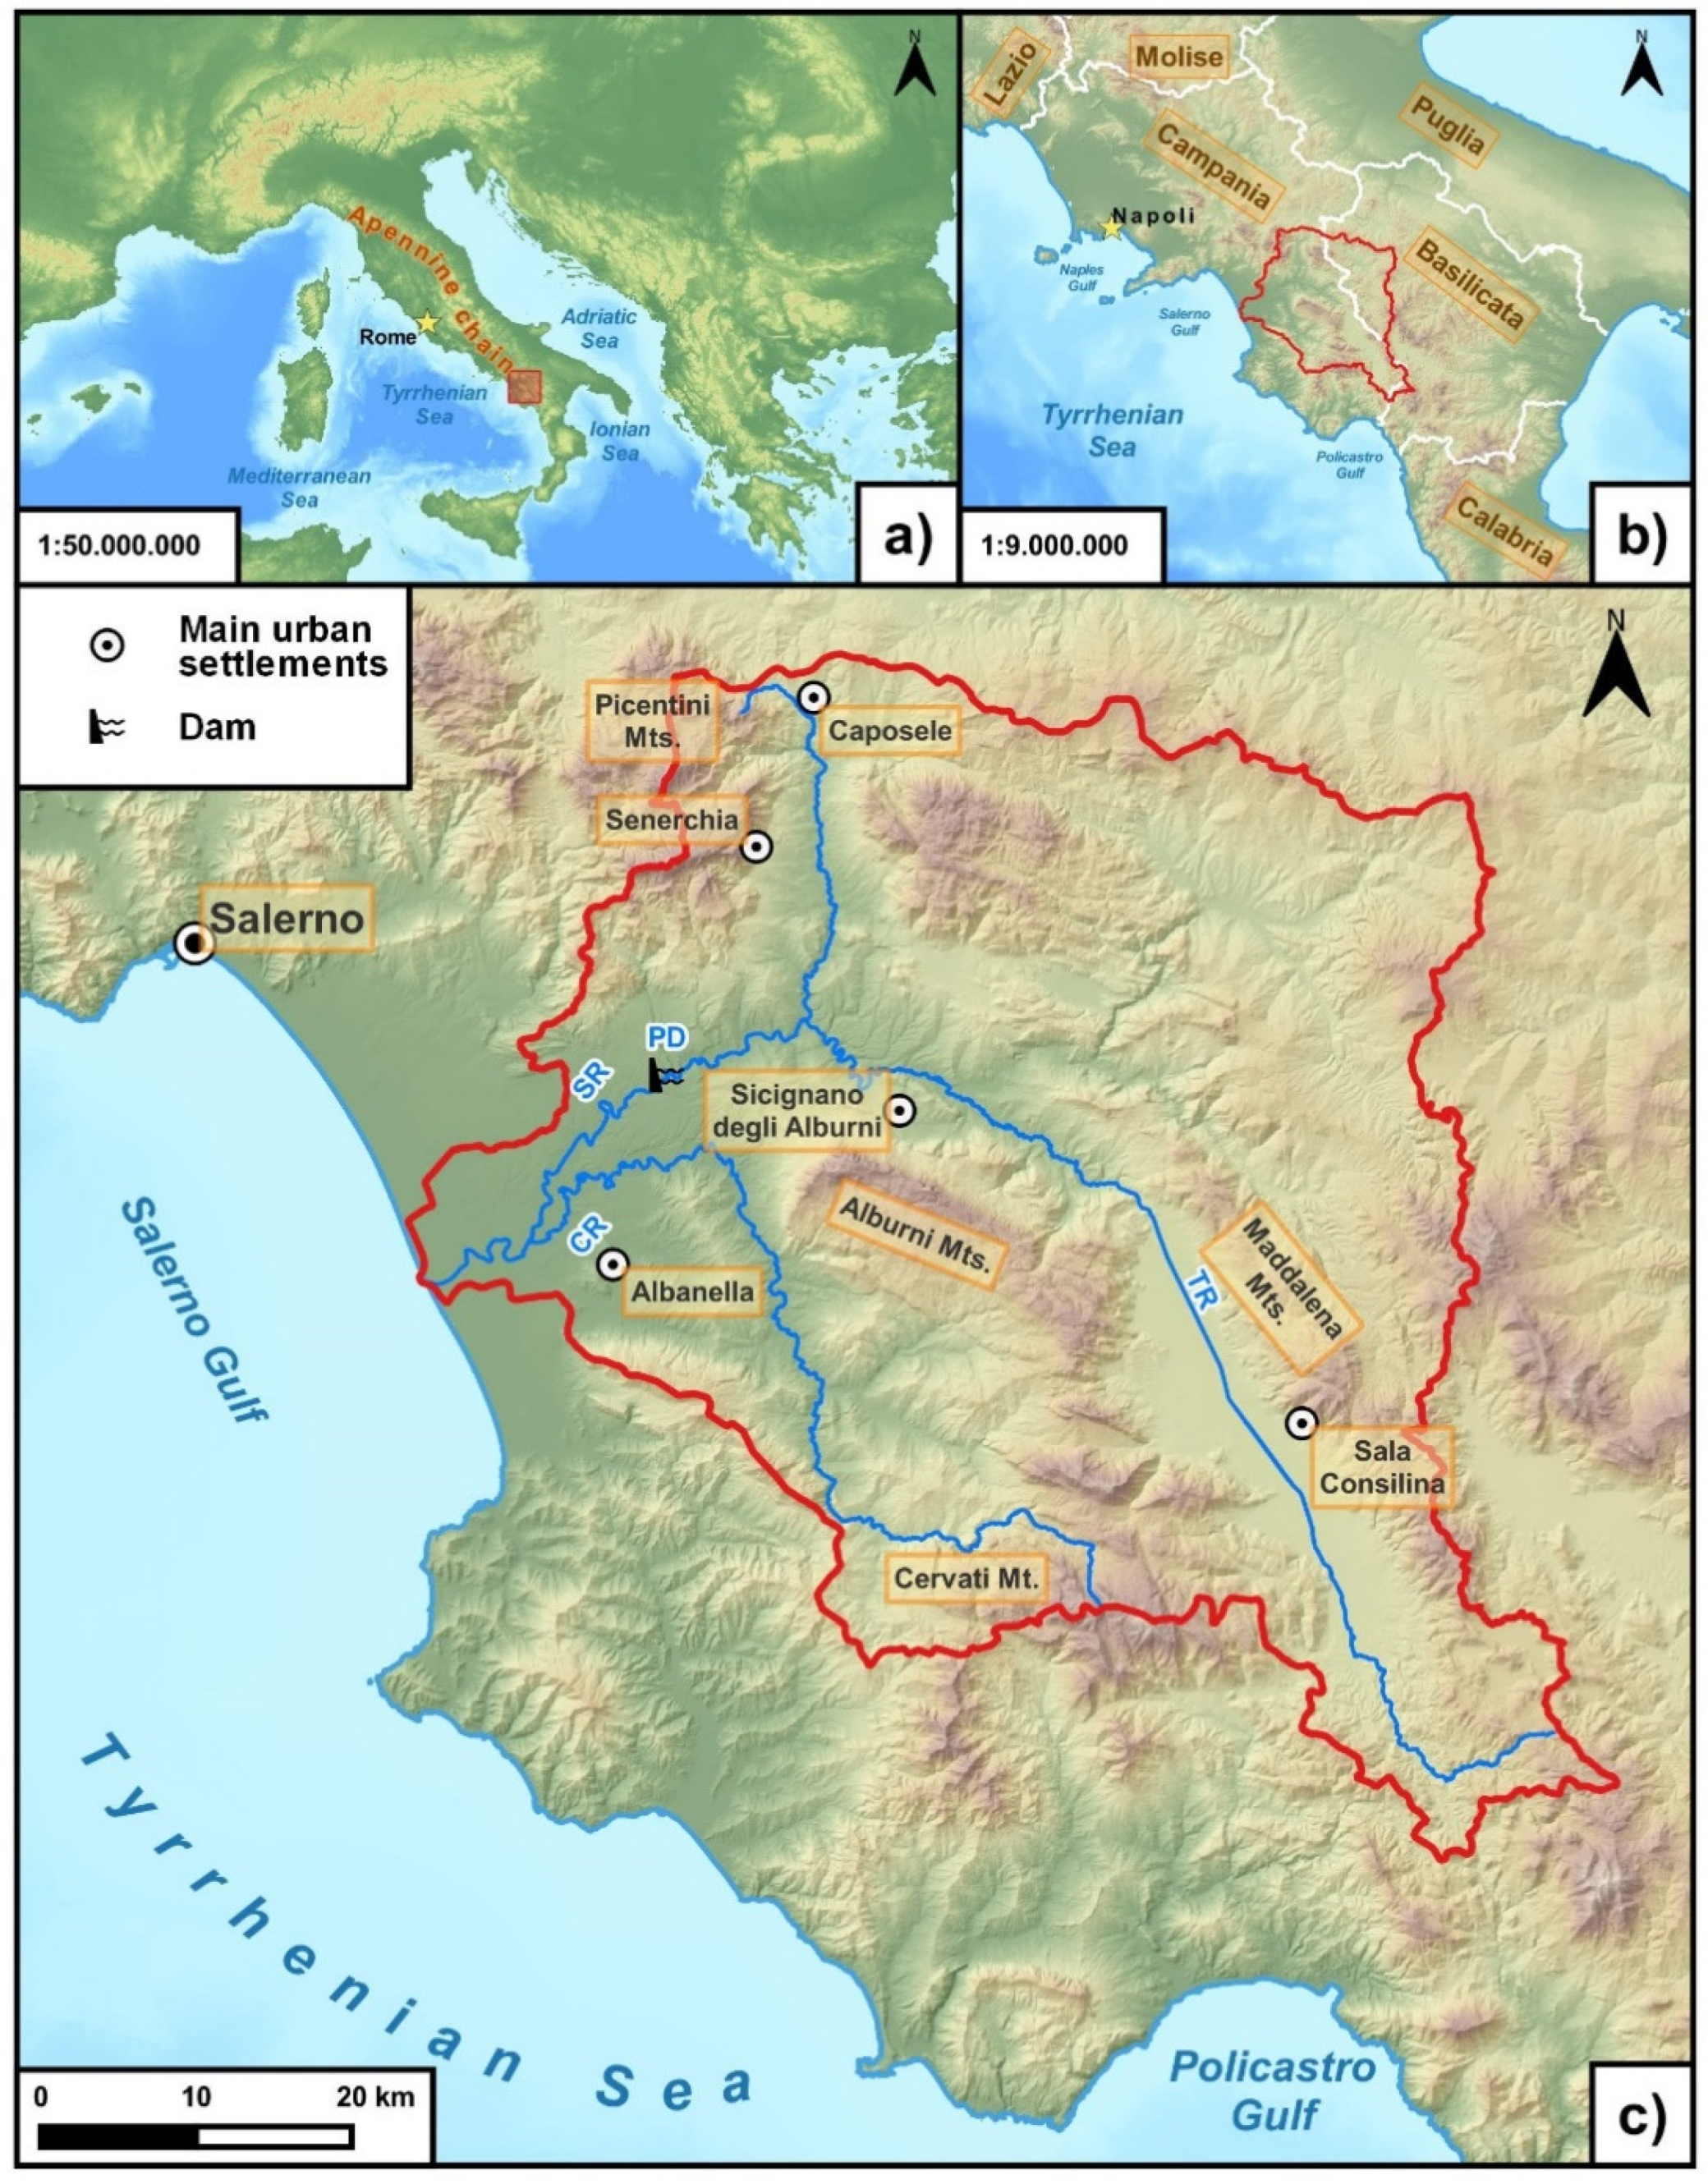
2.1. Study Area

The Sele River basin is located in Southern Italy, at the geographical boundary between the Campania and Basilicata regions, between 40°11′ N and 40°52′ N latitude and 14°58′ E and 15°47′ E longitude (Figure 1). It covers a surface area of 3245 km2. Altitudes range between 0 m a.s.l. and 1886 m a.s.l. [53], with an average elevation of approximately 600 m [54]. Mountainous relieves account for more than 54% of the study area, while flat land surfaces accounted for 5.1%.
The climate is of Mediterranean type, with prolonged warm and dry summers and wet and mild winters [54]. Mean annual precipitation ranges from 700 to 2000 mm, with an average of 1180 mm, with important spatial variation of both erosive rainfall and temperature, according to the elevation and the distance from the coast [55]. Stormy rainfall events with the highest hourly and half-hourly intensity mostly happen from May to September [54].
According to the method proposed by Rinaldi et al. [56], the Sele River basin can be subdivided into three main physiographic units, i.e., (i) the Apennine mountain range, (ii) the low-altitude hills/alluvial valleys and (iii) the coastal plain [53].
From a geological standpoint, the Apennine mountain range physiographic unit is mainly shaped into limestone and dolostone, Triassic to Cretaceous in age [57]. The hilly sectors of the basin have a terrigenous bedrock, mainly Miocene to Pliocene-aged. The main rivers flow into valleys of morphostructural origin, infilled with alluvial, volcanic and slope deposits [58,59,60]. Finally, the coastal plain physiographic unit is mainly made up of beach and dune-ridge sandy deposits, back-ridge flat depression deposits and travertines [61].
From a geomorphological standpoint, steep slopes, locally deeply dissected by gorges, characterize the Apennine mountain range physiographic unit. At the top of these slopes, karstified remnants of ancient erosional landscapes are present [58]. In contrast, the hilly relieves shaped into the terrigenous deposits are generally gently sloping and gently rolling and affected by severe water erosion and mass movements [53]. Alluvial and slope deposits, often arranged into coalescent and/or telescopically arranged alluvial fans, connect the slopes to the alluvial plains. Different orders of river terraces characterize the alluvial plains. Locally, structural terraces shaped into pyroclastic deposits (i.e., Campanian Ignimbrite) and travertines are present.
The Sele River is the main watercourse flowing into the basin. It has a length of ~68 km and has the highest mean annual flow discharge among the rivers of Southern Italy (i.e., ~69.4 m3/s). The Sele River springs were captured in the 1910s to supply drinkable water to a vast area of Southern Italy. Between the end of 1929 and 1932, the Sele River was also dammed by the construction of the Persano Dam, which caused the formation of the Persano Reservoir. The 92 km-long Tanagro River and the 63 km-long Calore Lucano River are the main tributaries of the Sele River (Figure 1c). Both the alluvial plain of the Tanagro River and the coastal and alluvial plain of the Sele River were extensively reclaimed in the 1920s.

2.2. Data Source and Methodology

We investigated the land-use changes in the Sele River basin between 1960 and 2012 by means of a GIS-aided analysis of two land-use maps.
The first map is the Map of Land Cover, produced by the National Research Council (CNR) Touring Club (hereinafter, CNR-TC) in 1960 [62]. The map, 1:200,000 scaled, was in a raster format. We scanned the map at 1200 dpi and georeferenced in the UTM-WGS84 coordinate system using the “Georeferencing” functions of the ESRI® ArcGIS 10.4.1 software. Because the map covers the entire Italian territory, we manually digitized the area of the Sele River basin only. Previously, we digitized the boundary of the basin, in GIS environment, from 1:25,000 topographic maps produced by the Italian Geographical Military Institute (IGMI). Finally, we calculated the area of each digitized polygon, corresponding to land surfaces with different land uses, by using the “Calculate Geometry” ArcGIS tool.
The second map, reporting the land-use data for the studied basin in 2012, was obtained from Corine Land Cover shapefiles, freely downloadable from the www.sinanet.isprambiente.it website [63]. The shapefile was georeferenced in UTM-WGS84, zone 32 N, so we used the “Georeferencing” functions of ArcGIS software to re-project the shapefile in the UTM-WGS84 coordinate system, zone 33 N.
Because of some differences in land-use classes between the two maps, we carried out a harmonization of such classes. We used the different response to soil erosion processes, widely accepted in scientific literature ([8,9], and references therein), as main criterion for the harmonization. Given the deep differences between the land-use classes of the two maps, due to their different scopes, years and methods of production, harmonization was mainly possible only at the first level of the Corine Land Cover. Thus, we defined six broad classes: agricultural areas, forests and chestnuts, wetlands and water bodies, artificial surfaces, olive groves and fruit trees, and grasslands and pastures. Table 1 reports, in detail, the harmonization between the land-use classes of the two maps. Chestnuts were included in the “forests and chestnuts” land-use class due to their canopy cover >30%.
Because of the deep influence of land-use changes on soil erosion processes [8,9], we interpreted the detected land-use changes in terms of increase/decrease in soil erosion. Because the C factor of the USLE equation [64] quantitatively expresses the effect of land-use changes on soil erosion (in particular, on soil erosion induced by diffuse water runoff, while gully, wind and crop erosion are excluded), we assigned to each land-use class a mean C factor calculated according to the C factor values reported by Panagos et al. [30]. For artificial surfaces, not considered by Panagos et al. [30], we took into account the vast literature dealing with impacts of urbanization on soil erosion ([65,66,67], and references therein) that converged in highlighting the severe increase in soil erosion associated to any land-use change that leads to urbanization. Accordingly, we ordered the land-use classes in terms of decreasing “degree of protection” of soil against erosion. Then, we ranked each type of land-use change (e.g., afforestation, deforestation, agricultural extensification and so on) in terms of increase or decrease in soil erosion processes. For example, we assigned the highest increase in soil erosion (i.e., severe increase) to the land-use change from the “most protective” land-use class (i.e., forests and chestnuts) to the “less protective” one (i.e., artificial surfaces). We excluded flat land surfaces from the analysis, as land-use changes do not significantly affect either water or mass erosion where a topographic gradient is missing. On these land surfaces, we assumed that soil erosion intensity induced by land-use transitions remained unchanged.

3. Results

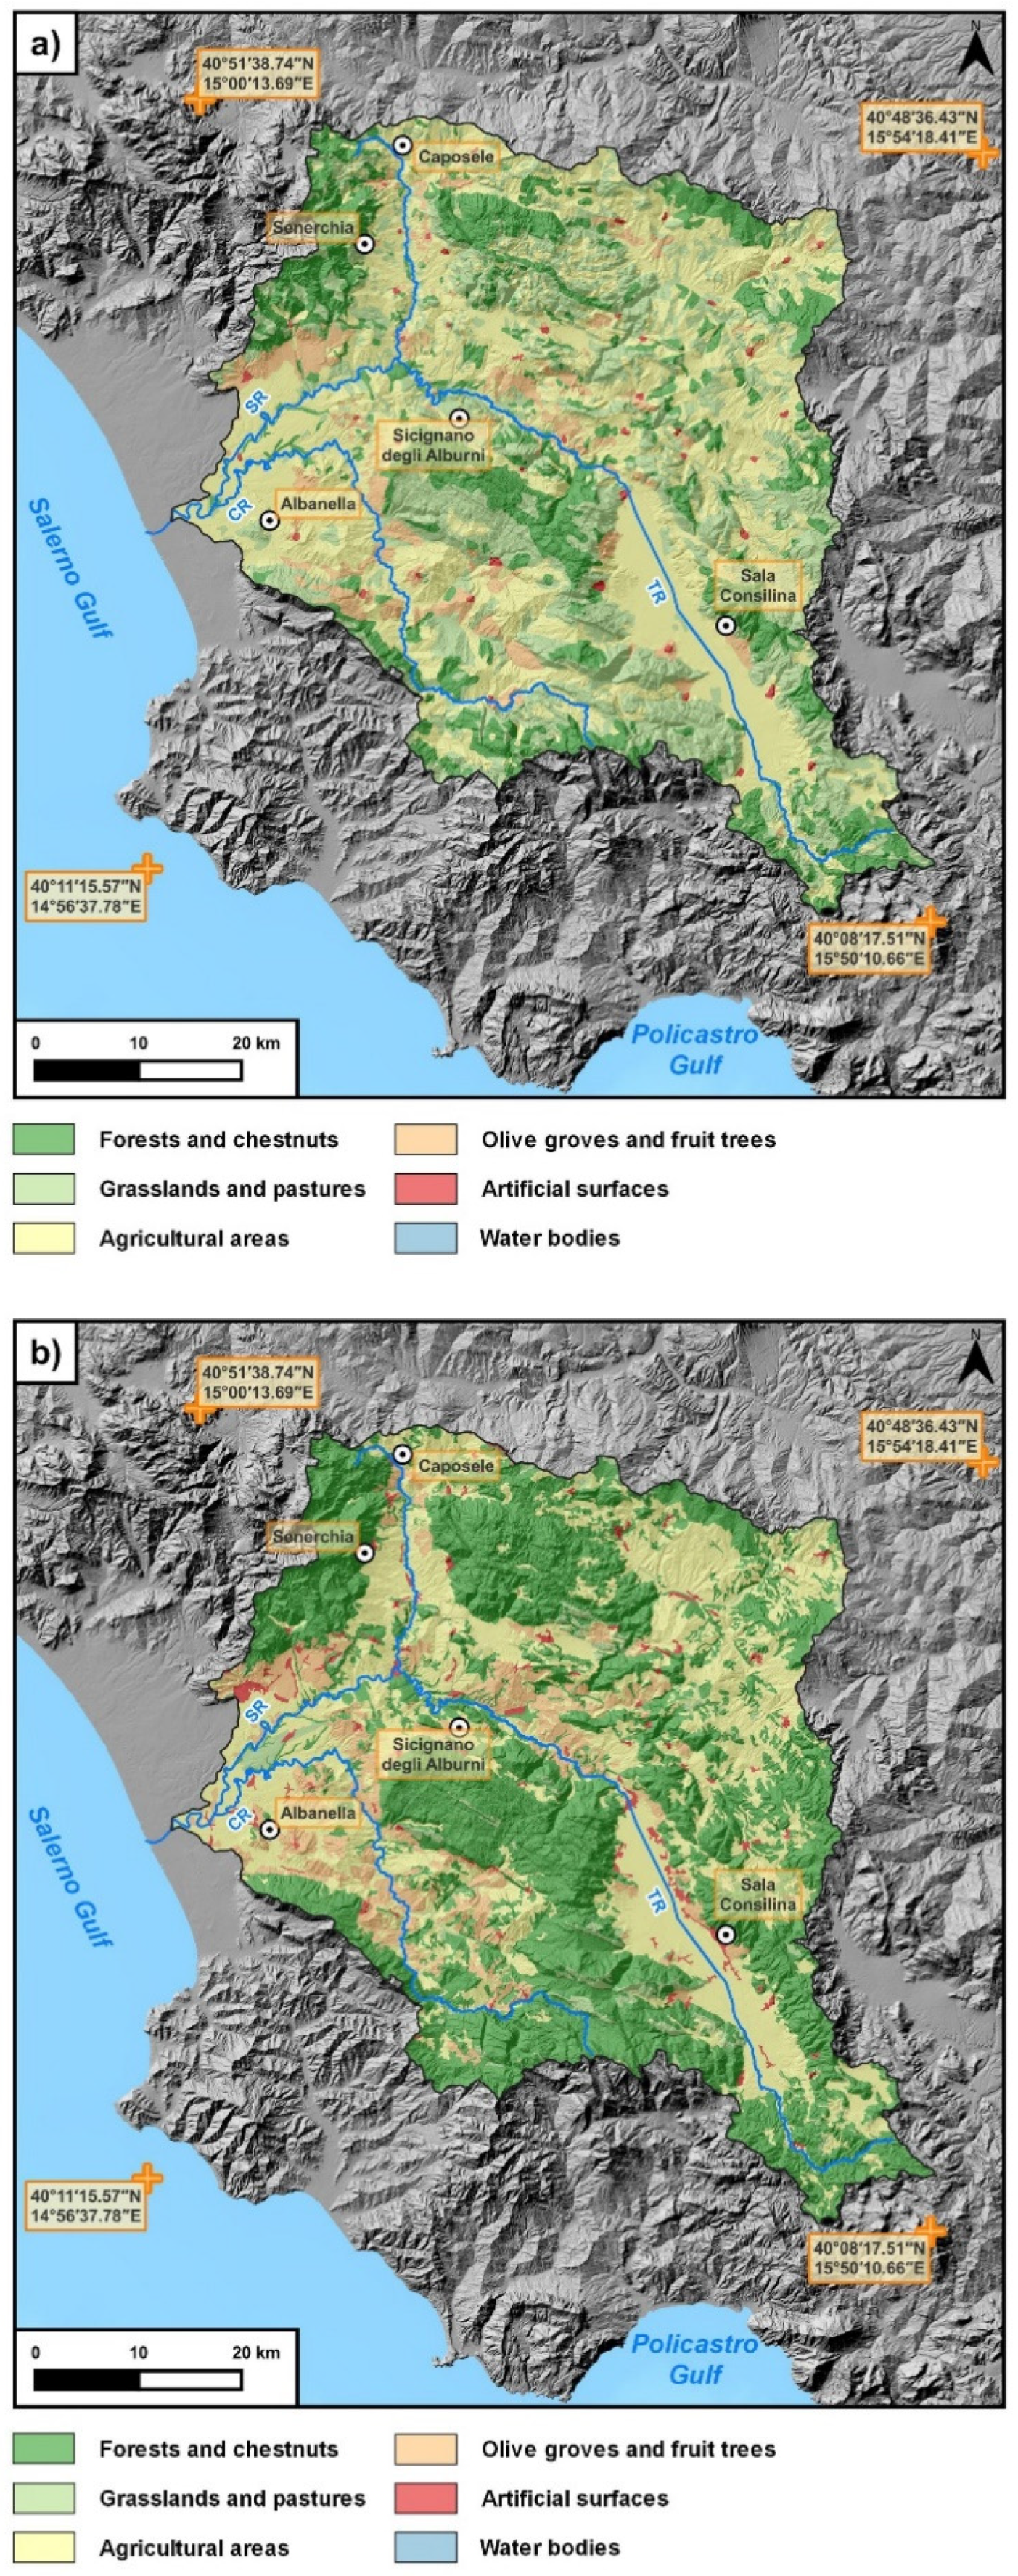
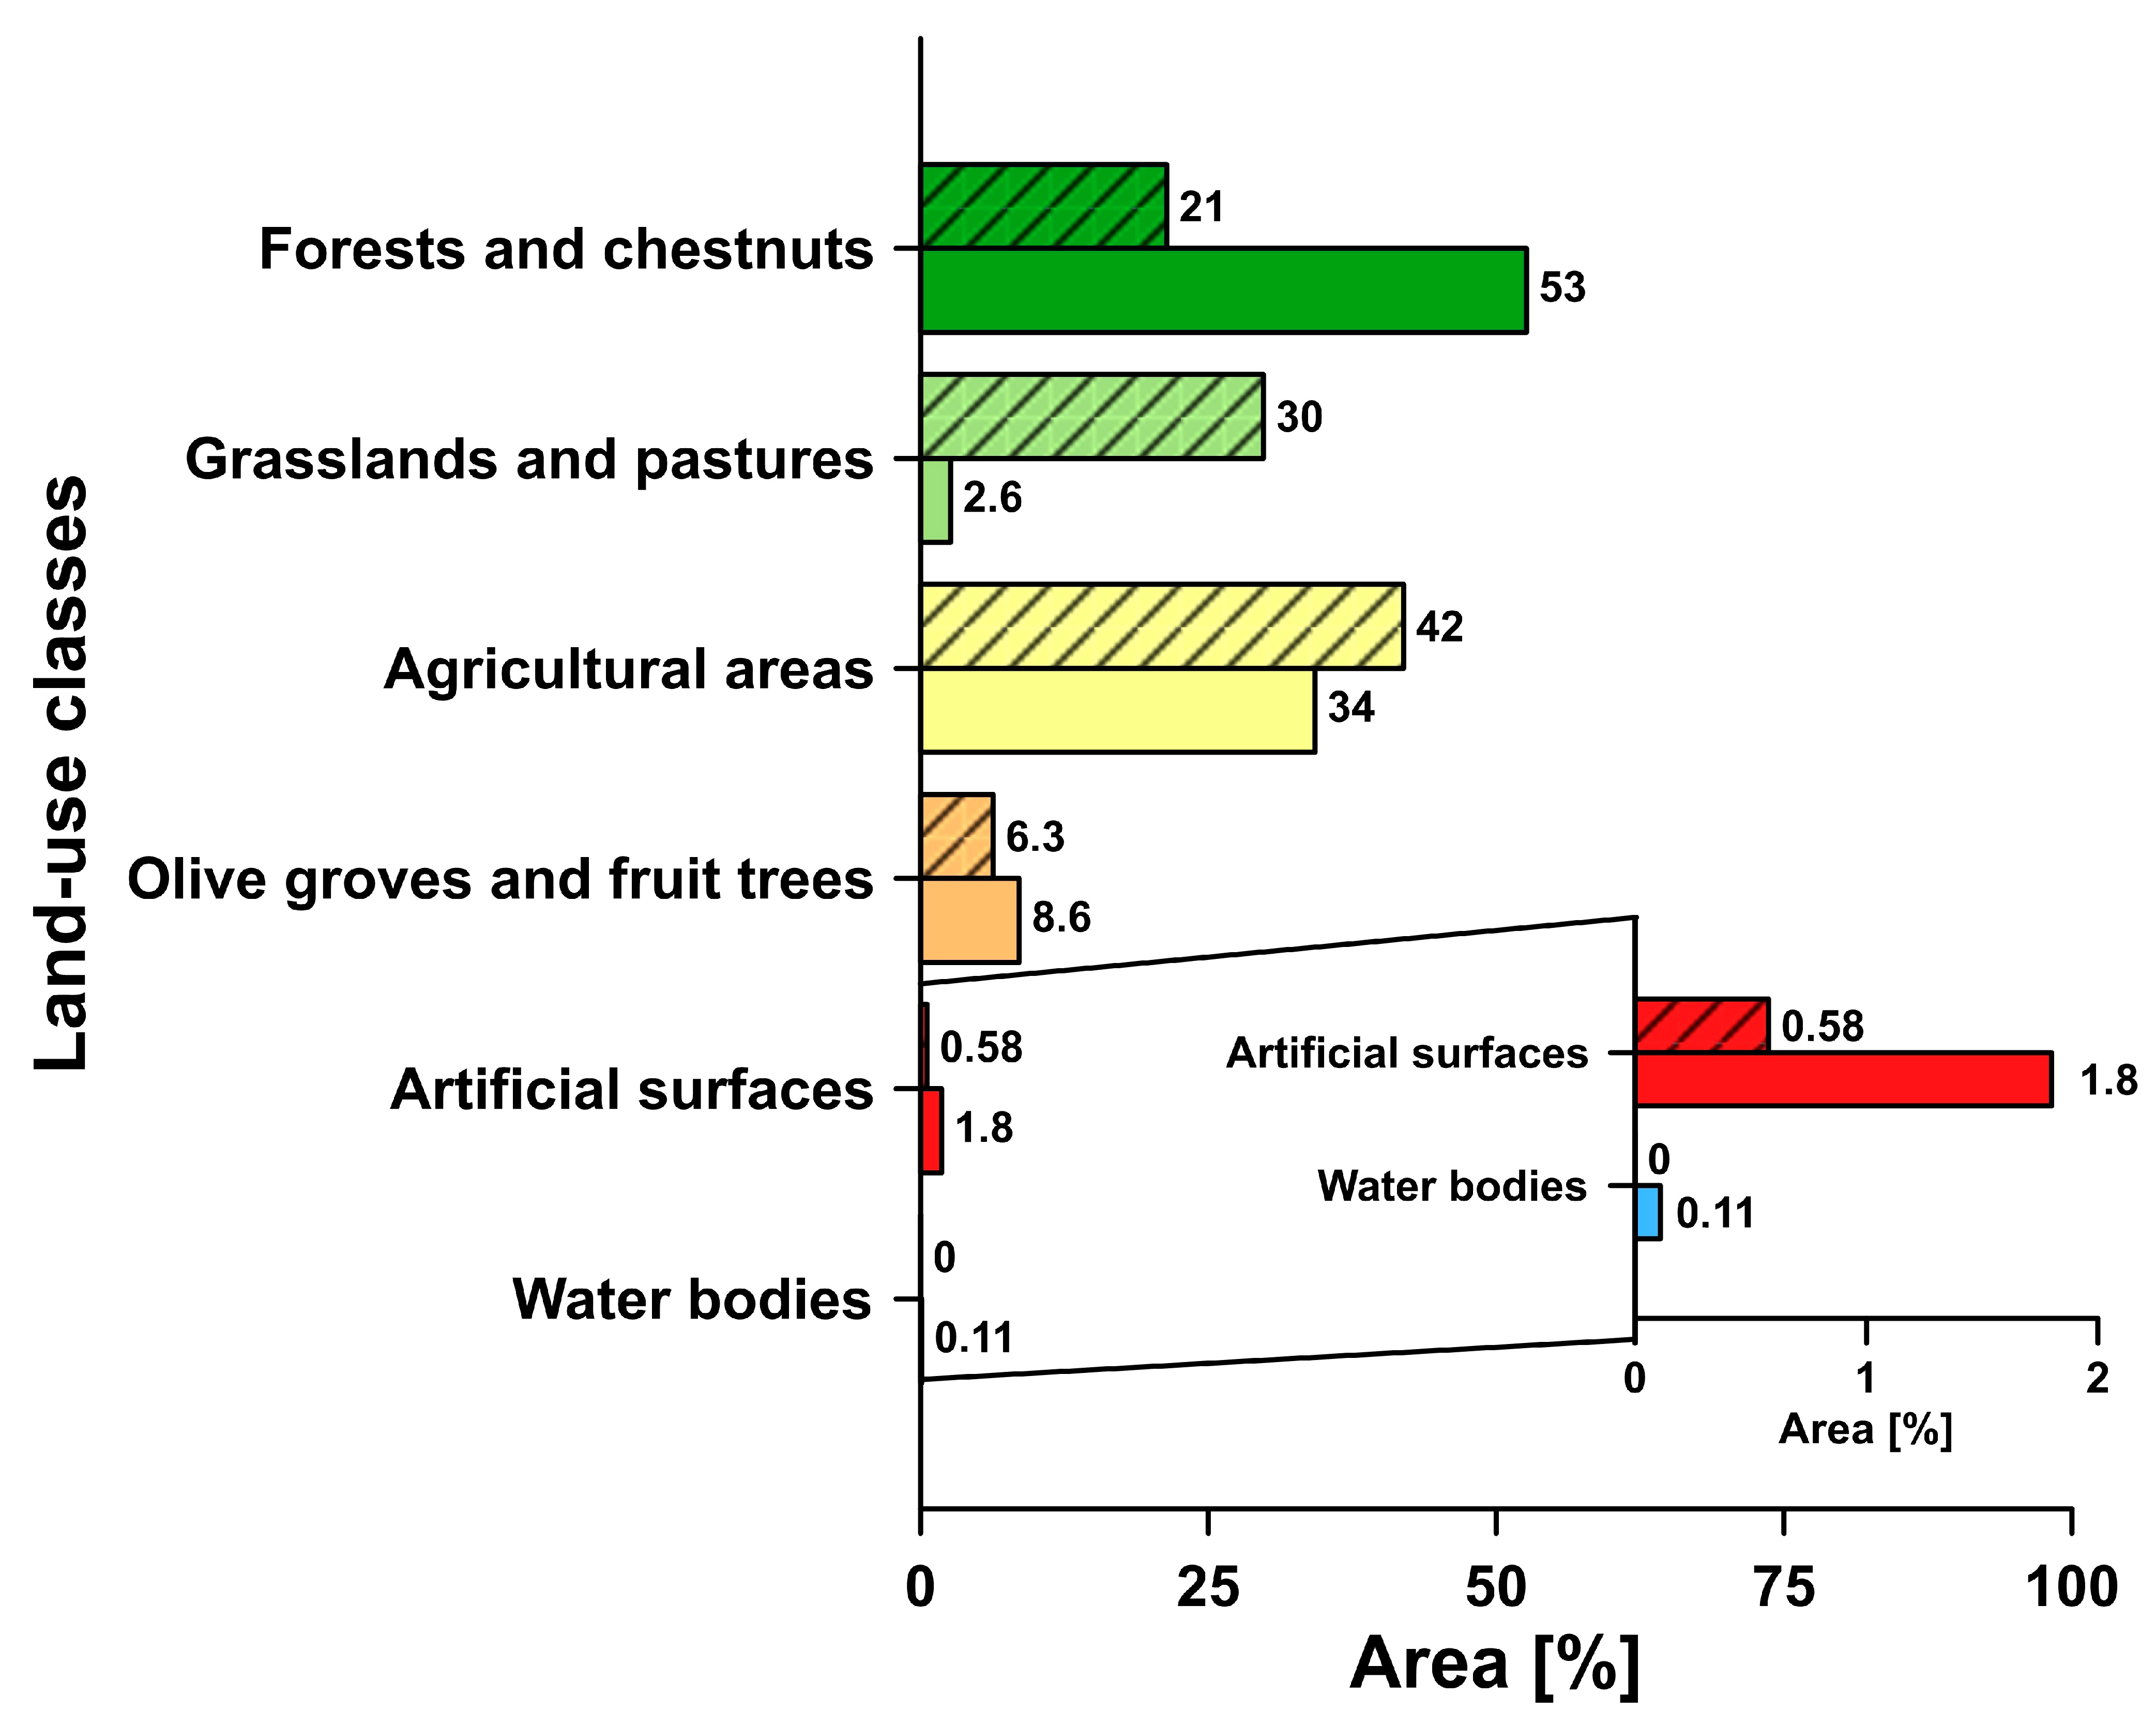
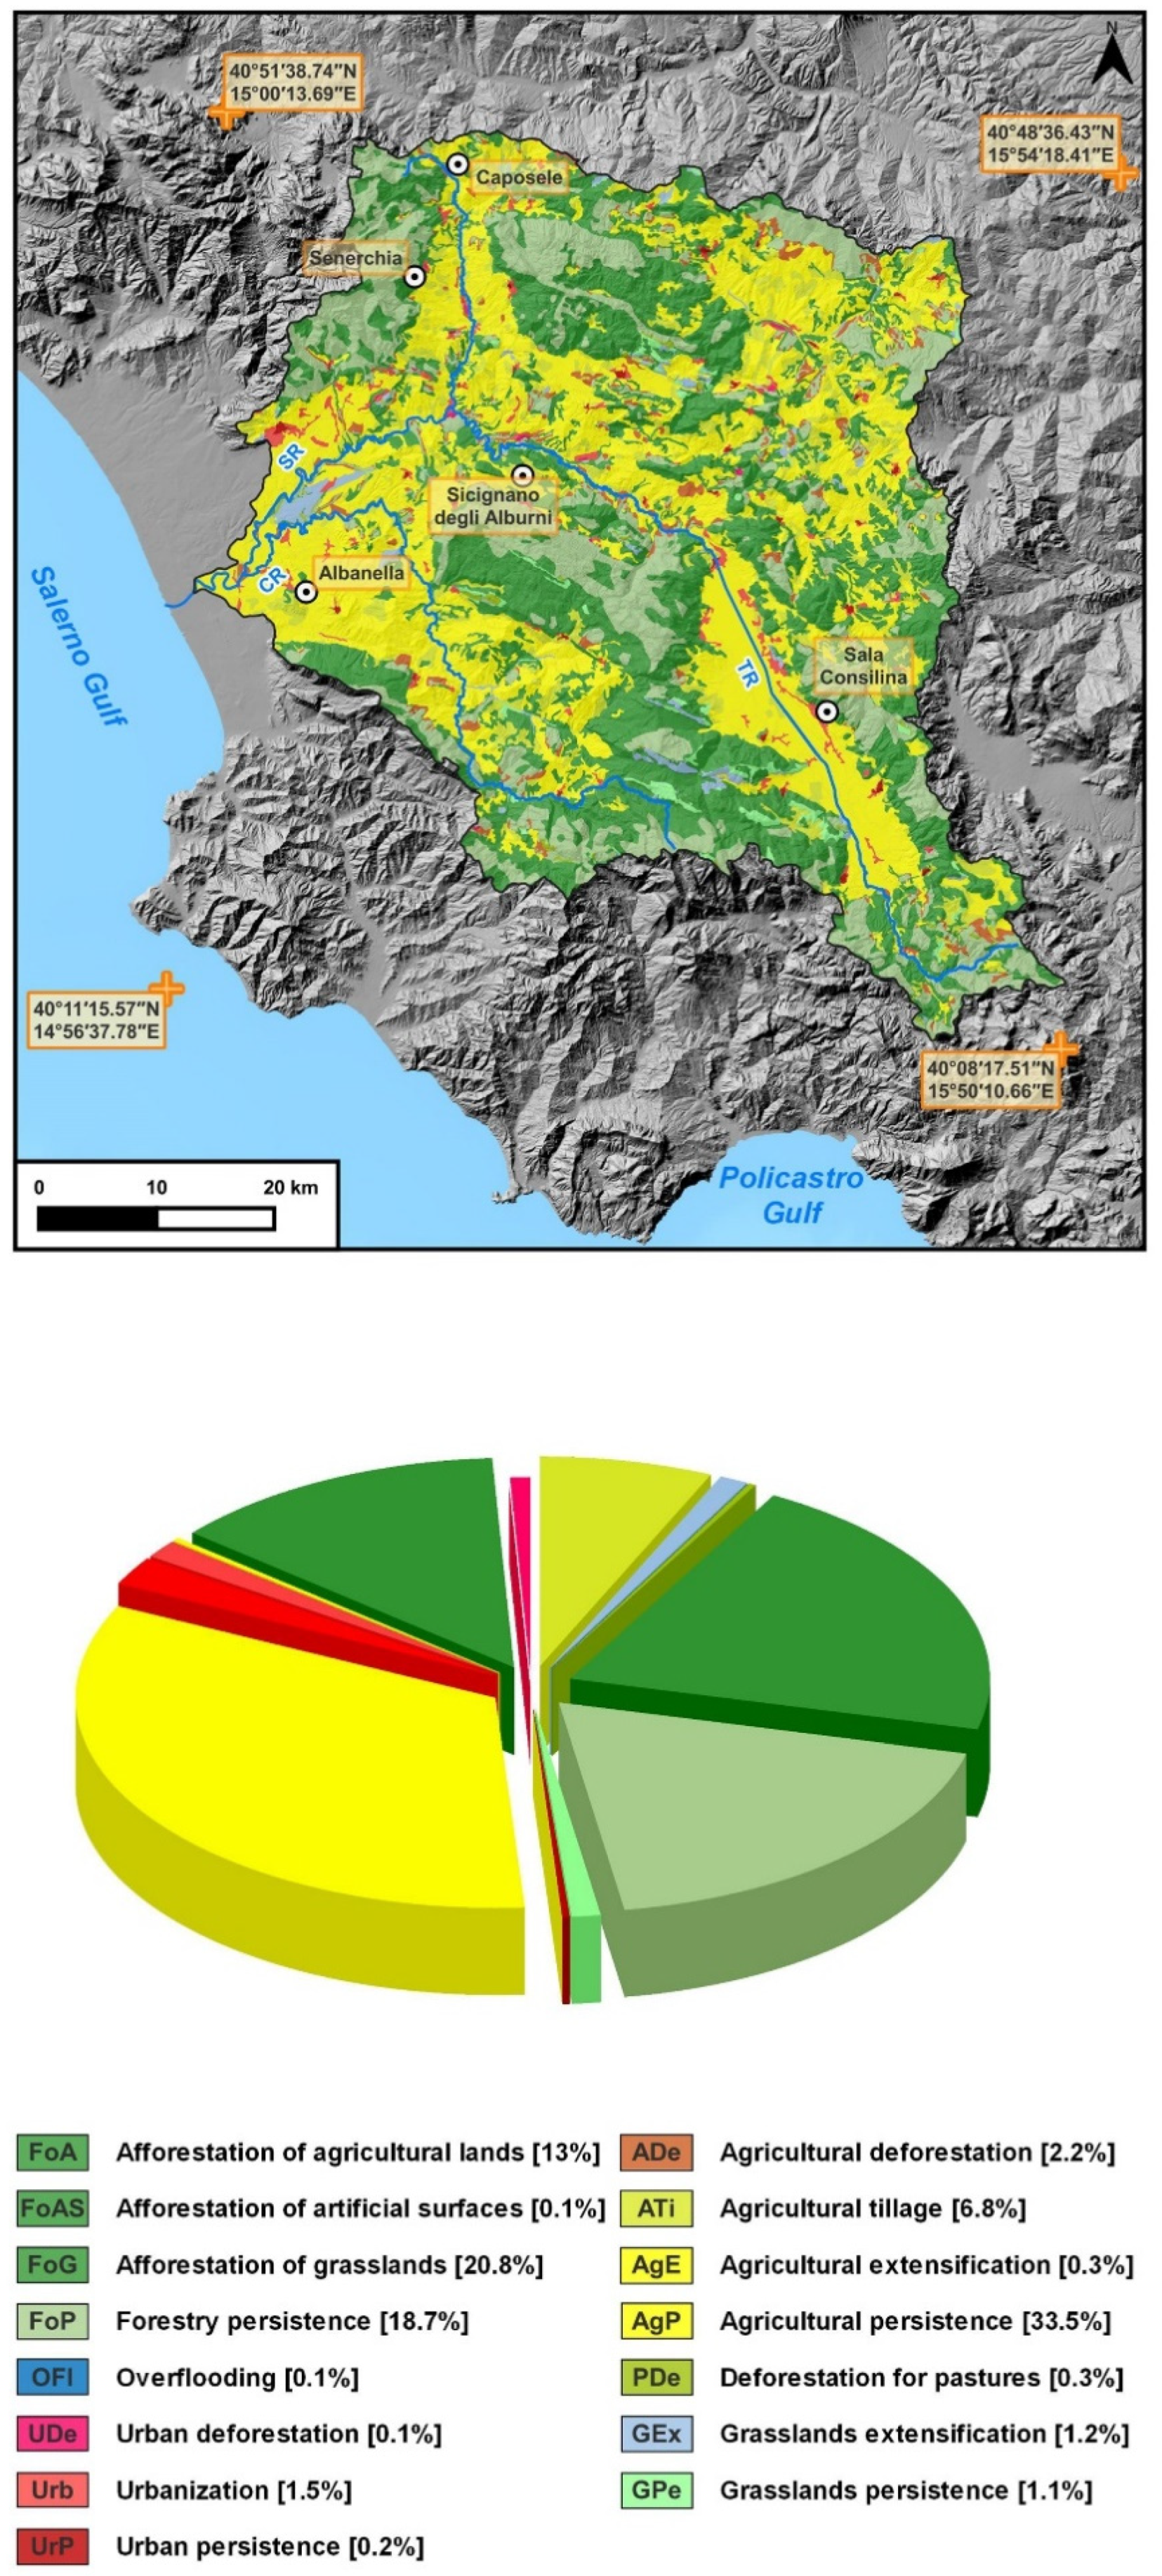
3.1. Land-Use Changes

Figure 2 shows the spatial distribution of the land-use classes in the Sele River basin in 1960 and in 2012. Figure 3 compares the percentages of the total surface of the study area in the considered years. Finally, Table 2 reports the extension of the land-use classes in the considered years and their variations compared with the area of each class in 1960.
Figure 2a and Figure 3 show that in 1960, 42% of the total surfaces consisted of agricultural areas (mainly arable lands and, to a lesser extent, kitchen gardens and vineyards) and 6% of olive groves and fruit trees. Thus, in 1960, 48% of the total surface of the basin was used for agriculture. In 2012, agricultural areas decreased to 34%, while land surfaces used for olive groves and fruit trees slightly increased to 9%. Thus, in 2012, the total surface used for agriculture slightly decreased compared with 1960 (i.e., from 48% to 43% of the total area). Figure 2 shows that in both 1960 and 2012, the land surfaces used for agriculture were mainly concentrated along the alluvial valleys and on surrounding hilly relieves. In particular, olive groves and fruit trees prevailed over other agricultural areas on hills, whereas the opposite occurred in the river valleys. In contrast, mountainous relieves were mostly covered by forests (mainly oak and beech groves and coniferous forests) and pastures in both the considered years. In particular, Figure 3 shows that, at the basin scale, forest cover significantly increased from 21% in 1960 to 53% in 2012, while pastures dramatically decreased from 30% to 3%. Artificial surfaces tripled in the considered period, even if they occupied a negligible percent of the total surface (0.6 and 1.8%, respectively).
The geoprocessing in GIS environment of the two land-use maps shown in Figure 2 highlighted a series of land-use changes summarized in Figure 4, the latter adapted from Di Gennaro et al. [68].
Figure 5 shows the spatial distribution of these changes in the Sele River basin in the considered period and their amount in terms of percent of the total surface. Figure 5 shows that the land-use remained unchanged (i.e., forestry, agricultural, grassland and urban persistence; Figure 4) in slightly more than a half of the basin (i.e., 54% of the total surface). However, the most notable result is that more than one third of the basin (i.e., 34% of the total surface) underwent afforestation in the considered period. Such land-use change mainly affected the mountainous relieves located both in the central part (Alburno and Cervati Mts.; Figure 1) and along the external boundaries of the basin (Figure 5). Afforestation mainly occurred at the expense of grasslands and pastures. More precisely, Figure 5 shows that, at the basin scale, more than 20% of area occupied by grasslands in 1960 was covered by forests in the following five decades, while afforestation affected agricultural areas to a slightly lesser extent (i.e., 13% of the total surface of the basin). In contrast, a negligible percentage (i.e., 2.5%) of the basin experienced deforestation in the considered period. Finally, artificial surfaces covered less than 2% of the land surfaces.
Some of the land-use changes described above at the basin scale (i.e., the percent of the total surface of the basin affected by a given land-use change) are still more evident when considered at the scale of the single land-use class (i.e., the percent of the total surface of each land-use class that experienced the same type of land-use change). Table 3 summarizes the obtained results.
The most striking result is that, in five decades, forests covered ~71.6% of the total surface of grasslands from 1960. In the same period, forests also covered a significant part of both agricultural areas and olive groves/fruit trees (25 and 25.9%, respectively). In contrast, deforestation affected a much lower percent of the forested areas from 1960. In particular, agricultural deforestation affected only 10.5% of the former forests (1.6% for olive groves and/or fruit trees plantations and 8.9% for other agricultural uses), while a very negligible percent (i.e., 0.5%) of forests were cut for urbanization. Finally, Table 3 shows that some parts of the negligible area occupied by artificial surfaces in 1960 (i.e., less than 1% of the basin area) changed into forests (18%), agricultural areas (28%) and olive groves (11.3%). Visual inspection showed that forests mainly occupied reclaimed sediment extraction sites, while agricultural areas were forms of “urban agriculture”, e.g., kitchen gardens. Artificial surfaces remained unchanged where impervious covers occurred (42.6% of the land-use class area from 1960).

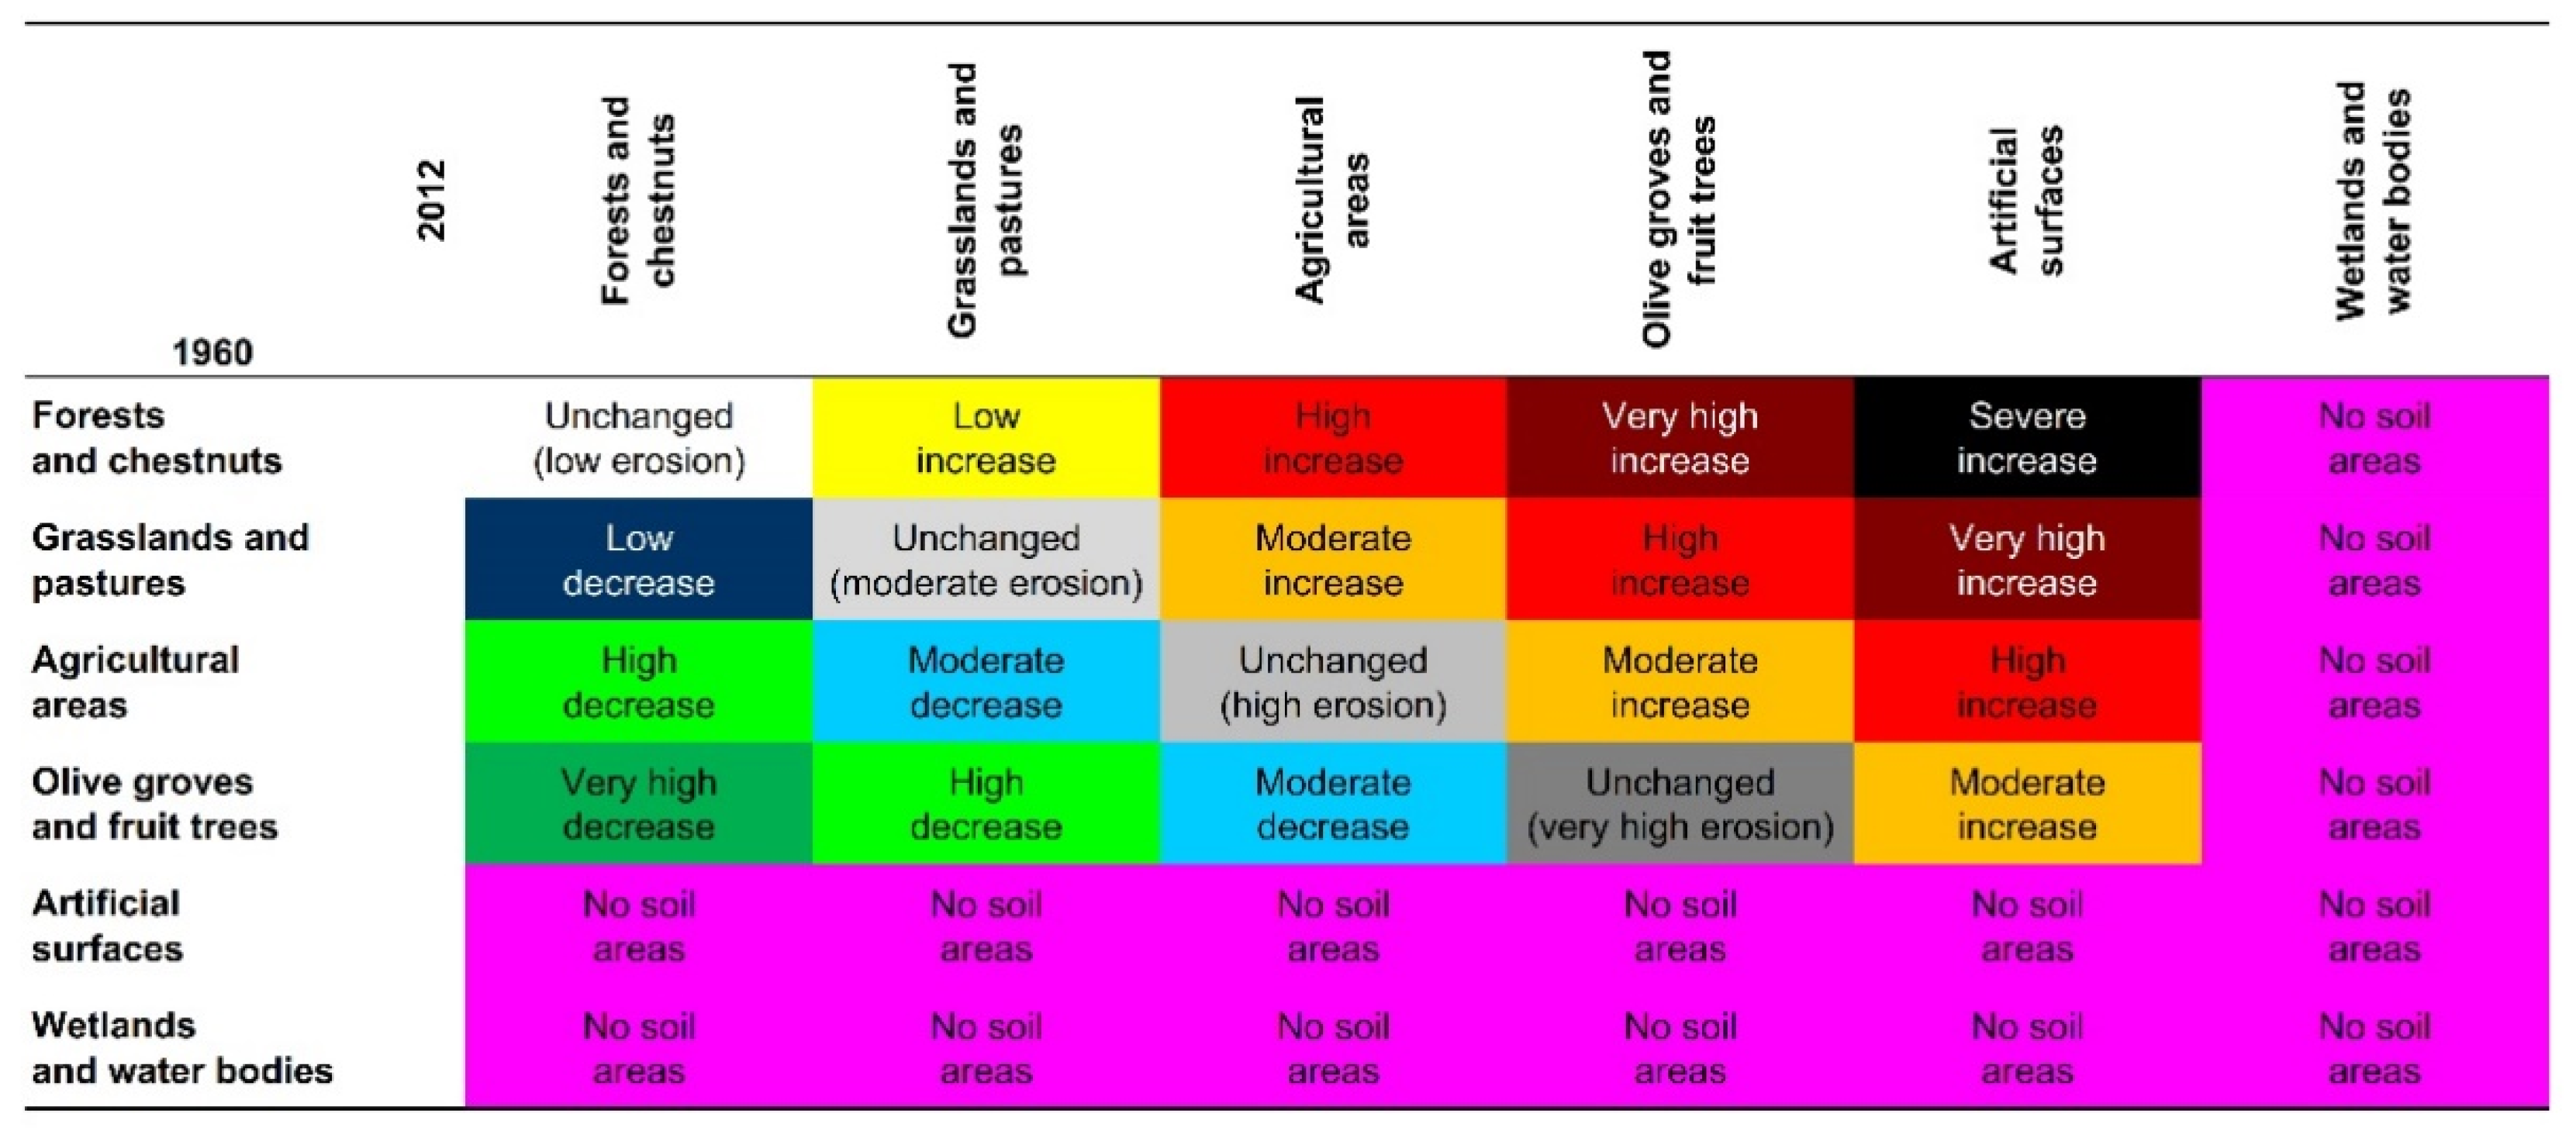
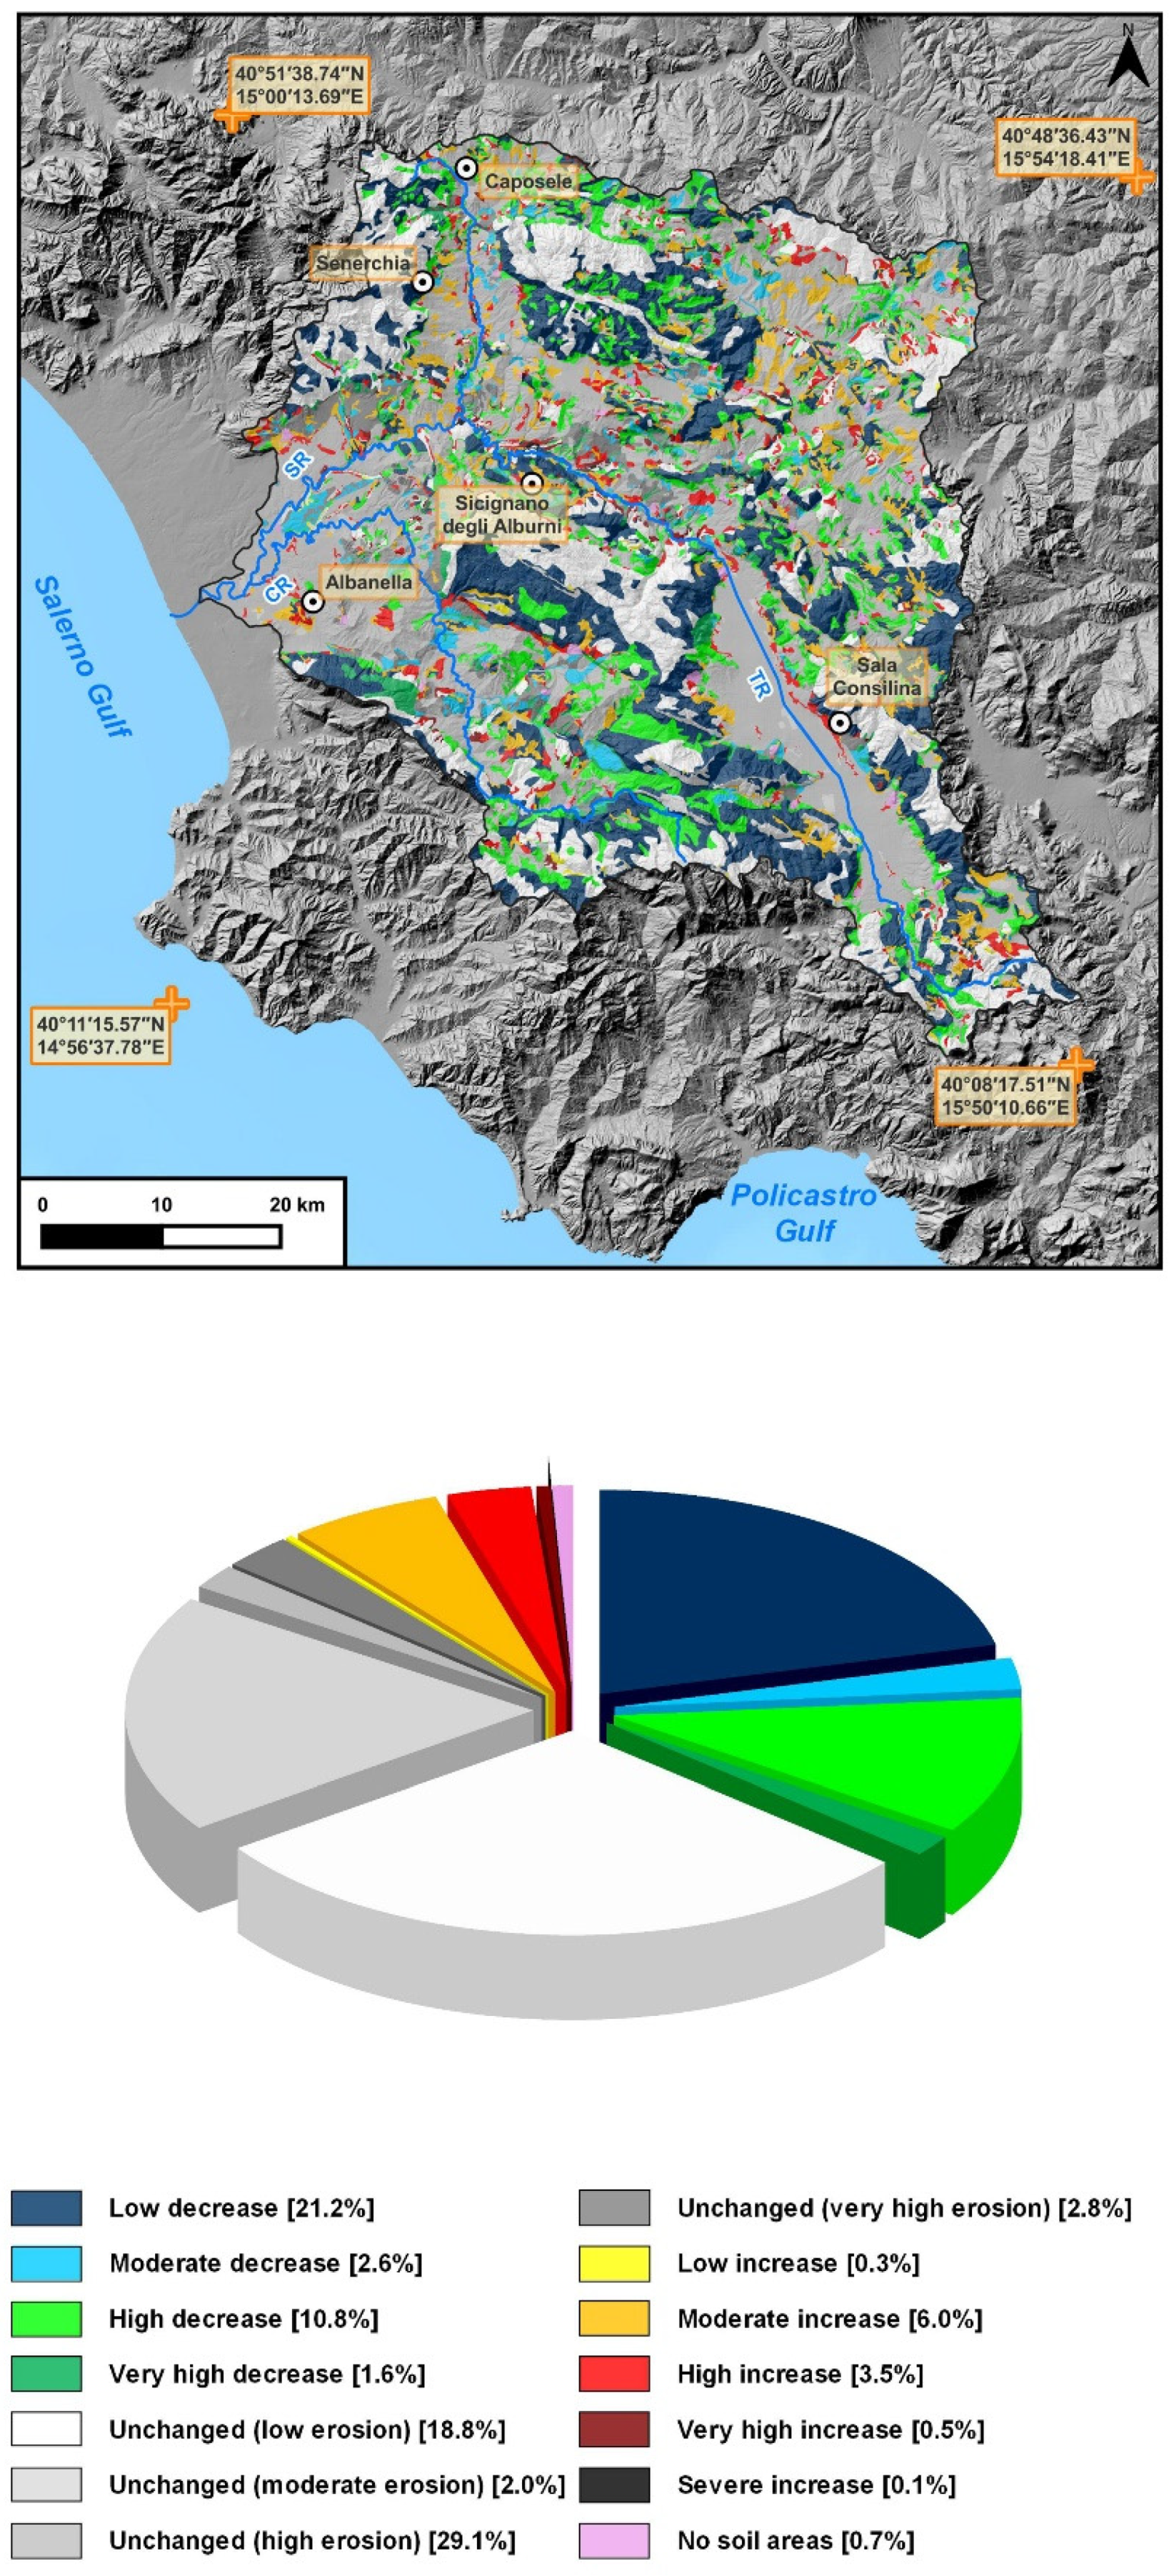
3.2. Variations in Expected Soil Erosion Intensity Induced by Land-Use Changes

Because the C factor of the USLE equation expresses the protective effect of the different land-uses against soil erosion [64], we calculated the C factors of the land-use classes occurring in the study area according to the values reported by Panagos et al. [30]. Unfortunately, the quoted study does not provide C factor values for artificial surfaces. This problem was partly overcome by analyzing the vast scientific literature, which converges in highlighting that urbanization is the most destructive land-use change in terms of soil erosion processes, due to trees being clear cut, earth-moving, soil compaction, road building, increase in impervious covers that favor runoff and arson [65,66,67]. Table 4 reports the C factors calculated, where possible, for the land-use classes occurring in the study area, ranked in terms of increasing protective effect against soil erosion. We qualitatively labelled each land-use class in a relative scale of expected intensity of soil erosion processes, according to the literature.
According to Table 4, we interpreted each land-use change in terms of increase or decrease (or stability) in expected soil erosion intensity, producing the matrix of Figure 6. Figure 7 shows the spatial distribution in the Sele River basins of the classes of expected variations in soil erosion intensity induced by land-use changes and their amount, expressed as percent of the total surface of the study area. The results showed that the expected intensity remained unchanged (with different degrees of expected erosion) in 53% of the total surface of the basin. In contrast, expected soil erosion decreased on 36% of the total surface of the basin and increased on 10%. The decrease in expected soil erosion was mainly low (21% of the basin area) and induced by the afforestation of grasslands (Figure 6) and, secondly, high due to both afforestation of agricultural areas and grassland extensification of olive groves and fruit trees (Figure 4). In contrast, increase in soil erosion was mainly moderate (6% of the basin area) and mainly induced by agricultural tillage of grasslands, conversion of agricultural areas into olive groves/fruit trees plantations and, to a lesser extent, urbanization of olive groves (Figure 6).

4. Discussion

4.1. Selection of the Land-Use Classes

As correctly highlighted in several papers ([69,70], and references therein), any analysis of land-use changes based on datasets from different sources is subject to technical problems. To solve these problems, Falcucci et al. [23] suggest reducing the number of classes and choosing classes that represent markedly distinct land-use types. Thus, our choice to select, in this study, a reduced number of classes that are representative of distinct land uses follows such suggestions, with the aim to reduce uncertainties in the land-use changes assessment.
The selection of the classification criterion is also of utmost importance. Such criterion should be coherent for all the classes and strongly supported by literature data. The different degree of protection of soil against erosion, which we used as classification criterion in this study, unquestionably meets such requirements. More in detail, a large number of previous studies ([71,72,73], and references therein) proved, for example, the protective effects of forests against soil erosion. In this study, we grouped forests and chestnuts in the same land-use class (i.e., “forests and chestnuts”). Corine Land Cover nomenclature [74] supports our choice, as it suggests classifying forests as all those areas occupied by trees higher than 5 m with a canopy closure of at least 30%. Chestnuts occurring in the study area meet such requirement. The increase in soil erosion due to the removal of natural vegetation (i.e., forests and grasslands) for agriculture is also widely proved in scientific literature [75]. In particular, olive groves offer less protection to soil against erosion than other agricultural uses due to the low density of trees, generally cultivated on steep slopes [9]. The higher C factor estimated for olive groves by Panagos et al. [30] at European scale, based on the best available dataset in combination with a literature review, also proved the scarce protection offered by olive groves against soil erosion induced by water runoff. Our choice to include both olive groves and fruit trees plantations into a single class was because low density of trees and cultivation on steep slopes are common to both these land-use classes. According to what is stated above, we created the class “olive groves and fruit trees”, which we separated from the “agricultural areas” class that includes other agricultural uses. Finally, the class “artificial surfaces” includes both urban and industrial settlements and sediment extraction sites (i.e., no-soil areas). Similarly, wetlands and water bodies are also no-soil areas, but we obviously separated them from artificial surfaces due to both their physical diversity and for highlighting the land-use transitions associated to these land-use classes (i.e., urbanization and overflooding), even if spatially negligible in the study area (Figure 7).

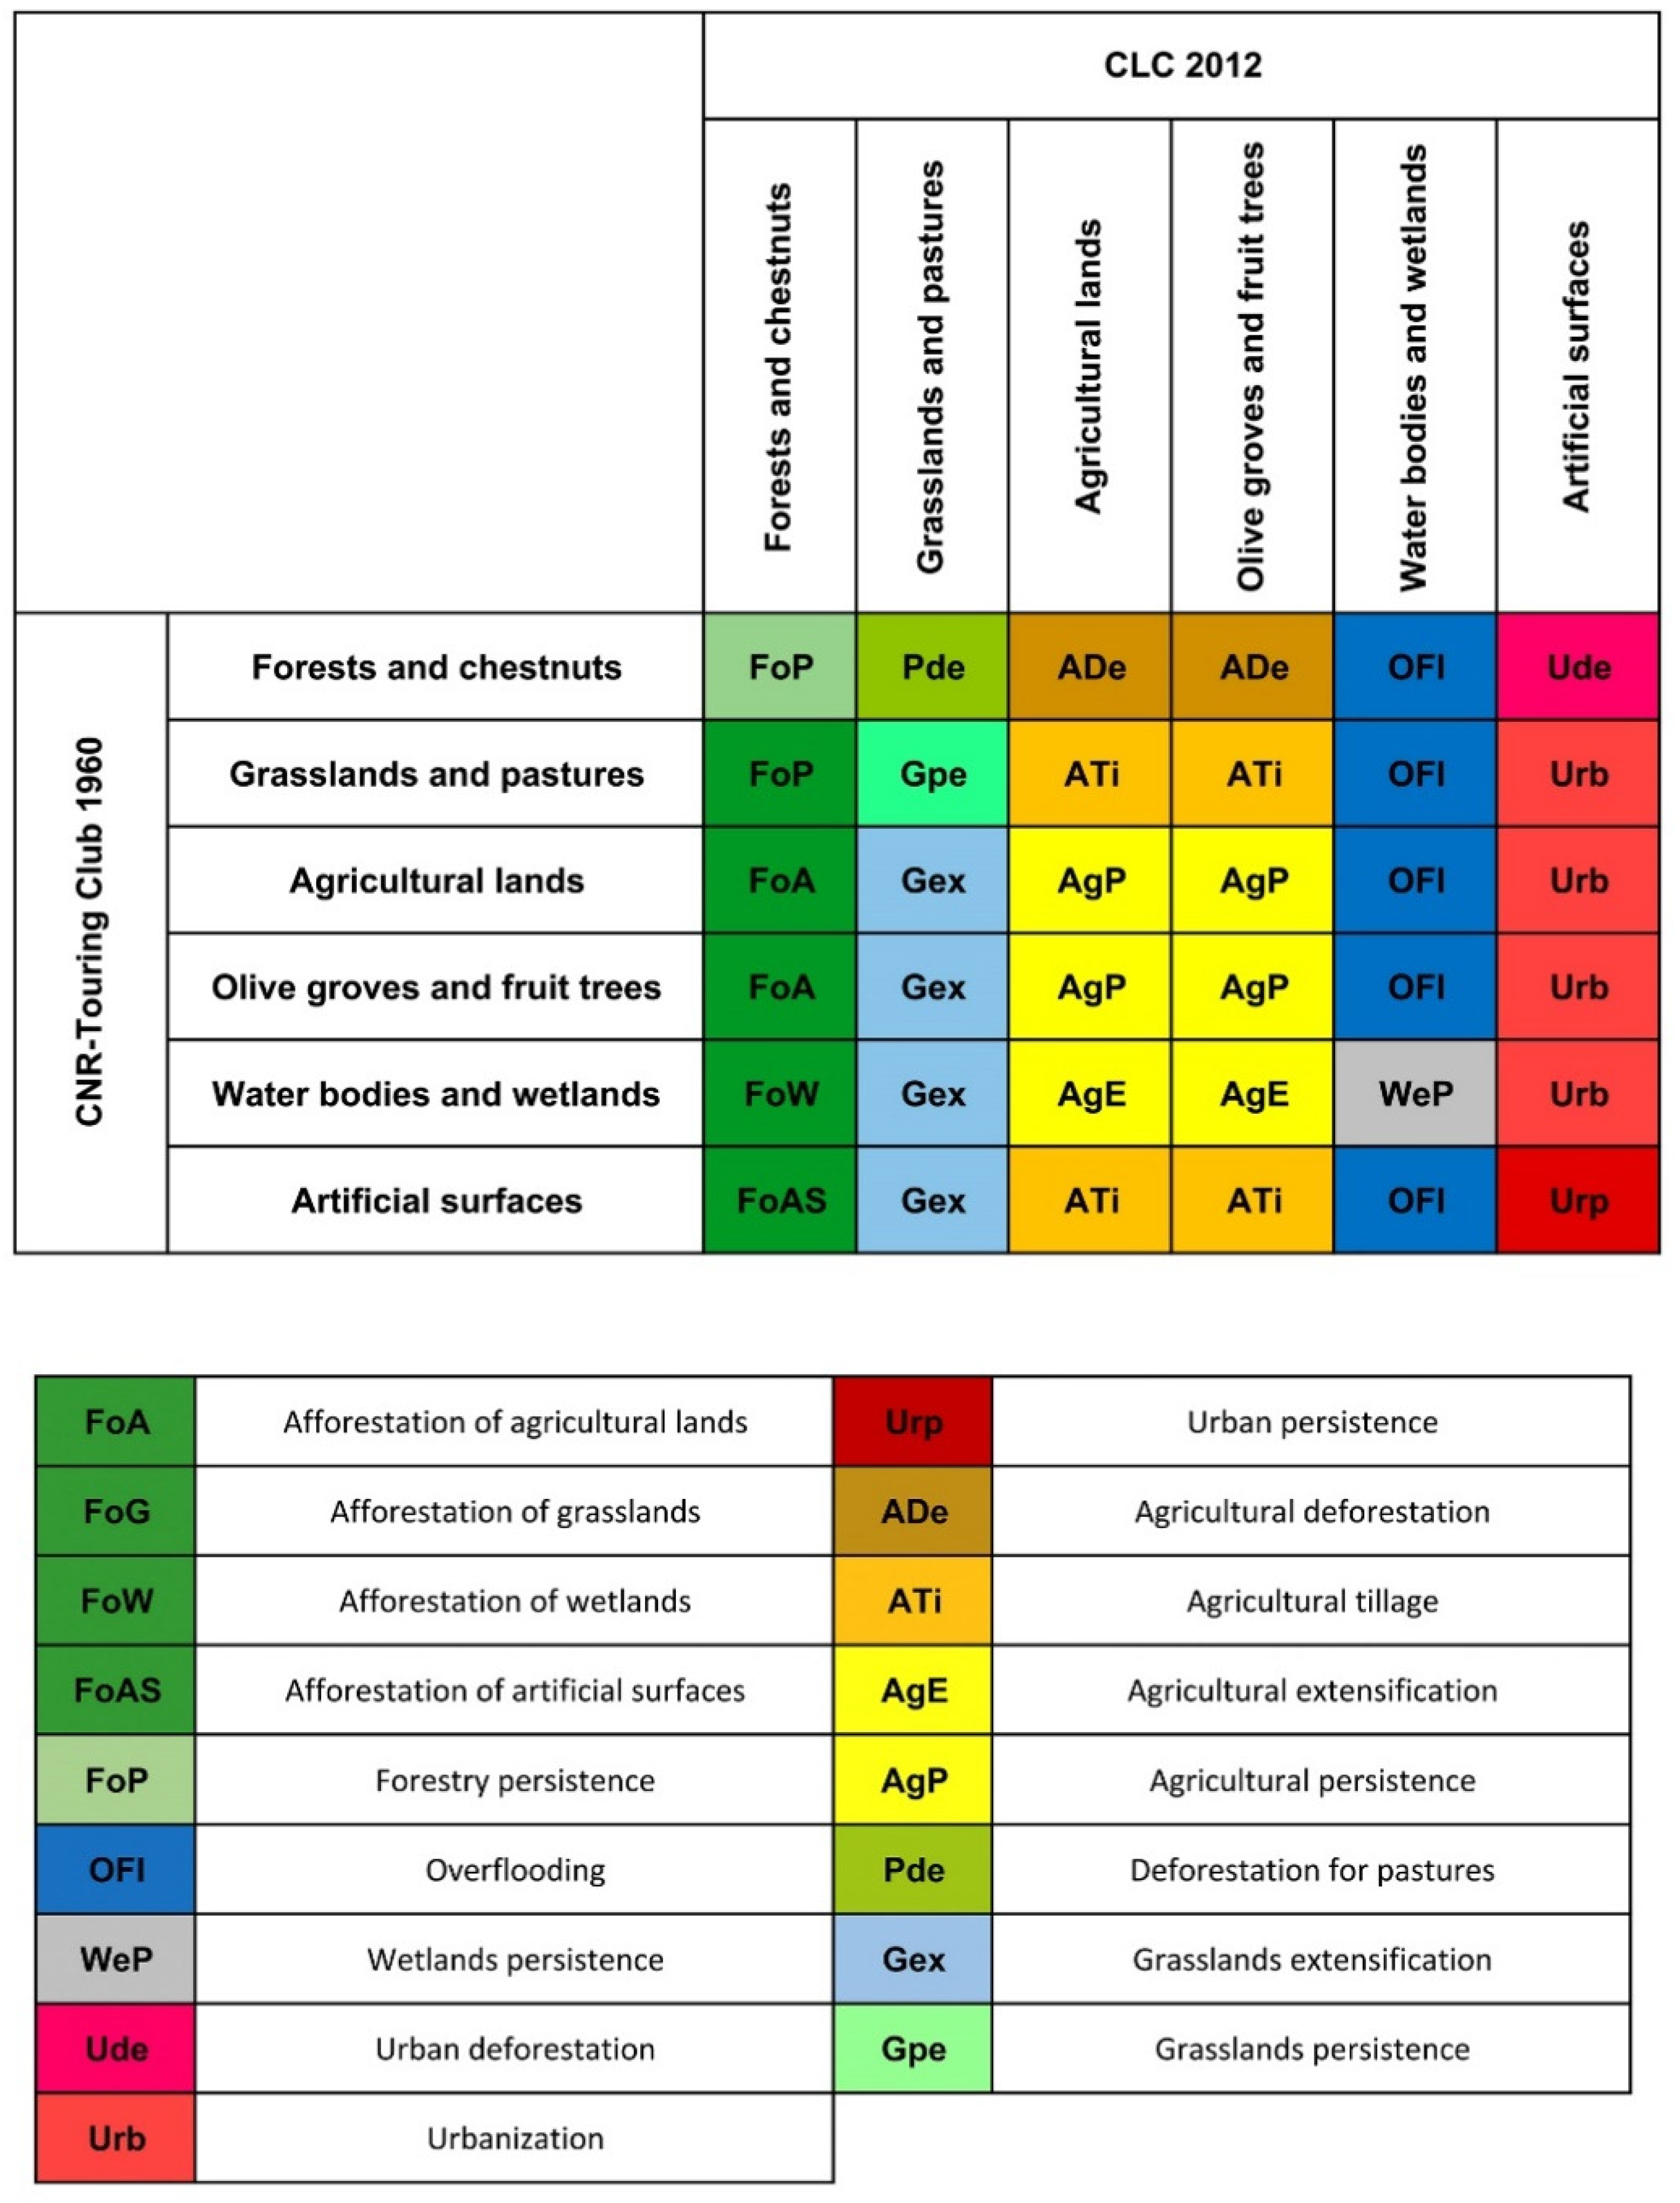
4.2. Assessment, Classification and Interpretation of the Land-Use Changes

In the ~50 year period considered in this study (1960–2012), the land use remained unchanged in slightly more than half of the study area (i.e., 54%). In this framework, we also noted that more than 79% of the flat land surfaces located in the main alluvial plains experienced agricultural persistence. This was probably because of the high fertility of the soils developed on alluvial deposits and the greater possibility to use easily agricultural machinery on flat land surfaces. In contrast, the remaining 46% of the basin area experienced land-use changes (Figure 5). Such a result is consistent with the values obtained at the national scale, as in a slightly shorter period (i.e., 1960–1990), ~51.63% of the Italian peninsula changed from one land-use class to another [23].
The most evident land-use change in the studied area was the afforestation of about one third of the total surface (i.e., 34%; Figure 5). Afforested areas were mainly located along the steep slopes of the mountainous relieves of the Alburni, Cervati and Maddalena mountains (Figure 1 and Figure 5). This result is coherent with the pre-existing literature. In fact, for the inner areas of Italy located along the Apennine mountain chain (in which the Sele River basin is comprised), Falcucci et al. [23] observed that, in the period 1960–2000, afforestation affected more than 20% of the total surface. At the regional scale (Campania region; Figure 1), afforestation affected a lower percent of the entire regional surface (i.e., 12.3%), and the forested areas mainly consisted of former grasslands and agricultural areas [68]. However, the percentages of surface that underwent afforestation in the considered period are different if we consider only the mountainous inner areas of the Campania region, in which the study area, which consists of mountainous relieves for 54% of its total surface, is located. In fact, Di Gennaro et al. [68] report that, on the mountainous relieves of the Campania region, forests increased by 38.5%. The latter value is consistent with that obtained for the study area (31.2%; Figure 3), even if slightly higher. However, if we compare the area that was forested between 1960 and 2012 with the forested area in 1960, we obtain a much higher value (i.e., +146%; Table 2) that reflects the importance of the afforestation process in the study area in a more consistent way.
Forestry persistence between the considered years affected a relatively low percent of the study area if compared with the afforested area (Figure 5). This means that mature forest formations are less widespread than recolonization pioneer formations [67], mainly consisting of coniferous forests.
The forested land surfaces in the study area were mainly former grasslands and pastures and, to a much lesser extent, agricultural areas (Figure 5; Table 3). In particular, grasslands and pastures dramatically decreased in the study area, while the extension of the areas used for agricultural purposes remained almost unchanged. This trend was also noted at the national scale [23]. At the regional scale, Di Gennaro et al. [68] found a decrease in grasslands and pastures of the Campania region, ranging from 40% of the total surface on the mountainous relieves to 60% on hilly areas. In the study area, the decrease in the percent of surface used as grasslands and pastures is apparently lower (i.e., 26%). However, if we consider such reduction compared with the area covered by grasslands and pastures in 1960, we observe a reduction in such area by 91.3% that better reflects the scale of this process in the study area (Table 2). Such a reduction has many complex causes at the continental, national and regional scale. In particular, the fodder farms system underwent a structural and organizational evolution in the framework of an increasing depopulation of the inner areas towards the coastal areas, abandonment of the marginal agricultural lands, changes of the European Commission funding policy for agriculture and, finally, current market trends [76]. In the study area, the intense afforestation of pastures can also be explained with the aesthetic, recreational and perceptive value of the afforested mountainous landscape [77], considering that most parts of the study area are included in the “Cilento, Vallo di Diano and Alburni” UNESCO Geopark. Finally, afforestation significantly reduces soil erosion on steep slopes [8,9].
The extension of the artificial surfaces in the study area almost tripled in the considered period (Table 2), even if they accounted for less than 2% of the total surface of the basin (Figure 2). Such increase is consistent with the data reported by Falcucci et al. [23] for the inner areas of Italy. Most of the urban settlements of the study area are located on hilly relieves. The rate of increase in the artificial surfaces on hilly areas of the Campania region [68] is still higher than that obtained for the Sele River basin (i.e., +436% vs. +219%; Table 2).

4.3. Effects of the Land-Use Changes on Soil Erosion Intensity

Among the factors explaining the intensity of soil erosion, plant cover and land uses are considered the most important, exceeding the influence of rainfall intensity and slope gradient [78,79,80].
The reclassification, according to scientific literature, of the detected land-use changes in the Sele River basin in terms of induced intensity variations of expected soil erosion and their spatial distribution is reported in Figure 7. It showed that more than one-third of the basin (i.e., ~36% of the total surface) experienced land-use changes potentially coherent with a decrease in soil erosion intensity, while such intensity increased in ~10% of the basin only. Such a reduction is the consequence of the transition of many land surfaces towards the most “protective” land use, i.e., forests. The expected decrease in erosion was mostly low (Figure 7), affecting the former grasslands that ensure a good protection against soil erosion, which changed into the still more “protective” forested areas. However, such reduction was high or very high where agricultural areas changed into forests, i.e., in about 12% of the basin. The results also showed that the expected intensity of soil erosion remained unchanged in ~53% of the basin. This was the case of both the land surfaces that experienced forestry, grasslands and agricultural persistence (Figure 4), and flat land surfaces. In fact, regarding the latter, the absence of topographic gradient did not allow both runoff-induced and mass erosion, independently of the experienced land-use change.
It should be underlined that the map in Figure 7, notwithstanding that it is unquestionably useful and reliable in detecting the areas that very likely experienced variation in soil erosion intensity induced by land-use changes, makes no claim to provide quantitative data about soil losses and rates in the considered period. This is because other factors, in addition to land-use, control soil erosion losses and rates. In particular, rainfall erosivity, soil erodibility, slope length, slope gradient and soil management interact with land use in determining the amount of soil loss [64]. The quantifications of these factors are out of the scope of this paper. However, we can make some considerations based on the literature. As regards rainfall erosivity, Diodato et al. [55] demonstrated that, in the study area, erosive rainfall varies spatially according to elevation and distance from the coast. Because none of these two variables changed in the considered period, we can consider constant the spatial distribution of the rainfall erosivity in the study area. Vast literature ([10,11], and references therein) also demonstrated that soil erodibility is, at least partly, controlled by land-use changes, so where land use changes, soil erodibility also changes accordingly. Finally, similarly to rainfall erosivity, slope length and slope gradient can also be considered unchanged in the study area. Thus, even if this study does not provide quantitative results about soil losses and rates, the map of Figure 7 should be considered a useful starting point to this aim.
Geomorphological literature also confirms the reliability of the results obtained in this study. In a recent paper, Magliulo et al. [53] demonstrated that the main river that flows through the study area, i.e., the Sele River, experienced a channel narrowing by 36% between 1955 and 2011 (i.e., approximately the same period considered in this study), coupled with a reduction in transitional channel morphologies. Such kinds of river morphological changes are perfectly coherent with a reduction in sediment supply to the river from the surrounding slopes, i.e., with a reduction in soil erosion [17,18,52], such as that hypothesized in this study for the entire Sele River basin. Furthermore, when sediment supply from the slopes to the rivers decreases, sediment supply from the rivers to the coast also decreases accordingly, often determining a shoreline retreat ([22], and references therein). In the case of the Sele River basin, such a retreat in the considered period was indeed demonstrated by the paper of Alberico et al. [81]. Finally, research on the suspended sediment transport variations in rivers flowing through the studied catchment would have been of great importance in further confirming the impact of land-use changes on river transport. Such kinds of studies were carried out for the Sele River in connection with the assessment of water quality [82,83,84]. Unfortunately, such studies embraced a too short period (i.e., 4–5 years, from 2001 to 2006) compared with the time span (1960–2012) considered in this study. Thus, the results were not useful in further supporting our data.

5. Conclusions

This study allowed assessing the land-use changes in the Sele River basin, which is one of the larger basins of Southern Italy. The study provided a first contribution to fill the gap in studies dealing with multidecadal assessment of land-use changes at the basin scale, where more evident are the interrelationships between land-use changes, soil erosion intensity, river morphological changes and shoreline geomorphological evolution. GIS analysis proved, once again, to be a very effective tool in such kinds of studies.
The study confirmed the trend of inner areas of Italy moving towards more pristine conditions, with an increase in forested areas, mainly at the expense of grasslands, while agricultural areas remained substantially unchanged. Afforestation of slopes very likely induced a significant reduction in soil erosion processes, confirmed by geomorphological literature data. Such kinds of studies allow for assessing the type and the intensity of human impact on river basins and have a relevant application-oriented importance in detecting areas potentially most prone to experience soil erosion processes, flood hazard and coastline modifications.

Author Contributions

Conceptualization, P.M.; methodology, P.M.; software, A.C.; validation, P.M., A.C. and F.R.; formal analysis, P.M. and A.C.; investigation, P.M. and A.C.; resources, P.M; data curation, P.M. and A.C.; writing—original draft preparation, P.M.; writing—review and editing, P.M. and F.R.; visualization, P.M. and A.C.; supervision, P.M. and F.R.; project administration, P.M. and F.R.; funding acquisition, P.M. All authors have read and agreed to the published version of the manuscript.

Funding

This research was funded by Università degli Studi del Sannio; project code: FRA_2018; project ID: 2864; Responsible: Paolo Magliulo.

Data Availability Statement

Data is contained within the article.

Acknowledgments

Authors are grateful to the anonymous reviewers whose comments and suggestions improved the readability and the scientific rigor of the paper.

Conflicts of Interest

The authors declare no conflict of interest.

References

  1. de Chazal, J.; Rounsevell, M.D.A. Land-use and climate change within assessments of biodiversity change: A review. Glob. Environ. Change 2009, 19, 306–315. [Google Scholar] [CrossRef]
  2. Dang, A.N.; Kawasaki, A. A review of methodological integration in land-use change models. IJAEIS 2016, 7, 1–25. [Google Scholar] [CrossRef]
  3. de Jong, L.; de Bruin, S.; Knoop, J.; van Vliet, J. Understanding land-use change conflict: A systematic review of case studies. J. Land Use Sci. 2021, 16, 223–239. [Google Scholar] [CrossRef]
  4. Zube, E.H. Perceived land use patterns and landscape values. In Landscape Ecology; SPB Academic Publishing: Hague, The Netherlands, 1987; Volume 1, pp. 37–45. [Google Scholar]
  5. Houet, T.; Loveland, T.R.; Hubert-Moy, L.; Gaucherel, C.; Napton, D.; Barnes, C.; Sayler, K. Exploring subtle land use and land cover changes: A framework for future landscape studies. Landsc. Ecol. 2010, 25, 249–266. [Google Scholar] [CrossRef] [Green Version]
  6. Daye, D.D.; Healey, J.R. Impacts of land-use change on sacred forests at the landscape scale. Glob. Ecol. Conserv. 2015, 3, 349–358. [Google Scholar] [CrossRef] [Green Version]
  7. Kan, S.; Chen, B.; Han, M.; Hayat, T.; Alsulami, H.; Chen, G. China’s forest land use change in the globalized world economy: Foreign trade and unequal household consumption. Land Use Policy 2021, 103, 105324. [Google Scholar] [CrossRef]
  8. Vacca, A.; Loddo, S.; Ollesch, G.; Puddu, R.; Serra, G.; Tomasi, D.; Aru, A. Measurement of runoff and soil erosion in three areas under different land use in Sardinia (Italy). Catena 2000, 40, 69–92. [Google Scholar] [CrossRef]
  9. García-Ruiz, J.M. The effects of land uses on soil erosion in Spain: A review. Catena 2010, 81, 1–11. [Google Scholar] [CrossRef]
  10. Wu, W.; Yang, P.; Tang, H.; Ongaro, L.; Shibasaki, R. Regional variability of the effects of land use systems on soil properties. Agric. Sci. China 2007, 6, 1369–1375. [Google Scholar] [CrossRef]
  11. Lizaga, I.; Quijano, L.; Gaspara, L.; Ramos, M.C.; Navas, A. Linking land use changes to variation in soil properties in a Mediterranean mountain agroecosystem. Catena 2019, 172, 516–527. [Google Scholar] [CrossRef]
  12. Zucca, C.; Canu, A.; Della Peruta, R. Effects of land use and landscape on spatial distribution and morphological features of gullies in an agropastoral area in Sardinia (Italy). Catena 2006, 68, 87–95. [Google Scholar] [CrossRef]
  13. Zucca, C.; Canu, A.; Previtali, F. Soil degradation by land use change in an agropastoral area in Sardinia (Italy). Catena 2010, 83, 46–54. [Google Scholar] [CrossRef]
  14. Magliulo, P.; Russo, F.; Lo Curzio, S. Detection of permanently eroded landsurfaces through multitemporal analysis of Landsat data: A case study from an agricultural area in southern Italy. Environ. Earth Sci. 2020, 79, 18. [Google Scholar] [CrossRef]
  15. Fortugno, D.; Boix-Fayos, C.; Bombino, G.; Denisi, P.; Quiñonero-Rubio, J.M.; Tamburino, V.; Zema, D.A. Adjustments in channel morphology due to land-use changes and check dam installation in mountain torrents of Calabria (southern Italy). Earth Surf. Process. Landf. 2017, 42, 2469–2483. [Google Scholar] [CrossRef]
  16. Cooper, S.D.; Lake, P.S.; Sabater, S.; Melack, J.M.; Sabo, J.L. The effects of land use changes on streams and rivers in Mediterranean climates. Hydrobiologia 2013, 719, 383–425. [Google Scholar] [CrossRef]
  17. Magliulo, P.; Bozzi, F.; Leone, G.; Fiorillo, F.; Leone, N.; Russo, F.; Valente, A. Channel adjustments over 140 years in response to extreme floods and land-use change, Tammaro River, southern Italy. Geomorphology 2021, 383, 18. [Google Scholar] [CrossRef]
  18. Scorpio, V.; Piégay, H. Is afforestation a driver of change in Italian rivers within the Anthropocene era? Catena 2020, 22. [Google Scholar] [CrossRef]
  19. Brath, A.; Montanari, A.; Moretti, G. Assessing the effect on flood frequency of land use change via hydrological simulation (with uncertainty). J. Hydrol. 2006, 324, 141–153. [Google Scholar] [CrossRef]
  20. Liu, J.; Wang, S.; Li, D. The analysis of the impact of land-use changes on flood exposure of Wuhan in Yangtze River Basin, China. Water Resour. Manag. 2014, 28, 2507–2522. [Google Scholar] [CrossRef]
  21. Apollonio, C.; Balacco, G.; Novelli, A.; Tarantino, E.; Piccinni, A.F. Land use change impact on flooding areas: The case study of Cervaro Basin (Italy). Sustainability 2016, 8, 961. [Google Scholar] [CrossRef] [Green Version]
  22. Bonora, N.; Immordino, F.; Schiavi, C.; Simeoni, U.; Valpreda, E. Interaction between Catchment Basin Management and Coastal Evolution (Southern Italy). J. Coast. Res. 2002, 36, 81–88. [Google Scholar] [CrossRef]
  23. Falcucci, A.; Maiorano, L.; Boitani, L. Changes in land-use/land-cover patterns in Italy and their implications for biodiversity conservation. Landsc. Ecol. 2007, 22, 617–631. [Google Scholar] [CrossRef]
  24. Tasser, E.; Tappeiner, U. Impact of land use changes on mountain vegetation. Appl. Veg. Sci. 2002, 5, 173–184. [Google Scholar] [CrossRef]
  25. Hamidov, A.; Helming, K.; Balla, D. Impact of agricultural land use in Central Asia: A review. Agron. Sustain. Dev. 2016, 36. [Google Scholar] [CrossRef] [Green Version]
  26. Salazar, A.; Baldi, G.; Hirota, M.; Syktus, J.; McAlpine, C. Land use and land cover change impacts on the regional climate of non-Amazonian South America: A review. Glob. Planet Change 2015, 128, 103–119. [Google Scholar] [CrossRef]
  27. Lambin, E.; Geist, H.J.; Lepers, E. Dynamics of land-use and land-cover change in tropical regions. Annu. Rev. Environ. Resour. 2003, 28, 205–241. [Google Scholar] [CrossRef] [Green Version]
  28. Ruiz, I.; Sanz-Sánchez, M.J. Effects of historical land-use change in the Mediterranean environment. Sci. Total Environ. 2020, 732, 8. [Google Scholar] [CrossRef] [PubMed]
  29. Kosmas, C.; Danalatos, N.; Cammeraat, L.H.; Chabart, M.; Diamantopoulos, J.; Farand, R.; Gutierrez, L.; Jacob, A.; Marques, H.; Martinez-Fernandez, J.; et al. The effect of land use on runoff and soil erosion rates under Mediterranean conditions. Catena 1997, 29, 45–59. [Google Scholar] [CrossRef]
  30. Panagos, P.; Borrelli, P.; Meusburger, K.; Alewell, C.; Lugato, E.; Montanarella, L. Estimating the soil erosion cover-management factor at the European scale. Land Use Policy 2015, 48, 38–50. [Google Scholar] [CrossRef]
  31. Rounsevell, M.D.A.; Reay, D.S. Land use and climate change in the UK. Land Use Policy 2009, 26, S160–S169. [Google Scholar] [CrossRef]
  32. Deng, X.Z.; Li, Z.H. A review on historical trajectories and spatially explicit scenarios of land-use and land-cover changes in China. J. Land Use Sci. 2016, 11, 709–724. [Google Scholar] [CrossRef]
  33. Salvati, L.; Bajocco, S. Land sensitivity to desertification across Italy: Past, present, and future. Appl. Geogr. 2011, 31, 223–231. [Google Scholar] [CrossRef]
  34. Santini, M.; Valentini, R. Predicting hot-spots of land use changes in Italy by ensemble forecasting. Reg. Environ. Chang. 2011, 11, 483–502. [Google Scholar] [CrossRef]
  35. Piccarreta, M.; Capolongo, D.; Boenzi, F.; Bentivenga, M. Implications of decadal changes in precipitation and land use policy to soil erosion in Basilicata, Italy. Catena 2006, 65, 138–151. [Google Scholar] [CrossRef]
  36. Łowicki, D. Land use changes in Poland during transformation: Case study of Wielkopolska region. Landsc. Urban Plan. 2008, 87, 279–288. [Google Scholar] [CrossRef]
  37. Gallardo, M.; Martínez-Vega, J. Three decades of land-use changes in the region of Madrid and how they relate to territorial planning. Eur. Plan. Stud. 2016, 24, 1016–1033. [Google Scholar] [CrossRef] [Green Version]
  38. Ellis, E.C.; Goldewijk, K.K.; Siebert, S.; Lightman, D.; Ramankutty, N. Anthropogenic transformation of the biomes, 1700 to 2000. Glob. Ecol. Biogeogr. 2010, 19, 589–606. [Google Scholar] [CrossRef]
  39. Mendoza, M.E.; López Granados, E.; Geneletti, D.; Pérez-Salicrup, D.R.; Salinas, V. Analysing land cover and land use change processes at watershed level: A multitemporal study in the Lake Cuitzeo Watershed, Mexico (1975–2003). Appl. Geogr. 2011, 31, 237–250. [Google Scholar] [CrossRef]
  40. Bhattacharya, R.K.; Das Chatterjee, N.; Das, K. Land use and Land Cover change and its resultant erosion susceptible level: An appraisal using RUSLE and Logistic Regression in a tropical plateau basin of West Bengal, India. Environ. Dev. Sustain. 2021, 23, 1411–1446. [Google Scholar] [CrossRef]
  41. Lewis, S.E.; Bartley, R.; Wilkinson, S.N.; Bainbridge, Z.T.; Henderson, A.E.; James, C.S.; Irvine, S.A.; Brodie, J.E. Land use change in the river basins of the Great Barrier Reef, 1860 to 2019: A foundation for understanding environmental history across the catchment to reef continuum. Mar. Pollut. Bull. 2021, 166, 112193. [Google Scholar] [CrossRef]
  42. Tadese, M.; Kumar, L.; Koech, R.; Kogo, B.K. Mapping of land-use/land-cover changes and its dynamics in Awash River Basin using remote sensing and GIS. Remote Sens. Appl. Soc. Environ. 2020, 19, 100352. [Google Scholar] [CrossRef]
  43. D’Angelo, M.; Enne, G.; Madrau, S.; Percich, L.; Previtali, F.; Pulina, G.; Zucca, C. Mitigating land degradation in Mediterranean agro-silvo-pastoral systems: A GIS-based approach. Catena 2000, 40, 37–49. [Google Scholar] [CrossRef]
  44. Pignatti, S.; Cavalli, R.M.; Cuomo, V.; Fusilli, L.; Pascucci, S.; Poscolieri, M.; Santini, F. Evaluating Hyperion capability for land cover mapping in a fragmented ecosystem: Pollino National Park, Italy. Remote Sens. Environ. 2009, 113, 622–634. [Google Scholar] [CrossRef]
  45. Alqurashi, A.; Kumar, L. Investigating the use of Remote Sensing and GIS techniques to detect land use and land cover change: A review. Adv. Remote Sens. 2013, 2, 193–204. [Google Scholar] [CrossRef] [Green Version]
  46. Amol, D.V.; Bharti, W.G. Analysis and modeling of agricultural land use using Remote Sensing and Geographic Information System: A Review. IJERA 2013, 3, 81–91. [Google Scholar]
  47. Attri, P.; Chaudhry, S.; Sharma, S. Remote Sensing & GIS based Approaches for LULC Change Detection—A Review. Int. J. Curr. Eng. Technol. 2015, 5, 3126–3137. [Google Scholar]
  48. MohanRajan, S.N.; Loganathan, A.; Manoharan, P. Survey on Land Use/Land Cover (LU/LC) change analysis in remote sensing and GIS environment: Techniques and challenges. Environ. Sci. Pollut. Res. 2020, 27, 29900–29926. [Google Scholar] [CrossRef] [PubMed]
  49. Forino, G.; Ciccarelli, S.; Bonamici, S.; Perini, L.; Salvati, L. Developmental policies, long-term land-use changes and the way towards soil degradation: Evidence from Southern Italy. Scott. Geogr. J. 2015, 131, 123–140. [Google Scholar] [CrossRef]
  50. D’Ippolito, A.; Ferrari, E.; Iovino, F.; Nicolaci, A.; Veltri, A. Reforestation and land use change in a drainage basin of southern Italy. iForest 2013, 6, 175–182. [Google Scholar] [CrossRef] [Green Version]
  51. Ricca, N.; Guagliardi, I. Multi-temporal dynamics of land use patterns in a site of community importance in Southern Italy. Appl. Ecol. Environ. Sci. 2015, 13, 677–691. [Google Scholar] [CrossRef]
  52. Romano, G.; Abdelwahab, O.M.M.; Gentile, F. Modeling land use changes and their impact on sediment load in a Mediterranean watershed. Catena 2018, 163, 342–353. [Google Scholar] [CrossRef]
  53. Magliulo, P.; Cusano, A.; Giannini, A.; Sessa, S.; Russo, F. Channel width variation phases of the major rivers of the Campania Region (Southern Italy) over 150 years: Preliminary results. Earth 2021, 2, 22. [Google Scholar] [CrossRef]
  54. Diodato, N. The influence of topographic co-variables on the spatial variability of precipitation over small regions of complex terrain. Int. J. Climatol. 2005, 25, 351–363. [Google Scholar] [CrossRef]
  55. Diodato, N.; Fagnano, M.; Alberico, I.; Chirico, G.B. Mapping soil erodibility from composed data set in Sele River Basin, Italy. Nat. Hazards 2011, 58, 445–457. [Google Scholar] [CrossRef]
  56. Rinaldi, M.; Surian, N.; Comiti, F.; Bussettini, M. Guidebook for the Evaluation of Stream Morphological Conditions by the Morphological Quality Index (MQI); Istituto Superiore per la Protezione e la Ricerca Ambientale: Rome, Italy, 2012; p. 90.
  57. Mostardini, F.; Merlini, S. Appennino centro meridionale. Sezioni geologiche e proposta di modello strutturale. Mem. Soc. Geol. Ital. 1986, 35, 177–202. [Google Scholar]
  58. Brancaccio, L.; Cinque, A.; D’Angelo, G.; Russo, F.; Santangelo, N.; Sgrosso, I. Evoluzione tettonica e geomorfologica della Piana del Sele (Campania, Appennino meridionale). Geogr. Fis. Din. Quat. 1987, 10, 47–55. [Google Scholar]
  59. Cinque, A.; Guida, F.; Russo, F.; Santangelo, N. Dati cronologici e stratigrafici su alcuni depositi continentali della Piana del Sele (Campania): I «Conglomerati di Eboli». Geogr. Fis. Din. Quat. 1988, 11, 39–44. [Google Scholar]
  60. Magliulo, P.; Terribile, F.; Colombo, C.; Russo, F. A pedostratigraphic marker in the geomorphological evolution of Campanian Apennines (Southern Italy): The Paleosol of Eboli. Quat. Intern. 2006, 156–157, 97–117. [Google Scholar] [CrossRef]
  61. Amato, V.; Aucelli, P.P.C.; Ciampo, G.; Cinque, A.; Di Donato, V.; Pappone, G.; Petrosino, P.; Romano, P.; Rosskopf, C.M.; Russo Ermolli, E. Relative sea level changes and paleogeographical evolution of the southern Sele plain (Italy) during the Holocene. Quat. Intern. 2013, 288, 112–128. [Google Scholar] [CrossRef]
  62. National Research Council (CNR). Direzione Generale del Catasto. Carta Dell’utilizzazione del Suolo in Italia Alla Scala 1:200,000; Touring Club: Milano, Italy, 1960.
  63. Istituto Superiore per la Ricerca Ambientale (ISPRA). Corine Land Cover. Available online: https://www.isprambiente.gov.it/ (accessed on 18 November 2021).
  64. Wischmeier, W.H.; Smith, D.D. Predicting Rainfall Erosion Losses: A Guide to Conservation Planning; USDA, Science and Education Administration: Hyattsville, MD, USA, 1978.
  65. Ozsoy, G.; Aksoy, E. Estimation of soil erosion risk within an important agricultural sub-watershed in Bursa, Turkey, in relation to rapid urbanization. Environ. Monit. Assess. 2015, 187, 419. [Google Scholar] [CrossRef] [PubMed]
  66. Jeong, A.; Dorn, R.I. Soil erosion from urbanization processes in the Sonoran Desert, Arizona, USA. Land Degrad. Dev. 2019, 30, 226–238. [Google Scholar] [CrossRef]
  67. Nyssen, J.; Poesen, J.; Moeyersons, J.; Luyten, E.; Veyret-Picot, M.; Deckers, J.; Haile, M.; Govers, G. Impact of road building on gully erosion risk: A case study from the Northern Ethiopian Highlands. Earth Surf. Process. Landf. 2002, 27, 1267–1283. [Google Scholar] [CrossRef]
  68. Di Gennaro, A.; Innamorato, F.; Capone, S. La grande trasformazione: Land cover e land use in Campania. In Estimo e Territorio–Valutare e Gestire L’ambiente; Edagricole: Bologna, Italy, 2005; Volume 3 (LXVII), pp. 25–39. [Google Scholar]
  69. Petit, C.C.; Lambin, E.F. Integration of multi-source remote sensing data for land cover change detection. Int. J. Geogr. Inform. Sci. 2001, 15, 785–803. [Google Scholar] [CrossRef]
  70. Petit, C.C.; Lambin, E.F. Impact of data integration technique on historical land-use/land-cover change: Comparing historical maps with remote sensing data in the Belgian Ardennes. Landsc. Ecol. 2002, 17, 117–132. [Google Scholar] [CrossRef]
  71. Kort, J.; Collins, M.; Ditsch, D. A review of soil erosion potential associated with biomass crops. Biomass Bioenergy 1998, 14, 351–359. [Google Scholar] [CrossRef]
  72. Zuazo, V.H.D.; Pleguezuelo, C.R.R. Soil-Erosion and Runoff Prevention by Plant Covers: A Review. In Sustainable Agriculture; Lichtfouse, E., Navarrete, M., Debaeke, P., Véronique, S., Alberola, C., Eds.; Springer: Dordrecht, The Netherlands, 2009. [Google Scholar] [CrossRef] [Green Version]
  73. Gharibreza, M.; Zaman, M.; Porto, P.; Fulajtar, E.; Parsaei, L.; Eisaei, H. Assessment of deforestation impact on soil erosion in loess formation using 137Cs method (case study: Golestan Province, Iran). Int. Soil Water Conserv. Res. 2020, 8, 393–405. [Google Scholar] [CrossRef]
  74. Copernicus—Land Monitoring Service. Available online: https://land.copernicus.eu/ (accessed on 26 October 2021).
  75. Pimentel, D.; Allen, J.; Beers, A.; Guinand, L.; Linder, R.; McLaughlin, P.; Meer, B.; Musonda, D.; Perdue, D.; Poisson, S.; et al. World Agriculture and Soil Erosion. BioScience 1987, 37, 277–283. [Google Scholar] [CrossRef]
  76. Caradoc, Y.; Lucas, S.; Vidal, C. Agricultural landscapes over half of Europe’s territory maintained by farmers. In Agriculture, Environment, Rural Development: Facts and Figures—A Challenge for Agriculture; The European Commission—Eurostat, the Agriculture DG and the environment DG: Bruxelles, Belgium, 2008. [Google Scholar]
  77. Parish, R. Mountains Environment; Routledge: London, UK, 2002; p. 368. [Google Scholar]
  78. Thornes, J.B. The interaction of erosional and vegetational dynamics in land degradation: Spatial outcomes. In Vegetation and Erosion. Processes and Environments; Thornes, J.B., Ed.; Wiley: Chichester, UK, 1990; pp. 41–53. [Google Scholar]
  79. Kosmas, C.; Danalatos, N.G.; López Bermúdez, F.; Romero Díaz, M.A. The effect of land use on soil erosion and land degradation under Mediterranean conditions. In Mediterranean Desertification: A Mosaic of Processes and Responses; Geeson, N.A., Brandt, C.J., Thornes, J.B., Eds.; Wiley: Chichester, UK, 2002; pp. 57–70. [Google Scholar]
  80. Wainwright, J.; Thornes, J.B. Environmental Issues in the Mediterranean. Processes and Perspectives from the Past and Present; Routledge: London, UK, 2004; p. 479. [Google Scholar]
  81. Alberico, I.; Amato, V.; Aucelli, P.P.C.; D’Argenio, B.; Di Paola, G.; Pappone, G. Historical shoreline change of the Sele Plain (Southern Italy): The 1870–2009 time window. J. Coast. Res. 2012, 28, 1638–1647. [Google Scholar] [CrossRef] [Green Version]
  82. Naddeo, V.; Zarra, T.; Belgiorno, V. Optimization of sampling frequency for river water quality assessment according to Italian implementation of the EU Water Framework Directive. Environ. Sci. Policy 2007, 10, 243–249. [Google Scholar] [CrossRef]
  83. Scannapieco, D.; Naddeo, V.; Zarra, T.; Belgiorno, V. River water quality assessment: A comparison of binary- and fuzzy logic-based approaches. Ecol. Eng. 2012, 47, 132–140. [Google Scholar] [CrossRef]
  84. Naddeo, V.; Scannapieco, D.; Zarra, T.; Belgiorno, V. River water quality assessment: Implementation of non-parametric tests for sampling frequency optimization. Land Use Policy 2013, 30, 197–205. [Google Scholar] [CrossRef]
Figure 1. Location map of the study area (Sele River basin) in the framework of the Italian peninsula (a) and Southern Italy (b). Red line in (b,c) indicates the basin boundary. SR: Sele River; CR: Calore Lucano River; TR: Tanagro River; PD: Persano Dam.
Geographies 01 00017 g001
Figure 2. Land-use maps of the Sele River basin in 1960 (a) and 2012 (b).
Geographies 01 00017 g002
Figure 3. Variations of the extension of the land-use classes in the study area, expressed as percent of the total surface of the Sele River basin. Bars with diagonals refer to 1960.
Geographies 01 00017 g003
Figure 4. Matrix used to classify the different types of land-use changes that occurred in the study area (adapted from Di Gennaro et al. [68]).
Geographies 01 00017 g004
Figure 5. Map of the land-use changes of the Sele River basin and pie chart expressing the percent of the total extension of the study area affected by the different types of land-use changes. Same colors as Figure 4.
Geographies 01 00017 g005
Figure 6. Matrix aimed at reclassifying the detected land-use transitions in terms of expected variations in soil erosion intensity.
Geographies 01 00017 g006
Figure 7. Map of the spatial distribution of the expected variations in soil erosion intensity induced by the land-use changes and pie chart expressing the percent of the total surface of the basin occupied by the different classes. Same colors as Figure 6.
Geographies 01 00017 g007
Table 1. Conversion scheme used for the comparison of the land-use maps. CLC: Corine Land Cover. CNR-TC: Consiglio Nazionale delle Ricerche (National Research Council) Touring Club.
CLC 2012—1st LevelCNR-TC 1960This Study
Agricultural areasArable crops (dry)Agricultural areas
Agro-forestry areas (dry)
Irrigated crops
Irrigated agro-forestry areas
Rice fields
Kitchen gardens
Vineyards
Agricultural areasOlive grovesOlive groves and fruit trees
Fruit trees
Citrus groves
Olive groves and vines association
Agricultural areasDry grasslandsGrasslands and pastures
Irrigated grasslands
Pastures
Forests and semi-natural areasShrub and/or herbaceous vegetation associations
Forests and semi-natural areasRotation coppicesForests and chestnuts
High forest
Mixed forest
Agricultural areasChestnuts
Artificial surfacesSettlementsArtificial surfaces
Water bodies-Wetlands and water bodies
Wetlands-
Table 2. Extension of the land-use classes in the study area in the considered years and percent variations compared with the area of each class in 1960.
Land-Use ClassArea 1960
(ha)
Area 2012
(ha)
Difference (ha)Variation (%)
Grasslands and pastures96,039.18382.5−87,656.6−91.3
Agricultural areas135,317.3110,455.2−24,862.1−18.4
Olive groves and fruit trees20,320.027,656.77336.736.1
Forests and chestnuts68,928.6169,688.0100,759.4146.2
Artificial surfaces1860.15928.34068.2218.5
Table 3. Transition matrix of percent change for different land-use classes in the investigated period.
2012
Forests and ChestnutsGrasslands and
Pastures
Agricultural AreasOlive Groves and Fruit TreesWater Bodies and WetlandsArtificial Surfaces
1960Forests and chestnuts87.71.38.91.6-0.5
Grasslands and pastures71.64.520.32.8-0.7
Agricultural areas25.92.358.111.20.22.4
Olive groves and fruit trees25.00.828.341.8-4.1
Water bodies and wetlands------
Artificial surfaces18.00.128.011.3-42.6
Table 4. C factor of the detected land-use classes calculated according to Panagos et al. [30] and relative degree of protection of soil and expected intensity of soil erosion. (*) refer to urbanization process.
Land-Use ClassC FactorProtection against
Soil Erosion
Relative Intensity
of Soil Erosion
Artificial surfacesFrom literatureNull or very low (*)Severe (*)
Olive groves and fruit trees0.2231LowVery high
Agricultural areas0.1869ModerateHigh
Grasslands and pastures0.0982HighModerate
Forests and chestnuts0.0012Very highLow
Publisher’s Note: MDPI stays neutral with regard to jurisdictional claims in published maps and institutional affiliations.

