
Numerical Study of the Behavior of Back-to-Back Mechanically Stabilized Earth Walls


1
Department of Civil Engineering, Arak Branch, Islamic Azad University, Arak 38361, Iran
2
Antea Group, F-92160 Antony, France
3
Laboratory 3SR, CNRS, Grenoble Alpes University, F-38000 Grenoble, France
4
School of Automotive and Transportation Engineering, Hefei University of Technology, Hefei 230009, China
*
Author to whom correspondence should be addressed.
Geotechnics 2021, 1(1), 18-37; https://0-doi-org.brum.beds.ac.uk/10.3390/geotechnics1010002
Submission received: 13 January 2021
/
Revised: 11 April 2021
/
Accepted: 12 April 2021
/
Published: 19 April 2021
(This article belongs to the Special Issue Fundamental Challenges for Civil Infrastructures in Problematic and Unsaturated Soils, Breakthroughs, and Opportunities)
Abstract
:Back-to-back mechanically stabilized earth (MSE) walls can sustain significant loadings and deformations due to the interaction mechanisms which occur between the backfill material and reinforcement elements. These walls are commonly used in embankments approaching bridges, ramps, and railways. The performance of a reinforced wall depends on numerous factors, including those defining the soil, the reinforcement, and the soil/reinforcement interaction behavior. The focus of this study is to investigate the behavior of back-to-back mechanically stabilized earth walls considering synthetic and metallic strips. A two-dimensional finite difference numerical modeling is considered. The role of the soil friction angle, the distance of the reinforcement elements, the walls’ width to height ratio, and the quality of the soil material are investigated in a parametric study. Their effects on the critical failure surface, shear displacements, wall displacements, and tensile forces on the reinforcements are presented. The interaction between back-to-back reinforced walls strongly depends on the distance between walls and modifies the critical failure surface location.
1. Introduction
Soil resists compressive stresses well but is less able to resist shear strength solicitations. Therefore, tensile elements are often used to compensate for this weakness. The concept of the soil reinforcement was initially expressed by Vidal in 1969 [1]. Since Vidal’s works, numerous retaining walls have been constructed using soil reinforcements all over the world. Reinforced soils are used in the construction of many geotechnical structures such as retaining walls, embankments, slopes and shallow foundations. Reinforced walls can be integrated in the category of flexible walls, which usually contain the following three elements: embankments made generally of granular soils; reinforcement elements, which can be metallic or synthetic; and a wall face usually made of concrete.
Reinforced walls contain reinforcement elements that are located inside the soil, and their initial points are attached to the wall face. In this case, on one side the reinforcements elements help to resist the lateral pressure at the face embankment; at the other side, they interact with the soil, and sliding between the reinforcements and the soil can occur. The width to height ratio for reinforced walls is usually large, and there is no stress concentration phenomenon appearing at the wall toe [2]. For this reason, they are suitable for low bearing capacity substrates. Due to the low soil reinforcement volume, the wall has a high flexibility, which increases its ductility and resistance to differential settlements.
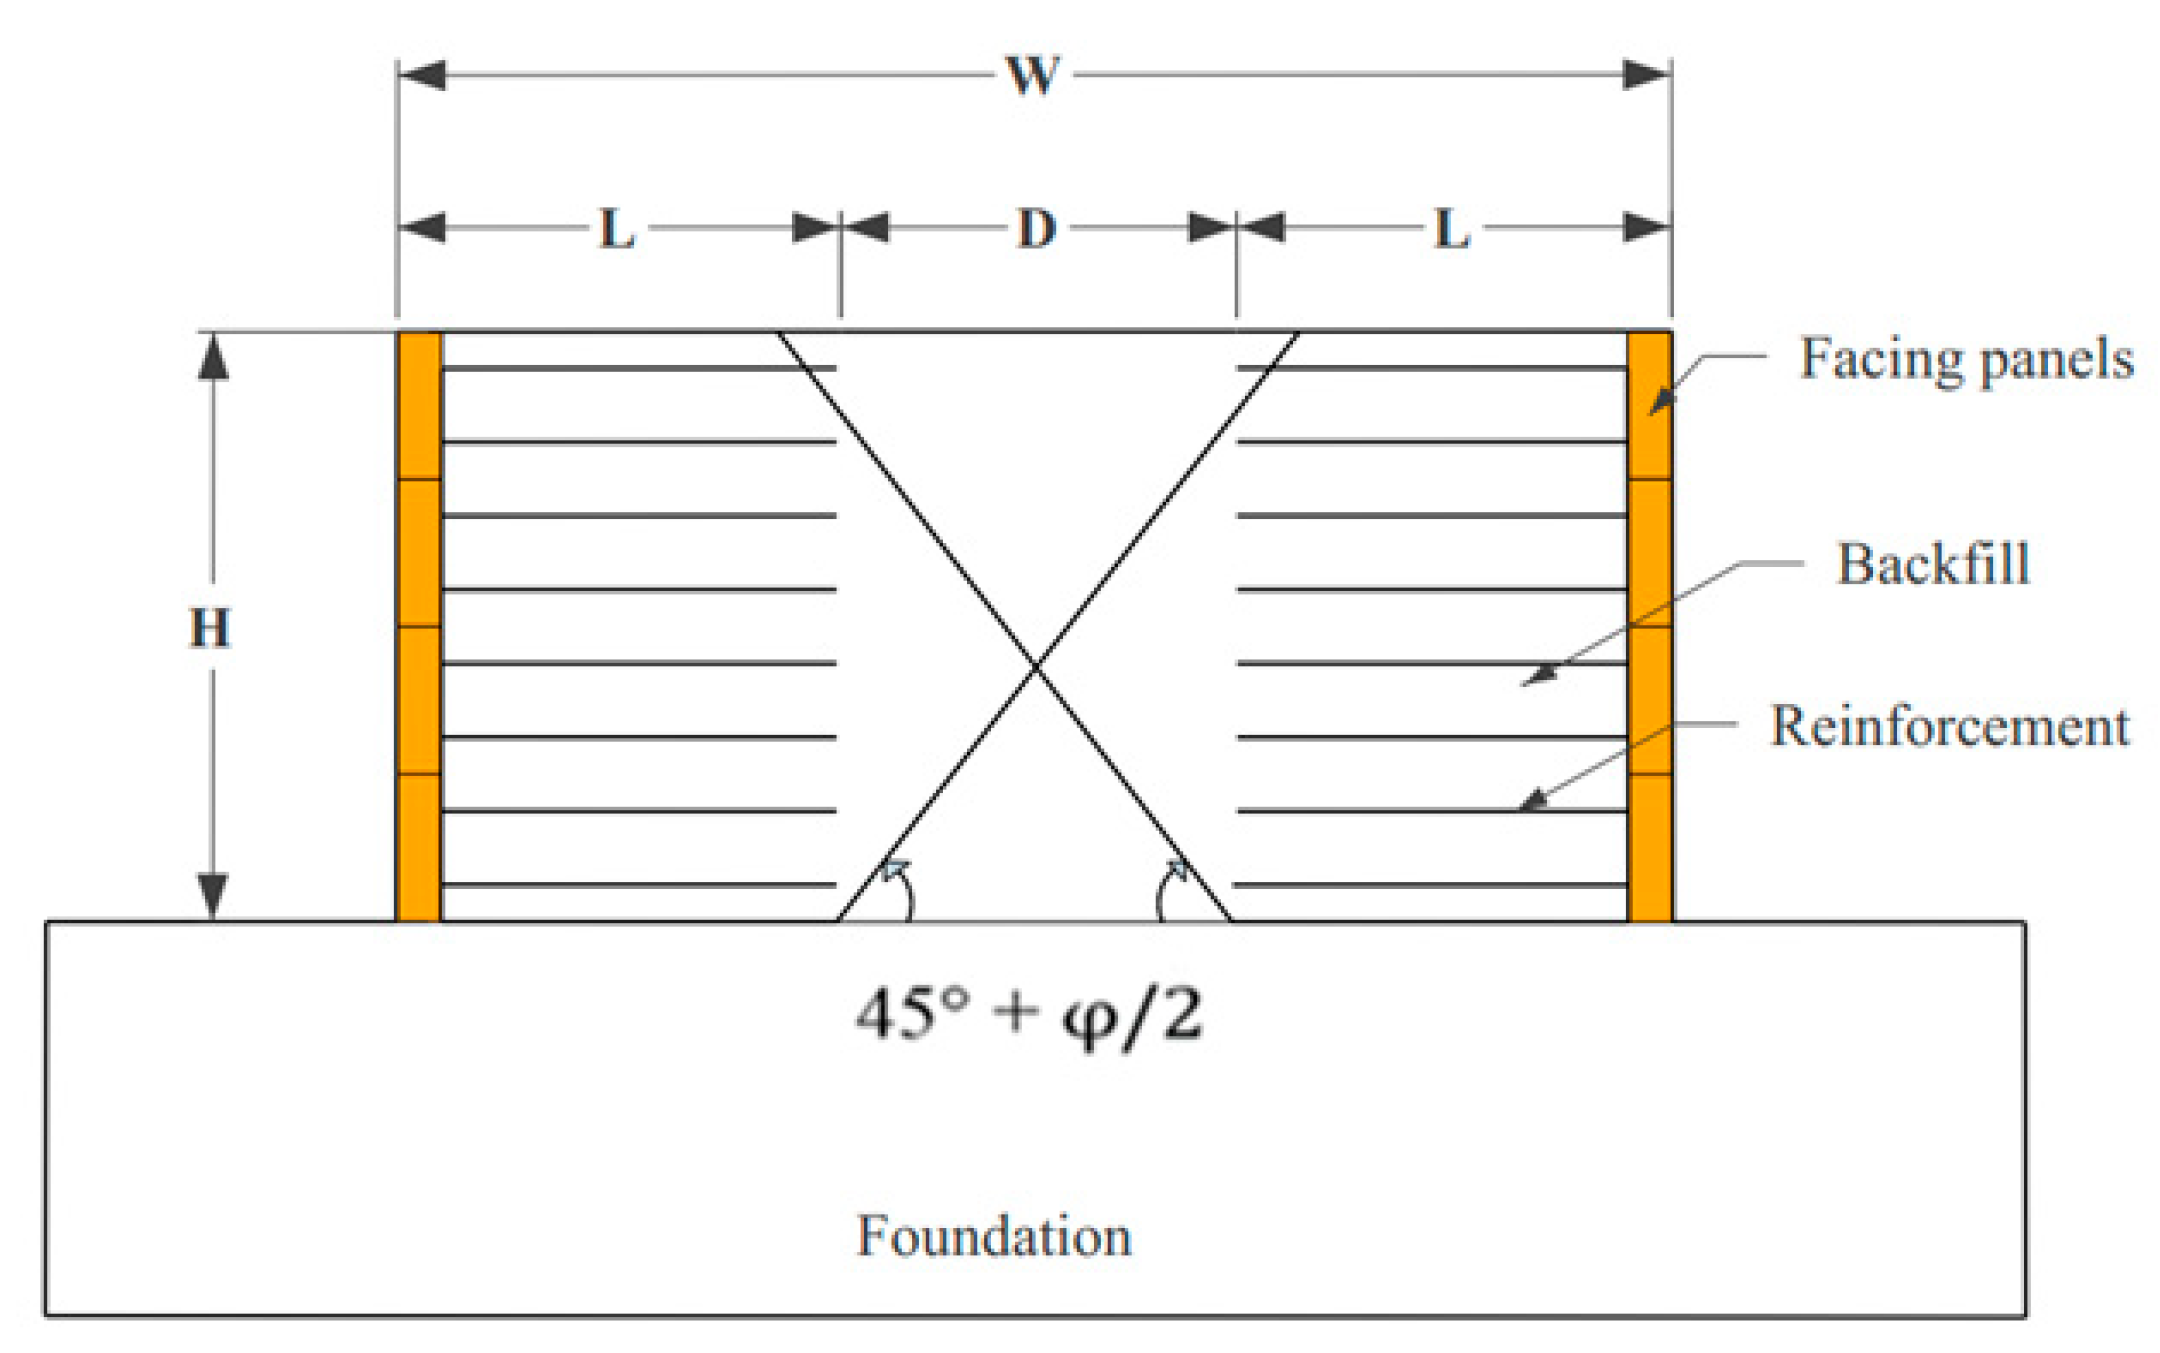
Walls utilizing back-to-back mechanically stabilized earth (MSE) are especially prevalent in raising the elevation of bridges, ramps, and railways. However, these walls are demanding regarding their design, since they require complex geometries such as in the Federal Highway Administration (FHWA) Demonstration Project 82 [3]. In Figure 1 the two cases are analyzed regarding the distance of two back-to-back walls, D, such as in the FHWA design guidelines. The walls can be designed independently if D (distance between the reinforcements from each other) is greater than H tan (45° − φ/2) and H is the height of the walls and the friction angle of the backfill. The typical design method for MSE walls can be applied for this case. As a matter of fact, the two walls can be designed independently for internal stability, but no active thrust in the reinforced zone is considered from the backfill in the case of D being equal to 0. In fact, external stability is not required to be analyzed.
Evaluation of the stability of MSE walls can be carried out using both limit equilibrium and numerical models, which obtain close results regarding safety factors and critical failure surfaces [4,5,6]. The effect of the distance, D, between walls (width to height ratio) on the internal and external stability of the MSE walls under static conditions was explored. Han and Leshchinsky conducted back-to-back walls; the results indicate that when the two back-to-back walls are far from each other they perform independently, while, if they are close to each other they interact with each other [7].
The results indicate that each of the back-to-back walls behave independently if the wall spacing to height ratio is more than one. When the ratio is less than one, the two walls interact with each other and the earth pressure behind the wall decreases because the failure wedge behind the wall is not fully developed. Thus, the tensile forces in the geosynthetic reinforcement decrease with decreasing spacing between walls [8]. Previous research findings on two back-to-back geosynthetic-reinforced soil walls have revealed that these walls perform independently when they are far apart and interact with each other when they are close and that the location and shape of the critical failure surface would be changed depending on their interaction. Moreover, the distance between the back-to-back walls would not affect the maximum tension in geosynthetics. Accordingly, the required maximum tensile strength of reinforcement slightly decreases in the case of a decrease in the distance of the two back-to-back walls [9]. An investigation on the spacing ratio between two walls to the wall height (W/H) was carried out by Sasanka et al. [10]. A W/H ratio between 1.4 and 2.0 was considered with different reinforcement stiffnesses. They showed that the W/H ratio has a significant effect on the maximum tension location on the reinforcement, and maximum tension occurred at 0.9 m in height from the bottom of the wall. In order to evaluate the effect of the geosynthetic type on the internal deformation of the wall, a full-scale back-to-back geosynthetic-reinforced soil retaining wall (GRS) was constructed [11]. The findings of the shaking table tests revealed that the geocell-reinforced earth walls failed under seismic loading in a rotational or translational mode; consequently, a limit equilibrium method was utilized to model it [12]. Numerical analysis of the behavior of the normal reinforced wall using different types of synthetic and metallic strips showed that the parameters of the soil friction, shear interface, and elastic modulus of strips have an effective role in wall behavior [13]. Pullout tests were performed to analyze the soil/interface parameters [14]. The authors have evaluated the deformation and the influence of several parameters in reinforced soil walls by two and three-dimensional methods based on finite elements or finite differences [15,16,17,18,19]. Accordingly, different soil constitutive models and their influence on the results were examined by Huang et al. [20,21].
In this article, a stability analysis of back-to-back reinforced walls is carried out using a finite difference code. A parametric analysis considering three type of reinforcements, the effect of the soil friction angle, and the reinforcement elements’ distance on the wall displacement, soil/strip shear displacement, and reinforcement tensile forces on reinforcement are investigated.
2. Studied Case
2.1. Geometry of the Wall
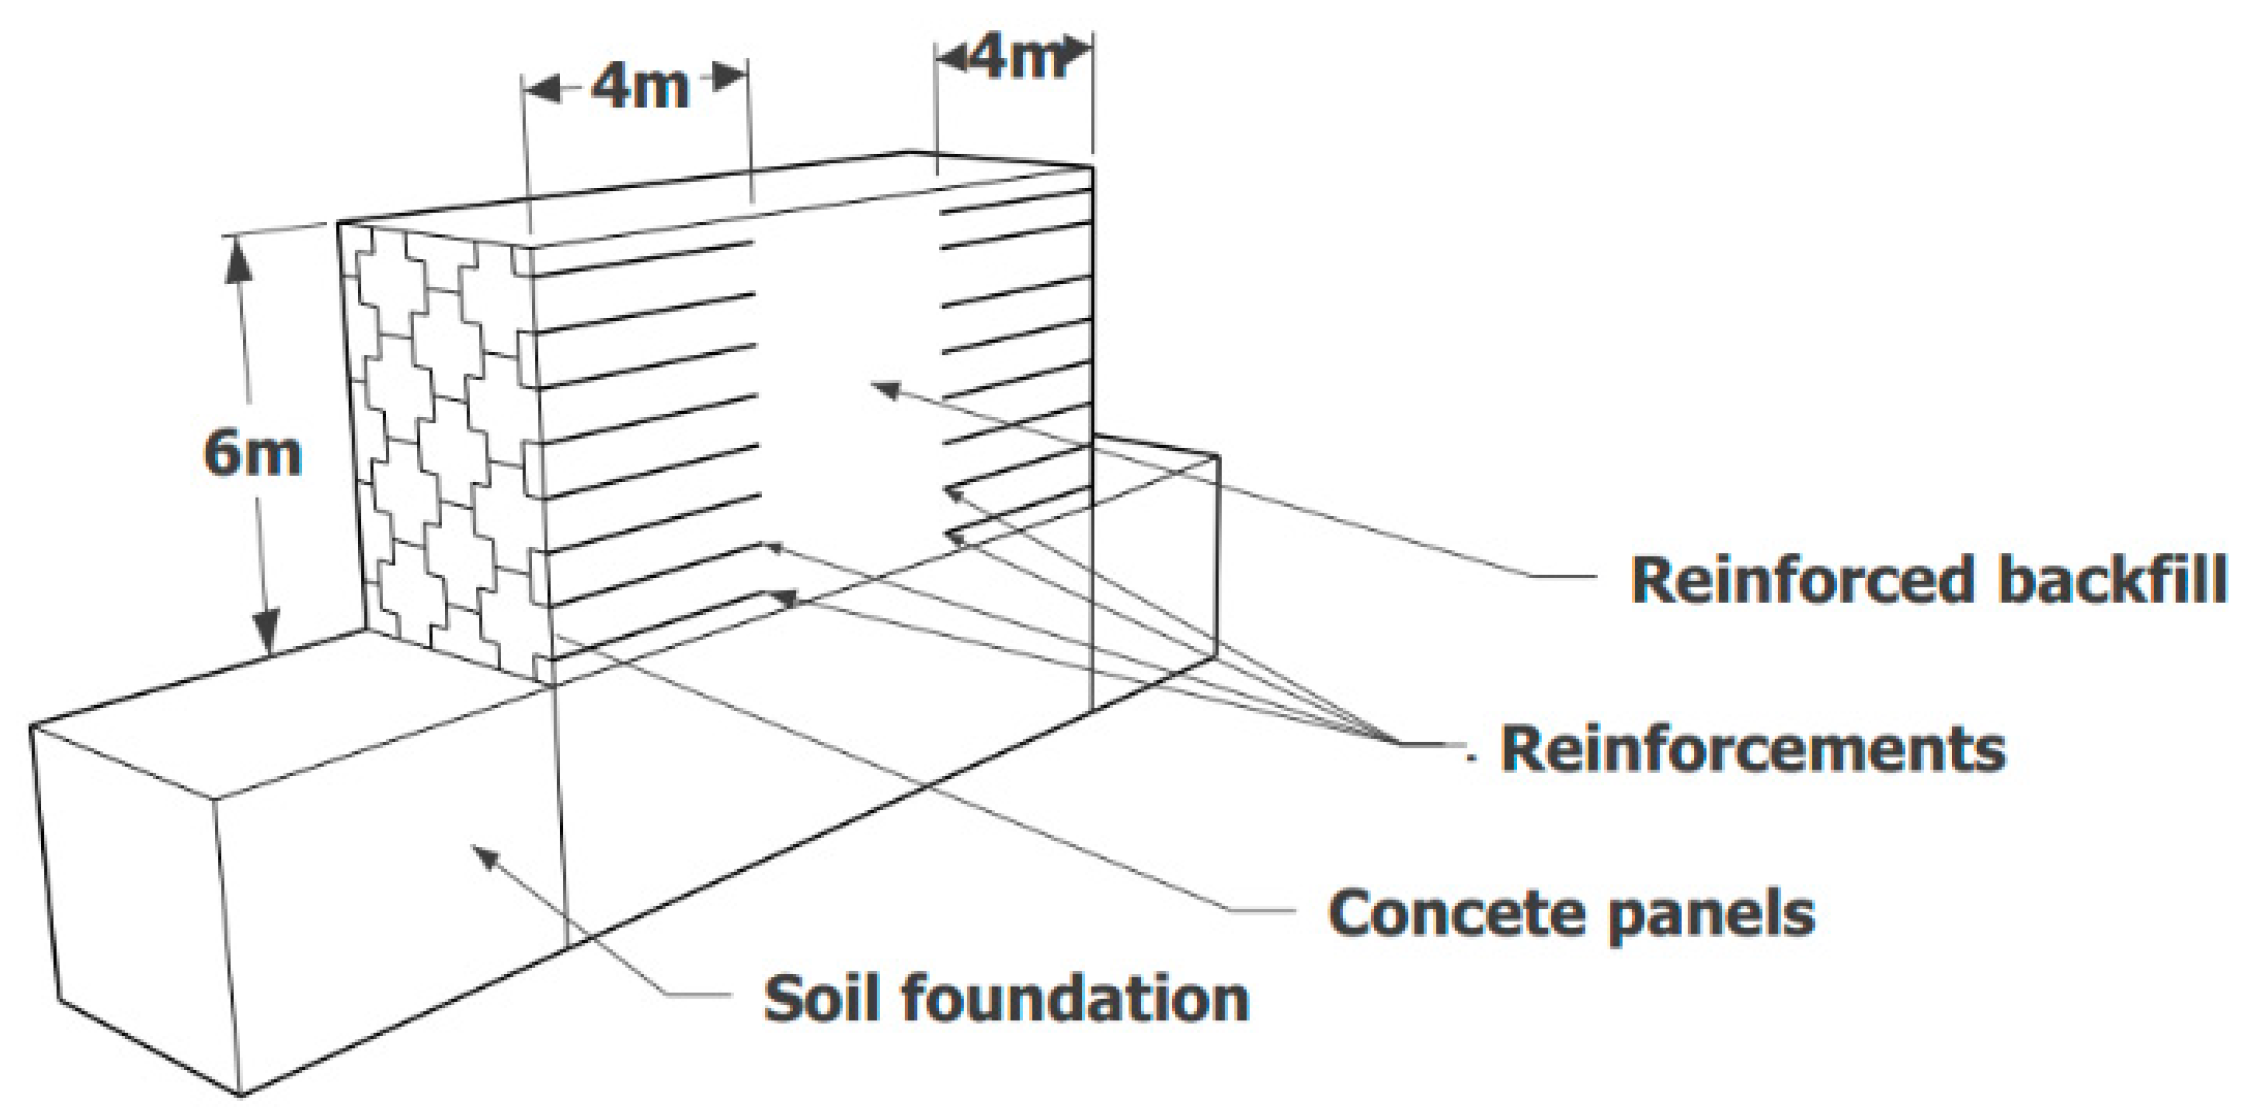
Figure 2 shows a three-dimensional view of a back-to-back reinforced wall. The concrete face panels allow one to homogenize the displacements of such structures, and using the assumptions of Figure 3 it is possible to consider a 2D model which is representative of the real 3D behavior of such a structure [14].
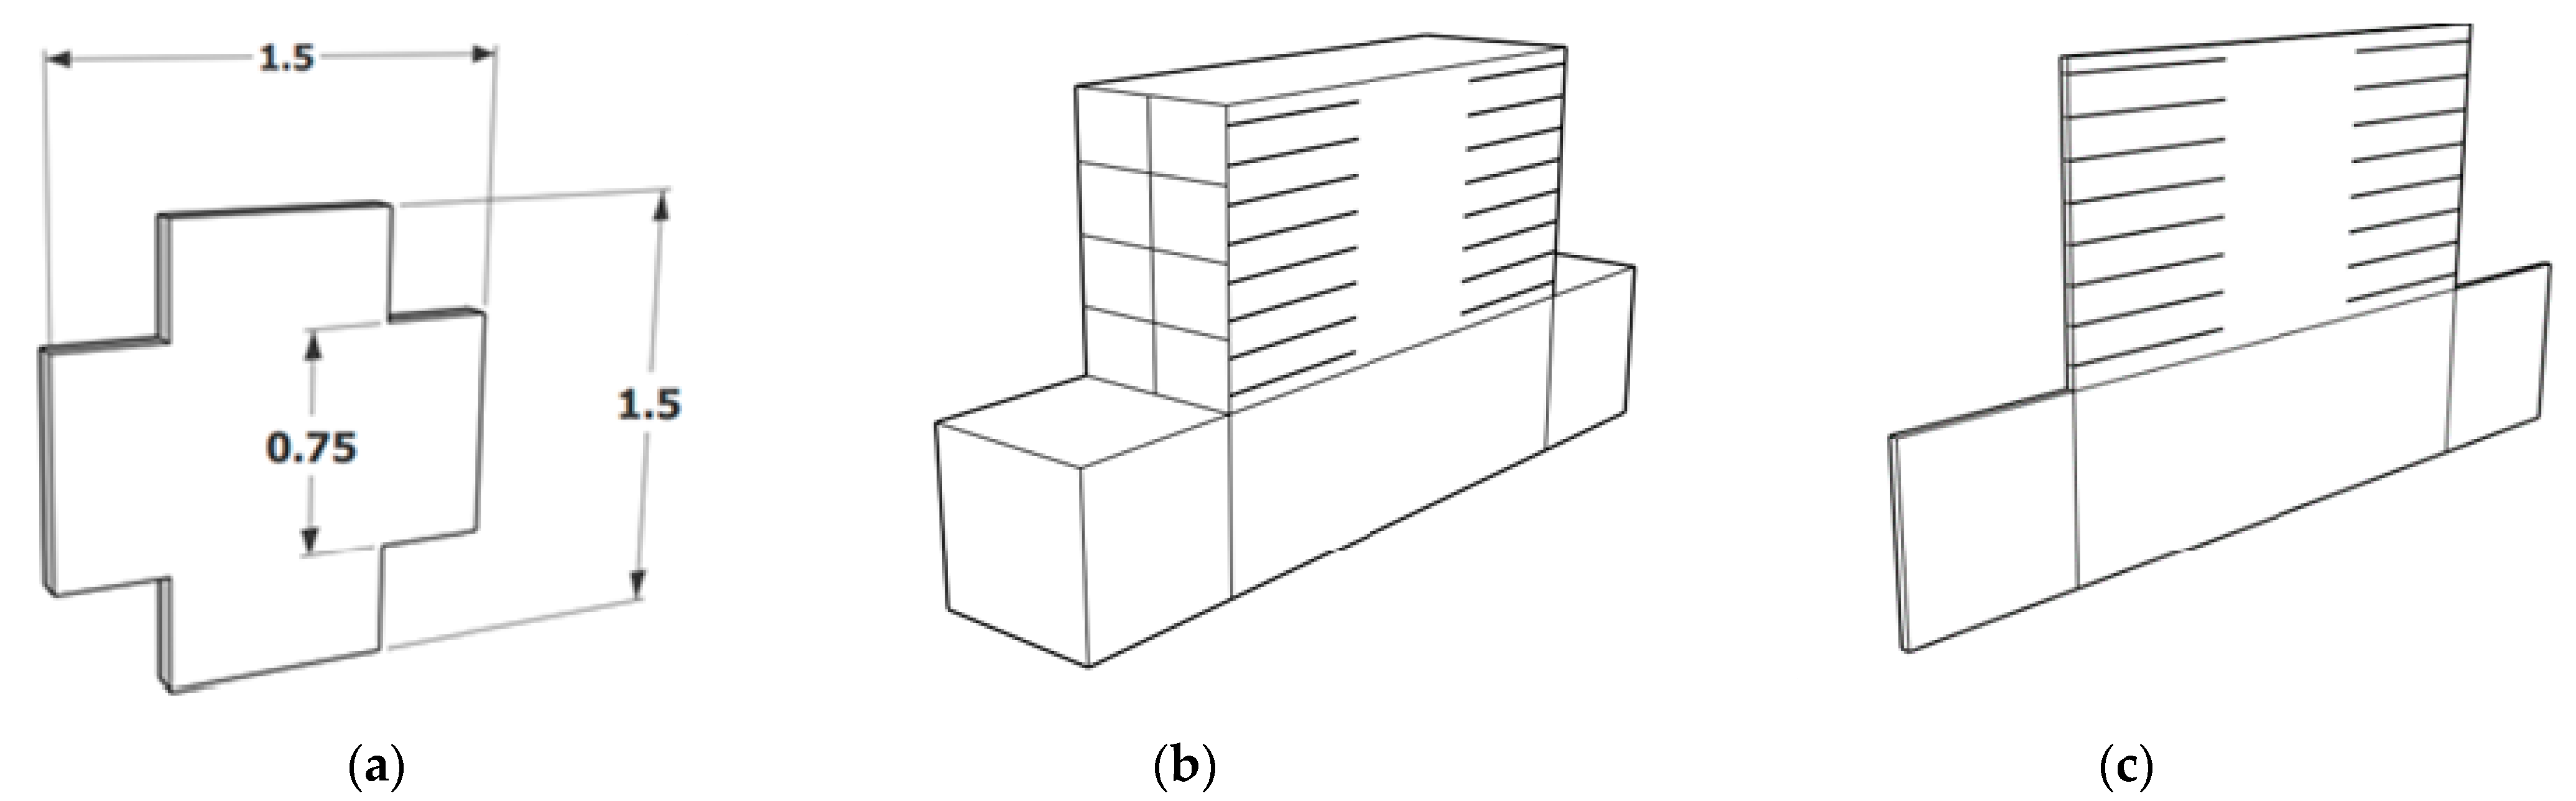
The wall considered in the study is 6 m high. For both sides of the wall, a concrete face cruciform geometry divided into panels (Figure 2) with 16 reinforcement strips (metallic or synthetic) of 4 m in length have been used (Figure 2). Two wall faces in the transverse direction are considered in the numerical model. On each side of the wall, four concrete panels in the vertical direction with the dimension 1.5 × 1.5 m are used in the transverse direction. Each panel has been attached to the reinforcement strips in four points. To simplify the geometry of the model, the three-dimensional shape is converted into a two-dimensional one. The cruciform parts of the concrete parts are then considered as square ones (with dimensions of 1.5 × 1.5 m) (Figure 3).
The reference case is an academic one based on a real study case. The geomechanical parameters are deduced from real triaxial tests. The soil/reinforcement interface parameters are back-analyzed from the pullout tests [14].
The values of the friction coefficient (f*) and the shear stiffness (kb) parameter taken in the numerical model were defined by calibration on laboratory pullout tests [13]. The pullout tests were modelled numerically and allowed us to obtain the soil/strip interface parameters to use in the MSE wall modelling.
2.2. Soils
The system is composed of two types of soils: a reinforced backfill and the soil foundation. In this study, the reinforced backfill soil behavior is simulated by using the Plastic Hardening (PH) constitutive model [22]. This constitutive model is a shear and volumetric hardening model. The stress–strain relationship is hyperbolic during a drained axial compression, and a power-law describes the stress-dependent elastic stiffness. Moreover, a shear hardening law, a volumetric hardening law, and the Mohr–Coulomb failure criterion are included [23]. Abdelouhab et al. [14] have shown that this kind of constitutive model is adequate for the numerical modelling of retaining walls. The input parameters for the PH constitutive model were deduced from triaxial tests [14]. Table 1 shows the input parameters values adopted for the PH constitutive model.
2.3. Concrete Face and Doil Foundation
The wall face is made up of concrete in the numerical model. This concrete face is simulated using beam structural elements. These elements are resistant to tensile and compressive stresses and to bending moments. They behave as a linear elastic material (Table 2). The elastomeric pads are considered in numerical modelling by reducing artificially the beam section but keeping its actual inertia moment. The foundation soil (concrete slab) is modelled using zones, and it is assumed to behave elastically. This allows one to minimize the foundation influence on the reinforced soil behavior.
2.4. Concrete Panel/Soil Interface
To simulate the soil/structure interaction, an interface between the concrete panel and soil is defined. The interface elements parameters are related to the soil parameters. The interface shear strength () is calculated by using a strength reduction factor (), Equation (1):
The interface adhesion (Cint) was related to the backfill soil cohesion (CSoil), Equation (2):
2.5. Reinforcements
In this study, two types of synthetic strips reinforcement (a normal and a high adherence one) and a metallic strip reinforcement are considered. Their properties are presented in Table 4. These reinforcements are the same as those considered in Abdelouhab et al. [14].
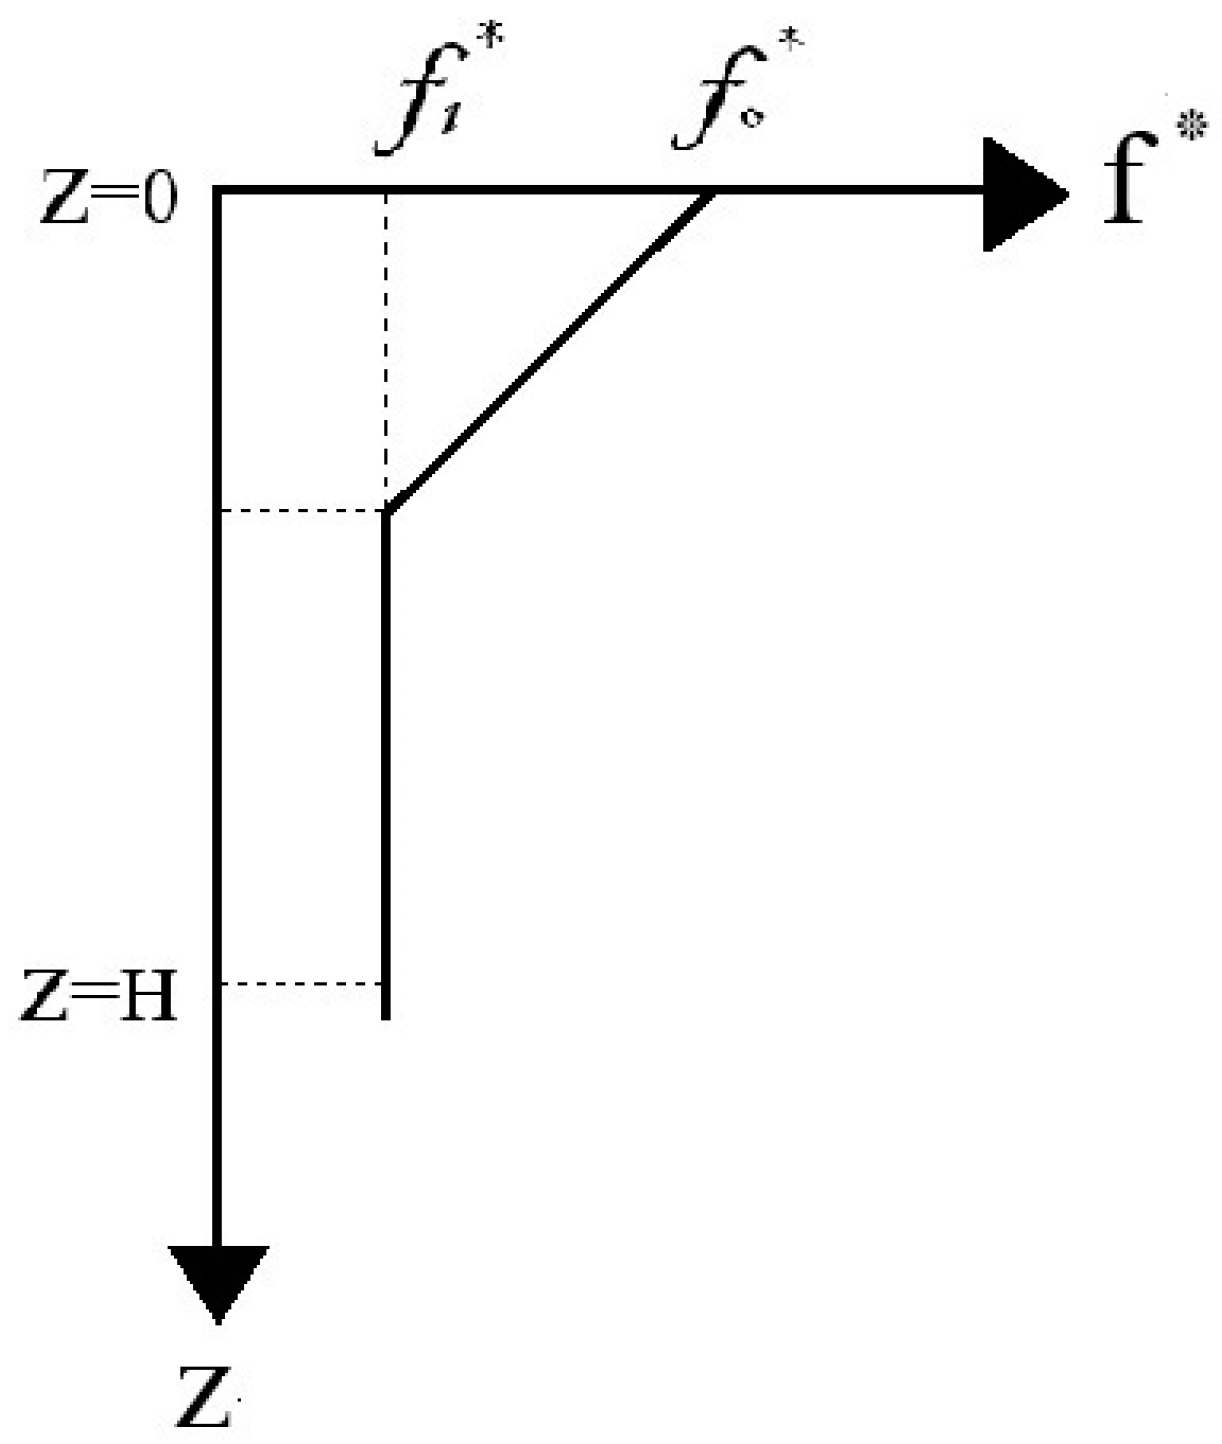
The strip structural element implemented in Flac2D is used in the following simulations for the three kinds of strip reinforcements. This element has a tensile strength limit. The shear behavior of the soil/reinforcements interface is defined by a nonlinear shear failure envelope, which changes based on the confining pressure. Figure 4 shows the relationship which is implemented for this interface shear behavior. The apparent friction coefficient depends on the wall height.
The parameters used for the interfaces are f* and kb.
- f*: Apparent friction coefficient/
- : Maximum shear stresses exerted by reinforcements.
- : Initial vertical stress applied on strips.
- kb: Shear stiffness at the soil strip interface.
- : Maximum tensile force on the strip.
- : Strip length.
- : Relative soil/strip displacement at the total mobilization of the strip in pullout tests for a wall of 1 m in width.
2.6. Comparison Criterion
The norm of the maximal displacement |U| of the reinforced backfill is used to obtain the displacement amplitude of the wall:
where Ux and Uy are, respectively, the horizontal and vertical displacements of the concrete face.
The wall stability is evaluated by the calculation of the factor of safety (Fs), which is calculated by the c − φ reduction process [23]. The factor of safety is then obtained by
3. Numerical Modeling
3.1. Reference Model
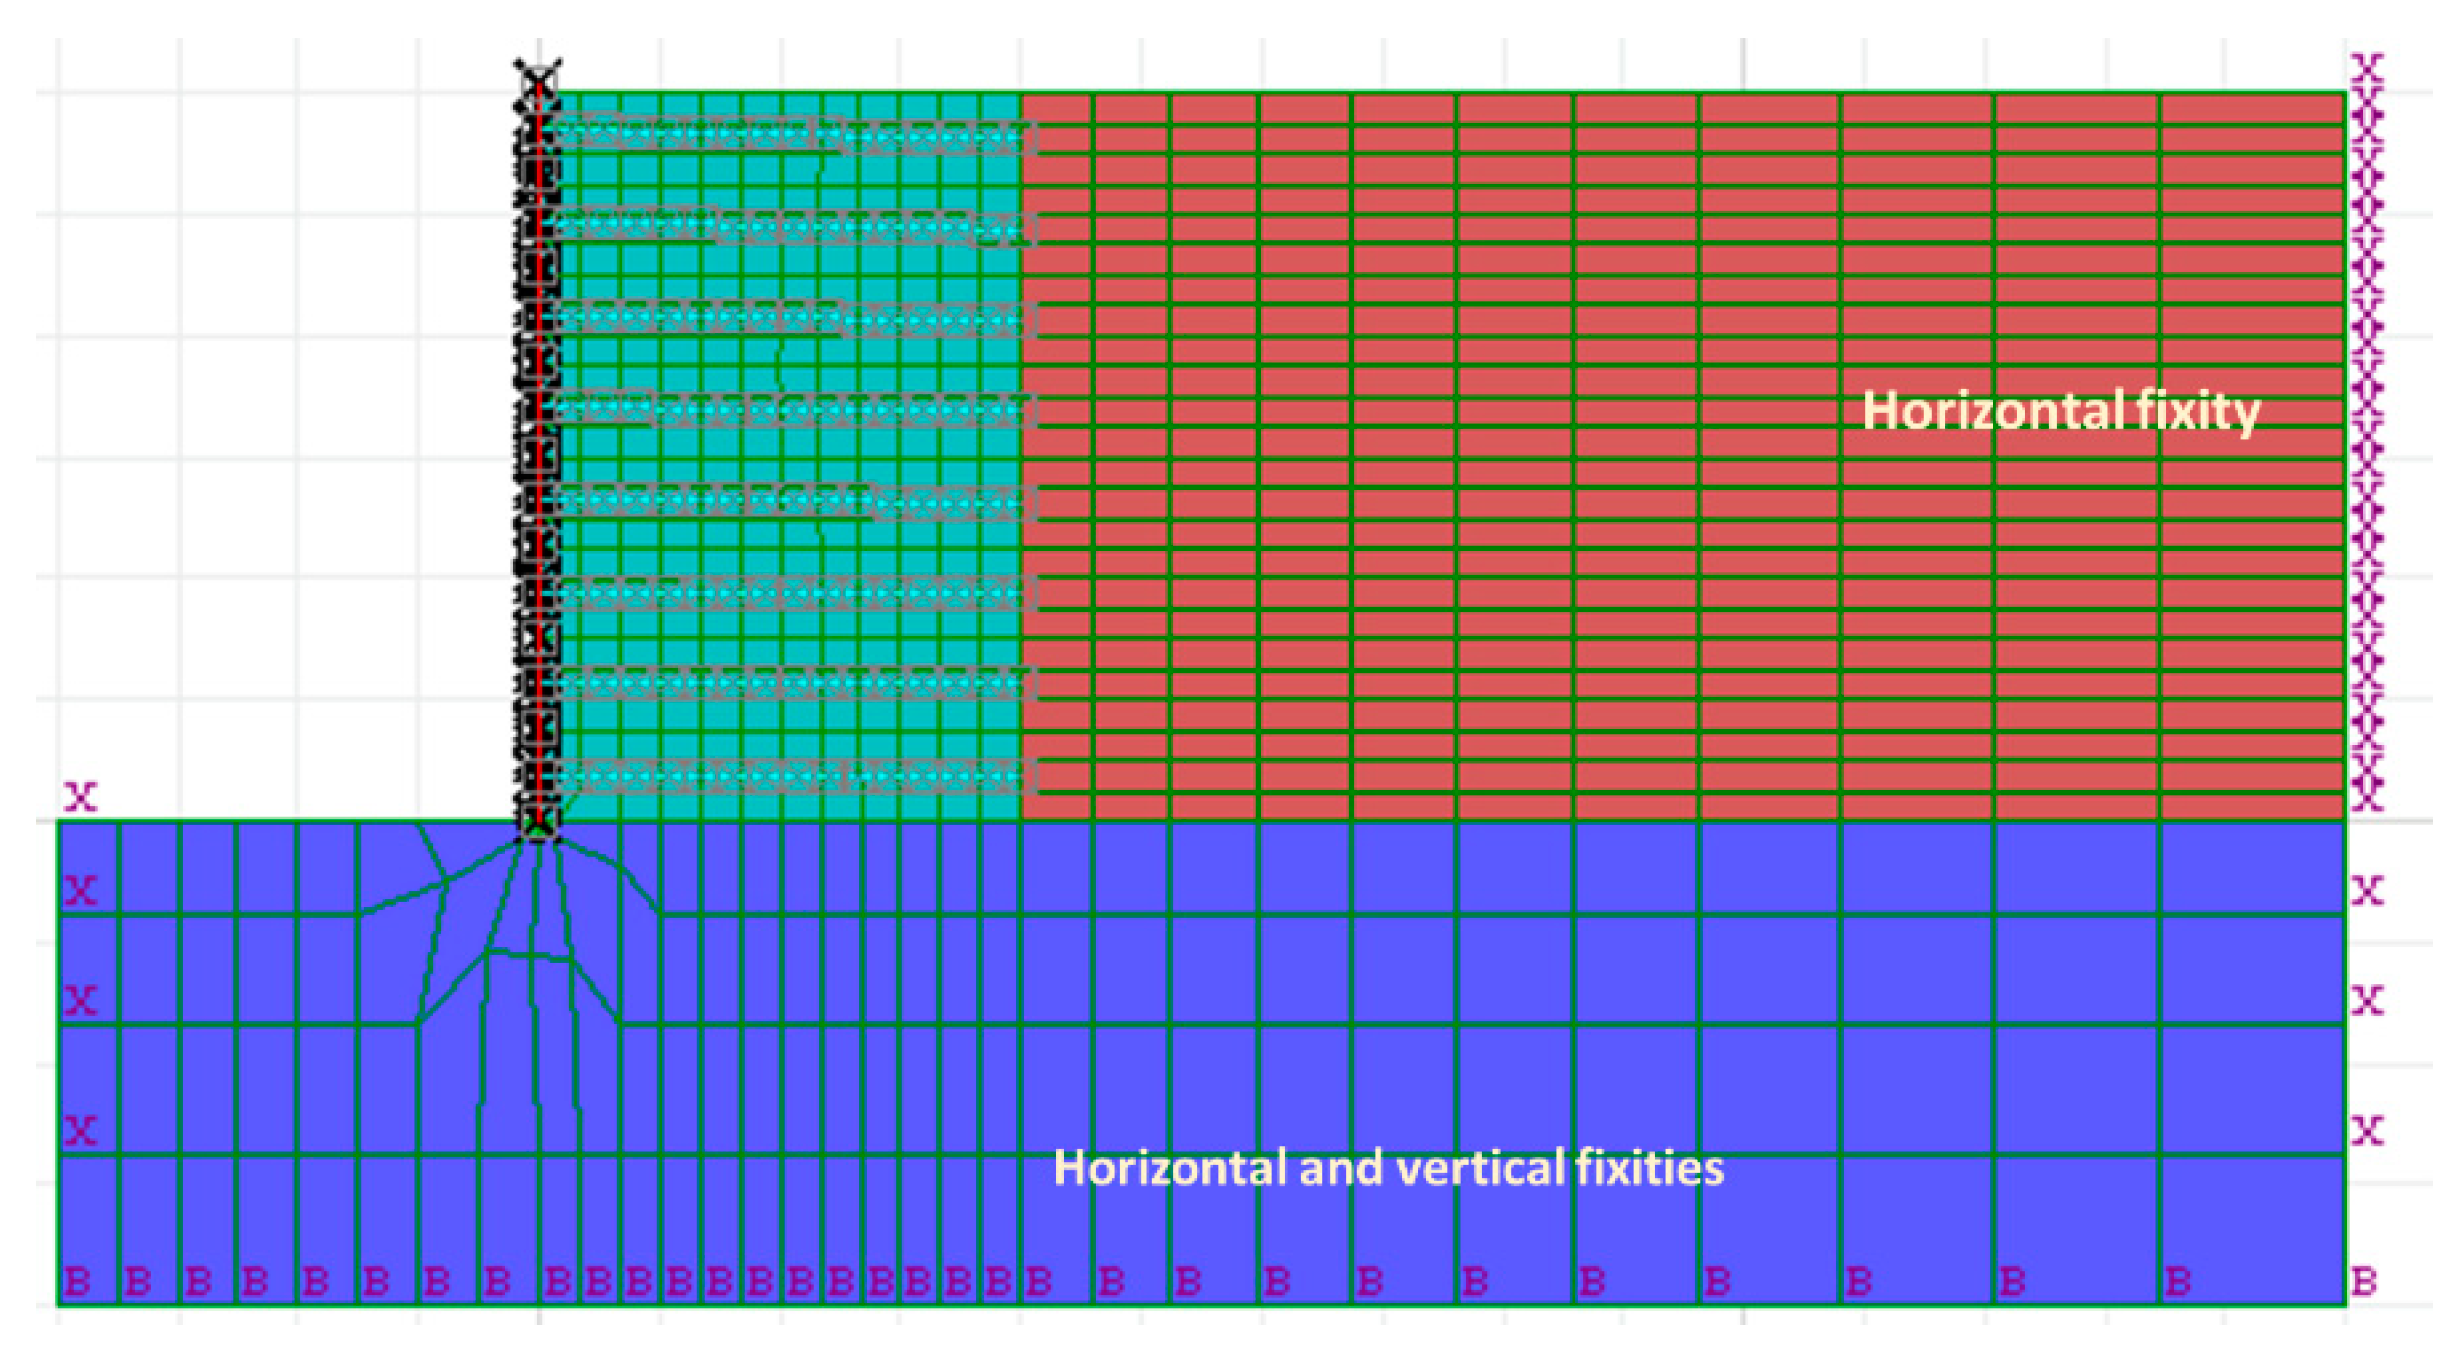
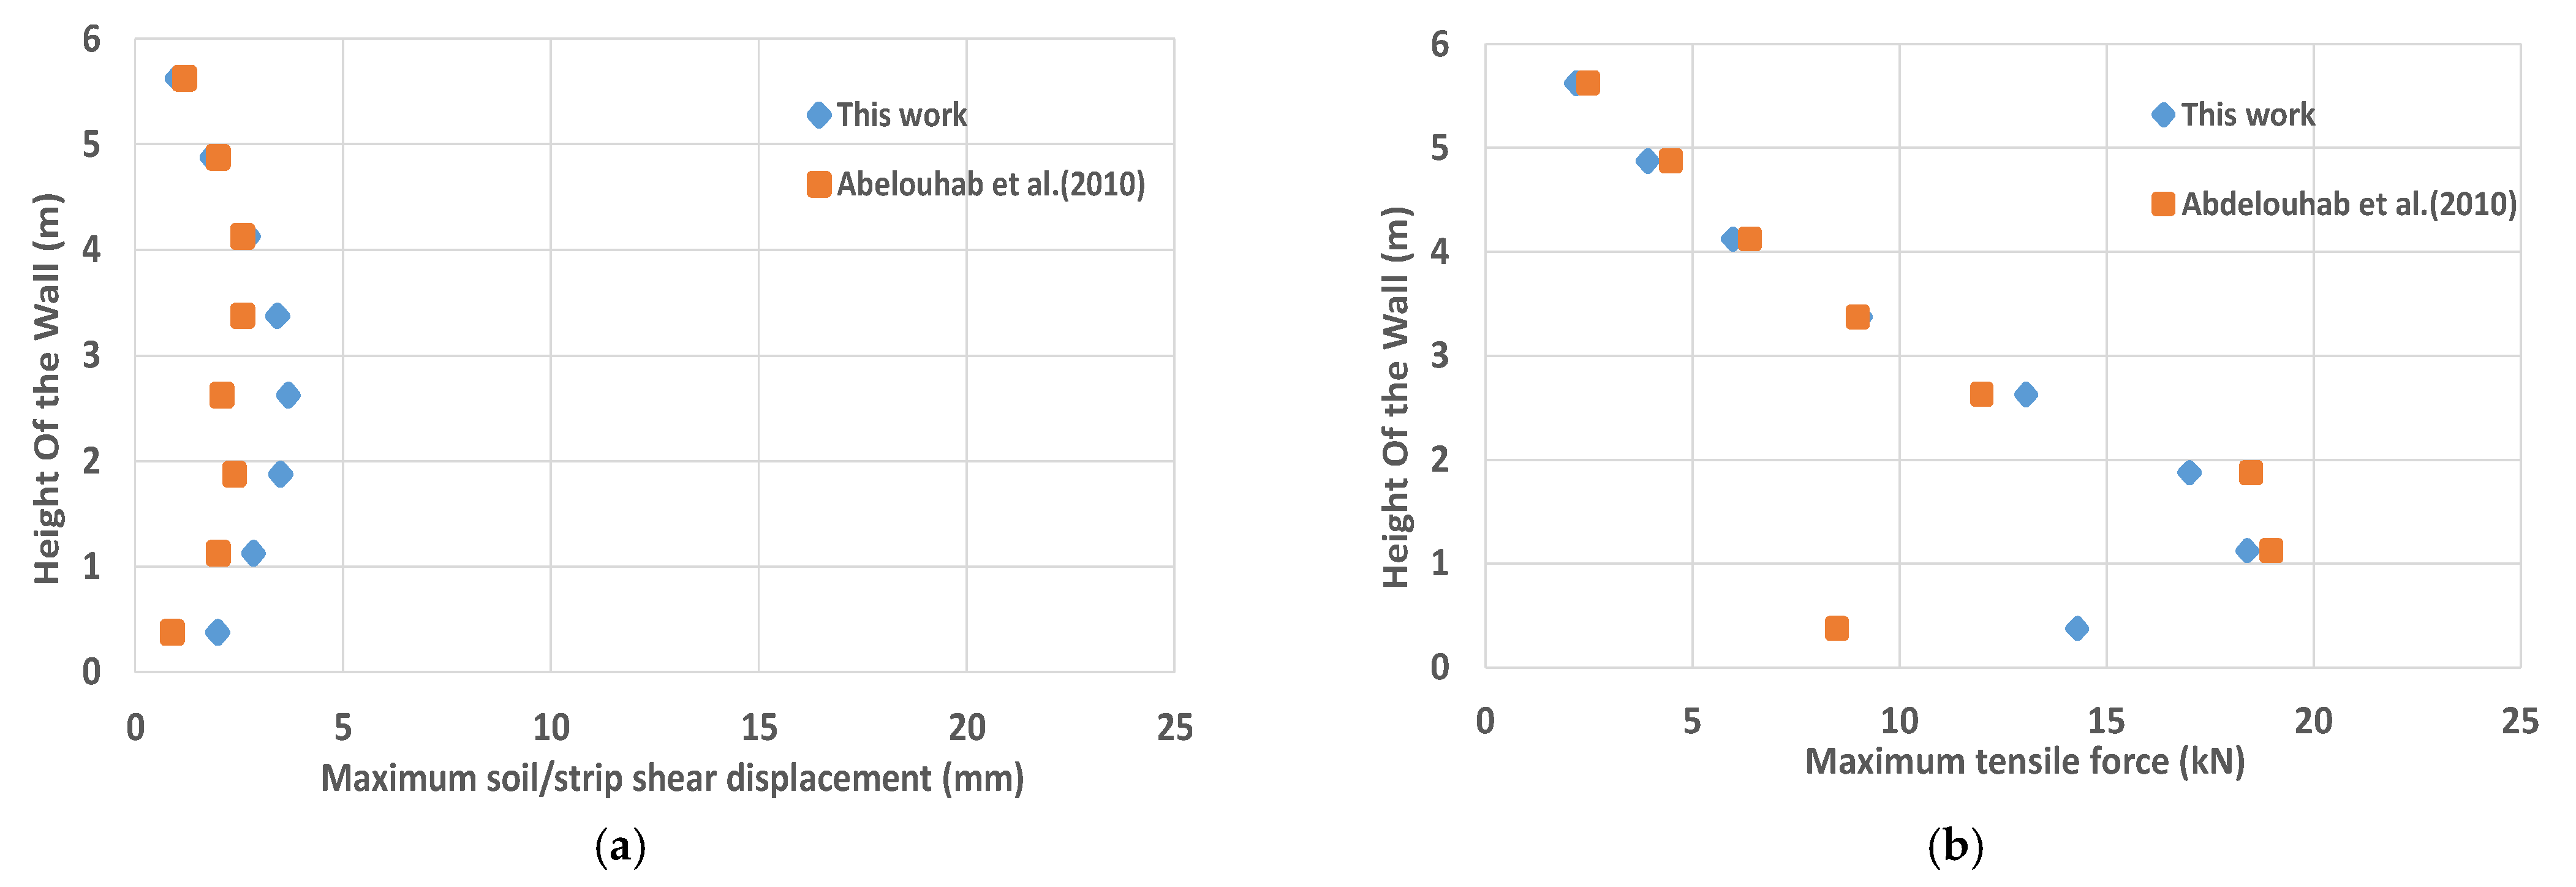
In order to validate the developed numerical finite differences model, the reference case of Abdelouhab et al. [14], which is a wall reinforced (W/H = infinity) with metallic strips, is simulated (Figure 5). The numerical model is composed of 1250 gridpoints. The model base is fully fixed, and the two lateral faces are blocked in their normal direction. The only difference is the constitutive model used in this study which, is the PH one; the CJS2 (constitutive model for granular materials based on two plasticity mechanisms [25]) one was used by Abdelouhab et al. [14]. Figure 6 shows the comparison of the results of the proposed study with the reference case. The soil/strip shear displacements and tensile force variations along the reinforced wall are presented. A good agreement is found between the results of these two models and permits us to show that the constitutive model used here has the same features as that used in the former study.
3.2. Parametric Analysis
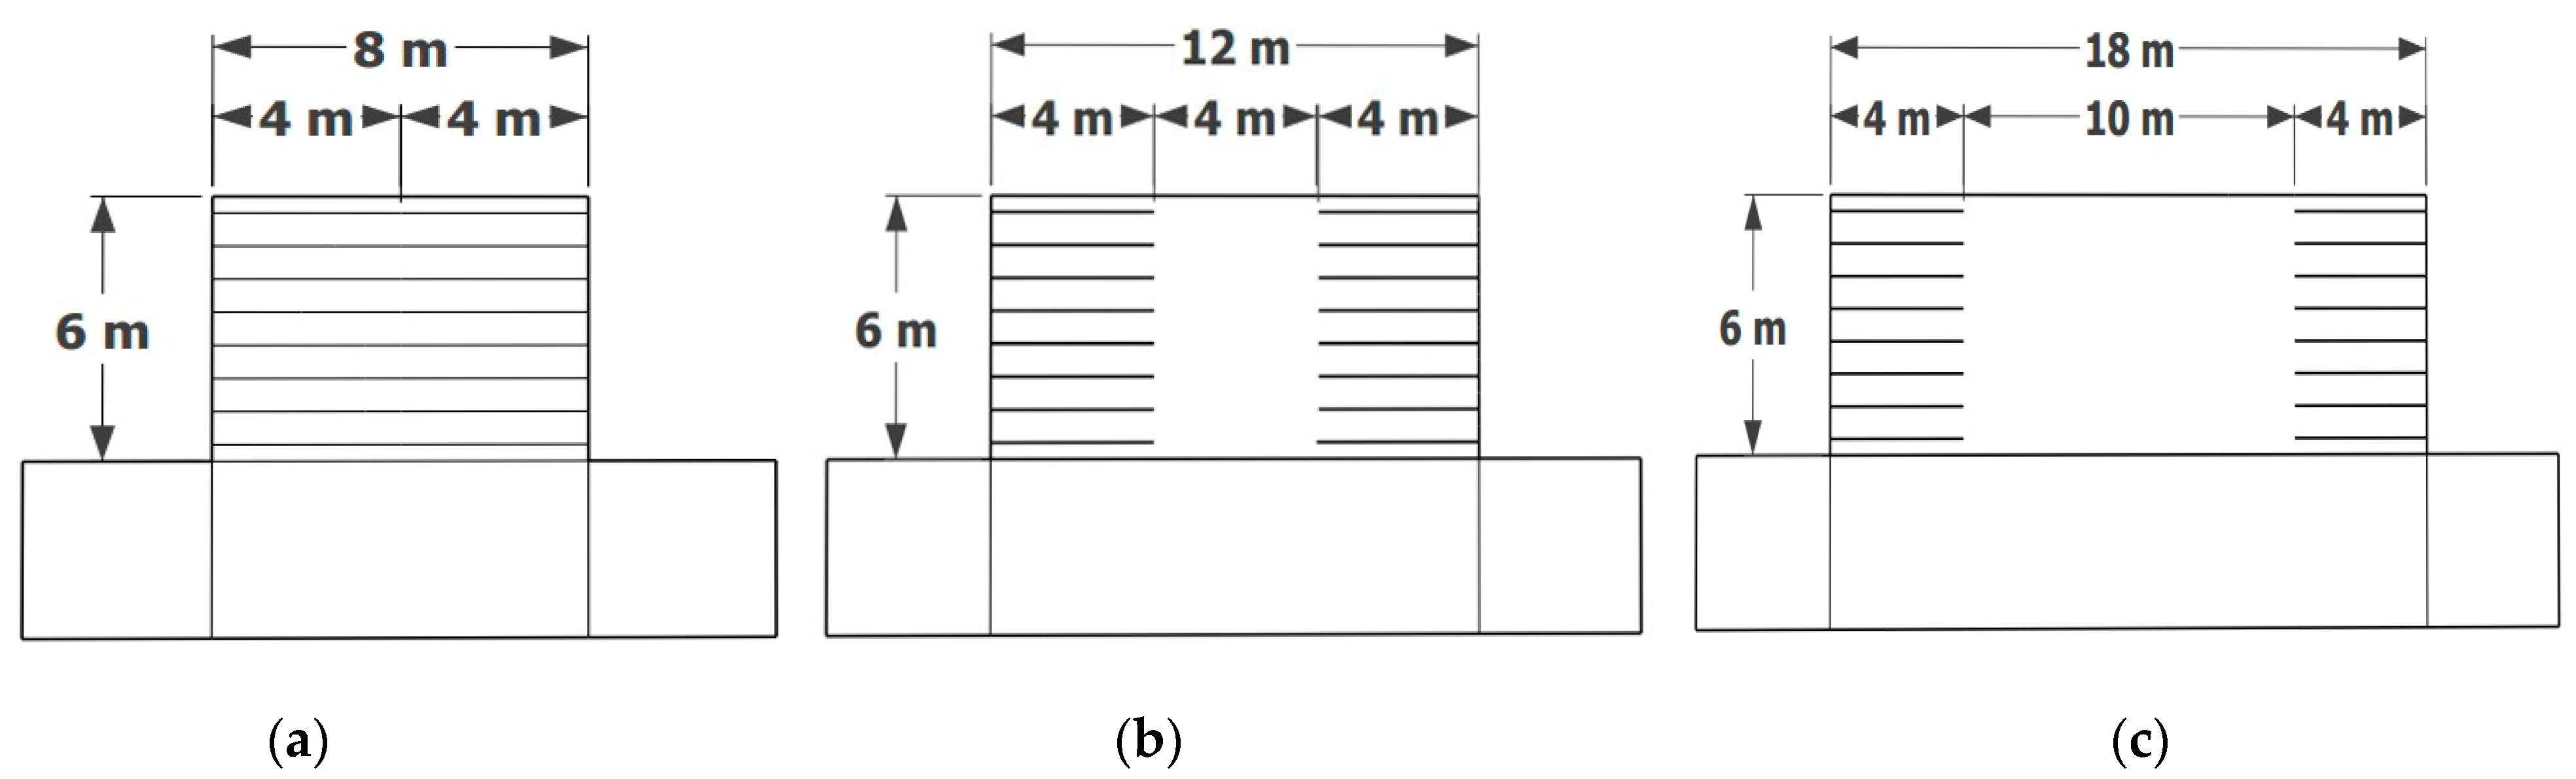
In this section, the behavior of back-to-back walls considering three width to height (W/H) ratios for three types of strips reinforcement is investigated. The height of the wall (H) and the reinforcement length (L) are fixed and are, respectively, equal to 6 and 4 m. The horizontal distance between the reinforcements from each other (D), which is the variable parameter of this study, is determined by the proposed equation of the FHWA design guideline [26]. In this study, the influence of the distance between the reinforcements in the horizontal direction is considered by using three cases: D equal to 0, which is a lower value than the proposed one of the FHWA design guideline, and D equal to 4 and to 10 m, which are, respectively, closer and greater than the FHWA proposed value (Figure 7).
Figure 7a shows back-to-back walls where there is no unreinforced fill between these two walls (D = 0 m). The back-to-back wall configuration includes, then, two separate walls with their reinforcements, and there is no connection between their reinforcements.
3.2.1. Influence of the Width to Height Ratio (W/H)
Soil/Strip Shear Displacement
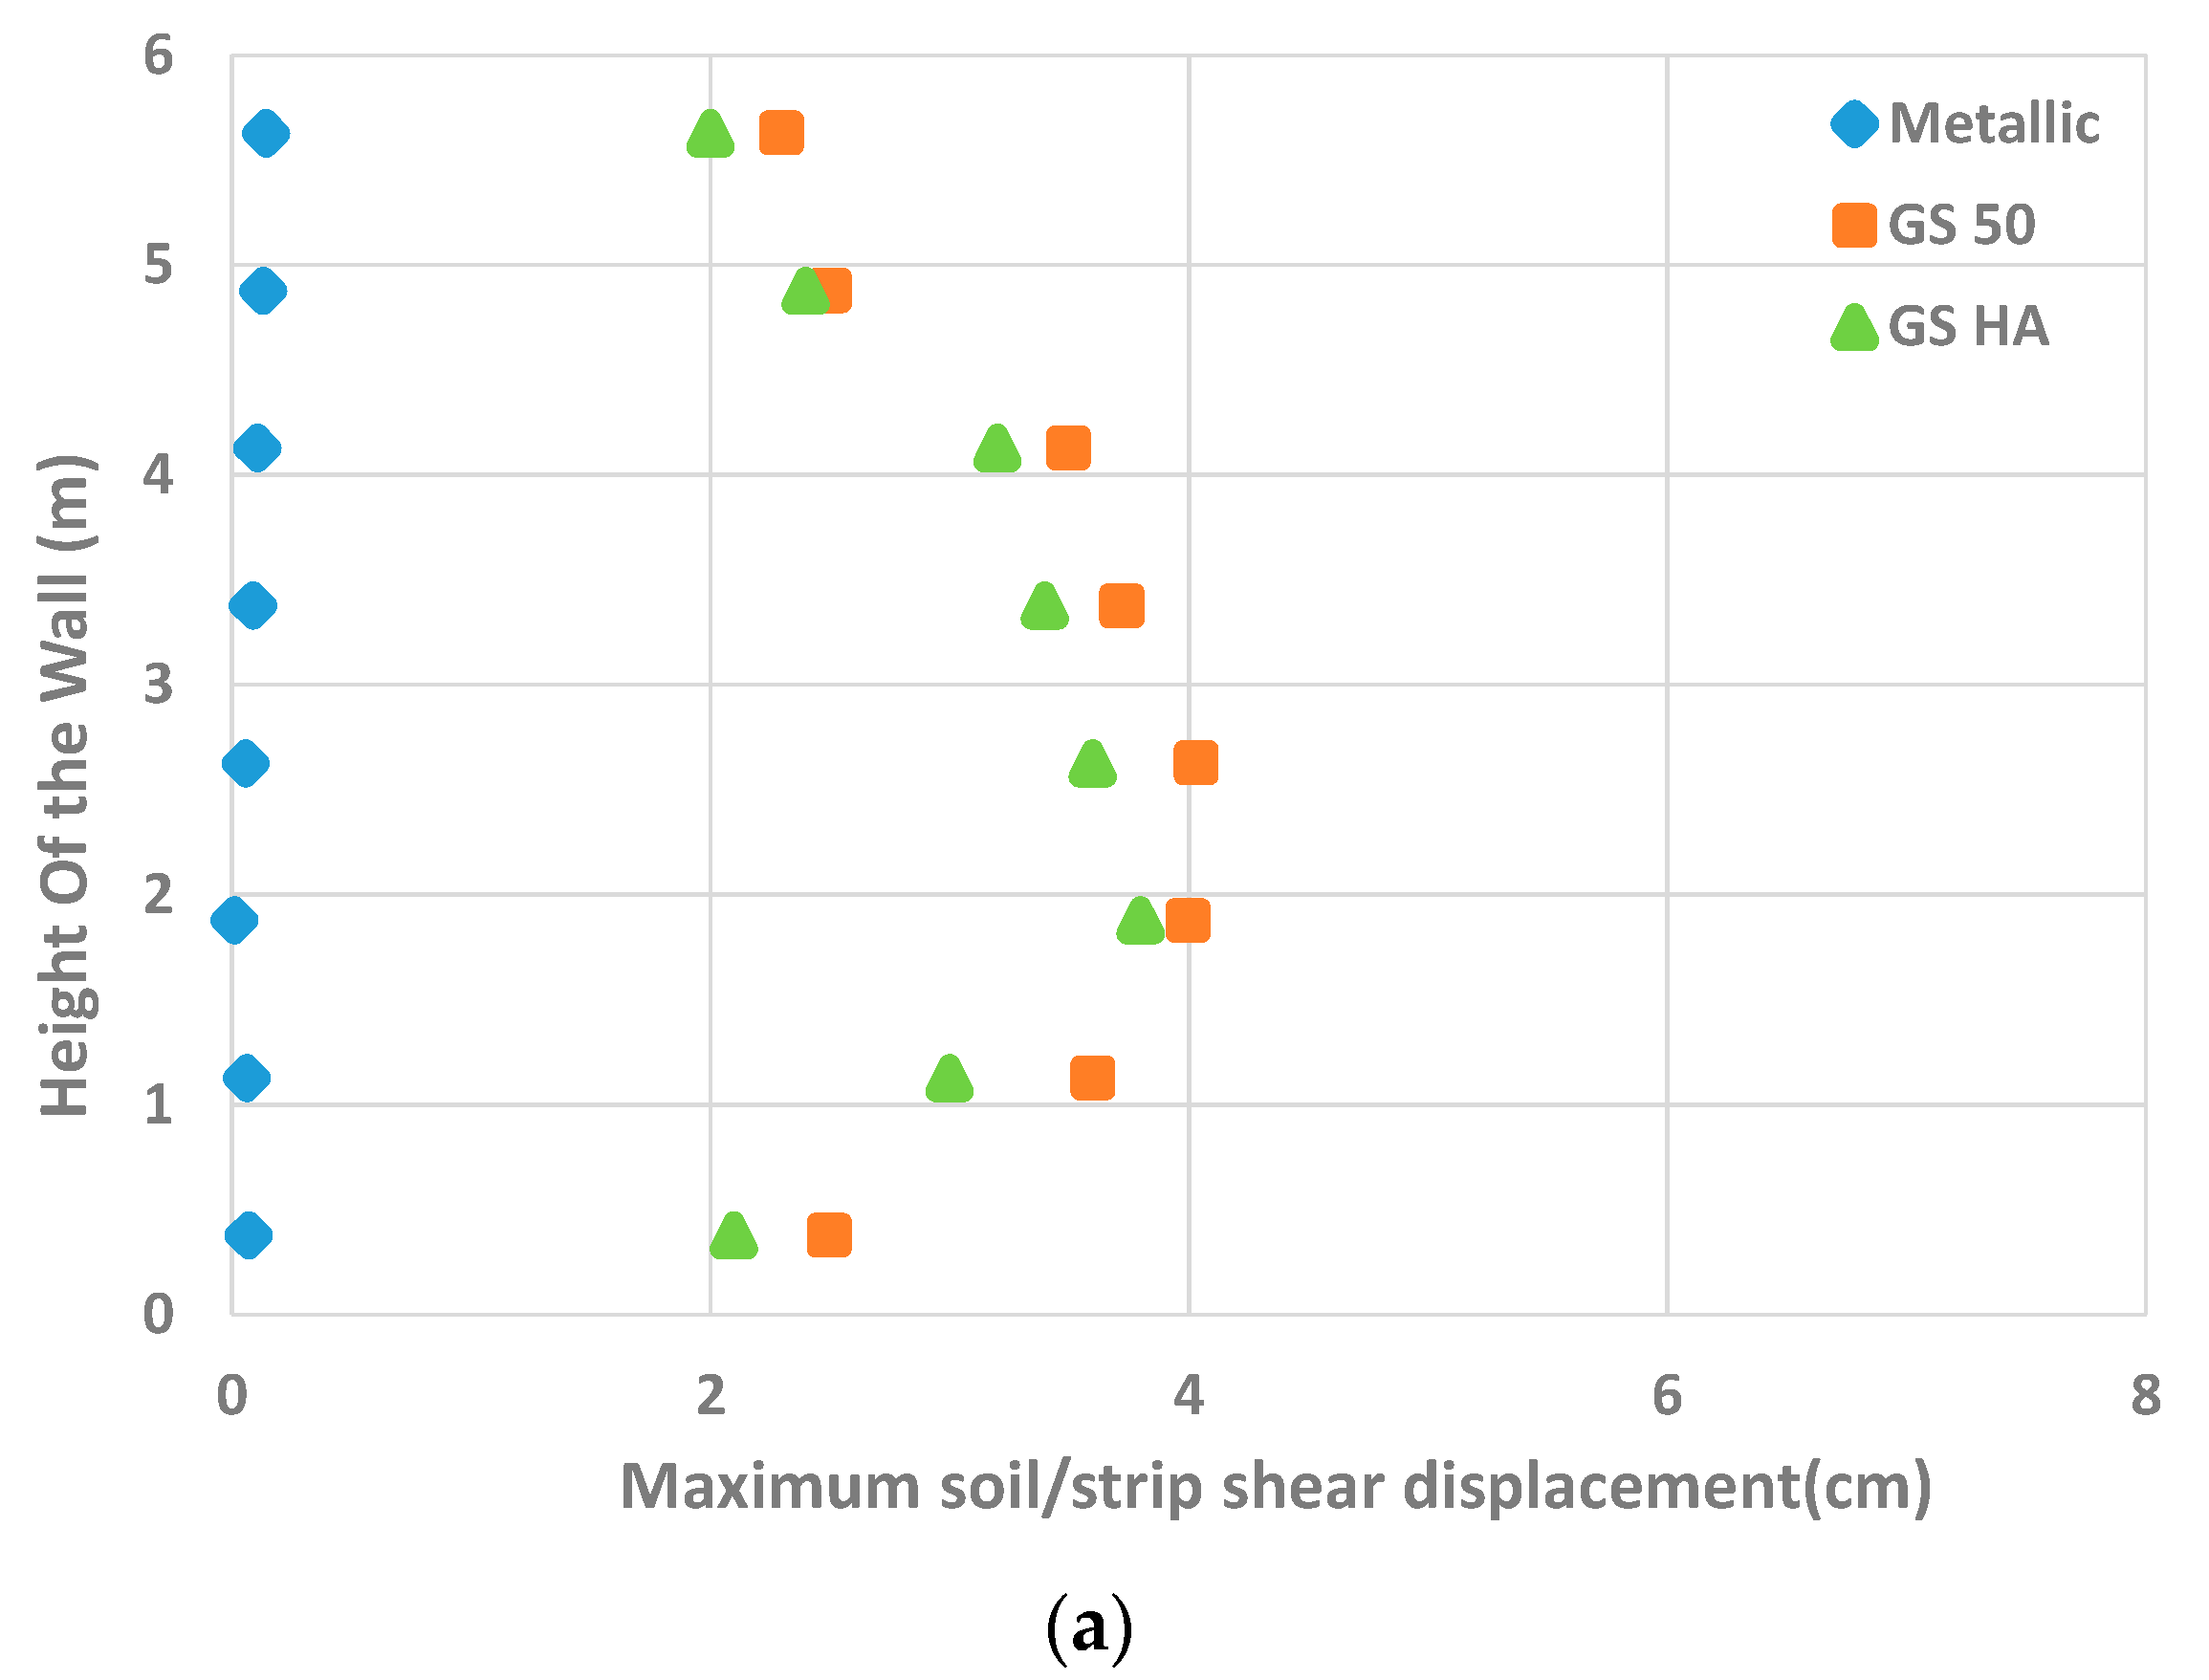
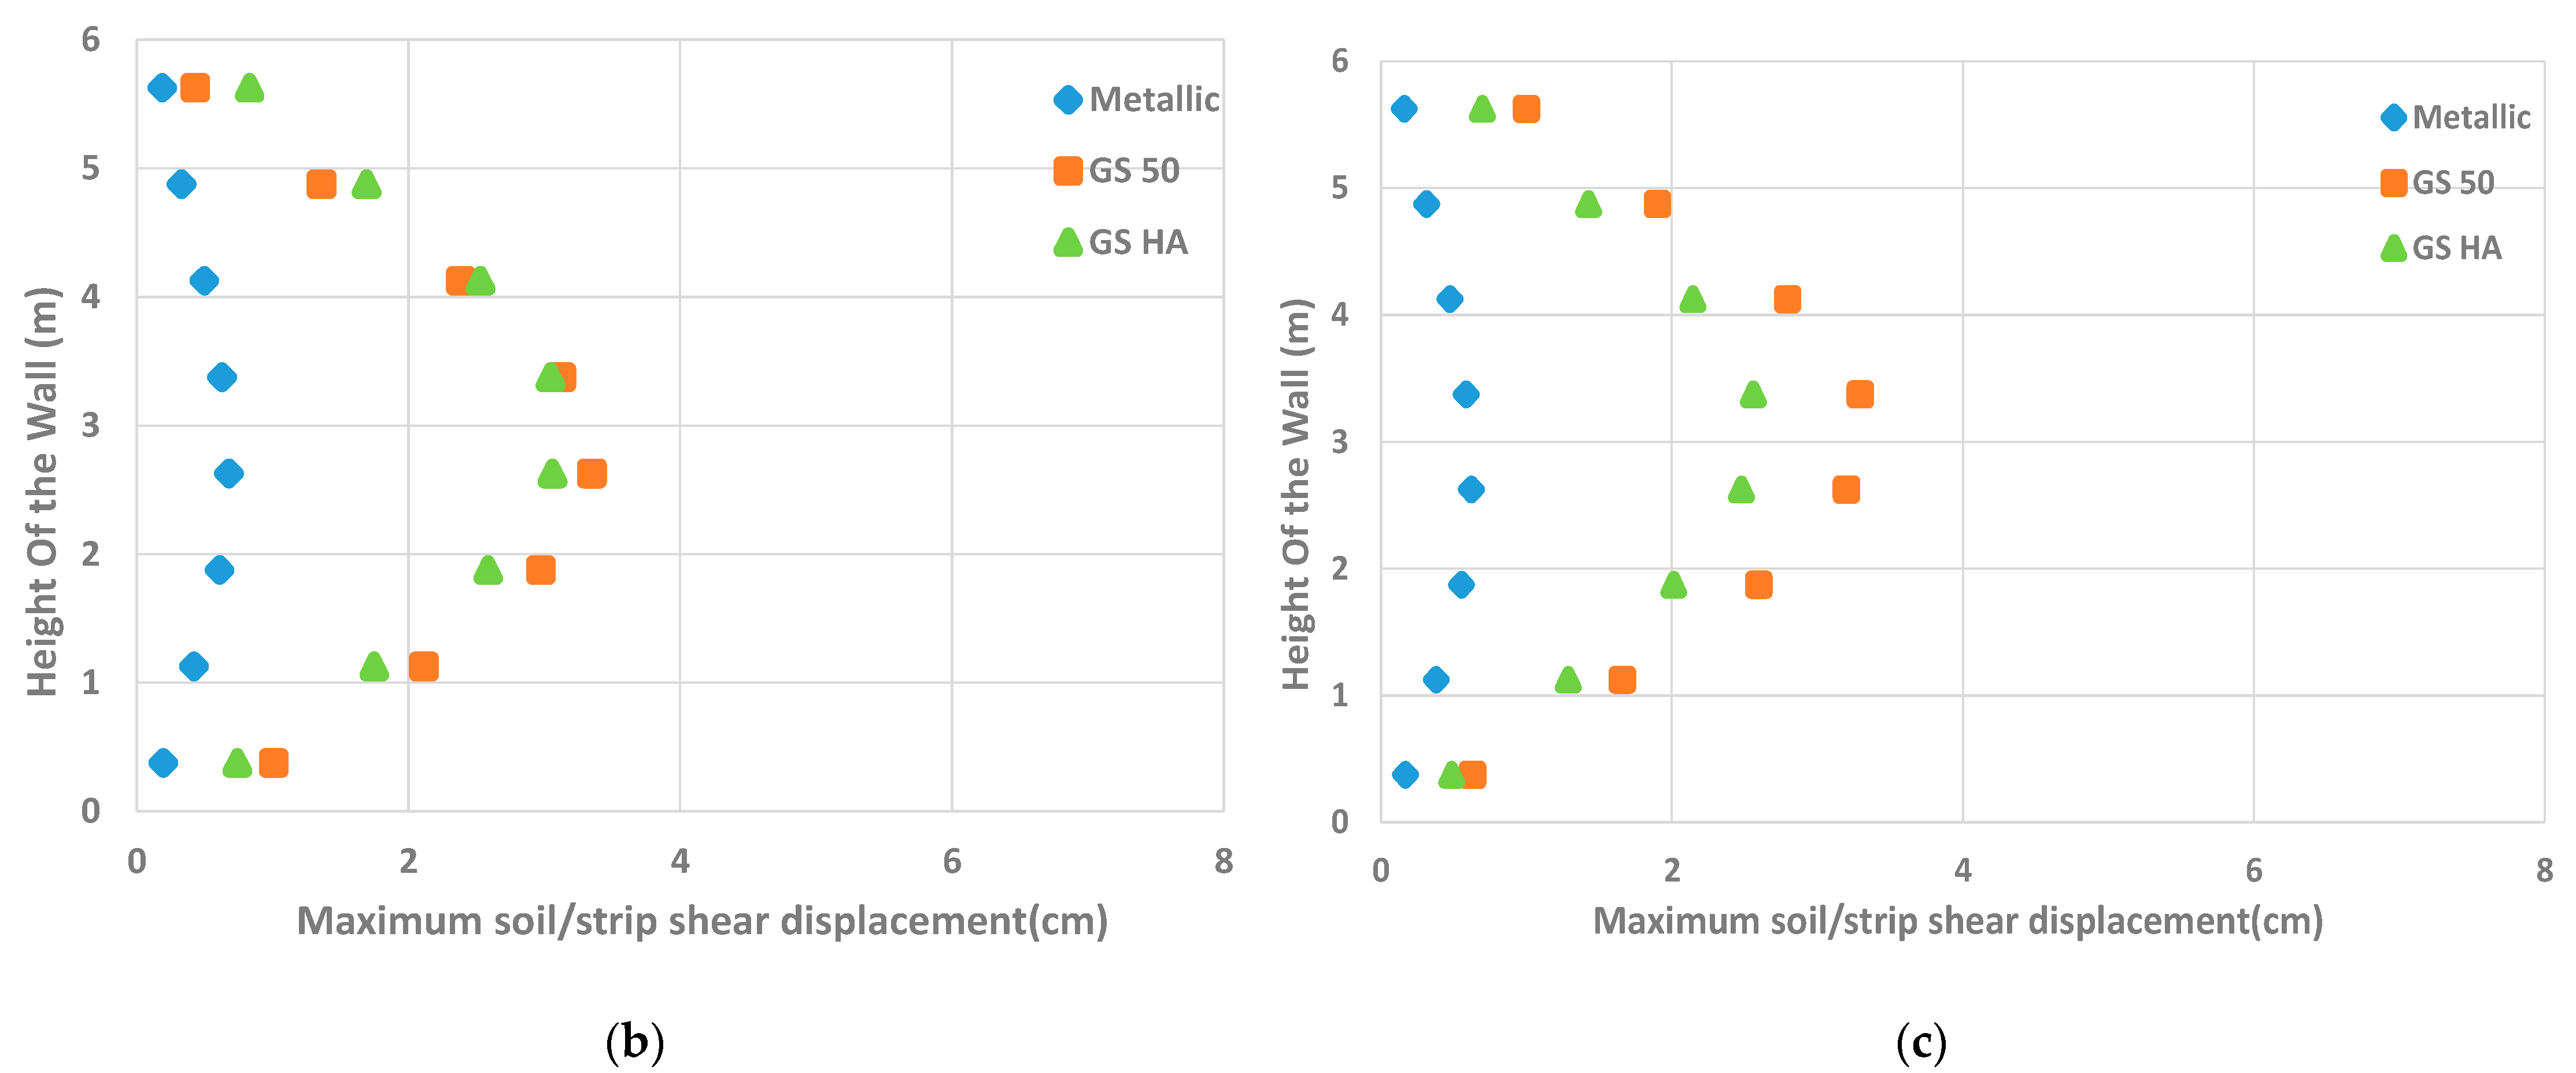
As shown in Figure 8, the soil/strip shear displacements for the three considered strips started to increase from the bottom of the wall. As the wall height increases, they decrease so that the greatest displacement occurs between the fourth and fifth strips and the lowest between the seventh and the eighth strips. As the distance of the reinforcement strip (D) increases, the values of the soil/strip shear displacements increase. The distance between reinforcements and the soil/strip shear displacements is directly linked.
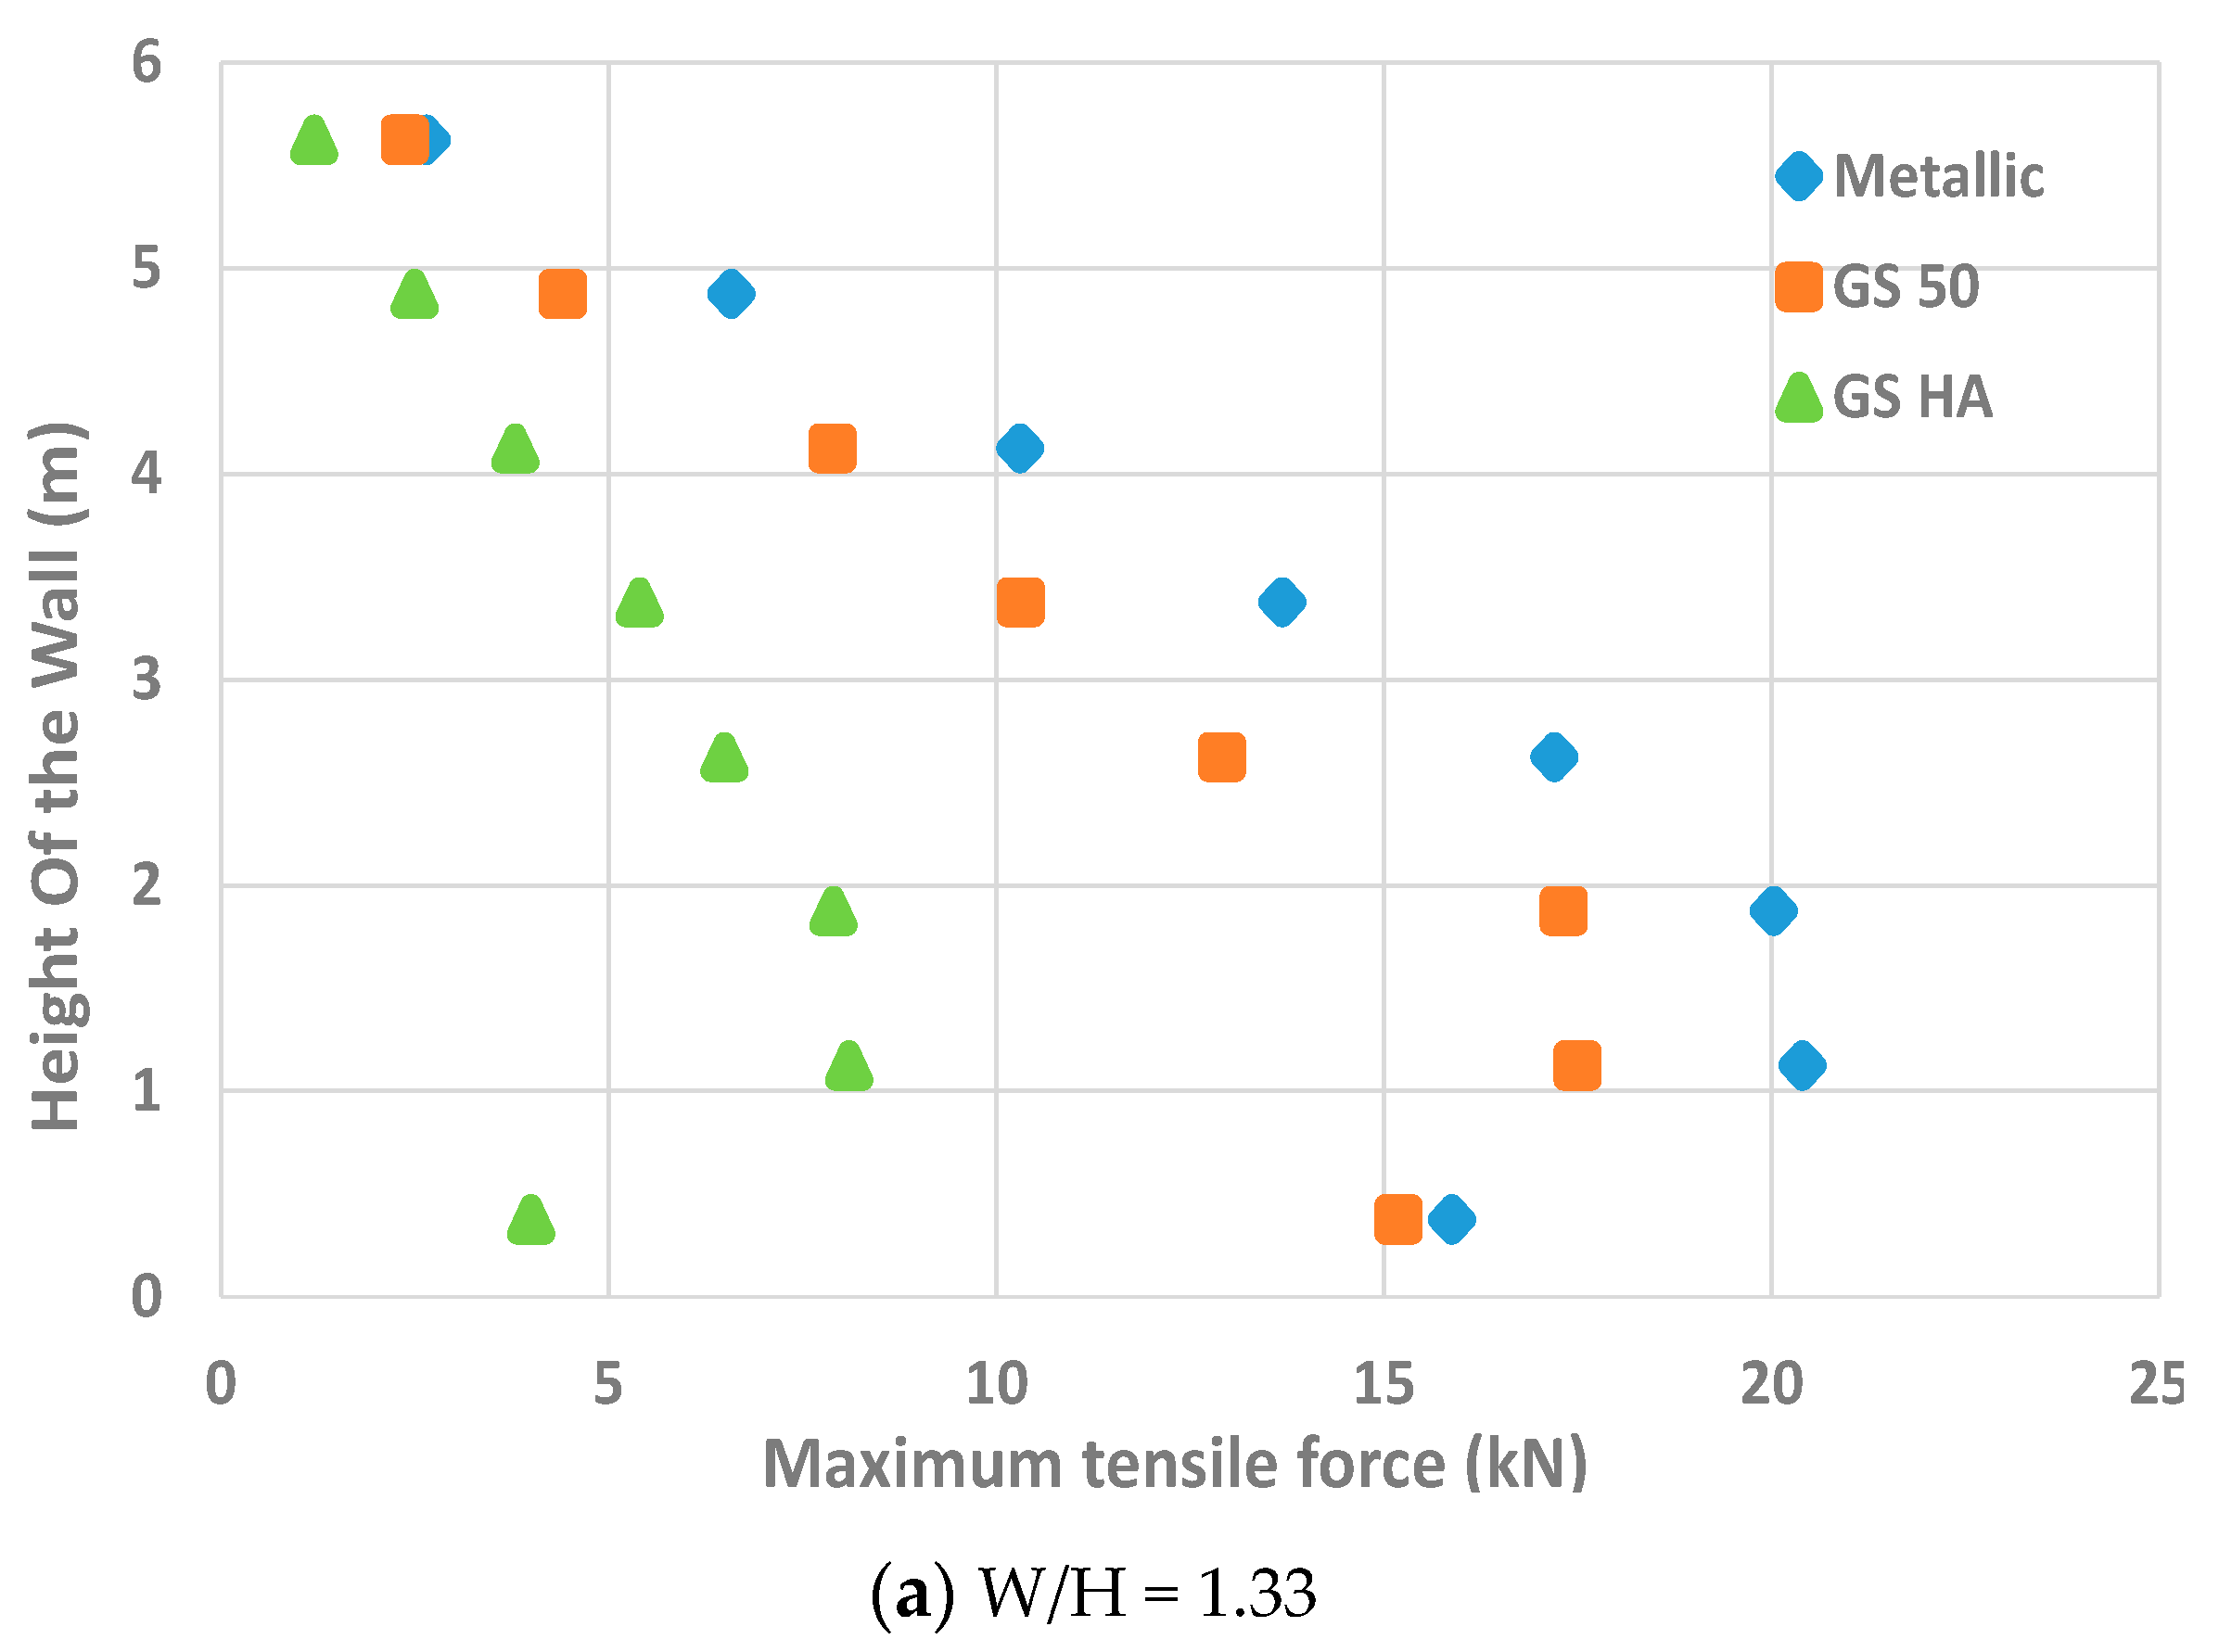
Tensile Force
The analysis of the tensile strip forces show that the maximum tensile force occurs at 2 m below the wall and then decreases and reaches the lowest value at the wall top (Figure 9). It is also observed that with an increase in the distance between reinforcements (D), the amount of the tensile force on the strips decreases. The tensile force on the reinforcements is inversely related to their distance. GS50 and Metallic strips have the same tensile yield-force. However, the tensile yield-force of the GS HA strips is 30% lower than that of GS 50; thus, the results are different.
Ultimate Limit State of Back-to-Back Reinforced Walls
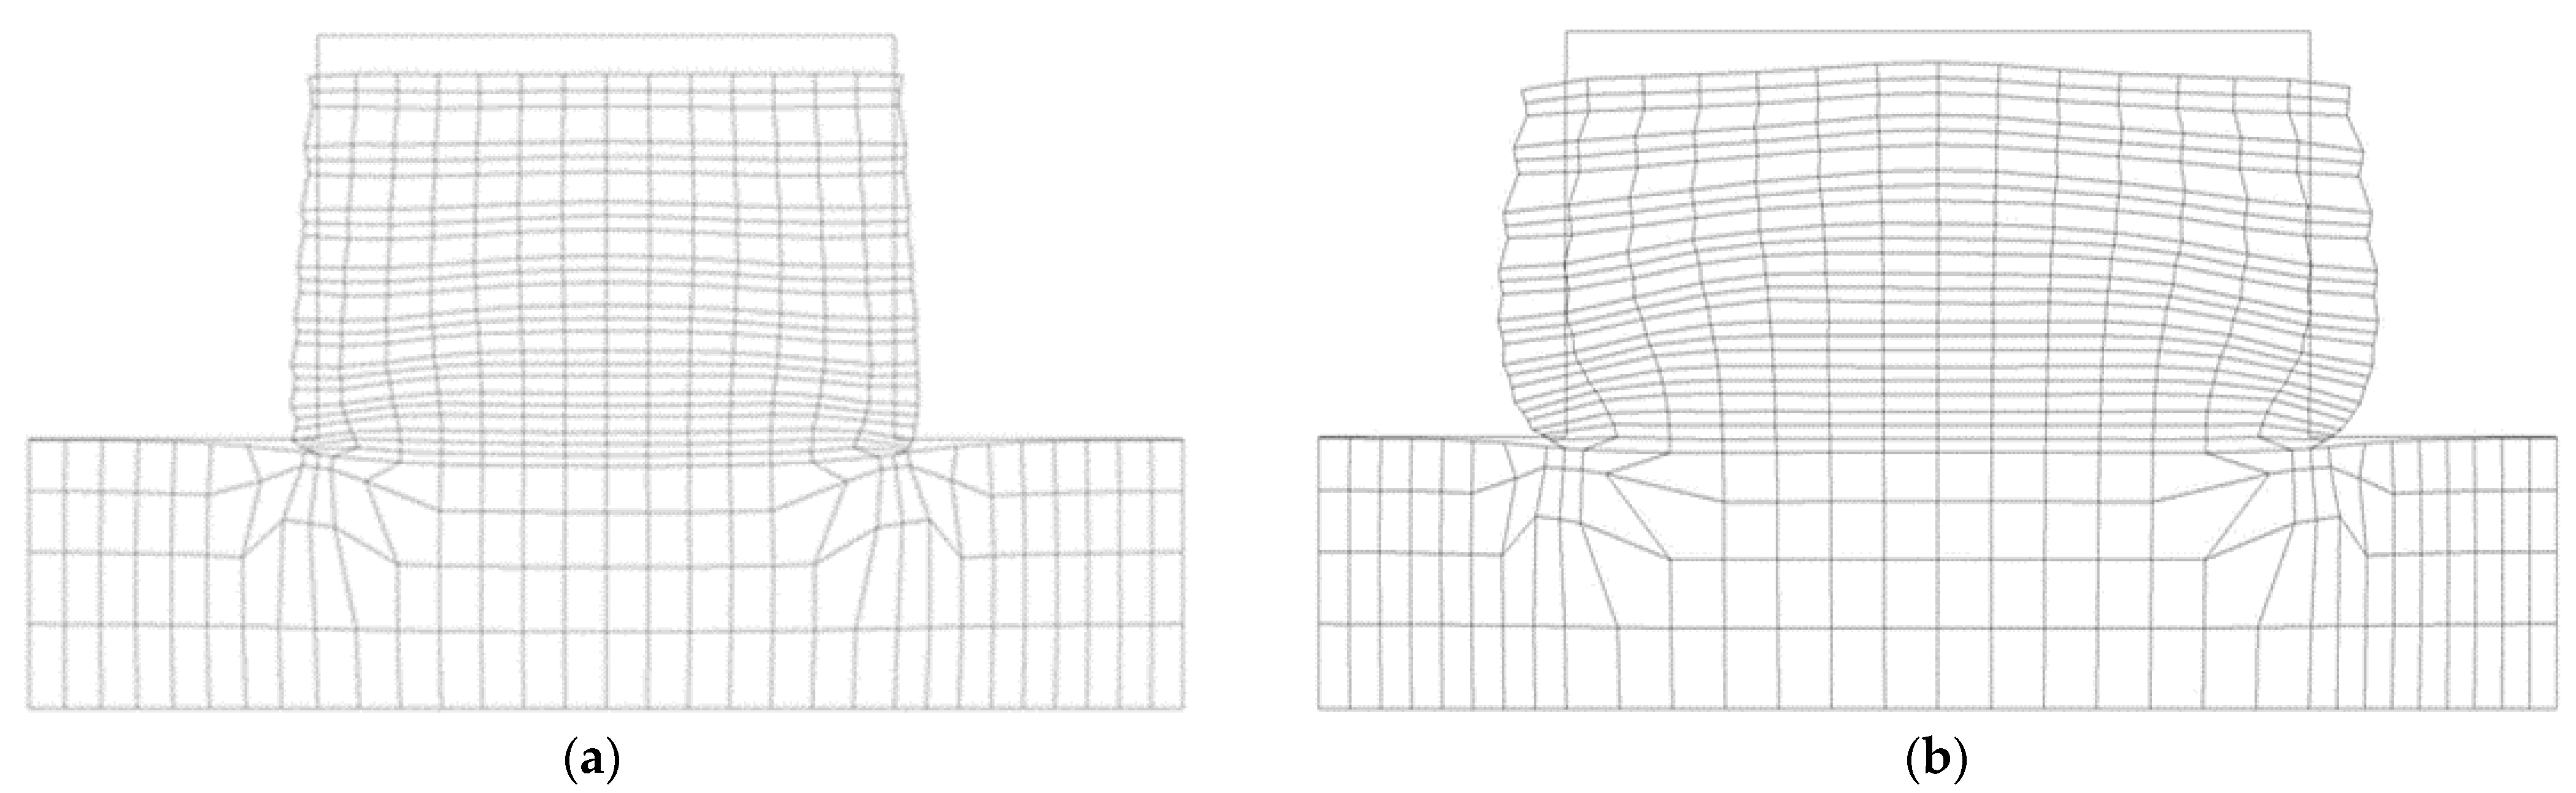
Figure 10 shows the wall failure for the reference case (metallic strips). At failure, a soil/strip adherence default for the bottom and middle top reinforcement layers (W/H ratios of 2 and 3) is noted. In addition, for W/H ratios of 2 and 3 considering the synthetic strips (GS HA and GS 50), the wall failure shape is the same as that in the reference case (Figure 10).
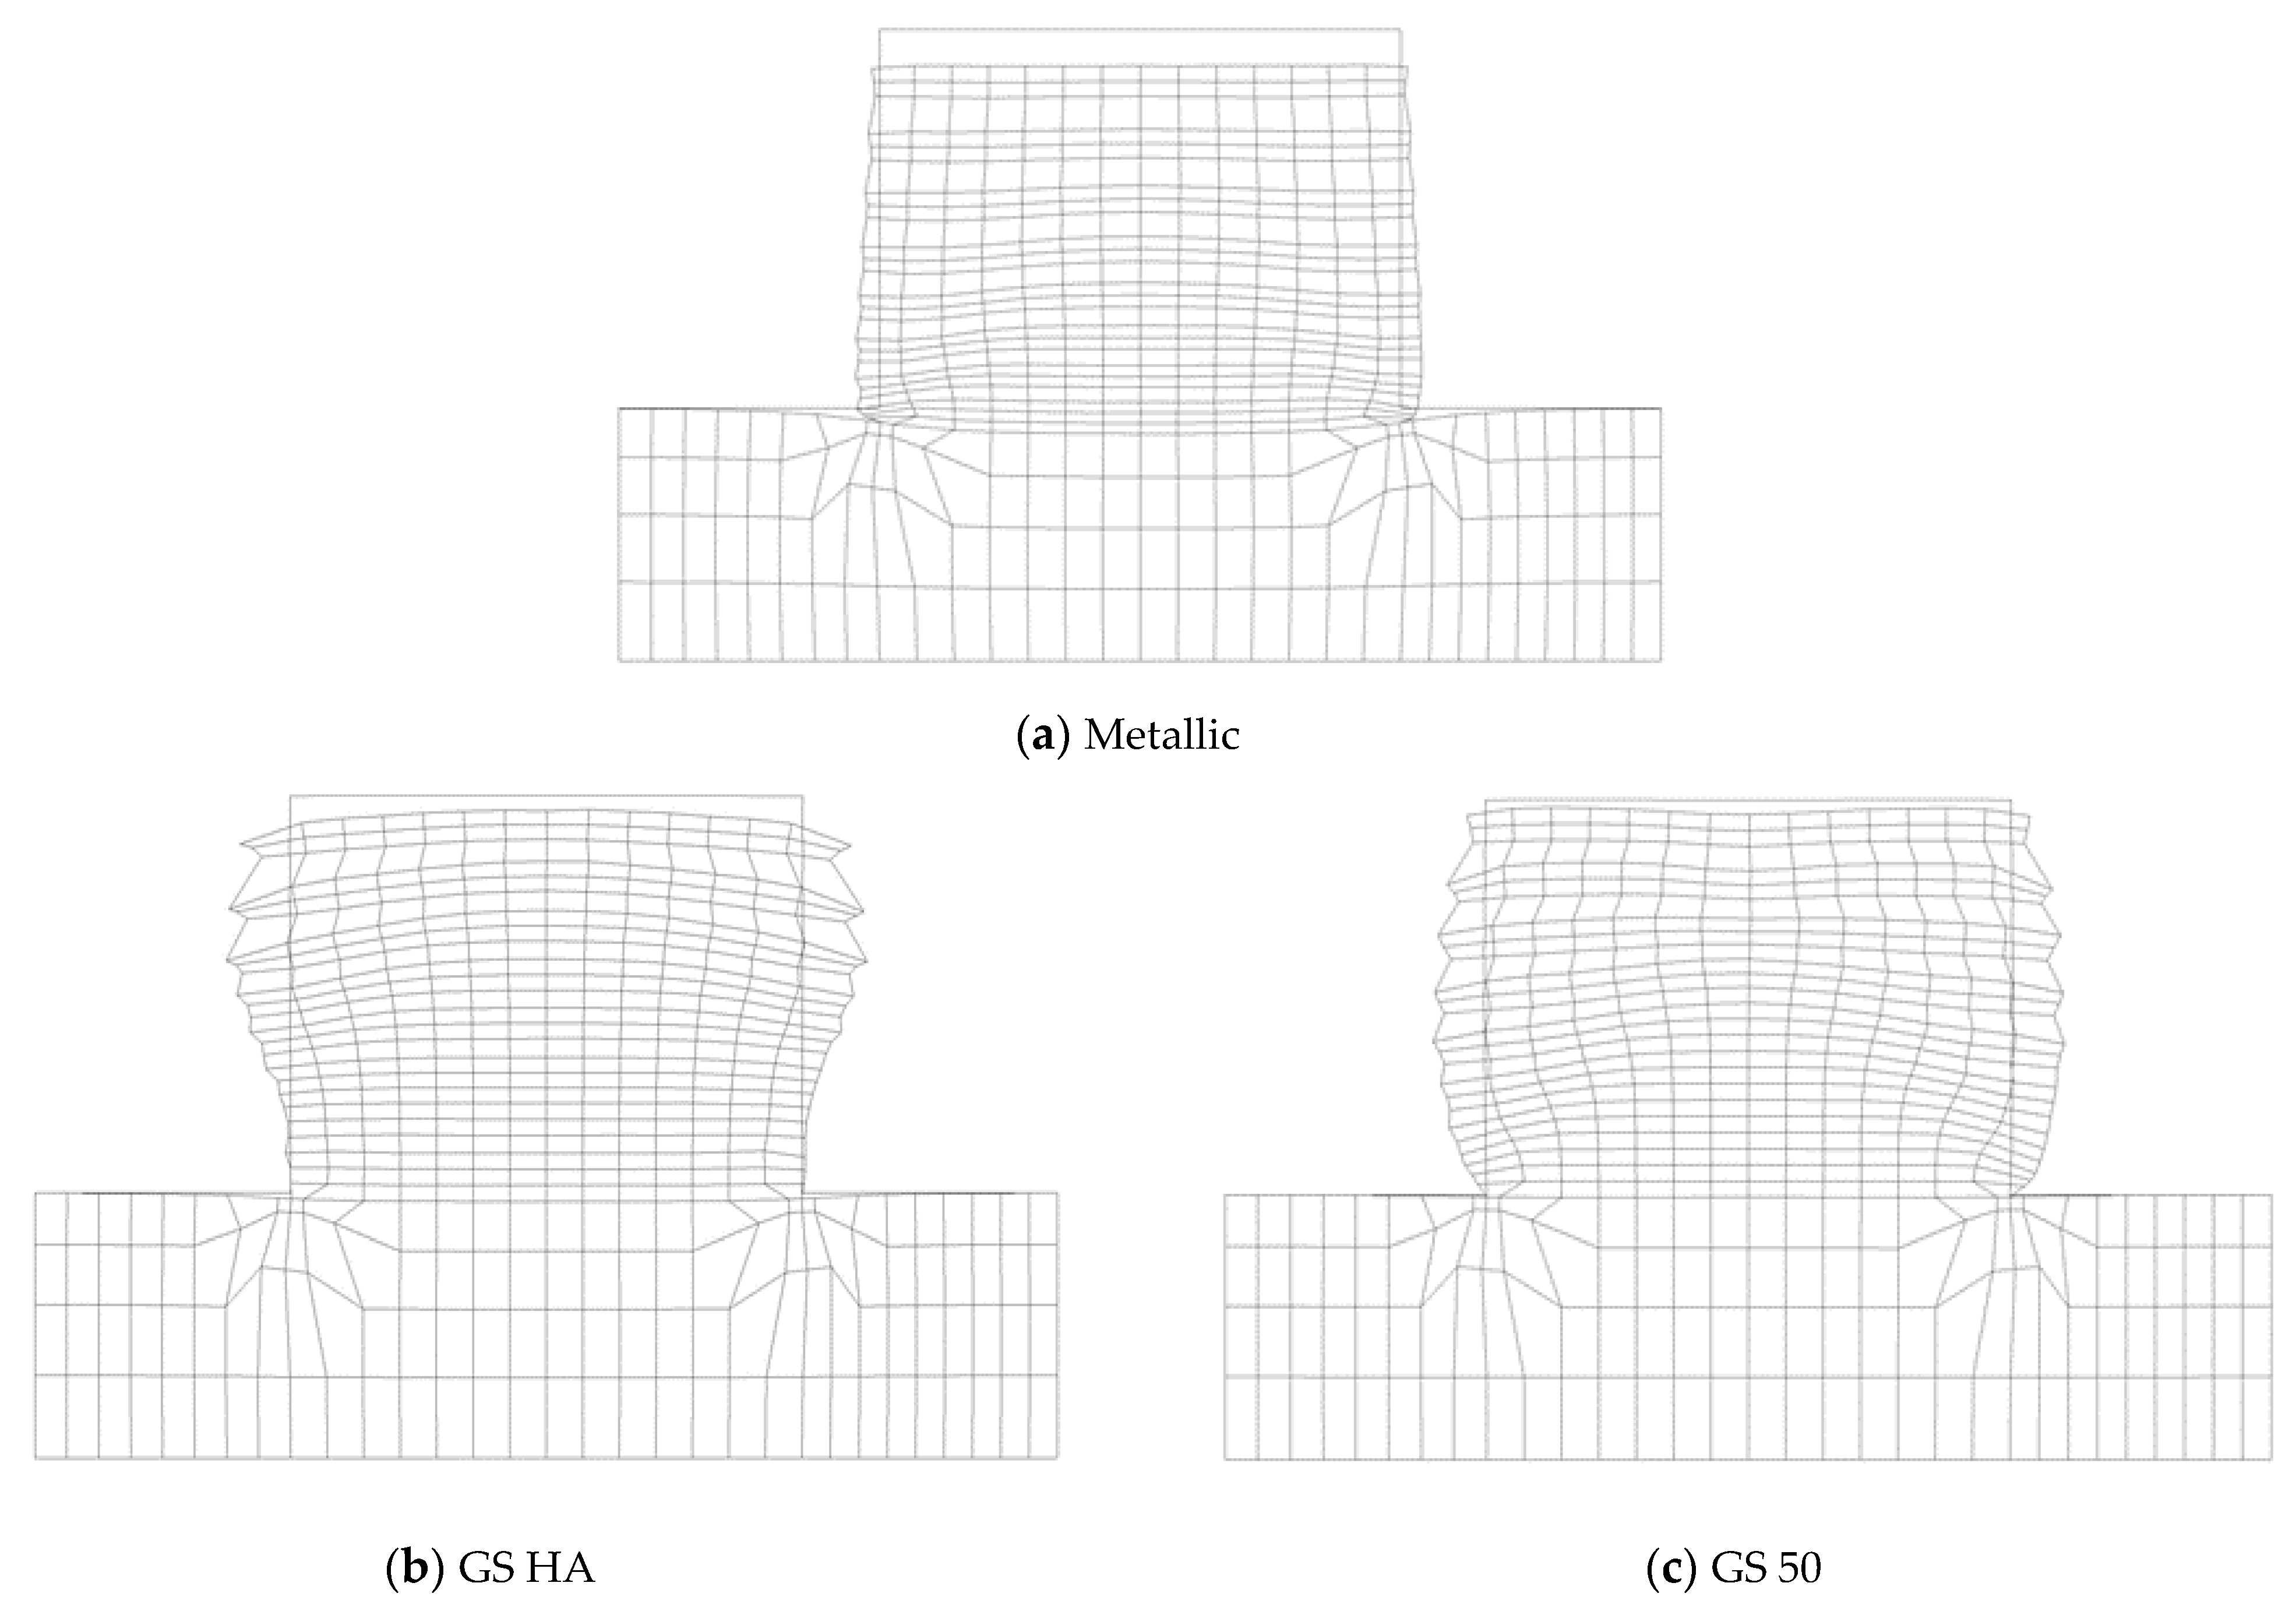
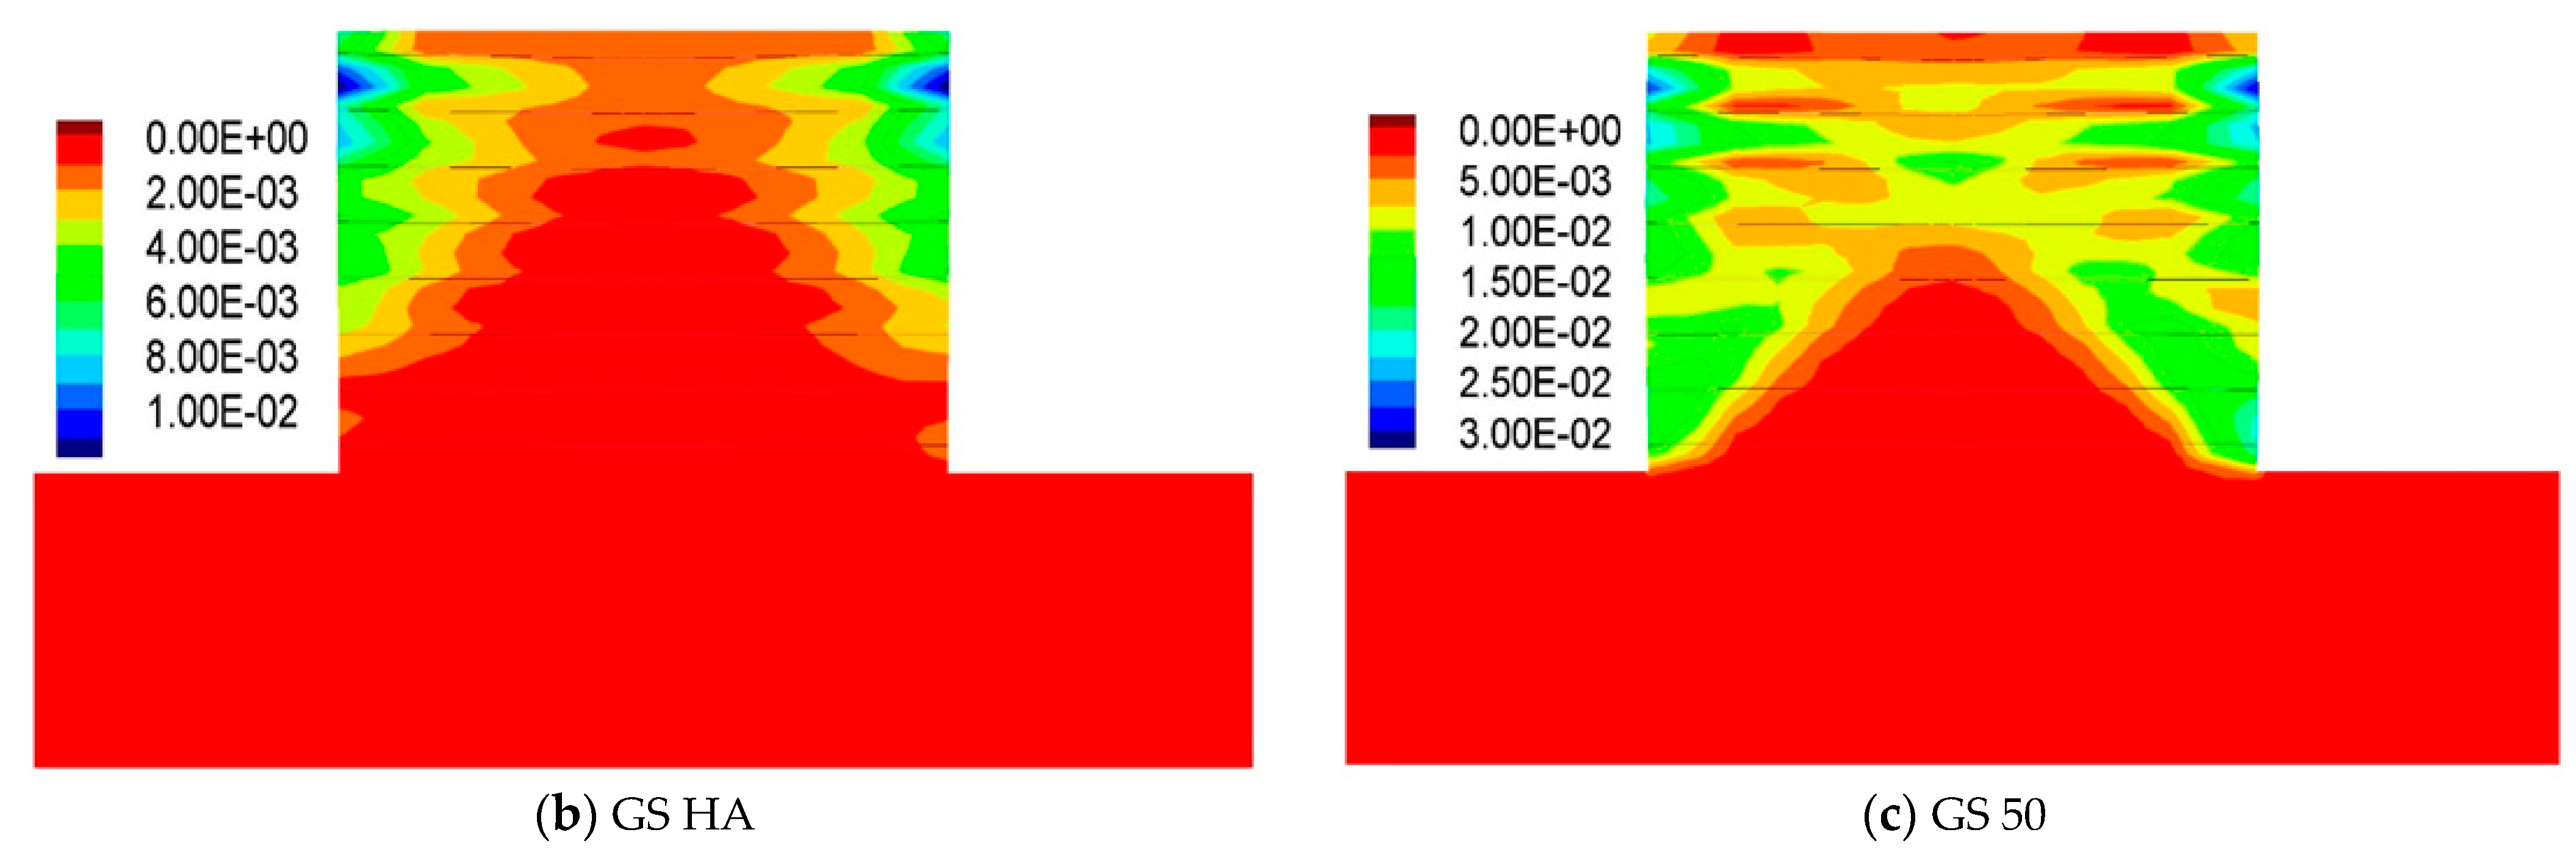
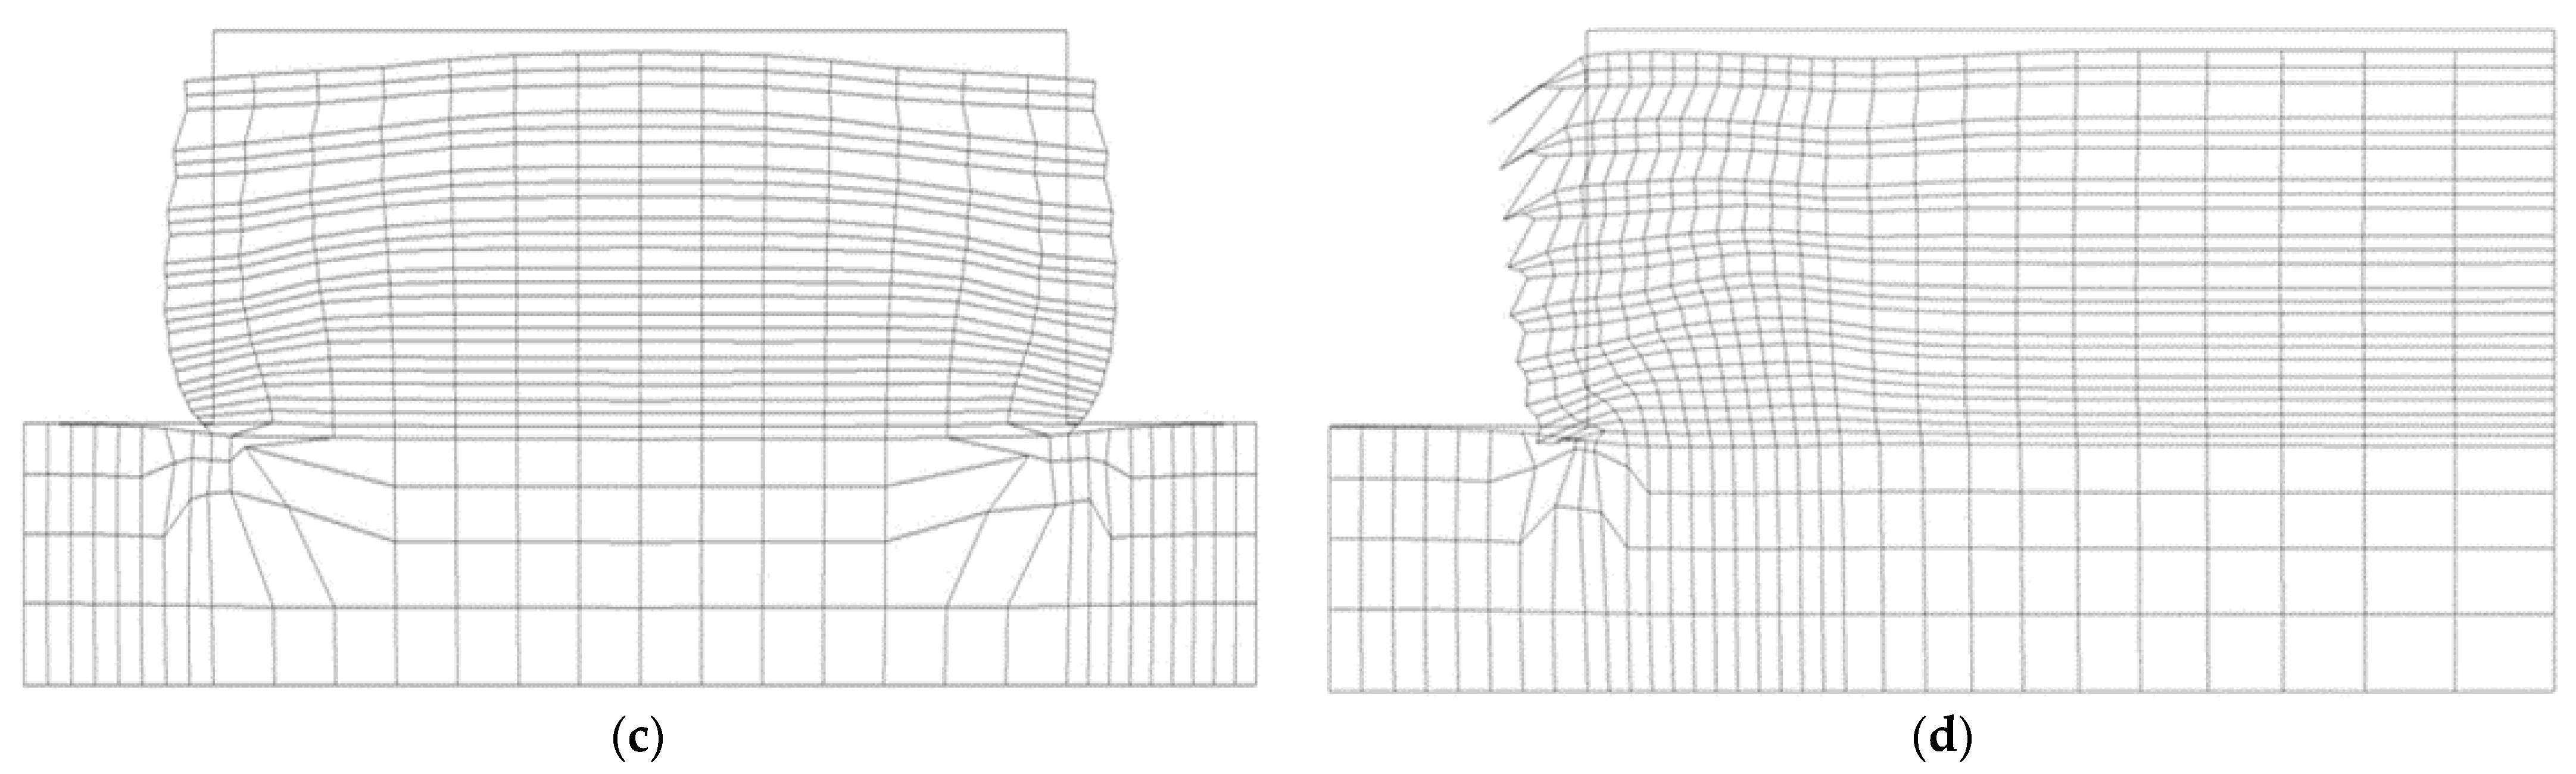
For the ratio of 1.33, the adherence default is only observed at the bottom reinforcement layer. For the other W/H ratios, the adherence default for the GS HA strips is observed at the bottom reinforcement layer and for the GS 50 strips at the bottom and middle reinforcement layers (Figure 11).
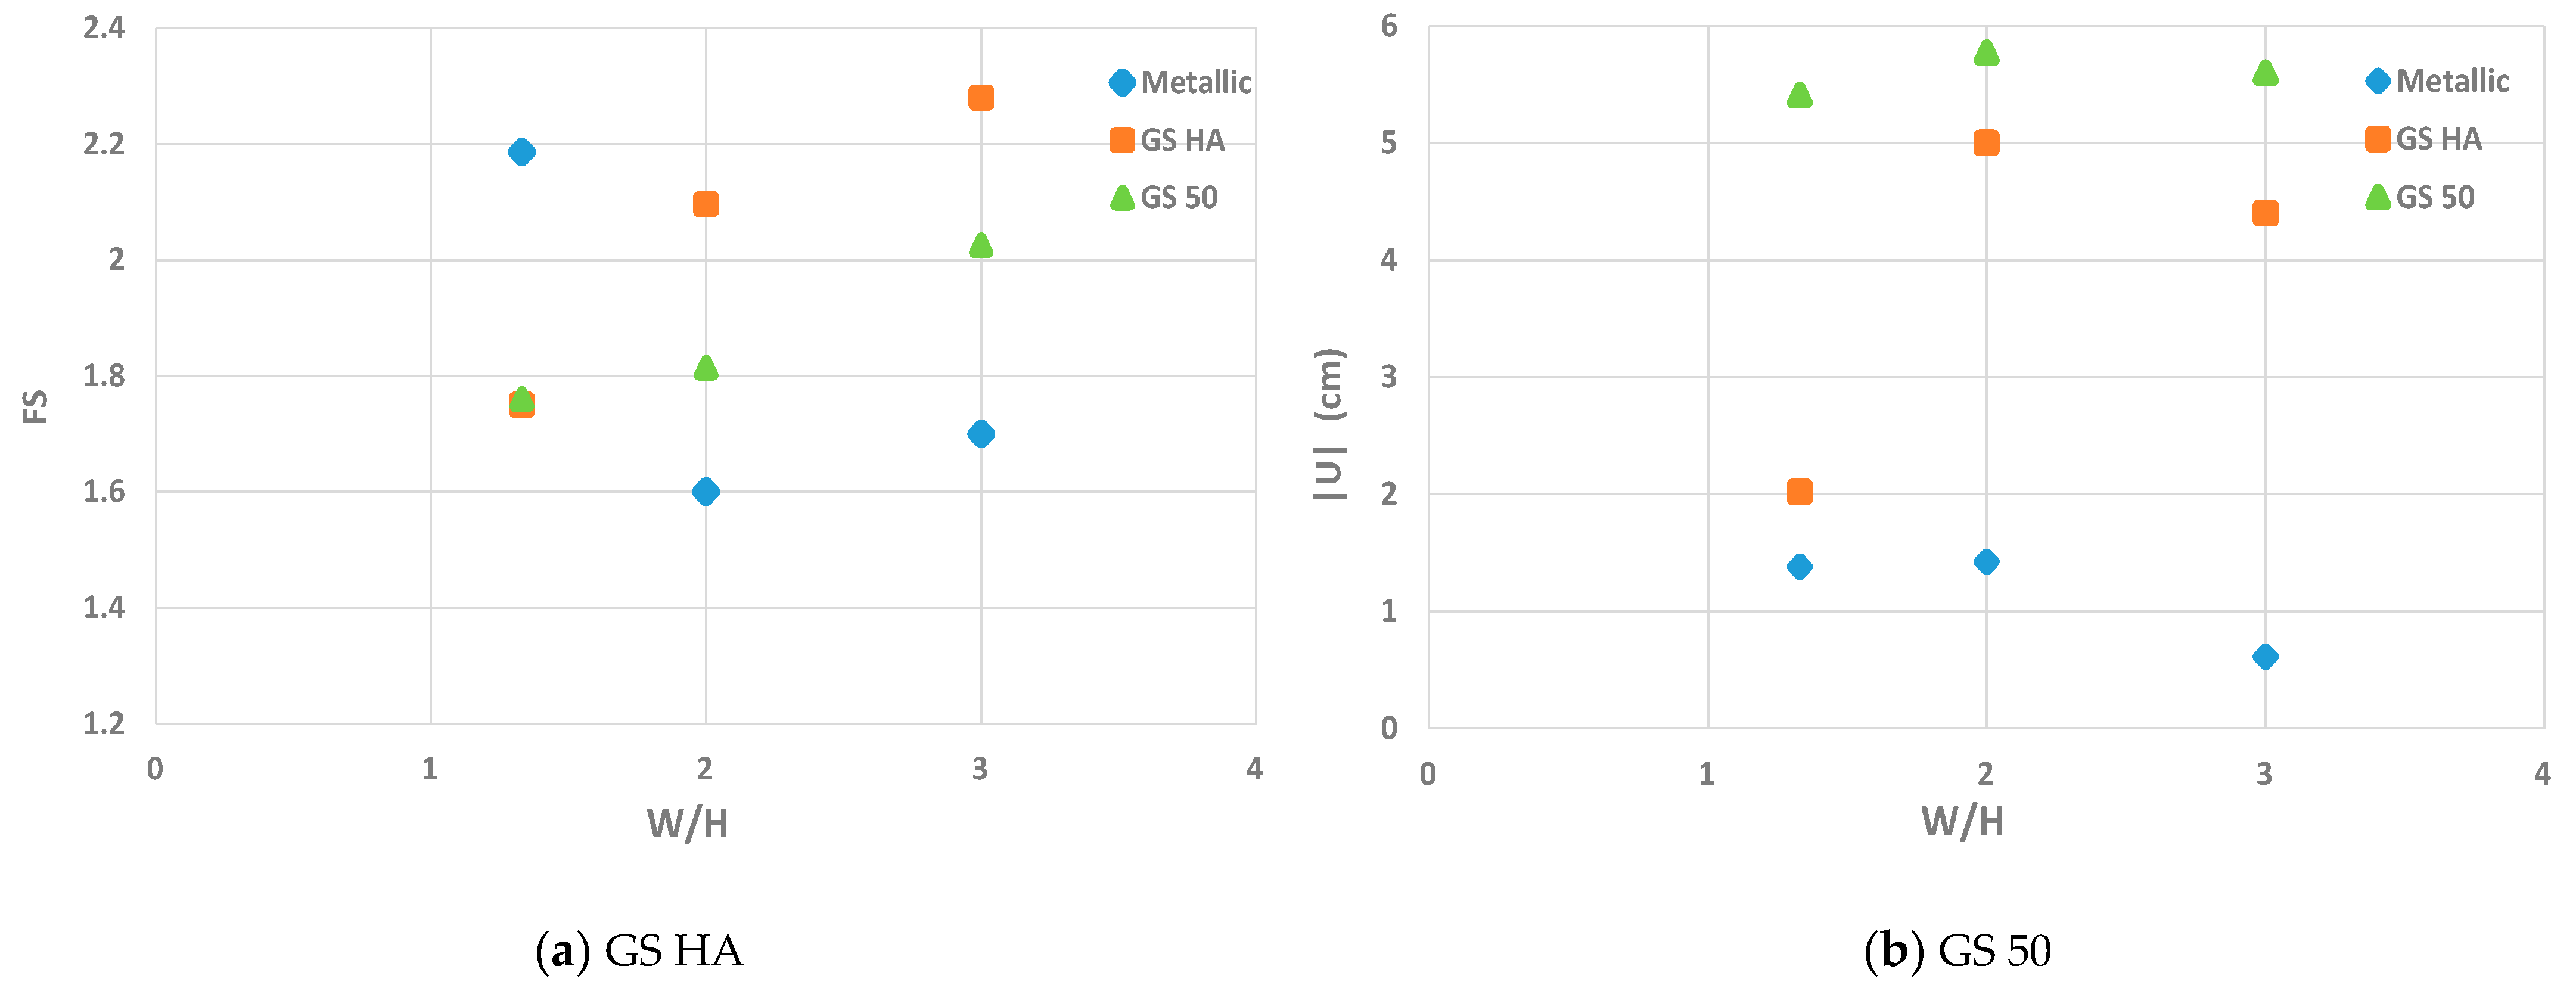
Figure 12 shows the comparison of the displacements and safety factors for different W/H ratios considering different types of synthetic strips (GS HA and GS 50). The results shown that displacement differences between the W/H ratios of 2 and 3 increase, respectively, of 31% and 25.7% and for the safety factors of 10.23% and 18.49%. The wall failures are similar. In contrast to a W/H ratio of 1.33, different wall failures are observed.
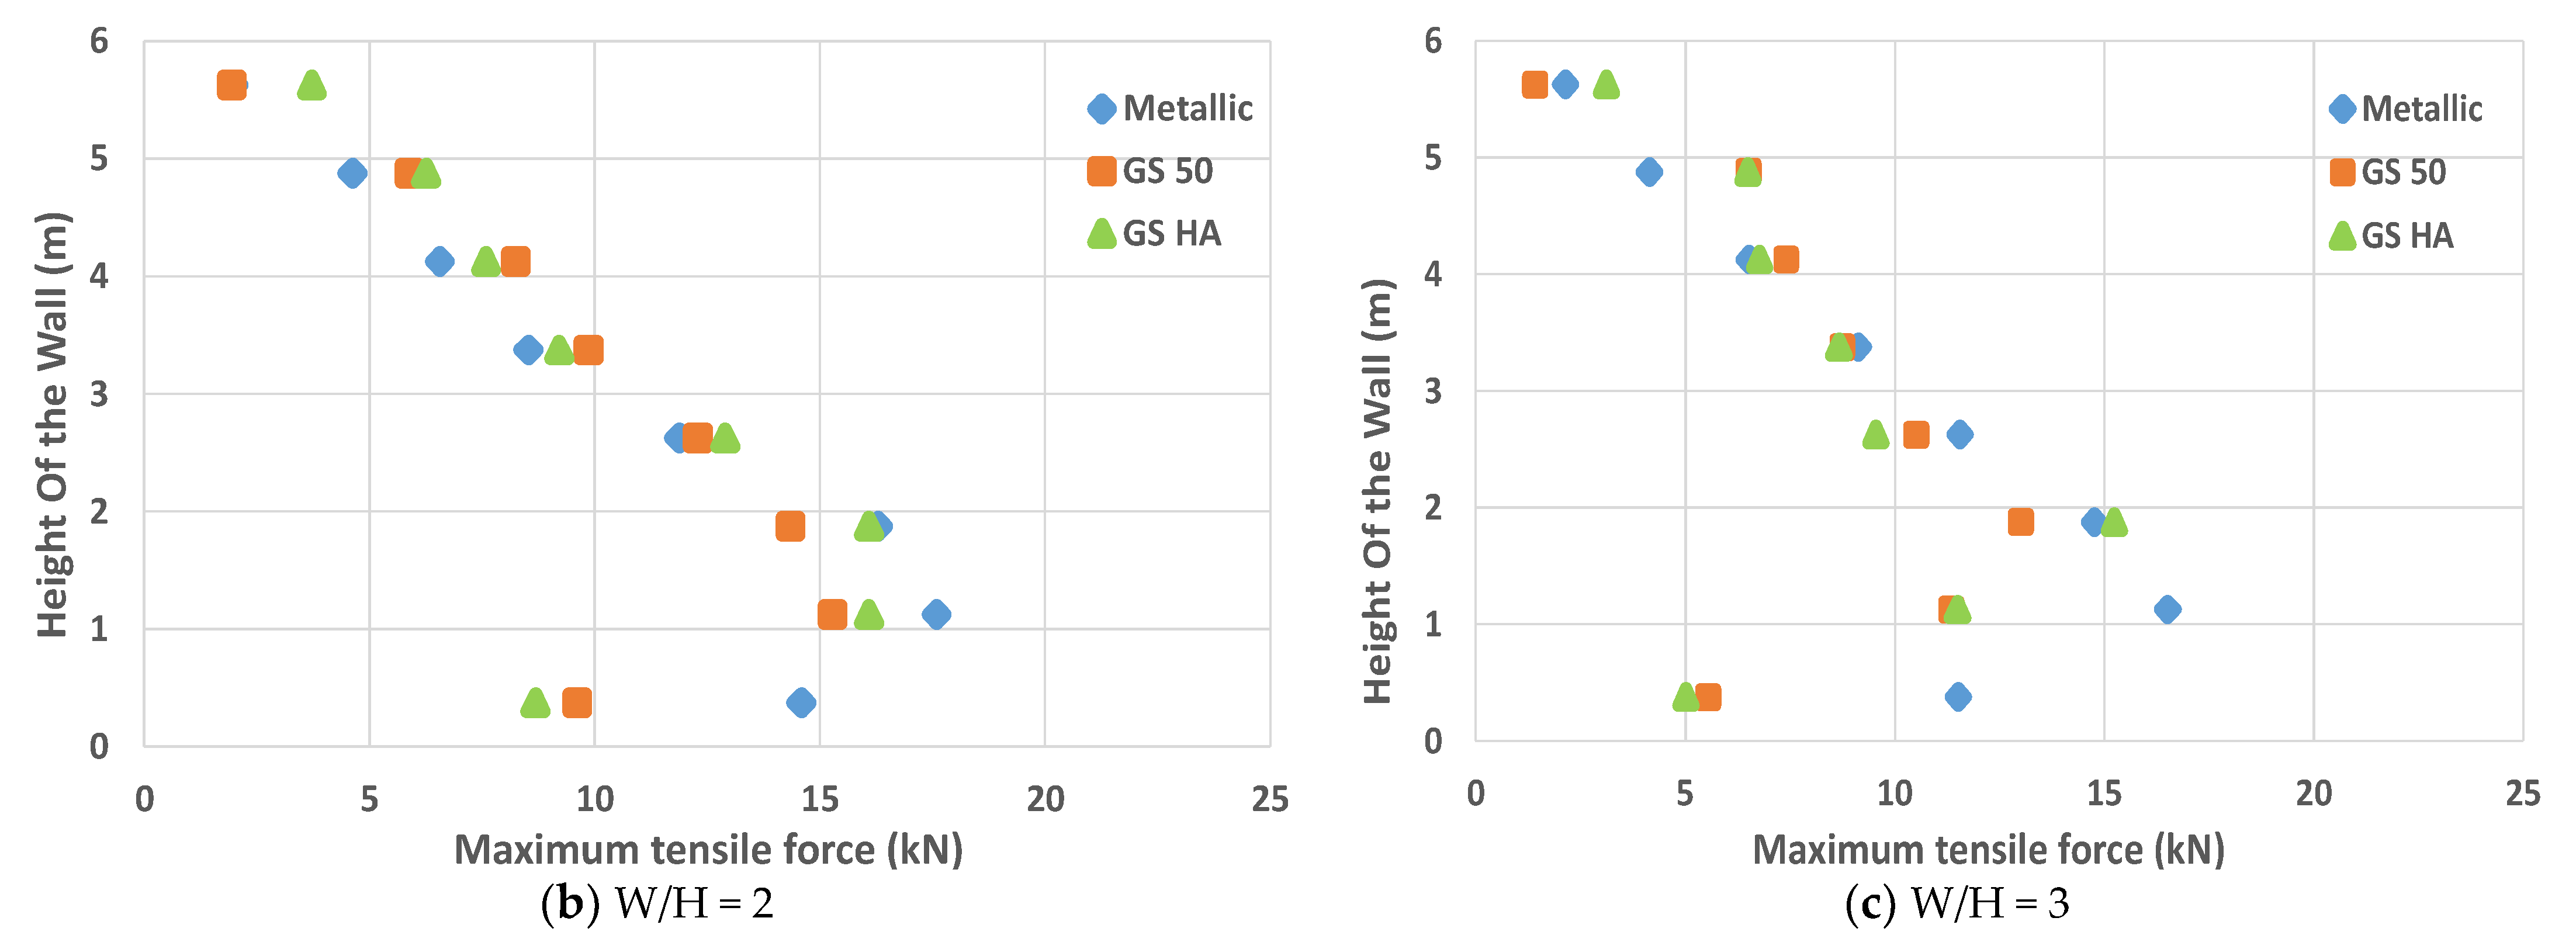
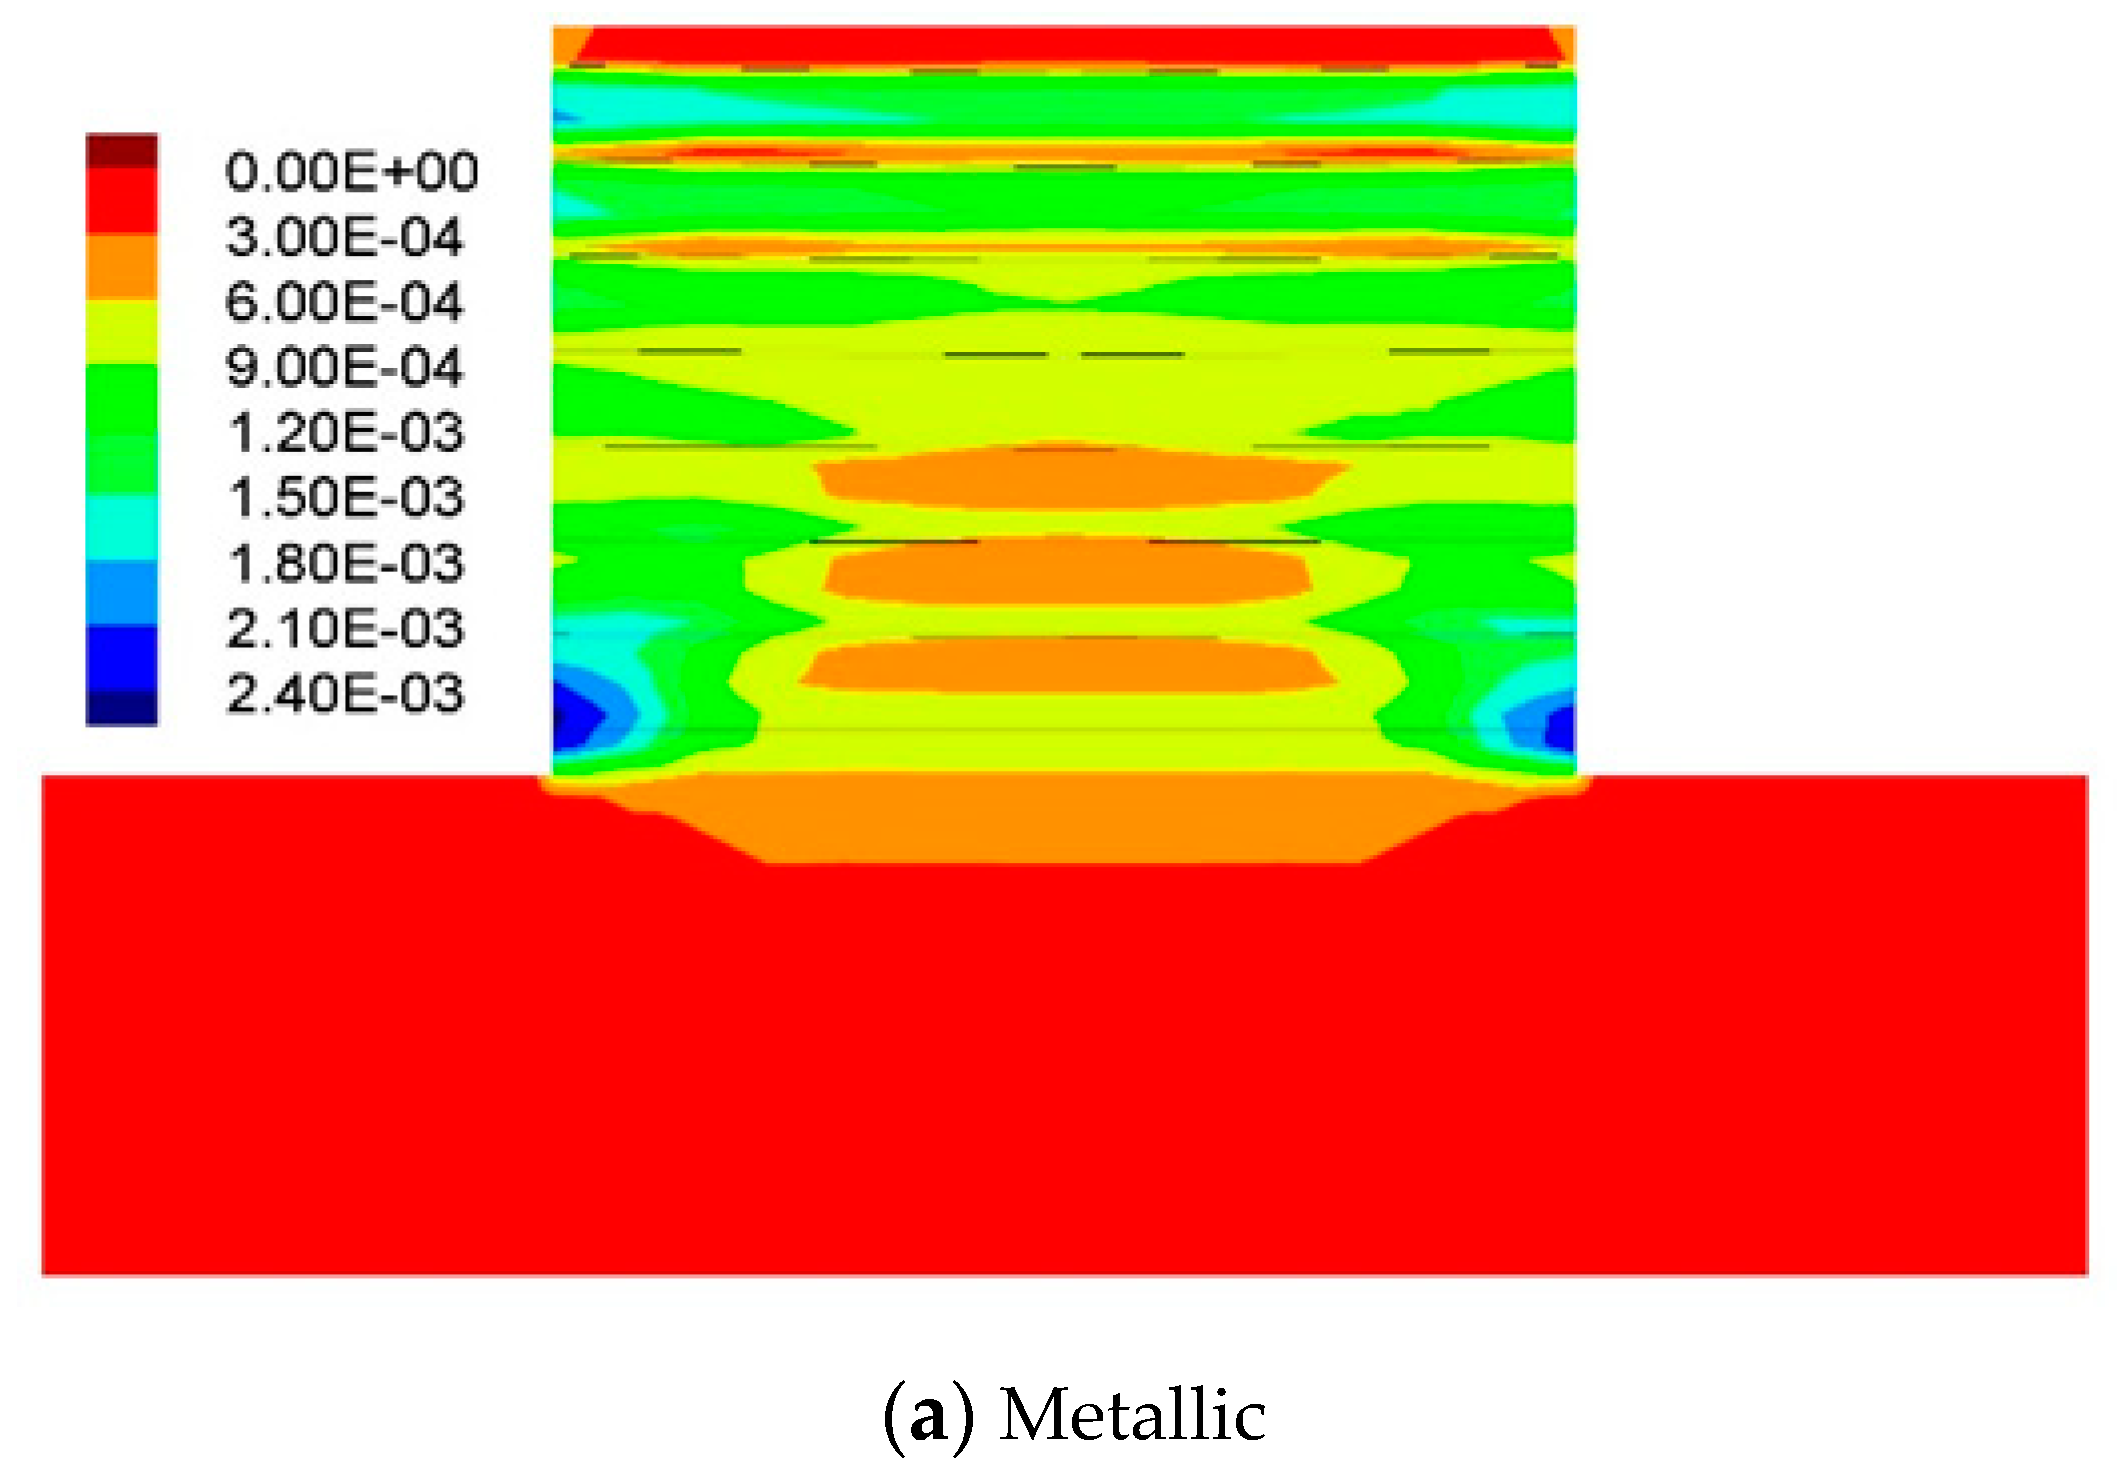
Figure 13 shows the shear strain field in the back-to-back walls for width to height ratios of 2 and 3. The zones of maximum shear strain are on the bottom (between the first and third strip level) and at the wall top (between the sixth and eighth strip level). In addition, for the W/H ratios of 2 and 3 for GS HA and GS 50 strips, the maximum shear strain zones are the same as those in the reference case.
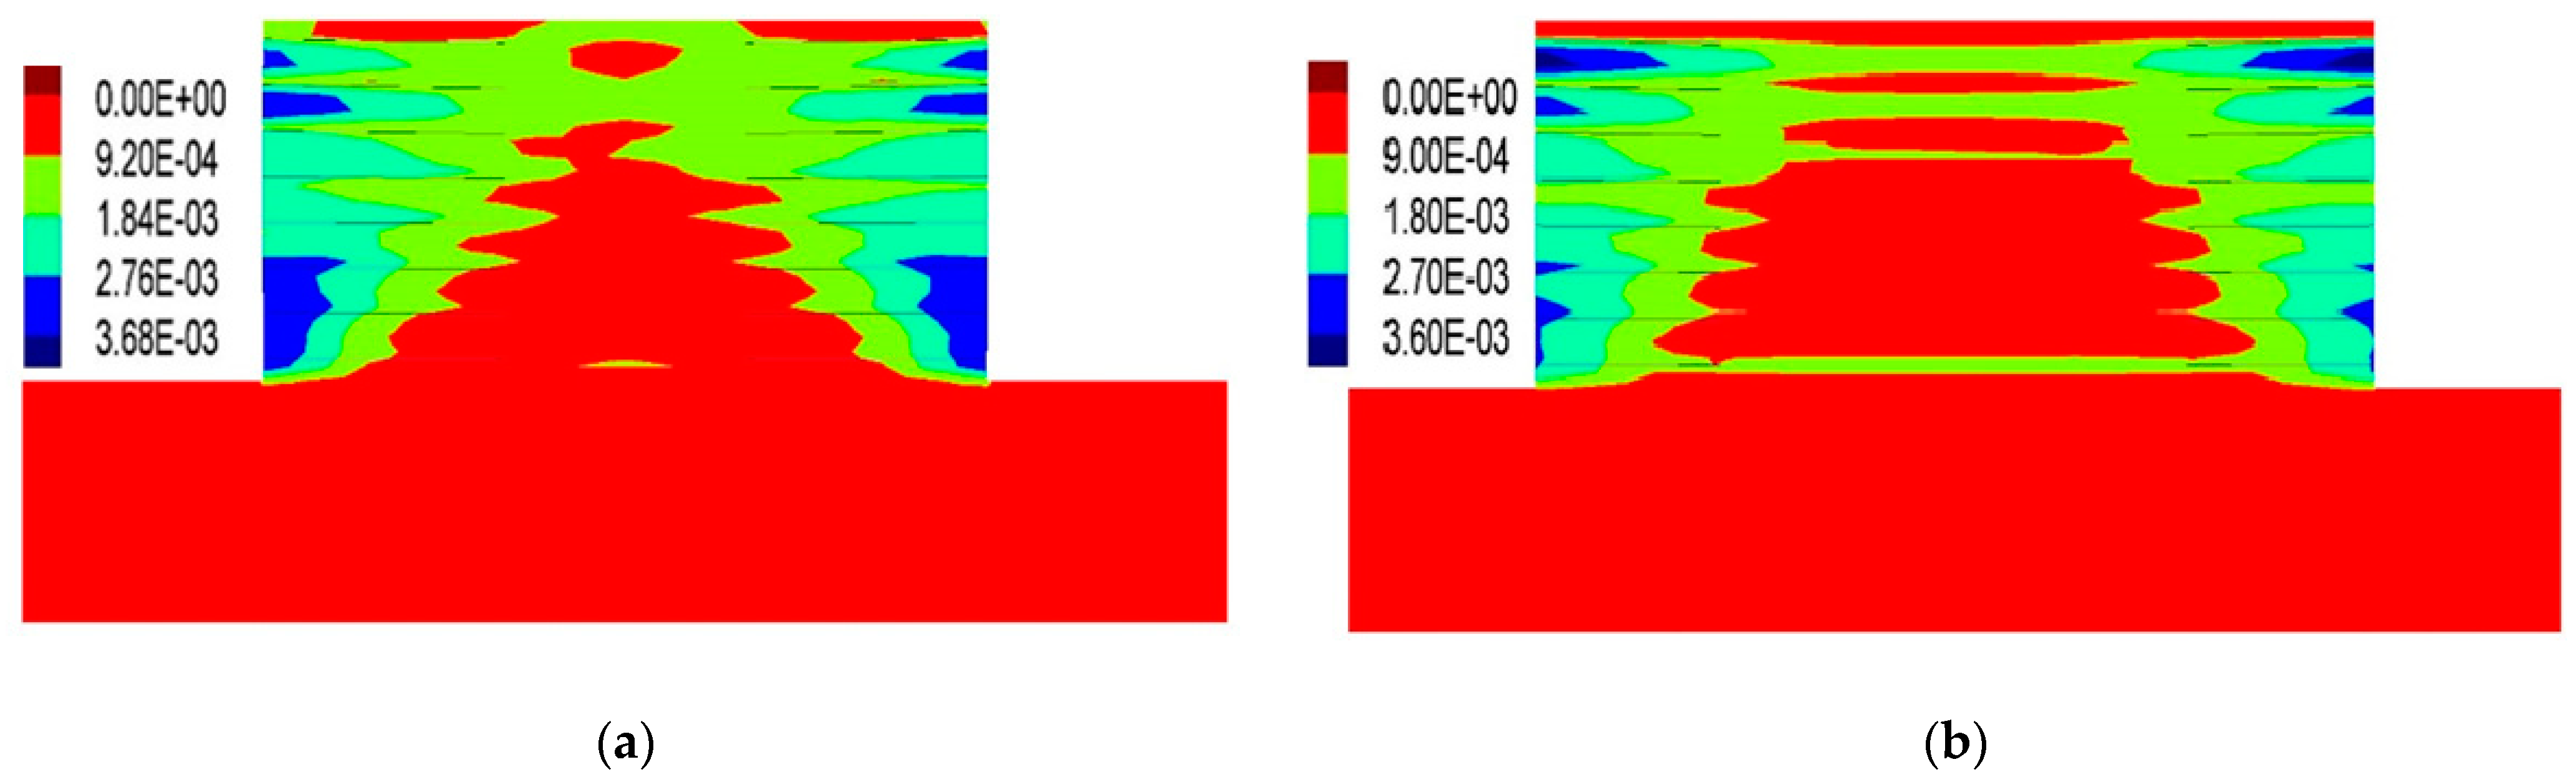
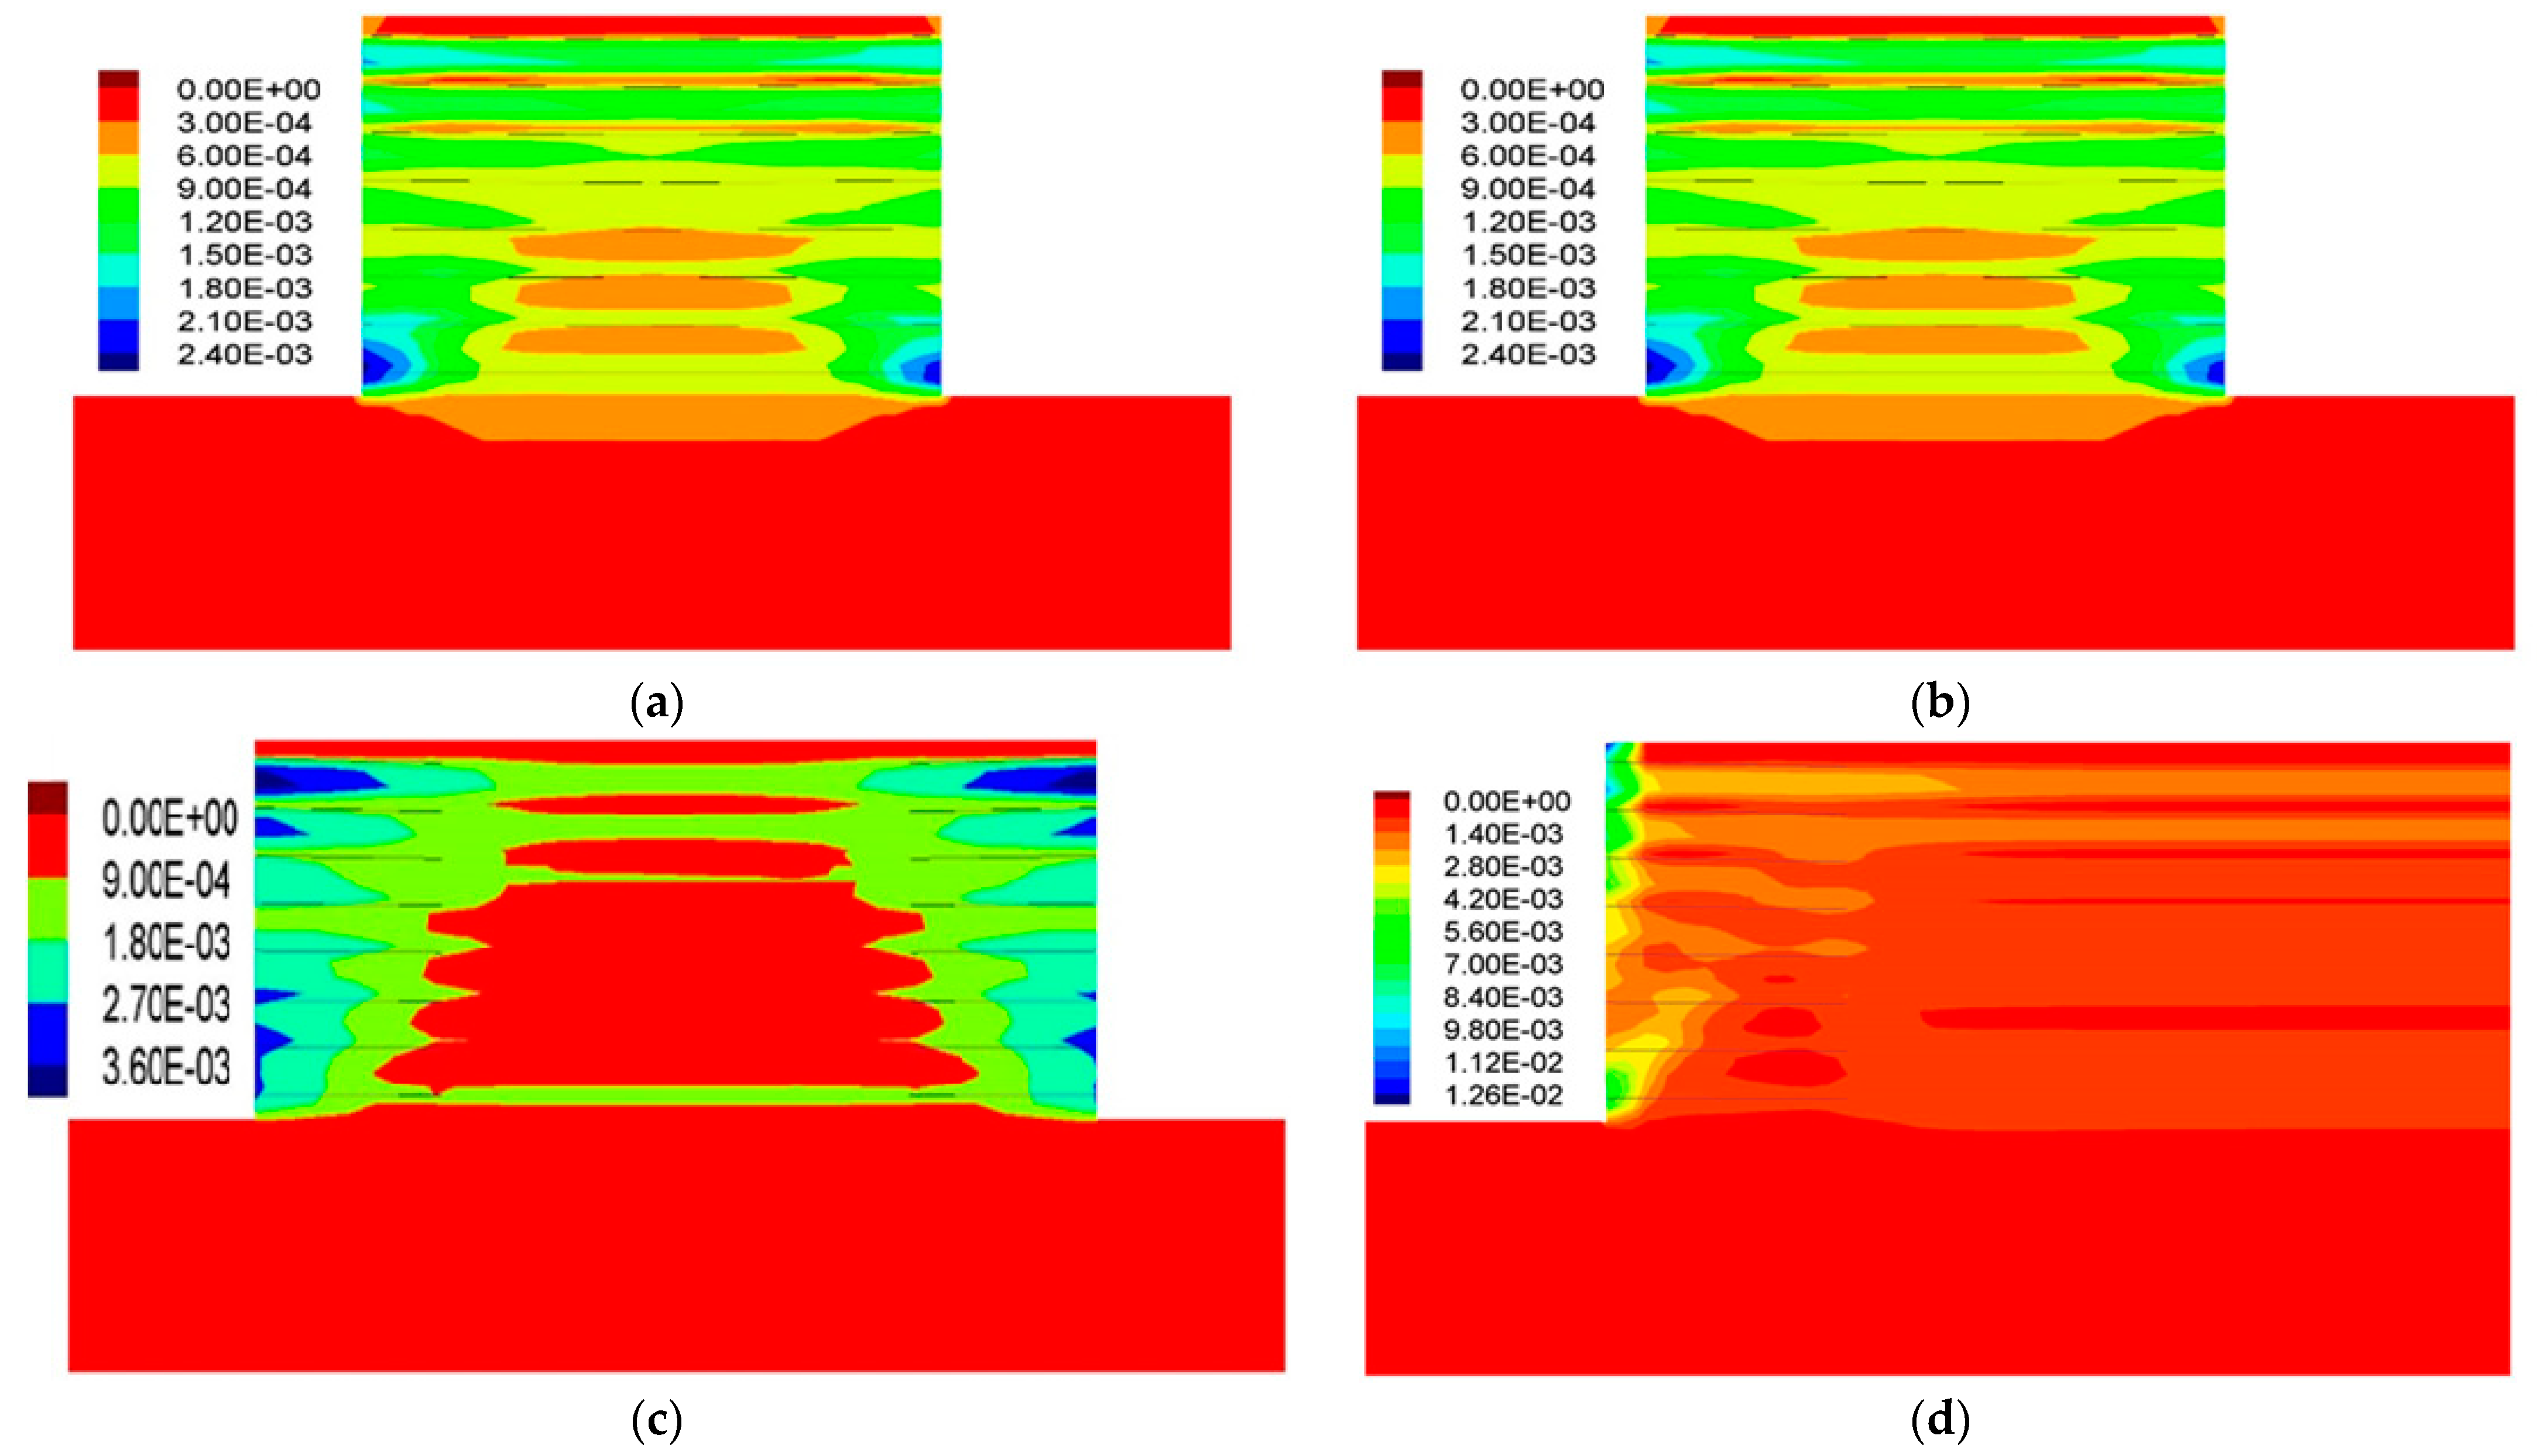
On the other hand, for the ratio of 1.33, we observed different results for different strips. For metallic strips, the locations of maximum shear strain are at the bottom (between the first and second strip level) and the top of the wall (between the seventh and eighth strip level). For the GS HA strips, the zones of maximum shear strain are on top of the wall (between the sixth and eighth strip level) and on the bottom (between the first and third strip level). The location of these zones is at the wall top (between the sixth and eighth strip level) for the GS 50 strips (Figure 14).
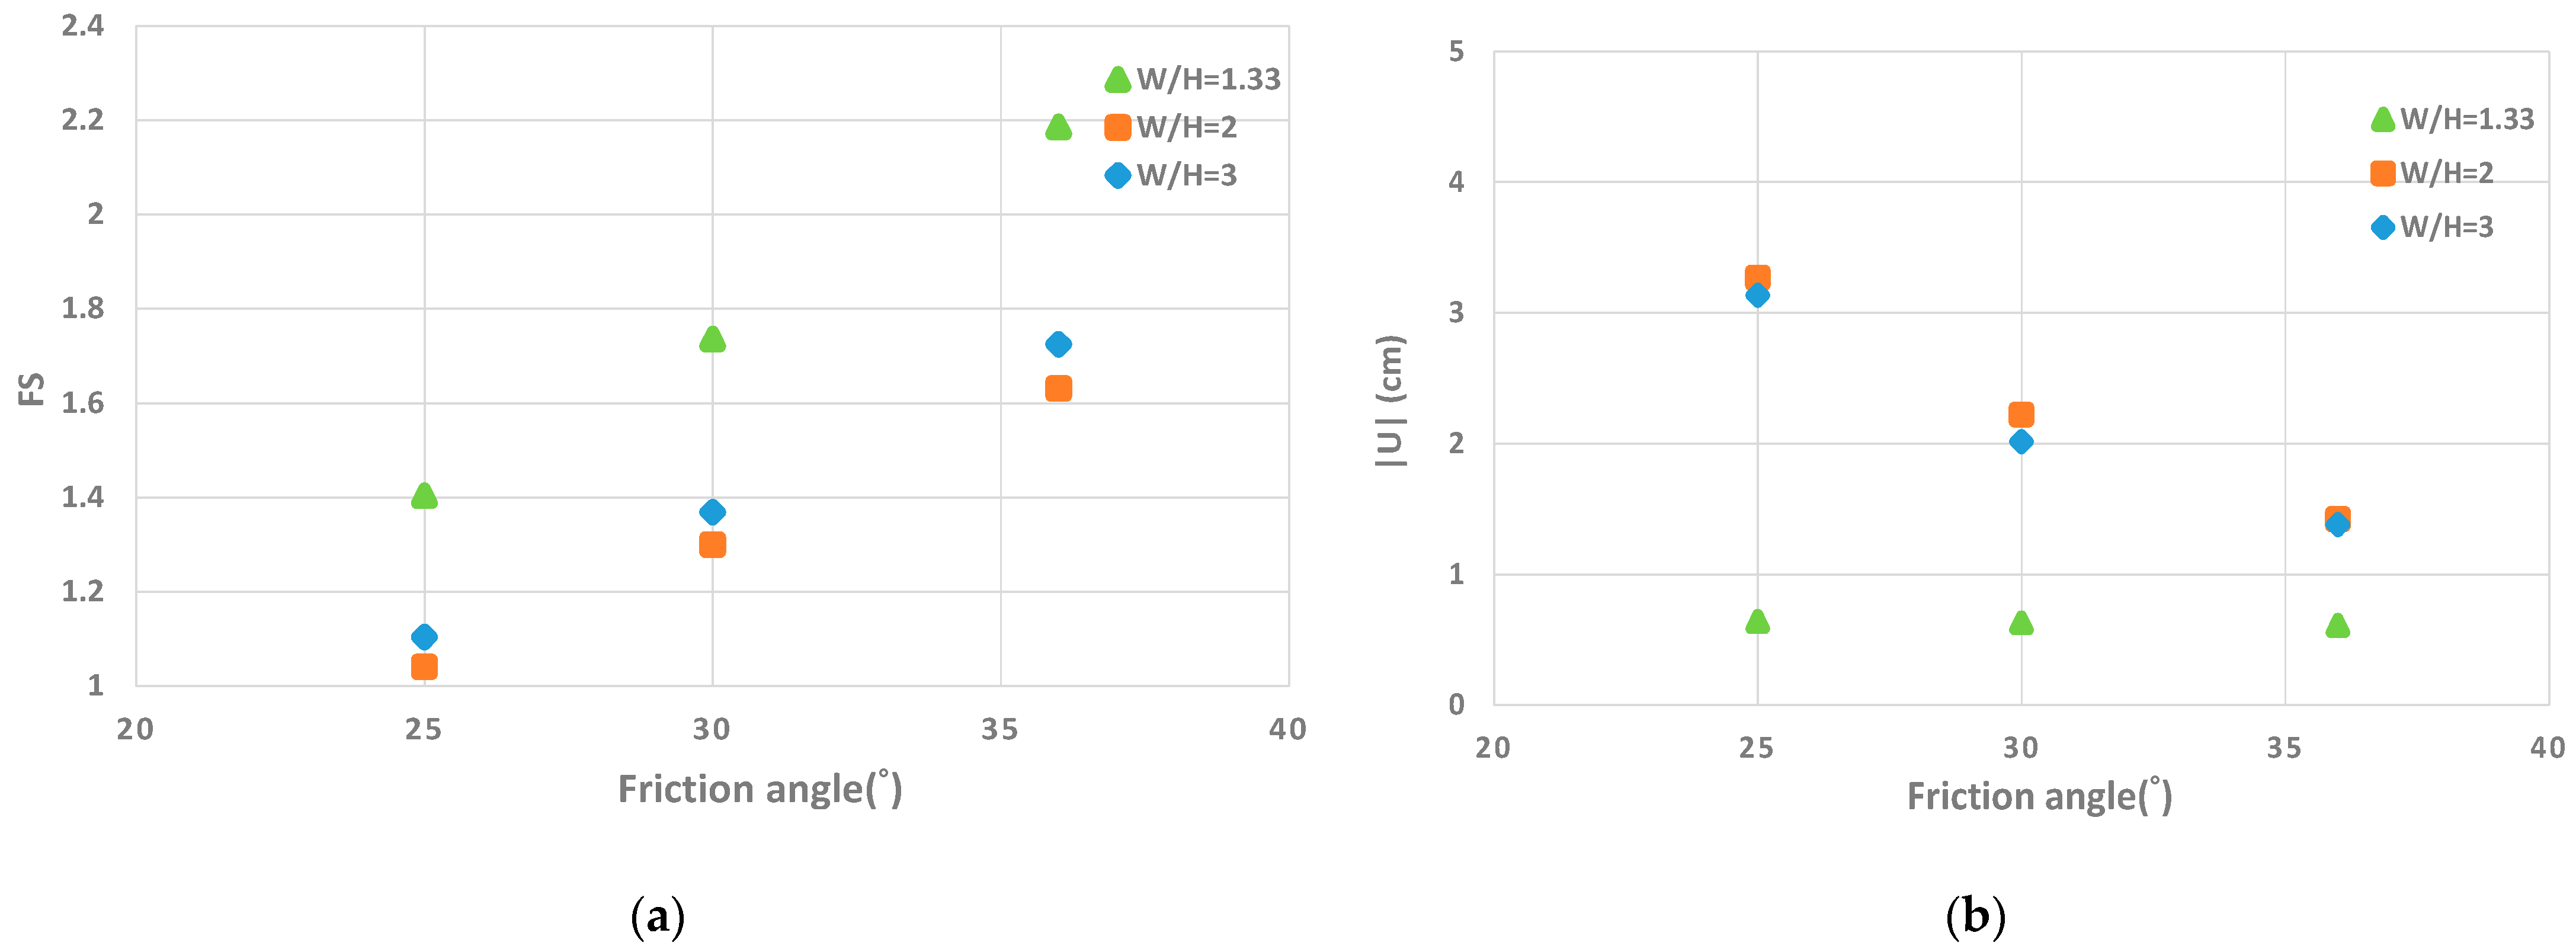
3.2.2. Influence of the Friction Angle (φ)
The findings indicate that the friction angle has a significant influence on the displacement amplitude and on the safety factor of MSE walls (Figure 15). The results show that decreases in the friction angle lead to a wall displacement increase and, on the other hand, lead to a safety factor reduction. The higher safety factor and the lower displacements were related to D = 0, while increases in the distance between strips (D) led to reductions in the safety factor and increases in the displacement (Table 6). The results for the W/H = 2 and W/H = 3 ratios are not significantly different.
3.2.3. Influence of the Strip Type
The influence of the strip type is studied using the metallic strip and two synthetic strips (GS HA–GS 50) presented in Table 4. Table 7 shows the synthetic strips GS 50 and GS HA, which are twice the frictional width of the metallic strips per connection point (100 mm versus 50 mm); as a result, they reveal a higher safety level in W/H = 2. A higher stability is the result of the use of the synthetic strips GS 50 and GS HA (+11.2% and +23.8% on Fs, respectively). The displacements observed for the reinforced wall by the synthetic strips GS 50 and GS HA are about four times higher than those observed in the case of metallic strips. In the horizontal and vertical directions, the observed displacements are high. The results obtained from W/H = 2 and W/H = 3 are not significantly different. On the other hand, the results for W/H = 1.33 are different. The use of the synthetic strips GS 50 and GS HA leads to a lower stability (−22.7% on Fs). The use of metallic strips in W/H = 1.33 leads to a higher stability in the wall.
3.3. Comparison of the Back-to-Back Wall with the Reference Case (Single-Sided Wall)
3.3.1. Metallic Strips
This section presents the comparison of the back-to-back reinforced walls (W/H = 1.33, 2, and 3) with the reinforced wall (W/H = infinity) considering metallic strips.
Soil/Strip Shear Displacement
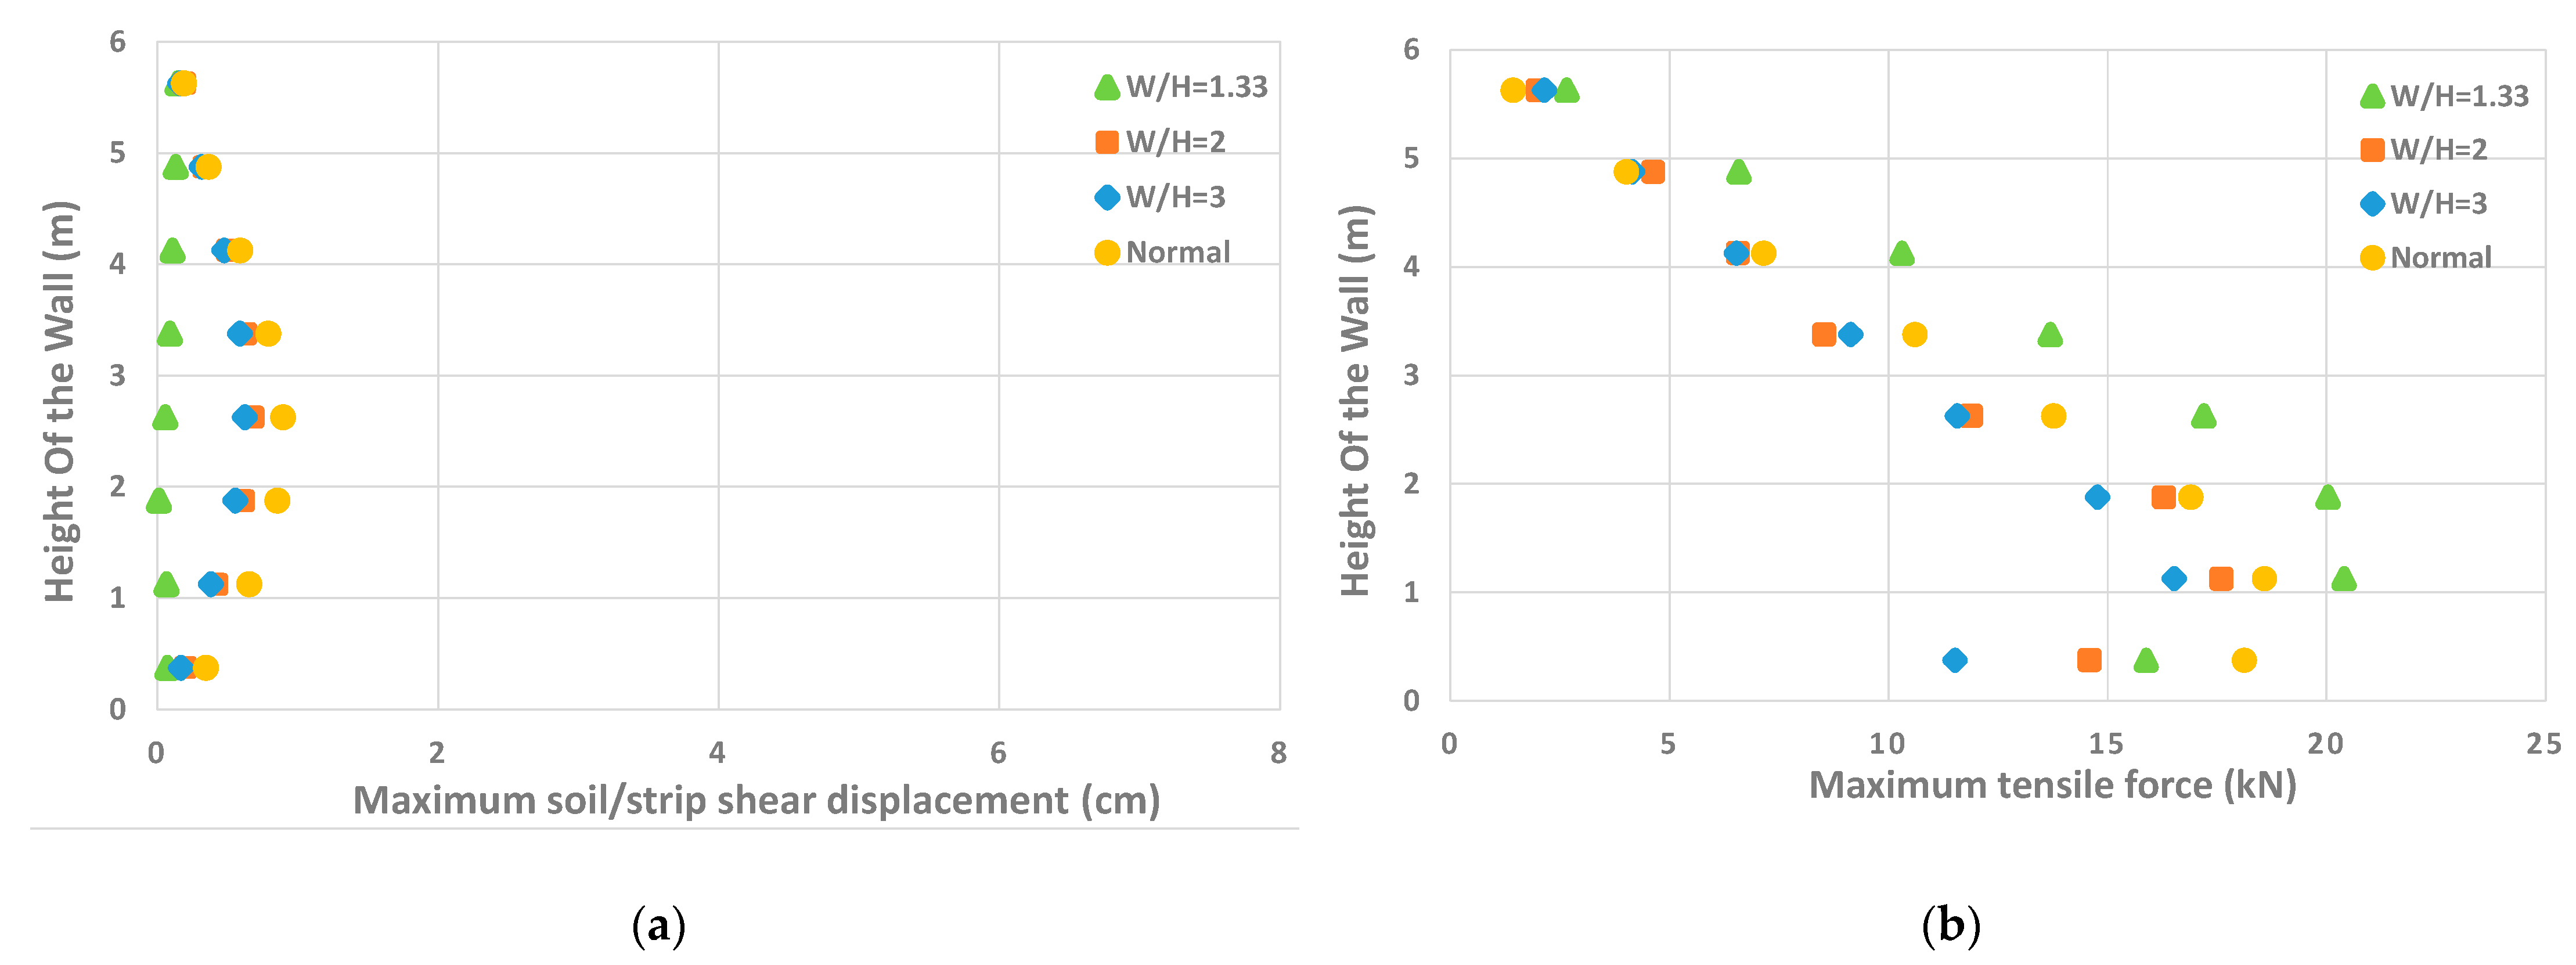
The trend of variation of the soil/strip shear displacements for different W/H walls is similar, and the only difference is in their values (Figure 16a). The maximum shear displacement is located at the middle of the wall. The soil/strip shear displacements of a single-sided wall and the back-to-back walls for W/H ≥ 2 are not different. For a D < (45° − φ/2), these values are reduced (Table 8).
Tensile Force
The analysis of the tensile strip forces shows that the maximum tensile forces are slightly different for all the considered walls. The tensile forces on the strips increased when W/H = 1.33 (D < (45° − φ/2)), while for W/H ≥ 2 the differences are small. The maximum tensile strips force increases slightly from W/H = infinity to W/H ≥ 2 and decreases slightly for W/H = 1.33 (Table 8 and Figure 16b).
Ultimate Limit State of Walls
The failure of the soil/strip adherence for some walls (W/H = infinity, 2, and 3) is located at the bottom and middle strips layers. While for the ratio of 1.33, this default of adherence is only observed at the bottom strips layer (Figure 17).
Figure 18 shows the shear strain fields. The maximum shear strain locations for walls with ratios W/H = infinity, 2, and 3 are at the bottom (between the first and third strip level) and at the wall top (between the sixth and eighth strip level). However, for the 1.33 ratio, the maximum shear strain is located at the bottom (between the first and second strip level) and top of the wall (between the seventh and eighth strip level).
3.3.2. Influence of the Strip Type
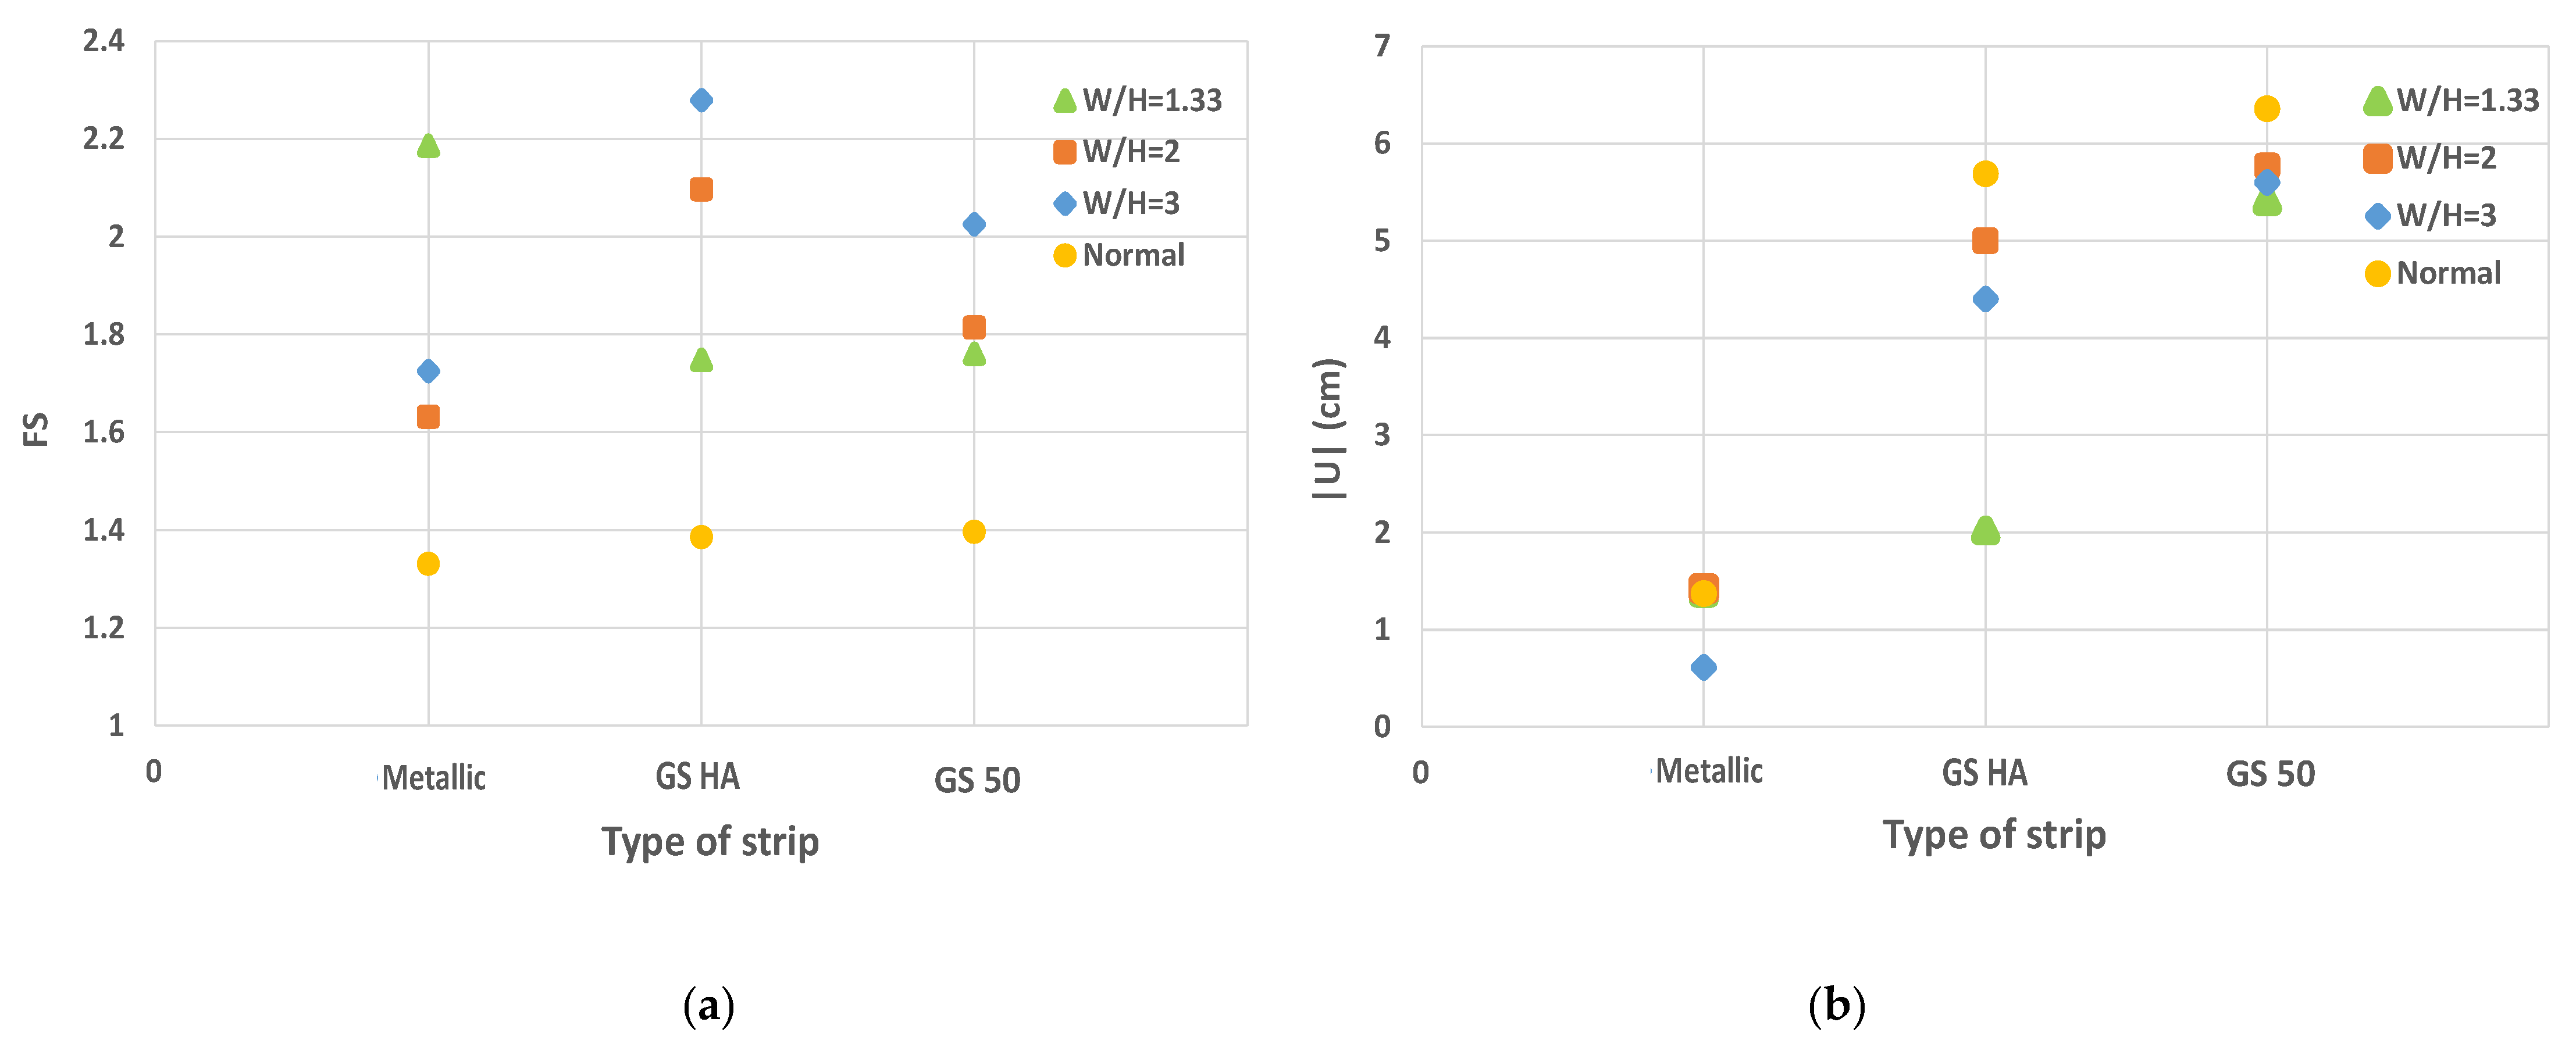
The comparison of the performance of different walls considering the three strip types is studied. The design of back-to-back reinforced walls leads to a higher safety factor and wall displacements are reduced (Figure 19).
The results show also that for back-to-back walls and when the walls’ distance increases (W/H ≥ 2), the stability increases, and the walls’ displacements decrease. While for metallic strips, the higher stability and the lower displacements are related to back-to-back walls with W/H = 1.33 when D < H tan (45° − φ/2) (Table 9).
According to the FHWA design guidelines (NHI-10-024, 2009) when D (the horizontal distance between the strips for back-to-back wall configurations) is greater than H tan (45° − φ/2) or, in other words, when W/H ≥ 2, the full active collapse pressure is mobilized. In this situation, the two walls can be considered to act independently, and each wall can be designed individually. However, the results obtained from the proposed calculations indicated that designing unified back-to-back walls with D > H tan (45° − φ/2) can perform better than a single-sided wall. For the metallic strip case, when D < H tan (45° − φ/2) (W/H = 1.33), the performance of the back-to-back wall is even more important with an increase in the safety factor of around 40%.
4. Conclusions
- The results show that the back-to-back walls with geosynthetic strips have more flexibility than those with the metallic ones. This flexibility leads to higher displacements and, consequently, to higher soil/strip interface shear displacements and horizontal displacements. This is due to the lower rigidity of the geosynthetic strips.
- In contrast, the study of the back-to-back walls considering different width to height ratios showed that as the width of the wall decreases and the strips become closer to each other (D = 0), the mobilization of the tensile forces at the wall center lead to a reduction in the geosynthetic strips’ performance. In addition, the comparison between different W/H walls ratio shows that when the walls become closer, the wall stability increases, and the walls’ displacements decrease. The best performance (higher stability and lower dispacement) is related to walls with a W/H = 1.33 considering metallic strips.
- The results of back-to-back reinforced soil walls considering different ratios of width to height indicate that this ratio is directly connected to the tensile forces, and it is inversely related to soil/strip interface shear displacements. In other words, as the width of the wall becomes greater and the distance of the reinforcement strip increases, the tensile force on the reinforcement strips decreases. On the other hand, by increasing the width of the wall, the soil/strip interface shear displacements increase for both the metallic and synthetic strips. The failure is also highly impacted by the width to height ratio and the type of reinforcement strip.
- The results show that the soil friction angle has a significant effect on the behavior of the back-to-back walls. As this friction angle decreases, the stability of the wall decreases, and the soil/strip shear displacements and the tensile forces on the reinforcement increase.
- For back-to-back walls considering D > (45° − φ/2), each of the walls can be designed separately because the results are close but not equal.
Author Contributions
Conceptualization, S.H.L., K.M. and D.D.; methodology, S.H.L. and K.M.; software, K.M.; validation, K.M. and S.H.L.; formal analysis, K.M. and S.H.L.; investigation, K.M. and S.H.L.; data curation, D.D.; writing—original draft preparation, K.M. and S.H.L.; writing—review and editing, D.D.; visualization, S.H.L. and K.M.; supervision, D.D.; All authors have read and agreed to the published version of the manuscript.
Funding
This research received no external funding.
Institutional Review Board Statement
Not applicable.
Informed Consent Statement
Not applicable.
Data Availability Statement
Some or all data, models, or code that support the findings of this study are available from the corresponding author.
Conflicts of Interest
The authors declare no conflict of interest.
References
- Jones, C.J. Earth Reinforcement and Soil Structures; Butterworth and Co. Ltd.: Oxford, UK, 1985. [Google Scholar]
- Iran Guideline for Design of Retaining Walls. 2005. Available online: www.sama.mporg.ir (accessed on 13 January 2021).
- Elias, V.; Christopher, B.R. Mechanically Stabilized Earth Walls and Reinforced Soil Slopes Design and Construction Guidelines; Federal Highway Administration: Washington, DC, USA, 1997.
- Leshchinsky, D.; Han, J. Geosynthetic reinforced multitiered walls. J. Geotech. Geoenvironmental Eng. 2004, 130, 1225–1235. [Google Scholar] [CrossRef]
- Han, J.; Leshchinsky, D. Stability analyses of geosynthetic reinforced earth structures using limit equilibrium and numerical methods. In Proceedings of the 8th international geosynthetics conference, Yokohama, Japan, 18–22 September 2006; pp. 1347–1350. [Google Scholar]
- Han, J.; Leshchinsky, D. Stability analysis of back-to-back MSE walls. In Proceedings of the 5th International Symposium on Earth Reinforcement, Fukuoka, Japan, 13–17 November 2007; pp. 487–490. [Google Scholar]
- Han, J.; Leshchinsky, D. Analysis of back-to-back mechanically stabilized earth walls. Geotext. Geomembr. 2010, 28, 262–267. [Google Scholar] [CrossRef]
- El-Sherbiny, R.; Ibrahim, E.; Salem, A. Stability of Back-to-Back Mechanically Stabilized Earth Walls. In Geo-Congress 2013; American Society of Civil Engineers: San Diego, CA, USA, 2013; pp. 555–565. [Google Scholar]
- Djabri, M.; Benmebarek, S. FEM Analysis of Back-to-Back Geosynthetic-Reinforced Soil Retaining Walls. Int. J. Geosynth. Ground Eng. 2016, 2, 26. [Google Scholar] [CrossRef] [Green Version]
- Sasanka, M.S.; Umashankar, B.; Madhira, R.M. Reinforcement Tensile Forces in Back-to-Back Retaining Walls. Geotech. Appl. 2019, 173–181. [Google Scholar]
- Won, M.S.; Kim, Y.S. Internal deformation behavior of geosynthetic-reinforced soil walls. Geotext. Geomembr. 2007, 25, 10–22. [Google Scholar] [CrossRef]
- Leshchinsky, D.; Ling, H.I.; Wang, J.P.; Rosen, A.; Mohri, Y. Equivalent seismic coefficient in geocell retention systems. Geotext. Geomembr. 2009, 27, 9–18. [Google Scholar] [CrossRef]
- Abdelouhab, A.; Dias, D.; Freitag, N. Physical and analytical modelling of geosynthetic strip pullout behaviour. Geotext. Geomembr. 2009, 28, 44–53. [Google Scholar] [CrossRef]
- Abdelouhab, A.; Dias, D.; Freitag, N. Numerical analysis of the behaviour of mechanically stabilized earth walls reinforced with different types of strips. Geotext. Geomembr. 2010, 29, 116–129. [Google Scholar] [CrossRef]
- Ho, S.K.; Rowe, R.K. Prediction behavior of two centrifugal model soil walls. Geotech. Eng. 1994, 120, 1845–1873. [Google Scholar] [CrossRef]
- Hatami, K.; Bathurst, R.J. Parametric analysis of reinforced soil walls with different backfill material properties. In Proceedings of the NAGS’ Conference, Las Vegas, NV, USA, 1–3 December 2006; pp. 1–15. [Google Scholar]
- Skinner, G.D.; Rowe, R.K. Design and behaviour of a geosynthetic reinforced retaining wall and bridge abutment on a yielding foundation. Geotext. Geomembr. 2005, 23, 235–260. [Google Scholar] [CrossRef]
- Al Hattamleh, O.; Muhunthan, B. Numerical procedures for deformation calculations in the reinforced soil walls. Geotext. Geomembr. 2006, 24, 52–57. [Google Scholar] [CrossRef]
- Bergado, D.T.; Teerawattanasuk, C. 2D and 3D numerical simulations of reinforced embankments on soft ground. Geotext. Geomembr. 2008, 26, 39–55. [Google Scholar] [CrossRef]
- Huang, B.; Bathurst, R.J.; Hatami, K. Numerical study of reinforced soil segmental walls using three different constitutive soil models. Geotech. Geoenvironmental Eng. 2009, 135, 1486–1498. [Google Scholar] [CrossRef]
- Hoe, I.L.; Huabei, L. Deformation analysis of reinforced soil retaining walls—Simplistic versus sophisticated finite element analyses. Acta Geotech. 2009, 4, 203–213. [Google Scholar]
- Schanz, T.; Vermeer, P.A.; Bonnie, P.G.R. The Hardening Soil Model: Formulation and Verification. Beyond 2000. In Computational Geotechnics–10 Years of Plaxis; Brinkgreve, R.B.J., Ed.; Balkema: Rotterdam, The Netherlands, 1999. [Google Scholar]
- FLAC2D. User’s Guide; Itasca Consulting Group: Minneapolis, MN, USA, 2017. [Google Scholar]
- Yu, Y.; Bathurst, R.J.; Miyata, Y. Numerical analysis of a mechanically stabilized earth wall reinforced with steel strips. Soils Found. 2015, 55, 536–547. [Google Scholar] [CrossRef]
- Cambou, B.; Jafari, K. A constitutive model for granular materials based on two plasticity mechanisms. In Constitutive Equations for Granular Non-Cohesive Soils; Saada, A.S., Ed.; Balkema: Rotterdam, The Netherlands, 1987; pp. 149–167. [Google Scholar]
- Federal Highway Administration. Design of Mechanically Stabilized Earth Walls and Reinforced Soil Slopes and Reinforced Soil Slope; Federal Highway Administration: Washington, DC, USA, 2009; Volume 1.
Figure 1.
Schematic view of a back-to-back reinforced wall.

Figure 2.
Three-dimensional view of a back-to-back reinforced wall.

Figure 3.
Back-to-back reinforced wall (dimensions in m): (a) geometry of a panel, (b) 3D simplified geometryl (c) 2D geometry.
Figure 3.
Back-to-back reinforced wall (dimensions in m): (a) geometry of a panel, (b) 3D simplified geometryl (c) 2D geometry.

Figure 4.
Apparent friction coefficient with the wall height.

Figure 5.
Reference numerical model.

Figure 6.
Comparison of the results with the reference model of Abdelouhab et al. (2010): (a) soil/strip shear displacement; (b) tensile force.
Figure 6.
Comparison of the results with the reference model of Abdelouhab et al. (2010): (a) soil/strip shear displacement; (b) tensile force.

Figure 7.
Geometry of the back-to-back reinforced walls considering different ratios of width (W) to height (H): (a) W/H = 1.33 and D = 0; (b) W/H = 2 and D = 4 m; (c) W/H = 3 and D = 10 m.
Figure 7.
Geometry of the back-to-back reinforced walls considering different ratios of width (W) to height (H): (a) W/H = 1.33 and D = 0; (b) W/H = 2 and D = 4 m; (c) W/H = 3 and D = 10 m.

Figure 8.
Soil/strip shear displacement for three strip types and different W/H ratios: (a) W/H = 1.33; (b) W/H = 2; (c) W/H = 3.
Figure 8.
Soil/strip shear displacement for three strip types and different W/H ratios: (a) W/H = 1.33; (b) W/H = 2; (c) W/H = 3.


Figure 9.
Tensile force variations on the three strip types and different W/H ratios.


Figure 10.
Failure of the back-to-back reinforced wall (metallic strips).

Figure 11.
Failure of the back-to-back reinforced wall for a W/H ratio of 1.33 with different types of strips.
Figure 11.
Failure of the back-to-back reinforced wall for a W/H ratio of 1.33 with different types of strips.

Figure 12.
Influence of the W/H ratio on the back-to-back reinforced wall behavior with different types of strips: (a) influence on the safety factor; (b) influence on the displacement amplitude.
Figure 12.
Influence of the W/H ratio on the back-to-back reinforced wall behavior with different types of strips: (a) influence on the safety factor; (b) influence on the displacement amplitude.

Figure 13.
Maximum shear strains for back-to-back reinforced wall (metallic strips): (a) W/H = 2; (b) W/H = 3.
Figure 13.
Maximum shear strains for back-to-back reinforced wall (metallic strips): (a) W/H = 2; (b) W/H = 3.

Figure 14.
Maximum shear strain of a W/H ratio of 1.33 with different types of strips.


Figure 15.
Influence of the soil friction angle on the wall behavior considering metallic strips: (a) influence on the safety factor; (b) influence on the displacements.
Figure 15.
Influence of the soil friction angle on the wall behavior considering metallic strips: (a) influence on the safety factor; (b) influence on the displacements.

Figure 16.
Comparison soil/strip shear displacement and tensile force for different modes of walls for metallic strips (reference case): (a) soil/strip shear displacement; (b) tensile force.
Figure 16.
Comparison soil/strip shear displacement and tensile force for different modes of walls for metallic strips (reference case): (a) soil/strip shear displacement; (b) tensile force.

Figure 17.
Failure of the wall for different modes of walls for metallic strips (reference case): (a) W/H = 1.33; (b) W/H = 2; (c) W/H = 3; (d) W/H = infinity.
Figure 17.
Failure of the wall for different modes of walls for metallic strips (reference case): (a) W/H = 1.33; (b) W/H = 2; (c) W/H = 3; (d) W/H = infinity.


Figure 18.
Maximum shear strain for different modes of walls for metallic strips (reference case): (a) W/H = 1.33; (b) W/H = 2; (c) W/H = 3; (d) W/H = infinity.
Figure 18.
Maximum shear strain for different modes of walls for metallic strips (reference case): (a) W/H = 1.33; (b) W/H = 2; (c) W/H = 3; (d) W/H = infinity.

Figure 19.
Comparison of the behavior of different modes of walls with different types of strips: (a) influence on the safety factor; (b) influence on the displacement amplitude.
Figure 19.
Comparison of the behavior of different modes of walls with different types of strips: (a) influence on the safety factor; (b) influence on the displacement amplitude.


Table 1.
Reinforced backfill PH input parameters.
| Parameter | Value |
|---|---|
| Volumic weight (kg/m3) | 1580 |
| E50 ref 1 (MPa) | 50 |
| Eoed ref 2 (MPa) | 60 |
| Eur3 (MPa) | 145 |
| Failure Ratio | 0.7 |
| Cohesion (kPa) | 0 |
| Dilatancy angle (°) | 6 |
| Friction angle (°) | 36 |
1 Secant stiffness at half of the ultimate deviatoric stress at reference pressure; 2 tangent stiffness in an oedometer test at the reference vertical stress; 3 elastic unloading–reloading Young’s modulus.
Table 2.
Parameters for the concrete and the foundation soil.
| Parameter | E 1 (MPa) | ν 2 | γ 3 (kg/m3) |
|---|---|---|---|
| Concrete panel | 15 | 0.2 | 2500 |
| Soil foundation | 200 | 0.25 | 2200 |
1 Young modulus; 2 Poisson’s ratio; 3 Volumic weight.
Table 3.
Characteristics of the concrete panel/soil interface.
| Parameter | Normal Stiffness (MPa) | Shear Stiffness (MPa) | Interface Friction Angle |
|---|---|---|---|
| Concrete panel/soil interface | 1000 | 1000 | 24 |
Table 4.
Reinforcements characteristics.
| Reinforcement | (GS50) 1 Geosynthetic Strip | (GS HA) 2 Geosynthetic Strip | Metallic Strip |
|---|---|---|---|
 |  |  | |
| Elastic modulus (GPa) | 2.5 | 2.5 | 210 |
| Width (m) | 0.1 | 0.1 | 0.05 |
| Thickness (mm) | 3 | 3 | 4 |
| Strip tensile yield-force limit (kN) | 100 | 70 | 100 |
| Strip compressive yield-force limit (N) | 0.0 | 0.0 | 100 |
| Tensile failure strain limit of the strip (%) | 12 | 12 | 10 |
1 Geosynthetic reinforcement strips (GeoStrap 50) used in MSE Walls; 2 new geosynthetic strips (GeoStrap High Adherence) used in MSE Walls.
Table 5.
Values of f * and kb.
| Parameter | (GS 50) Geosynthetic Strip | (GS HA) Geosynthetic Strip | Metallic Strip |
|---|---|---|---|
| f*0 Initial apparent friction coefficient at the soil/strip interface | 1.2 | 2.5 | 1.5 |
| f*1 Minimum apparent friction coefficient at the soil/strip interface | 0.6 | 1 | 0.727 |
| kb (MN/m2/m) Shear stiffness at the soil strip interface | 0.22 | 0.25 | 1.6 |
Table 6.
Influence of the friction angle.
| Strip | W 1/H 2 | φ (°) 3 | Fs 4 | |U| 5 (cm) | % Decrease Fs | % Increase |U| | ||
|---|---|---|---|---|---|---|---|---|
| (36–30) | (30–25) | (36–30) | (30–25) | |||||
| Metallic | 3 | 36 | 1.7 | 1.38 | 21 | 19 | 31.3 | 35.8 |
| 30 | 1.3 | 2.01 | ||||||
| 25 | 1.1 | 3.13 | ||||||
| 2 | 36 | 1.6 | 1.42 | 20.2 | 20 | 36 | 32.1 | |
| 30 | 1.3 | 2.22 | ||||||
| 25 | 1.0 | 3.27 | ||||||
| 1.33 | 36 | 2.2 | 0.61 | 20.6 | 19 | 3.2 | 1.6 | |
| 30 | 1.7 | 0.63 | ||||||
| 25 | 1.4 | 0.64 | ||||||
1 Height of the wall (m); 2 width of the wall (m); 3 soil friction angle (°); 4 safety factor; 5 maximal displacement of the reinforced backfill.
Table 7.
Results for the |U| and Fs for back-to-back walls with three strip types.
| Strip | W/H | Fs | |U| (cm) |
|---|---|---|---|
| Metallic | 2 | 1.6 | 1.42 |
| 1.33 | 2.2 | 0.61 | |
| GS HA | 2 | 2.1 | 5.38 |
| 1.33 | 1.7 | 2.02 | |
| GS 50 | 2 | 1.8 | 5.74 |
| 1.33 | 1.7 | 5.41 |
Table 8.
Results for different walls (metallic strips).
| Strip | W/H | Tensile Force (kN) | Soil/Strip Shear Displacement (cm) |
|---|---|---|---|
| Metallic | 3 | 16.5 | 0.62 |
| 2 | 17.6 | 0.68 | |
| 1.33 | 20.4 | 0.14 | |
| Infinity | 18.6 | 0.89 |
Table 9.
Comparison of different walls considering three strip types.
| Strip | W/H | Fs | |U| (cm) | ∆Fs/Fs (I)% | ∆|U|/|U| (I) % |
|---|---|---|---|---|---|
| Metallic | 3 | 1.7 | 1.38 | +21.8 | +0.72 |
| 2 | 1.6 | 1.42 | +16.9 | +3.65 | |
| 1.33 | 2.2 | 0.61 | +39.5 | −55.5 | |
| Infinity | 1.33 | 1.37 | - | - | |
| GS HA | 3 | 2.28 | 4.4 | +65.2 | −22.7 |
| 2 | 2.1 | 5.38 | +52.2 | −5.45 | |
| 1.33 | 1.7 | 2.02 | +23.2 | −64.5 | |
| Infinity | 1.38 | 5.69 | - | - | |
| GS 50 | 3 | 2.02 | 5.6 | +45.3 | −11.95 |
| 2 | 1.8 | 5.74 | +29.5 | −9.75 | |
| 1.33 | 1.7 | 5.41 | +22.3 | −14.93 | |
| Infinity | 1.39 | 6.36 | - | - |
Publisher’s Note: MDPI stays neutral with regard to jurisdictional claims in published maps and institutional affiliations. |
© 2021 by the authors. Licensee MDPI, Basel, Switzerland. This article is an open access article distributed under the terms and conditions of the Creative Commons Attribution (CC BY) license (https://creativecommons.org/licenses/by/4.0/).
Share and Cite
MDPI and ACS Style
Lajevardi, S.H.; Malekmohammadi, K.; Dias, D. Numerical Study of the Behavior of Back-to-Back Mechanically Stabilized Earth Walls. Geotechnics 2021, 1, 18-37. https://0-doi-org.brum.beds.ac.uk/10.3390/geotechnics1010002
AMA Style
Lajevardi SH, Malekmohammadi K, Dias D. Numerical Study of the Behavior of Back-to-Back Mechanically Stabilized Earth Walls. Geotechnics. 2021; 1(1):18-37. https://0-doi-org.brum.beds.ac.uk/10.3390/geotechnics1010002
Chicago/Turabian StyleLajevardi, Seyed Hamid, Khashayar Malekmohammadi, and Daniel Dias. 2021. "Numerical Study of the Behavior of Back-to-Back Mechanically Stabilized Earth Walls" Geotechnics 1, no. 1: 18-37. https://0-doi-org.brum.beds.ac.uk/10.3390/geotechnics1010002