
Review of Recent Developments and Understanding of Atterberg Limits Determinations


Department of Civil, Structural and Environmental Engineering, Trinity College Dublin, D02 PN40 Dublin, Ireland
Geotechnics 2021, 1(1), 59-75; https://0-doi-org.brum.beds.ac.uk/10.3390/geotechnics1010004
Submission received: 19 March 2021
/
Revised: 4 May 2021
/
Accepted: 18 May 2021
/
Published: 20 May 2021
(This article belongs to the Special Issue Soil-Water-Structure Interaction)
Abstract
:Among the most commonly specified tests in the geotechnical engineering industry, the liquid limit and plastic limit tests are principally used for (i) deducing useful design parameter values from existing correlations with these consistency limits and (ii) for classifying fine-grained soils, typically employing the Casagrande-style plasticity chart. This updated state-of-the-art review paper gives a comprehensive presentation of salient latest research and understanding of soil consistency limits determinations/measurement, elaborating concisely on the many standardized and proposed experimental testing approaches, their various fundamental aspects and possibly pitfalls, as well as some very recent alternative proposals for consistency limits determinations. Specific attention is given to fall cone testing methods advocated (but totally unsuitable) for plastic limit determination; that is, the water content at the plastic–brittle transition point, as defined using the hand rolling of threads method. A framework (utilizing strength-based fall cone-derived parameters) appropriate for correlating shear strength variation with water content over the conventional plastic range is presented. This paper then describes two new fine-grained soil classification system advancements (charts) that do not rely on the thread-rolling plastic limit test, known to have high operator variability, and concludes by discussing alternative and emerging proposals for consistency limits determinations and fine-grained soil classification.
1. Introduction
Plasticity of fine-grained soils is considered a function of the liquid limit (LL) and plastic limit (PL), which have wide importance for civil/geotechnical engineering and agronomic applications, in the ceramic industry and brick manufacturing process. The original tests for the determination of these consistency limits originate from the investigations of Atterberg [1,2], and their subsequent standardization for use in civil engineering applications by Terzaghi [3,4] and Casagrande [5,6]. The LL is notionally the water content (w) below which fine-grained soil ceases to flow as a liquid. The hand-rolling plastic limit (i.e., PLHR), as originally proposed by Atterberg, determines a genuine observable transition in soil behavior (i.e., the water content at the plastic–brittle transition point), obtained for rolling out on a glass plate of soil threads at water contents each side of the PLHR. For the Casagrande (percussion cup, PC) LL, a brass cup containing saturated remolded fine-grained soil paste, through which a standardized groove has been cut, is repeatedly dropped through a fixed distance of 10 mm onto a rubber base, with the associated LL (i.e., LLPC) defined as the water content value for which 25 blows are required for the plastic flow of the soil paste to close the groove over a specified length. The PLHR test [7,8,9] involves manually rolling out a thread of soil on a glass plate until it crumbles at a specified diameter (nominally 3 mm), being caused by air entry or cavitation within the soil thread [10]. These same tests were employed by Casagrande in developing the first plasticity chart for fine-grained soil classification purposes [11], which has undergone several revisions over the decades, along with the introduction of various other plasticity-based classification systems for engineering purposes, as elaborated in the review paper by Moreno-Maroto et al. [12].
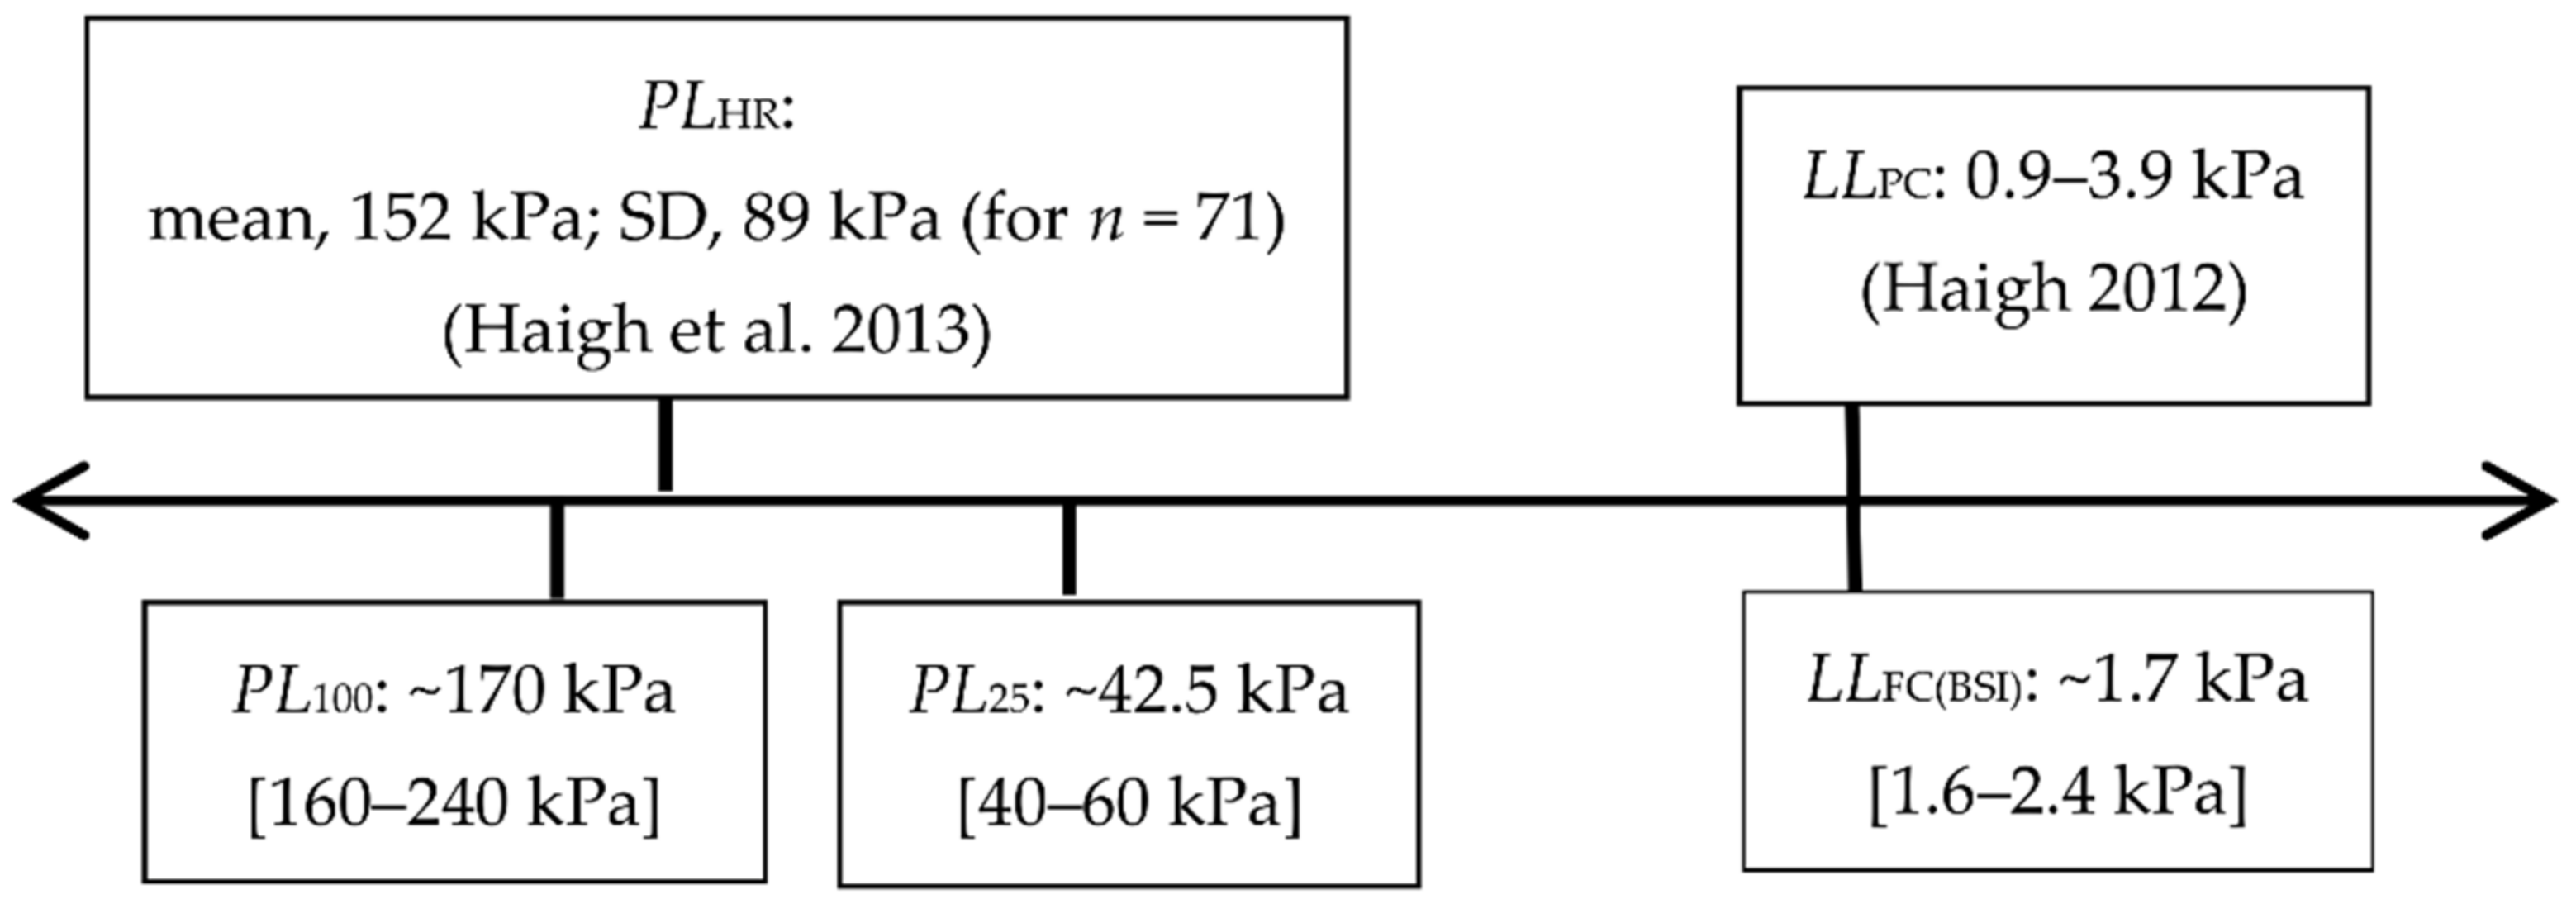
While standardized PC LL methods remain in widespread use in many parts of the world, standardized fall cone (FC) approaches have been introduced in many regions and sometimes adopted as the preferred method for LL determination. Similarly, different alternative methods have been proposed for PL determination, principally implementing strength-based FC approaches, which, as elaborated later in this paper, are entirely unsuitable for determining the PLHR, as established using the standardized hand rolling of threads method. The following sections present the state-of-the-art of soil plasticity determination/measurement, elaborating concisely on different experimental methods, their various fundamental aspects, and pitfalls for determination of the consistency limits, particularly those strength-based approaches advocated (but totally inappropriate) for PLHR determination. As an overview, Figure 1 presents schematically the relative locations of pertinent index parameters, positioned on the logarithmic scale of remolded undrained shear strength (su), each of which will be explained in detail later in this paper.
Note, this paper concerns itself with consistency limits determinations for inorganic fine-grained soils, the associated testing methods being deemed not appropriate for peat and other highly organic soils, nor reliable indicators of their consistency [14,15]. In assessing the likely engineering behavior of these highly organic soils, rather than the consistency limits, a more useful suite of index tests is natural water content, organic content, fiber content and degree of humification [14,15].
This paper discusses the strength-based ‘plastic strength limit’ (PSL) (coined by Haigh et al. [10]) parameter derived from FC testing, and then presents a framework (utilizing strength-based FC-derived parameters) appropriate for correlating shear strength variation with water content for fine-grained soils over their conventional plastic ranges. This paper then describes two new fine-grained soil classification system advancements (charts) that do not require PLHR results, known to have high operator variability, and concludes by discussing alternative and emerging proposals for consistency limits determinations and fine-grained soil classification.
2. LL Determination
2.1. General Approaches and Categorizations
The PC LL and FC LL approaches are mechanically different, each mobilizing arbitrarily criteria-chosen low shear strengths for the LL condition. The PC test devices are typically categorized as having ‘hard’ (e.g., ASTM D4318-17e1 [8]) or ‘soft’ (e.g., BS 1377-2 [7]) rubber base material, although considerable variability exists within each of these categorizations [16], while FC test devices can employ cones of different mass and apex angle (80 g/30° and 60 g/60° cones are commonly employed) and for a different cone penetration depth (dLL) in defining the FC LL condition (i.e., LLFC).
Often one LL determination approach has gained widespread favor over the other in various parts of the world, although compared to the PC LL test, the FC LL test is often cited as having superior repeatability and reproducibility [17,18,19]. The situation is further complicated by the fact that for both approaches, there are variants of the test apparatus employed and/or the manner of performing the testing, as evident from comparisons of different codes from around the world (e.g., for a review of PC LL approaches, see Haigh [16]; for FC LL approaches, see O’Kelly et al. [13] and Koumoto and Houlsby [20]). For instance, considering PC LL apparatuses, the most significant variations among codes are differences in the PC devices’ base hardness and resilience values [16,21]. Note, potential degradation of PC device base materials may occur over time, such that base hardness and resilience must be regularly monitored (as mandated by ASTM D4318 [8]) to ensure proper device performance, thereby achieving consistency of LLPC results [16].
Given that the PC LL and FC LL approaches are set out in numerous standards, with both of them in widespread use and for one approach often being favored over the other in different parts of the world, it is inevitable that they will both continue to co-exist in practice until such time that international agreement for definitively choosing one approach is reached, along with international standardization of codes for the chosen approach. Some suggestions relating to the international standardization of the FC LL approach have been presented in the papers by O’Kelly et al. [13], Koumoto and Houlsby [20] and O’Kelly [22].
2.2. Fundamental Basis and Mobilized Strengths for LL Approaches
While the FC approach is strength based [23], the soil response to repeated impact in the PC LL device, being compared to the dynamic failure of cohesive slopes, is dependent on the specific strength of the saturated soil paste [16,24], defined as the ratio of remolded undrained shear strength to saturated bulk density (i.e., su/ρsat). Hence, it follows that for decreasing soil density with increasing value of the water content at the LL, the mobilized undrained shear strength corresponding to the LLPC (i.e., su(LLcup)) reduces in value with increasing LL, found represented by a semi-logarithmic relationship [16,24,25,26]. For instance, Haigh [16] reported that ‘hard’ base PC LL devices mobilize an average su(LLcup)/ρsat value of 0.87 m2/s2, whereas for ‘soft’ base devices, the corresponding value is 0.47 m2/s2. Consequently, the ‘soft’ base devices systematically produce higher LLPC values, and hence marginally lower su(LLcup) values, compared to ‘hard’ base PC LL devices [16,21,26,27]. Further, while PC LL is not associated directly with undrained shear strength, rather with specific strength, the associated su(LLcup) magnitude can be estimated from the LLPC water content taking the average su(LLcup)/ρsat value for either the ‘hard’ or ‘soft’ base device employed in the testing and assuming a typical value of specific gravity of solids in determining the bulk density of the saturated soil paste at the measured the LLPC water content. From comparisons with mostly miniature vane-shear results, the overwhelming body of experimental evidence indicates that su(LLcup) can range from 1 to 3 kPa, and for low to very high plasticity soils (considering LLPC increasing from 20% to 70% water content), typically decreases from approx. 2.5 to 1.6 kPa [26]. Note, the value of su(LLcup) for a given fine-grained soil is typically deduced from a fitting of su − w results, such that its accuracy depends on the spread and accuracy of the measured strength data about the LL water content.
The FC LL, on the other hand, is associated with a set undrained shear strength (i.e., su(LL FC)), as defined by the cone’s mass, surface roughness and apex-angle characteristics together with the set dLL value specified for the LLFC condition [13,20,22]. For instance, the 80 g/30° FC, with dLL = 20 mm (i.e., LLFC(BSI)), as defined in the British standard (BS 1377-2 [7]), mobilizes an undrained shear strength (i.e., su(LL FC)) of approx. 1.7 kPa [13,28,29], as calculated using Hansbo’s [23] FC strength equation (Equation (1)), taking a constant value of the cone factor, K, for given cone angle and surface roughness characteristics.
where m and d are the cone mass and penetration depth, respectively, K is the fall cone factor, and g is the gravitational constant (9.81 m/s2).
Note, compared to conventional understanding (e.g., Hansbo [23] and Koumoto and Houlsby [20]), recent experimental evidence presented by Llano-Serna and Contreras [30] showed that the degree of cone roughness does not have a major effect on the cone penetration depth and hence the deduced su magnitude. As well as the cone characteristics, the K magnitude is also dependent on the soils’ strain-rate dependence, with O’Kelly et al. [13] deducing that for the rate dependence parameter’s probable range of 0.05–0.15, the LLFC(BSI) would have a probable su(LL FC) range of 1.6 to 2.4 kPa. Employing different cone characteristics and dLL magnitude combinations for identifying LLFC (e.g., 60 g/60° FC and dLL = 10 mm [31]) generally results in the mobilization of slightly different values of su(LL FC), thereby deducing (slightly) different LLFC water content values for a given fine-grained soil.
Note, although mineralogy may well play a key role in the varying strength of clays with water content, the PC LL and FC LL approaches do not respond in any way to mineralogy [24,32]. As shown by Haigh [24], the form of the increasing LLPC to LLFC ratio relationship for higher LL water contents can be derived based on analysis of the test mechanics. As described earlier, the LLPC is dependent on the dynamic slope stability of the grooved soil paste in the PC device and hence on the soil’s specific strength (i.e., su/ρsat). So, for high plasticity soils, the lower soil densities seen at LL result in lower strengths (i.e., su(LLcup)) being required for slope stability compared to those for low plasticity soils. Therefore, with a set su(LL FC) magnitude being mobilized for given FC characteristics and dLL combination, the su(LLcup) to su(LL FC) ratio decreases and, consequently, the LLPC to LLFC ratio increases for increasing LL water content.
2.3. Comparison of LL Results from PC and FC Approaches
Since they employ mechanically different testing methodologies and different definitions for identifying the LL condition, it is not surprising that the PC and FC approaches can produce systematic different water content values for the LL condition when investigating a given fine-grained soil [13,16,26]. Accordingly, the deduced plasticity index (IP) magnitude for the measured LLFC (i.e., IP(FC) = LLFC − PLHR) can be different from that obtained for the LLPC (i.e., IP(PC) = LLPC − PLHR). Without careful consideration, these differences can have significant implications; for instance, in the case of classifying some fine-grained soils which lie close to boundaries when design codes are prescriptive about allowable soil classes but methods for testing consistency limits change [19,33]. In other words, the change in the measured LL value, simply as a result of switching from the PC LL to the FC LL test method, or vice versa, does not represent a fundamental change in material behavior [13], but may be sufficient to change the classification of a soil from suitable to unsuitable owing to precise thresholds of allowable LL and (or) IP values.
For instance, compared to ‘hard’ base devices, the ‘soft’ base PC LL device systematically gives a higher value of LLPC, since its softer base material absorbs more energy from the impacting brass cup [16,27]. Further, when testing intermediate and high plasticity fine-grained soils; compared to the LLFC(BSI), the ‘soft’ base PC LL device generally gives slightly greater values of water content for the LL [13]. For extremely high values of LL water content, substantial divergence can be expected for a given fine-grained soil between ‘soft’ and ‘hard’ base LLPC and also between these LLPC and the 80 g/30° and 60 g/60° LLFC (examples given below).
Following the introduction of the LL FC approach, some misunderstanding arose in subsequent geotechnical publications when engineers sought to replace the PC LL test with the arguably more reliable FC LL approach, but wished to retain for soil classification purposes the Unified Soil Classification System (USCS) plasticity chart (ASTM D2487-17e1 [34]), which was developed using ‘hard’ base LLPC results [11]. The same misconception would arise in employing LLFC results for deducing useful parameter values for preliminary geotechnical design from existing correlations based on LLPC and (or) IP(PC) data [13].
One means of resolving the effect of the described methodological differences on the obtained LL results is through various correlations, each specific to particular variants of the PC LL and FC LL test devices, as specified in the various codes/standards. Applying such correlations is recommended when substantial discrepancies in LL results, obtained for a given fine-grained soil investigated using various LL testing approaches, are anticipated. For instance, linear type LLFC − LLPC correlations are presented in Moon and White [35], Özer [36] and Claveau-Mallet et al. [37], with non-linear forms relating LLFC(BSI) to ‘hard’ base (i.e., LLPC(ASTM)) and ‘soft’ base (i.e., LLPC(BSI)) devices given by Equations (2) and (3), after O’Kelly et al. [13].
For example, considering an LL value of 120%, the largest difference in LL water contents predicted by Equations (2) and (3) occurs for the LLFC(BSI) − LLPC(BSI) combination (at 10.6% water content), compared to 1.4% water content for the LLFC(BSI) − LLPC(ASTM) combination. As clearly demonstrated, the differences can be considerable at higher LL water contents, showing the potentially significant importance of applying such correlations; for instance, in obtaining LLPC(ASTM) from measured LLFC(BSI) for the purposes of deducing the value of other soil parameters employing existing correlations derived based on LLPC(ASTM).
3. PLHR Determination
3.1. Definitive Method—Rolling of Soil Threads
As originally described by Atterberg [1,2], the PLHR is determined using the hand-rolling method, being standardized worldwide (e.g., BS 1377-2 [7], ASTM D4318-17e1 [8] and EN ISO 17892-12 [9]). Note, it has been shown that the thread diameter requirement for the crumbling condition—specified as approximately 3.0 mm [7] or 3.2 mm [8]—is not critical, with no statistically significant trend of varying PLHR water content with the soil thread diameter (2–6 mm range investigated) for the crumbling condition [10,38].
While it has been often argued that the method is overly dependent on operator performance and judgement [17,18,21,39,40,41], with an operator error as great as 10–15% when testing the same fine-grained soil [17,40,41], this would point to the absolute necessity for the PLHR experiment to be performed only by experienced and attentive personnel, with strict adherence to the standard procedure [38,42].
3.2. Proposed Alternative PLHR Methods Based on Onset of Brittleness
In view of perceived weaknesses and poor repeatability/reproducibility of the hand-rolling PL, mechanical thread-rolling [43,44,45,46] and alternative methods also based on the onset of brittleness [47,48,49,50] have been proposed for improved PL determination.
The Bobrowski and Griekspoor [44] test method utilizes a rolling device comprising two acrylic flat plates covered with unglazed paper, downward force being simultaneously applied (via the top plate) to the soil thread with the back and forth rolling motion, until the top plate comes into contact with 3.2 mm-deep side rails. Despite Bobrowski and Griekspoor [44] claiming that PLs are obtained in a more expeditious and uniform fashion, their experimental findings along with those of Rashid et al. [51], Ishaque et al. [52] and Rehman et al. [53] independently indicated that the water contents for the thread crumbling condition obtained using this plate rolling device (i.e., PLPRD) generally underestimate their PLHR values. It has been suggested that this most likely occurred because the paper attached to the flat plates tends to produce inhomogeneity of the soil thread, the outside becoming drier than its core, during the rolling out procedure [13]. Ishaque et al. [52] also reported that this method is not a workable means for ‘non-cohesive’ (i.e., silt) soils. However, given the relatively small number of fine-grained soils examined in each of the Bobrowski and Griekspoor [44], Rashid et al. [51], Ishaque et al. [52] and Rehman et al. [53] studies, the author of this paper believes it would be worth revisiting, and judging the PLPRD reliability/repeatability, with respect to the PLHR, based on statistical analysis of these combined PLPRD datasets.
Gay and Kaiser [43] described a motorized rolling device having three rotating grooved rods, with pre-set clearance of 3.2 mm, which propel the wet soil nodule to produce a constant-diameter soil thread. This device was employed in the investigations by Kayabali [54,55], with the associated ‘PL’ (i.e., PLMRD) defined as the water content for the condition when the length of soil threads dropping from the bottom release of the device was somewhere between 1 to 2 cm long. From investigating 120 fine-grained soil samples, Kayabali [55] found that the PLMRD systematically underestimated the PLPRD by approx. 20%. As the PLMRD water content falls considerably below PLHR, the motorized rolling device produces an irregularly shaped soil thread instead of a cylindrical one [55].
Barnes [45,46] emulated the rolling conditions of soil cylinders (threads) using a device capable of measuring their values of indicative toughness (the property that best defines soil deformation capacity and therefore plasticity), thereby allowing determination of the PLHR. Although the results of Barnes’ test method have been of value, particularly in obtaining quantitative data on soil toughness, it has disadvantages in terms of complexity, slowness and criteria employed for PLHR determination. de Oliveira Modesto and Bernardin [47] proposed an indentation test whereby the force applied to a 30° cone is slowly and steadily increased to indent the soil test-specimen, which is considered in a plastic state if the perforation mark printed on it presents no cracks, or in a brittle state for crack formation. Moreno-Maroto and Alonso-Azcárate [48] developed a fast and simple test method based on the bending of 3 mm diameter soil cylinders, which allowed determination of PL as well as a number of new consistency parameters. Their bending method was refined in subsequent work [49,50], becoming a potential alternative to the standardized hand-rolling PL method. However, apart from the Bobrowski and Griekspoor approach [44], which has been included in ASTM D4318-17e1 [8] and AASHTO T90–00 [56] albeit that the hand-rolling method remains the preferred approach for PL determination, none of the other described methods have, to date, been adopted more widely.
3.3. Unsoundness of Strength-Based Approaches for PLHR Determination
Various FC (e.g., [20,28,41,57,58,59]), steady monotonic cone penetration [60,61], fast-static cone loading [40] and extrusion (e.g., [21,62]) approaches have been advocated as alternatives to the PLHR method. However, as well brought out in the literature, it is unequivocal that strength-based methods employing extrusion [63] or FC approaches (e.g., [10,13,64]) cannot consistently and reliably determine the PLHR (i.e., the plastic–brittle transition point) condition for fine-grained soils. For instance, in the reverse extrusion (RE) approach, the confined soil specimen is extruded through a die orifice under a steady-state extrusion pressure (pe), with the constancy of the pe to su ratio for fine-grained soils investigated using a given RE apparatus configuration fundamental to accurate strength determinations using this approach. However, from reassessment of previously reported data for many hundreds of different fine-grained soils, O’Kelly [63] found that the pe to su ratio magnitude does not remain constant among different remolded fine-grained soils, thereby invalidating the present RE testing approach for su and hence strength-based ‘plastic limit’ determinations [63,65].
3.4. Definition of the ‘Plastic Strength Limit’, PL100
With criteria set out in terms of the cone characteristics and dLL magnitude, various FC approaches can be used to determine, usually by extrapolation of FC data (e.g., [66]), the lower water content for a set multiple of the undrained shear strength mobilized at the LLFC water content. Based on the assumption of Schofield and Wroth [67], a strength gain factor (R) of 100 is typically adopted, thereby defining a new parameter termed PL100 [10,41,58,60,61,64,68,69,70]; i.e., the PSL parameter, as coined by Haigh et al. [10]. Importantly, unlike the PLHR, the PSL does not define a transition between one consistency state and another, and its strength-based definition fundamentally contradicts the original understanding of Atterberg’s consistency limits; that is, the LL and PLHR are two independent parameters, not related at all [19].
So, for instance, with the LLFC(BSI) corresponding to su(LL FC) ≈ 1.7 kPa [13,28], the undrained shear strength mobilized at the PSL (i.e., su(PSL)) for R = 100 (i.e., the PL100 water content) equates to approx. 170 kPa. Following from Equation (1), since FC tests employing different cone characteristics and dLL magnitude combinations for identifying the LLFC mobilize slightly different su(LL FC) values, the associated su(PSL) values will also be different, as are the deduced PSL water contents in investigating a given fine-grained soil.
Among the various FC PL100 methodologies reported in the published literature, Sivakumar et al. [41] presented a novel energy-based approach, whereby a 0.727 kg/30° cone is allowed to fall freely through 200 mm before its tip contacts the specimen top surface, with the PSL defined for this falling cone to penetrate a depth of 20 mm into the test specimen, this scenario being equivalent to a stationary 8.0 kg/30° cone, with its tip just contacting the specimen surface at the beginning of the test, penetrating to the same 20 mm depth. This alternate arrangement for the FC test, whereby the cone is dropped from a certain height and hits the top surface of the soil specimen with an impact velocity (i.e., nonzero cone velocity at the start of penetration) is the original idea of Sivakumar et al. [41].
3.5. Strength Range at the PLHR and Non-Uniqueness with PL100
For fine-grained soils at their PLHR water contents, Haigh et al. [10], in examining data for 71 soils, found that the remolded undrained shear strength at PLHR (i.e., su(PL)) had median, mean and standard deviation values of 132, 152 and 89 kPa, respectively. Further, considering the data for 11 inorganic fine-grained soils with PLHR = 16–51%, O’Kelly [69] deduced that su(PL) ranged 34 to 123 kPa (mean of 82 kPa) for these soils. Further evidence of the su(PL) variation is provided from analysis by O’Kelly [63] of RE data presented for 60 remolded fine-grained soils in the paper by Kayabali and Ozdemir [71], with the mean pe(PL) to su(PL) ratio value of 13.9 for the particular RE apparatus configuration employed found to have a standard deviation of 3.2, where pe(PL) is the extrusion pressure corresponding to the measured PLHR.
Consequently, the strength gain factor with reducing water content over the full conventionally defined plastic range varies substantially between soils [10,69,72,73], often been significantly less than the commonly assumed value of R = 100 adopted in defining the PL100. For instance, Vardanega and Haigh [74] demonstrated using a database of 101 soils that the mean strength gain factor when considering the conventional plastic range was closer to 83.5 when FC su was fitted to the logarithmic liquidity index, ILN, as defined in Koumoto and Houlsby [20].
Note, the strength gain factor deduced for a given fine-grained soil is also dependent on the spread and accuracy of available strength data over the plastic range and whether the semi-logarithmic [74], bi-logarithmic [74] or multilinear [75] model approaches are used in the fitting. As hypothecated by O’Kelly et al. [76] and then confirmed experimentally in Barnes [75]; for a given fine-grained soil, compared to the semi- or bi-logarithmic regression analysis with extrapolation along the single line to the PLHR water content value, the multilinear fitting, being more representative of the experimental su − w relationship/curve, predicts (possibly by a substantial amount) a higher value of su(PL) and hence also of the experimentally derived strength gain factor, R.
As such, with the strength gain factor for the conventional plastic range invariably not being 100, and often significantly less than this value, any agreement found between the experimental values of PLHR and PL100 for a given fine-grained soil is deemed purely coincidental [10,13,63,64,69]. Feng [66] and Hrubesova et al. [77], for instance, reported ±20% variation for PL100 to PLHR water contents considering various fine-grained soils investigated. Consequently, the PL100 values (or those PSL values deduced based on another strength-gain factor magnitude assumed for the conventional plastic range) should not be entertained for soil classification purposes using Casagrande-style plasticity charts, or employed in deducing other soil parameters using established correlations based on datasets with PLHR [13].
4. PL100 (and PL25) Correlations with Strength
The variability of su(PL) between fine-grained soils makes a correlation between the liquidity index and strength problematic. From this perspective, the strengths defined at the LLFC and PL100 for a given cone characteristics and dLL combination may make the correlation with the liquidity index worthwhile, and the PL100 also may be useful as an extra index parameter [10,13,77], alongside the PLHR and the FC flow index, IF(FC) [78]. As described by Haigh et al. [10] and Kyambadde et al. [70], for correlations with strength and stiffness, the PL100 or the associated plasticity index, IP100 (= LLFC − PL100), would be a favorable choice since they are both implicitly linked to the strength variation with changing water content.
However, as described above, soils frequently exist in a brittle state at water contents around the PL100 (i.e., for w < PLHR), such that test-specimen preparation can be difficult [21,28,58,60,66], and the use of Hansbo’s [23] FC-strength equation (Equation (1)) for non-ductile materials is questionable, at best, as elaborated in O’Kelly et al. [13]. Koumoto and Houlsby [20] suggested the definition of a new index value, PL10; that is, the lower water content corresponding to a strength tenfold greater than that mobilized at the LLFC, although this results in defining a narrow shear strength range of approx. 1.7–17 kPa for the 80 g/30° FC with dLL = 20 mm. Seeking to encompass a wide enough range of undrained shear strengths, but also requiring that the tested soils exist in a plastic state for water contents about the chosen su(PSL) value, O’Kelly et al. [13] proposed the PL25 parameter (i.e., for R = 25, giving su(PSL) ≈ 42.5 kPa) as a best compromise to replace PL100. Based on the PL25 and a new FC-based logarithm consistency index parameter (IC(FC): Equation (4)), O’Kelly et al. [13] proposed a framework whereby the FC su magnitude corresponding to any water content value within the full plastic range (PLHR < w < LLFC) can be approximated employing Equation (5).
Note, assuming su(LL FC) ≈ 1.7 kPa for IC(FC) = 0, the Equation (5) reduces to the following:
Compared to the conventional liquidity index (IL), Equations (5) and (6) allow significantly better FC su predictions to be achieved for soft to medium-stiff clays. Further, for a given fine-grained soil (with experimental PL100 ≥ PLRT to be precise), these equations can also be used to estimate the FC su magnitude corresponding to its PL100 water content (i.e., for inputting IC(FC) = log 100/log 25 = 1.43). Also, if its PLHR has been separately measured using the hand-rolling method, the corresponding su(PL) and hence R (= su(PL)/ LLFC) values can be estimated using the same approach. Note, a similar framework was presented in O’Kelly [63] for su determinations from RE testing of soft to medium-stiff clays.
5. Recent Developments Regarding Consistency Limits Determinations and Soil Classification
A comprehensive review and critical examination of the main fine-grained soil classification systems based on plasticity, which included the prevalent Casagrande-USCS approach (e.g., [34]), was recently presented in Moreno-Maroto et al. [12]. Note, as well as plasticity-based classification systems, there are many other fine-grained soil classification proposals based on the determination of other properties with other objectives (e.g., gradation, color, texture, morphology, production capacity, genesis) in existence.
After presenting two very recent advancements in plasticity-based approaches (charts) for classifying fine-grained soils for civil/geotechnical purposes, this section considers alternative and emerging proposals for consistency limits determinations and soil classification. The first of these advancements, after Moreno-Maroto and Alonso-Azcárate [50,79], was developed according to objective criteria, based on the quantitative measurement of properties such as toughness, thread bending capacity (as elaborated in Section 3.2) and the observation of adhesive consistency. The second, after Vardanega et al. [19], requires only FC LL test results for classifying fine-grained soils to an acceptable degree of accuracy; i.e., the approach does not require the PLHR measurement, removing the dependence on a test (hand rolling) that has high operator variability [17,40,41].
In analyzing the relationship between soil toughness and the consistency limits, Moreno-Maroto and Alonso-Azcárate [79] observed a strong correlation between the IP to LLPC ratio and the maximum toughness Tmax, allowing them to define Equation (7), and refine their earlier fine-grained soil classification proposal [50].
where Tmax is the maximum toughness (in kJ/m3), as determined by the Barnes’ thread-rolling test device [45,46], emulating the standard hand-rolling PL test, with Tmax mobilized immediately above the PLHR water content.
IP/LLPC = 0.0077 Tmax + 0.3397
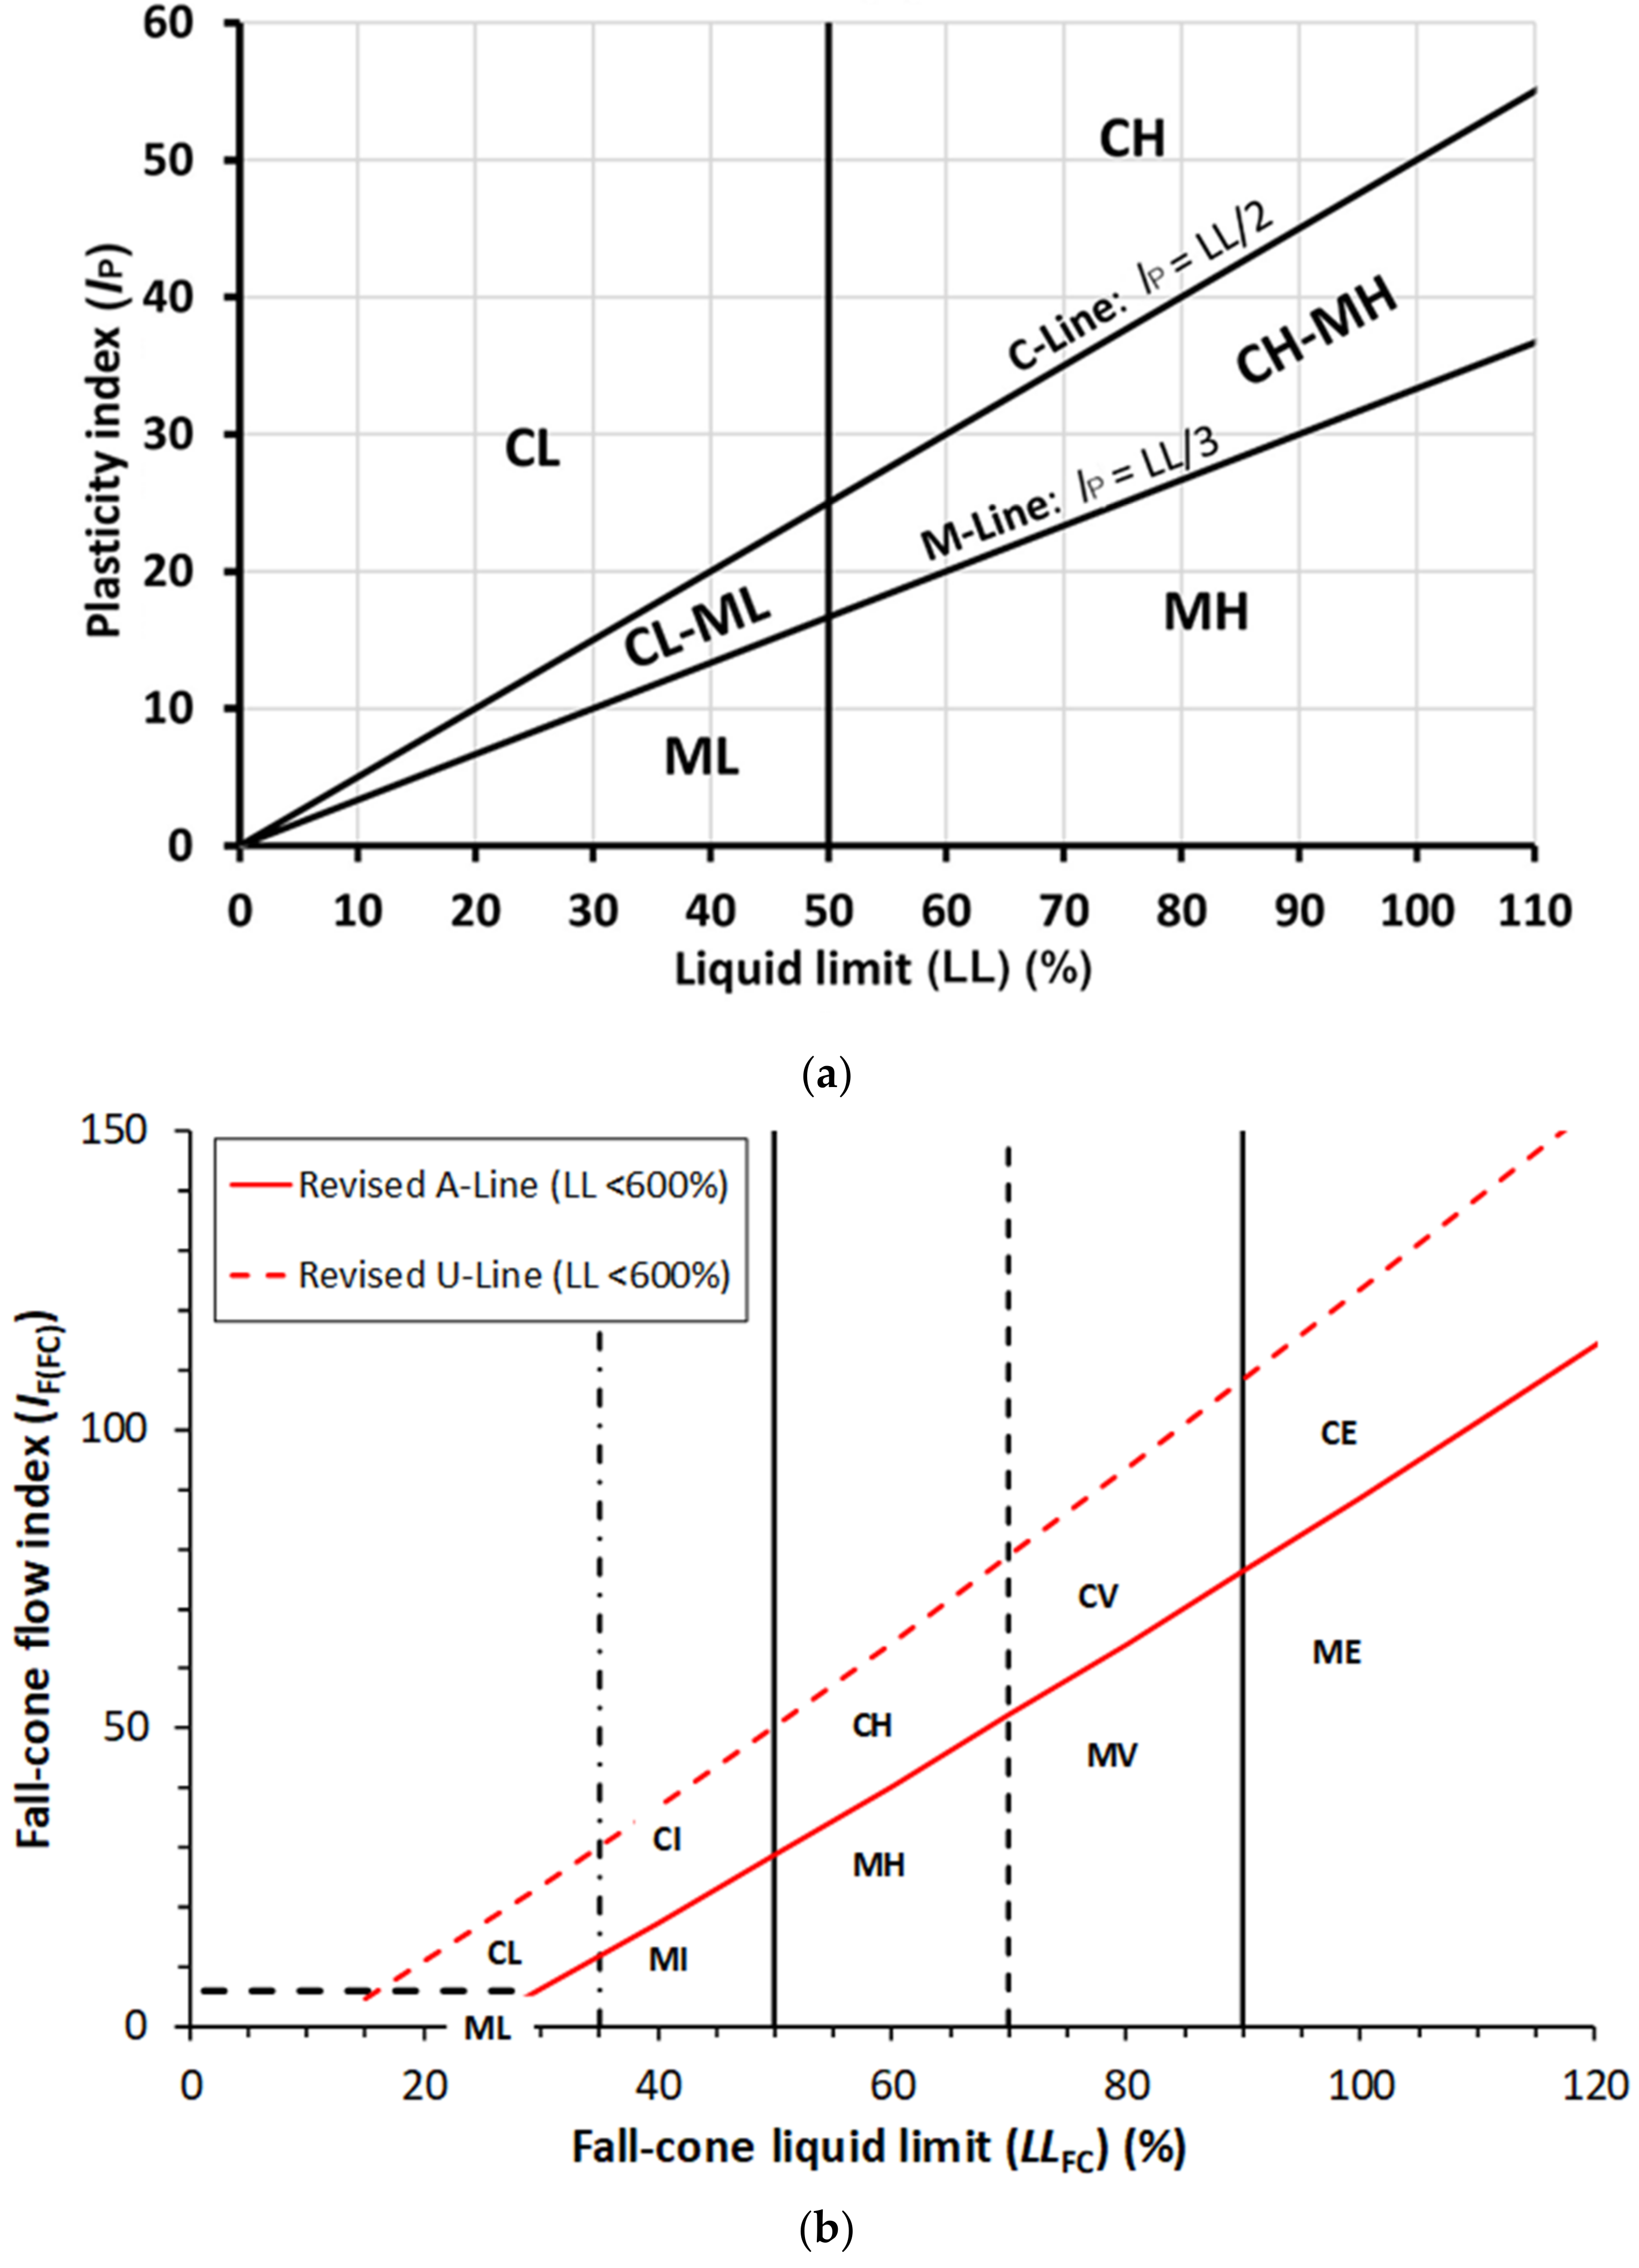
Considering that toughness (plasticity) is an exclusive property of clays and clayey soils, and with the PLHR determined using the thread bending test [49,50], a value of IP/LLPC ≈ 0.33 (i.e., setting Tmax = 0 in Equation (7)) defines the upper limit for silts and other non-cohesive soils; plotting as the so-called ‘M-line’ in their IP − LL chart (Figure 2a). Similarly, considering that clays have high toughness [11], and adopting a Tmax value of 20 kJ/m3 (based on Barnes’ toughness classification [45,46]) as a boundary between moderately or slightly clayey soils (e.g., clayey silts) and actual clays, results in IP/LLPC ≈ 0.50, defining the so-called ‘C-line’ in Figure 2a. Therefore, those fine-grained soils with intermediate characteristics (i.e., 0 < Tmax < 20 kJ/m3) plot in the space between the M-line and C-line in Figure 2a. It their review paper, Moreno-Maroto et al. [12] investigated the correctness of classifications assigned to 31 different fine-grained mineral soils by applying six main plasticity-based soil classification proposals (charts), including the Casagrande-USCS approach (e.g., see [34]), with the Moreno-Maroto and Alonso-Azcárate [79] plasticity chart (Figure 2a) ranked as having the strongest predictive capacity among those proposals examined.
Figure 2b presents the new plasticity chart system after Vardanega et al. [19], which requires only FC LL test results; plotting the FC flow index (obtained from the experimental 80 g/30° FC flow curve as IF(FC) = Δw/Δlog d [78]) against the LLFC defined for dLL = 20 mm (i.e., LLFC(BSI)). As two different fine-grained soils can have the same LLFC values but different computed IF(FC) magnitudes, these measures (LLFC and IF(FC)) are arguably independent [19], despite being obtained from analyses of the same data acquired for a given fine-grained soil using the 80 g/30° FC LL test apparatus. Note that the A-line and U-line equations of the Casagrande-USCS plasticity chart [11,34] are repositioned in this new IF(FC) − LLFC chart using Equation (2) in order to account for methodological differences between the FC LL and PC LL tests. In other words, FC LL results are employed in using the new chart, whereas PC LL results were used by Casagrande [11] in establishing the A-line and U-line for the Casagrande-USCS plasticity chart [34]. Using FC LL datasets for 235 fine-grained soils, Vardanega et al. [19] demonstrated that these soils can be classified to an acceptable degree of accuracy using their IF(FC) − LLFC chart (Figure 2b). Note, Vardanega et al. [19] emphasized that computed IF(FC) values should not be used for PLHR determination; that is, having measured LL, some earlier work reported in the literature (e.g., [78]) proposed the estimation of the PLHR magnitude via IP(FC), which was deduced using correlations with IF(FC), but such approaches cannot be used with confidence [80]. Similarly, the PC flow index [81], determined as the absolute gradient of the plotted PC LL results (i.e., IF(PC) = −Δw/Δlog N, where w = water content of soil paste in the brass cup, and N = number of blows to close the standardized groove over a specified length) does not correlate to an adequately high level for obtaining accurate PLHR predictions [80,82].
The final part of this section considers some alternative and emerging proposals for consistency limits determinations and fine-grained soil classification. On the basis that for large sample quantities the conventional laboratory measurement methods are tedious and costly, some researchers have proposed new microstructural and mineralogical based testing methods for consistency limits determinations. For instance, Rehman et al. [83] developed visible–near-infrared (vis–NIR) spectroscopy based models, correlating the Atterberg limits with typical clay signatures in the vis–NIR spectrum (from 400 to 2500 nm), reportedly obtaining very good and quite good estimation accuracies for LL and PL determinations, respectively, attributable to a strong correlation between them and spectrally active components related to soil clay mineralogy (mainly O–H bonds and Fe oxides). From field spectroscopy investigations of forest soils in Iran, Mousavi et al. [84] reported that partial least-square regression modeling for the parameters of LL and IP in the raw spectra and the first derivative of the spectrum is very suitable, but is weak and not acceptable for PL determination. Further, compared to conventional consistency limits testing apparatuses, spectroscopy equipment is not as readily available or robust. For intermediate to extremely-high plasticity clays from Istanbul Province (Turkey), Akbay Arama et al. [85] reported relatively strong correlations, obtained from power regression analysis of a very large database (1523 LL tests), for evaluating the values of IP(PC) directly from only LLPC test results. However, with a wide variety of clay soils inevitably present in such a large deposit, as evident from the huge scatter of the experimental data, plotting from the A-line up to the U-line in the Casagrande-USCS plasticity chart, it is evident that the reported correlation could not consistently produce reliable IP(PC) predictions, for subsequent use in deducing design parameter values from existing correlations based on IP(PC) data. Further, since all of the database soils were known to be clays, and with the plasticity class level determined only by the measured LL, there is no new information in terms of soil classification to be gleaned from the reported LLPC − IP(PC) correlation. Pedo-transfer functions (PTFs) have been employed to predict consistency limits using measured and morphological soil properties from large datasets [86,87,88]. However, large variations in the expansivity of different clay minerals limits the applicability of any PTF based on clay and silt contents to those soil samples that have similar mineralogy as the samples used in developing the PTFs and, furthermore, the measurement methods of basic properties (e.g., gradation and cation exchange capacity) required for such functions can also be tedious.
Very recently, Arthur et al. [89] proposed regression models that estimate the consistency limits from hygroscopic water content at different relative humidity values ranging from 10 to 90% and considering water sorption hysteresis. Further, Zhou and Ning [90] demonstrated that the consistency limits correlated to mechanisms of soil–water interaction, specifically to a soil’s total adsorptive water content in terms of gravimetric water content, thereby potentially providing a new pathway for moving beyond the consistency limits and to classify fine-grained soils directly using more representative soil physical properties, like adsorption suction stress, which could be linked to all four fundamental factors of soil mineralogy, gradation, pore fluid chemistry and pore structure.
Sitton et al. [91] presented an artificial neural network framework for rapid soil classification that relates the results of qualitative and quantitative field soil analyses to standardized laboratory soil analyses and, ultimately, USCS classification. Additionally, very recently Prakash and Sridharan [92] postulated on dispensing with the plasticity chart concept altogether, tentatively suggesting an alternative system based on the free swell ratio (FSR) [27], or to use the FSR parameter along with the plasticity chart in any fine-grained soil classification system. As an indicator of the soil swelling capacity, FSR, by itself, does not give a quantification of the plastic range or level of plasticity of fine-grained soil and, so, on its own, does not seem to allow assignment of a fine-grained soil to one of the prescribed soil plasticity class levels [93] (as implemented in the Casagrande-style plasticity chart). In other words, a key point to keep focus on is that the purpose of soil classification for civil/geotechnical engineering applications is to assign the test soil to one of a number of distinct soil groups, each having their own similar characteristic engineering behavior/properties; these being assessed via the level of soil plasticity (toughness), as directly quantified using the conventional consistency limits tests (PLHR and LLPC or LLFC). Therefore, the determination of consistency limits remains a topic of major importance in the current state of Geotechnics.
6. Summary
The salient points of this state-of-the-art review paper on the latest research and understanding of fine-grained soil consistency limits determinations/measurement are summarized as follows:
- The FC LL test method (with su(LL FC) ≈ 1.7 kPa for LLFC(BSI)) has superior repeatability/reproducibility compared to the PC LL approach, for which the deduced LLPC is dependent on specific strength, explaining why ‘soft’ base PC LL devices produce higher LLPC values compared to ‘hard’ base ones and also the LLFC(BSI), as well as the form of the increasing LLPC to LLFC ratio relationship for higher LL water contents. Accordingly, deduced plasticity index values for measured LLPC (i.e., IP(PC)) are often different from those obtained for measured LLFC (i.e., IP(FC)), which can have significant implications; for instance, in the classification of some fine-grained soils, especially those that lie close to boundaries. For extremely high LL water content, substantial divergence can be expected between ‘soft’ and ‘hard’ base LLPC and also between these LLPC and the 80 g/30° and 60 g/60° LLFC. Discrepancies in the LL results obtained for a given fine-grained soil arising from the methodological differences can be adequately resolved via appropriate correlations; e.g., see Equations (2) and (3).
- The hand-rolling PL (i.e., PLHR) determines a genuine observable transition in soil behavior (i.e., the water content at the plastic–brittle transition point), but plate rolling and mechanized rolling devices (PLPRD and PLMRD, respectively) systematically produce underestimates of the PLHR, especially for the PLMRD-derived values. Indentation testing, considering cases with and without crack formation (for the printed perforation mark) indicative of brittle and plastic states, respectively, merits further investigation.
- Since the strength gain factor with reducing water content over the full conventionally defined plastic range varies substantially between fine-grained soils, the strength-based FC and extrusion approaches are entirely unsuitable for PLHR determination, typically producing ±20% variation for PL100 to PLHR water contents. Consequently, PL100 (or those PSL values deduced based on another assumed strength-gain factor magnitude over the conventional plastic range) should not be entertained for fine-grained soil classification purposes or employed in deducing other parameters for preliminary geotechnical design from established correlations based on datasets with PLHR.
- The presented framework given by Equations (4)–(6), utilizing strength-based FC-derived LLFC and PL25 parameters, provides a convenient and reliable means of correlating FC strength variation with water content over the full plastic range, with PL25 favored over PL100, so that the FC-tested soil specimens exist in a plastic state (w > PLHR).
- Finally, the two recently developed plasticity-based fine-grained soil classification systems [19,79] presented do not rely on PLHR results (which are known to have high operator variability of up to 10–15%), but instead require PL determination using a thread-bending test (Moreno-Maroto and Alonso-Azcárate [48,49]), or rely solely on the flow index (and LLFC(BSI)) determined from 80 g/30° FC LL testing [19].
Funding
This research received no external funding.
Institutional Review Board Statement
Not applicable.
Conflicts of Interest
The author declares no conflict of interest.
Abbreviations
| FC | fall cone |
| LL | liquid limit |
| PC | percussion cup |
| PL | plastic limit |
| PSL | plastic strength limit |
| PTF | pedo-transfer function |
| USCS | Unified Soil Classification System |
Nomenclature
| d | cone penetration depth |
| dLL | penetration defining the fall cone liquid limit |
| g | gravitational constant |
| IC(FC) | fall cone-based logarithmic consistency index parameter |
| IF(FC) | the fall cone-derived flow index |
| IF(PC) | percussion cup-derived flow index |
| IL | the conventional liquidity index |
| ILN | the logarithmic liquidity index |
| IP | the plasticity index |
| IP(FC) | the plasticity index based on the fall cone liquid limit (i.e., LLFC − PLHR) |
| IP(PC) | the plasticity index based on the percussion cup liquid limit (i.e., LLPC − PLHR) |
| IP100 | the plasticity index based on the PSL water content derived for R = 100 (i.e., LLFC − PL100) |
| K | fall cone factor |
| LLFC | the fall cone liquid limit |
| LLFC(BSI) | the liquid limit determined by 80 g/30° fall cone at 20 mm penetration depth |
| LLPC | the percussion cup liquid limit |
| LLPC(ASTM) | the percussion cup liquid limit determined according to American Standards (hard base) |
| LLPC(BSI) | the percussion cup liquid limit determined according to British Standard (soft base) |
| m | cone mass |
| n | number of data points used to generate a regression |
| N | number of blows to brass cup in Casagrande device |
| pe | extrusion pressure |
| pe(PL) | extrusion pressure corresponding to the PLHR water content |
| PLHR | the plastic limit determined by the hand-rolling method |
| PLMRD | water content to produce 3.2 mm dia. by 1–2 cm long soil threads using motorized rolling device |
| PLPRD | water content for thread crumbling condition in Bobrowski and Griekspoor’s plate rolling device |
| PL10 | the plastic strength limit (for R = 10) |
| PL25 | the plastic strength limit (for R = 25) |
| PL100 | the plastic strength limit (for R = 100) |
| R | undrained strength gain factor with reducing water content relative to fall cone liquid-limit water content |
| R2 | coefficient of determination |
| su | undrained shear strength |
| su(LLcup) | undrained shear strength corresponding to the LLPC water content |
| su(LL FC) | undrained shear strength corresponding to the LLFC water content |
| su(PL) | undrained shear strength at the PLHR water content |
| su(PSL) | undrained shear strength at the plastic strength limit water content |
| Tmax | maximum toughness |
| w | water content |
| Δw | change in water content |
| ρsat | saturated bulk density |
References
- Atterberg, A. Die Plastizität der Tone. Int. Mitt. Bodenkd. 1911, 1, 4–37. (In German) [Google Scholar]
- Atterberg, A. Lerornas forhållande till vatten, deras plasticitetsgränser och plasticitetsgrader. K. Lantbr. Handl. Och Tidskr. 1911, 50, 132–158. [Google Scholar]
- Terzaghi, K. Principles of final soil classification. Public Roads 1926, 8, 41–53. [Google Scholar]
- Terzaghi, K. Simplified soil tests for subgrades and their physical significance. Public Roads 1926, 7, 153–170. [Google Scholar]
- Casagrande, A. Research on the Atterberg limits of soils. Public Roads 1932, 13, 121–136. [Google Scholar]
- Casagrande, A. Notes on the design of the liquid limit device. Géotechnique 1958, 8, 84–91. [Google Scholar] [CrossRef]
- BS 1377-2. Methods of Test for Soils for Civil Engineering Purposes (Classification Tests); British Standards Institution: London, UK, 1990. [Google Scholar]
- ASTM D4318-17e1. Standard Test Methods for Liquid Limit, Plastic Limit, and Plasticity Index of Soils; ASTM International: West Conshohocken, PA, USA, 2017. [Google Scholar]
- EN ISO 17892-12. Geotechnical Investigation and Testing–Laboratory Testing of Soil–Part 12: Determination of Liquid and Plastic Limits; European Committee for Standardization, CEN-CENELEC Management Centre: Brussels, Belgium, 2018. [Google Scholar]
- Haigh, S.K.; Vardanega, P.J.; Bolton, M.D. The plastic limit of clays. Géotechnique 2013, 63, 435–440. [Google Scholar] [CrossRef] [Green Version]
- Casagrande, A. Classification and identification of soils. Trans. Am. Soc. Civ. Eng. 1947, 113, 901–991. [Google Scholar] [CrossRef]
- Moreno-Maroto, J.M.; Alonso-Azcárate, J.; O’Kelly, B.C. Review and critical examination of fine-grained soil classification systems based on plasticity. Appl. Clay Sci. 2021, 200, 105955. [Google Scholar] [CrossRef]
- O’Kelly, B.C.; Vardanega, P.J.; Haigh, S.K. Use of fall cones to determine Atterberg limits: A review. Géotechnique 2018, 68, 843–856. [Google Scholar] [CrossRef] [Green Version]
- O’Kelly, B.C. Atterberg limits are not appropriate for peat soils. Geotech. Res. 2015, 2, 123–134. [Google Scholar] [CrossRef] [Green Version]
- O’Kelly, B.C. Briefing: Atterberg limits and peat. Environ. Geotech. 2016, 3, 359–363. [Google Scholar] [CrossRef]
- Haigh, S.K. Consistency of the Casagrande liquid limit test. Geotech. Test. J. 2016, 39, 13–19. [Google Scholar] [CrossRef] [Green Version]
- Sherwood, P.T. The Reproducibility of the Results of Soil Classification and Compaction Tests; Transport and Road Research Laboratories Report LR 339; Department of Transport: London, UK, 1970.
- Sherwood, P.T.; Ryley, M.D. An investigation of a cone-penetrometer method for the determination of the liquid limit. Géotechnique 1970, 20, 203–208. [Google Scholar] [CrossRef]
- Vardanega, P.J.; Haigh, S.K.; O’Kelly, B.C. Use of fall-cone flow index for soil classification: A new plasticity chart. Géotechnique 2021. [Google Scholar] [CrossRef]
- Koumoto, T.; Houlsby, G.T. Theory and practice of the fall cone test. Géotechnique 2001, 51, 701–712. [Google Scholar] [CrossRef]
- Whyte, I.L. Soil plasticity and strength: A new approach using extrusion. Ground Eng. 1982, 15, 16–24. [Google Scholar]
- O’Kelly, B.C. Fall-cone strength testing of municipal sludges and residues. Environ. Geotech. 2018, 5, 18–30. [Google Scholar] [CrossRef]
- Hansbo, S. A new approach to the determination of the shear strength of clay by the fall cone test. Proc. R. Swed. Geotech. Inst. 1957, 14, 1–48. [Google Scholar]
- Haigh, S.K. Mechanics of the Casagrande liquid limit test. Can. Geotech. J. 2012, 49, 1015–1023. [Google Scholar] [CrossRef]
- Youssef, M.S.; El Ramli, A.H.; El Demery, M. Relationships Between Shear Strength, Consolidation, Liquid Limit and Plastic Limit for Remolded Clays. In Proceedings of the 6th International Conference on Soil Mechanics and Foundation Engineering, Montreal, Canada, 8–15 September 1965; University of Toronto Press: Toronto, ON, Canada, 1965; Volume 1, pp. 126–129. [Google Scholar]
- O’Kelly, B.C. Fallacy of wide undrained strength range at the Casagrande liquid limit. Geotech. Res. 2019, 6, 205–217. [Google Scholar] [CrossRef] [Green Version]
- Sridharan, A.; Prakash, K. Percussion and cone methods of determining the liquid limit of soils: Controlling mechanisms. Geotech. Test. J. 2000, 23, 236–244. [Google Scholar] [CrossRef]
- Wroth, C.P.; Wood, D.M. The correlation of index properties with some basic engineering properties of soils. Can. Geotech. J. 1978, 15, 137–145. [Google Scholar] [CrossRef]
- Haigh, S.K.; Vardanega, P.J.; O’Kelly, B.C. Discussion of ‘Factors influencing undrained strength of fine-grained soils at high water contents’ by H.B. Nagaraj, M.V. Sravan and B.S. Deepa. Geomech. Geoengin. 2021. [Google Scholar] [CrossRef]
- Llano-Serna, M.A.; Contreras, L.F. The effect of surface roughness and shear rate during fall-cone calibration. Géotechnique 2020, 70, 332–342. [Google Scholar] [CrossRef]
- Karlsson, R. Consistency Limits. A Manual for the Performance and Interpretation of Laboratory Investigations, Part 6; Swedish Council for Building Research: Stockholm, Sweden, 1977. [Google Scholar]
- O’Kelly, B.C.; Vardanega, P.J.; Haigh, S.K.; Bicalho, K.V.; Fleureau, J.-M.; Cui, Y.-J. Discussion: Use of fall cones to determine Atterberg limits: A review. Géotechnique 2020, 70, 652–654. [Google Scholar] [CrossRef]
- Di Matteo, L.; Dragoni, W.; Cencetti, C.; Ricco, R.; Fucsina, A. Effects of fall-cone test on classification of soils: Some considerations from study of two engineering earthworks in central Italy. Bull. Eng. Geol. Environ. 2016, 75, 1629–1637. [Google Scholar] [CrossRef]
- ASTM D2487-17e1. Standard Practice for Classification of Soils for Engineering Purposes (Unified Soil Classification System); ASTM International: West Conshohocken, PA, USA, 2017. [Google Scholar]
- Moon, C.; White, K. A comparison of liquid limit test results. Géotechnique 1985, 35, 59–60. [Google Scholar] [CrossRef]
- Özer, M. Comparison of liquid limit values determined using the hard and soft base Casagrande apparatus and the cone penetrometer. Bull. Eng. Geol. Environ. 2009, 68, 289–296. [Google Scholar] [CrossRef]
- Claveau-Mallet, D.; Duhaime, F.; Chapuis, R. Practical considerations when using the Swedish fall cone. Geotech. Test. J. 2012, 35, 618–628. [Google Scholar] [CrossRef]
- Prakash, K.; Sridharan, A.; Prasanna, H.S. A note on the determination of plastic limit of fine-grained soils. Geotech. Test. J. 2009, 32, 372–374. [Google Scholar] [CrossRef]
- Temyingyong, A.; Chantawaragul, K.; Sudasna-na-Ayudthya, P. Statistical analysis of influenced factors affecting the plastic limit of soils. Agric. Nat. Resour. 2002, 36, 98–102. [Google Scholar]
- Sivakumar, V.; Glynn, D.; Cairns, P.; Black, J.A. A new method of measuring plastic limit of fine materials. Géotechnique 2009, 59, 813–823. [Google Scholar] [CrossRef]
- Sivakumar, V.; O’Kelly, B.C.; Henderson, L.; Moorhead, C.; Chow, S.H. Measuring the plastic limit of fine soils: An experimental study. Proc. Inst. Civ. Eng.-Geotech. Eng. 2015, 168, 53–64. [Google Scholar] [CrossRef]
- Prakash, K.; Sridharan, A. Critical appraisal of the cone penetration method of determining soil plasticity. Can. Geotech. J. 2006, 43, 884–888. [Google Scholar] [CrossRef]
- Gay, G.C.W.; Kaiser, W. Mechanization for remolding fine grained soils and for the plastic limit test. J. Test. Eval. 1973, 1, 317–318. [Google Scholar] [CrossRef]
- Bobrowski, L.J.; Griekspoor, D.M. Determination of the plastic limit of a soil by means of a rolling device. Geotech. Test. J. 1992, 15, 284–287. [Google Scholar] [CrossRef]
- Barnes, G.E. An apparatus for the plastic limit and workability of soils. Proc. Inst. Civ. Eng.-Geotech. Eng. 2009, 162, 175–185. [Google Scholar] [CrossRef]
- Barnes, G.E. An apparatus for the determination of the workability and plastic limit of clays. Appl. Clay Sci. 2013, 80–81, 281–290. [Google Scholar] [CrossRef]
- De Oliveira Modesto, C.; Bernardin, A.M. Determination of clay plasticity: Indentation method versus Pfefferkorn method. Appl. Clay Sci. 2008, 40, 15–19. [Google Scholar] [CrossRef]
- Moreno-Maroto, J.M.; Alonso-Azcárate, J. An accurate, quick and simple method to determine the plastic limit and consistency changes in all types of clay and soil: The thread-bending test. Appl. Clay Sci. 2015, 114, 497–508. [Google Scholar] [CrossRef]
- Moreno-Maroto, J.M.; Alonso-Azcárate, J. A bending test for determining the Atterberg plastic limit in soils. J. Vis. Exp. 2016, 112, e54118. [Google Scholar] [CrossRef]
- Moreno-Maroto, J.M.; Alonso-Azcárate, J. Plastic limit and other consistency parameters by a bending method and interpretation of plasticity classification in soils. Geotech. Test. J. 2017, 40, 467–482. [Google Scholar] [CrossRef]
- Rashid, A.S.A.; Kassim, K.A.; Katimon, A.; Noor, M.N. Determination of plastic limit of soil using modified methods. Malays. J. Civ. Eng. 2008, 20, 295–305. [Google Scholar]
- Ishaque, F.; Hoque, M.N.; Rashid, M.A. Determination of plastic limit of some selected soils using rolling device. Progress. Agric. 2010, 21, 187–194. [Google Scholar] [CrossRef] [Green Version]
- Rehman, H.U.; Pouladi, N.; Pulido-Moncada, M.; Arthur, E. Repeatability and agreement between methods for determining the Atterberg limits of fine-grained soils. Soil Sci. Soc. Am. J. 2020, 84, 21–30. [Google Scholar] [CrossRef]
- Kayabali, K. Determination of consistency limits: A comparison between –#40 and –#200 materials. Electron. J. Geotech. Eng. 2011, 16, 1547–1561. [Google Scholar]
- Kayabali, K. An alternative testing tool for plastic limit. Electron. J. Geotech. Eng. 2012, 17, 2107–2114. [Google Scholar]
- AASHTO T90–00. Determining the Plastic Limit and Plasticity Index of Soils; AASHTO: Washington, DC, USA, 2020. [Google Scholar]
- Wasti, Y. Liquid and plastic limits as determined from the fall cone and Casagrande methods. Geotech. Test. J. 1987, 10, 26–30. [Google Scholar] [CrossRef]
- Harison, J.A. Using the BS cone penetrometer for the determination of the plastic limits of soils. Géotechnique 1988, 38, 433–438. [Google Scholar] [CrossRef]
- Feng, T.W. Using a small ring and a fall-cone to determine the plastic limit. J. Geotech. Geoenviron. Eng. 2004, 130, 630–635. [Google Scholar] [CrossRef]
- Stone, K.J.L.; Phan, K.D. Cone penetration tests near the plastic limit. Géotechnique 1995, 45, 155–158. [Google Scholar] [CrossRef]
- Stone, K.J.L.; Kyambadde, B.S. Determination of strength and index properties of fine-grained soils using a soil minipenetrometer. J. Geotech. Geoenviron. Eng. 2007, 133, 667–673. [Google Scholar] [CrossRef]
- Kayabali, K.; Tufenkci, O.O. Determination of plastic and liquid limits using the reverse extrusion technique. Geotech. Test. J. 2010, 33, 14–22. [Google Scholar] [CrossRef]
- O’Kelly, B.C. Reappraisal of soil extrusion for geomechanical characterisation. Geotech. Res. 2019, 6, 265–287. [Google Scholar] [CrossRef] [Green Version]
- Sivakumar, V.; O’Kelly, B.C.; Henderson, L.; Moorhead, C.; Chow, S.H.; Barnes, G.E. Discussion: Measuring the plastic limit of fine soils: An experimental study. Proc. Inst. Civ. Eng.-Geotech. Eng. 2016, 169, 83–85. [Google Scholar] [CrossRef] [Green Version]
- O’Kelly, B.C. Discussion of “Strength and consolidation characteristics for cement stabilized cohesive soil considering consistency index” by Ahmed F. Zidan, published in Geotechnical and Geological Engineering. Geotech. Geol. Eng. 2021. [Google Scholar] [CrossRef]
- Feng, T.W. Fall cone penetration and water content relationship of clays. Géotechnique 2000, 50, 181–187. [Google Scholar] [CrossRef]
- Schofield, A.N.; Wroth, C.P. Critical State Soil Mechanics; McGraw-Hill: Maidenhead, UK, 1968. [Google Scholar]
- Kyambadde, B.S.; Stone, K.J.L. Index and strength properties of clay–gravel mixtures. Proc. Inst. Civ. Eng.-Geotech. Eng. 2012, 165, 13–21. [Google Scholar] [CrossRef] [Green Version]
- O’Kelly, B.C. Atterberg limits and remolded shear strength—Water content relationships. Geotech. Test. J. 2013, 36, 939–947. [Google Scholar] [CrossRef]
- Kyambadde, B.S.; Stone, K.J.L.; Barnes, G.E. Discussion: Index and strength properties of clay–gravel mixtures. Proc. Inst. Civ. Eng.-Geotech. Eng. 2014, 167, 83–86. [Google Scholar] [CrossRef] [Green Version]
- Kayabali, K.; Ozdemir, A. Use of reverse extrusion method to determine undrained shear strength. Geotech. Geol. Eng. 2013, 31, 719–727. [Google Scholar] [CrossRef]
- Barnes, G.E.; O’Kelly, B.C. Discussion: An apparatus for the plastic limit and workability of soils. Proc. Inst. Civ. Eng.-Geotech. Eng. 2011, 164, 293–294. [Google Scholar] [CrossRef]
- Nagaraj, H.B.; Sridharan, A.; Mallikarjuna, H.M. Re-examination of undrained strength at Atterberg limits water contents. Geotech. Geol. Eng. 2012, 30, 727–736. [Google Scholar] [CrossRef]
- Vardanega, P.J.; Haigh, S.K. The undrained strength—Liquidity index relationship. Can. Geotech. J. 2014, 51, 1073–1086. [Google Scholar] [CrossRef] [Green Version]
- Barnes, G.E. A multi-linear approach to strength and plasticity states between the Atterberg limits. Proc. Inst. Civ. Eng.-Geotech. Eng. 2021, 174, 102–117. [Google Scholar] [CrossRef]
- O’Kelly, B.C.; Vardanega, P.J.; Haigh, S.K.; Barnes, G.E. Discussion: Use of fall cones to determine Atterberg limits: A review. Géotechnique 2020, 70, 647–651. [Google Scholar] [CrossRef] [Green Version]
- Hrubesova, E.; Lunackova, B.; Mohyla, M. Mohajerani method: Tool for determining the liquid limit of soils using fall cone test results with strong correlation with the Casagrande test. Eng. Geol. 2020, 278, 105852. [Google Scholar] [CrossRef]
- Sridharan, A.; Nagaraj, H.B.; Prakash, K. Determination of the plasticity index from flow index. Geotech. Test. J. 1999, 22, 175–181. [Google Scholar] [CrossRef]
- Moreno-Maroto, J.M.; Alonso-Azcárate, J. What is clay? A new definition of “clay” based on plasticity and its impact on the most widespread soil classification systems. Appl. Clay Sci. 2018, 161, 57–63. [Google Scholar] [CrossRef]
- Soltani, A.; O’Kelly, B.C. Discussion of “The flow index of clays and its relationship with some basic geotechnical properties” by G. Spagnoli, M. Feinendegen, L. Di Matteo, D.A. Rubinos, published in Geotechnical Testing Journal 42, no. 6 (2019): 1685–1700. Geotech. Test. J. 2021, 44, 216–219. [Google Scholar] [CrossRef]
- Fang, H.Y. Rapid determination of liquid limit of soils by flow index method (includes discussion by C.M. Johnston). Highw. Res. Board Bull. 1960, 254, 30–35. [Google Scholar]
- O’Kelly, B.C.; Soltani, A. Discussion: Determining the plasticity properties of high plastic clays: A new empirical approach [Arab J Geosci (2020) 13(11), 394]. Arab. J. Geosci. 2021, 14, 715. [Google Scholar] [CrossRef]
- Rehman, H.U.; Knadel, M.; Kayabali, K.; Arthur, E. Estimating Atterberg limits of fine-grained soils by visible–near-infrared spectroscopy. Vadose Zone J. 2019, 18, 190039. [Google Scholar] [CrossRef]
- Mousavi, F.; Abdi, E.; Ghalandarzadeh, A.; Bahrami, H.; Majnounian, B. Laboratory evaluation of the PLSR method to estimate Atterberg limits of soil by field spectroscopy. Iran. J. For. 2019, 11, 151–164. [Google Scholar]
- Akbay Arama, Z.; Akın, M.S.; Nuray, S.E.; Dalyan, İ. Estimation of consistency limits of fine-grained soils via regression analysis: A special case for high and very high plastic clayey soils in Istanbul. Int. Adv. Res. Eng. J. 2020, 4, 255–266. [Google Scholar] [CrossRef]
- Seybold, C.A.; Elrashidi, M.A.; Engel, R.J. Linear regression models to estimate soil liquid limit and plasticity index from basic soil properties. Soil Sci. 2008, 173, 25–34. [Google Scholar] [CrossRef] [Green Version]
- Keller, T.; Dexter, A.R. Plastic limits of agricultural soils as functions of soil texture and organic matter content. Soil Res. 2012, 50, 7–17. [Google Scholar] [CrossRef]
- Van Tol, J.J.; Dzene, A.R.; Le Roux, P.A.L.; Schall, R. Pedotransfer functions to predict Atterberg limits for South African soils using measured and morphological properties. Soil Use Manag. 2016, 32, 635–643. [Google Scholar] [CrossRef]
- Arthur, E.; Rehman, H.U.; Tuller, M.; Pouladi, N.; Nørgaard, T.; Moldrup, P.; de Jonge, L.W. Estimating Atterberg limits of soils from hygroscopic water content. Geoderma 2021, 381, 114698. [Google Scholar] [CrossRef]
- Zhou, B.; Ning, L. Correlation between Atterberg limits and soil adsorptive water. J. Geotech. Geoenviron. Eng. 2021, 147, 04020162. [Google Scholar] [CrossRef]
- Sitton, J.D.; Zeinali, Y.; Story, B.A. Rapid soil classification using artificial neural networks for use in constructing compressed earth blocks. Constr. Build. Mater. 2017, 138, 214–221. [Google Scholar] [CrossRef]
- Prakash, K.; Sridharan, A. Discussion on review and critical examination of fine-grained soil classification systems based on plasticity {Authored by Moreno-Maroto, J.M., Alonso-Azcárate, J. and O’Kelly, B.C., Applied Clay Science, vol. 200, No. 1, pp. 1–13}. Appl. Clay Sci. 2021, 206, 106008. [Google Scholar] [CrossRef]
- Moreno-Maroto, J.M.; Alonso-Azcárate, J.; O’Kelly, B.C. Reply to Discussion on “Review and critical examination of fine-grained soil classification systems based on plasticity” by J.M. Moreno-Maroto, J. Alonso-Azcárate and B.C. O’Kelly, Applied Clay Science 200 (2021) 105955. Appl. Clay Sci. 2021, 206, 106074. [Google Scholar] [CrossRef]
Figure 1.
Typical undrained shear strength ranges for various index parameters plotted on a logarithmic strength scale. Note: LLPC, percussion-cup liquid limit; LLFC(BSI), liquid limit determined by 80 g/30° fall cone for 20 mm penetration depth; n, number of data points/results; PLHR, plastic limit determined by hand-rolling method; PL25 and PL100, plastic strength limits for strength gain factors of 25 and 100, respectively, with reducing water content relative to the fall-cone liquid limit; SD, standard deviation (adopted from O’Kelly et al. [13]).

Figure 2.
Recently proposed fine-grained soil classification charts: (a) developed based on quantitative toughness and thread-bending capacity measurements and observation of adhesive consistency (adopted from Moreno-Maroto and Alonso-Azcárate [79]); (b) employing the FC-derived flow index and with LLFC obtained for the 80 g/30° FC setup and dLL = 20 mm (adopted from Vardanega et al. [19]).

Publisher’s Note: MDPI stays neutral with regard to jurisdictional claims in published maps and institutional affiliations. |
© 2021 by the author. Licensee MDPI, Basel, Switzerland. This article is an open access article distributed under the terms and conditions of the Creative Commons Attribution (CC BY) license (https://creativecommons.org/licenses/by/4.0/).
Share and Cite
MDPI and ACS Style
O’Kelly, B.C. Review of Recent Developments and Understanding of Atterberg Limits Determinations. Geotechnics 2021, 1, 59-75. https://0-doi-org.brum.beds.ac.uk/10.3390/geotechnics1010004
AMA Style
O’Kelly BC. Review of Recent Developments and Understanding of Atterberg Limits Determinations. Geotechnics. 2021; 1(1):59-75. https://0-doi-org.brum.beds.ac.uk/10.3390/geotechnics1010004
Chicago/Turabian StyleO’Kelly, Brendan C. 2021. "Review of Recent Developments and Understanding of Atterberg Limits Determinations" Geotechnics 1, no. 1: 59-75. https://0-doi-org.brum.beds.ac.uk/10.3390/geotechnics1010004