Development of an Interface Shear Strength Tester and a Model Predicting the Optimal Application Rate of Tack Coat


Department of Civil Engineering, Seoul National University of Science and Technology, 232 Gongneung-ro, Nowon-gu, Seoul 01811, Korea
*
Author to whom correspondence should be addressed.
Constr. Mater. 2021, 1(1), 22-38; https://0-doi-org.brum.beds.ac.uk/10.3390/constrmater1010002
Submission received: 28 February 2021
/
Revised: 25 March 2021
/
Accepted: 30 March 2021
/
Published: 2 April 2021
Abstract
:Tack coat application rates and testing conditions differ among nations and construction conditions because various tack coat materials are available. In this study, newer materials are optimized for addition to porous asphalt pavements exposed to torrential rainfall, which is common in South Korea. Interface shear strength (ISS) tests are used to define the optimum application rates (OARs) of tack coat materials generally used in South Korea, by reference to the Korean Design Standard (KDS), the Korean Construction Standard (KCS), and features of pavement construction and bonding. We performed ISS tests using asphalt mixtures with porosities of 3, 5, and 7% to explore the effect of porosity on shear strength. The ISSs associated with varying tack coat proportions were earlier determined by creating polynomial regression equations. Here, we develop a predictive model using a non-linear function to estimate the OAR of tack coat and compare our approach with the earlier polynomial regression analysis. Based on the ISSs, the golden section search method was applied to define the OARs afforded by the predictive polynomial function. We used the generalized reduced gradient algorithm to construct a nonlinear predictive function using data from the ISS tests. Finally, our comparative analysis showed that the predictive model using the non-linear function was superior to the polynomial model in terms of both error rate and predictive tendency.
1. Introduction
Emulsified asphalt (e.g., tack coat) prevents the slippage and separation of two different pavement layers used to bear traffic loads by improving the binding between the upper and lower layers. Tack coat not only ensures adhesion, it is also moisture-resistant and thus imparts waterproofing. Two emulsified asphalts (tack coat and prime coat) find different applications. Tack coat is commonly divided by stiffness into slow-setting (SS-1, SS-1h, CSS-1, and CSS-1h) and rapid-setting grades (RS-1, RS-2, CRS-1, CRS-2, CRS-2P, and CRS-2L, respectively). CRS-2P and CRS-2L are emulsified asphalts modified by the addition of latex or polymeric material. The performance of tack coat varies with pavement condition, asphalt and emulsified asphalt types used, application rate, and the extent of quality control.
Optimized tack coat materials have been recently developed. However, the lack of specifications and application guidelines render it difficult to reliably apply the materials. The bonding characteristics of tack coat materials depend on several factors. Specifically, the bonding properties can be changed by the material type of underlying mixture, and the temperature and the application rate have an impact on their shear strength [1].
Factors important to interlayer strength include tack coat characteristics (binder dosage, binder type, and breaking time), surface characteristics (material type, surface roughness, surface texture, and state), temperature, traffic loads, etc., and the optimum application rate can be influenced by the aggregate gradation.
It is recommended these factors be considered to evaluate the bonding characteristics of the pavement site [2,3,4,5].
To understand the performance of tack coat and define application standards, various tests have been developed to define its adhesion characteristics (shear, pull-off, torsion, and impact). In South Korea, the Korean Design Standard (KDS) and the Korean Construction Standard (KCS) indicate that RS(C)-4 is to be used for paving (except for new construction) via a specific method wherein the application level is between 0.3–0.6 L/m2. Other types of tack coat are rarely used, and their application rates have not been specified. No uniform standards are applied, and the choice of materials is at the discretion of site superintendents or the builders. Increasingly, however, specific tests are required to be conducted.
Thus, our first objective was to develop a test platform to research which conditions are appropriate for tack coat applications in South Korea. We also developed a model predicting shear strength by application rate and defined the optimum application rates (OARs). We studied the shear characteristics of specimens varying in porosity because both porous and drainage asphalt guard against the increased precipitation associated with climate change. We developed an interface shear strength (ISS) tester to evaluate the shear performances of hot-mixed asphalt (HMA) mixtures with varying amounts of tack coat. The newly developed model was evaluated to determine the tack coat dosage, in comparison with the regression model developed in the previous research using a test machine.
2. Tack Coat Investigations
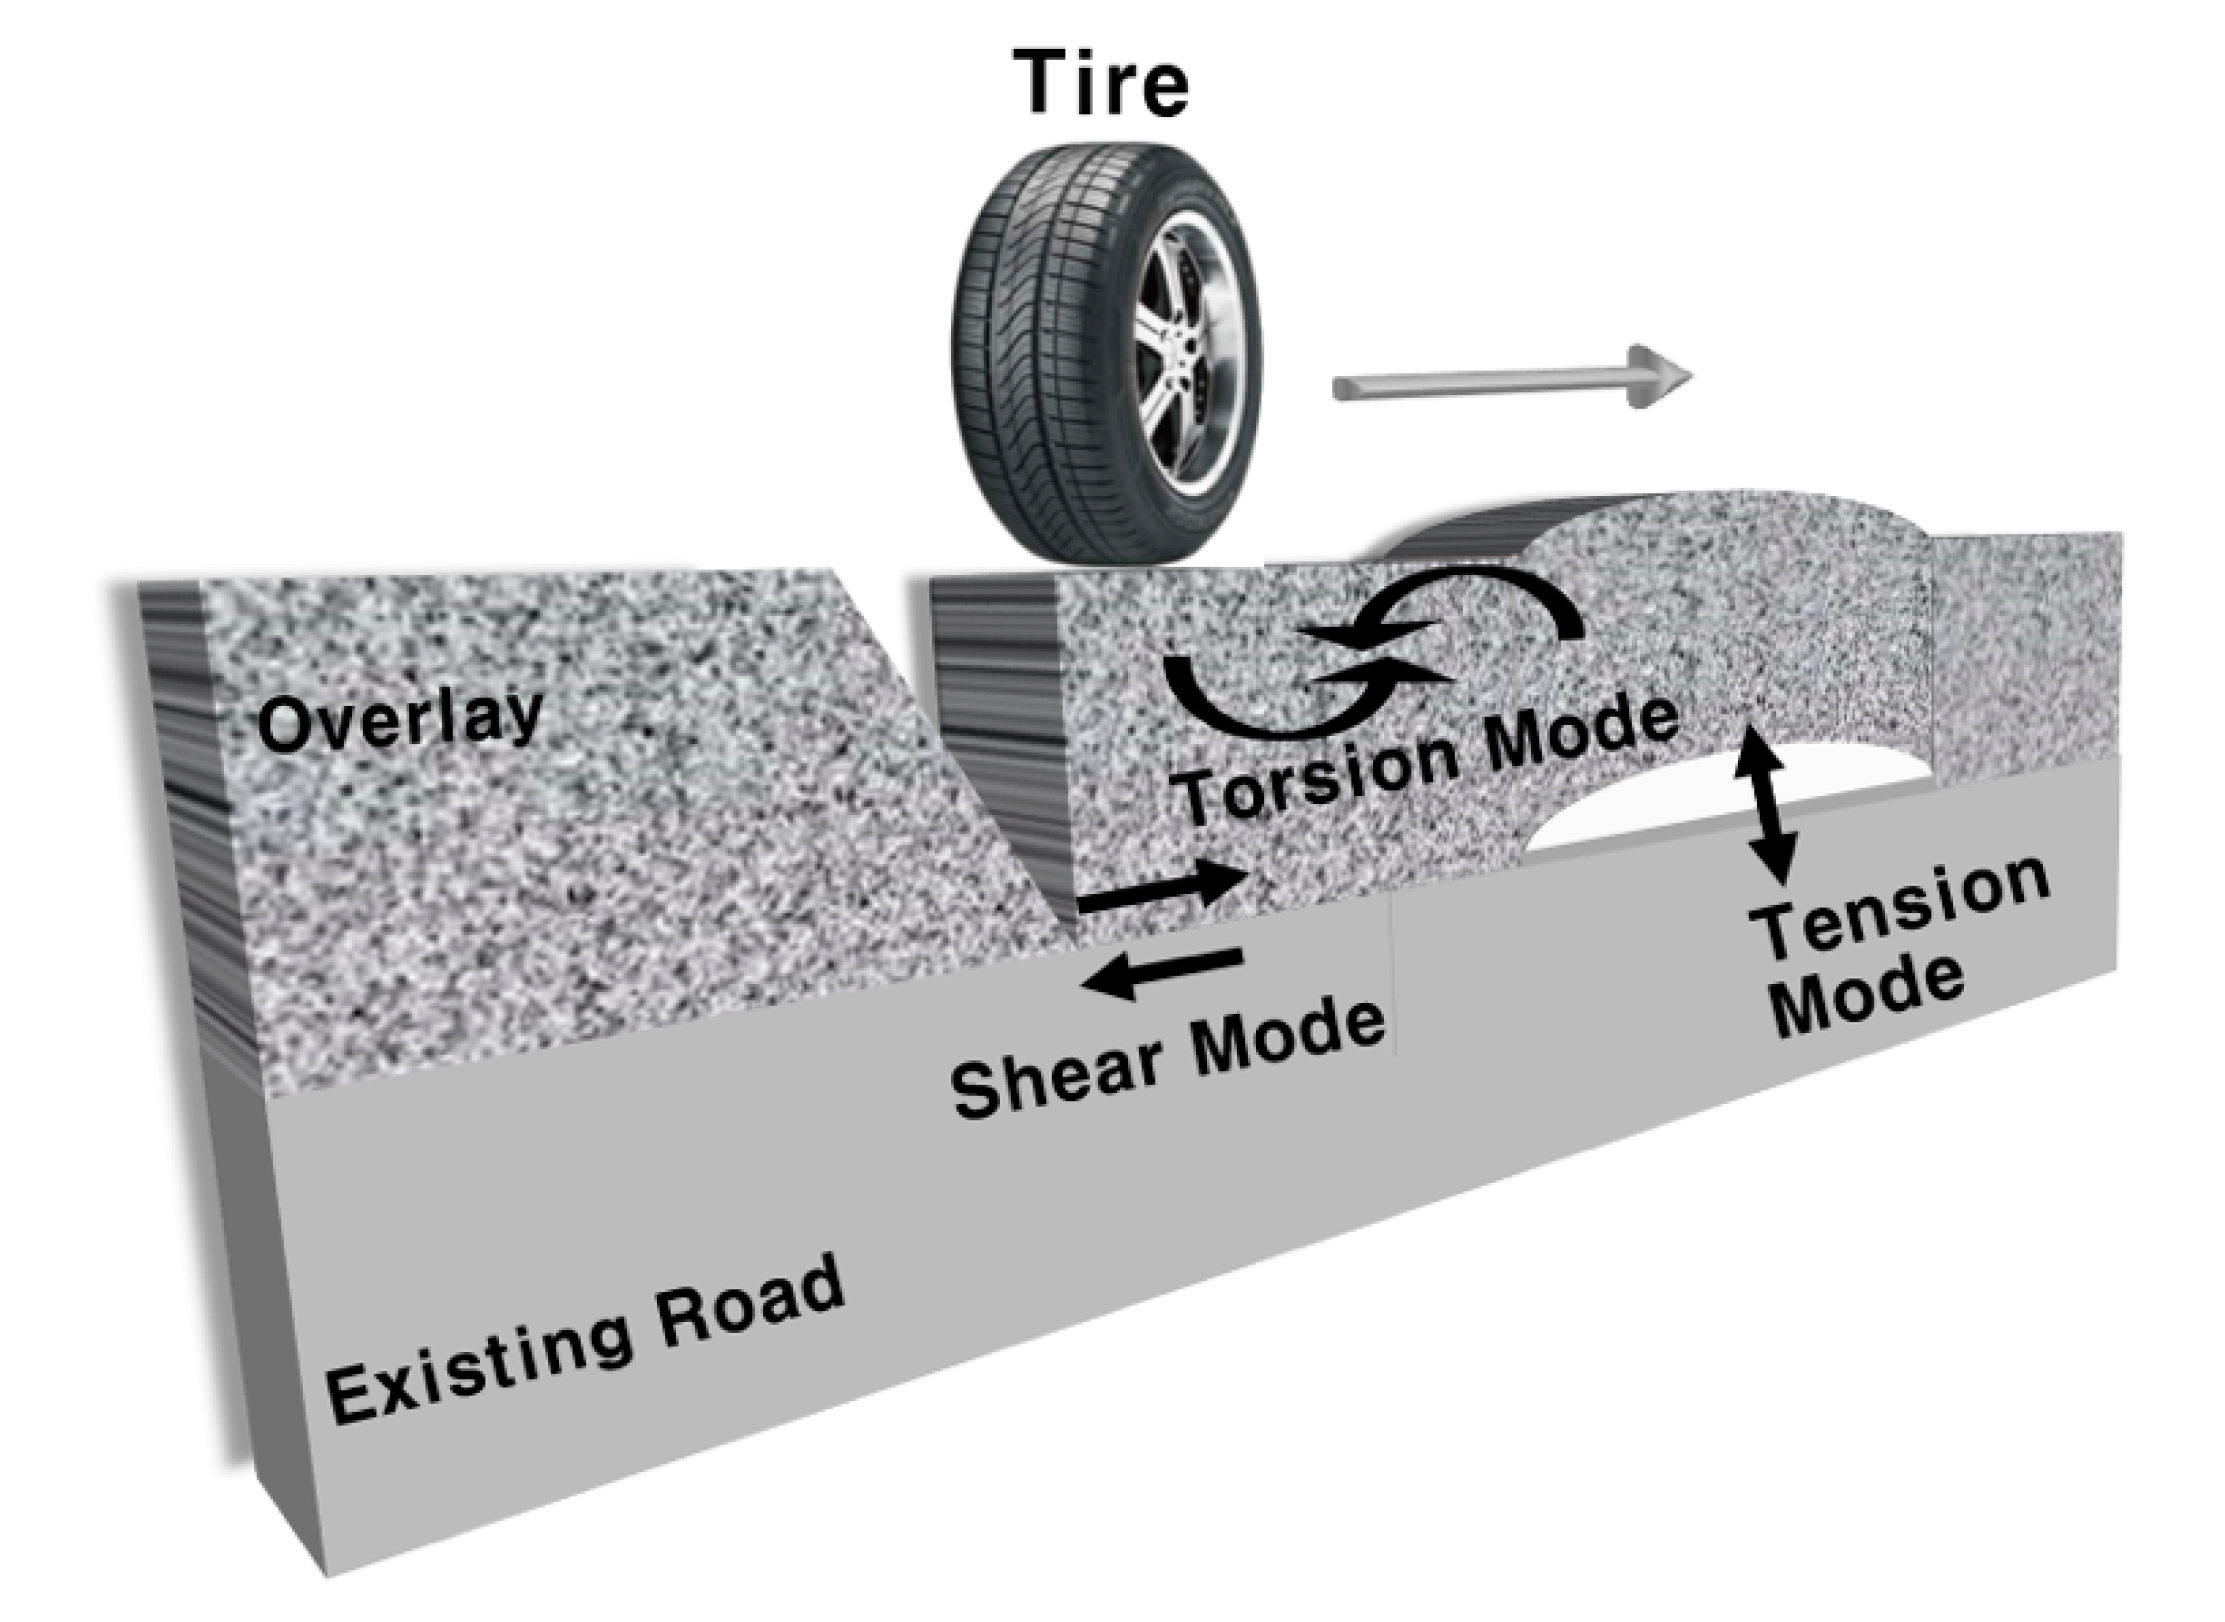
Tack coat can be applied in two different ways to improve adhesion between the upper and lower layers during pavement construction. During the maintenance of existing pavement, a tack coat is used to bond different pavement types when an overlay (with or without cutting) is applied to an existing surface. If the tack coat is inappropriately applied, the pavement interlayer may fail on the application of horizontal, vertical, and/or torsional forces, as shown in Figure 1.
Interlayer shear (slip) is generated via traffic acceleration and deceleration, while low-level shear is associated with tension. Torsion is applied when vehicles change direction. Thus, shear, tension, and torsional forces are repeatedly generated between the upper and lower layers (assuming that the lower layer behaves as a continuum). The upper and lower layers may separate if adhesion is inadequate. Tack coat-mediated adhesion is measured in various ways worldwide. The usual laboratory tests are the shear, pull-off, and torsional tests. The shear test applies shear force directly to the interlayer and measures slipping, as explained above. Shear tests include the Leutner shear test, the Louisiana Transportation Research Center (LTRC) direct shear test, the Florida direct shear test, the Ancona Shear Testing Research and Analysis (ASTRA) interface shear test, the National Center for Asphalt Technology (NCAT) shear test, and the Louisiana Interlayer Shear Strength Test (LISST). Tension tests apply vertical forces to the interfaces between upper and lower mixtures (Figure 1). Such tests include the Switzerland pull-off test, the University of Texas at El Paso (UTEP) pull-off test, and the Louisiana Tack Coat Quality Test (LTCQT) [6,7].
The torsion test presents torsional forces generated in different directions, mimicking the effect of tires turning on the pavement, the Texas Transportation Institute (TTI) torsional shear test is commonly used. In addition, site performance tests using digital signals from hammer impacts include the impulsive hammer test, the torque bond test (Highway Agency, UK), and the In-Situ Shear Stiffness Test (Carleton University, Canada) [8,9].
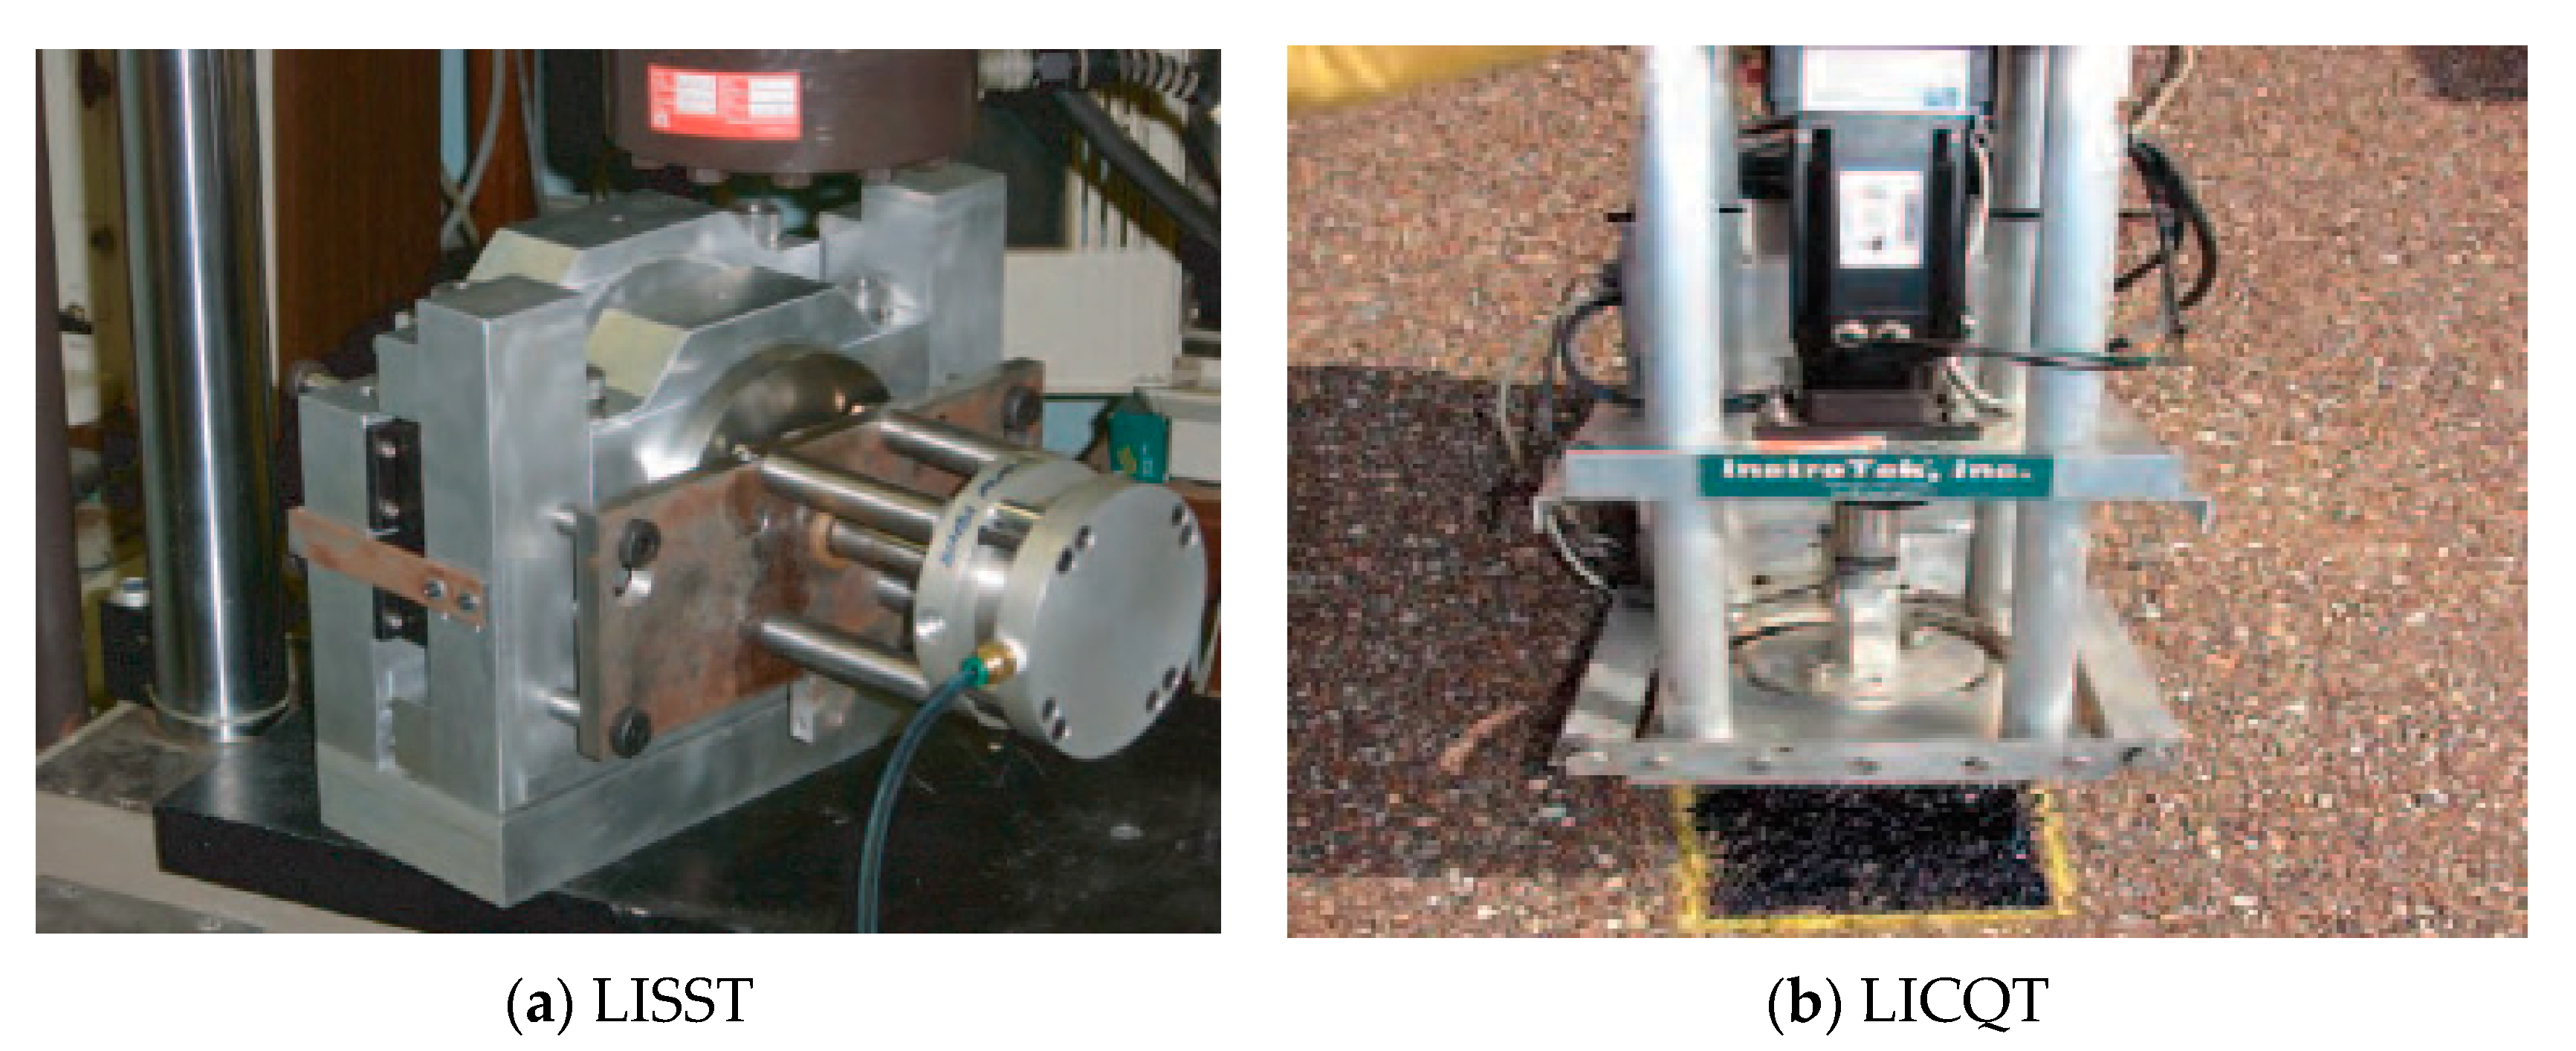
The test data vary, but all tests seek to evaluate tack coat adhesion performance. The effects of application rate and temperature on the behavioral characteristics (including loading) of viscoelastic materials were explored. LTCQT and LISST were used to evaluate interlayer bond strength in NCHRP Report 712, and an OAR was determined by calculating ISSs at various application rates rather than using a predictive model. The LTCQT and LISST platforms are shown in Figure 2 (NCHRP Report 712) [9]. We used an existing research approach and elements of existing equipment to develop a new machine, novel standards, and a predictive model reflecting construction conditions in South Korea.
3. Standards and Performance Tests for Tack Coat Applications
3.1. Design and Construction Standards
The pavement standard RS(C)-4 applies when tack coat is used to create or repair South Korean national roads and highways. The Practical Design Guideline for National Roads (Ministry of Land, Infrastructure, and Transportation (MOLIT); the principal guideline) indicates that tack coat RS(C)-4 is to be used at 0.3 L/m2 with a 3% excess. The National Road Construction Guide Specification states that RS(C)-4 tack coat must meet KDS M22-3 guidelines. The application temperature was chosen by the construction supervisor [10,11,12]. The spread rate should be 0.3–0.6 L/m2. Rapid-setting tack coat is generally preferred to reduce construction periods (curing is rapid in South Korea), but other countries prefer slow-setting materials. Other types of tack coat are approved under specific circumstances. For example, QRS-4 (a rapid-setting hard material) overcomes some shortcomings of RS(C)-4. In addition, a modified asphalt emulsion containing a rubber-based polymer (BD-Coat) was recently developed to improve flexibility and other characteristics [13]. However, as tack coat performance is affected by material type, application temperature, and application rate, standards are clearly required. Thus, we here evaluate the ISS of RS(C)-4, usually applied in South Korea, and compare it to that of BD-Coat admixed with HMA.
3.2. Performance Tests
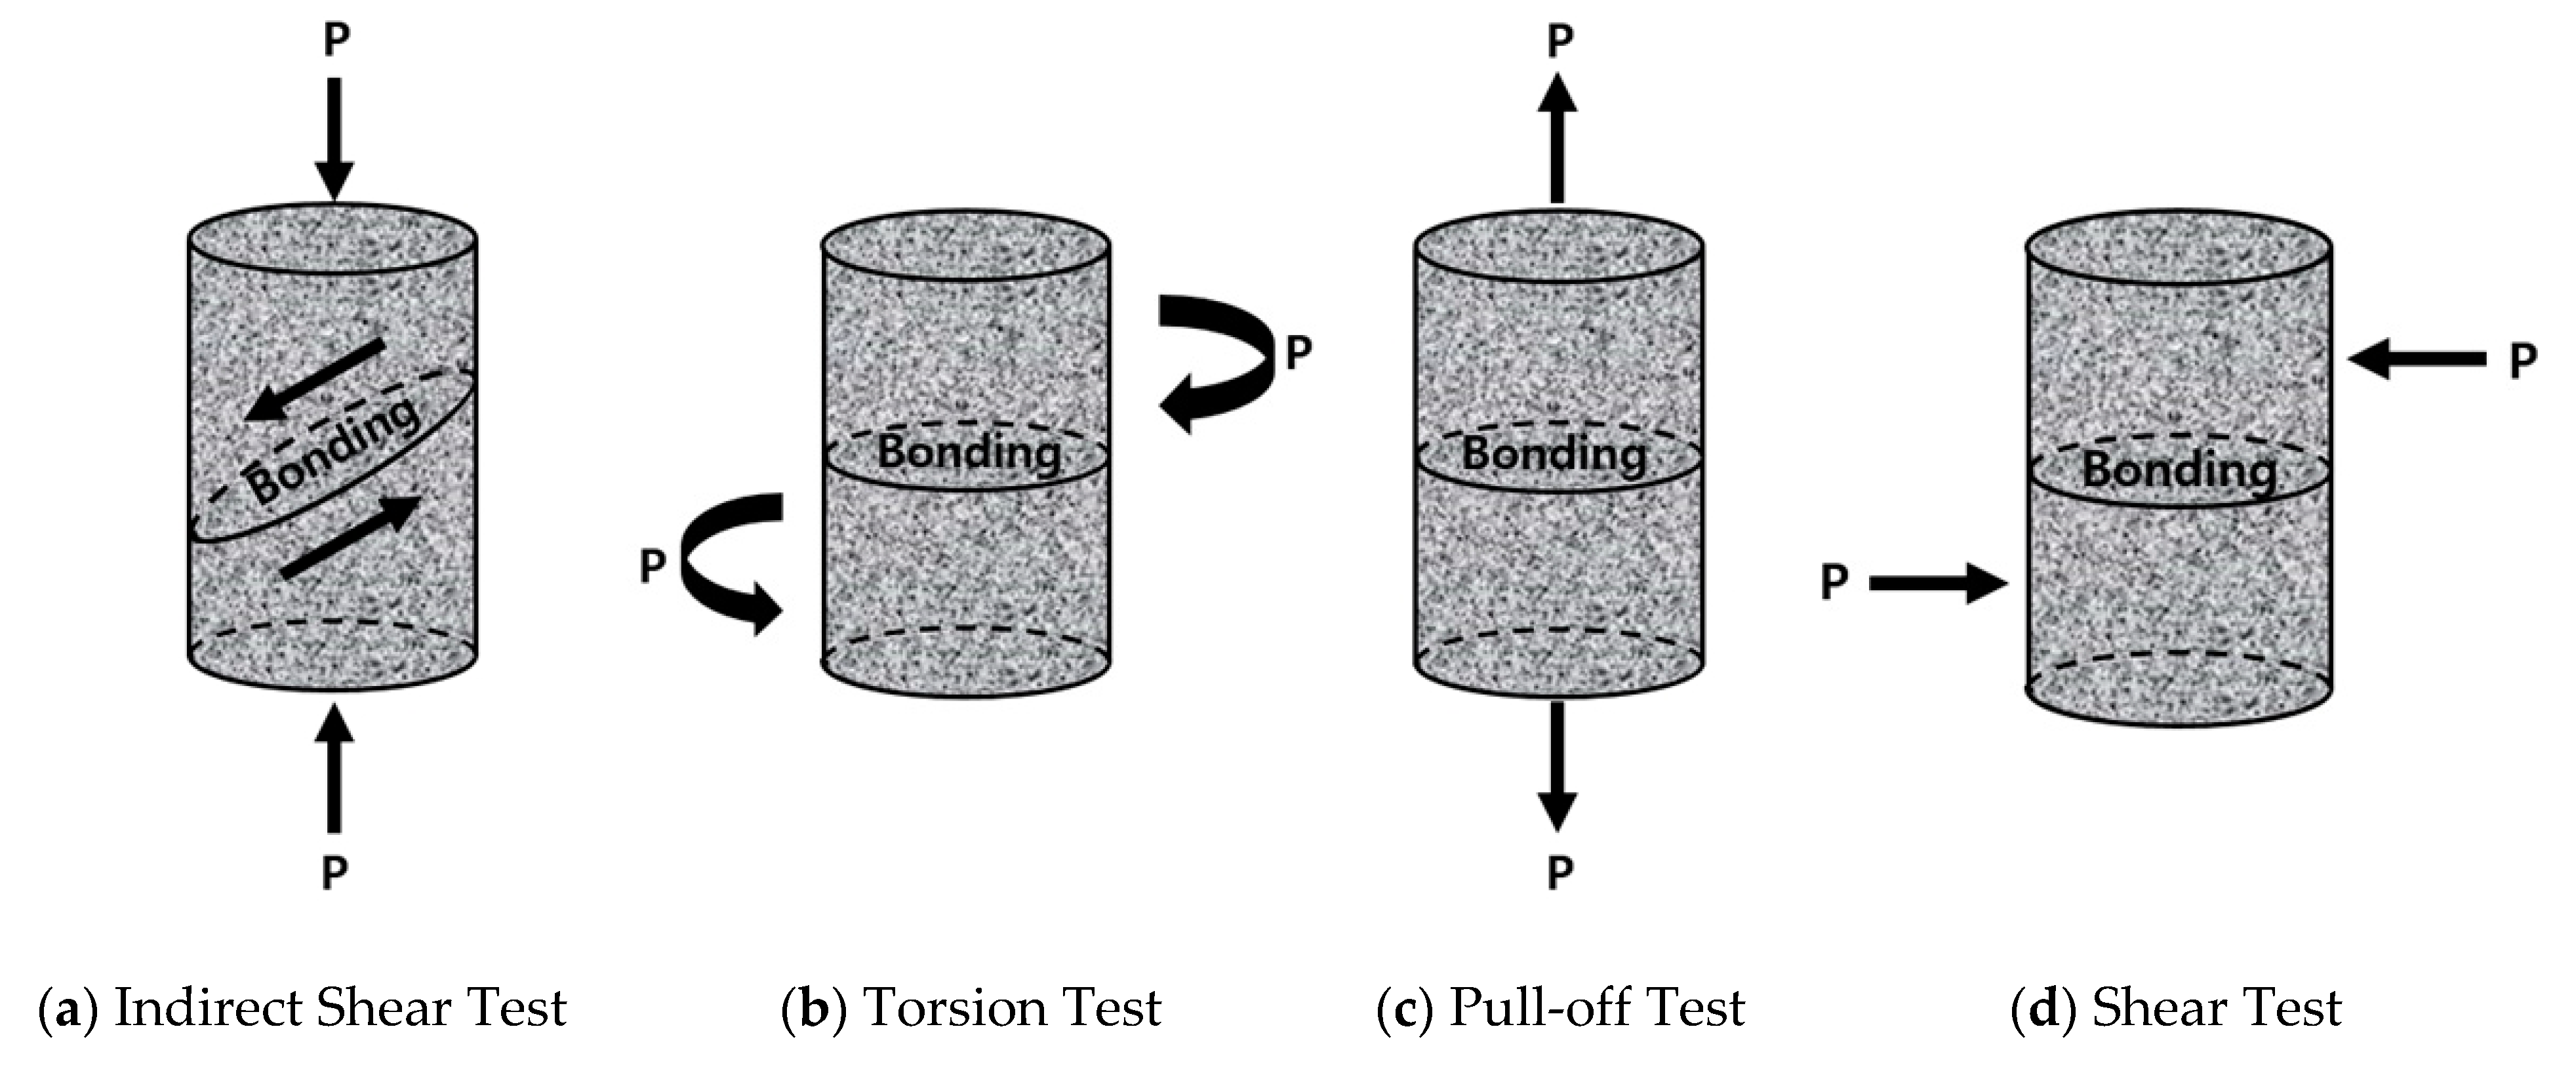
The adhesion, performance, and applications of tack coat have been studied in South Korea. The usual tests performed are the indirect shear test (IST), the pull-off test, the direct shear test, and the torsional test (Figure 3) [14,15,16,17,18,19]. These tests are similar to those mentioned above, but the IST (also known as the slant shear test) applies compressive forces to the molded specimens, and then the upper layers are paved. This test is easily performed using simple equipment, but specimens are difficult to prepare and cored specimens from construction sites were not evaluated.
Other tests have been used to develop application equipment and performance standards. Furthermore, efforts are underway to improve the performance of asphalt pavement. Low-noise, high-drainage asphalts created using performance grade (PG) 82-34 binders have recently received research attention, as have the tack coat modifications necessary for the use of such asphalts [19]. In general, because the OAR is taken to be that which affords the best performance, various application rates have been explored [7]. Because performance varies linearly over the application rate range, the optimum rate was determined using a second-order regression equation [20,21,22].
However, the linear prediction approach cannot predict the ISSs. The equation does not allow ISS prediction in the absence of an application or reveal how the ISS may affect performance. Here, we develop a model that more efficiently predicts OARs using new equipment. We also develop a test appropriate for South Korean conditions.
4. Performance Tester
As mentioned in Section 3, the ordinary tests can be only utilized to evaluate the simple performance objective of the research. Also, they cannot be continuously used because they have some weakness in bonding force evaluation, they cannot be used to perform the various application rate tests, and they need a specific mixture size. In comparison, the newly developed machine was not restrained by specimen size and was able to execute the tests for shear, tension, torsion, indirect tension, etc. The mechanical features listed below were considered when developing the ISS performance tester.
4.1. Mixture Size Variation
Marshall compaction mixtures are generally used in South Korea. However, mixtures produced by gyratory compactors have also been employed to prevent the destruction of asphalt aggregates by the impact of Marshall compactors. This process differs from roller compaction in that the aggregate is scattered and falls freely in impact compaction, as it does in a gyratory compactor. The Superpave (Superior Performing Asphalt Pavements) section of the Strategic Highway Research Program (SHRP) presents the required standards and method to be used when forming asphalt mixtures using gyratory compactors. Test mixtures produced to the MOLIT standards using Marshall compactors must be 10 cm in diameter and 7.5 cm in height. For gyratory compactors, mixtures must have the same diameter but must be 15 cm in height. Thus, new test equipment must accept all mixture sizes.
4.2. Implement Various Tests
As mentioned earlier, various tests evaluating adhesion characteristics were performed in South Korea (and elsewhere). The IST applied compression to a slanted interface, the tension test applied a vertical tension force, the torsion test applied torsional forces in different directions, and the direct shear test applied shear force to the interface, as shown in Figure 3. A new tester must perform all of these tests and various specimen size tests.
In order to account for varying load conditions, it is essential to mimic actual traffic loads, and the tester must apply both cyclic and static loads to the maximum values.
4.3. Error Minimization
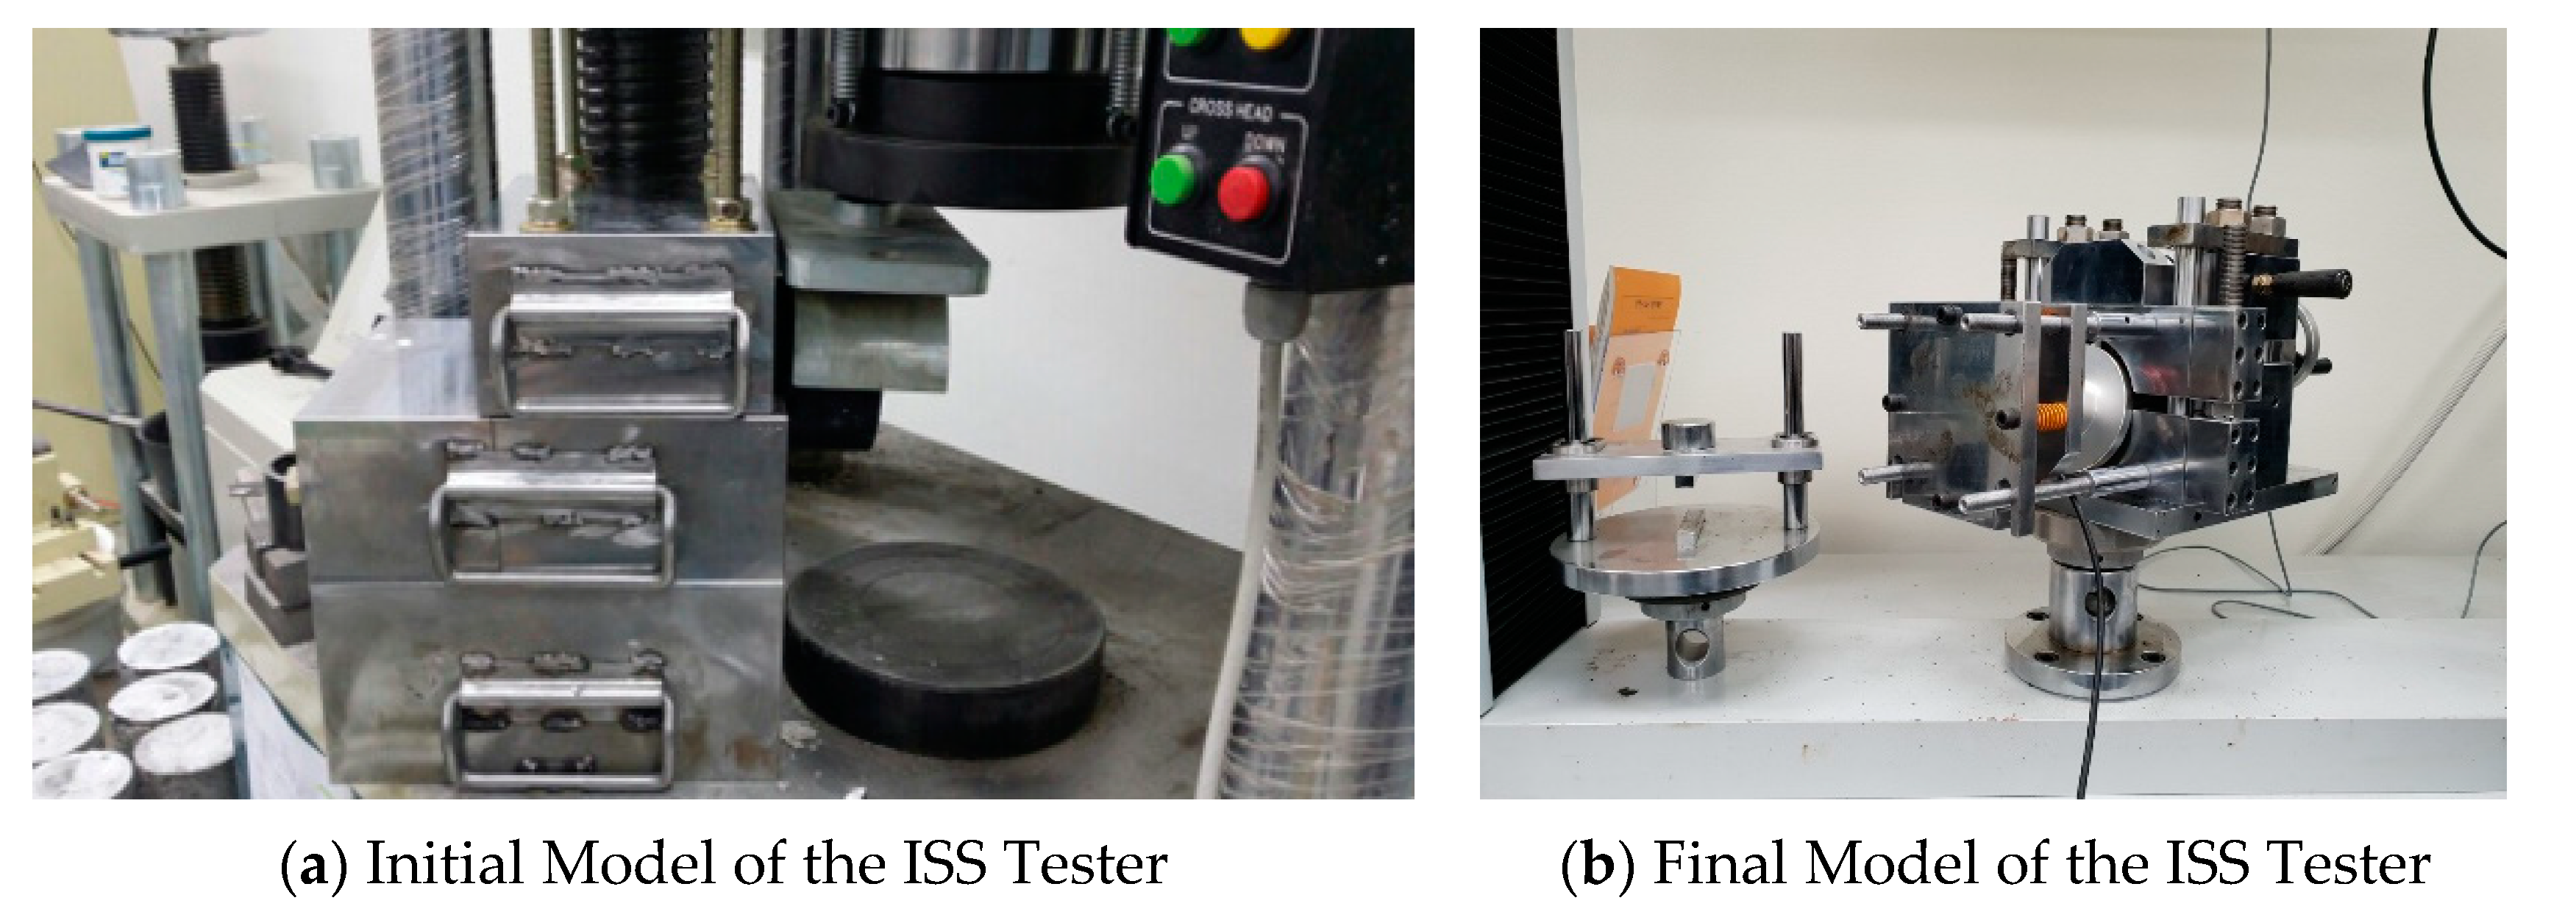
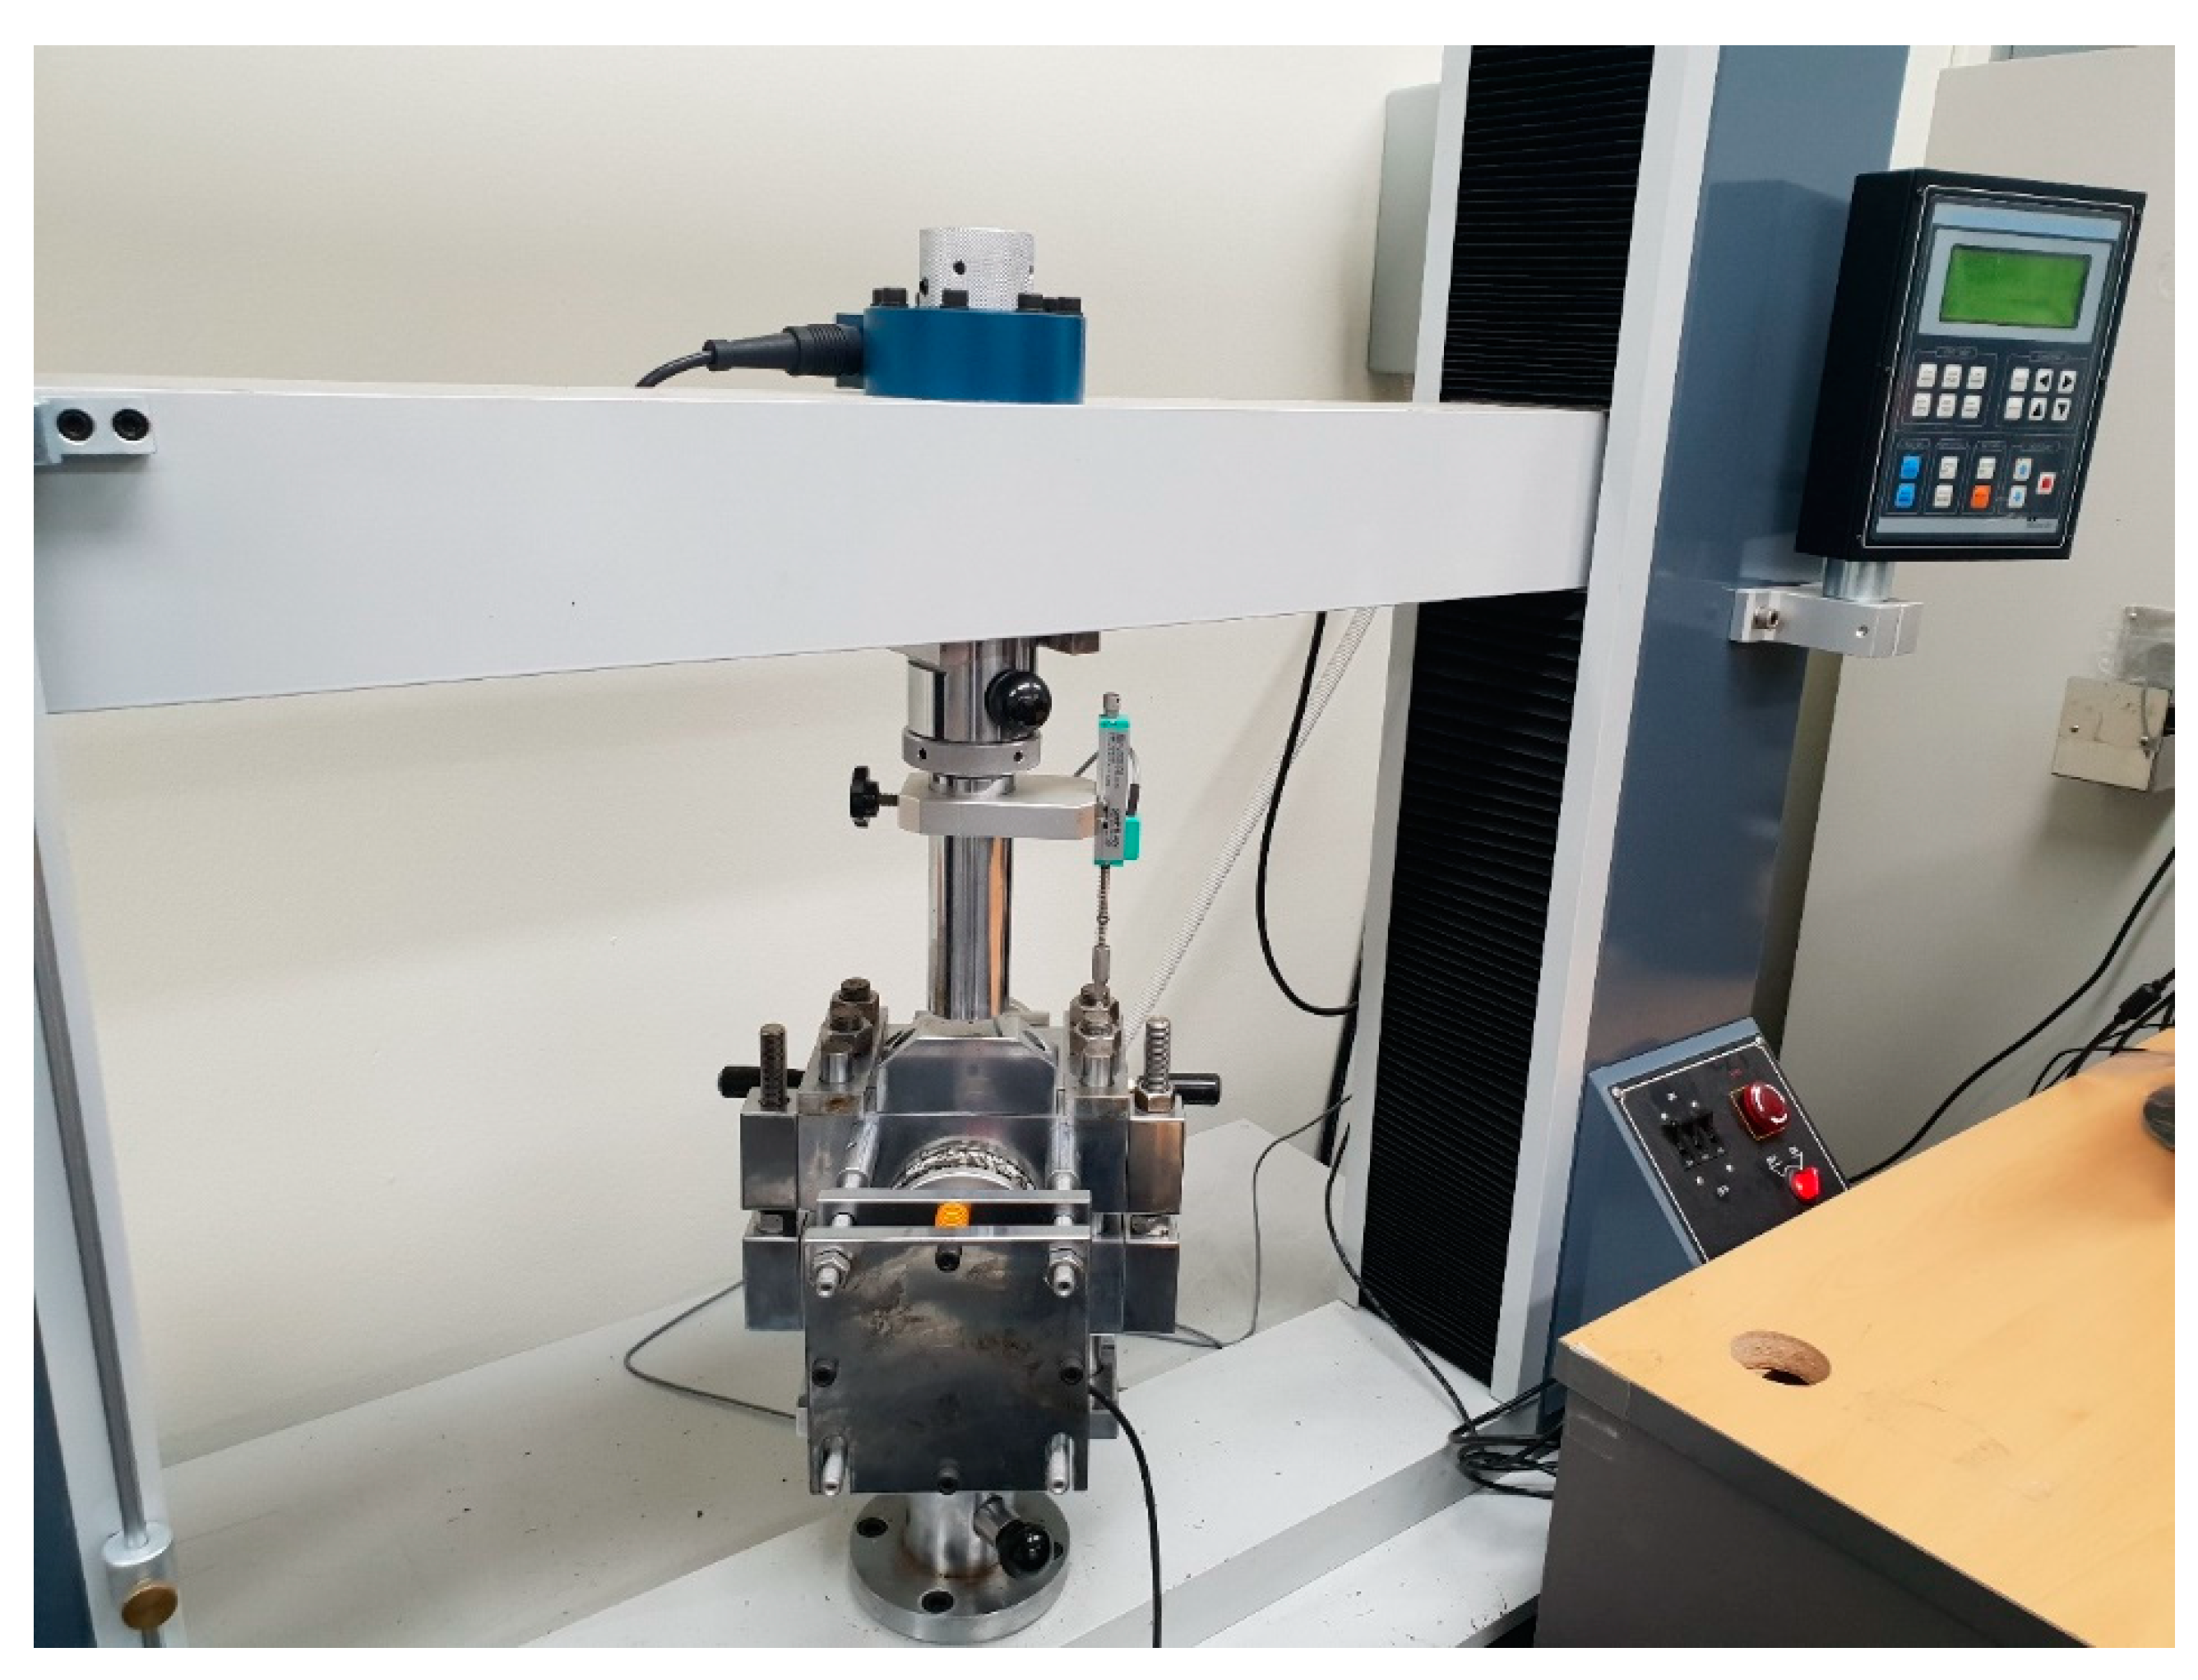
Presently, linear variable differential transformers (LVDTs) attached to load cells are used to measure displacement. However, LVDTs hard-wired to the test equipment yield erroneous data because of the displacement differences between the equipment and the mixtures. Thus, we attached LVDTs directly to mixtures, to more accurately define displacement–stress relationships. Older equipment and the new performance tester are shown in Figure 4. The results in Figure 5 were obtained using the new ISS tester, an LVDT, and a load cell. The ISS could be determined from the maximum shear stress. The fracture energy is shown in Figure 5. The ISS and fracture energy were calculated using Equation (1a,b):
where, , , and A are the ISS, the maximum load, and the interface area, respectively. In Equation (1b), E, , usp, cfp, and ult are the fracture energy, shear force-deformation function, initial point, complete fracture end-point, and fracture start point, respectively.
5. ISS Test
We formed asphalt mixtures to explore how porosity affected adhesion characteristics and developed a model predicting the optimal tack coat application rates. The mixtures were subjected to ISS testing and the displacement–load relationships were obtained. In another study, a layer shear test according to the German ALP A-StB specifications which shows adhesion as the shear strength in kN between BBTM (The thin asphalt layers used in Latvia) and the lower layer of asphalt concrete, noted that the adhesion of the interlayers was affected by tensile stresses resulting from the cyclic loading of heavy transport loads [23,24]. Due to the cyclical nature of transport, it would be good to note the possibility of further developing this test or model in order to simulate real conditions as much as possible. However, this study focused only on the non-cyclic loading shear strength.
5.1. Mixture Construction
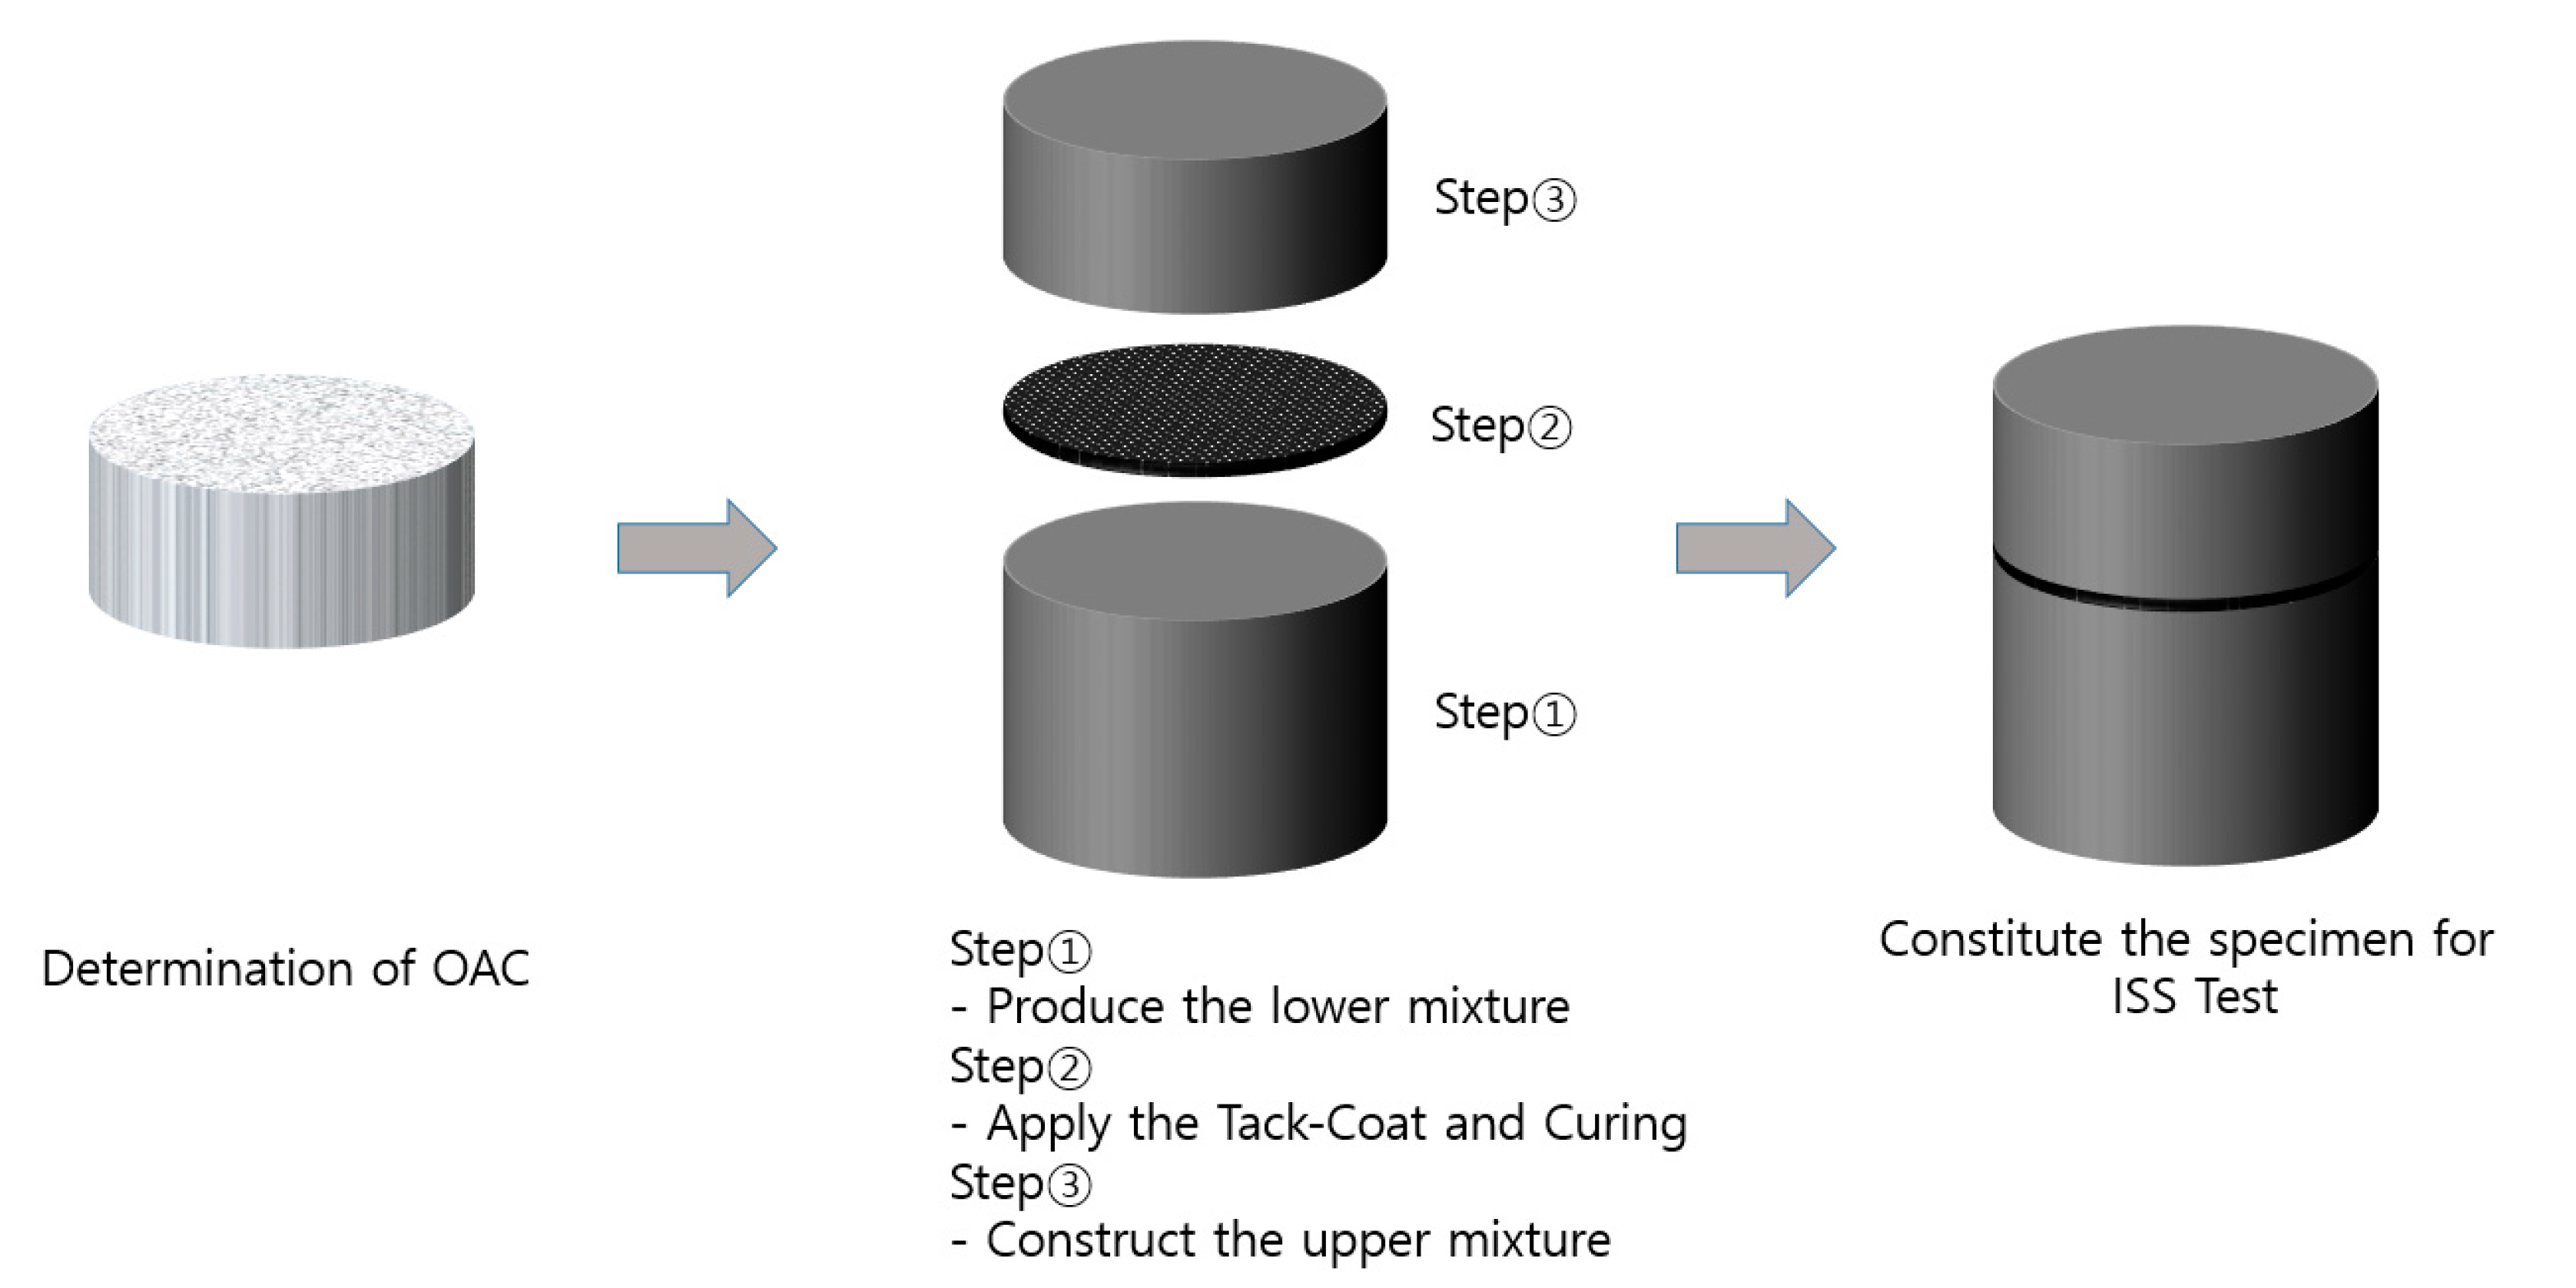
The mixtures used were all HMAs varying in porosity, bonded with different proportions of tack coat. All were produced via gyratory compaction to mimic real pavement conditions and to minimize the aggregate damage caused by Marshall compaction (Figure 6). Tack coat was paved onto the interface between the upper and lower mixtures constructed, referencing the optimum asphalt content (OAC). We ensured that the surface of the lower mixture was very smooth.
The upper layer was added after the tack coat had cured for about 1 h to avoid allowing the tack coat to penetrate the porous upper layer, following Korea Expressway Corporation standards. Porosities ranging from 3 to 7% were required to evaluate the performance of the tack coats. Tack coats RS(C)-4, BD-Coat, QRS-4, and AP-3 were applied. The porosity effects were principally explored after the application of RS(C)-4 and BD-Coat. The application rates were those of the South Korean standards, as informed by recent research (0.3 L/m2 in the Practical Design Guideline for National Roads; 0.3–0.6 L/m2 in the Expressway Construction Guide Specification and the National Road Construction Guide Specification). The recommended application rate for old pavement was 0.055 gallons per square yard (gsy) (Table 1) [7]. Thus, our minimum, median, and maximum application rates were 0.3, 0.45, and 0.8 L/m2, respectively, with a generous margin. Application rates of 0.24, 0.36, and 0.48 L/m2 were used to evaluate the porosity effects of old asphalt pavement. Three samples each of RS(C)-4, BD-Coat, QRS-4, and AP-3 were prepared, and application rates of 0.24, 0.3, 0.36, 0.45, 0.48, 0.6, and 0.8 L/m2 were used to evaluate the RS(C) and BD-Coat tack coats. Application rates of 0.3, 0.45, 0.6, and 0.8 L/m2 were used to evaluate the QRS-4 and AP-3 tack coats.
5.2. ISS Results
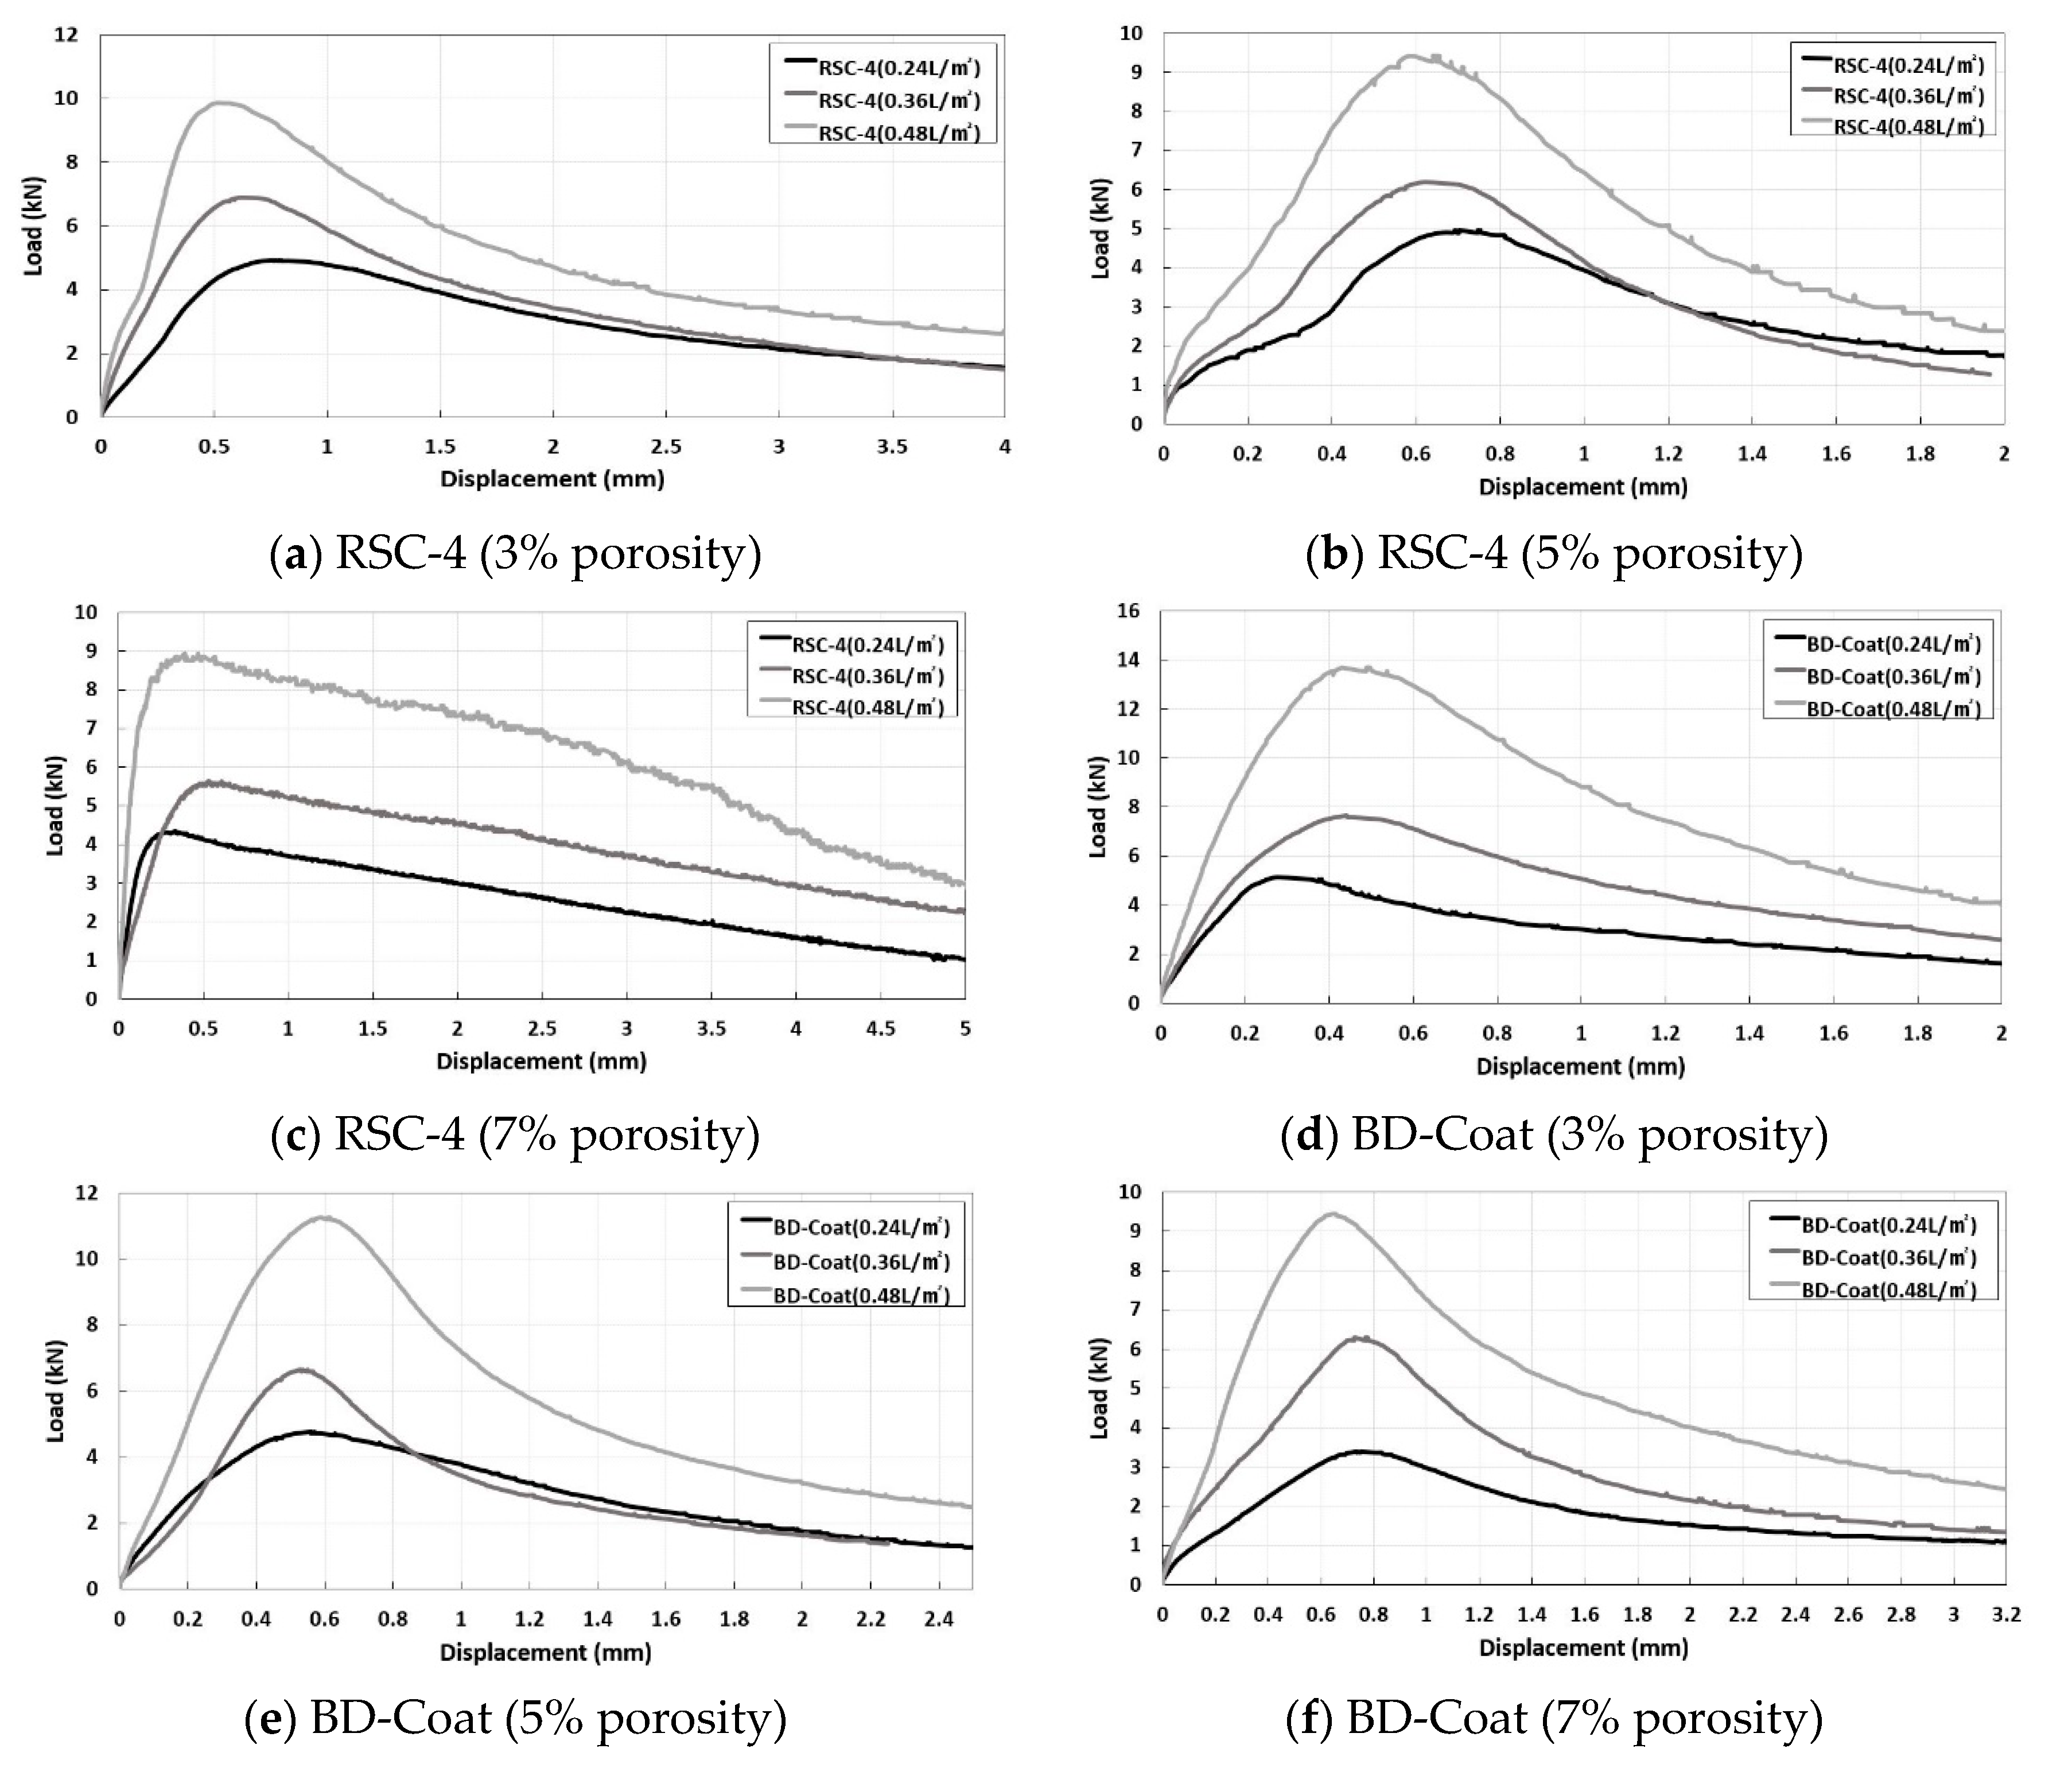
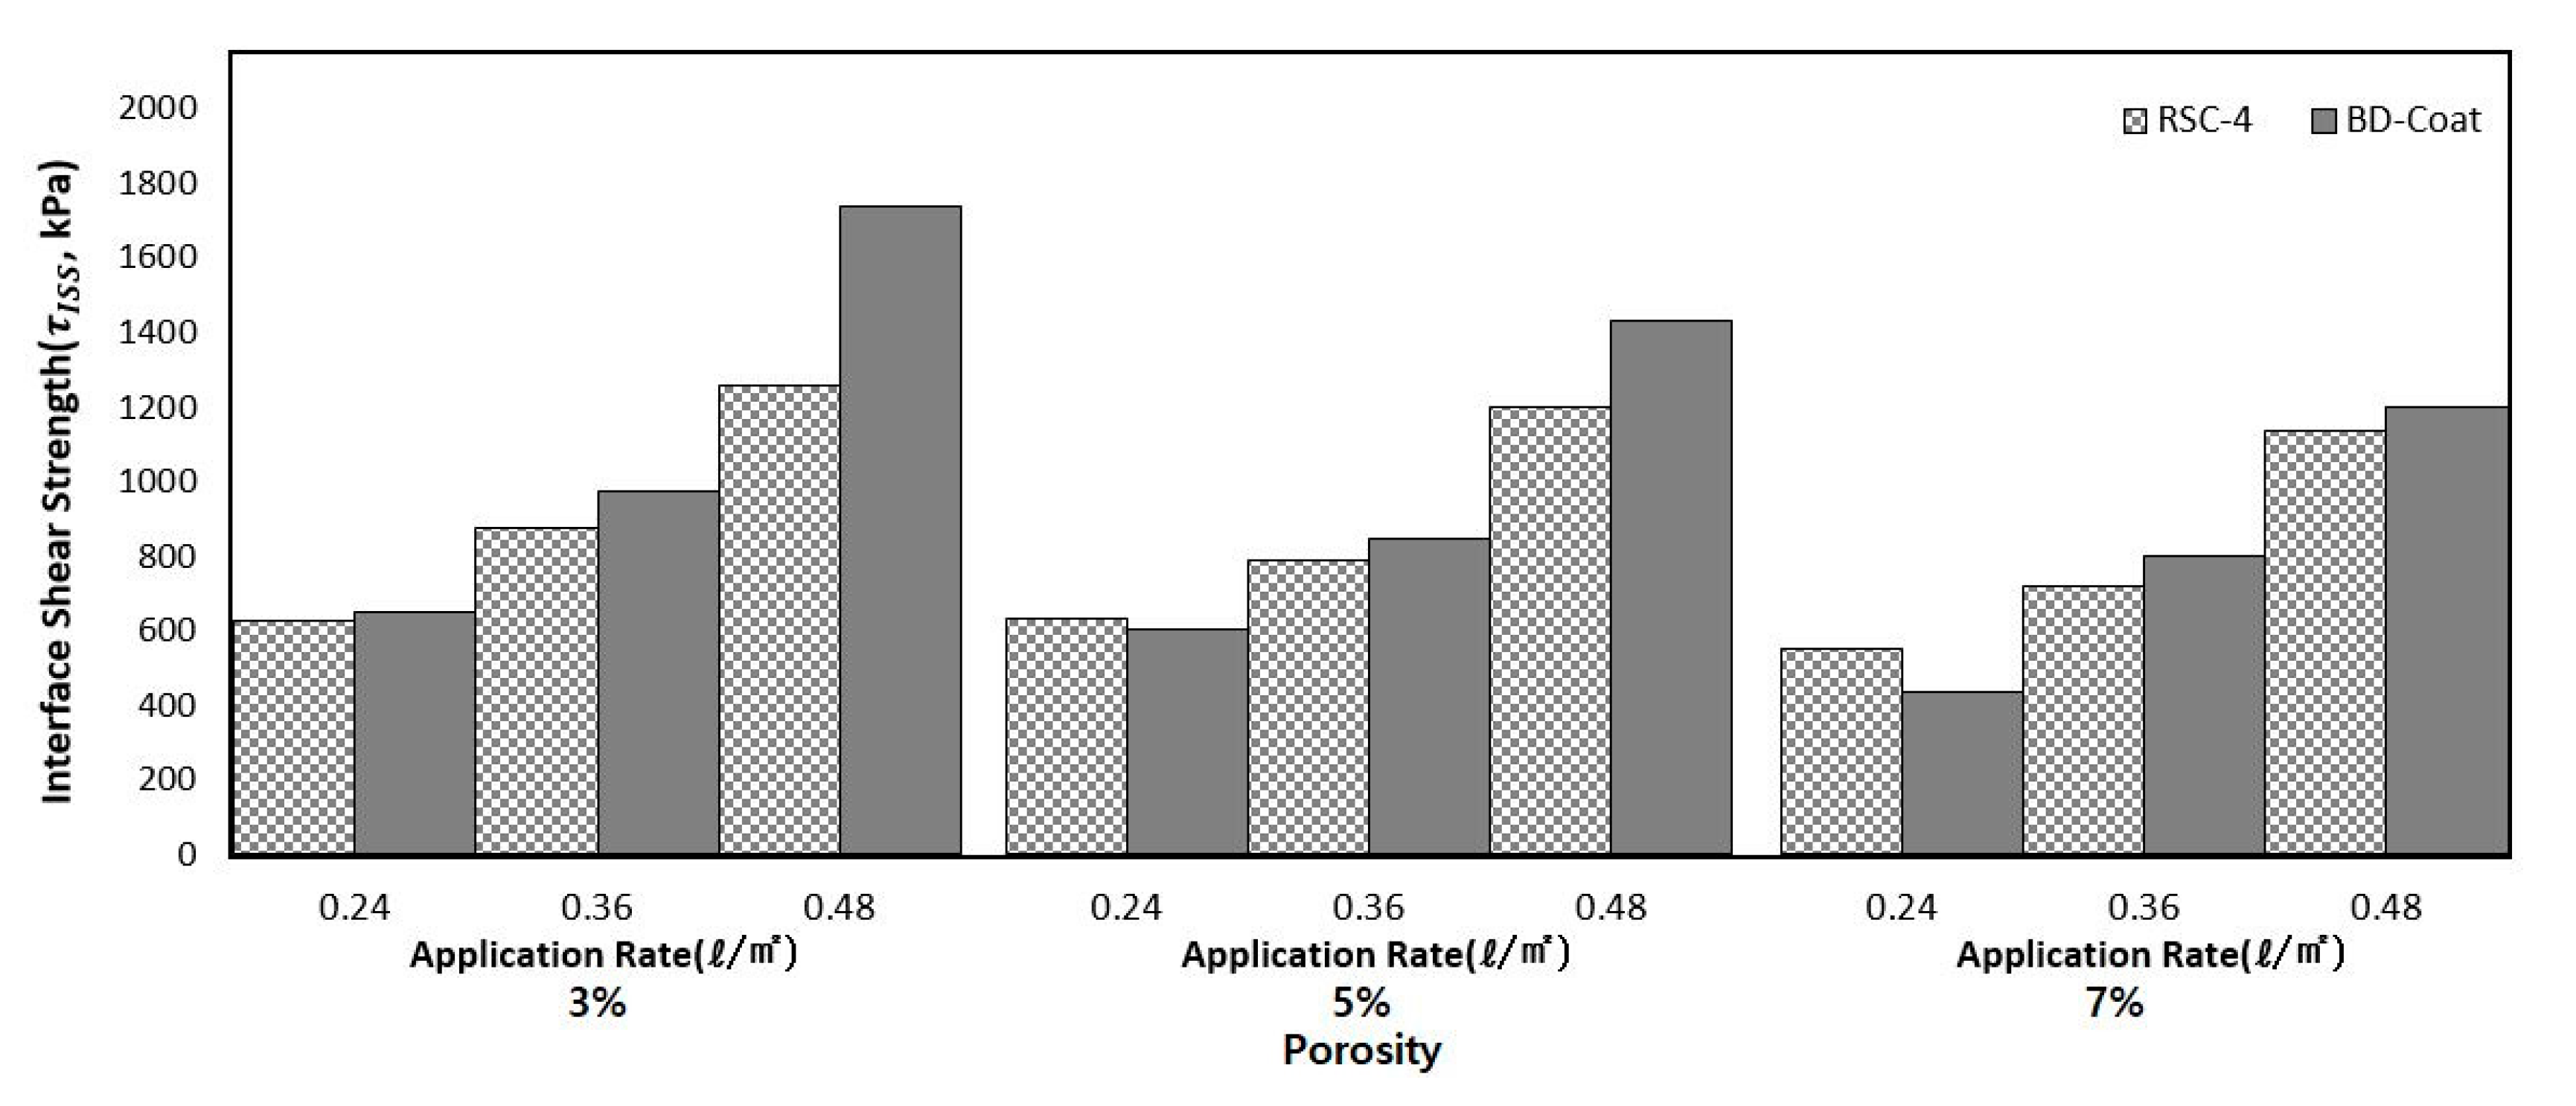
The ISS test specimens were 10 cm in diameter and 15 cm in height. The interface was placed 10 cm from the bottom of the lower layer. Thus, the 10 cm section under the interface was constrained, and the section above the interface loaded to destruction (Figure 7). Specimens coated with RS(C)-4 or BD-Coat were used to evaluate the effects of porosity. We measured the ultimate shear stresses using displacement–load curves (Figure 8 and Equation (1a)). The data are shown in Table 2 and Figure 9. BD-Coat afforded better adhesion than RS(C)-4 at an application rate of 0.24 L/m2, except at porosities of 5 and 7%. The greater the porosity, the lower the ISS determined using Equation (2):
where, , and K are the ISS, the interlayer displacement within the interface, and the interlayer tangential modulus, respectively. We determined the optimal tack coat application rates by evaluating ISSs. We also used application rates of 0.3, 0.45, 0.6, and 0.8 L/m2 (Table 3).
6. The Predictive Model
We developed a new predictive model and compared it with existing approaches, based on the following procedure.
6.1. Previous Research
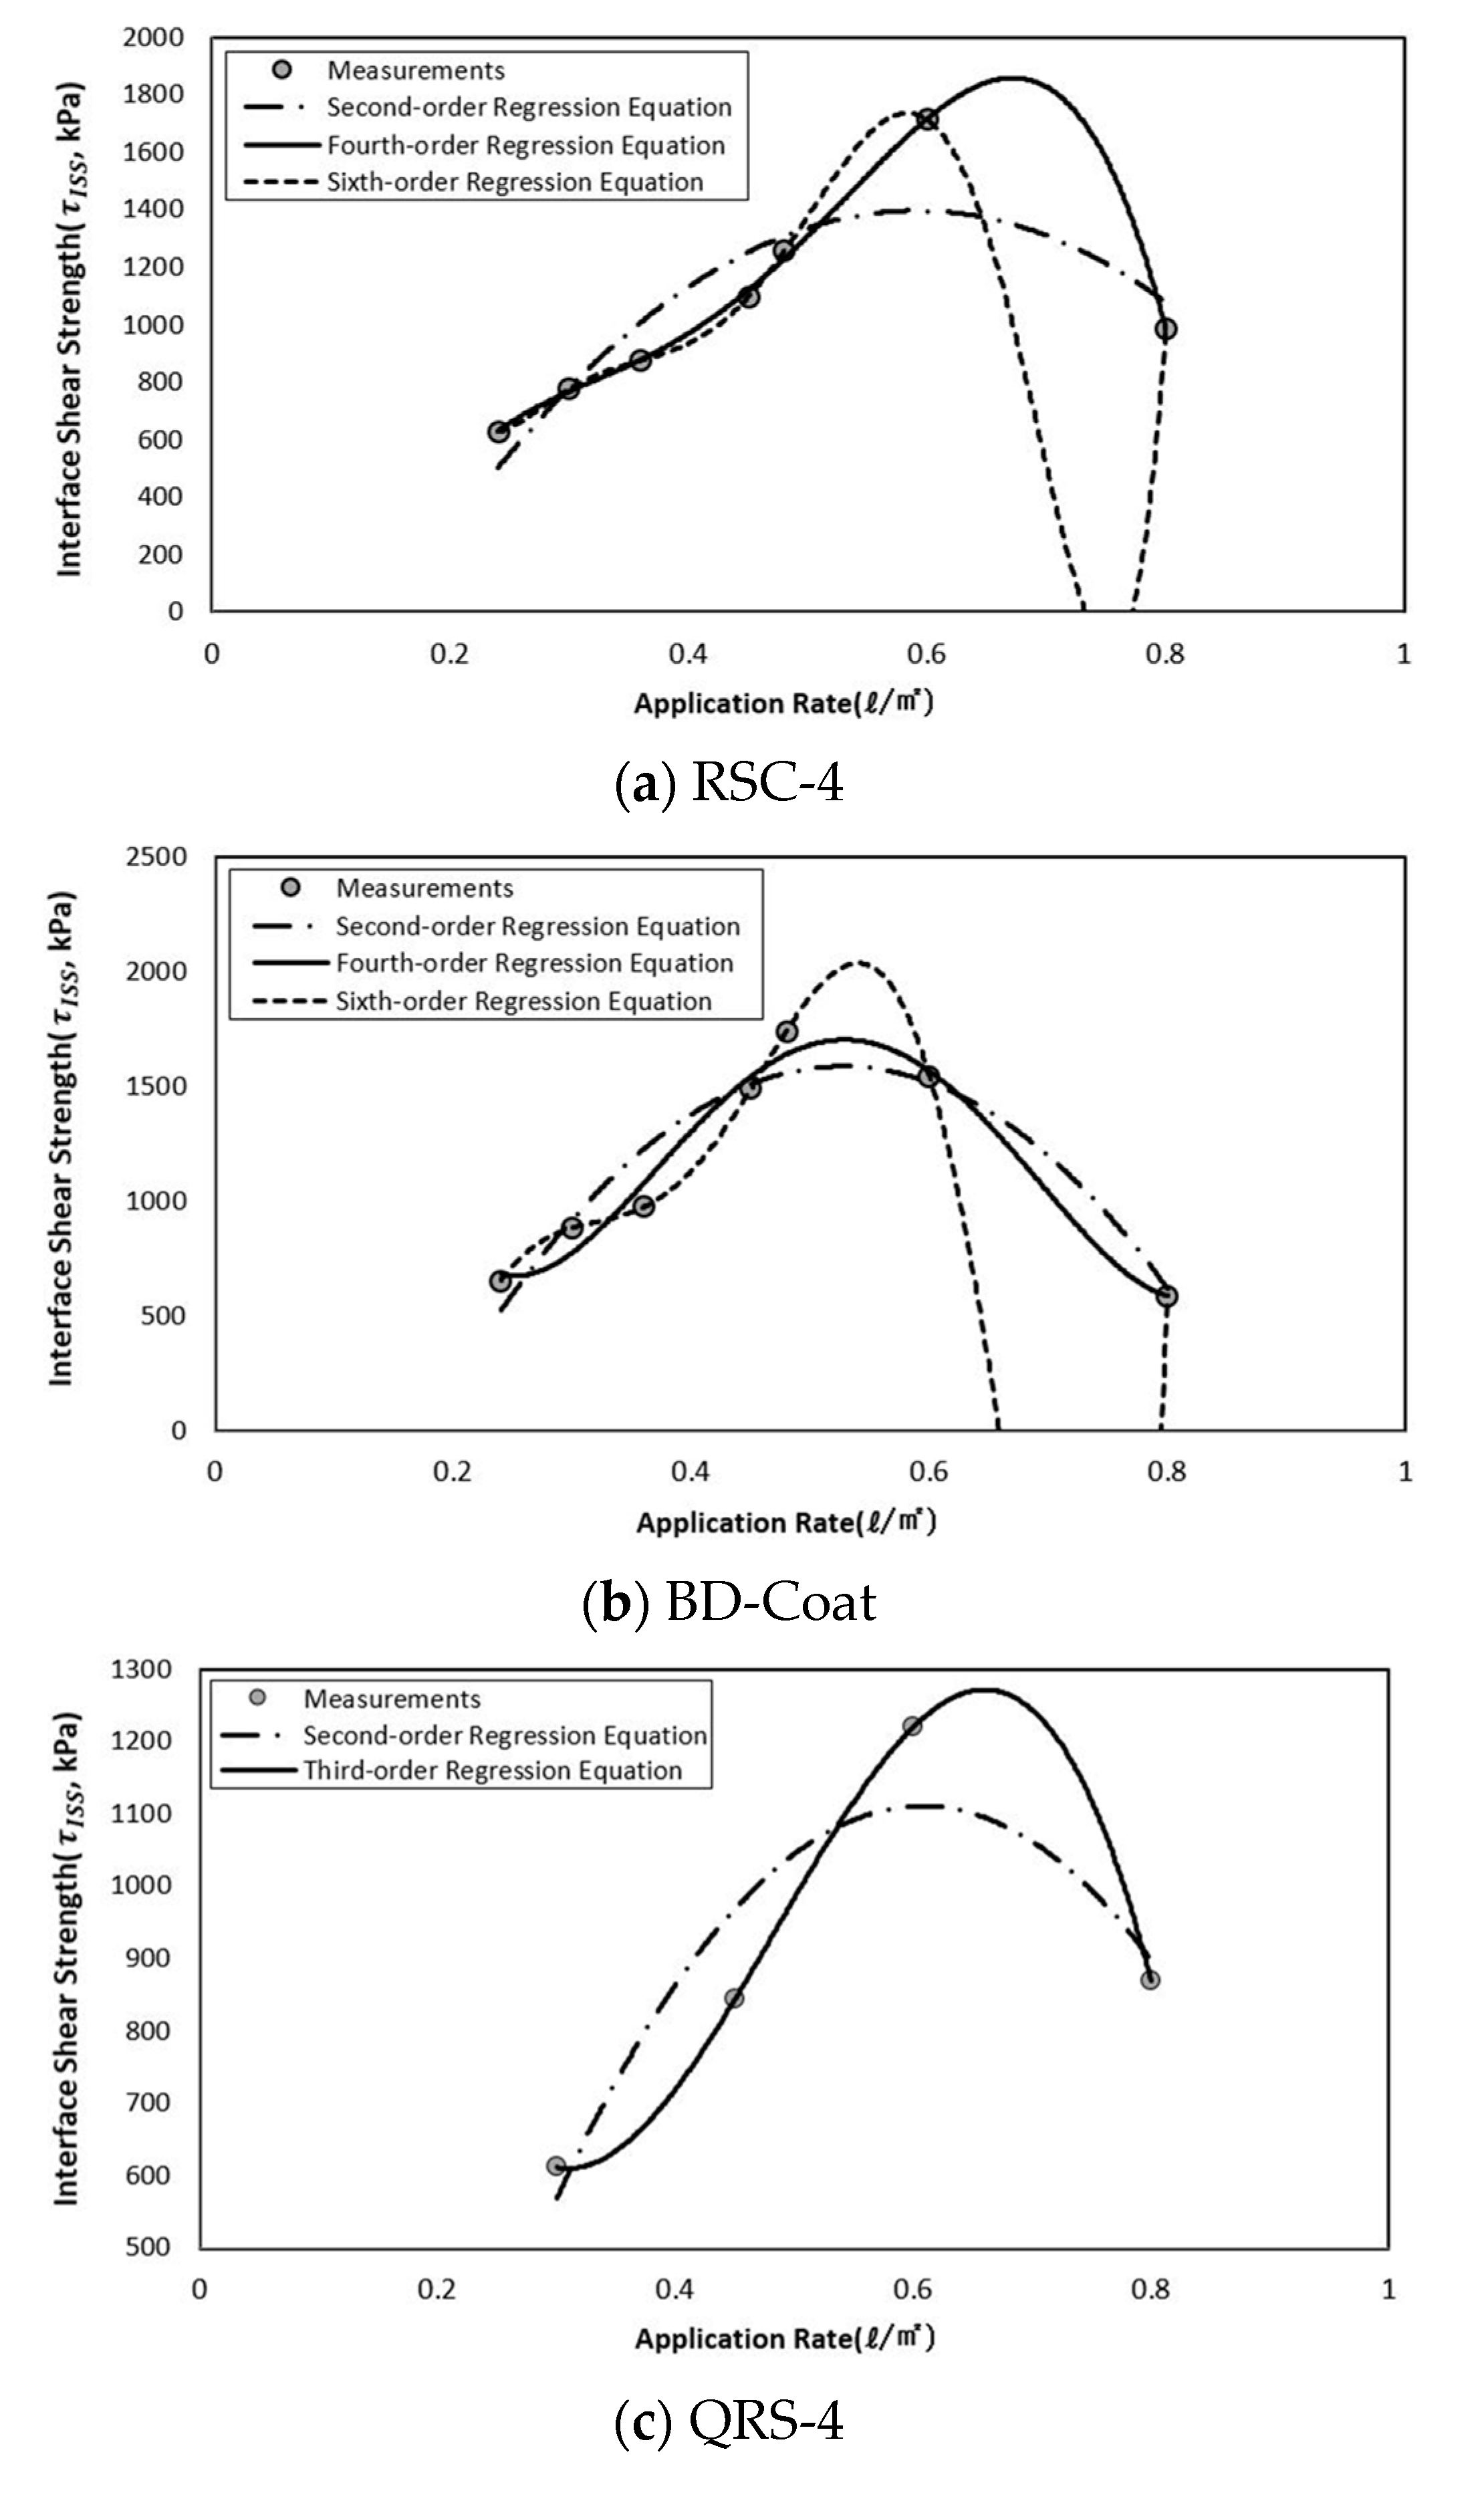
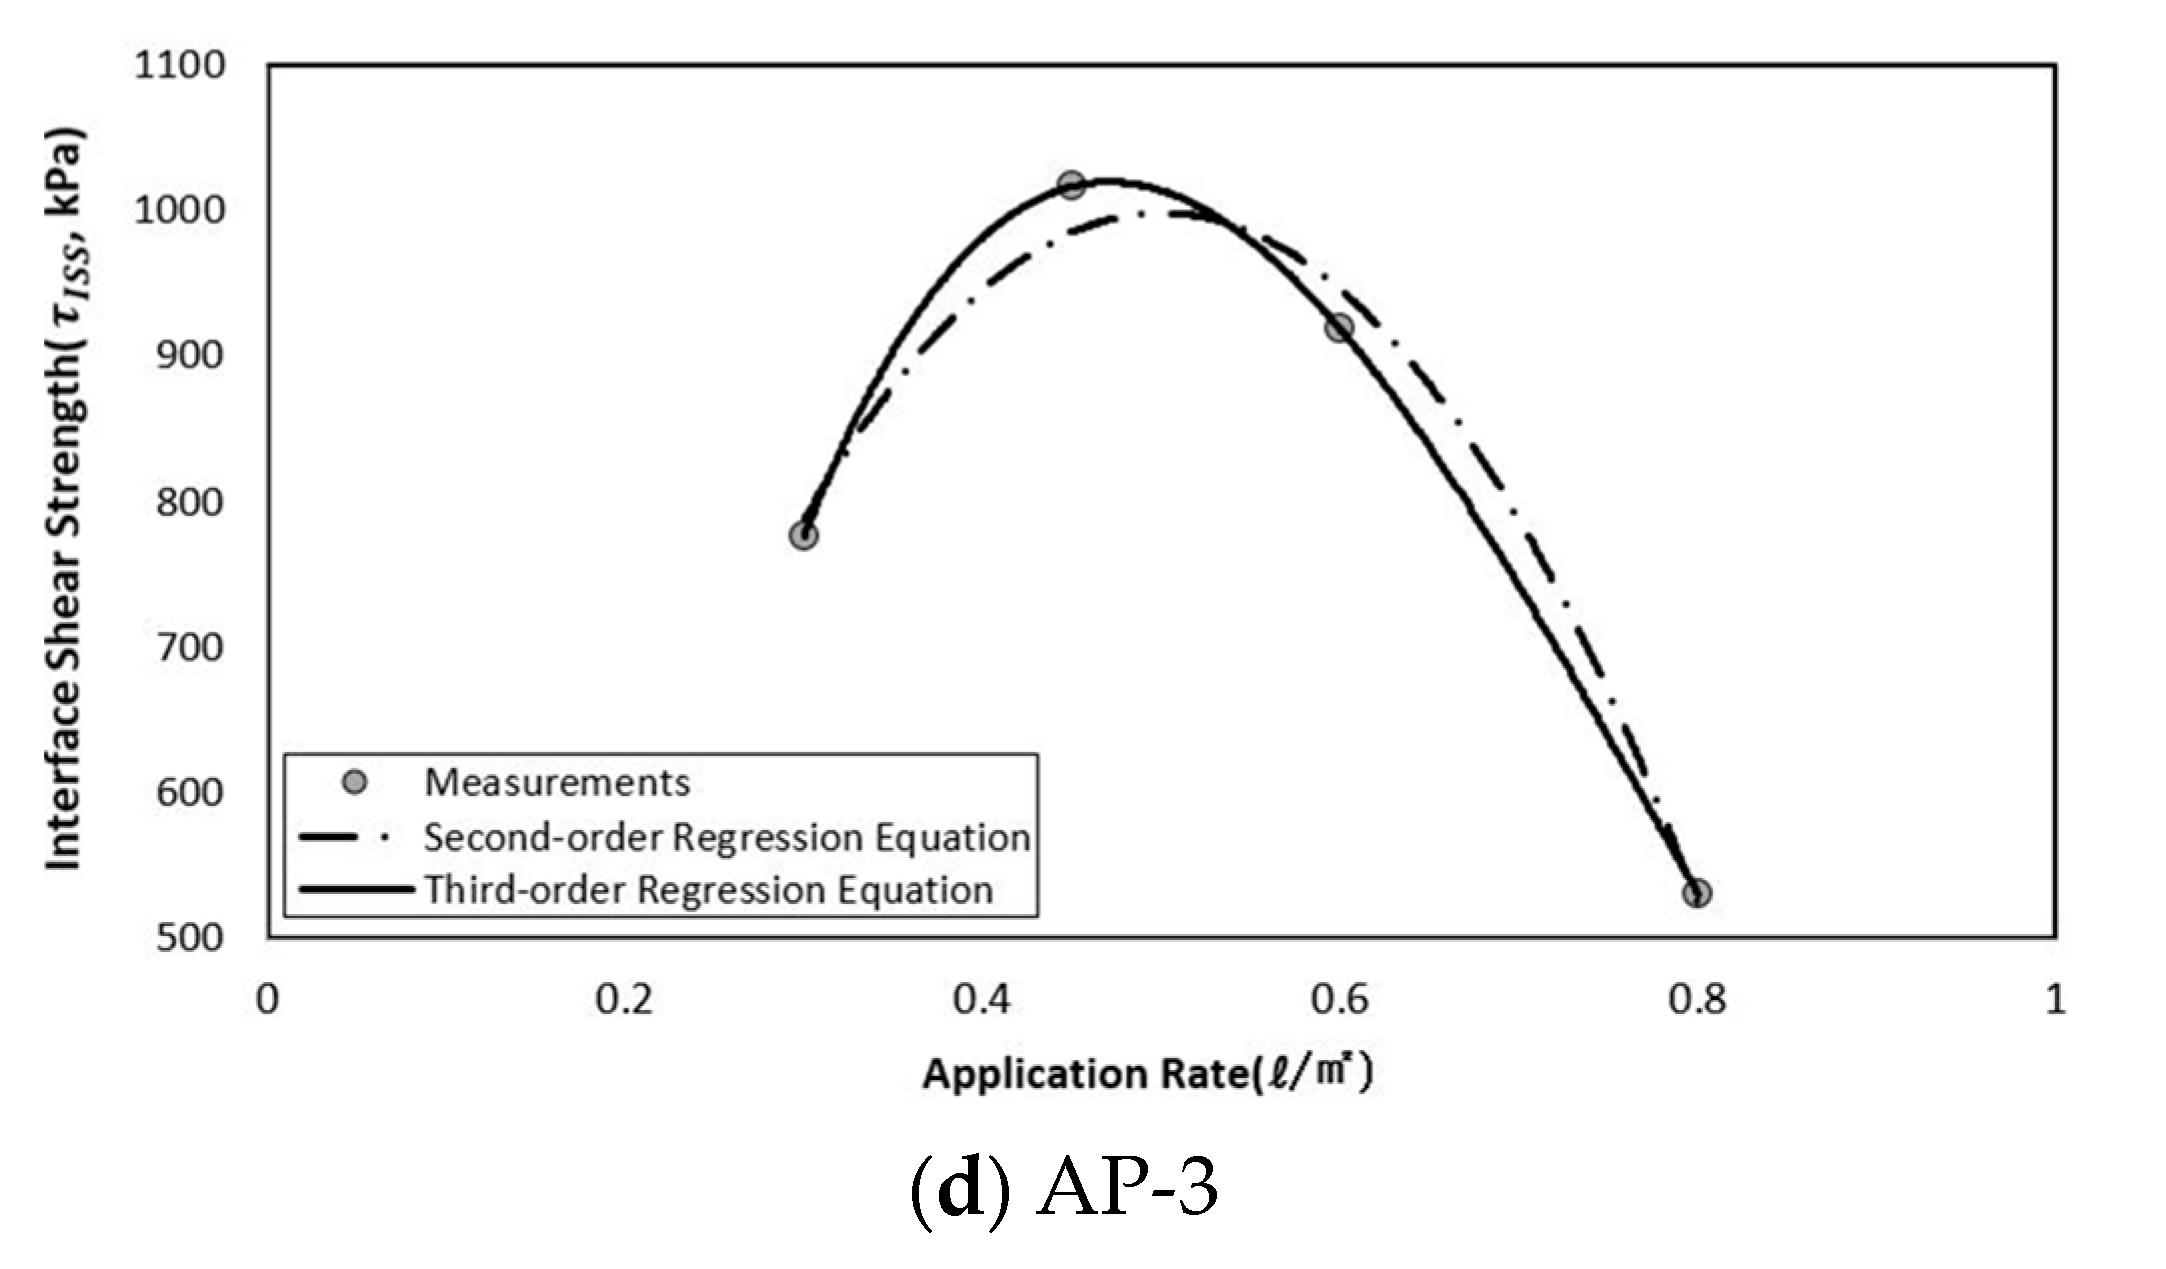
Earlier, regression analysis was used to define the relationship between tack coat application rates and shear stress. OARs were determined using a range-confined, second-order, polynomial regression equation [20], or a fourth-order polynomial regression equation constructed from the ISS test data [17]. A sixth-order polynomial regression equation was used to evaluate the fracture energy [18]. The regression approach can be written as Equation (3):
where , AP and are the ISS, the application rate, and a regression constant, respectively. We used regression analysis to determine optimum tack coat application rates and predict the associated ISSs. We constructed second-, fourth-, and sixth-order polynomial regression equations using the ISS test data obtained when evaluating the effects of porosity on the RSC-4 and BD-Coat layers. Second- and third-order polynomial regression equations were used to evaluate the QRS-4 and AP-3 results because of data limitations (Figure 10).
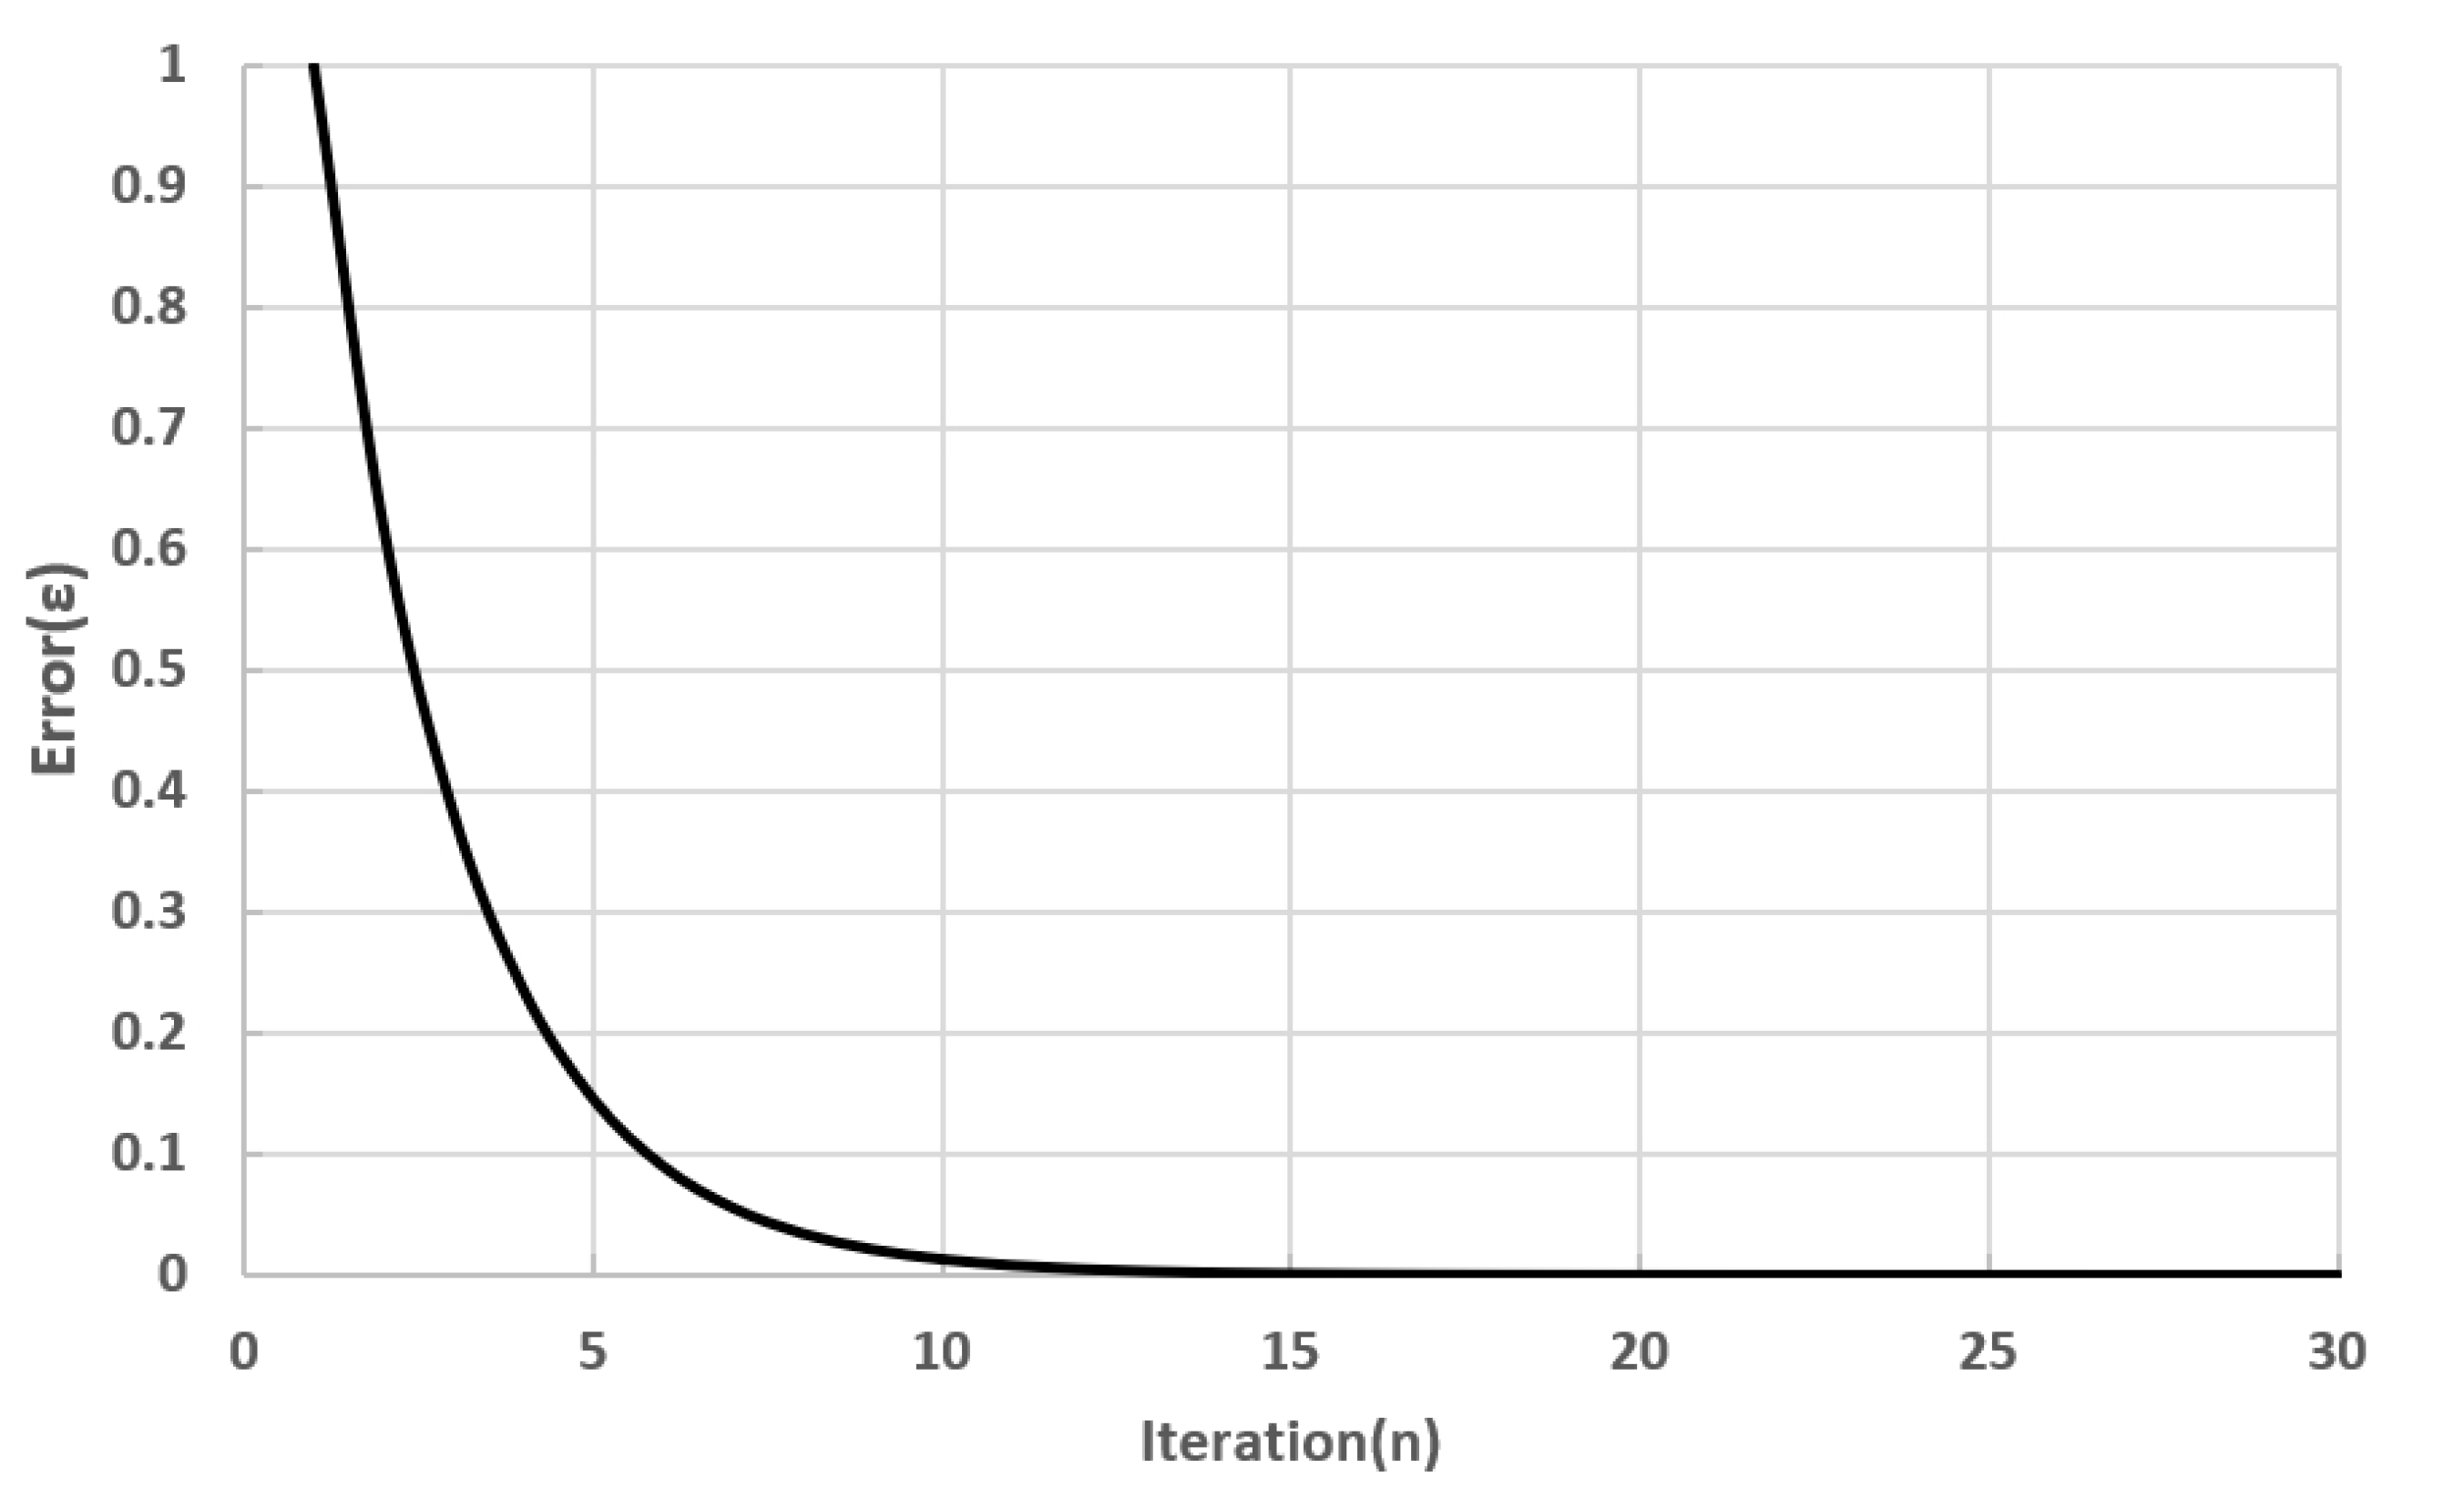
The golden section search method was used to estimate optimal tack coat application rates. This method searches for global maxima or minima by downscaling the h of the golden ratio when the maximum or minimum of an arbitrary function lies in the h section between a and b. The golden ratio is calculated by repeatedly defining new R sections (overlaps of the R × h multiplied by the section length of h). Iterations proceed until an allowable error (e.g., ) is attained. Progress was evaluated using Equations (4a) and (4b) below.
The OARs were determined using Matlab. Error reductions by iteration are shown in Figure 11. The optimum rates were defined when the application rate range was confined between 0 and 1. We calculated the root mean squared errors (RMSEs), mean absolute percentage errors (MAPEs), and Pearson correlation coefficients (Table 4).
6.2. The New Predictive Model
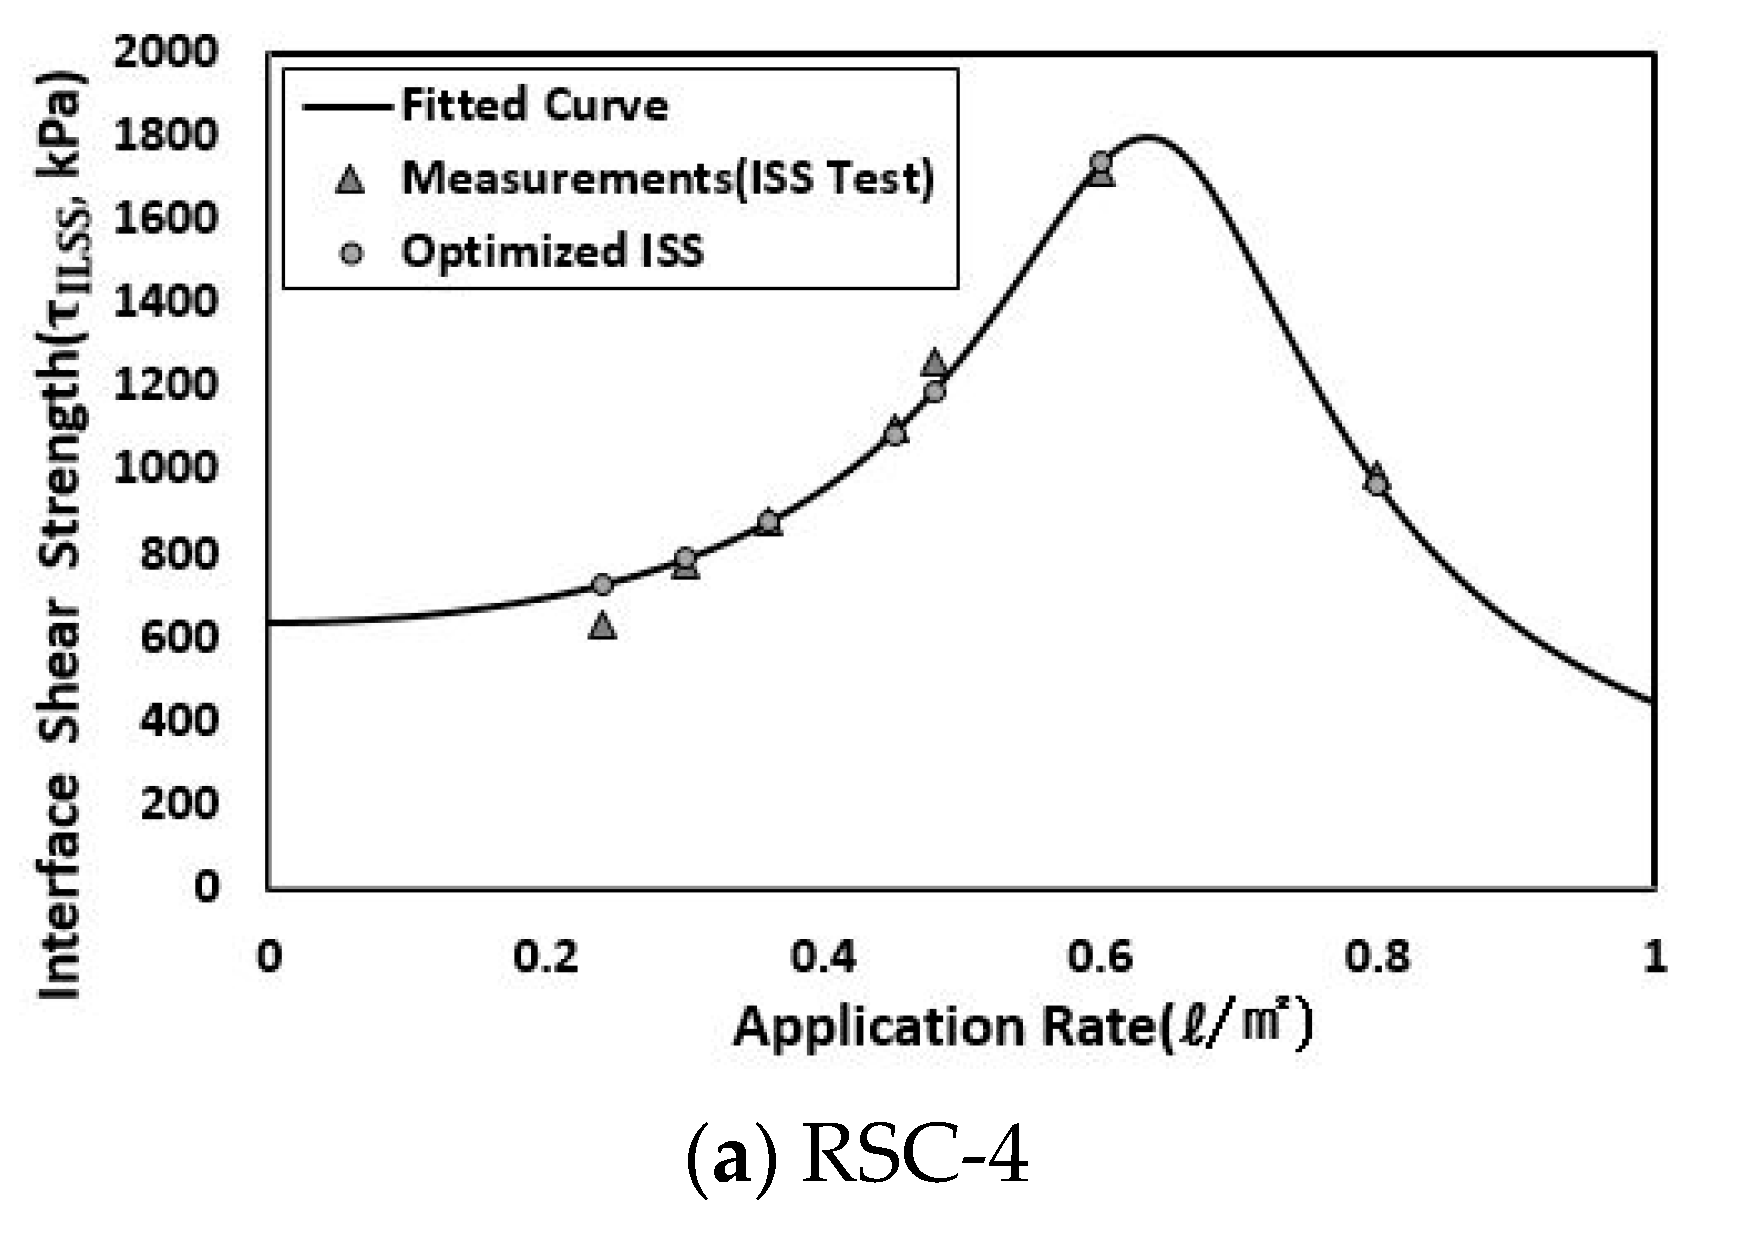
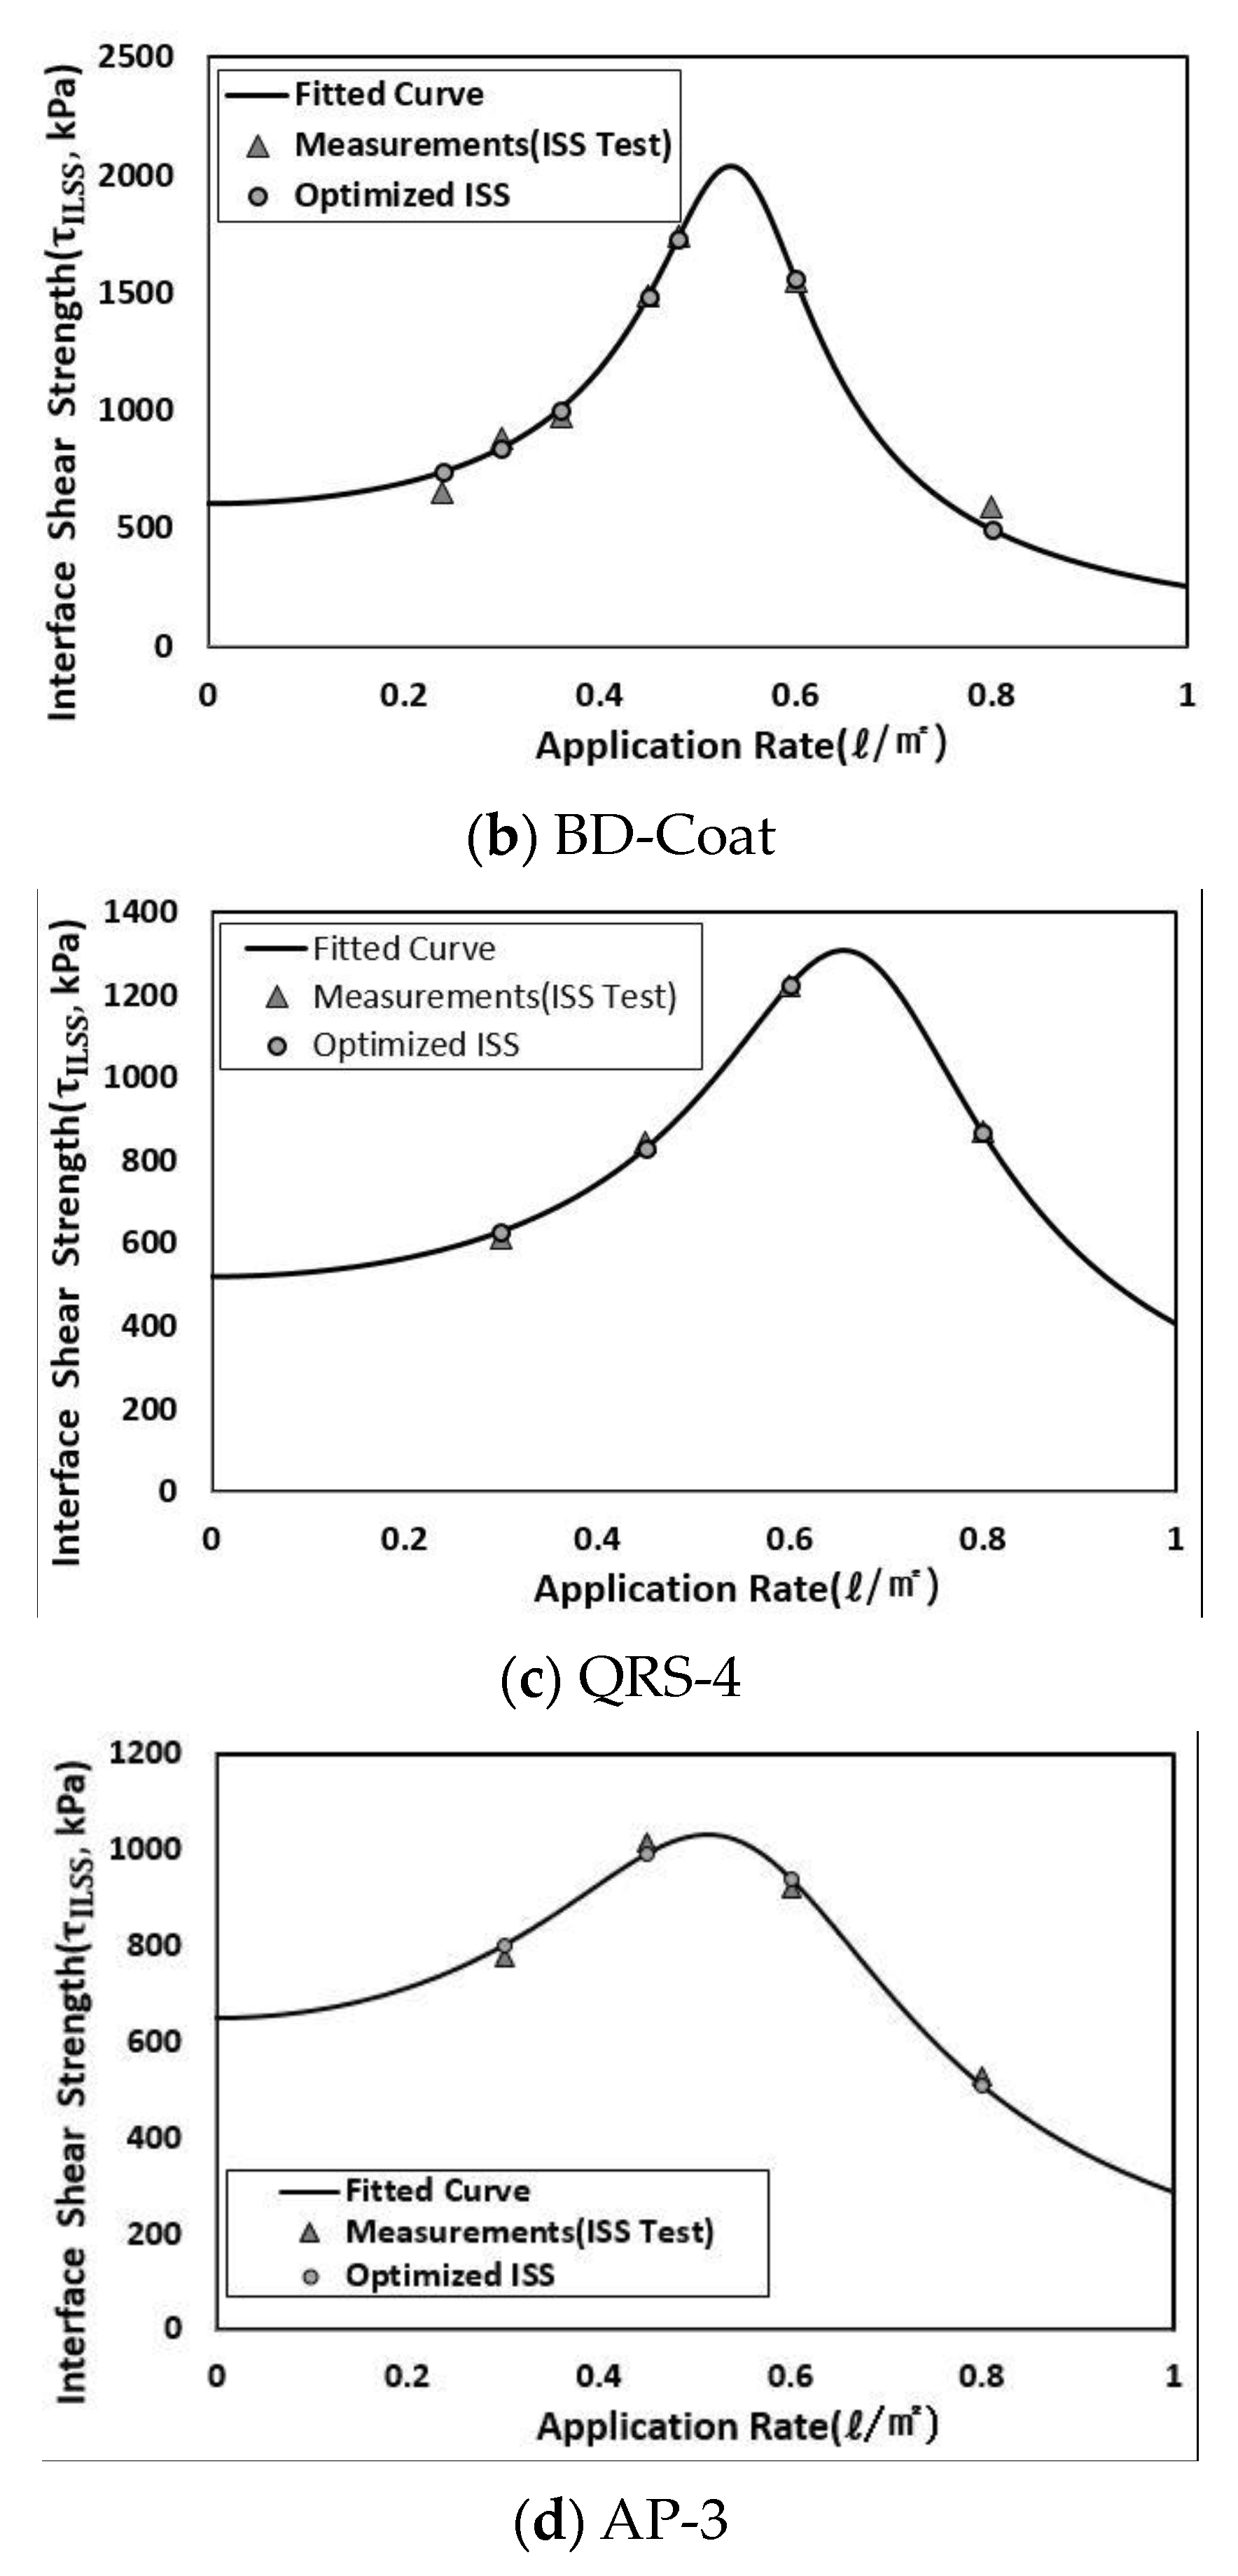
Test data and a mechanical approach were used to construct a new predictive model. The ISS was the global maximum at the OAR. Mixtures were required to resist the shear force when both the bottom and upper pavements were produced gradually without the application of a tack coat. The mixtures were divided into two sections, and the sections were then bonded (or not) with a tack coat. Thus, the ISS could not resist shear force, yielding different predictive functions under various conditions. Testing showed that the required shear strength slowly decreased above and below the arbitrary application rate. Moreover, the fact that undefined coefficients cannot be negative was considered when constructing the predictive model (Equation (5a,b)):
where , , α, β, AP and APOP are the ISS, the pure ISS, two undefined coefficients, the application rate, and the OAR, respectively. The additional term on the right of Equation (5) can be used when the material is bonded with tack coat after cutting. However, as our test specimens were paved gradually with a tack coat, and their adhesion characteristics were originally explored without the application of tack coat, the additional term cannot be applied. The fitted model used in the present study is shown in Equation (6), below. This allows the simple prediction of tack coat application rates because ISS is maximized when the application rate is that of Equation (6).
6.3. Optimum Application Rates and Evaluations by the Predictive Model
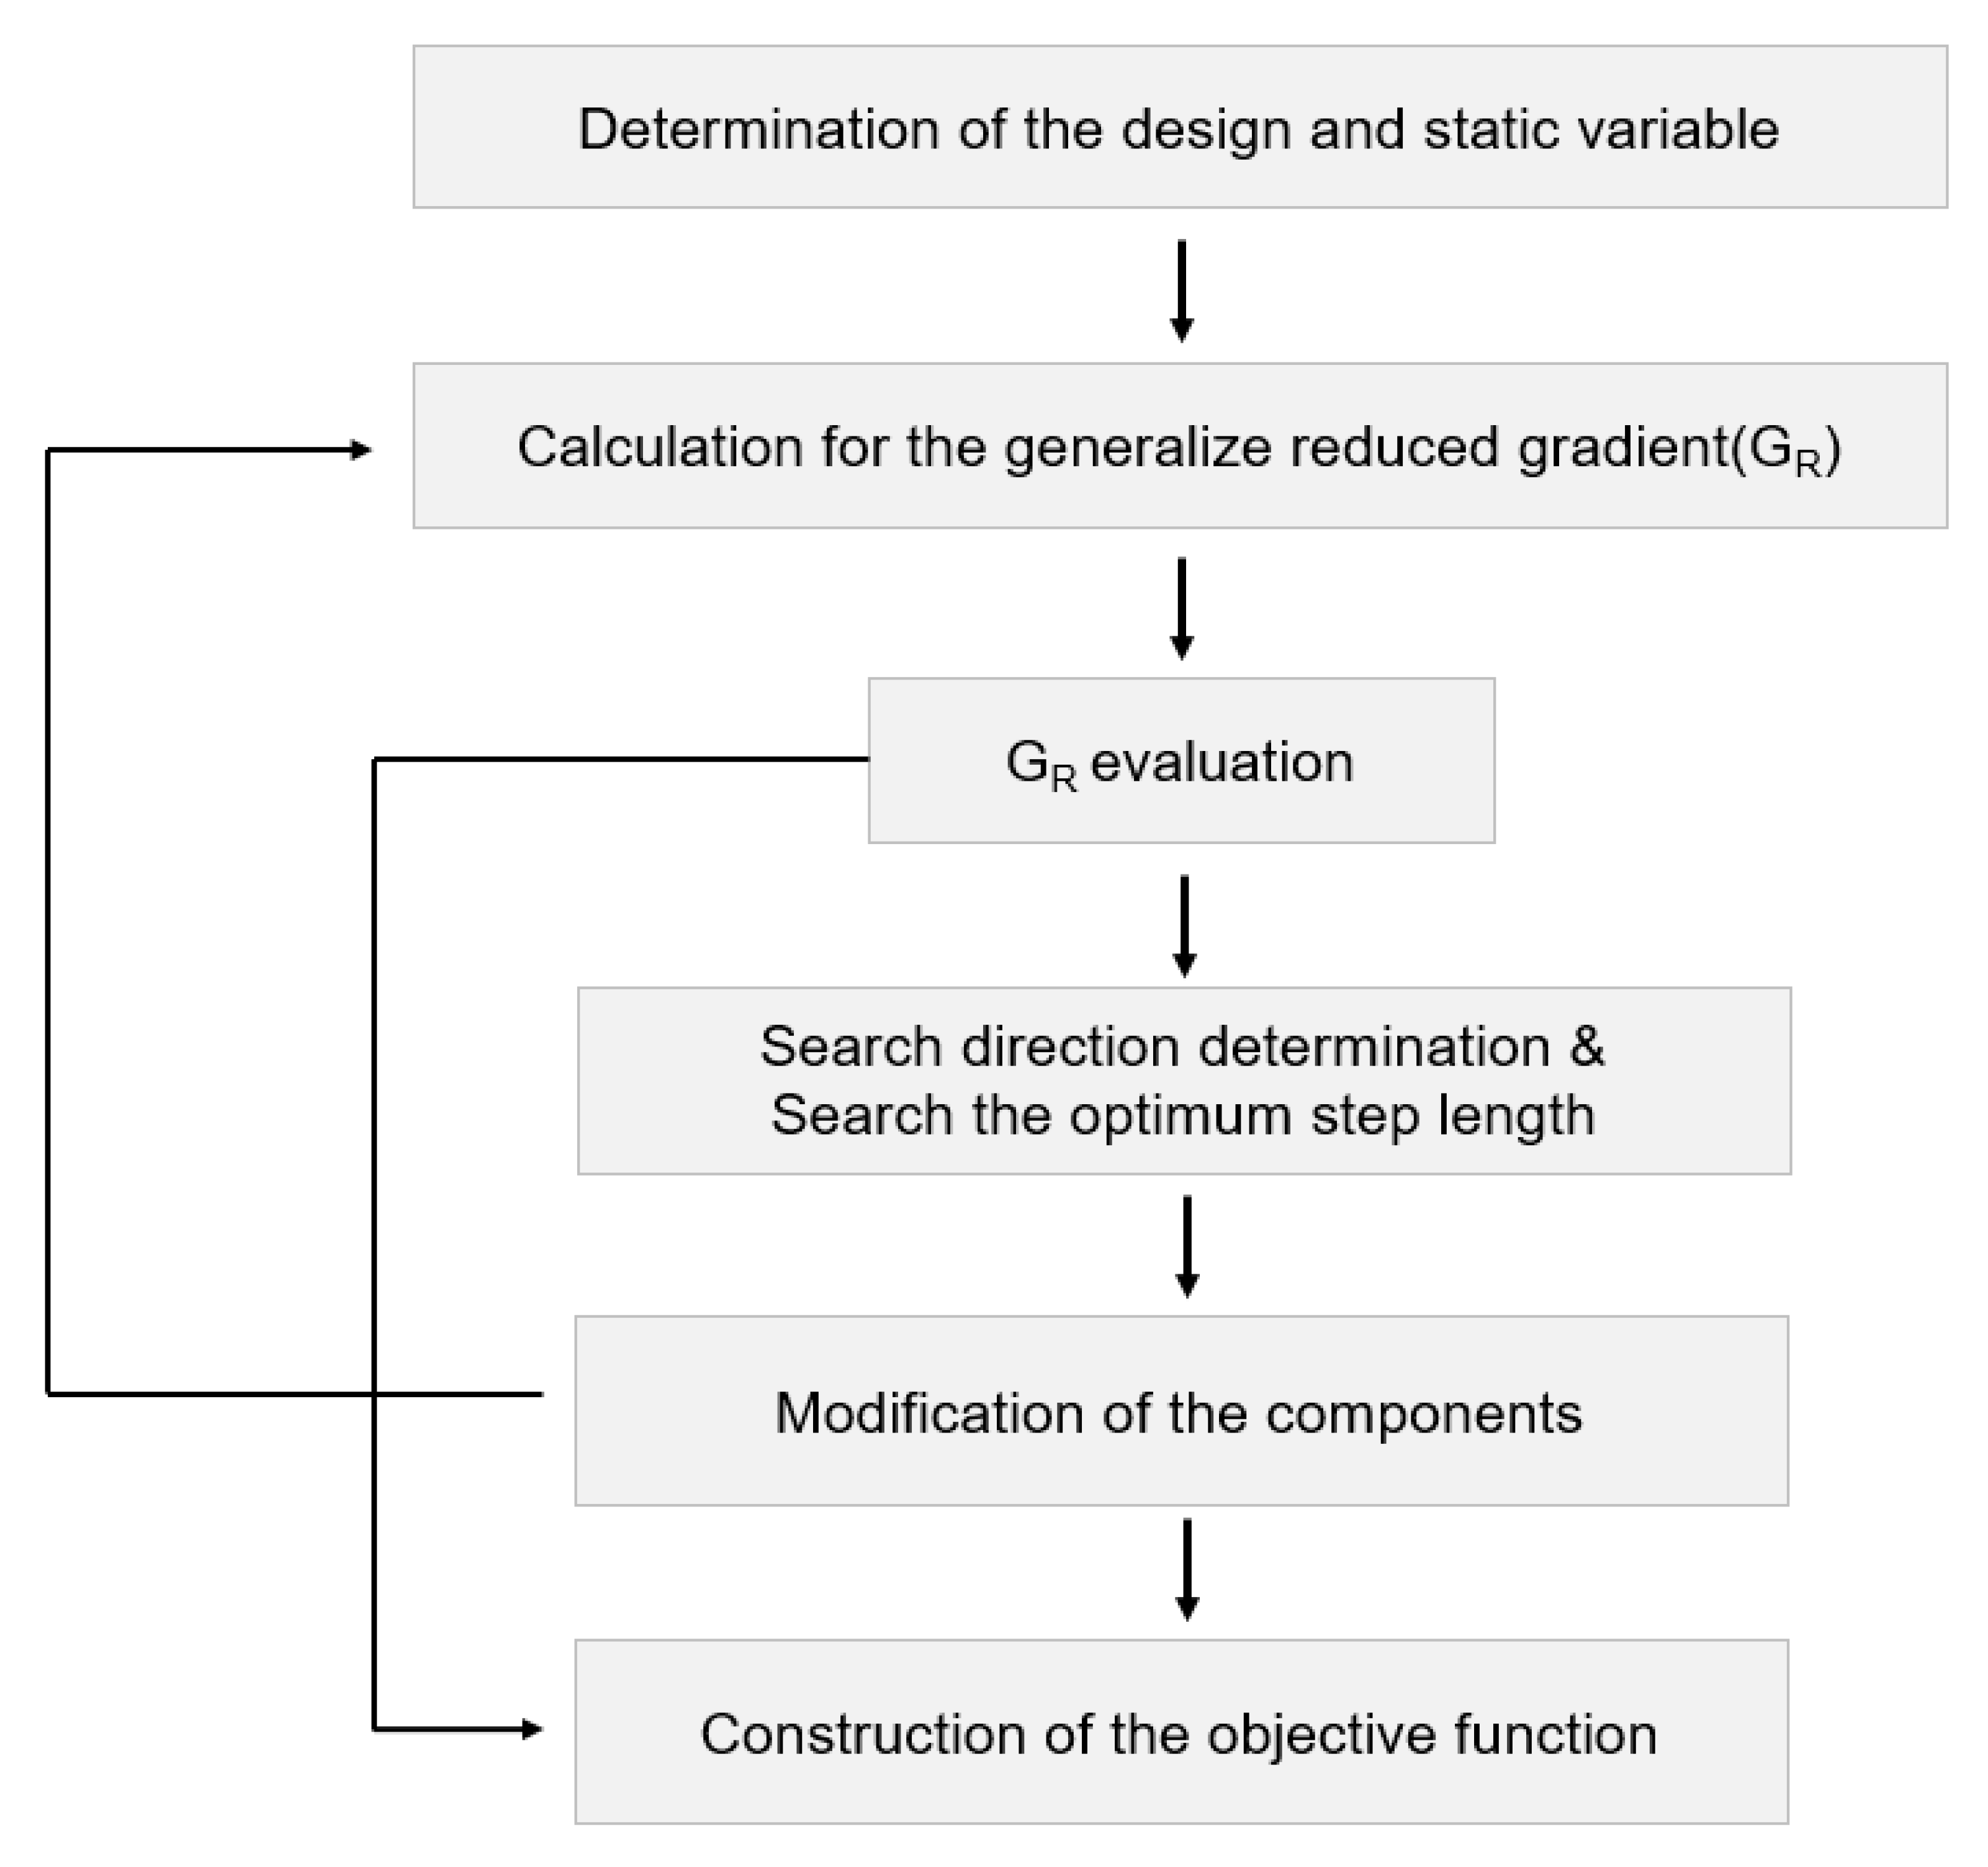
The generalized reduced gradient (GRG) algorithm [25,26,27] was used to determine unknown coefficients in our new predictive model. We minimized the RMSEs of the measurements and the fitted values. The GRG algorithm is a direct, constrained optimization technique developed to solve nonlinear problems. The GRG algorithm is an expansion of the reduced gradient method (Figure 12). In this study, the determined alpha and beta parameters in Equation (6) resulted in 0.711 and 0.16 (RSC-4), 0.903 and 0.148 (BD-Coat), 0.697 and 0.194 (QRS-4), and 0.720 and 0.280 (AP-3).
The objective function f and the constraint function g are expressed as functions of the design and state variables (Equation (7a,b)). When dg(X) = 0, it is assumed that the constraints are satisfied, because g(X) = 0 at vector X. Equation (7b) can be expressed as Equation (8). The GRG (GR) is given by Equation (9). By evaluating the gradient of allowable error (e.g.,), the search direction and the optimum iteration step length are defined. We used the steepest descent method to determine the search direction (Figure 13).
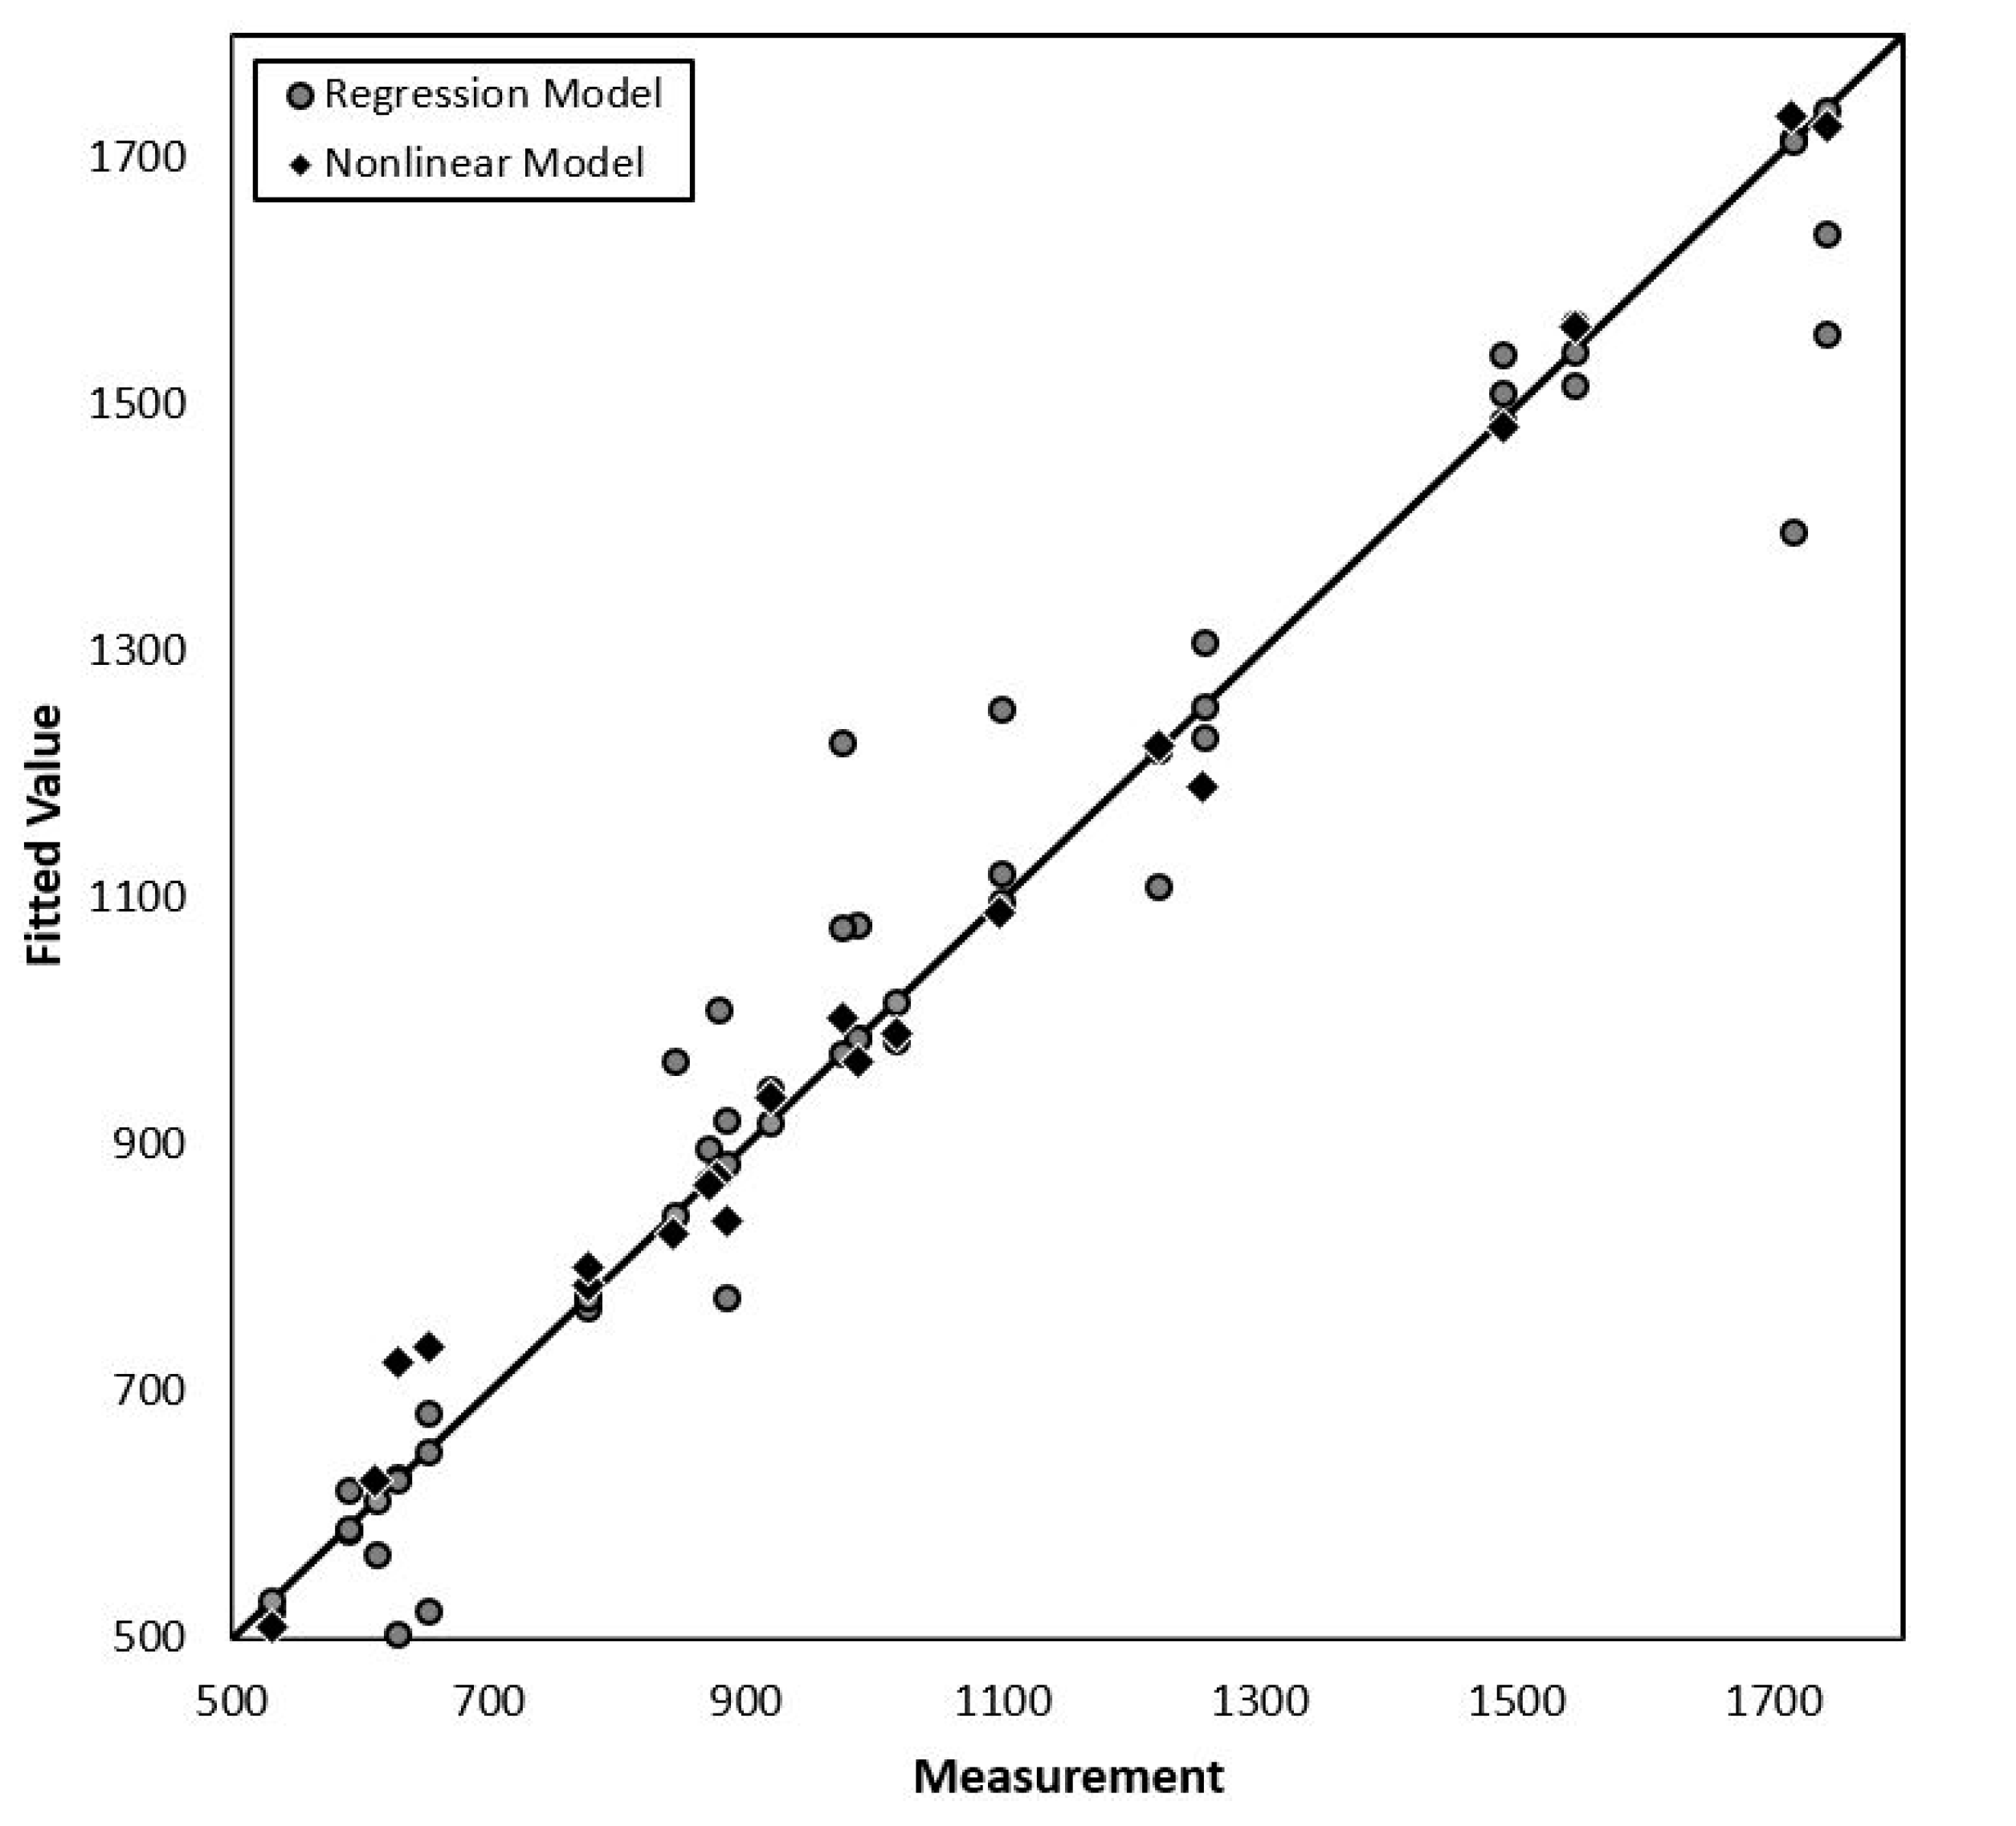
We compared our new model with the models employing regression analysis by calculating the OARs, RMSEs, MAPEs, and correlation coefficients (Table 5 and Table 6). Also, we compared the differences between predictions and measurements (Figure 14). The RMSE, MAPE, and correlation coefficient of the regression approach were 78.52 kPa, 4.13%, and 95.25%, respectively; but were 40.88 kPa, 3.75%, and 98.64% using our new approach.
7. Conclusions
We developed a new performance tester measuring ISS considering the standards and construction conditions of South Korea and compared the direct shear strengths of asphalt mixtures differing in porosity after the application and non-application of tack coat. We developed models estimating optimal tack coat application rates using polynomial regression and a non-linear function running the GRG algorithm and compared the data. We found that:
- A developed test machine that does not require a specific material size was developed that can variously perform the shear, tension, torsion, and indirect tension tests.
- The ISS decreased as asphalt porosity increased. BD-Coat provided a higher shear performance of normal HMA (porosity 3%) than RS(C)-4 did.
- Our nonlinear fitting model using the GRG algorithm was analytically superior to the polynomial regression model in terms of both error and correlation. Also, the regression model cannot predict interface shear stress over a broad testing range, as negative values appear.
- We plan to use a mechanical/empirical approach to evaluate the effects of tack coat curing period and temperature, as viscoelastic materials are sensitive to temperature and loading.
Some inaccuracies in model fit and predictive errors may be unavoidable due to measurement errors, changes in material properties, and human errors. Thus, future investigations and model validation should be required in order to distinguish the model fit and predictive errors.
Author Contributions
Conceptualization, S.M. and D.K.; methodology, S.M.; software, D.K.; validation, S.M. and D.K.; formal analysis, D.K.; investigation, S.M.; resources, D.K.; data curation, D.K.; writing—original draft preparation, D.K.; writing—review and editing, S.M.; visualization, D.K.; supervision, S.M.; project administration, S.M.; funding acquisition, S.M. All authors have read and agreed to the published version of the manuscript.
Funding
This study was supported by the Research Program funded by SeoulTech (Seoul National University of Science and Technology).
Data Availability Statement
Data is contained within the article.
Conflicts of Interest
The authors declare that they have no conflict of interest. Furthermore, we can provide any information about the availability of the asked data in this manuscript.
References
- Song, W.; Shu, X.; Huang, B.; Woods, M. Factors affecting shear strength between open-graded friction course and underlying layer. Constr. Build. Mater. 2015, 101, 527–535. [Google Scholar] [CrossRef]
- Raposeiras, A.C.; Castro-Fresno, D.; Vega-Zamanillo, A.; Rodriguez-Hernandez, J. Test methods and influential factors for analysis of bonding between bituminous pavement layers. Constr. Build. Mater. 2013, 43, 372–381. [Google Scholar] [CrossRef]
- Raposeiras, A.C.; Rojas-Mora, J.; Piffaut, E.; Movilla-Quesada, D.; Castro-Fresno, D. Development of an estimative model for the optimal tack coat dosage based on aggregate gradation of hot mix asphalt pavements. Constr. Build. Mater. 2016, 118, 1–10. [Google Scholar] [CrossRef] [Green Version]
- Song, W.; Shu, X.; Huang, B.; Woods, M. Effects of asphalt mixture type on asphalt pavement interlayer shear properties. J. Transp. Eng. B Pave 2018, 144, 04018021. [Google Scholar] [CrossRef]
- Song, W.; Shu, X.; Huang, B.; Woods, M. Influence of interface characteristics on the shear performance between open-graded friction course and underlying layer. J. Mater. Civ. Eng. 2017, 29, 04017077. [Google Scholar] [CrossRef]
- Ahn, H.-J. Evaluation of Asphalt Pavement Interface. Master’s Thesis, Purdue University, West Lafayette, IN, USA, 2014. [Google Scholar]
- Bahia, H.U.; Hanson, D.I.; Zeng, M.; Zhai, H.; Khatri, M.A.; Anderson, R.M. Characterization of Modified Asphalt Binders in Superpave Mix Design; Report 459; National Cooperative Highway Research Program: Washington, DC, USA, 2001. [Google Scholar]
- Moses, O.O. Mechanical Behaviour of Stress Absorbing Membrane Interlayers. Ph.D. Thesis, University of Nottingham, Nottingham, UK, 2011. [Google Scholar]
- Mohammad, L.N.; Elseifi, M.A.; Bae, A.; Patel, N.; Button, J.; Scherocman, J.A. Optimization of Tack Coat for HMA Placement; Report 712; National Cooperative Highway Research Program: Washington, DC, USA, 2012. [Google Scholar]
- Korea Expressway Corporation. Expressway Construction Guide Specification; Korea Expressway Corporation: Seongnam, Korea, 2012. [Google Scholar]
- Ministry of Land, Infrastructure and Transportation. National Road Construction Guide Specification; Korea Ministry of Land, infrastructure and Transportation: Seoul, Korea, 2015. [Google Scholar]
- Ministry of Land, Infrastructure and Transportation. Practical Design Guideline for National Roads; Korea Ministry of Land, Infrastructure and Transportation: Seoul, Korea, 2016. [Google Scholar]
- Hong, K.; Kim, Y.K.; Bae, A.; Lee, S.W. Bond characteristics at the interface between HMA surface and RCC base. J. Korean Soc. Road Eng. 2017, 19, 37–46. [Google Scholar] [CrossRef]
- Kim, Y.; Im, J.; Hwang, S. Development and evaluation of polymer-modified asphalt emulsions used for tack coats. J. Korean Soc. Road Eng. 2015, 17, 39–46. [Google Scholar]
- Kim, D.; Mun, S. A study for evaluation of hot mixed asphalt mixtures with tack-coat regarding high-frequency dynamic resistance performance and bonding property. J. Korean Soc. Road Eng. 2015, 17, 35–47. [Google Scholar]
- Kim, D.; Lee, S.; Mun, S. A study of evaluation for optimum content and bond strength properties of bituminous materials applied for preventing separation of asphalt pavement layers. J. Korean Soc. Road Eng. 2016, 18, 137–143. [Google Scholar] [CrossRef]
- Kim, D.; Mun, S. Evaluation of optimized application rate of emulsified asphalt using uniaxial compression test and regression analysis. J. Korean Soc. Road Eng. 2017, 19, 97–102. [Google Scholar] [CrossRef]
- Kim, D.; Mun, S.; Kwon, O.; Moon, K. Evaluation of interlayer shear properties and bonding strengths of a stress-absorbing membrane interlayer and development of a predictive model for fracture energy. J. Korean Soc. Road Eng. 2018, 20, 87–95. [Google Scholar] [CrossRef]
- Lim, C.; Jeong, H.; Jang, D.; Park, J.; Lee, J. Evaluation of mechanical characteristic of asphalt pavement with usage of trackless tack coat. J. Korean Soc. Road Eng. 2017, 9, 25–34. [Google Scholar] [CrossRef]
- Du, J.C. Evaluation of shear strength on pavement layers by use tack materials. Adv. Mat. Res. 2011, 255, 3176–3179. [Google Scholar] [CrossRef]
- Antonio, D.; Cristina, T. Interlayer shear failure evolution with different test equipments. Procedia Soc. Behav. Sci. 2012, 53, 556–567. [Google Scholar]
- Johnson, E.N.; Cole, M.K.; John, P. Tack Coat Testing–Measuring Field Bond Strength; Final Report, MN/RC 2015-25; Minnesota Department of Transportation: St. Paul, MN, USA, 2015. [Google Scholar]
- Riekstins, A.; Haritonovs, V.; Abolins, V.; Straupe, V.; Tihonovs, J. Life cycle cost analysis of BBTM and traditional asphalt concretes in Latvia. Engrgy Rural Dev. 2019, 22, 1065–1072. [Google Scholar]
- Braunfelds, J.; Senkans, U.; Skels, P.; Janeliukstis, R.; Salgals, T.; Redka, D.; Lyashuk, I.; Porins, J.; Spolitis, S.; Haritonovs, V.; et al. FBG-based sensing for structural health monitoring of road infrastructure. J. Sens. 2021, 8850368. [Google Scholar] [CrossRef]
- Haggag, A.A. A variant of the generalized reduced gradient algorithm for non-linear programming and its applications. Eur. J. Oper. Res. 1981, 7, 161–168. [Google Scholar] [CrossRef]
- Brenan, K.E.; Hallman, W.P. A generalized reduced gradient algorithm for large-scale trajectory optimization problems. Optim. Des. Control 1995, 19, 117–132. [Google Scholar]
- Abdelkrim, E.M. Two-phase generalized reduced gradient method for constrained global optimization. J. Appl. Math. 2010, 2010, 976529. [Google Scholar]
Figure 1.
Fractures in the interlayers caused by moving traffic loads.

Figure 2.
The testing jigs developed by NCHRP.

Figure 3.
Testing methods.

Figure 4.
Previous and current ISS tester jigs.

Figure 5.
Example of the ISS testing results.

Figure 6.
Steps for specimen production.

Figure 7.
ISS test implementation.

Figure 8.
ISS test results (load vs. displacement).

Figure 9.
Comparative analysis results.

Figure 10.
Regression analysis.


Figure 11.
Error reduction by number of iterations.

Figure 12.
Flow chart for the generalized reduced gradient algorithm.

Figure 13.
Application of the nonlinear fitting model.


Figure 14.
Comparative analysis between the regression and nonlinear fitting models.


Table 1.
Residual application rates of emulsified asphalt.
| Surface Type | Residual Application Rate |
|---|---|
| New Asphalt Mixture | 0.035 gsy (0.16 L/m2) |
| Old Asphalt Mixture | 0.055 gsy (0.25 L/m2) |
| Milled Asphalt Mixture | 0.055 gsy (0.25 L/m2) |
| Portland Cement Concrete | 0.045 gsy (0.20 L/m2) |
Table 2.
Results of the ultimate load (UL, kN) and interface shear strength (ISS, kPa).
| Porosity | 3% | 5% | 7% | ||||||||||
|---|---|---|---|---|---|---|---|---|---|---|---|---|---|
| RSC-4 | BD-Coat | RSC-4 | BD-Coat | RSC-4 | BD-Coat | ||||||||
| Rate | UL | ISS | UL | ISS | UL | ISS | UL | ISS | UL | ISS | UL | ISS | |
| 0.24 | 4.94 | 628.6 | 5.13 | 652.6 | 4.97 | 632.3 | 4.75 | 605.2 | 4.34 | 552.9 | 3.40 | 432.7 | |
| 0.36 | 6.89 | 877.1 | 7.65 | 974.3 | 6.19 | 788.0 | 6.66 | 848.0 | 5.63 | 716.6 | 6.29 | 801.5 | |
| 0.48 | 9.87 | 1256.1 | 13.67 | 1740.5 | 9.43 | 1201.3 | 11.25 | 1432.9 | 8.93 | 1137.1 | 9.44 | 1201.6 | |
Table 3.
Determination of interface shear strength.
| Material Type | RSC-4 | BD-Coat | QRS-4 | AP-3 | |||||
|---|---|---|---|---|---|---|---|---|---|
| Application Rate | Pult (kN) | τISS (kPa) | Pult (kN) | τISS (kPa) | Pult (kN) | τISS (kPa) | Pult (kN) | τISS (kPa) | |
| 0.24 | 4.937 | 628.6 | 5.125 | 652.6 | – | – | – | – | |
| 0.3 | 6.100 | 776.6 | 6.947 | 884.5 | 1.775 | 611.8 | 1.454 | 776.9 | |
| 0.36 | 6.889 | 877.1 | 7.652 | 974.3 | – | – | – | – | |
| 0.45 | 8.621 | 1097.7 | 11.692 | 1488.6 | 1.754 | 843.6 | 2.122 | 1017.0 | |
| 0.48 | 9.865 | 1256.1 | 13.670 | 1740.5 | – | – | – | – | |
| 0.6 | 13.462 | 1714.1 | 12.131 | 1544.6 | 2.440 | 1220.2 | 1.634 | 918.5 | |
| 0.8 | 7.750 | 986.8 | 4.631 | 589.6 | 1.740 | 870.0 | 1.061 | 530.5 | |
Table 4.
Results of predictive model using regression analysis.
| Usage | RSC-4 | BD-Coat | QRS-4 | AP-3 | |||||||
|---|---|---|---|---|---|---|---|---|---|---|---|
| 2nd | 4th | 6th | 2nd | 4th | 6th | 2nd | 3rd | 2nd | 3rd | ||
| Parameters | −1140.7 | −2747.7 | 4.49 × 10⁴ | −2004.6 | 7922.1 | 9451.8 | −1008.8 | 3075.5 | −320.19 | −1343 | |
| 8595.1 | 33,814 | −7.05 × 10⁵ | 13,636 | −75,311 | −248,083 | 6979.5 | −18,873 | 5276.9 | 11,751 | ||
| −7274.4 | −125,409 | 4.50 × 10⁶ | −12,944 | 266,606 | 2.0 × 10⁶ | −5744.7 | 44,771 | −5277.9 | −17,928 | ||
| – | 209,381 | −1.47 × 10⁷ | – | −368,555 | −9.0 × 10⁶ | – | −30,781 | – | 7708.3 | ||
| – | −122,700 | 2.61 × 10⁷ | – | 173,308 | 2.0 × 10⁷ | – | – | – | – | ||
| – | – | −2.38 × 10⁷ | – | - | −2.0 × 10⁷ | – | – | – | – | ||
| – | – | 8.64 × 10⁶ | – | - | 9.0 × 10⁶ | – | – | – | – | ||
| RMSE | 155.72 | 13.54 | 0.009029 | 129.50 | 72.70 | 0.007766 | 87.05 | 0.389876 | 21.80 | 0.00960 | |
| MAPE | 1959.87 | 16.05 | 8.05 × 10⁻⁶ | 1633.93 | 484.29 | 9.36 × 10⁻⁶ | 809.50 | 0.01662 | 50.73 | 0.00001 | |
| 0.78 | 1.00 | 1 | 0.91 | 0.97 | 1 | 0.84 | 1 | 0.84 | 1.00000 | ||
| OAR | 0.590777 | 0.671766 | 0.583294 | 0.526731 | 0.528468 | 0.539864 | 0.607473 | 0.660003 | 0.499905 | 0.470494 | |
Table 5.
Comparative analysis results for RSC-4 and BD-Coat.
| Cases | RSC-4 | BD-Coat | ||||||||
|---|---|---|---|---|---|---|---|---|---|---|
| Test | 2nd *Reg. | 4th Reg. | 6th Reg. | Nonlinear | Test | 2nd Reg. | 4th Reg. | 6th Reg. | Nonlinear | |
| 0.24 | 628.6 | 503.1 | 631.5 | 628.6 | 724.3 | 652.6 | 522.5 | 684.1 | 652.6 | 736.3 |
| 0.30 | 776.6 | 783.1 | 769.1 | 776.6 | 785.6 | 884.5 | 921.2 | 776.1 | 884.5 | 838.6 |
| 0.36 | 877.1 | 1010.8 | 880.3 | 877.1 | 874.1 | 974.3 | 1226.8 | 1077.9 | 974.3 | 1003.6 |
| 0.45 | 1097.7 | 1254.0 | 1121.7 | 1097.6 | 1087.5 | 1488.6 | 1510.4 | 1542.0 | 1488.6 | 1482.5 |
| 0.48 | 1256.1 | 1308.9 | 1231.2 | 1256.1 | 1190.1 | 1740.5 | 1558.4 | 1639.5 | 1740.5 | 1725.9 |
| 0.60 | 1714.1 | 1397.6 | 1717.8 | 1714.1 | 1733.8 | 1544.6 | 1517.2 | 1566.5 | 1544.6 | 1563.0 |
| 0.80 | 986.8 | 1079.8 | 986.9 | 986.7 | 967.9 | 589.6 | 620.0 | 587.9 | 589.7 | 494.1 |
| RMSE | – | 155.716 | 13.544 | 0.009 | 45.421 | – | 129.498 | 72.701 | 0.008 | 53.029 |
| MAPE | – | 1959.867 | 16.049 | 0.000 | 3.708 | – | 1633.932 | 484.293 | 0.000 | 5.667 |
| – | 0.780 | 0.998 | 1.000 | 0.983 | – | 0.908 | 0.971 | 1.000 | 0.985 | |
| OAR | – | 0.591 | 0.672 | 0.583 | 0.656 | – | 0.527 | 0.528 | 0.540 | 0.547 |
*Reg: regression.
Table 6.
Comparative analysis results for QRS-4 and AP-3.
| Cases | QRS-4 | AP-3 | ||||||
|---|---|---|---|---|---|---|---|---|
| Test | 2nd Reg. | 3rd Reg. | Nonlinear | Test | 2nd Reg. | 3rd Reg. | Nonlinear | |
| 0.24 | – | – | – | – | – | – | – | – |
| 0.30 | 611.8 | 568.0 | 611.9 | 628.2 | 776.9 | 787.9 | 776.9 | 800.0 |
| 0.36 | – | – | – | – | – | – | – | – |
| 0.45 | 843.6 | 968.7 | 843.9 | 828.1 | 1017.0 | 985.6 | 1016.9 | 990.8 |
| 0.48 | – | – | – | – | – | – | – | – |
| 0.60 | 1220.2 | 1110.8 | 1220.6 | 1223.3 | 918.5 | 945.9 | 918.5 | 938.6 |
| 0.80 | 870.0 | 898.2 | 870.7 | 868.5 | 530.5 | 523.5 | 530.5 | 508.2 |
| RMSE | – | 87.046 | 0.390 | 11.443 | – | 21.798 | 0.010 | 22.997 |
| MAPE | – | 809.502 | 0.017 | 1.241 | – | 50.730 | 0.000 | 2.982 |
| – | 0.840 | 1.000 | 0.997 | – | 0.840 | 1.000 | 0.985 | |
| OAR | 0.607 | 0.660 | 0.685 | 0.500 | 0.470 | 0.582 | ||
Publisher’s Note: MDPI stays neutral with regard to jurisdictional claims in published maps and institutional affiliations. |
© 2021 by the authors. Licensee MDPI, Basel, Switzerland. This article is an open access article distributed under the terms and conditions of the Creative Commons Attribution (CC BY) license (https://creativecommons.org/licenses/by/4.0/).
Share and Cite
MDPI and ACS Style
Kim, D.; Mun, S. Development of an Interface Shear Strength Tester and a Model Predicting the Optimal Application Rate of Tack Coat. Constr. Mater. 2021, 1, 22-38. https://0-doi-org.brum.beds.ac.uk/10.3390/constrmater1010002
AMA Style
Kim D, Mun S. Development of an Interface Shear Strength Tester and a Model Predicting the Optimal Application Rate of Tack Coat. Construction Materials. 2021; 1(1):22-38. https://0-doi-org.brum.beds.ac.uk/10.3390/constrmater1010002
Chicago/Turabian StyleKim, Dowan, and Sungho Mun. 2021. "Development of an Interface Shear Strength Tester and a Model Predicting the Optimal Application Rate of Tack Coat" Construction Materials 1, no. 1: 22-38. https://0-doi-org.brum.beds.ac.uk/10.3390/constrmater1010002