
Predicting People’s Motivation to Engage in Urban Possum Control


Manaaki Whenua Landcare Research, Lincoln 7608, New Zealand
*
Author to whom correspondence should be addressed.
Conservation 2021, 1(3), 196-215; https://0-doi-org.brum.beds.ac.uk/10.3390/conservation1030016
Submission received: 28 June 2021
/
Revised: 16 July 2021
/
Accepted: 20 July 2021
/
Published: 1 August 2021
Abstract
:Initiatives such as education, incentives, and regulations are used to change people’s behaviour and thereby achieve policy objectives. Understanding and predicting the willingness of people to change their behaviour in response to an initiative is critical in assessing its likely effectiveness. We present a framework proposed by Kaine et al. (2010) for understanding and predicting the motivation of people to change their behaviour in response to a policy initiative. The framework draws on the marketing concept of ‘involvement’, a measure of motivation. Through application to a predator control case study, we show how the framework may be used to predict people’s responses to a policy initiative and how these predictions might help agencies develop strategies to promote behaviour change.
1. Introduction
Urbanisation has resulted in major impacts on the natural environment [1,2]. With approximately 3.5 billion people now living in cities, it is imperative we gain a greater understanding of how urbanisation affects the natural environment as well as the health and wellbeing of citizens [3]. One implication of urbanisation is that most species will struggle to cope with human impacts, while others will persist or flourish in these new conditions [1]. Adaptable predators such as rats flourish in urban environments, and in response, recent research has examined the potential public health [4] and economic [5] benefits of eradicating rats from urban environments, as well as the perceptions of residents towards a programme of urban rat control [6].
To capture the benefits of urban predator control, initiatives such as trapping will need to be coordinated across hundreds (if not thousands) of householders and landowners. Thus, understanding the willingness of urban householders to change their behaviour is critical in assessing the likely effectiveness of these initiatives. This paper contributes to the emerging literature on urban predator control by proposing a framework that can be used in urban as well as rural settings to predict people’s response to different predator control initiatives.
The framework is tested by analysing the responses of urban householders to a policy promoting the trapping of brushtail possums in the New Zealand city of Dunedin. New Zealand is a good location to examine urban predator control as the country seeks to implement Predator Free 2050, a collaborative project that aims to eradicate non-native introduced mustelids (stoats, ferrets, and weasels), rats, and possums from New Zealand by the year 2050 [7]. In urban New Zealand, researchers have identified that households can contribute to Predator Free 2050 by trapping and killing brushtail possums that were introduced from Australia [8]. This potential can, in principle, be realised by using a range of policy initiatives, including marketing, education, incentives, charges and regulations to stimulate interest, encourage participation, and modify people’s behaviour and practice. Consequently, a better understanding of what policy initiatives might encourage participation in an urban programme of possum trapping is of interest to Predator Free 2050 and the larger national goal of predator eradication.
Choosing which policy initiative to employ depends on several factors, with the likelihood of householders responding favourably being, perhaps, the most critical. For example, incentives could be popular among householders but prohibitively expensive, given the trapping densities that may be required. Regulations compelling the installation of traps could have the potential to change the behaviour of all households but might be unpopular among householders and problematic to enforce. Hence, knowing the likely response of householders to any proposed policy initiative is crucial when choosing between policy initiatives (and knowing when there may be merit in combining them).
In this study, we use a framework based on social psychology and marketing theory [9] to investigate the responses of urban households to a policy that would promote the use of traps to reduce the population of possums in Dunedin [10]. Although there is an established literature on the ecology of common urban pests, such as rats [11,12,13], the literature on the economic or social impacts of urban predators is extremely limited. Wilson et al. [4] mainly investigated the public health aspects of rat, stoat, and possum eradication in New Zealand but also cite the potential social benefits to residents’ mental health. This research is the first study, to the best of our knowledge, that explores New Zealander’s motivation to participate in urban predator control.
2. Materials and Methods
Kaine et al. [9] suggested that theories about people’s responses to policy initiatives had a common underpinning, whether those theories were grounded in the economics of rational choice or were more behavioural in nature, incorporating social and normative motivations. The common underpinning was that people’s decision-making was motivated by the achievement of personal goals and that the decisions are sufficiently important to the individual for them to devote cognitive effort to gathering information, processing that information, formulating attitudes, and reaching a decision [14,15,16].
Given these underpinnings, these theories cannot be expected to predict behaviour when a decision is not relevant enough to people’s personal goals to warrant the effort to form an attitude that has the power to influence their behaviour. In these circumstances, due deliberation does not take place in reaching a decision. Consequently, to predict how people may or may not respond to a policy initiative, it is necessary to understand if they are likely to invest effort in decision-making regarding the initiative.
Social psychology theory suggests that, given the limited capacity to process information, individuals must form priorities so they can allocate their processing capacity [17]. The theory proposes that deliberate, effortful thinking is reserved for more important decisions while automatic processes that require less effort, such as habit, are employed to make routine, unimportant decisions. Hence, when a person is presented with a decision-making situation, they must consciously or subconsciously evaluate the importance of the decision to determine the level of deliberate, effortful thinking they should invest in it [17].
The importance or personal relevance of a decision is judged on the extent to which it is perceived to influence a person’s capacity to satisfy their needs [18,19]. A person’s perception of the importance of a decision in relation to the satisfaction of their needs represents their ‘involvement’ with the decision. Hence, involvement is a measure of the intensity of a person’s motivation regarding a decision [20]. The intensity or level of involvement evoked by the decision depends on a mix of external cues, including context and promotion, and internal cues, such as experience, perception of risk, personal value systems, and social norms [18].
The degree of involvement a person has in a subject is a key determinant then of the effort they will expend in making decisions about that subject and then acting on them [21,22]. Involvement arises from functional needs in relation to comfort and security, experiential needs in relation to feelings of pleasure and reward, and identity needs in relation to self-expression and belonging [23]. Involvement tends to be higher the more the subject of interest is novel, complex, and entails substantial social and financial risks [24]. Consequently, involvement can be characterised in terms of functional, experiential, identity-based, risk-based, and consequence-based components [23].
A person’s involvement with a subject will be greater the more they associate each of these components’ needs with the subject. Farmers, for example, should exhibit very high involvement with farming because it provides them with an income (functional involvement), with the opportunity to be physically active and work outdoors (experiential involvement), and to work independently of others (identity involvement). Farming is characterised by long production cycles that are sensitive to seasonal conditions, and product prices are highly variable. Consequently, production and revenue performances are inherently unpredictable (risk-based involvement) with serious consequences for business success and family income (consequence-based involvement).
High involvement with a subject is associated with greater time and effort devoted to obtaining information about the subject, the formulation of strongly held beliefs and attitudes about the subject, and a greater likelihood of acting regarding the subject. In contrast, low involvement in a subject is associated with little time and effort devoted to obtaining information about the subject, the formulation of weakly held beliefs and attitudes, if any, about the subject, and a lower likelihood of acting regarding the subject.
Kaine et al. [9] proposed that people’s responses to policy initiative, such as the subsidised provision of traps for catching possums, for example, can be inferred from their: (1) involvement with the relevant policy outcome (such as reducing possum numbers), (2) involvement with and attitude towards the policy initiative itself (subsidised traps).
The two dimensions of involvement with the policy outcome and involvement with the policy initiative mean that the responses of people to a policy initiative can be classified into four quadrants, as shown in Figure 1.
People in quadrant one exhibit low involvement in both the policy outcome and the policy initiative. These people are likely to have little knowledge or even awareness of the policy outcome. They are likely to have limited knowledge of the policy initiative and have weak attitudes towards it, if any at all. Non-compliance with the initiative is largely unintentional [25].
If people in quadrant one present little risk in terms of achieving the policy outcome, they can be ignored. Otherwise, their compliance with the initiative may be encouraged by: (1) linking the policy outcome to a subject they find more involving, (2) reducing the effort required to be compliant, and (3) promoting awareness of the policy outcome and the policy initiative. The last strategy is likely to be ineffective.
People in quadrant two exhibit high involvement with the policy outcome but low involvement with the initiative. These people are likely to have some knowledge about the policy outcome. They are likely to have limited knowledge of the policy initiative and may have weak or ambiguous attitudes towards it. Any non-compliance with the initiative is largely unintentional [9]. If people in quadrant two represent little risk in terms of achieving the policy outcome, they can be ignored. If their compliance is important to achieving the policy outcome, then reducing the effort required for compliance [26] and promoting awareness of the policy initiative may be worthwhile.
People in quadrant three exhibit high involvement with the policy outcome and the initiative. These people are likely to have extensive and detailed knowledge of the policy outcome. They are also likely to have extensive knowledge of the policy initiative and strong attitudes towards it. If their attitude towards the policy initiative is favourable, then they will comply with the initiative and may even advocate for it [25].
If people in quadrant three have an unfavourable attitude towards the policy initiative, they may reluctantly comply [9]. Non-compliance with the initiative will be intentional. Most likely, they will prefer, and even advocate for, alternative initiative designs. Where practical, incorporating alternatives into the design of the policy initiative may encourage the compliance of these people. Alternatively, offering incentives to reduce compliance costs may neutralise unfavourable reactions.
People in quadrant four exhibit low involvement with the policy outcome but high involvement with the initiative. People in this quadrant are likely to have limited knowledge of the policy outcome. They are likely to have detailed knowledge of the policy initiative and have strong attitudes towards it. If their attitude towards the initiative is favourable, then they will comply with the initiative [9]. On the other hand, if they have an unfavourable attitude towards the policy initiative, then they will only comply reluctantly, or may intentionally refuse to comply at all. These people will regard the initiative as imposing unwarranted costs upon them. Most likely, they will agitate against the policy initiative [9]. Offering incentives to offset compliance costs may neutralise unfavourable reactions.
The I3 framework has been employed to understand and predict compliance behaviour in a variety of contexts in agriculture [27,28,29], rural and urban predator control [30,31], and community support for predator control [32].
Methods
We used the framework proposed by Kaine et al. [9] to measure the involvement of urban householders in Dunedin with the idea of trapping possums. The purpose of this research was to provide insights into the popularity, or otherwise, of a program promoting urban trapping for a Predator Free Dunedin [10,33,34].
A questionnaire was developed to elicit people’s views on three sets of scales. The first set of scales measured their involvement with the idea of reducing possum numbers and their involvement with the idea of trapping possums. Involvement was measured using a condensed version of the Laurent and Kapferer [23] involvement scale developed by Kaine [35] with respondents rating statements for each of the five components of involvement as follows: (1) statements about functional involvement concerning the importance of, and caring about, reducing possum numbers; (2) statements about experiential involvement concerning the reward from, and passion about, reducing possum numbers; (3) statements about self-identity concerning opinions about reducing possum numbers reflecting on your identity, and others identity, as a person; (4) statements about the seriousness or importance of consequences arising from making a mistake in relation to reducing possum numbers; and (5) statements about the risk of making mistakes concerning the complexity or difficulty of making decisions about reducing possum numbers.
Similar statements were formulated for involvement with trapping possums.
The second set of scales measured attitudes, and attitude strength, towards trapping possums. Attitudes were measured using a simple, evaluative Likert scale. The strength of respondents’ attitudes to possum trapping was expected to vary depending on the strength of their involvement with trapping. Consequently, respondents were also questioned about their uncertainty, or otherwise, towards trapping using an ipsative scale or ‘forced choice’ based on Olsen [36]. In addition, the Pest-Management Attitude scale [37] was included in the questionnaire to obtain a measure of respondents’ attitudes towards pests generally.
The third set of scales was a series of questions formulated to discover respondents’ beliefs about the advantages and disadvantages of reducing possum numbers and of trapping to achieve this. Information was sought on whether respondents trapped possums and their experiences if they did. Respondents who did not trap were asked about their reasons for not doing so. A series of questions were also included concerning the respondent’s age, gender, education, income, property, and location. Finally, information was collected on whether respondents were aware of, or volunteered for, Predator Free Dunedin.
The questionnaire was administered online and through telephone by a market research company. The ordering of the statements in the involvement, attitude, and belief scales was randomised among the individual questionnaires to avoid bias in responses. Participation in the survey was voluntary, respondents could leave the survey at any time, and all survey questions were optional and could be skipped. The questionnaire was approved for distribution by Manaaki Whenua Landcare Research’s social ethics process (application 1920/29).
Telephone respondents were randomly selected from a database of urban addresses in Dunedin. Internet respondents were randomly selected from a database of panellists in Dunedin. Internet respondents received compensation for competing surveys and had greater flexibility with respect to when they participated. The survey was conducted in April 2020, and we received 404 responses.
3. Results
Approximately 54 per cent of the respondents were men. The age distribution of the sample was marginally older than current census estimates for Dunedin and had a higher level of education than current census estimates for Dunedin. The overwhelming majority of respondents lived in a house (82 per cent), with most of the remaining respondents living in apartments, townhouses, or units (14 per cent). A small proportion of respondents (4 per cent) lived on farmlets or lifestyle blocks bordering the city. A complete report on our sample and our results can be found in Kaine et al. [30].
3.1. Involvement with Trapping and Reducing Possum Numbers
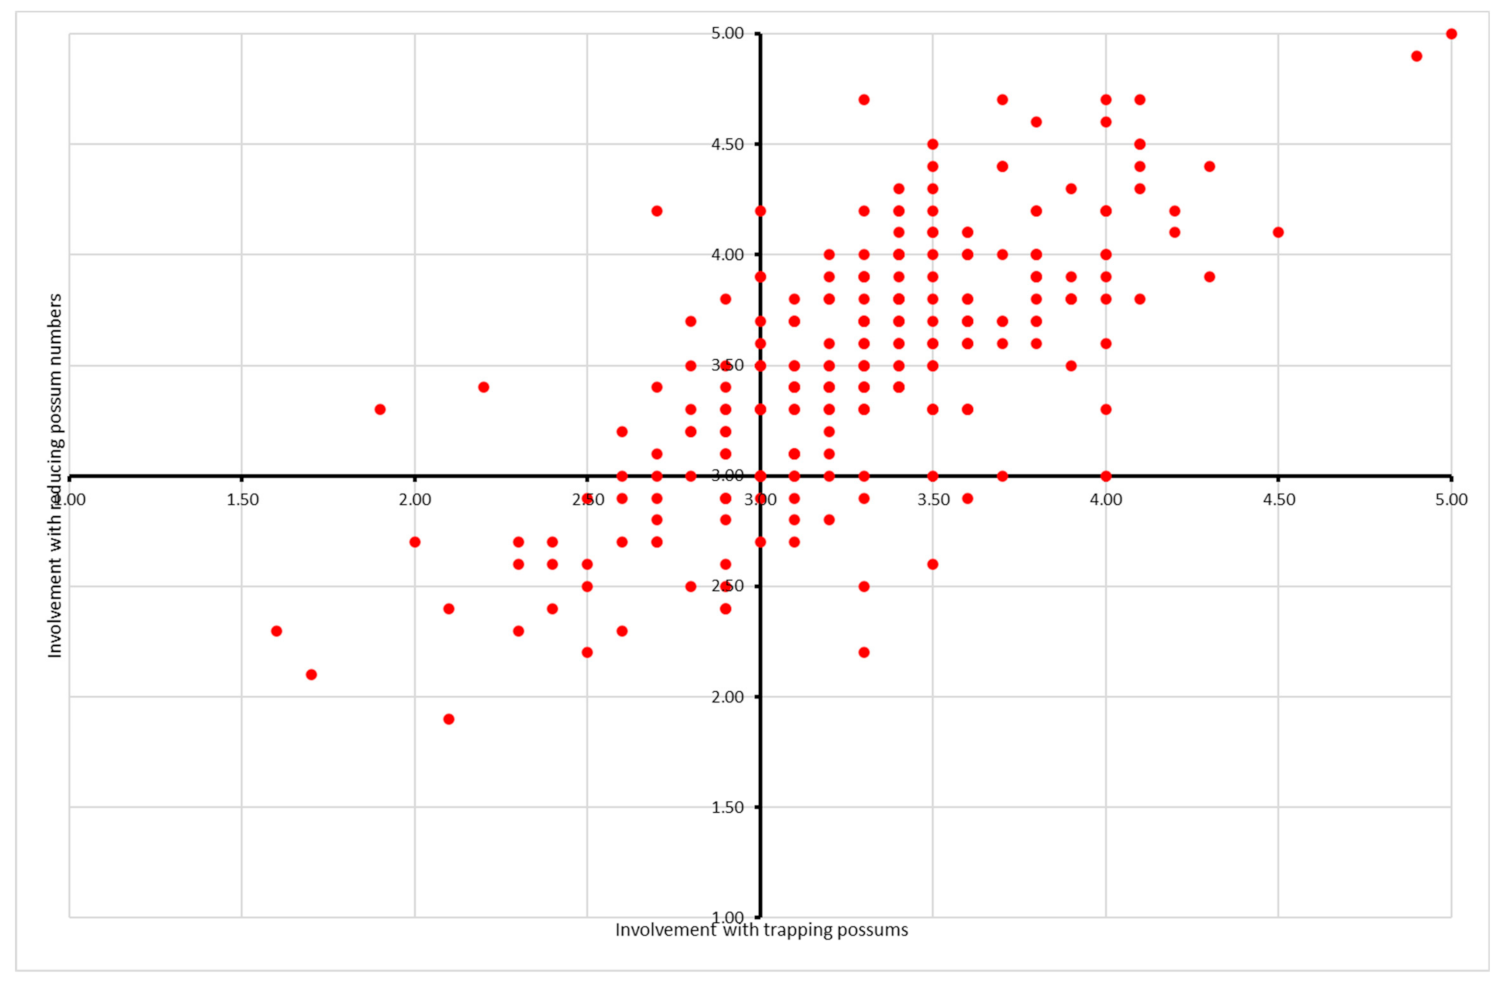
Following Kaine et al. [9], respondents were classified into two-dimensional maps based on their involvement with the idea of reducing possum numbers and their involvement with the idea trapping (see Figure 2). Respondents were classified into quadrants based on their involvement scores relative to the scale mid-point. A score of one indicates the minimum possible level of involvement, and a score of five indicates the highest possible level of involvement. Therefore, for example, respondents with involvement scores less than three for reducing possum numbers and using traps were classified into quadrant one. Statistical tests [38] indicated that the scales were reliable, that is, internally consistent in the sense that scores on related statements were highly correlated with each other.
Inspection of Figure 2 reveals that most respondents exhibited moderate-to-high involvement with the idea of reducing possum numbers, and mild-to-moderate involvement with using traps to catch possums. Consequently, most respondents were classified into quadrant three (see Table 1). The moderate-to-high involvement of respondents with reducing possum numbers indicates that most residents of Dunedin would support a policy to eradicate possums in urban areas (see Table 2). The mild-to-moderate levels of residents’ involvement with trapping suggest that, while they have some interest in the idea of traps (Table 2), they would be likely to invest only a limited amount of their time and energy in trapping.
Almost 50 per cent of respondents had a strongly favourable attitude to trapping. Only five per cent of respondents had an unfavourable attitude towards trapping (see Table 3). Consistent with reporting only mild-to-moderate involvement with trapping possums, just under half of the respondents were unsure about or indifferent towards trapping. As we expected, these respondents had lower levels of involvement than respondents who had a definite, favourable attitude towards trapping (see Table 4).
In line with theory, a relatively high proportion of respondents who were uninterested in reducing possum numbers and uninterested in trapping (quadrant 1) had not thought about, or were indifferent to, the use of traps. In contrast, a relatively high proportion of respondents who were interested in reducing possum numbers and in trapping (quadrant 3) had a definite and favourable attitude toward trapping (see Table 5). The relatively high proportion of respondents that were interested in reducing possum numbers but had not thought about or were indifferent to the use of traps (quadrant 2) is consistent with the respondents in this quadrant exhibiting low to mild involvement with trapping possums.
3.2. Involvement Profiles
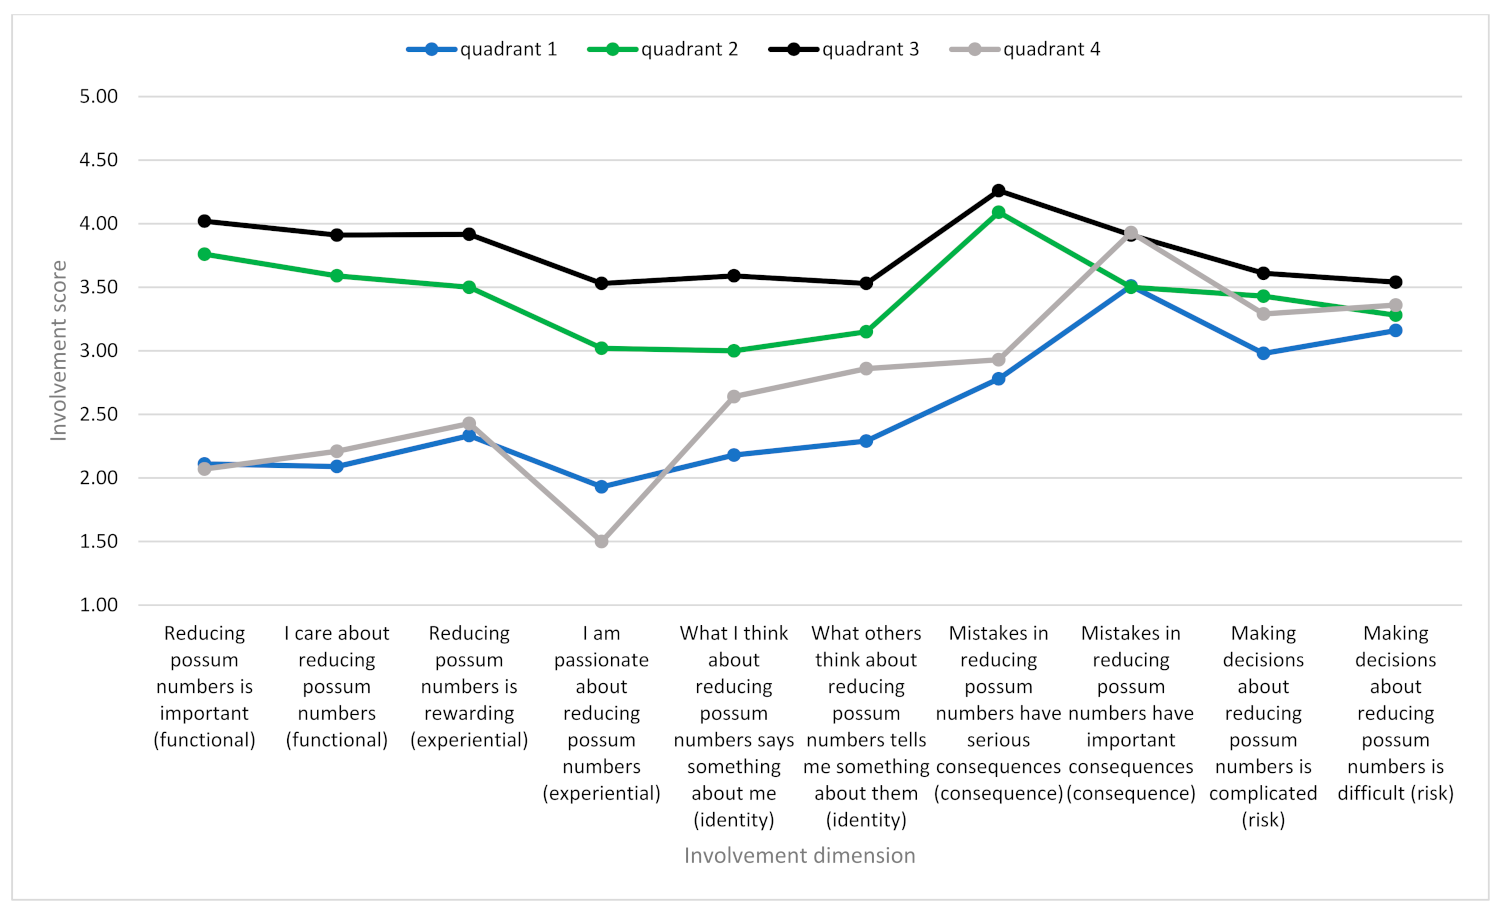
The involvement profiles of respondents in each quadrant with respect to reducing possum numbers are reported in Figure 3. The profiles represent the average score, for each of the involvement statements, of the respondents in each quadrant. On average, respondents exhibited higher involvement with the idea of reducing numbers of possums than with the idea of using traps to catch possums.
On average, respondents in quadrants two and three exhibit moderate functional, experiential, and identity involvement with the idea of reducing possum numbers. This implies that, to the degree these respondents were involved with the idea of reducing possum numbers, their involvement stems from concerns about the potentially unfavourable impact possums can have on their material wellbeing and enjoyment. These concerns could stem from the perceived impact of possums on biodiversity and the environment, as well as the risks they pose to human health and the damage they can inflict on buildings, gardens, and so forth. Respondents in quadrants one and four exhibited mild involvement in these dimensions. Respondents in all quadrants exhibited moderate consequence and risk involvement, suggesting they believe there is some risk that mistakes could be made with reducing possum numbers, and any such mistakes could have serious consequences.
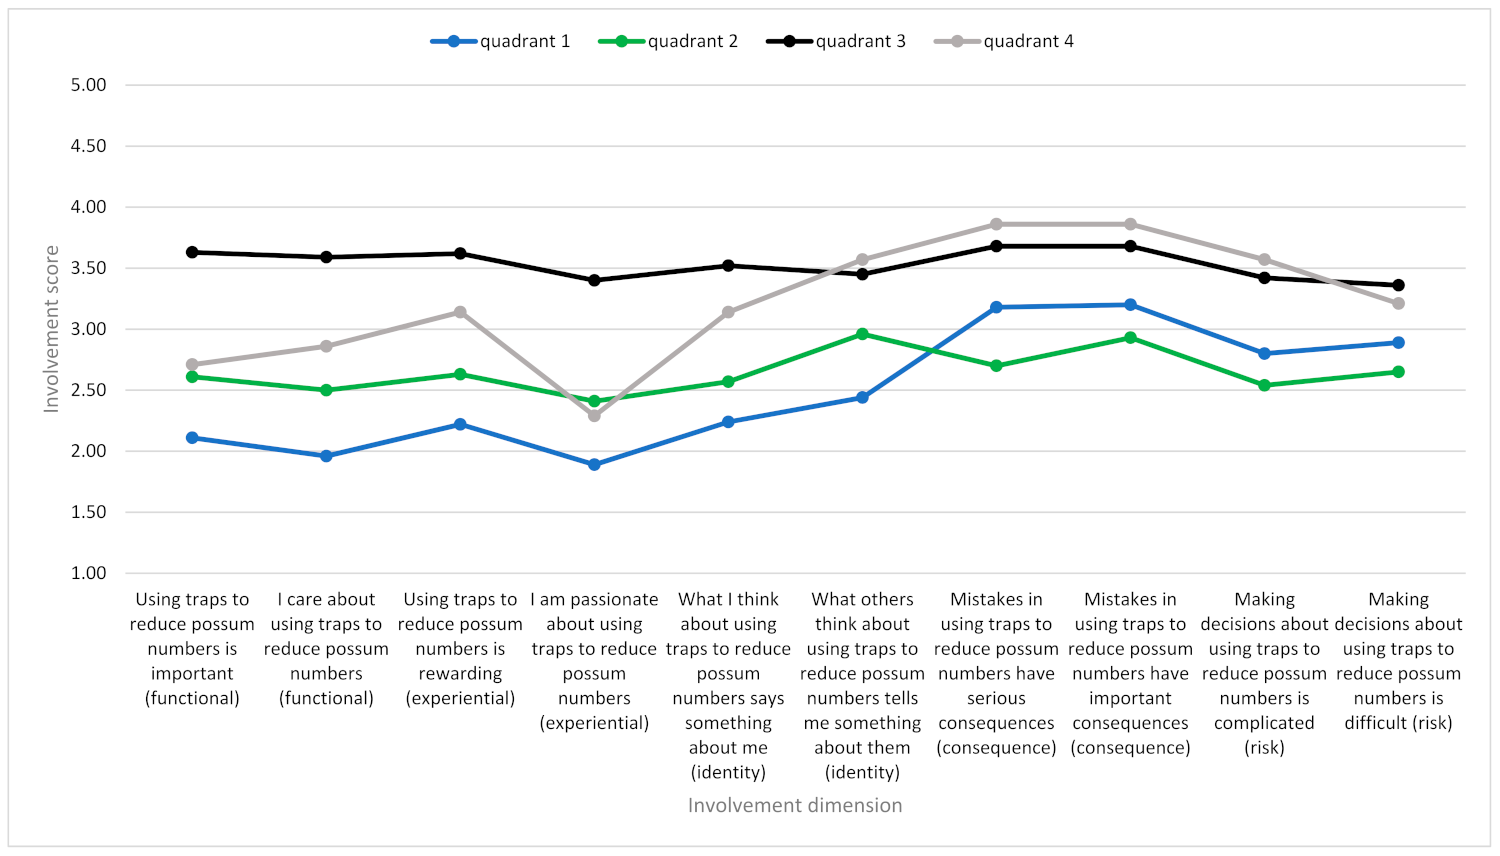
The involvement profiles of respondents in each quadrant with respect to using traps to reduce possum numbers are reported in Figure 4. Again, the profiles represent the average score, for each of the involvement statements, of the respondents in each quadrant. On average, with respect to the idea of using traps to reduce possum numbers, respondents in quadrant three exhibited moderate involvement across all the components of involvement.
Respondents in quadrant four exhibited mild involvement with most aspects of trapping possums but moderate consequence and risk involvement, suggesting they may be concerned about the consequences of making mistakes when trapping possums. Respondents in quadrants one and two primarily exhibit mild involvement with all aspects of the idea of using traps to reduce possum numbers.
Involvement with the idea of reducing possum numbers and involvement with the idea of using traps to reduce possum numbers was not related to the gender, education, income, or property type of respondents. There was a statistically significant, but inconsequential, association between age and involvement with the idea of reducing possum numbers, with older respondents exhibiting marginally higher involvement than younger respondents. There was no association between age and involvement with the idea of using traps to reduce possum numbers.
3.3. Involvement and Beliefs about Possums
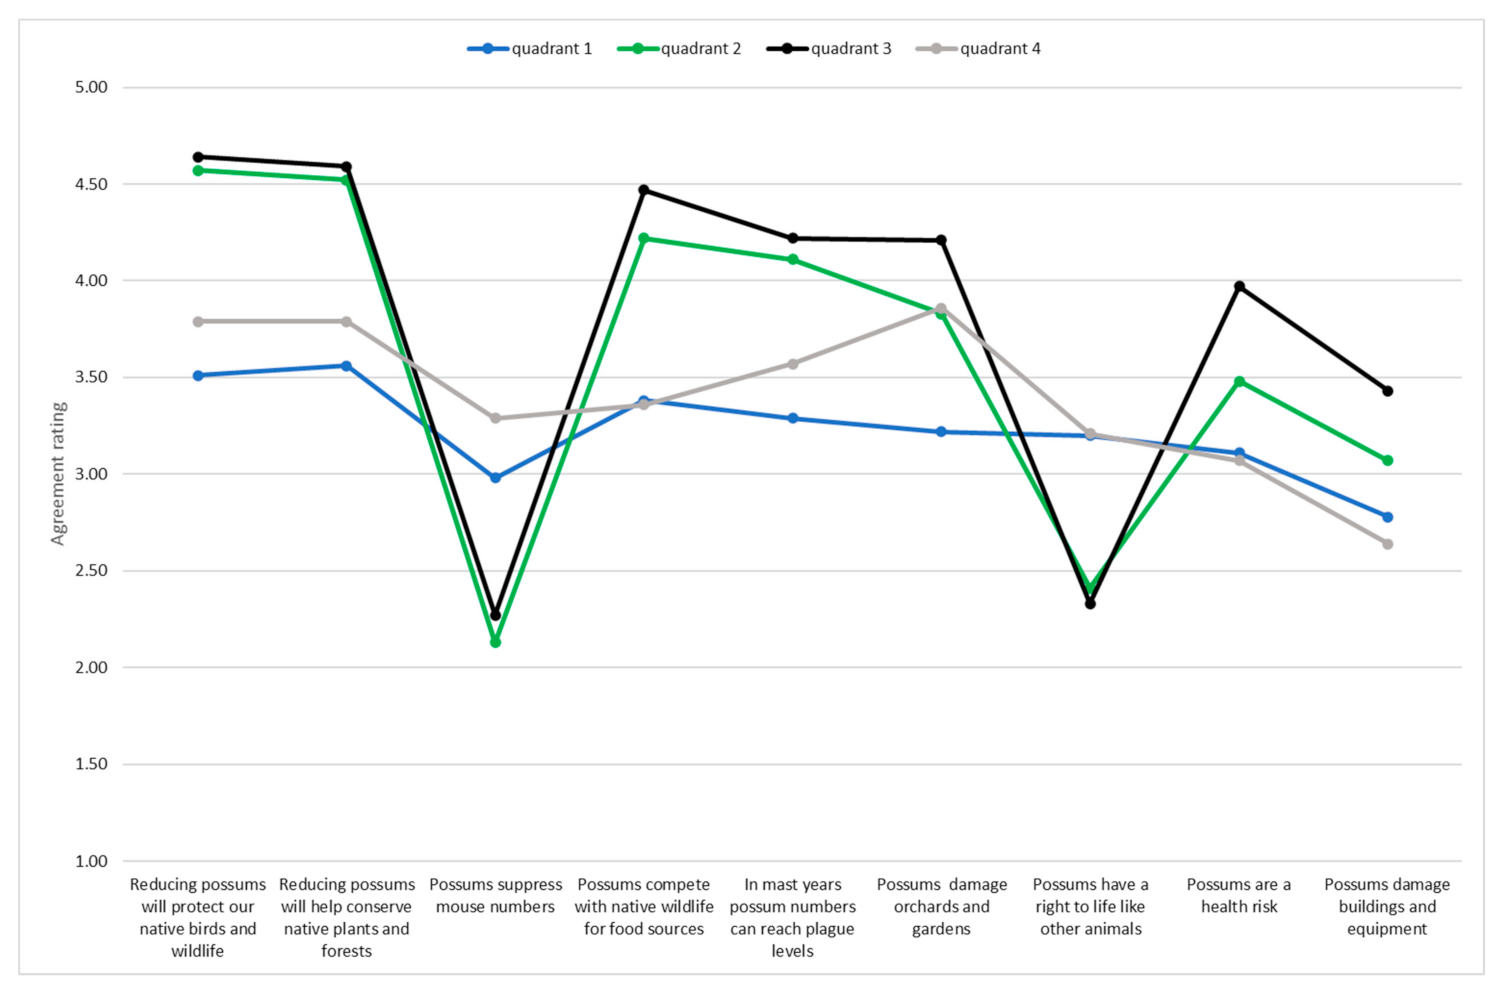
Respondents in quadrants two and three, representing 85 per cent of the sample, believe possum populations should be reduced to protect and conserve native birds and wildlife, as well as native plants and forests. They also believe possums damage orchards and gardens as well as buildings and equipment and that they are a risk to health (see Figure 5). They disagreed, on average, with the view that possums are as entitled to life as other animals.
We expected differences across the quadrants in respondents’ opinions about possums. Specifically, we hypothesised, because of their relatively low involvement with the idea of reducing possum numbers, that respondents in quadrant one would be less likely than respondents in other quadrants to express definite opinions about the unfavourable effects of possums on native plants, birds and animals, and on orchards, gardens, buildings and equipment.
This hypothesis was supported with respondents in quadrant one being less sure, on average, about the unfavourable effects of possums than respondents in quadrants two and three (see Figure 5).
On average, the opinions of respondents in quadrant four, who also have relatively low involvement with the idea of reducing possum numbers, were similar to those of respondents in quadrant one.
3.4. Involvement and Attitudes about Using Traps
The interaction between involvement and attitudes determines the types of strategies that may be employed to change the behaviour of people in each quadrant of the framework [9]. Consequently, both the direction and strength of respondents’ attitudes towards trapping possums were measured with a four-statement normative scale about trapping and a five-statement ipsative scale about trapping, respectively. Testing revealed respondents’ answers were consistent across the two scales, with respondents who indicated trapping was the ‘right thing to do’ on the ipsative scale displaying the most favourable scores, on average, on the normative scale. Correspondingly, respondents who indicated trapping was a ‘bad thing to do’ displayed the least favourable scores, on average, on the normative scale (see Table 6). Responses were also satisfactorily consistent with respect to attitudes towards pests generally and attitudes towards trapping possums, with the two measures being reasonably correlated (see Table 7).
On average, respondents in quadrant one were unsure about, or had a neutral attitude towards, trapping. Respondents in the other quadrants expressed a favourable attitude towards trapping, with respondents in quadrant three having the most favourable attitude (see Table 7). Respondents’ beliefs about the advantages and disadvantages of using traps to reduce possum numbers were broadly similar, on average, across the quadrants. However, respondents in quadrants two and three were less likely than respondents in quadrants one and four to believe that trapping was a danger to children, pets, or native birds, a risk to health or were inhumane, and more likely to agree that traps were more effective than baiting.
Overall, these results imply that there is widespread support for using traps to reduce possum numbers in Dunedin. This is consistent with the experience of community attitudes to predator control in Wellington [33].
3.5. Involvement and Possum Trapping Activity
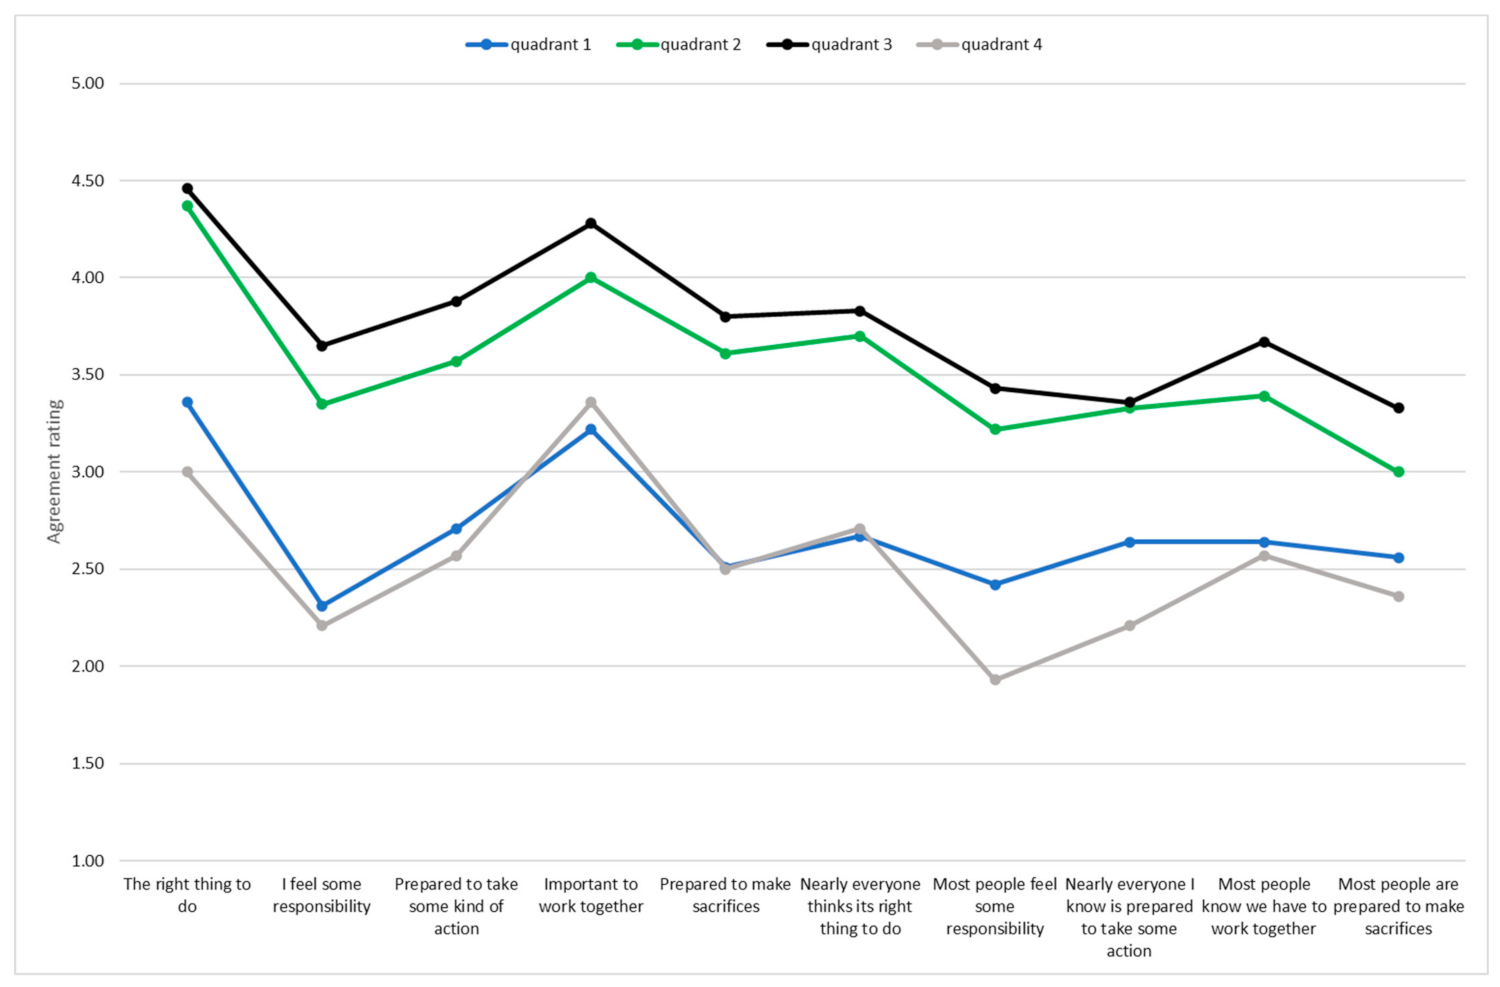
We expected differences across the quadrants in the degree to which respondents agreed that they were personally responsible for reducing possum numbers. Consistent with differences in their involvement with the idea of reducing possum numbers, respondents in quadrants two and three expressed stronger agreement than respondents in quadrants one and four, that reducing possum numbers was the right thing to do, that reducing possum numbers was their responsibility, and that they were willing to take action and make sacrifices to reduce possum numbers (see Figure 6).
We also hypothesised respondents who had higher involvement with the ideas of reducing possum numbers and with trapping (quadrant 3) would be more likely to actually trap possums than respondents who were less involved with these ideas (quadrants 1, 2, and 4). This hypothesis was supported (see Table 8). These results indicate that differences in motivation, as measured by involvement, are an important factor influencing trapping.
With one exception, there were no significant differences between respondents who were and were not trapping in their perceptions of the advantages and disadvantages of reducing possum numbers. The exception was the need to keep possums to suppress mice, with those that were trapping possums being less likely to agree that possums were needed to suppress mice.
Respondents who were trapping possums differed in their beliefs about the advantages and disadvantages of trapping from those who did not. Basically, those who were currently trapping had more favourable opinions of the cost-effectiveness, safety, and humaneness of trapping than those who were not. The latter were, on average, less certain about these qualities.
The proportion of respondents in each quadrant who were in favour of, unsure about, or against trapping possums is summarised in Table 9. The two largest groups of respondents in our sample were the respondents in quadrant three who either favoured, or were unsure about, trapping. Comparing these two groups confirms the importance that both involvement and attitude have on the propensity to trap. Approximately 19 per cent of respondents in quadrant three who favoured trapping reported they trapped possums. In contrast, only five per cent of respondents in quadrant three who were unsure about trapping reported they trapped possums.
Compared with respondents in quadrant three who favoured trapping, the respondents in this quadrant who were unsure about trapping were: (1) not as certain of the importance of reducing possum numbers and thought there was a greater chance of mistakes being made in trying to reduce possum numbers; (2) not as sure of the importance of using traps to reduce possum numbers and thought there was a greater chance of mistakes being made in using traps to reduce possum numbers; and (3) less sure of the advantages of trapping, and less confident about the safety and welfare aspects of trapping.
These results indicate that the propensity to trap is influenced by a person’s involvement with the idea of reducing possum numbers and their involvement with the idea of trapping. The propensity to trap is also influenced by beliefs about the advantages of trapping as a means of reducing possum numbers (such as the safety of pets) but not by beliefs about the advantages and disadvantages of reducing possum numbers (such as the positive impact of reducing possum numbers on native birdlife).
3.6. Experiences with Trapping Possums
We questioned respondents who currently trapped possums about their experiences with trapping. We questioned those who were not trapping about why they did not trap possums and what they imagined the experience of trapping would be like. Respondents were questioned about the emotional (affective) aspects of their experiences, real or imagined, and the reasoned (cognitive) aspects of their experiences, real or imagined. Cronbach’s alpha was 0.65 for affective aspects and 0.82 for cognitive aspects, respectively, indicating consistent responses [38]. The results are summarised in Table 10.
Respondents who were trapping strongly agreed that catching possums was inspiring, that they were encouraged and excited when they caught a possum, and that they felt that they were making a difference. They were not particularly concerned about the time taken to check traps and dispose of dead possums, or about becoming bored if they did not catch a possum (see Table 10).
On the other hand, respondents who were not trapping expressed only moderate agreement with the proposition that catching possums would be inspiring, that they would be encouraged and excited when they caught a possum, and were less likely to agree they would be making a difference. While they appeared unconcerned about the time taken to check traps and becoming bored if they did not catch a possum, they were more likely to be concerned about disposing of dead possums (see Table 10).
Respondents who were trapping strongly agreed that catching possums was useful, practical, helpful, set a good example for family, friends, and others, and made a difference (see Table 10). In contrast, respondents who were not trapping expressed only moderate agreement with the proposition that catching possums was useful, practical, helpful, set a good example for family, friends, and others, and made a difference. These respondents did appear to be slightly concerned about the safety of traps but did not prefer baiting to trapping and were not opposed to trapping (see Table 10).
These results suggest, first, that most respondents who did not trap would support (and not oppose) an urban trapping programme; and second, that many of these respondents would participate in such a programme, provided participation was inexpensive and required little effort; bearing in mind that a proportion of these respondents may already control possums by other means such as baiting.
4. Discussion
Kaine et al. [9] hypothesised that the propensity of people to change their behaviour and comply with a policy initiative depends, first, on the intensity of their involvement with the initiative and second, on their attitude towards the initiative. This is because cognitive effort is required to form a strongly held attitude, and such effort is only invested when the matter at hand is sufficiently important to the individual. They also hypothesised that the propensity of people to comply with an initiative depends on the interaction between their involvement with the policy issue that the initiative addresses and their involvement and possible attitude towards the initiative itself. Our results support these hypotheses.
The results confirmed there was a strong association between respondents’ propensity to trap possums, their involvement with the idea of reducing possum numbers and using traps and their attitude towards trapping. This means residents’ willingness to trap possums is not just a matter of their attitude towards trapping but also depends on how strongly motivated they are to reduce possum numbers.
Our results have several implications for designing strategies to encourage acceptance of, and participation in, a programme to control possums in Dunedin. Most respondents exhibited moderate involvement with reducing possum numbers and mild to moderate involvement with using traps. Most respondents also exhibited favourable attitudes towards reducing possums and using traps. These results indicate there is widespread support among residents of Dunedin for reducing possum numbers in the city and for using traps. This means many households in Dunedin would participate in an urban programme for trapping possums, either by installing and managing traps themselves or by permitting the installation of traps on their properties which could be serviced by programme volunteers. Given that most respondents exhibited only mild to moderate involvement with trapping, participation in the programme should be made as simple and easy as possible.
Knowing the primary reasons why residents want to reduce possum numbers provides a foundation for influencing their willingness to participate in a possum trapping programme. Our findings suggest residents’ desire to reduce possums in Dunedin is primarily motivated by concerns for biodiversity and the environment, the health of themselves and their families, and the potential for possums to damage property, gardens, and equipment. Consequently, to promote trapping and participation in a trapping programme, we suggest that attempts to encourage participation should concentrate on promoting the potential of urban trapping to reduce these harms.
A substantial proportion of respondents, nearly 30 per cent, were moderately involved in the idea of reducing possums and with the idea of trapping but were unsure of their attitude towards trapping. These respondents were less convinced of the benefits of trapping and were uncertain about the safety and welfare aspects of traps. Their moderate involvement with the idea of reducing possum numbers and with the idea of trapping indicates these respondents will be attentive to promotional information about trapping. Consequently, to encourage trapping and participation in a trapping programme among this group, we suggest promotional efforts should emphasise the safety of traps and the speed and efficacy with which they function.
Finally, the results indicated that respondents who did not trap were simply less interested in the problem of possums and in trapping compared to those that were. Although those who did not trap were aware of the advantages of reducing possum numbers, they were simply less enthusiastic about the benefits they might experience from trapping than those that trap. This supports our conclusion that most householders who do not trap would support (or at least not oppose) an urban trapping programme, and that many of these householders would participate in such a programme, provided participation was inexpensive and required little effort on their part (for example, traps were supplied and delivered to households for free). This is consistent with experience in predator control in Wellington [34].
5. Conclusions
The framework proposed by Kaine et al. [9] provides a systematic basis for government agencies to develop a mix of strategies that target relevant differences in the propensity of people to change their behaviour in response to a policy initiative.
Theoretically, and by application in a case study, we have shown the framework has merit in predicting the behavioural responses of people to an initiative and that the framework can be employed to help identify strategies to enhance compliance with an initiative beyond simple enforcement and promotion. Hence, the framework may provide a basis for targeting policy resources, thereby reducing the risk of over-investing in activities that are likely to have little impact on compliance or under-investing in alternative strategies that can strongly improve compliance.
With more people living in urban environments than ever before, it is critical that we understand how to protect natural environments that contribute to human health and wellbeing. One element is ensuring endemic species are protected from introduced predators, and the results of this research give clues as to how urban centres can design their pest control policies to ensure the conservation of valued species. Policies should be designed that target urban residents desire to increase biodiversity in their neighbourhood. Additionally, urban residents may need to be more familiar with the safety and effectiveness of control methods such as trapping to make them comfortable with having traps on their properties. Testing of these policy initiatives in contemporary urban pest control projects will help further validate our findings.
Author Contributions
Conceptualisation, G.K.; methodology, G.K.; writing—original draft preparation, G.K., N.K., R.K., D.S. and B.W.; writing—review and editing G.K. and N.K. All authors have read and agreed to the published version of the manuscript.
Funding
This research was funded by Predator Free Dunedin and Manaaki Whenua Landcare Research.
Institutional Review Board Statement
This research received social ethics approval through Manaaki Whenua Landcare Research’s internal social ethics process (application number 1920/29).
Informed Consent Statement
Informed consent was obtained from all subjects involved in this study.
Data Availability Statement
The data presented in this study are available on request from the corresponding author. The data are not publicly available to protect survey respondent confidentiality.
Acknowledgments
We would sincerely like to thank our survey respondents who readily gave up their time. We would also like to thank Vic Wright for commenting on an earlier draft of this article.
Conflicts of Interest
The authors declare no conflict of interest.
References
- McKinney, M.L.; Lockwood, J.L. Biotic homogenization: A few winners replacing many losers in the next mass extinction. Trends Ecol. Evol. 1999, 14, 450–453. [Google Scholar] [CrossRef]
- Goddard, M.A.; Dougill, A.J.; Benton, T.G. Scaling up from gardens: Biodiversity conservation in urban environments. Trends Ecol. Evol. 2016, 25, 90–98. [Google Scholar] [CrossRef]
- Ziter, C. The biodiversity-ecosystem service relationship in urban areas: A quantitative review. Okios 2016, 125, 761–768. [Google Scholar] [CrossRef]
- Wilson, N.; McIntyre, M.; Blaschke, P.; Muellner, P.; Mansoor, O.; Baker, M. Potential public health benefits from eradicating rats in New Zealand cities and a tentative research agenda. J. R. Soc. N. Z. 2018, 48, 280–290. [Google Scholar] [CrossRef]
- Almeida, A.; Corrigan, R.; Sarno, R. The economic impact of commensal rodents on small business in Manhattan’s Chinatown: Trends and possible causes. Suburb. Sustain. 2013, 1, 2. [Google Scholar] [CrossRef]
- German, D.; Latkin, C.A. Exposure to urban rats as a community stressor among low-income urban residents. J. Community Psych. 2016, 44, 249–262. [Google Scholar] [CrossRef]
- Department of Conservation (DOC). Towards a Predator Free New Zealand: Predator Free 2050 Strategy; Department of Conservation: Wellington, New Zealand, 2020.
- Russell, J.C.; Innes, J.G.; Brown, P.H.; Byrom, A.E. Predator-Free New Zealand: Conservation Country. BioScience 2015, 65, 520–525. [Google Scholar] [CrossRef] [Green Version]
- Kaine, G.; Murdoch, H.; Lourey, R.; Bewsell, D. A framework for understanding individual response to regulation. Food Policy 2010, 35, 531–537. [Google Scholar] [CrossRef]
- Predator Free Dunedin. Available online: https://pf2050.co.nz/project/predator-free-dunedin/#:~:text=Dunedin%20%3A%20Predator%20Free%202050%20Limited&text=The%20Predator%20Free%20Dunedin%20project,predator%20control%20investments%20by%20OSPRI (accessed on 31 May 2021).
- Feng, A.; Himsworth, C. The secret life of the city rat: A review of the ecology of urban Norway and black rats (Rattus norvegicus and Rattus rattus). Urban Ecosyst. 2013, 17, 149–162. [Google Scholar] [CrossRef]
- Himsworth, C.G.; Jardine, C.M.; Parsons, K.L.; Feng, A.; Patrick, D.M. The characteristic of wild rat (Rattus spp.) populations from an inner-city neighborhood with a focus on factors critical to the understanding of rat-associated zoonoses. PLoS ONE 2014, 9, e91654. [Google Scholar] [CrossRef]
- Youngsteadt, E.; Henderson, R.C.; Savage, A.M.; Ernst, A.F.; Dunn, R.R.; Frank, S.D. Habitat and species identify, not diversity, predict the extent of refuse consumption by urban arthropods. Glob. Chang. Biol. 2015, 21, 1103–1115. [Google Scholar] [CrossRef]
- Priluck, R.; Till, B.D. The role of contingency awareness, involvement and need for cognition in attitue formation. J. Acad. Mark. Sci. 2004, 32, 329–344. [Google Scholar] [CrossRef]
- Herr, P.M.; Fazio, R.H. The attitude-to-behavior process: Implications for consumer behavior. In Advertising Exposure, Memory, and Choice; Mitchel, A.A., Ed.; Lawrence Erlbaum Associates: Mahwah, NJ, USA, 2008; pp. 119–140. [Google Scholar]
- McLeod, L.J.; Hine, D.W.; Please, P.M.; Driver, A.B. Applying behavioral theories to invasive animal management: Towards and integrated framework. J. Environ. Manag. 2015, 161, 63–71. [Google Scholar] [CrossRef]
- Derbaix, C.; Vanden Abeele, P. Consumer inferences and consumer preferences: The status of cognition and consciousness in consumer behavior theory. Int. J. Res. Mark. 1985, 2, 63–71. [Google Scholar] [CrossRef]
- Assael, H. Consumer Behavior and Marketing Action; South Western College Publishing: Cincinnati, OH, USA, 1998. [Google Scholar]
- Oliver, R.L. Need fulfilment in a consumer satisfaction context. In Satisfaction: A Behavioral Perspective on the Consumer; Oliver, R.L., Ed.; Irwin/McGraw Hill: New York, NY, USA, 1997; pp. 135–161. [Google Scholar]
- Verbeke, W.; Vackier, I. Profile and effects of consumer involvement in fresh meat. Meat Sci. 2006, 67, 159–168. [Google Scholar] [CrossRef]
- Celsi, R.L.; Olson, J.C. The role of involvement in attention and comprehension processes. J. Consum. Res. 1988, 15, 210–224. [Google Scholar] [CrossRef]
- Poiesz, T.B.C.; Bont, C.J.P.M. Do we need involvement to understand consumer behavior? Adv. Consum. Res. 1995, 15, 210–224. [Google Scholar]
- Laurent, G.; Kapferer, J.-N. Measuring consumer involvement profiles. J. Mark. Res. 1985, 22, 41–53. [Google Scholar] [CrossRef]
- Dholakia, U.M. A motivational process model of product involvement and consumer risk perception. Eur. J. Mark. 2001, 35, 1340–1360. [Google Scholar] [CrossRef]
- Murdoch, H.; Bewsell, D.; Lourey, R.; Kaine, G. Understanding people’s response to biosecurity regulation. In Proceedings of the 3rd National Conference on Risk Management, Auckland, New Zealand, 25–27 August 2006. [Google Scholar]
- Thaler, R.H.; Sunstein, C.R. Nudge: Improving Decisions about Health, Wealth, and Happiness; Yale University Press: New Haven, CT, USA, 2009. [Google Scholar]
- Davies, A.; Kaine, G.; Lourey, R. Understanding Factors Leading to Non-Compliance with Effluent Regulations by Dairy Farmers; Technical Report 2007/37; Environment Waikato: Hamilton, New Zealand, 2007.
- Kaine, G.; Tostovrsnik, N. Landholders and the Management of Weeds: Blackberry and Serrated Tussock; Service Design Research Working Paper 03-11; Department of Primary Industries: Tatura, Australia, 2011.
- Lourey, R.; Kaine, G.; Davies, A.; Young, J. Landholder Responses to Incentives for Wild Dog Control; Service Design Research Working Paper 07-11; Department of Primary Industries: Tatura, Australia, 2011.
- Kaine, G.; Kirk, N. Householders Interest in Urban Possum Control in Dunedin; Landcare Research Report LC3744; Manaaki Whenua–Landcare Research: Hamilton, New Zealand, 2020. [Google Scholar]
- Kaine, G.; Stronge, D. An Application of the I3 Framework to Rat Control in New Plymouth; Landcare Research Report LC3734; Manaaki Whenua–Landcare Research: Hamilton, New Zealand, 2020. [Google Scholar]
- Kaine, G.; Kannemeyer, R.; Stronge, D. Using 1080 to Control Possums and Rats: An Application of the I3 Framework; Landcare Research Report LC3747; Manaaki Whenua–Landcare Research: Hamilton, New Zealand, 2020. [Google Scholar]
- 92% of Wellingtonians Support a Predator Free Wellington. Available online: https://www.pfw.org.nz/news/92-of-wellingtonians-support-a-predator-free-wellington/ (accessed on 31 May 2021).
- After Thousand of Conversations We’re Almost There! Available online: https://www.pfw.org.nz/news/after-thousands-of-conversations-were-almost-there/ (accessed on 31 May 2021).
- Kaine, G. A Pilot Application of the I3 Framework to Compliance Behavior in Farming; Contract Report LC3513; Manaaki Whenua–Landcare Research: Hamilton, New Zealand, 2019. [Google Scholar]
- Olsen, S.O. Strength and conflicting valence in measurement of food attitudes and preferences. Food Qual. Prefer. 1999, 10, 483–494. [Google Scholar] [CrossRef]
- Aley, J.P.; Milfont, T.L.; Russell, J.C. The pest-management attitude (PMA) scale: A unidimensional and versatile assessment tool. Wildl. Res. 2020, 47, 166–176. [Google Scholar] [CrossRef]
- Carmines, E.G.; Zeller, R.A. Reliability and Validity Assessment; Sage: Beverley Hills, CA, USA, 1979. [Google Scholar]
Figure 1.
I3 Response framework. Note. Bold text describes the strength of motivation with respect to the policy outcome (e.g., reducing possums) and the policy initiative (e.g., subsidised traps). Plain text describes potential measures to promote compliance with the initiative (source: adapted from [9]).
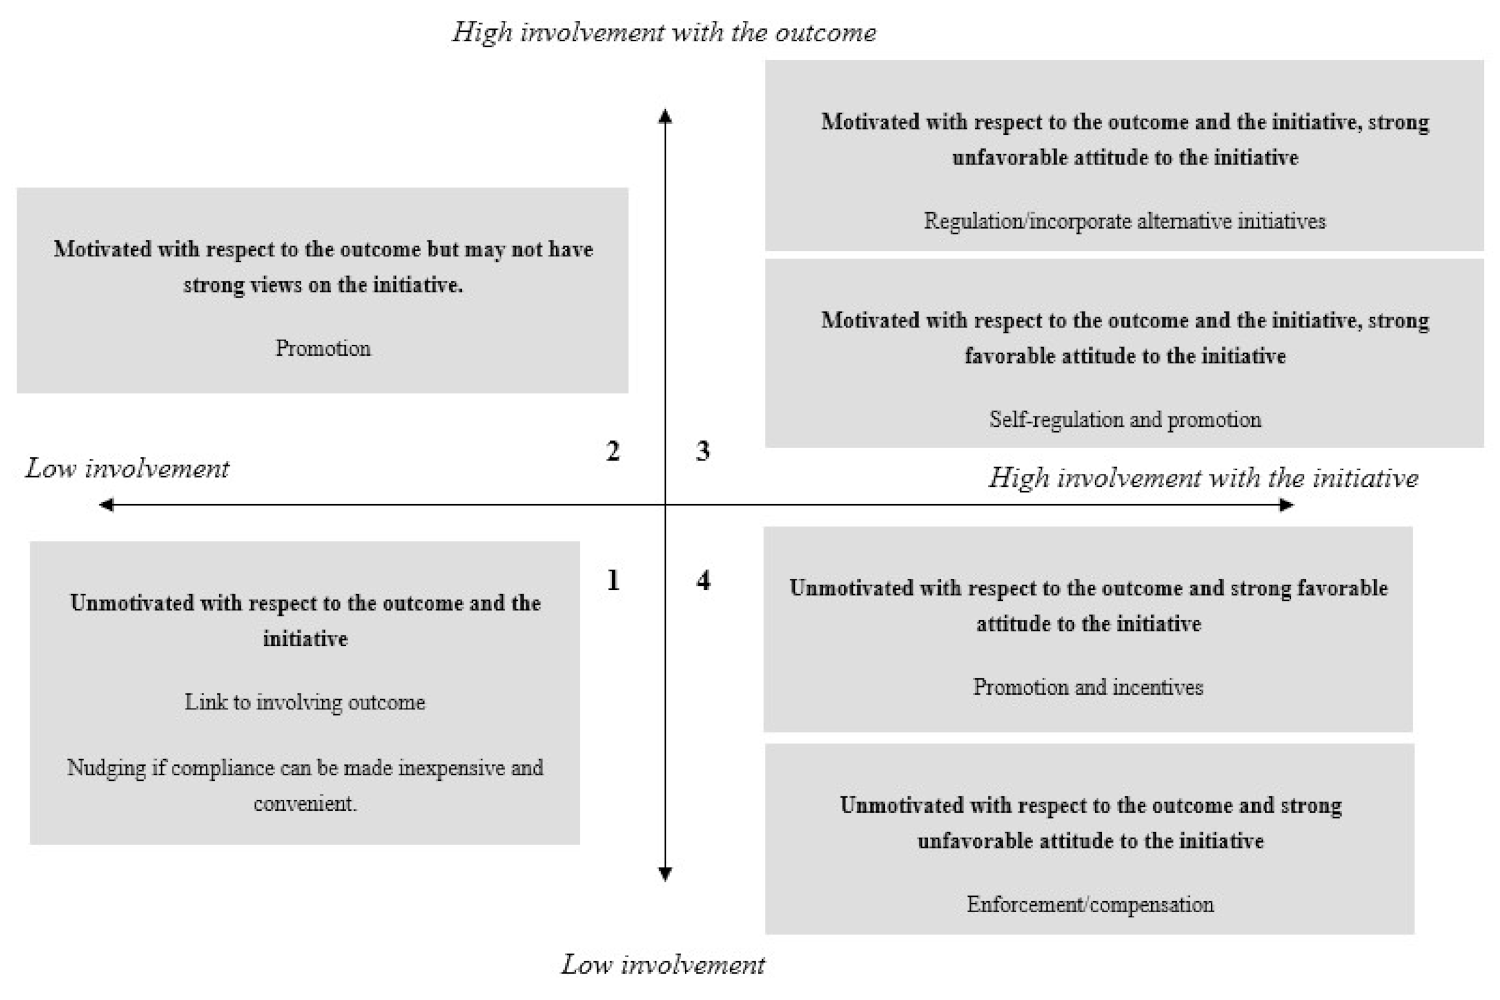
Figure 2.
I3 mapping of involvement with the idea of reducing possum numbers and the idea of using traps.
Figure 2.
I3 mapping of involvement with the idea of reducing possum numbers and the idea of using traps.

Figure 3.
Involvement profiles for the idea of reducing possum numbers.

Figure 4.
Involvement profiles for the idea of using traps to reduce possum numbers.

Figure 5.
Respondents’ beliefs about the advantages and disadvantages of reducing possum numbers.

Figure 6.
Respondents’ beliefs about responsibility for reducing possum numbers.


Table 1.
I3 classification.
| Quadrant | Proportion of Sample % |
|---|---|
| One—indifferent | 11.1 |
| Two—involved with reducing possum numbers | 11.4 |
| Three—involved with reducing possum numbers and with using traps | 74.0 |
| Four—involved with using traps | 3.5 |
Table 2.
Mean involvement by I3 quadrant.
| Involvement with Reducing Possum Numbers 1 | Involvement with Using Traps to Reduce Possum Numbers 2 | |
|---|---|---|
| Quadrant 1 | 2.54 b,c | 2.49 c,d |
| Quadrant 2 | 3.43 a,c,d | 2.65 c,d |
| Quadrant 3 | 3.78 a,b,d | 3.54 a,b |
| Quadrant 4 | 2.72 b,c | 3.22 a,b |
Note: 1 test for difference in means across quadrants (F = 131.5, p < 0.01), 2 test for difference in means across quadrants (F = 152.6, p < 0.01), a significantly different from Quadrant 1 using Tukey’s LSD (p < 0.01), b significantly different from Quadrant 2 using Tukey’s LSD (p < 0.01), c significantly different from Quadrant 3 using Tukey’s LSD (p < 0.01), d significantly different from Quadrant 4 using Tukey’s LSD (p < 0.01).
Table 3.
Attitude towards trapping possums.
| Attitude | Proportion of Sample % |
|---|---|
| Right thing to do | 48.8 |
| Does not matter to me | 13.1 |
| Not sure | 15.6 |
| Have not given it much thought | 17.1 |
| Bad thing to do | 5.4 |
Table 4.
Involvement and attitude towards trapping possums.
| Attitude | Involvement with Reducing Possum Numbers 1 | Involvement with Using Traps to Reduce Possum Numbers 2 |
|---|---|---|
| Right thing to do | 3.82 b,c,d,e | 3.53 b,c,d,e |
| Does not matter to me | 3.33 a | 3.08 a |
| Not sure | 3.40 a | 3.19 a |
| Have not given it much thought | 3.26 a | 3.06 a |
| Bad thing to do | 3.27 a | 3.02 a |
Note: 1 test for difference in means across attitude categories (F = 21.4, p < 0.01), 2 test for difference in means across attitude categories (F = 18.8, p < 0.01), a significantly different from (1) using Tukey’s LSD (p < 0.01), b significantly different from (2) using Tukey’s LSD (p < 0.01), c significantly different from (3) using Tukey’s LSD (p < 0.01), d significantly different from (4) using Tukey’s LSD (p < 0.01), e significantly different from (5) using Tukey’s LSD (p < 0.01).
Table 5.
I3 classification and attitude towards trapping possums.
| Attitude | Quadrant 1 | Quadrant 2 | Quadrant 3 | Quadrant 4 |
|---|---|---|---|---|
| Right thing to do | 13.3 | 21.7 | 59.5 | 21.4 |
| Does not matter to me | 31.3 | 21.7 | 8.4 | 28.6 |
| Not sure | 17.8 | 17.4 | 15.1 | 14.3 |
| Have not given it much thought | 24.4 | 28.3 | 14.0 | 21.4 |
| Bad thing to do | 13.3 | 10.9 | 3.0 | 14.3 |
Note: values are proportion of respondents in each quadrant. Test for differences in proportions across quadrants (χ2 = 68.9, p < 0.01).
Table 6.
Consistency in attitudes towards trapping possums.
| Attitude Statements (Ipsative Scale) | Attitude towards Trapping Possums (Normative Scale) 1 | Attitude towards Pests (Normative Scale) 2,3 |
|---|---|---|
| Right thing to do | 4.42 b,c,d,e | 3.76 c,d,e |
| Does not matter to me | 3.75 a,c,e | 3.55 e |
| Not sure | 3.24 a,b,e | 3.51 a |
| Have not given it much thought | 3.52 a,e | 3.50 a |
| Bad thing to do | 1.82 a,b,c,d | 3.10 a,b |
Note: Values are mean scores of respondents on the normative scale for each ipsative attitude category. 1 Test for differences in means across attitude categories (F = 121.1, p < 0.01), 2 test for differences in means across attitude categories (F = 10.7, p < 0.01), 3 Pest-Management Attitude scale [37], a significantly different from (1) using Tukey’s LSD (p < 0.01), b significantly different from (2) using Tukey’s LSD (p < 0.01), c significantly different from (3) using Tukey’s LSD (p < 0.01), d significantly different from (4) using Tukey’s LSD (p < 0.01), e significantly different from (5) using Tukey’s LSD (p < 0.01).
Table 7.
I3 classification and attitudes towards trapping possums.
| Attitude towards Trapping 1 | Attitude towards Pests 2,3 | |
|---|---|---|
| Quadrant 1 | 3.07 c | 3.21 b,c |
| Quadrant 2 | 3.54 c | 3.72 a,d |
| Quadrant 3 | 4.05 b,c | 3.69 a,d |
| Quadrant 4 | 3.32 | 3.06 b,c |
Note: 1 Test for differences in in means across quadrants (F = 21.6, p < 0.01), 2 test for differences in means across quadrants (F = 16.4, p < 0.01), 3 Pest-Management Attitude scale [37], a significantly different from Quadrant 1 using Tukey’s LSD (p < 0.01), b significantly different from Quadrant 2 using Tukey’s LSD (p < 0.01), c significantly different from Quadrant 3 using Tukey’s LSD (p < 0.01), d significantly different from Quadrant 4 using Tukey’s LSD (p < 0.01).
Table 8.
I3 classification and proportion of respondents that currently trap possums 1.
| Proportion of Quadrant % | |
|---|---|
| Quadrant 1 | 2.2 |
| Quadrant 2 | 2.2 |
| Quadrant 3 | 13.4 |
| Quadrant 4 | 0.0 |
Note: 1 Test for differences in proportions across quadrants (χ2 = 11.0, p = 0.01).
Table 9.
I3 classification and attitudes towards trapping possums 1.
| Favourable | Unsure/Neutral | Unfavourable | Total | |
|---|---|---|---|---|
| Quadrant 1 | 1.5 | 8.2 | 1.4 | 11.1 |
| Quadrant 2 | 2.6 | 7.7 | 1.2 | 11.5 |
| Quadrant 3 | 44.1 | 27.7 | 2.2 | 74.0 |
| Quadrant 4 | 0.7 | 2.2 | 0.5 | 3.4 |
| Total | 48.9 | 45.8 | 5.3 | 100 |
Note: Values are percentage of sample, 1 test for differences in in proportions across quadrants (χ2 = 58.3, p < 0.01).
Table 10.
Real and imagined experience with trapping.
| Statement | Currently Trap Possums | Do Not Trap |
|---|---|---|
| Affective: | ||
| Trapping is rewarding | 3.95 | – |
| Trapping is inspiring * | 4.26 | 3.51 |
| Catching possums is exciting * | 3.36 | 2.80 |
| Catching possums is encouraging * | 4.38 | 3.35 |
| Trapping makes a difference * | 4.41 | 2.79 |
| Wish checking traps was easier * | 2.93 | 2.54 |
| Boring when you do not catch possums | 2.76 | 2.41 |
| Dislike disposing of dead possums | 3.00 | 3.42 |
| Cognitive: | ||
| Trapping is useful * | 4.64 | 3.76 |
| Trapping is practical * | 4.57 | 3.71 |
| Trapping is helpful * | 4.48 | 3.77 |
| Set a good example for family and friends * | 4.1 | 3.12 |
| Set a good example for people around me * | 4.12 | 3.15 |
| Naïve or simplistic to think trapping makes a difference * | 2.07 | 2.92 |
| Safety: | ||
| Scared of hurting myself | – | 2.89 |
| Traps might injure children | – | 2.78 |
| Traps might accidentally catch pets | – | 3.52 |
| Preference: | ||
| Oppose using traps | – | 2.30 |
| I prefer baits | – | 2.45 |
| Just not interested | – | 3.08 |
Notes: * indicates F-test for difference in means across quadrants was significant (p < 0.01)—indicates statement was not included in the questionnaire for respondents in this category.
Publisher’s Note: MDPI stays neutral with regard to jurisdictional claims in published maps and institutional affiliations. |
© 2021 by the authors. Licensee MDPI, Basel, Switzerland. This article is an open access article distributed under the terms and conditions of the Creative Commons Attribution (CC BY) license (https://creativecommons.org/licenses/by/4.0/).
Share and Cite
MDPI and ACS Style
Kaine, G.; Kirk, N.; Kannemeyer, R.; Stronge, D.; Wiercinski, B. Predicting People’s Motivation to Engage in Urban Possum Control. Conservation 2021, 1, 196-215. https://0-doi-org.brum.beds.ac.uk/10.3390/conservation1030016
AMA Style
Kaine G, Kirk N, Kannemeyer R, Stronge D, Wiercinski B. Predicting People’s Motivation to Engage in Urban Possum Control. Conservation. 2021; 1(3):196-215. https://0-doi-org.brum.beds.ac.uk/10.3390/conservation1030016
Chicago/Turabian StyleKaine, Geoff, Nicholas Kirk, Robyn Kannemeyer, Dean Stronge, and Ben Wiercinski. 2021. "Predicting People’s Motivation to Engage in Urban Possum Control" Conservation 1, no. 3: 196-215. https://0-doi-org.brum.beds.ac.uk/10.3390/conservation1030016