Article

A State-of-the-Art Vegetation Map for Jordan: A New Tool for Conservation in a Biodiverse Country

1
School of Geosciences, The University of Edinburgh, Edinburgh EH9 3FF, UK
2
Centre for Middle Eastern Plants, Royal Botanic Garden Edinburgh, Edinburgh EH3 5LR, UK
3
Department of Land, Water and Environment, School of Agriculture, The University of Jordan, Amman 11942, Jordan
*
Author to whom correspondence should be addressed.
Submission received: 21 January 2022 / Revised: 18 February 2022 / Accepted: 24 February 2022 / Published: 3 March 2022

Abstract

:
In many countries, including Jordan, the updating of vegetation maps is required to aid in formulating development and management plans for agriculture, forest, and rangeland sectors. Remote sensing data contributes widely to vegetation mapping at different scales by providing multispectral information that can separate and identify different vegetation groups at reasonable accuracy and low cost. Here, we implemented state-of-the-art approaches to develop a vegetation map for Jordan, as an example of how such maps can be produced in regions of high vegetation complexity. Specifically, we used a reciprocal illumination technique that combines extensive ground data (640 vegetation inventory plots) and Sentinel-2 satellite images to produce a categorical vegetation map (scale 1:50,000). Supervised classification was used to translate the spectral characteristics into vegetation types, which were first delimited by the clustering analyses of species composition data from the plots. From the satellite image interpretation, two maps were created: an unsupervised land cover/land use map and a supervised map of present-day vegetation types, both consisting of 18 categories. These new maps should inform ecosystem management and conservation planning decisions in Jordan over the coming years.

1. Introduction

If natural resources are to be managed sustainably, it is crucial to assess land cover/land use and the spatial distribution of vegetation types. This is also helpful for protecting habitats and for providing data for vegetation cover modelling. Our goal here is to derive accurate maps and cover estimates for vegetation in Jordan through the use of both field study and satellite imagery. Jordan is a region of high vegetation complexity and provides an ideal testing ground for methods in land cover and vegetation type mapping.
Since Alexander von Humboldt first began categorising vegetation zones in 1807, biogeographers have classified the planet into chorological units. Prior to his work, it was typical to focus on individual plants; Humboldt shifted this towards a more collective focus on species—their distribution, growth forms, and how they relate to their surroundings [1]. This new approach meant that communities and associations among plants were able to be identified [2]. August Grisebach utilised this new approach to develop what would become known as phytogeographic regions, including the Mediterranean and Irano–Turanian regions, according to the species composition and physiognomy of individual vegetation groups [2,3].
Jordan is situated at the meeting point of Europe, Asia, and Africa [4]. This is rare among countries, as four main plant geographical regions meet at this point. The first person to map these areas was Eig [5,6], who used his analysis of plant lists and assessment of the physiognomic characteristics of the region’s geography and topography to develop his maps. He denoted four main units for this region, all with discrete climate and flora: Irano–Turanian, Mediterranean, Saharo–Sindian, and minor Sudano–Decanian enclaves. Eig’s [5] findings revealed that around 30% of plant species were found in two or more phytogeographic regions. Attempts have been made by researchers such as Whyte to either amend the existing boundaries or to subdivide the regions further [4]; moreover, Zohary posited that as more reliable analytical tools are devised, more appropriate boundary changes may be possible [3].
The research of Zohary [3] into the origins and categorisation of Middle Eastern vegetation has been the standard by which phytogeography in the region has been interpreted for much of the last five decades. His work separated Arabia into two main floral areas, with the southern region belonging to the Sudano–Decanian, and the central and northern regions to the Saharo–Sindian [3]. This was not disputed until 1991, when White and Léonard [7] revised Zohary’s approach and extended the Somalia–Masai Regional Centre of Endemism and the Afro–Montane archipelago-like Regional Centre of Endemism into southwest Arabia and divided their Saharo–Sindian zone into the Nubo–Sindian subzone, which represents the old Sudano–Decanian tropical vegetation, of Zohary (with Vachellia tortilis), and the Saharo–Arabian subzone (extra-tropical vegetation), which represents (in Jordan) the Saharo–Sindian of Zohary (with Vachellia gerardii). White and Léonard suggested that the Saharo–Sindian and Irano–Turanian zones are the two main phytochoria that influence Jordan [7], with each further subdivided subsequently into smaller, Middle East region-specific phytochoria [8], as illustrated in Figure 1.
Expanding on the work of Long [9], Al-Eisawi [10] determined that there are nine bioclimatic areas in Jordan, which are categorised into four overarching clusters: Saharan Mediterranean (cool, warm, very warm); arid Mediterranean (cool, warm, very warm); semi-arid Mediterranean (cool, warm); and sub-humid Mediterranean. Later, Al-Eisawi [11] also created a map based on the delineations made by Zohary [3] of the regions of vegetation in the Middle East.
The flora in the region under study is very species rich due to the area being situated at the meeting point of three phytogeographic regions [3,11,12,13]. The land changes from Mediterranean maquis and forests to grassland, steppes, and extremely arid desert biomes within a relatively short space. While edaphic influences do have an effect on vegetation, it is the climate that has a greater impact [13]. As well as vegetation being influenced by environmental pressures, human activities also affect the way plants are distributed. Some research has accounted for forestry, agriculture, and grazing potential along with human activity when classifying vegetation [9,14,15,16].
The vegetation types of the region have also been mapped. While earlier work (e.g., [3,5,6]) was conducted prior to modern development and experienced fewer restrictions on political boundaries, other modern works were either restricted by political boundaries or the study was conducted across limited borders based on extensive fieldwork [11,14,16,17]. The most recent and updated map of vegetation for Jordan was produced by Albert et al. [14]. The map included 19 vegetation types and was primarily based on topography and coarse-resolution satellite images to describe vegetation cover of the country at a scale of 1:1 M. However, no map to date has combined state-of-the-art earth observation approaches with extensive field data to ground-truth remote sensing data.
Remote sensing data have contributed to land cover and vegetation type mapping by applying advanced digital classification techniques to derive both land cover and vegetation types at different spatial resolutions [18]. For vegetation mapping, the outputs from digital classification of remotely sensed data are intensively used to map land cover dynamics [19], floristic diversity, phytogeography [20], and vegetation [21] over large geographic areas. In order to identify and map land cover and vegetation in a continuous manner, remote sensing is vital. Data from sensors such as Landsat, MODIS, Sentinel, SPOT, and ASTER can be obtained cheaply or free of charge, with some providing wide swath-width images (over 290 km).
Vegetation mapping of Jordan is now urgently required so that appropriate and effective planning can be made for managing agriculture, afforestation, and rangeland, and for the degradation of habitats to be reduced. Prior research has been less than ideal for a multitude of reasons; for instance, studies did not utilise satellite imaging, were not comprehensive enough, or did not include field observations to support mapping and definition of the areas under investigation. Further, much of the existing research fails to include data from maps based on land use, geological or meteorological information, vegetation sampling, or GIS methodologies, and often does not utilise herbarium specimens or pictures to identify the species found in each region.
Taking all of the abovementioned points into consideration, it is clear that no study currently exist that describes Jordan’s vegetation in a spatial context for use in mapping or restoring particular kinds of vegetation. This would be extremely useful in the management and conservation of the country’s biodiversity [22]. Hence, the aim of the current study is to map and classify the vegetation cover of Jordan using a combination of the latest satellite data, extensive ground data, and state-of-the-art statistical approaches.

2. Materials and Methods

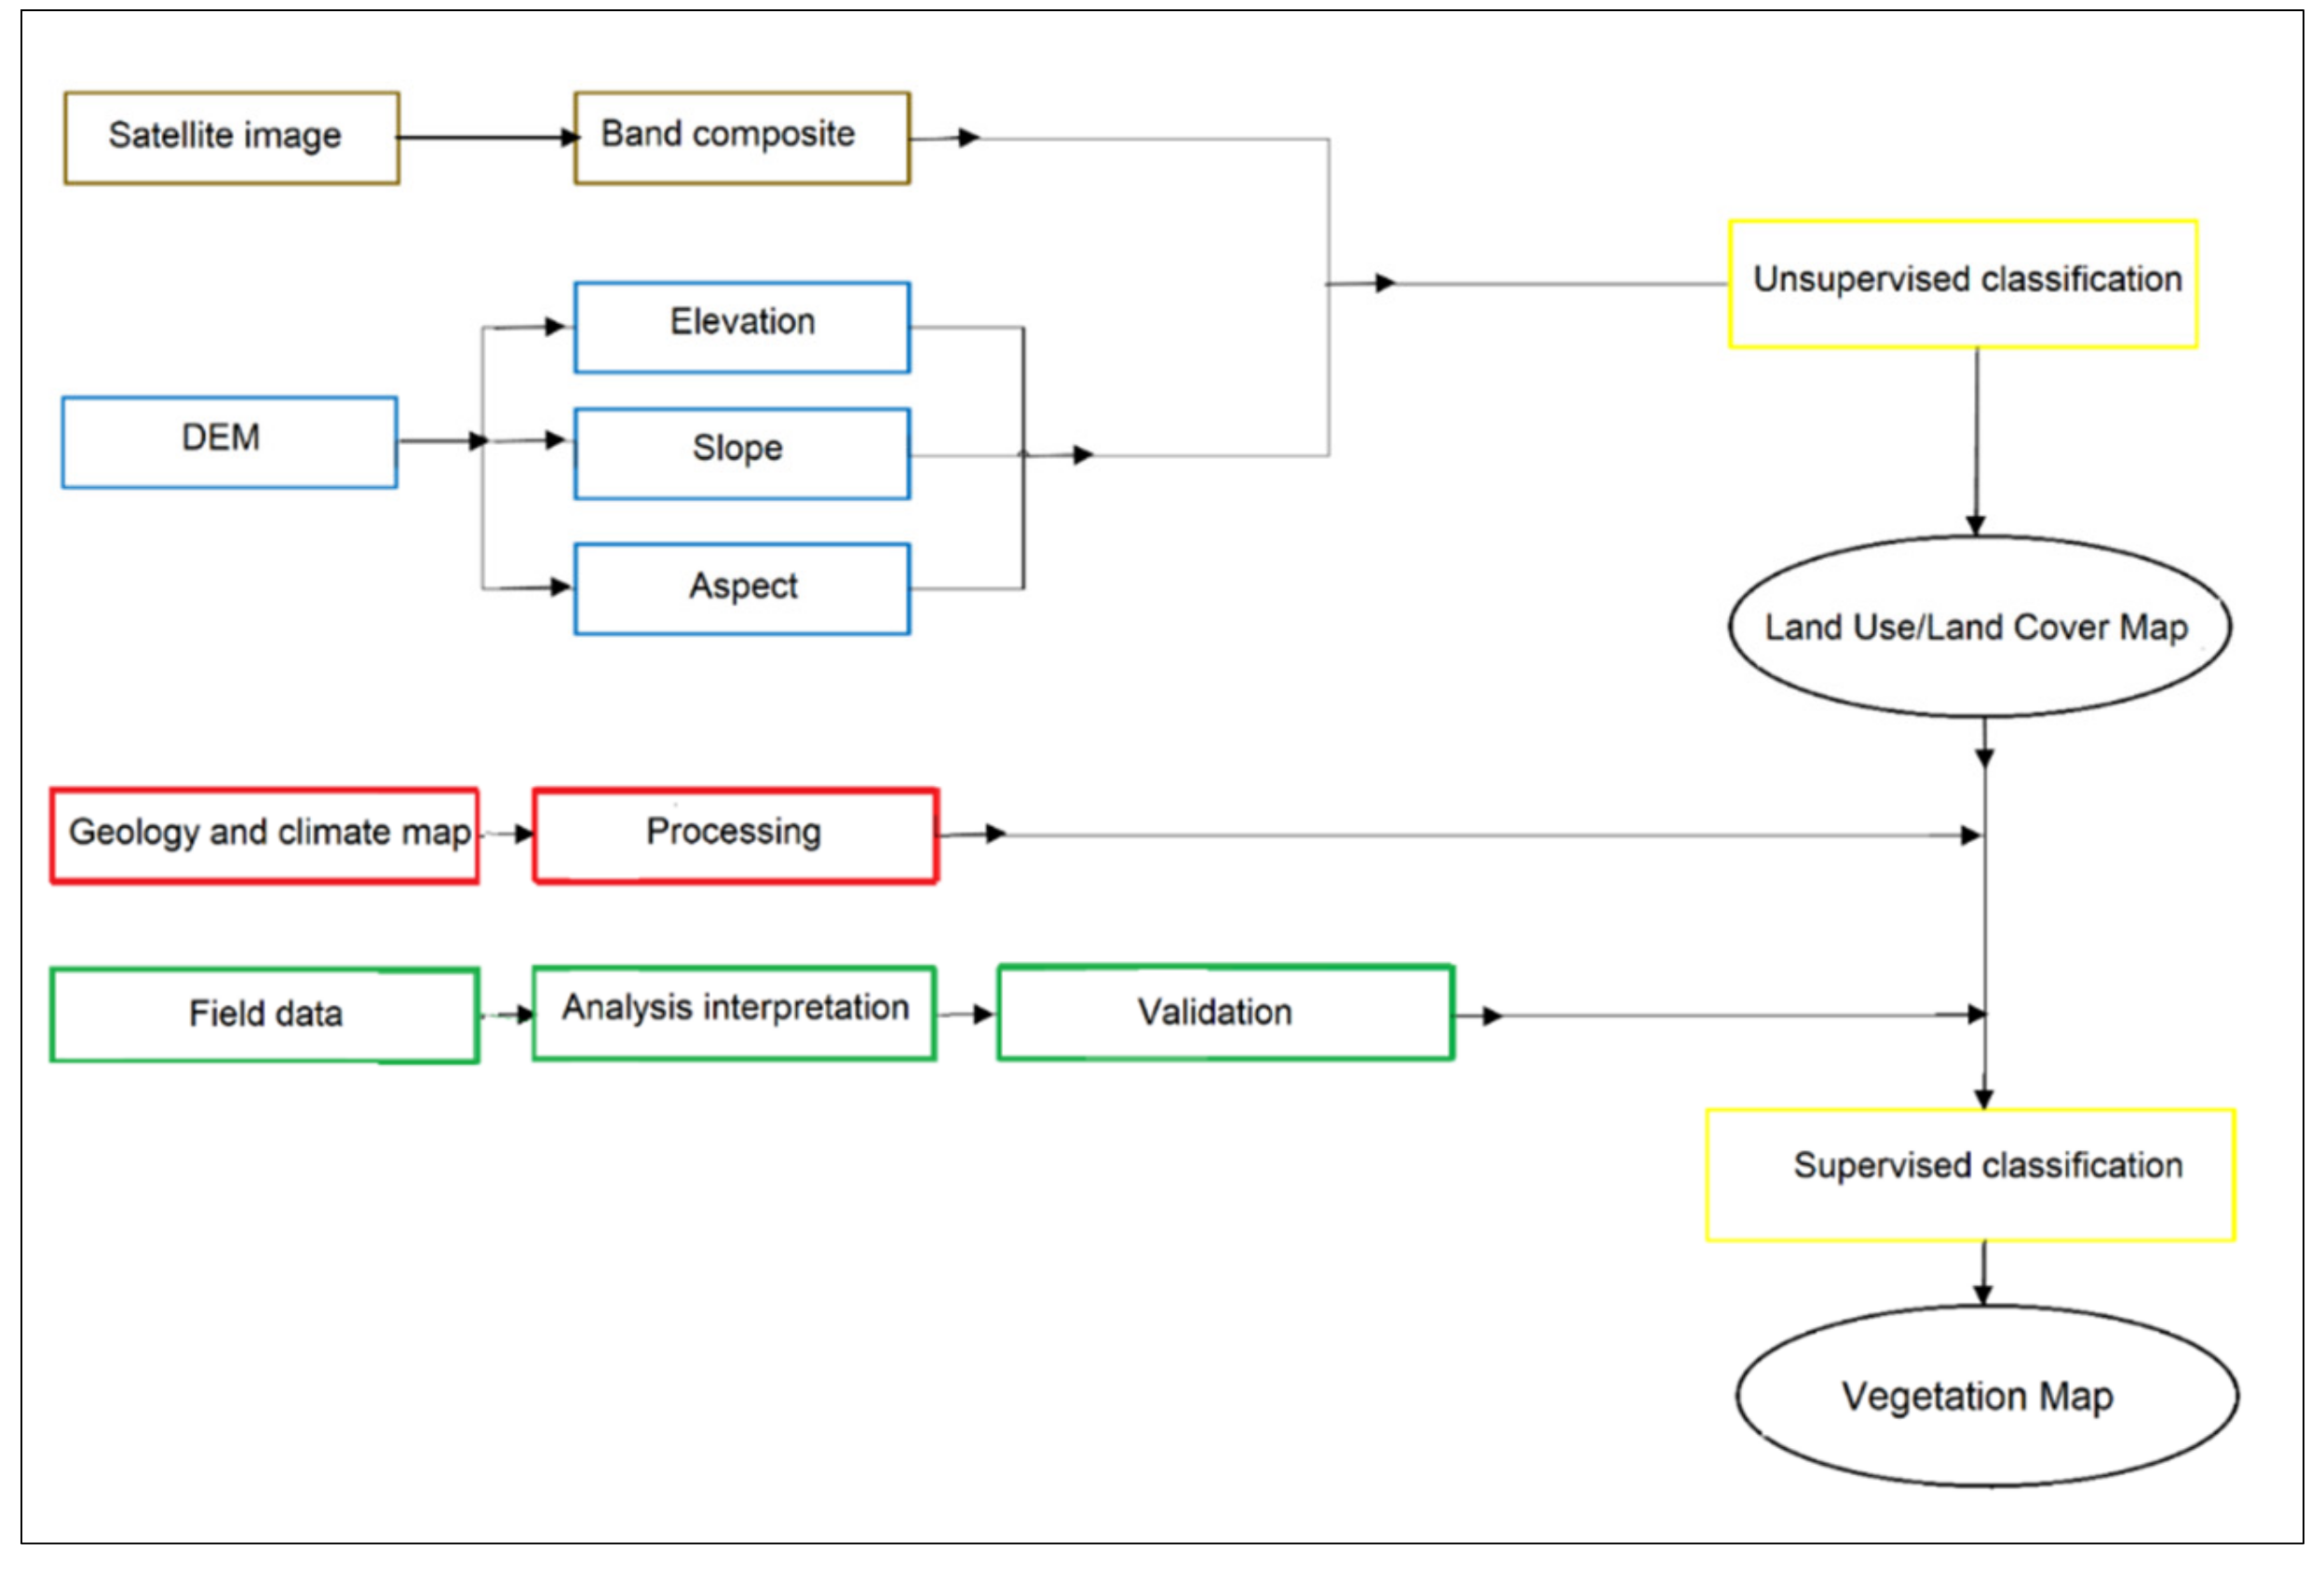
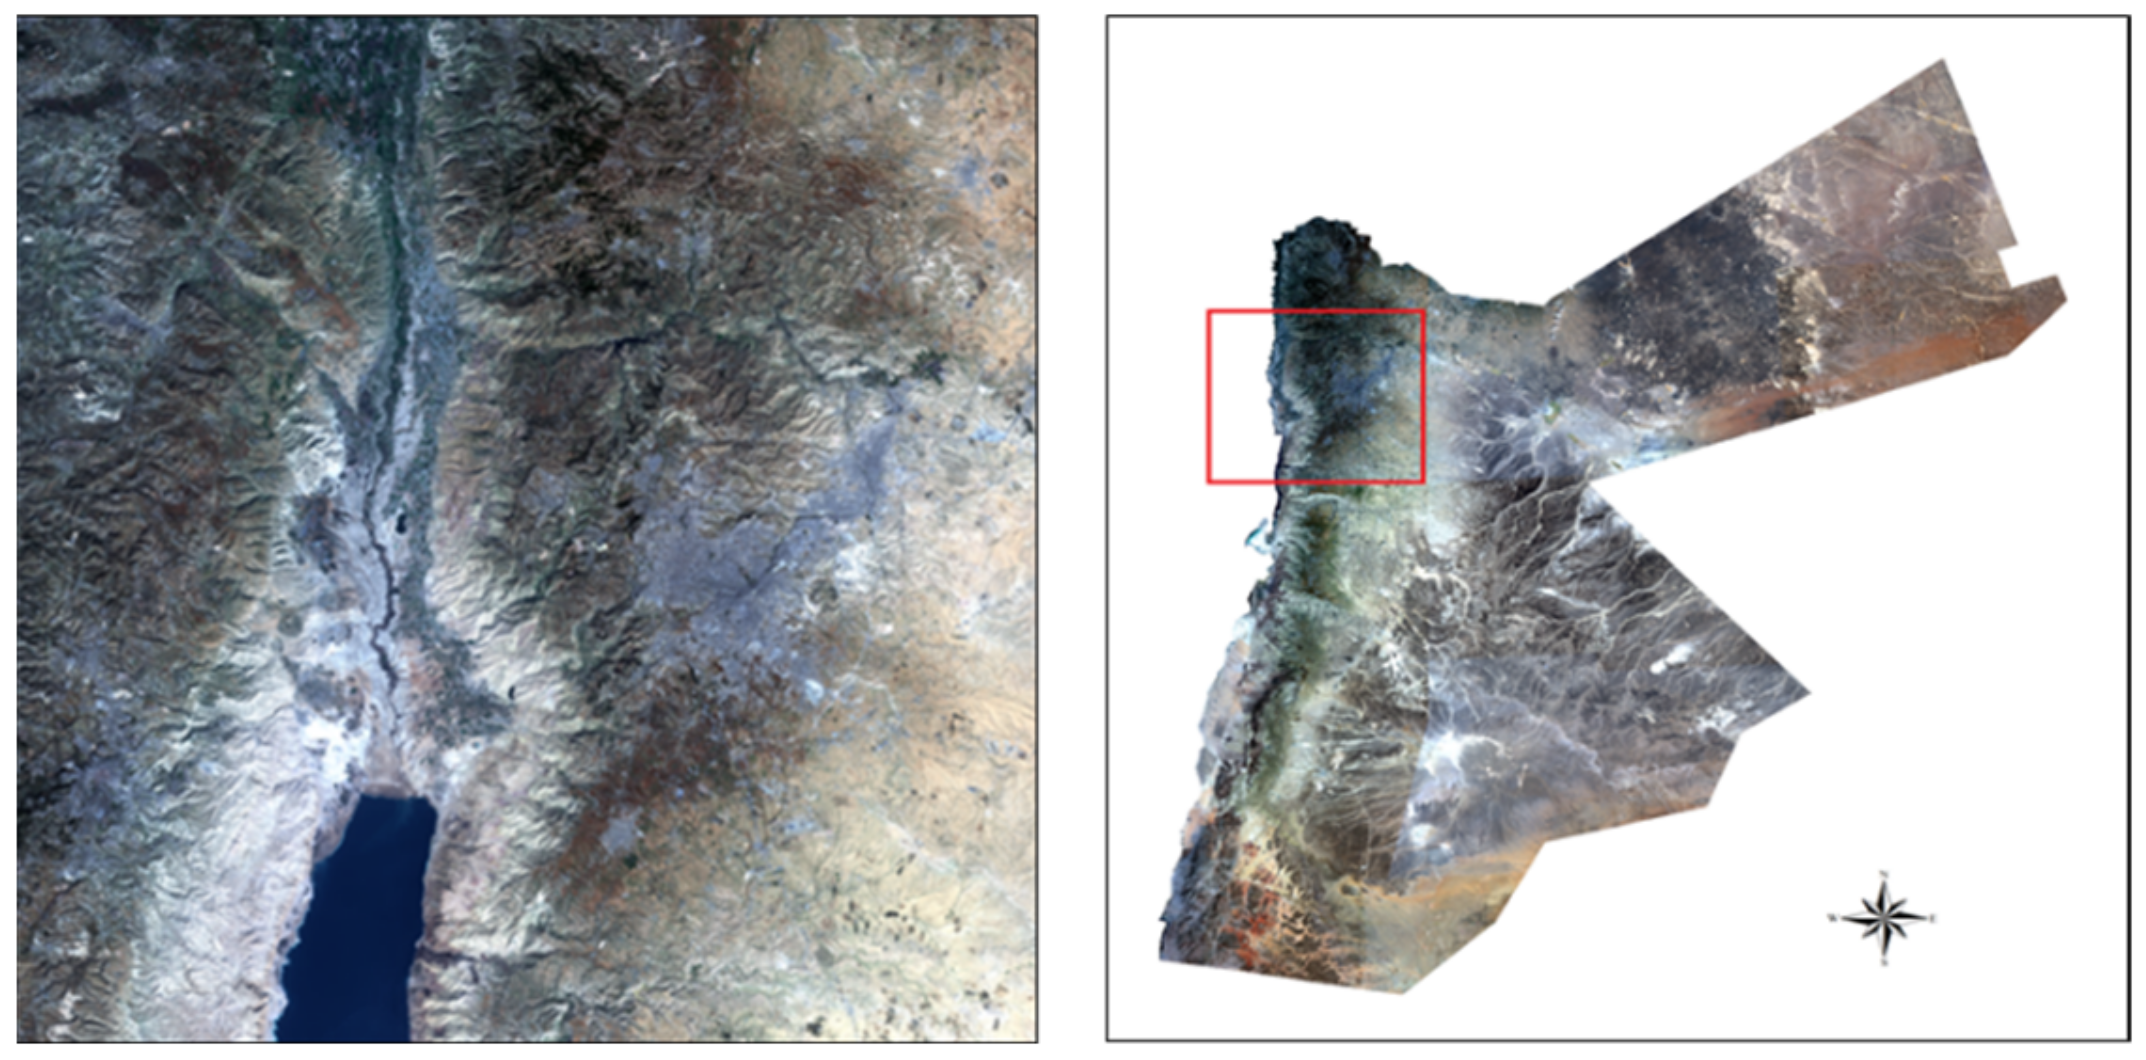
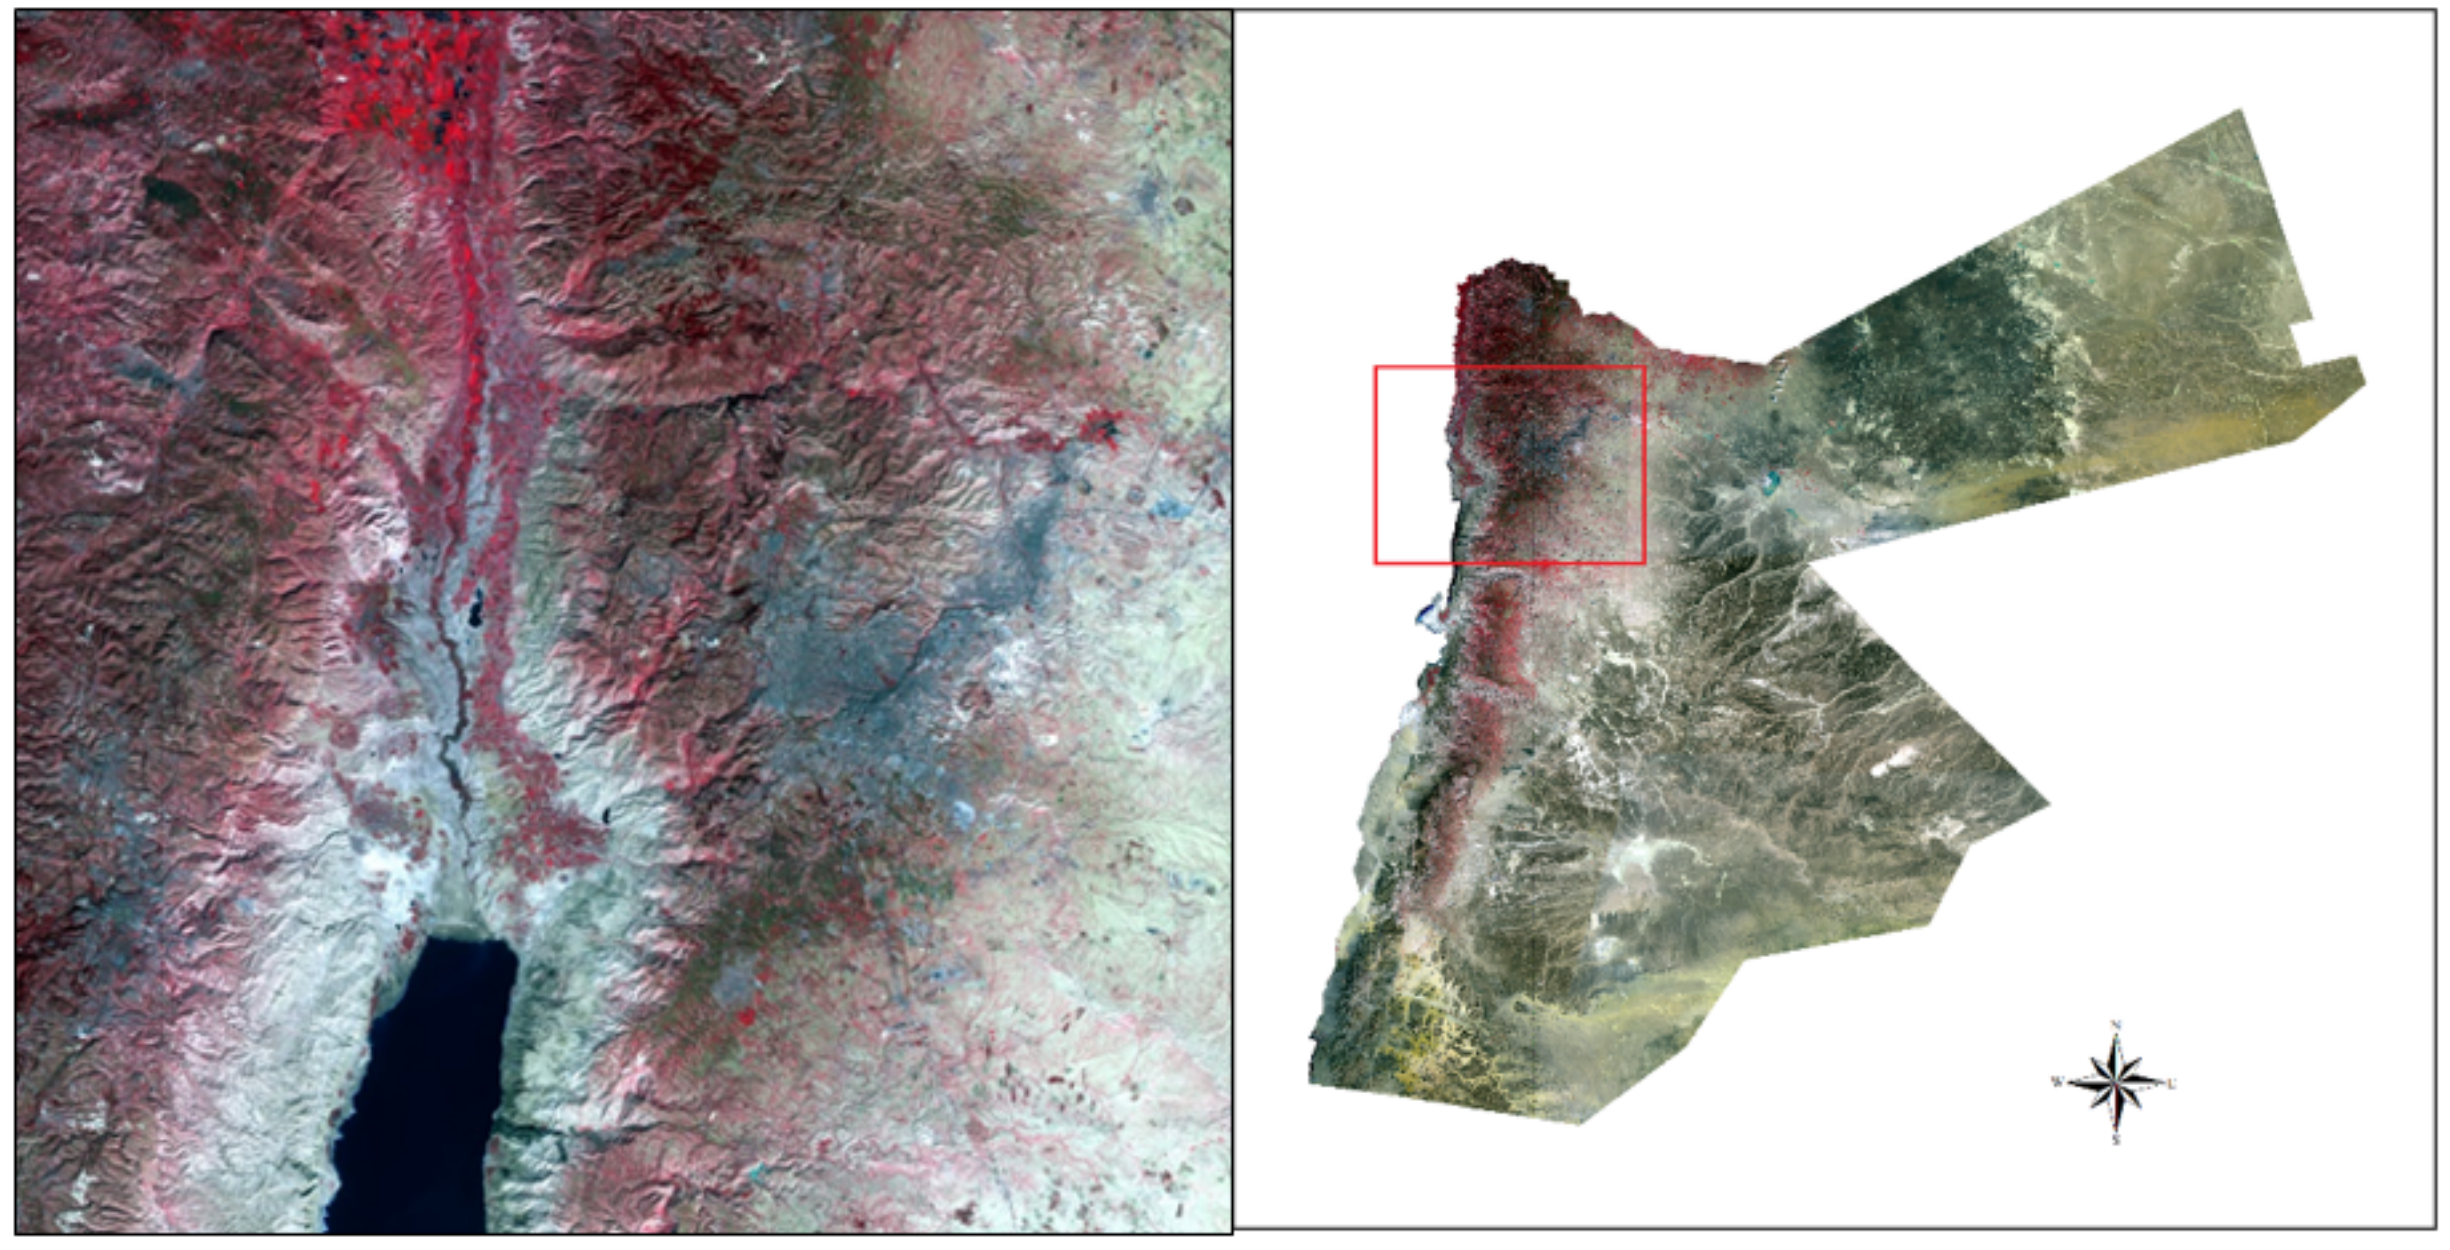
2.1. Processing of Remote Sensing Data

For the main floral groups to be displayed and a map of the vegetation to be produced (1:50,000 scale), it was necessary to define the types of vegetation present by utilising a reciprocal illumination approach between on-the-ground sampling and satellite imagery, as illustrated in Figure 2. The first step was to examine Sentinel-2 satellite images of Jordan to assess how well they correlate with known land cover classes, using Al-Bakri et al.’s land cover map [23]. Then, a more up-to-date land cover/land use map was created. The third step was more specialised and involved assessing how compatible the satellite images were with existing maps of the vegetation. Finally, decisions were made regarding where field sampling and ground-based verification were needed. The study of sufficient samples was confirmed within the known vegetation types in satellite images, and a minimum of 30 sample areas were collected for each hypothesised class of the produced land cover/land use map.
A digital elevation model (DEM) was used to represent the bare ground topographic surface of the earth excluding trees, buildings, and any other surface objects. The information from the geological map was useful in this area, as the map indicated shallow soil depth in this area as well as the presence of a marble layer close to the surface. This shallow soil has a high salt content as these areas receive marginal rainfall. The climatic data (i.e., isohyets of rainfall and temperature) were very useful to classify some types of vegetation (i.e., thermophilous vegetation in Jordan Valley).
Several data sources can be used for obtaining remotely sensed data. The current study utilised the United States Geological Service (USGS) EarthExplorer website (https://earthexplorer.usgs.gov/ (accessed on 30 October 2017)) to obtain Sentinel-2A images and prepare them for ArcMap usage. Eighteen cloud-free Sentinel-2A images were selected for use in this study. Individual bands of Sentinel-2 images were examined and used to create a natural colour composite, which is an important step to understand how to combine these bands for use in visualisation and analysis. Other spectral bands contain information that is very useful for visualisation and is used in later stages (e.g., false colour combinations were used in this study to identify urban area boundaries). The Sentinel-2 Multi-Spectral Instrument (MSI) has a span of 13 spectral bands from the visible and the near-infrared to the shortwave infrared at different spatial resolutions ranging from 10 to 60 metres on the ground. Of all those bands, only the four bands at 10 m resolution that gave information about vegetation cover were composited and used: bands 2, 3, 4, and 8. Images taken from Sentinel-2 were pre-processed, mosaicked, and clipped so that the images were calibrated. The images were pre-processed so that land cover/land use could be interpreted visually. Two techniques can be used to classify vegetation from images: supervised and unsupervised, with each method selected according to whether or not ground data are included. In supervised classification, training data collected from ground observations are used to initiate spectral signatures of the land cover types. The method has the advantage of the final map being comprised of known classes. Supervised classification approaches tend to give more accurate results in homogenous landscapes and when enough training data are available. Unsupervised classification methods have the advantage of separating spectral classes without prior knowledge of the area and without training data. Therefore, when mapping thematically from imagery, unsupervised methods are commonly employed [24].
In this study, unsupervised classification was used for mapping the land cover/land use of the country, while supervised classification was carried out to derive a vegetation map based on vegetation type clusters obtained from ground surveys of the species composition of vegetation. In this hybrid approach, classification accuracy was improved using both auxiliary data and a wide range of expert knowledge [25,26]. Hybrid supervised and unsupervised classification methods were adopted, along with the field experience of the first author, so that a greater degree of accuracy could be obtained within a shorter timeframe. Further, ArcGIS 10.5.1 software and the Sentinel Toolbox Sen2cor plugin were utilised for classification of images taken from the satellite and for simplifying the spectral data.

2.2. Using Unsupervised Classification to Produce Land Use/Land Cover Map

An unsupervised technique was employed to produce a baseline map from which vegetation sampling sites could be located. This was also used to update the land cover/land use map for Jordan. Ancillary datasets were used to develop an initial overview of the area under investigation, and then land cover/land use maps from the Jordan Land Cover Atlas [27], Al-Bakri et al. [23], and geological and soil maps from the Ministry of Agriculture of Jordan were also consulted [28]. Unsupervised classifications are determined by automatic software calculation of pixel similarity. For instance, forest pixels can be differentiated from water pixels by automatically grouping these pixels based on their spectral characteristics.
First, the visible spectrum (RGB) was utilised to visualise the landscape in natural colour. Figure 3 shows the resulting images. However, it was necessary to assess the full spectral capabilities of Sentinel-2 to acquire a better understanding of the nature of the area under study through the different colour composites of the multispectral data. Therefore, the images of Sentinel-2 were displayed in both true colour (TCC) and false colour (FCC) composites. Both combinations showed different characteristic of vegetation and land cover. The TCC reflected the variations in soils and rocks (Figure 3), while the FCC reflected the variations in natural vegetation and agricultural areas (Figure 4). In addition, spectral indices were produced for the study. Such indices are used for highlighting the landscape’s geological features, bodies of water, and vegetation. Here, the data were cut down and changed into more meaningful information using ratios between bands to transform the spectral data: NDVI = (NIR-Red)/(NIR+Red).
Typically, many classes are identified during analysis, and these are then honed and grouped more precisely to obtain more meaningful classes of features. We did this using the unsupervised method known as the Iterative Self-Organising Data Analysis Technique (ISODATA). The ISODATA method was preferred over the K-means method as splitting and merging of clusters was possible, so that the final number of classes would not be limited to the number identified by the trainer [18]. In this study, unsupervised classification was initiated with 30 spectral clusters, and the image pixels were then clustered into groups using ISODATA. Ground reference data and researchers’ expertise were then used to judge some of the clusters before a thematic urban land cover/land use map was produced. The classes were interpreted using two methods. The first involved interpreting images visually using field experience and feature attributes from high-resolution images taken from Google Earth. The second method was an automatic process using the vegetation index thresholds of feature attributes in each polygon. A visual interpretation was used for most of the mapping and the final results were checked using global positioning systems (GPS), topographic maps, and a number of field visits.

2.3. Field Data

We sampled the vegetation in order to validate vegetation types in the field. GPS data were gathered from the centre of homogeneous areas with respect to vegetation. Field surveys were conducted based on the previously produced land cover/land use map. A plan was made to sample 640 (50 × 50 m) plots during autumn 2017, spring and autumn 2018, and spring 2019. For each land cover class, approximately 30 sample areas were gathered [29], sometimes including multiple vegetation types. The percentage canopy cover for each layer (tree, shrub, and herbaceous layers) found in the sampling units was recorded. For all trees, shrubs, and perennial herbaceous plant species, the percentage of cover across the entire plot was estimated.
All of the vascular plants that could be identified to the sub-species level were listed for each of the vegetation classification plots. To accomplish this task, the team relied upon the experience of the first author, gained from his work as a botanist at the Royal Botanic Garden of Jordan for nearly 15 years. The Angiosperm Phylogeny Group (APG IV 2016) classification was followed along with a checklist of Jordan’s vascular plants [30].

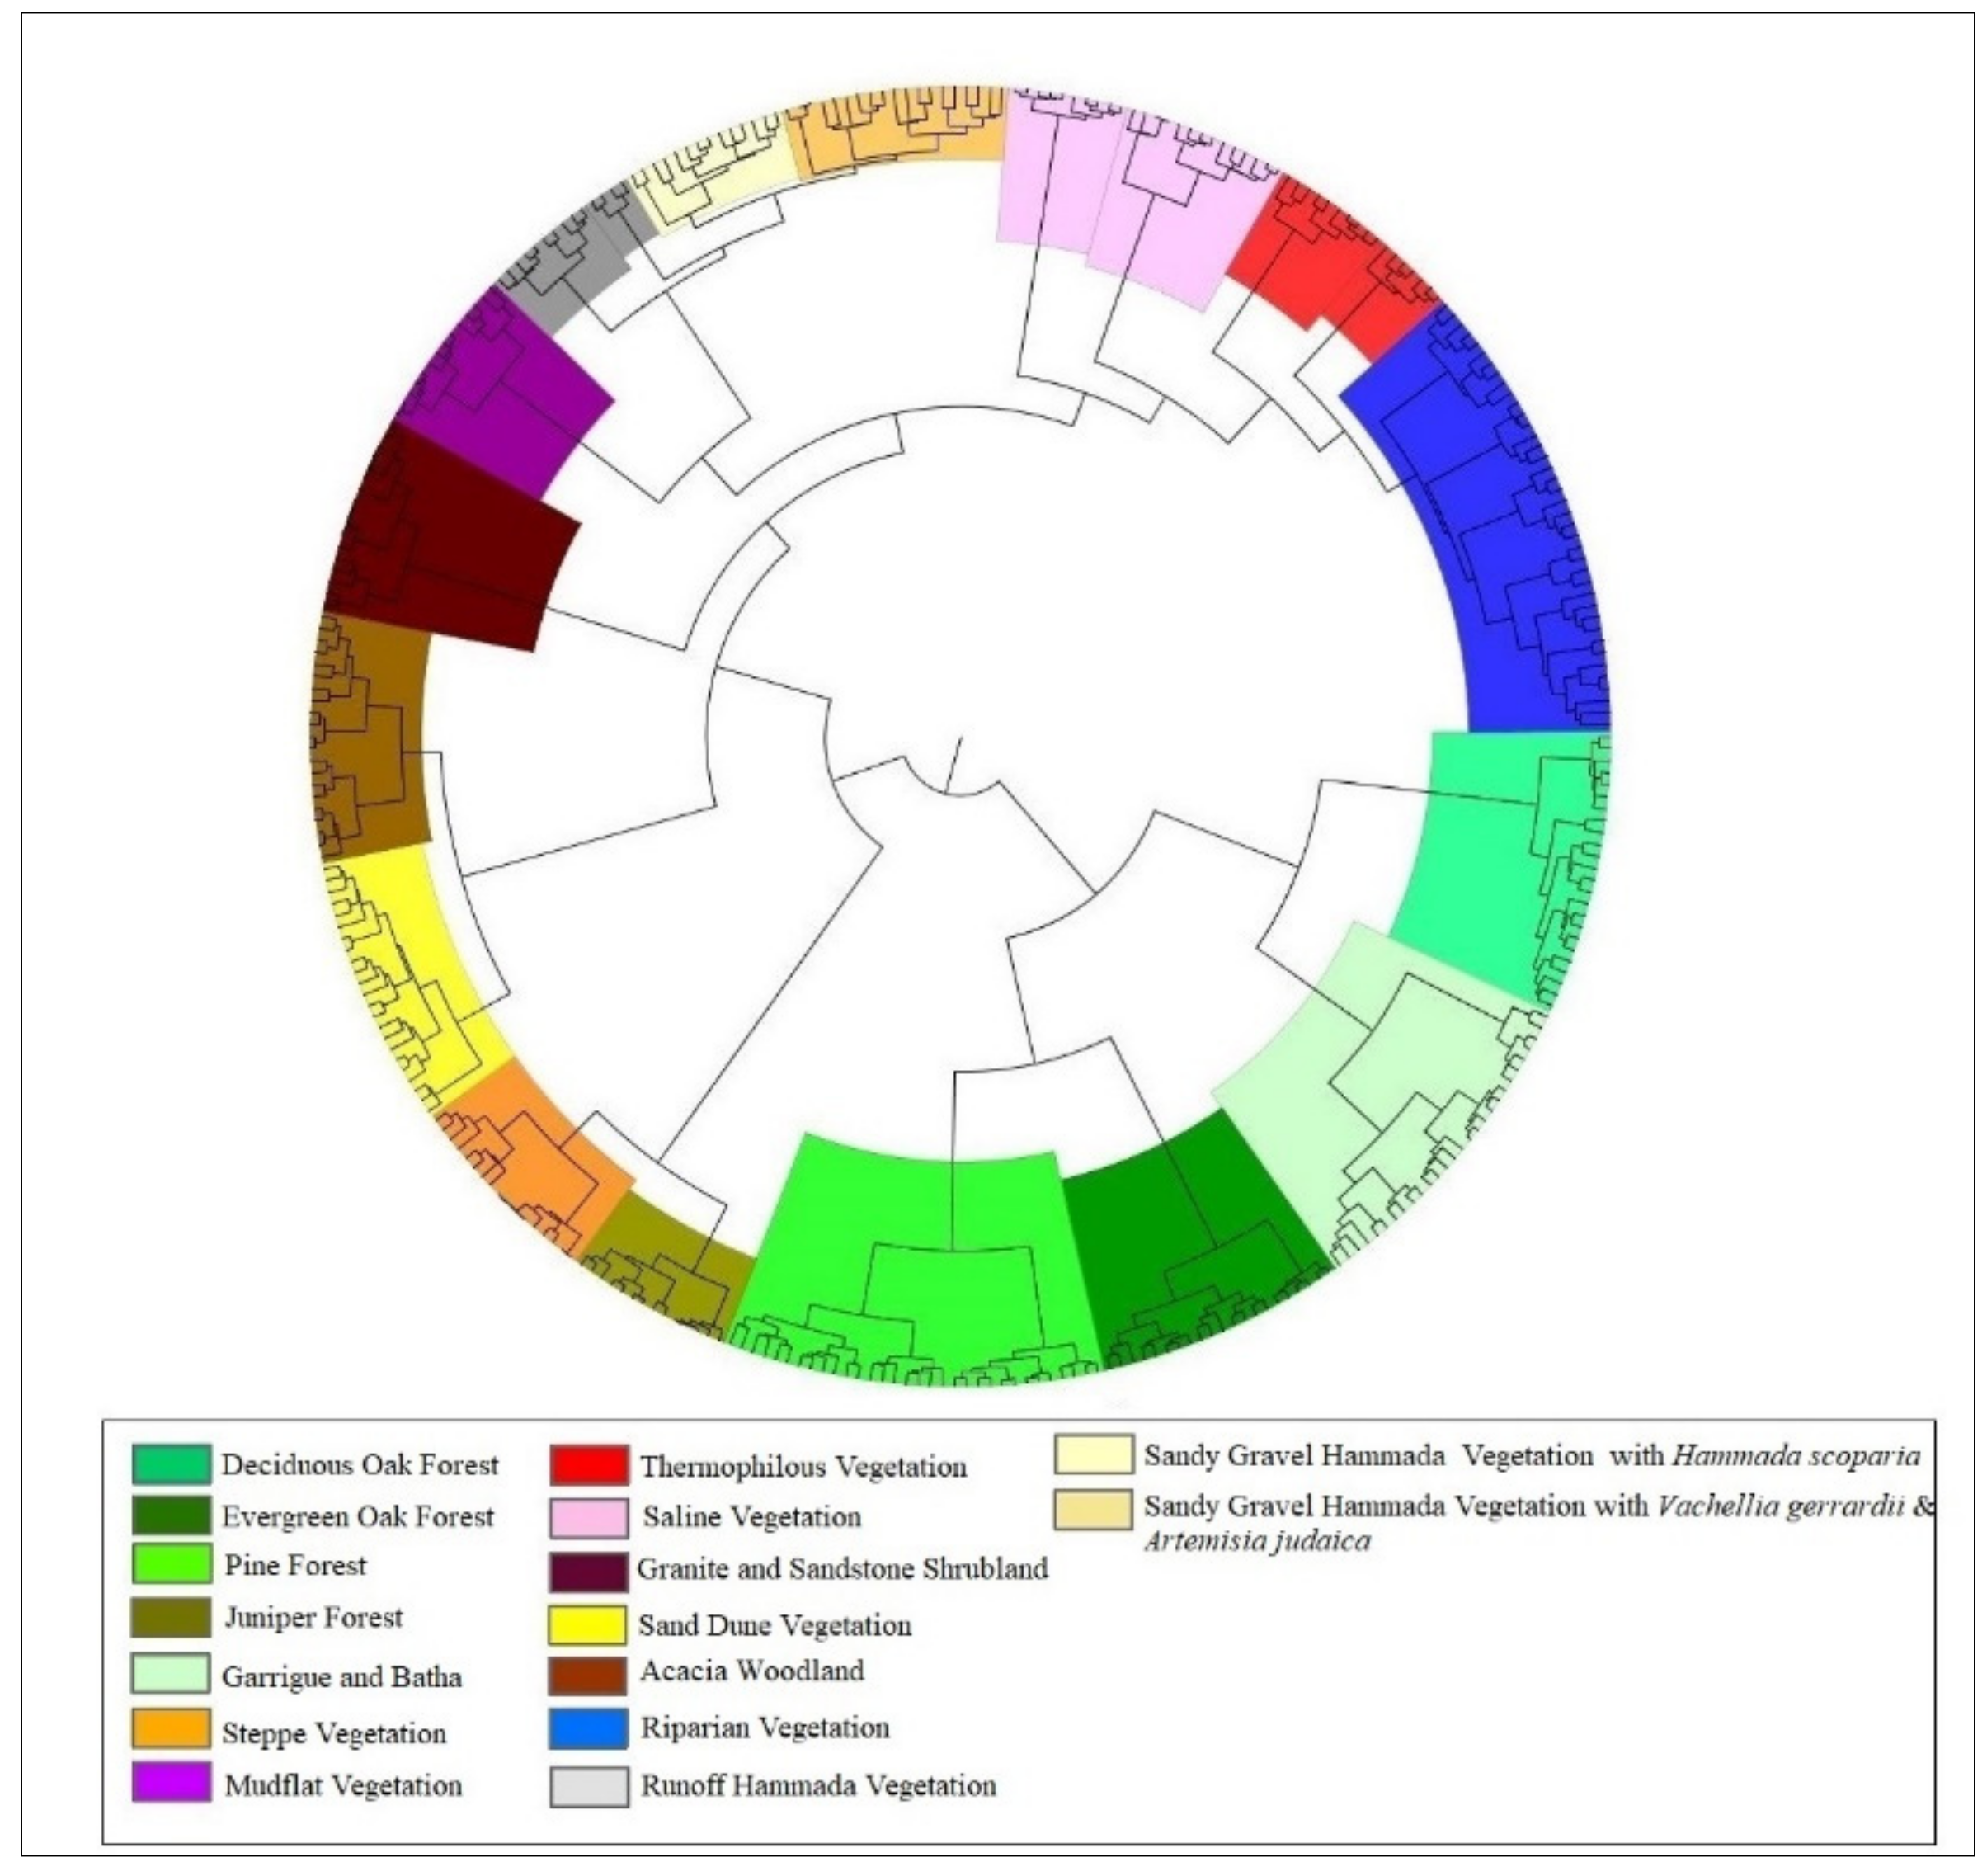
2.4. Statistical Analysis

Hierarchical clustering of field plots was executed based on the percent cover of each plant species. Annual species were excluded, because presence and percent cover could not be reliably recorded, as some plots were visited in different seasons. A dissimilarity matrix [31] was produced using the Bray–Curtis floristic distance approach, an index that helps to determine the differences in species’ relative abundance profiles among sites [32]. Ward’s hierarchical clustering algorithms were used to maximise the coherence of clusters, as per Murtagh and Legendre [33]. A number of approaches have been suggested to determine the optimal number of clusters including Silhouette, Elbow, and k-means [34,35]. The problem is that most apply arbitrary thresholds that do not account for knowledge of the vegetation. Thus, here, the appropriate number of clusters was estimated based on biological and field knowledge of the sites and vegetation. Analyses were carried out with the ‘vegan’ and ‘recluster’ packages in the Rstatistical environment [36,37,38].
For each identified habitat, an indicator species list was developed based on indicator values (IndVals) [39]. Two components make up IndVals, namely fidelity and specificity (percentage of sites containing the target species, and the probability of a species being abundant in a particular habitat, respectively) [39,40]. The species considered significant had IndVals indicators over 0.2, and a p-value lower than 0.05 for each particular habitat [39,41]. The ‘indicspecies’ R package was used for analysis [42].

2.5. Using Supervised Classification to Produce the Vegetation Map

The supervised classification method requires input training data for each class created by the researcher to calculate the classified image. Relying mainly on land cover classes, vegetation cover was classified using a combination system between physiognomic and phytosociological criteria [43]. All of the polygons/map units were given a vegetation type category according to the clustering analyses and training data, and this was revised and, if necessary, reassigned once the field data were analysed. In the interpretation phase, mosaics were reported, and the percentage of each type of vegetation found within the map unit boundary was provided.
In addition to mapping vegetation types, the boundaries of phytogeographical regions were determined using the approach described by White and Léonard [7]. A map of Jordan’s phytogeographical regions was developed using a combination of remotely sensed images and field data to delineate the biogeographical boundaries.

2.6. Accuracy Assessment of Vegetation Maps

There were four key steps taken to assess the accuracy of our maps: (i) visually inspecting the maps, (ii) comparing the classes of the thematic maps, (iii) using accuracy metrics based on comparing the class labels from ground data and thematic maps, and (iv) using an error or confusion matrix [44]. The technique most often utilised for assessing accuracy is the confusion matrix. Here, the interpreted classification is compared to the referenced classification that is known to be correct [45,46].
As per [47], a Kappa index was worked out for all typology levels by crossing the classification raster layers and validation points. Kappa = 1 when classification is perfect; Kappa > 0 when the observed correct proportion is greater than the proportion expected by chance; Kappa < 0 when the observed correct proportion is less than the proportion expected by chance [47]. If a classification has a Kappa index over 0.8, this means the classification accuracy is very good. An index of 0.6–0.8 means the accuracy is good; anything lower than 0.6 indicates a low classification accuracy [48].
The accuracy assessment was undertaken using random stratified ground-truth ‘square samples’ validation. Squared samples of 2500 m2 (the size of our field plots) were generated. Overall accuracy was calculated using the percentage of land cover that was classified correctly (sum of the correct classifications (diagonal elements) divided by the number of samples) [48].
ArcGIS 10.5.1 software was used to generate the reference maps from ground observations. The use of this approach enabled the agreement between the ground truth and the current land cover raster to be reflected through the use of four measures of accuracy: the user’s accuracy, the producer’s accuracy, the overall accuracy, and the Kappa coefficient.

3. Results

3.1. Land Cover/Land Use Map
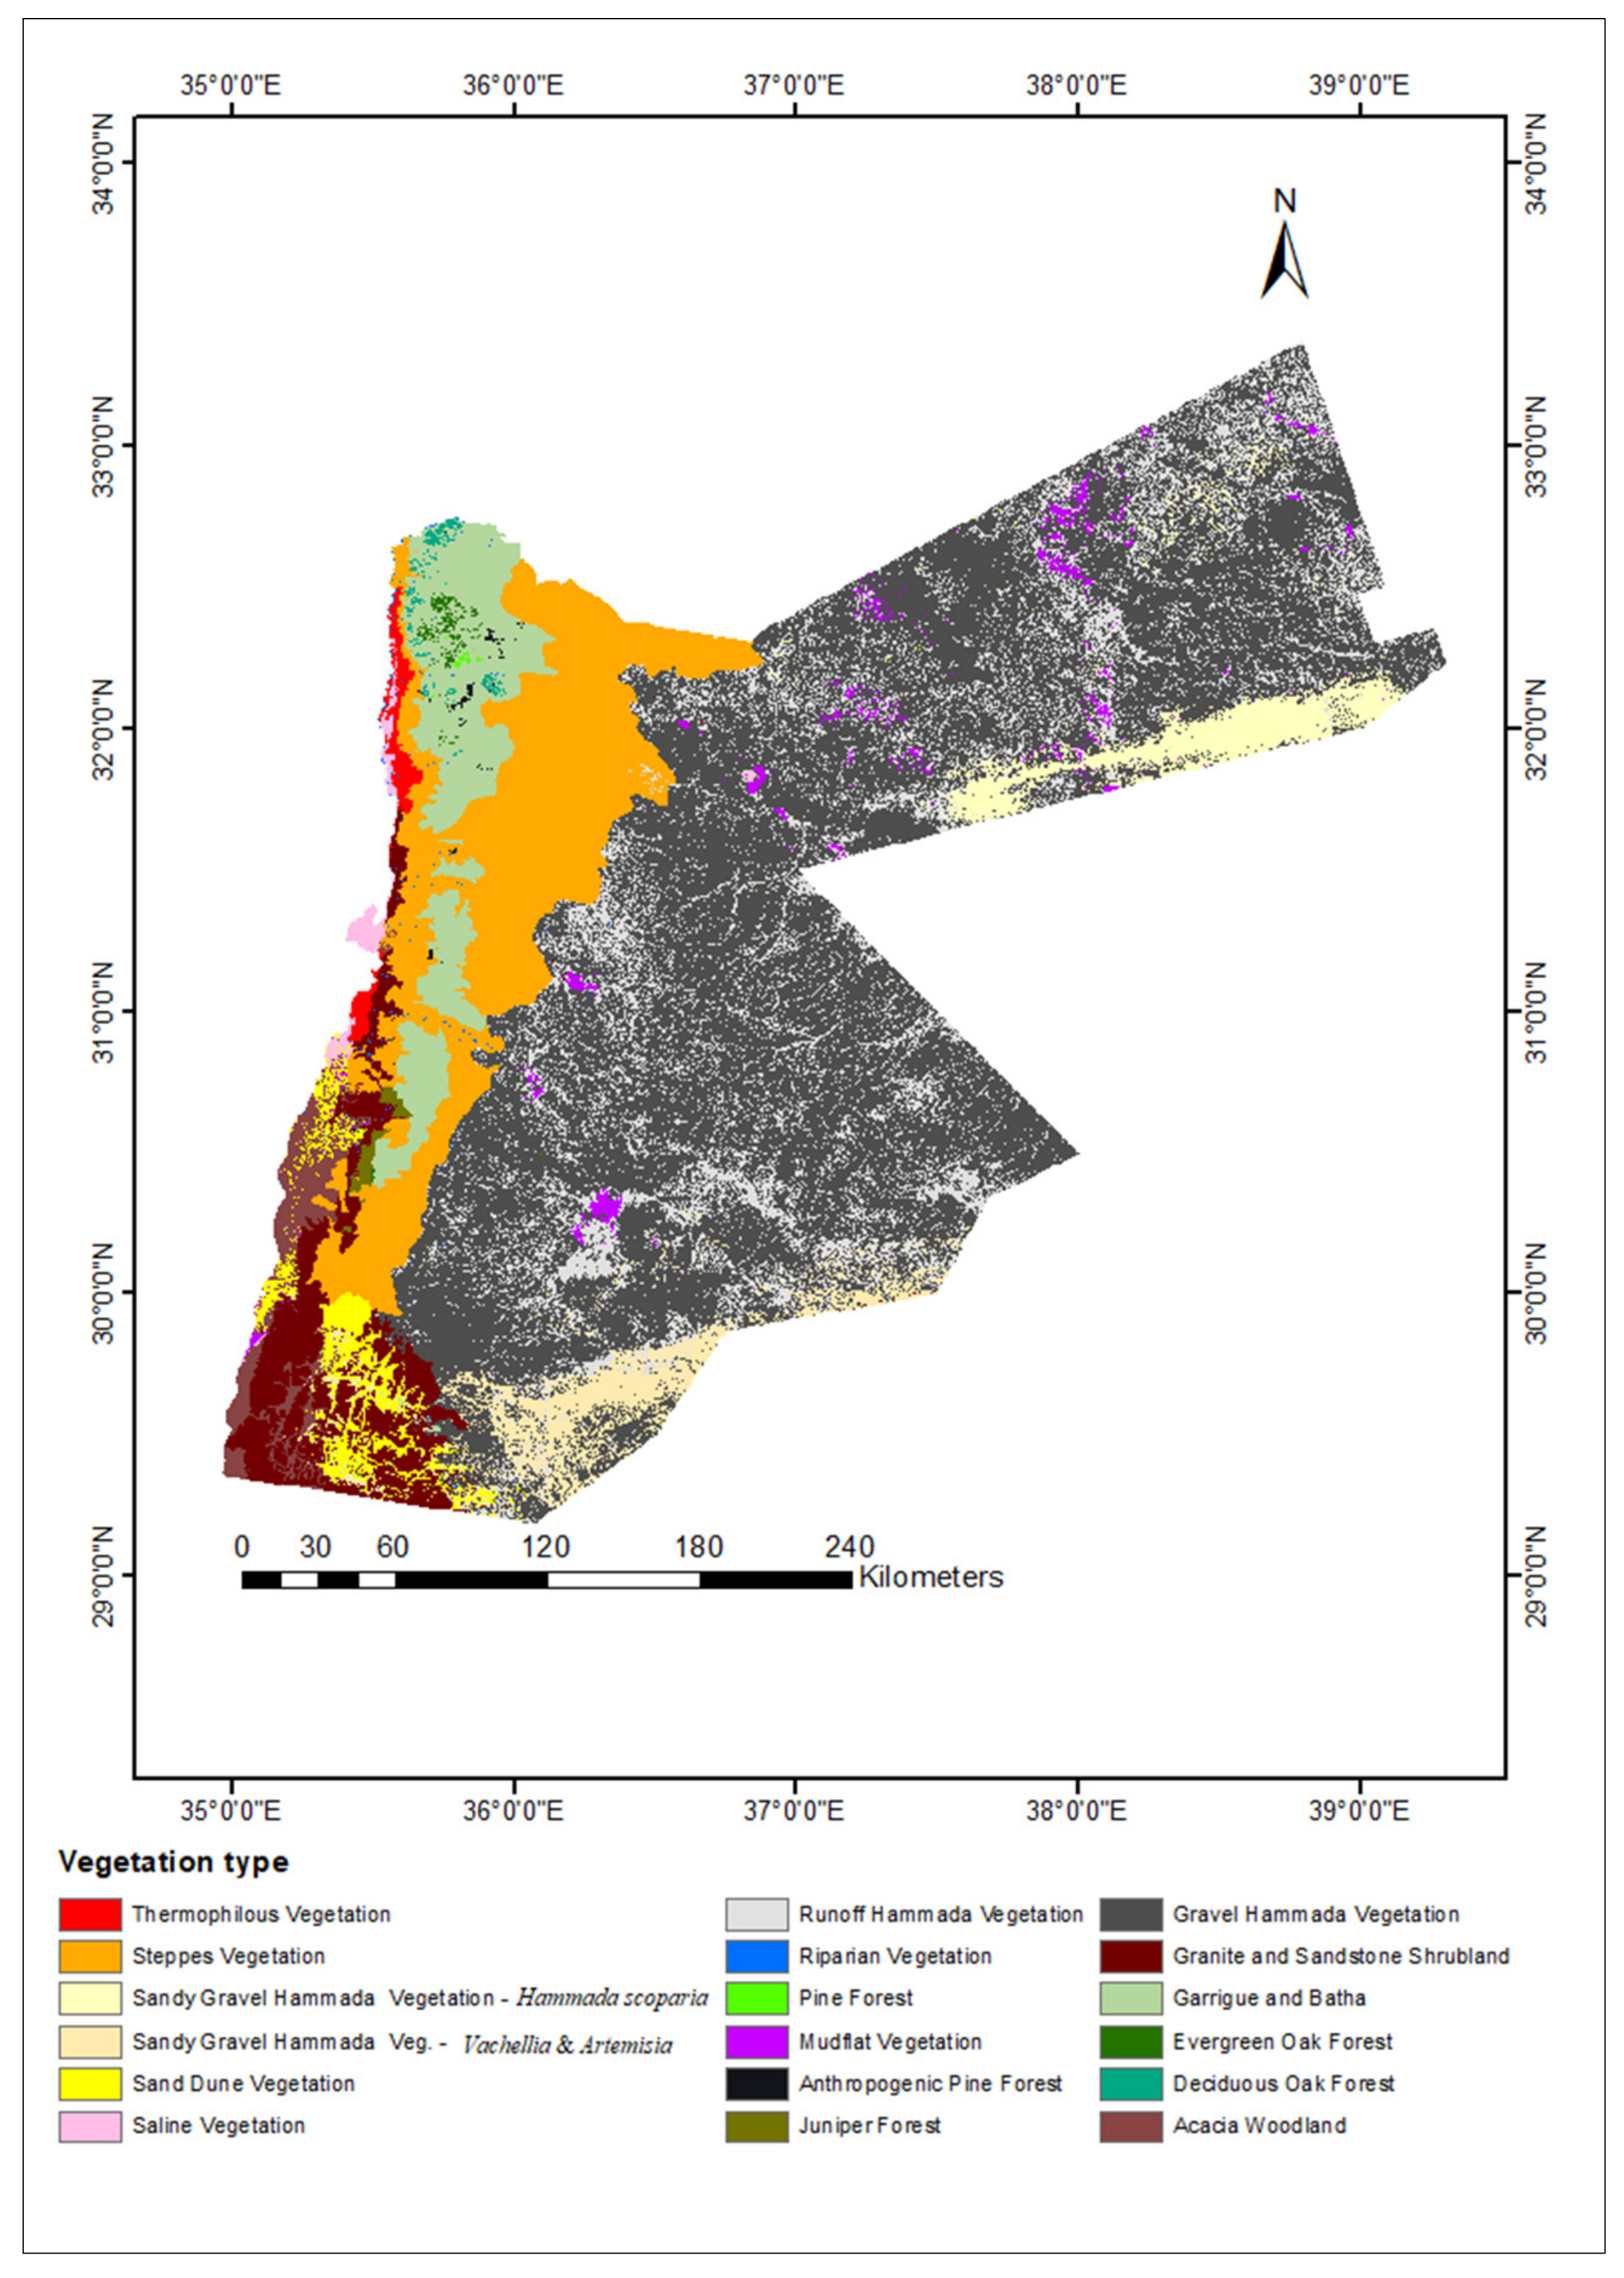
The land cover map is the result of the integration of remotely sensed data with thematic features from land cover models. According to this interpretation of satellite images, the map shows 18 classes of land cover (Figure 5, Table 1).

3.2. Vegetation Map

Sixteen groups, or vegetation type classifications, were produced from hierarchical cluster analysis (Figure 6). Sampling sites were grouped together based on the composition of the perennial vegetation present in each site. Two overarching vegetation groups emerged from the cluster analysis (Table 2).
From the species composition analysis, 54 indicator species were identified that could then be used to classify species of vegetation. Annual plant species were not included in the cluster analyses, but one vegetation type, specifically Gravel Hammada vegetation, lacks perennials. For this type, annual indicator species were added based on researcher experience and field records.

3.3. Using Remote Sensing to Classify Vegetation Types

Based on the land cover/land use map and as a result of using the supervised classification method in interpreting the satellite images, a current vegetation map was produced at a scale of 1:50,000 that contains 18 vegetation types (Figure 7, Table 3).
Two vegetation types—anthropogenic pine forest and gravel hammada vegetation—were added to the map, although they were not included in the cluster analysis. The reason for this is that there were no perennial indicator species for the gravel hammada vegetation, and there were no unique indicator species that distinguished both the natural and anthropogenic pine forest. According to the interpretations of the satellite images, there are 68 areas in which riparian habitats occur, mostly along tributaries of the Jordan River and Yarmouk River or wadis flowing towards the Dead Sea.

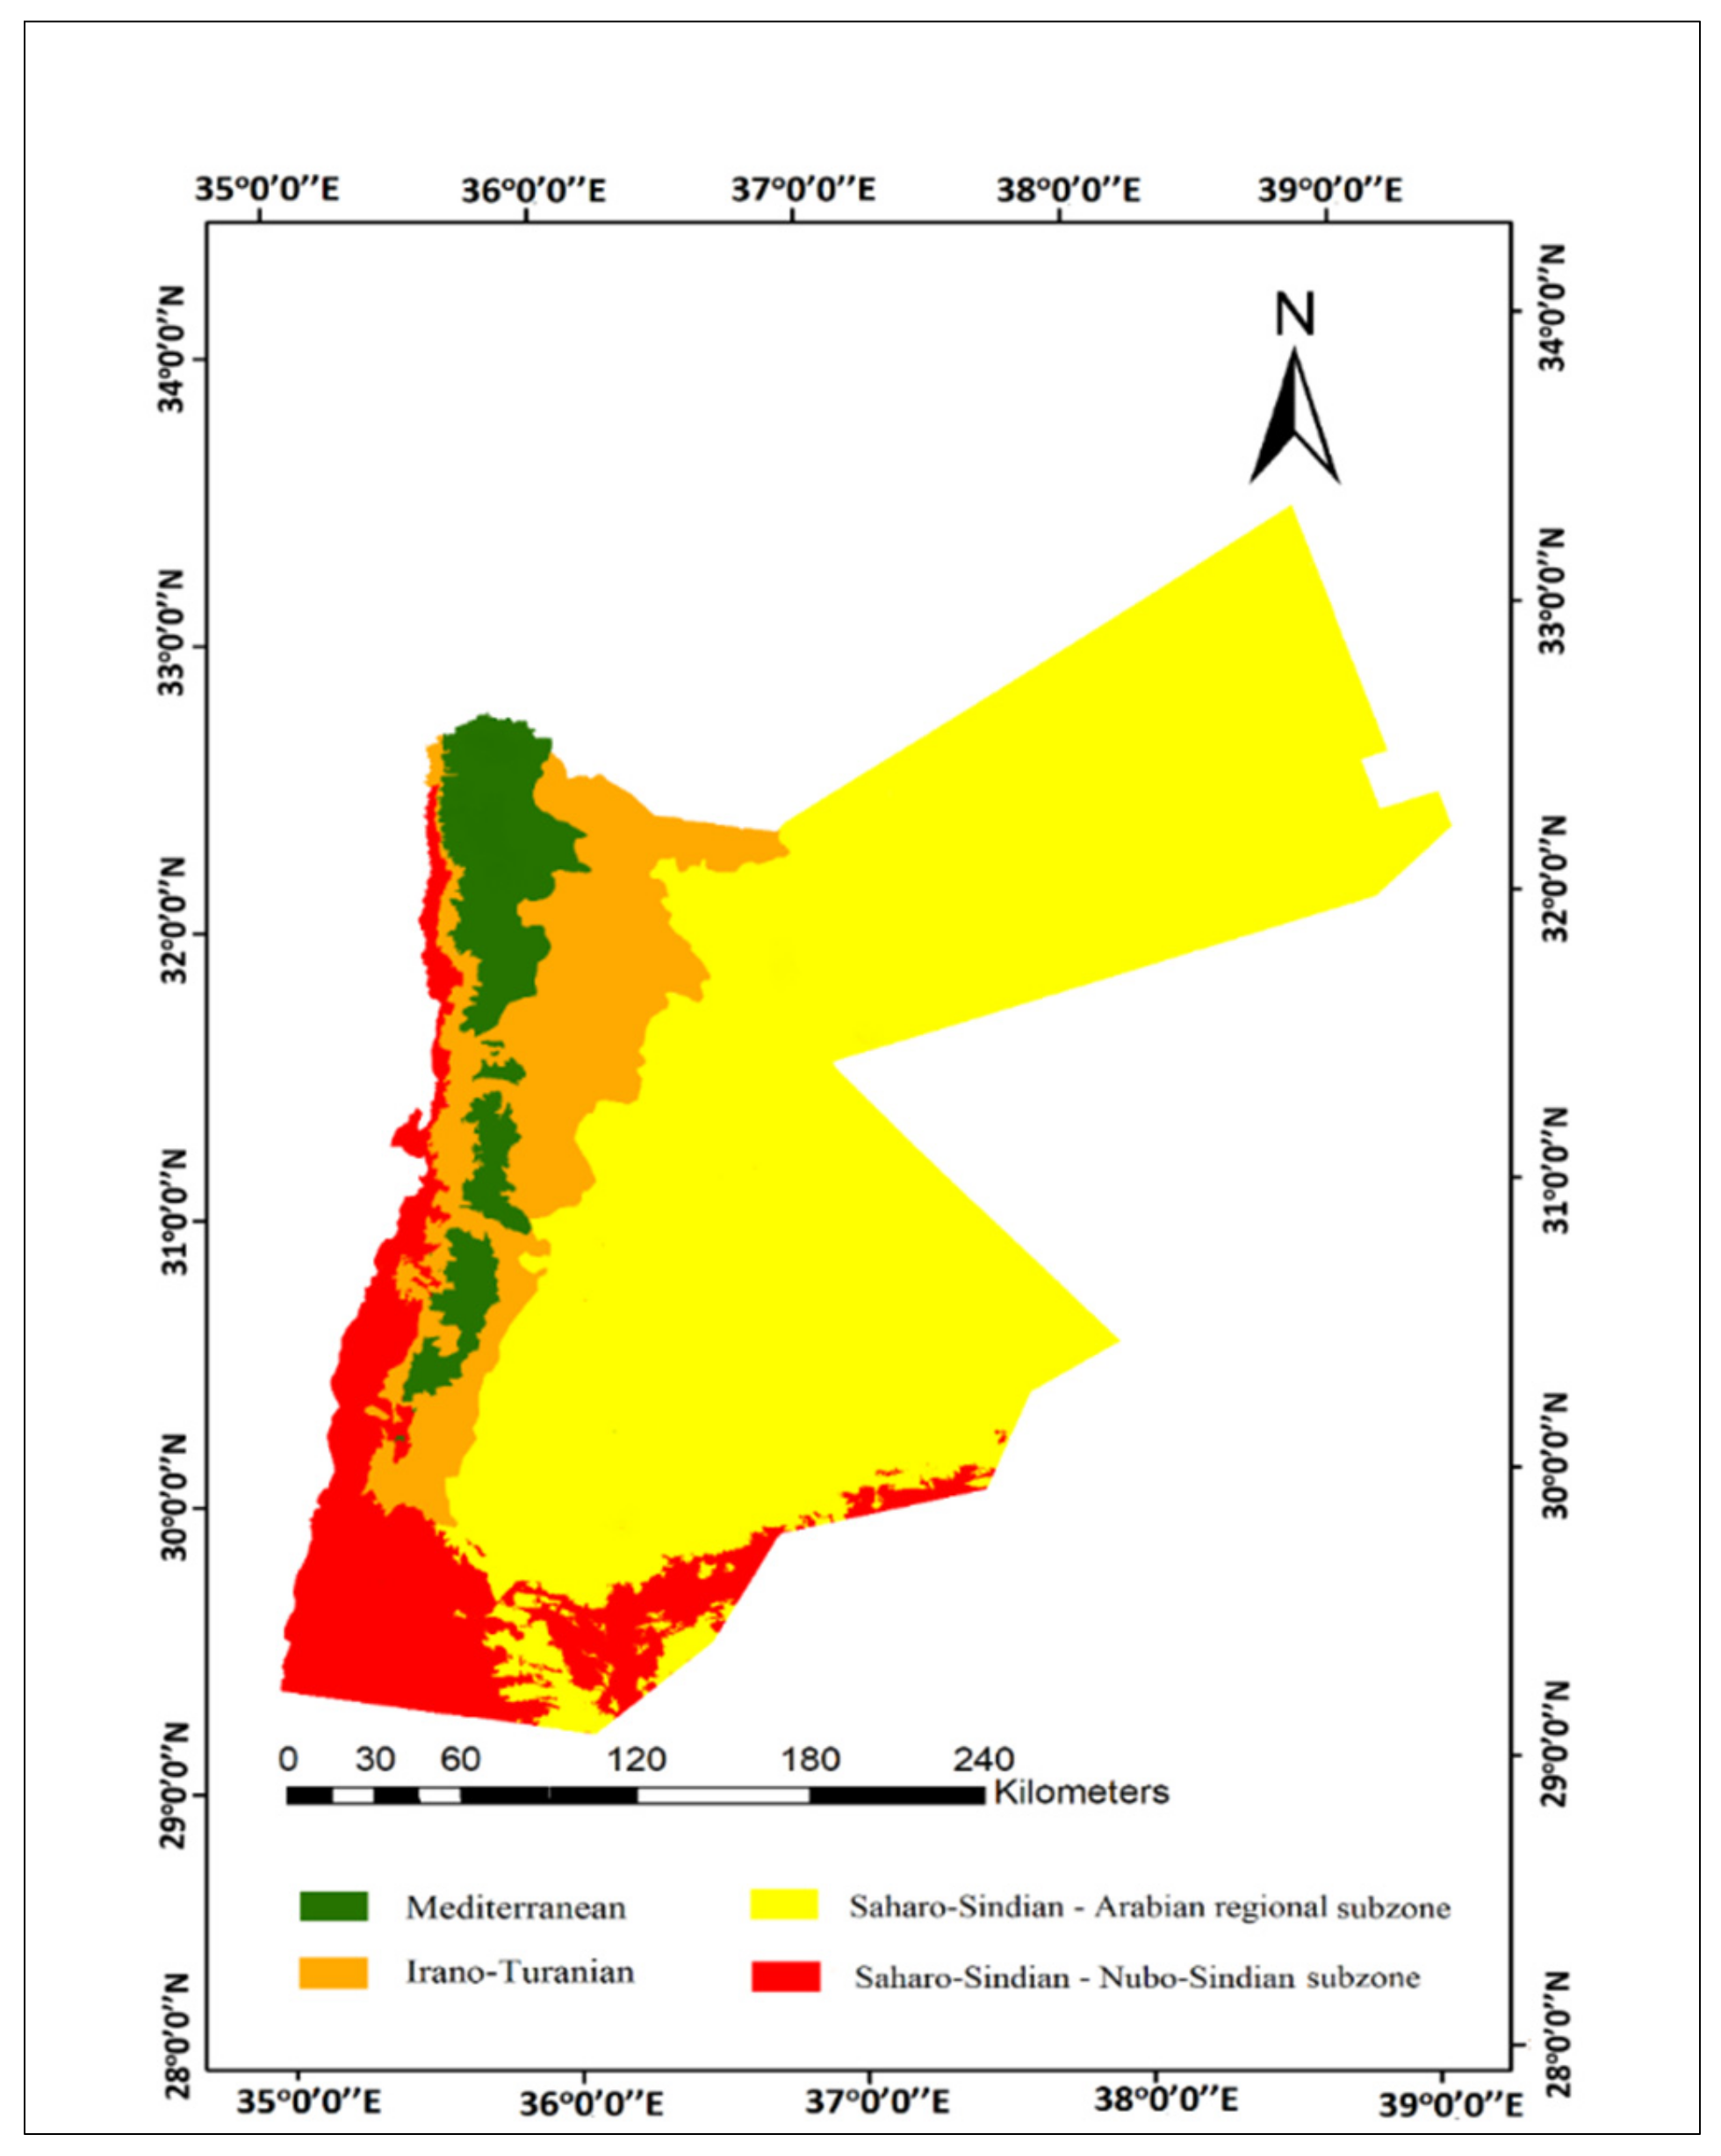
3.4. Phytogeographical Regions

The four main phytochoria are described below, each subdivided into specific Middle Eastern phytochoria that have influence in Jordan: the Mediterranean, Irano–Turanian, Saharo–Sindian–Nubo–Sindian subzone, and the Saharo–Sindian–Arabian regional subzone (Figure 8).
The Mediterranean region is restricted to the Highlands extending from Irbid in the north to Ras An-Naqab in the south, in addition to some isolated representation in the southern mountains. The Irano–Turanian zone separates the Mediterranean from the Saharo–Sindian–Arabian regional subzone on one side, and the Mediterranean from the Saharo–Sindian–Nubo–Sindian subzone on the other side [7]. The Saharo–Sindian–Arabian regional subzone is located at the eastern desert and accounts for the greatest proportion of land cover in Jordan—about 72%. The Saharo–Sindian–Nubo–Sindian subzone penetrates into Jordan, following Red Sea coastal areas, from tropical regions of the Arabian Peninsula and northeast Africa. A summary of each bio-geographic region and their associated vegetation types is presented in Table 4.

3.5. Accuracy Assessment of Vegetation Maps

In this study, four accuracy measures of each typology of the maps were calculated: the user’s accuracy, the producer’s accuracy, the overall accuracy, and the Kappa coefficient. These measurements were extracted using the specific confusion matrices listed in Appendix A. The overall accuracy and Kappa coefficient statistics were used to examine the quality of land cover and vegetation maps as a whole. The Kappa coefficient was used to determine the agreement between the map and reality, where 0 = complete disagreement and 1 = complete agreement.
All vegetation maps previously produced by experts and reviewed in this study were of poor to moderate accuracy, where the confusion matrices showed a diagonal line that illustrates a weak to medium agreement between the layers (land cover layer and ground-truth points). The classification accuracy of these maps indicated by the Kappa index also showed a low classification accuracy. On the other hand, the results of the analysis showed high overall accuracy for both the unsupervised land cover/land use map and the supervised vegetation map. The Kappa index also showed a high agreement for these two produced maps, as the result was more than 80%, indicating very good classification accuracy. Table 5 below summarises the accuracy and Kappa coefficient for all maps.

4. Discussion

4.1. Land Cover/Land Use Map

The land cover/land use map of Jordan produced here includes detailed information pertaining to agricultural activity and urbanisation, which can be used to address the issues related to the country’s increasing population. Overall, the accuracy of the land cover/land use map was relatively high and enabled the derivation of a vegetation map, after merging ground data sources. The land cover map was in agreement with other maps produced for Jordan [23,27] and with global land cover maps [49], particularly for the classes of dry lands, arable land, forests, and water bodies. For other classes, the differences in classification could be attributed to the type of remote sensing data and the classification scheme used in this study, which was intended for derivation of a vegetation map. The output map was produced as a series of digital layers, which were then overlain and analysed using a GIS in order to obtain land cover and land use percentage information. The map shows that 5.4% of the land is arable land, and dry lands account for 77.9% of the country. Highly productive rangelands are represented by the steppes, desert scrubs, and wadis located in the eastern desert, and constitute 14.1% of the total area. These findings can be used to update the percentages given in the Atlas of Jordan [27].

4.2. Vegetation Map

The clustering analyses delimited 16 vegetation types, all of which were included in the four older vegetation maps [11,14,16,17], with the exception of three vegetation types that were added during this study, namely runoff hammada vegetation, sandy gravel hammada vegetation with Haloxylon scoparia, and sandy gravel hammada vegetation with Vachellia gerrardii and Artemisia judaica. Al-Eisawi [11] indicated that the hammada is divided into four types, but he did not classify them on his map. The 16 vegetation types can be largely separated into two higher-level groups: mesic vegetation types growing in the highlands, and xeric vegetation growing in the eastern desert and the Jordan Valley [13,50]. Juniper forest and steppe vegetation form their own group distinct group, however, which represents a transition between the mesic and xeric areas [51]. While juniper is considered a Mediterranean species, it is also found in habitats alongside steppes shrubs.
Within the higher-level ‘dry group’, sand dune and acacia woodland, which grow in Wadi Araba and Wadi Rum, cluster together as their ground flora is compositionally similar; the shrub stratum dominates sand dune vegetation, and the tree stratum dominates acacia types [11,52]. Granite and sandstone scrubland form a group, likely because they are similar in having rock crevices that allow for water accumulation and can therefore support the germination of Mediterranean species typically growing in areas with higher rainfall [17]. Sandy gravel hammada vegetation with Vachellia gerrardii and Artemisia judaica, sandy gravel hammada vegetation with Hammada scoparia, and mudflat vegetation are clustered together because there is considerable overlap between these types of vegetation [11]. They also occur together in the eastern desert. The last sub-group within the higher-level dry group contains vegetation that is edaphically influenced such as riparian vegetation, saline vegetation, and thermophilous vegetation. All of these vegetation types occur in the Rift Valley, and frequently exhibit similar bush and herbaceous cover [12].
We mapped the distribution of these 16 vegetation types, plus two additional types (gravel hammada and cultivated pine forest), which we included based on remotely sensed information. These additional types of vegetation were only able to be determined through the use of high-quality satellite images, in which these latter two vegetation types were clearly visible along contour lines.
In our final map, the locations of Quercus ithaburensis-dominated deciduous oak forests were identical to those posited by both Al-Eisawi and Kasapligil, but not to locations outlined in Albert et al. or Danin [11,14,16,17]. In Albert et al.’s study, coverage of the Wadi Essir region is indicated to be wholly deciduous oak forest [14], while Danin showed no forested areas at all in either Wadi Essir or Al-Alouk [17]. Neither of these studies reflects the true coverage, which in Wadi Essir involves two oak species: deciduous oak Quercus ithaburensis and evergreen oak Quercus coccifera. In addition, the deciduous oak Quercus ithaburensis forest covers the Al-Alouk region. On the other hand, the findings of the current study support those of Kasapligil that suggested trees of Pistacia atlantica and Ceratonia siliqua are present [16]. As would be expected, the supervised current vegetation map gives a more accurate result than that obtained from the unsupervised map. Jordan’s forested regions account for 0.71% of the total land area, with acacia woodland and forests combined totalling 2.3%. These figures can be considered an update to the estimates put forth by the Ministry of Agriculture [53].
All of the prior vegetation maps represent the Quercus coccifera-dominated evergreen oak forests fairly well, although there is substantive variation in their accuracy [11,14,16,17]. Evergreen oak constitutes the densest forest in the country, with some areas achieving 95% canopy cover. This forest is also extremely important in terms of providing shelter for biodiversity; indeed, Zohary noted the richness of the habitat for many different species of flora and asserted it to be characteristic of the east Mediterranean maquis [54]. The current study found Quercus coccifera trees in areas neighbouring Quercus ithaburensis deciduous oak forests, with areas where the two species coexist in Wadi Essir and to the west of Ajloun—a finding that correlates to those of both Kasapligil and Al-Eisawi [11,16].
Pine forests account for 18.29 km2 of Jordan’s land cover. The Ministry of Agriculture report an area greater than this, but this is because they have a tendency to also include cultivated pine forests in their estimations. Pine trees are mainly found in Zay and Dibeen, but this study found some small pine forest areas in Jarash and Ajloun, lending further support to prior research [3,55]. These forests are found anywhere between 500 masl and 1000 masl, contradicting Al-Eisawi’s assertion that they only occur at elevations greater than 700 masl [11]. The Dibeen Forest Reserve is home to approximately 46% of the country’s total cover of natural pine forest.
The study’s findings did not correlate fully with existing perspectives regarding what constitutes the climax in Mediterranean forests, as natural regeneration takes place in both evergreen oak and pine forests. One argument put forth by Atkinson and Beaumont is that Pinus halepensis forests represent the climax [55], while others such as Liphschitz and Biger believe that it is either Quercus coccifera or a combination of Quercus coccifera and Pistacia palaestina [56]. However, this study found that, sometimes, Quercus coccifera replaces Pinus halepensis in places where the primary vegetation has been degraded, and this is in agreement with prior research by Al-Eisawi [11].
In support of prior research (i.e., [11]), we found that herbaceous coverage in natural pine forests is far greater than in anthropogenic pine forests. Coverage can reach up to 60% in natural pine environments, yet in cultivated forests only around 20% is recorded. Al-Eisawi reported that the natural vegetation that grows under Pinus halepensis trees on yellow rendzina soil is not present under the same trees cultivated in terra rosa [11]. The reason for this is that rendzina soil is alkaline, and pine needles are acidic; thus, when the pine needles fall onto the soil they neutralise it, improving its quality. Conversely, red soil is acidic, so when the needles fall here the condition of the soil worsens, making it less favourable for many types of vegetation.
All of the previous vegetation maps of Jordan illustrate well how juniper forests are distributed [11,14,16,17]. Since the regions of Petra and Dana experience a higher annual mean temperature range than other regions in the mountains, juniper forests occur in habitats that are more steppe-like, with shrubs such as Noaea mucronata and Artemisia sieberi growing over an Irano–Turanian understory [17].
Garrigue and Batha regions are Mediterranean areas, apart from the cultivated and forest areas [11], and their distribution matches that observed in previous studies.
The steppe region does not appear as one large, uniform area, but rather as a meeting place where the Arabian regional and Mediterranean phytogeographical regions come together. All of the remaining steppe forests are located in the south of Jordan at Beer Ad-Dabghat and Beer Khdad, the areas neighbouring the eastern border of the juniper forest in the Irano–Turanian region. The trees found in these forests are typically historical Pistacia atlantica, and it is thought that these trees have existed here for at least a thousand years. Among the pistachios are Rhamnus disperma and Prunus korshinskyi, although in much smaller numbers. It is believed these species are a relict species from the Mediterranean [17]. Trees of Pistacia atlantica are also found in the eastern desert at Wadi Al-Botom, accompanied by Retama raetam and Prunus arabica shrubs [11]. The growth of these plant species in the desert may be due to the presence of some types of soil or rocks that may provide the necessary moisture requirements for species that are usually found in more humid areas [57].
Granite–sandstone regions are full of fissures, meaning that water infiltration after rainfall is prevalent. The water is able to permeate the rock fissures and reach any soil there. As the water is protected between and under the rocks, it is less likely to evaporate in the heat. This environment is suitable for endemic and rare species to flourish, even in the hotter desert regions. One example is a shrub endemic to Jordan, Daphne mucronata subsp. linearifolia.
Coverage of riparian vegetation in the canyons, rivers, and wadis differs depending on the edaphic and climatic conditions. In the north, trees of Platanus orientalis, Populus euphratica, Tamarix palaestina, and Salix spp. are associated with Phragmites australis, Nerium oleander, and Arundo donax shrubs. In the south, Populus euphratica, Dalbergia sissoo, and Phoenix dactylifera trees are associated with the same shrubs plus Myrtus communis. On the banks of the Jordan River, trees of Populus euphratica populate the area closest to the water [3,6]. Many riparian vegetation sites were able to be identified from the satellite images, and a few of them appeared in the map produced by Al-Eisawi [11].
There are concentrated enclaves of thermophilous vegetation surrounding the Dead Sea. These enclaves were referred to by Zohary as ‘Sudano–Decanian enclaves’ [3,13], while Al-Eisawi named them ‘Sudanian tropical vegetation’ [11]. Degradation and fragmentation of this vegetation type is widespread due to the expansion of farming; this was first reported by Al-Eisawi and the current study reinforces this assertion [11]. Alongside the thermophilous vegetation is saline vegetation close to the Dead Sea and along the Jordan Valley, as well as in some parts of the eastern desert. Tamarix trees are able to tolerate high salt levels, while for shrubs, Atriplex spp. can withstand saline soils [11]. Herbaceous vegetation is particularly salt intolerant, however, and may not grow here at all.
Sand dune vegetation is very sparse, and generally trees cannot grow in pure sand. Some botanists delineated this vegetation growing in independent areas surrounded by different vegetation types in Wadi Rum and Wadi Araba in the south [11,14,16], whereas Danin considered it connected to desert savannoid vegetation in the south and extreme desert in the east [17]. Large sand dunes are frequently much better vegetated than the surrounding plains or sand flats. The huge sand sheet areas are populated with Hammada salicornica, Haloxylon persicum, Caroxylon tetrandrum, and Anabasis articulata. The only restricted plant of all the species in this environment is Haloxylon persicum, which can form quite dense shrubland on dunes [17].
All of the previously produced vegetation maps of Jordan have included acacia woodland. Kasapligil refers to it as “scattered acacia grasslands”, Al-Eisawi names it “acacia and Sudanian rocky vegetation”, Danin calls it “desert savannoid vegetation”, and Albert et al. refer to it as “acacia woodland” [11,14,16,17]. This type of vegetation is represented by sporadic Vachellia species as well as other desert semi shrubs like Anabasis articulata, Hammada salicornica, and Retama raetam.
There are five types of vegetation that make up the eastern desert, namely runoff hammada, gravel hammada, mudflat, and two types of sandy gravel hammada—one dominated by Hammada scoparia and another dominated by Vachellia gerrardii and Artemisia judaica. While mudflats frequently occur in the Badia, only one is found in Wadi Araba. There is typically no vegetation growing on the mudflats, but some species can be found around its periphery [11].
Most of the eastern desert is covered with gravel hammada. In this type of vegetation, only desert annuals generally grow. Desert shrubs belonging to the families Asteraceae and Chenopodiaceae occur sporadically next to and within the wadi beds, forming Runoff Hammada Vegetation. There are two sections of the Badia that have been identified as having soil that consists of both sand and gravel: one in the south, along the border with Saudi Arabia; the other in the northeast, close to the Iraqi–Saudi border. In the south, Vachellia gerrardii trees and Artemisia judaica shrubs are dominant, while in the northeast, shrubs of Hammada scoparia are the most commonly occurring species.

4.3. Phytogeographical Regions

Jordan is in a unique location geographically, where four separate phytogeographical zones meet. The Mediterranean region appears to be the least difficult to delineate out of all the zones. The Mediterranean region is home to the vast majority of the country’s population, and subsequently is the area that has experienced the most severe effects from human activities [53]. Here, disparate vegetation types are found intersecting with each other, such as garrigue, batha, maquis, and forests, which is related to vegetation degradation. The maquis vegetation type is characterised by Quercus coccifera—Pistacia palaestina, likely preceding climax forest in terms of vegetation succession. Formations of forest and maquis are visible at Wadi Essir and along the Ajloun mountains. Formations of garrigue and batha occur in degraded areas of the Mediterranean region that do not support forests under current physical and climatic conditions, such as many parts of Amman and Irbid. These regions are represented by Sarcopoterium spinosum, among other small shrubs [7,16].
In the Irano–Turanian region, the climax vegetation lacks substantive tree cover, but some tree species such as Pistacia atlantica and Ziziphus lotus do occur [11]. Tafila’s oak and juniper forests and Shoubak’s open forests of Pistacia atlantica are surrounded by steppes. Trees are uncommon in this habitat though, and Danin posits that these two areas with trees are likely to be relics from a climate that once had more rain [17].
In the Saharo–Sindian–Arabian regional subzone, the availability of water is the main determinant of the type of vegetation found here—often from wadis. The natural vegetation of the Arabian regional subzone has been destroyed in many areas due to ploughing and other agricultural practices for cultivating barley, particularly in runoff areas and wadi beds [11].
Finally, the vegetation of the Saharo–Sindian–Nubo–Sindian local centre of endemism is characterised by species such as Vachellia gerrardii and Ziziphus nummularia [7]. These species are at their northernmost limits of their distribution and represent the northernmost limits of tropical African vegetation in southwest Arabia.

5. Conclusions

Sentinel-2 imaging and extensive field work were utilised to produce two maps of Jordan. The first map is an unsupervised land cover/land use map including 18 distinct classes, and the second is a supervised present-day vegetation map, also including 18 classes of vegetation, which partially overlap with the 18 landcover classes. Remote sensing technology enabled the identification of two types of vegetation that were not represented in the hierarchical cluster analysis based on species composition, namely anthropogenic pine forest and gravel hammada vegetation. The hierarchical cluster analysis suggested that the vegetation was categorised into two major groups: mesic and xeric. The diversity assessment showed that the most species-rich plant communities are found in the evergreen oak forests, with mudflats representing the least species-rich habitat. Analysis of the species composition of the sampling sites enabled the production of a list containing 54 indicator species, which could then be used to identify the type of vegetation at currently unsampled sites. The country is uniquely located at the point where three continents converge, resulting in the presence of four phytogeographical regions: Mediterranean, Arabian regional subzone, Irano–Turanian, and Nubo–Sindian subzone. The vegetation maps produced by previous researchers were tested with regards to their accuracy; the findings revealed the overall accuracy ranged from weak, at 47% accuracy, to medium, at 61% accuracy. For the unsupervised land cover/land use map developed here, the overall accuracy was calculated at 91%, while the supervised current vegetation map had an overall accuracy of 95%. Jordan’s forested regions account for 0.71% of the total land area, with acacia woodland and forests combined totalling 2.3%.

Author Contributions

H.T. is the lead author who has contributed to the research conceptualization, methodology, validation, formal analysis, and wrote the original draft preparation. K.G.D. was the principal supervisor who contributed to the methodology, specifically in using clustering analyses in distinguishing vegetation types, and supervision. J.A.-B. assisted with the remote sensing analysis. A.M. and S.N. assisted in describing the vegetation types. All authors have read and agreed to the published version of the manuscript.

Funding

This research was funded the Research Training Support Grant of the University of Edinburgh. K.G.D. thanks the Natural Environment Research Council of the United Kingdom for support (NE/T01279X/1).

Institutional Review Board Statement

Not applicable.

Informed Consent Statement

Not applicable.

Data Availability Statement

Data supporting the reported results can be found in the University of Edinburgh, and in the published PhD thesis.

Acknowledgments

Appreciation goes to The Royal Botanic Garden, Edinburgh, and The Royal Botanic Garden, Jordan, for their support over the study period. We thank Edward Mitchard and Antje Ahrends for their valuable advice and discussions during the execution of this research.

Conflicts of Interest

The authors declare that there is no conflict of interest.

Appendix A. Confusion Matrices for Assessing the Accuracy of the Maps

Table A1. Confusion matrix to assess accuracy of unsupervised land cover/land use map.
TABLE
Confusion Matrix
(DF)(SF)(SS)(DS)(RA)(IA)(S)(WD)(DM)(WM)(XS)(WB)(CBR)(DBR)(CP)(RM)(WB)(UA)TotalUser’s Accuracy (%)Kappa
Dense Forest (DF)4300000000000000000431000
Sparse Forest (SF)043000100000000000044980
Shrubland-Steppe (SS)021500000000000000017880
Desert Scrubs (DS)0001800000000000000181000
Rainfed Agriculture (RA)020027001000000011032840
Irrigated Agriculture (IA)100001500000000000016940
Sand (S)0100009421000001100100940
Wadi Deposits (WD)02001071150000000300128900
Dry Mudflat (DM)000000002600200000028930
Wet Mudflat (WM)0000000001600000000161000
Xerophytic Slope (XS)0000000000150000000151000
Wadi Beds (WB)000100001002900900040730
Consolidated Basalt Rocks (CBR)0000000000001300000131000
Disintegrated Basalt Rocks (DBR)000000100000018000019950
Chert Plain (CP)010101000004117300082890
Rocky Mountain (RM)010000141000000120015800
Water Body (WB)00000000000000004041000
Urban Area (UA)0000000000000000010101000
Total445215202817103118291615351419831751064000
Producer’s Accuracy (%)98831009096889197901001008393958871801000910
Kappa000000000000000000000.9
Table A2. Confusion matrix to assess the accuracy of supervised actual vegetation map.
TABLE
Confusion Matrix
(APF)(AW)(S)(GH)(SD)(SVA)(SV)(M)(RH)(GB)(RV)(TH)(DO)(EO)(PF)(JF)(GSS)(SH)TotalUser’s Accuracy (%)Kappa
Anthropogenic Pine Forest (APF)40000000000000000041000
Acacia Woodland (AW)021001000000000000022950
Steppes Vegetation (S)102610000000000000028930
Gravel Hammada Vegetation (GH)000470010100000000049960
Sand Dune Vegetation (SD)020015000000000000017880
Sandy Gravel Hammada-V. gerrardii & A. judaica (SVA)0100070000000000008880
Saline Vegetation (SV)0010006000000000007860
Mudflat Vegetation (M)00000006000000000061000
Runoff Hammada Vegetation (RH)0000000015000000000151000
Garrigue and Batha (GB)000000000200010000021950
Riparian Vegetation (RV)00000000007000000071000
Thermophilous Vegetation (TH)0000000000010000000101000
Deciduous Oak Forest (DO)00000000000070000071000
Evergreen Oak Forest (EO)0000000000000510006830
Pine Forest (PF)00000000000000800081000
Juniper Forest (JF)00000000000000040041000
Granite and Sandstones Shrubland (GSS)00000000000000004041000
Sandy Gravel Hammada-Hammada scoparia (SH)00000000000000000441000
Total524274816776162071085944422700
Producer’s Accuracy (%)8088969894100861009410010010088100891001001000950
Kappa0000000000000000000094

References

  1. Nicolson, M. Alexander von Humboldt, Humboldtian science and the origins of the study of vegetation. Hist. Sci. 1987, 25, 167–194. [Google Scholar] [CrossRef]
  2. Whittaker, R.H. Classification of natural communities. Bot. Rev. 1962, 28, 1–239. [Google Scholar] [CrossRef]
  3. Zohary, M. Geobotanical Foundations of the Middle East; Gustav Fischer: Stuttgart, Germany, 1973. [Google Scholar]
  4. Por, F.D. The Levantine landbridge. Historical and present patterns. In Proceedings of the Symposium of the Fauna and Zoogeography of the Middle East; Krupp, F., Schneider, W., Kinzelbach, R., Eds.; Ludwig Reichert Verlag: Wiesbaden, Germany, 1987; pp. 23–28. [Google Scholar]
  5. Eig, A. Les elements et les groupes phytogeographiques auxiliaires dans la flore Palestinienne’. Repert. Spec. Nov. Regni Veg. 1931–1932, 63, 1–201, 63, 1–120. [Google Scholar]
  6. Eig, A. On the phytogeographical subdivision of Palestine. Palestine J. Bot. 1938, 1, 4–12. [Google Scholar]
  7. White, F.; Léonard, J. Phytogeographical links between Africa and Southwest Asia. Flora Veg. Mundi 1991, 9, 229–246. [Google Scholar]
  8. Léonard, J. Contribution à L’Étude de la Flore et de la Vegetation des Deserts D’Iran (Dasht-e-Kavir, Dasht-e-Lut, Jaz Kurian). Considerations Phytogeographiques sur les Phytochories Irano–Touranienne, Saharo-Sindienne et de la Somalie-Pays Masai; Jardin Botanique National de Belgique: Meise, Belgium, 1989. [Google Scholar]
  9. Long, G. The Bioclimatology and Vegetation of East Jordan; UNESCO/FAO: Rome, Italy, 1957. [Google Scholar]
  10. Al-Eisawi, D.M. Vegetation of Jordan. In Studies in the History and Archaeology of Jordan; Hadidi, A., Ed.; Ministry of Archaeology and Tourism: Amman, Jordan, 1985; Volume 1, pp. 45–56. [Google Scholar]
  11. Al-Eisawi, D.M. Vegetation of Jordan; UNESCO (ROSTAS): Cairo, Egypt, 1996; p. 284. [Google Scholar]
  12. Danin, A. Distribution Atlas of Plants in the Flora Palaestina Area; The Israel Academy of Sciences and Humanities: Jerusalem, Israel, 2004. [Google Scholar]
  13. Zohary, M.; Feinbrun-Dothan, N. Flora Palestina; The Israel Academy of Sciences and Humanities: Jerusalem, Israel, 1966; Volume 1. [Google Scholar]
  14. Albert, A.; Petutschnnig, B.; Watzka, M. Zur Vegetation und Flora Jordaniens. In Reise Durch die Natur Jordaniens; Waitzbaur, W., Albert, R., Petutschnnig, B., Aubrecht, G., Eds.; Biologiezentrum der Oberosterreichen Landesmuseen: Linz, Austria, 2003. [Google Scholar]
  15. Al-Jaloudy, M.A. FAO Country Pasture Profile for Jordan. Available online: http://www.fao.org/ag/AGP/agpc/doc/Counprof/Jordan/Jordan.htm (accessed on 15 November 2019).
  16. Kasapligil, B. Report to the Government of the Hashemite Kingdom of Jordan on an Ecological Survey of the Vegetation in Relation to Forestry and Grazing; UNESCO/FAO: Rome, Italy, 1956. [Google Scholar]
  17. Danin, A. Desert rocks as plant refugia in the Near East. Bot. Rev. 1999, 65, 93–170. [Google Scholar] [CrossRef]
  18. Jensen, J.R. Introductory Digital Image Processing: A Remote Sensing Perspective; Pearson Education, Inc.: Glenview, IL, USA, 2016. [Google Scholar]
  19. Homer, C.; Dewitz, J.; Jin, S.; Xian, G.; Costello, C.; Danielson, P.; Gass, L.; Funk, M.; Wickham, J.; Stehman, S.; et al. Conterminous United States land cover change patterns 2001–2016 from the 2016 national land cover database. ISPRS J. Photogramm. Remote Sens. 2020, 162, 184–199. [Google Scholar] [CrossRef]
  20. Abbas, A.M.; Al-Kahtani, M.A.; Alfaifi, M.Y.; Elbehairi, S.E.I.; Badry, M.O. Floristic diversity and phytogeography of Jabal Fayfa: A subtropical dry zone, south-west Saudi Arabia. Diversity 2020, 12, 345. [Google Scholar] [CrossRef]
  21. Zheng, J.; Fu, H.; Li, W.; Wu, W.; Zhao, Y.; Dong, R.; Yu, L. Cross-regional oil palm tree counting and detection via a multi-level attention domain adaptation network. ISPRS J. Photogramm. Remote Sens. 2020, 167, 154–177. [Google Scholar] [CrossRef]
  22. Gibbons, J.W.; Winne, C.T.; Scott, D.E.; Willson, J.D.; Glaudas, X.; Andrews, K.M.; Todd, B.D.; Fedewa, L.A.; Wilkinson, L.; Tsaliagos, R.N.; et al. Remarkable amphibian biomass and abundance in an isolated wetland: Implications for wetland conservation. Conserv. Biol. 2006, 20, 1457–1465. [Google Scholar] [CrossRef]
  23. Al-Bakri, J.T.; Salahat, M.; Suleiman, A.; Suifan, M.; Hamdan, M.R.; Khresat, S.; Kandakji, T. Impact of climate and land use changes on water and food security in Jordan: Implications for transcending “The Tragedy of the Commons”. Sustainability 2013, 5, 724–748. [Google Scholar] [CrossRef] [Green Version]
  24. Xie, Y.; Sha, Z.; Yu, M. Remote sensing imagery in vegetation mapping: A review. Plant Ecol. 2008, 1, 9–23. [Google Scholar] [CrossRef]
  25. Gad, S.; Kusky, T.M. Lithological mapping in the Eastern Desert of Egypt, the Barramiya area, using Landsat thematic mapper (TM). J. Afr. Earth Sci. 2006, 44, 96–202. [Google Scholar] [CrossRef]
  26. Shrestha, D.P.; Zinck, J.A. Land use classification in mountainous areas: Integration of image processing, digital elevation data and field knowledge (application to Nepal). Int. J. Appl. Earth Obs. Geoinf. 2001, 3, 78–85. [Google Scholar] [CrossRef]
  27. Franceschini, G.; de Leo, E.; Muchoney, D. Jordan—Land Cover Atlas; FAO: Rome, Italy, 2019. [Google Scholar]
  28. Ministry of Agriculture. The Soils of Jordan: Level 1 (Reconnaissance Survey), Report of the National Soil Map and Land Use Project; MOA: Amman, Jordan, 1993; Volume 1. [Google Scholar]
  29. Mitchard, E. Standard Operating Procedure Manual, Collection of Ground Data Points for Calibration and Validation of a Landcover Map. 2017. [Google Scholar]
  30. Taifour, H.; El-Oqlah, A. Plants of Jordan—An Annotated Checklist; Kew Royal Botanic Gardens: London, UK, 2017. [Google Scholar]
  31. Bray, J.R.; Curtis, J.T. An ordination of the upland forest communities of southern Wisconsin. Ecol. Monogr. 1957, 27, 325–349. [Google Scholar] [CrossRef]
  32. Ricotta, C.; Podani, J. On some properties of the Bray-Curtis dissimilarity and their ecological meaning. Ecol. Complex. 2017, 31, 201–205. [Google Scholar] [CrossRef]
  33. Murtagh, F.; Legendre, P. Ward’s hierarchical agglomerative clustering method: Which algorithms implement Ward’s criterion? J. Classif. 2014, 31, 274–295. [Google Scholar] [CrossRef] [Green Version]
  34. Masud, M.A.; Huang, J.Z.; Wei, C.; Wang, J.; Khan, I.; Zhong, M. I-nice: A new approach for identifying the number of clusters and initial cluster centres. Inf. 2018, 466, 129–151. [Google Scholar] [CrossRef]
  35. Thorndike, R.L. Who belongs in the family? Psychometrika 1953, 18, 267–276. [Google Scholar] [CrossRef]
  36. Dapporto, L.; Ramazzotti, M.; Fattorini, S.; Talavera, G.; Vila, R.; Dennis, R.L.H. Recluster: An unbiased clustering procedure for beta-diversity turnover. Ecography 2013, 36, 1070–1075. [Google Scholar] [CrossRef] [Green Version]
  37. Oksanen, J.; Blanchet, F.G.; Kindt, R.; Legendre, P.; O’hara, R.B.; Simpson, G.L.; Solymos, P.; Stevens, M.H.H.; Wagner, H. Vegan: Community Ecology Package. R Package Version 2.4-4. 2017. Available online: https://CRAN.R-project.org/package=vegan (accessed on 15 November 2019).
  38. Dufrêne, M.; Legendre, P. Species assemblages and indicator species: The need for a flexible asymmetrical approach. Ecol. Monog. 1997, 67, 345–366. [Google Scholar] [CrossRef]
  39. Tryjanowski, P.; Morelli, F. Case study 3. Using indicator species analysis IndVal to identify bird indicators of HNV in farmlands from Western Poland. In Birds as Useful Indicators of High Nature Value Farmlands: Using Species Distribution Models as a Tool for Monitoring the Health of Agro-ecosystems; Springer International Publishing: Berlin/Heidelberg, Germany, 2017; pp. 107–114. [Google Scholar]
  40. Wolski, G.; Kruk, A. Determination of plant communities based on bryophytes: The combined use of Kohonen artificial neural network and indicator species analysis. Ecol. Indic. 2020, 113, 106–160. [Google Scholar] [CrossRef]
  41. Della Rocca, F.; Stefanelli, S.; Pasquaretta, C.; Campanaro, A.; Bogliani, G. Effect of deadwood management on saproxylic beetle richness in the floodplain forests of northern Italy: Some measures for deadwood sustainable use. J. Insect Conserv. 2014, 18, 121–136. [Google Scholar] [CrossRef]
  42. de Caceres, M.; Jansen, F.; Indicspecies: Relationship between species and groups of sites. R Package Version 1.7.5. 2016. Available online: https://CRAN.Rproject.org/package=indicspecies (accessed on 15 November 2019).
  43. Rodwell, J.; Dring, J.; Pignatti, S.; Schaminé, J.; Mucina, L. Scientific Background to the EUNIS Habitat Classification: Phytosociological Relationships of EUNIS Habitats; Unit of Vegetation Science—Lancaster University & European Topic Centre on Nature Conservation: Paris, France, 1998. [Google Scholar]
  44. Congalton, R.G. Accuracy assessment of remotely sensed data: Future needs and directions. In Proceedings of Pecora 12 Land Information from Space-Based Systems, Sioux Falls, SD, USA, 24–26 August 1993; ASPRS, Bethesda: Rockville, MD, USA, 1994; Volume 12, pp. 383–388. [Google Scholar]
  45. Rwanga, S.S.; Ndambuki, J.M. Accuracy assessment of land use/land cover classification using remote sensing and GIS. Int. J. Geosci. 2017, 8, 611–622. [Google Scholar] [CrossRef] [Green Version]
  46. Kattenborn, T.; Leitloff, J.; Schiefer, F.; Hinz, S. Review on Convolutional Neural Networks (CNN) in vegetation remote sensing. ISPRS J. Photogramm. Remote Sens. 2021, 173, 24–49. [Google Scholar] [CrossRef]
  47. Congalton, R.G.; Oderwald, R.G.; Mead, R.A. Assessing Landsat classification accuracy using discrete multivariate statistical techniques. Photogramm. Eng. Remote Sens. 1983, 49, 1671–1678. [Google Scholar]
  48. Pontius, R.G., Jr. Quantification error versus location error in comparison of categorical maps. Photogramm. Eng. Remote Sens. 2000, 66, 1011–1016. [Google Scholar]
  49. Gong, P.; Liu, H.; Zhang, M.; Li, C.; Wang, J.; Huang, H.; Clinton, N.; Ji, L.; Li, W.; Bai, Y.; et al. Stable classification with limited sample: Transferring a 30-m resolution sample set collected in 2015 to mapping 10-m resolution global land cover in 2017. Sci. Bull. 2019, 64, 370–373. [Google Scholar] [CrossRef] [Green Version]
  50. Zohary, M. Plant Life of Palestine (Israel and Jordan); The Ronald Press Company: New York, NY, USA, 1962. [Google Scholar]
  51. Danin, A. Near East ecosystems, plant diversity. In Encyclopedia of Biodiversity; Levin, S., Ed.; Academic Press: New York, NY, USA, 2001. [Google Scholar]
  52. Danin, A. Man and the natural environment. In The Archaeology of Society in the Holy Land; Levy, T.E., Ed.; Leicester University Press: London, UK, 1995. [Google Scholar]
  53. Ababsa, M. Atlas of Jordan: History, Territories and Society; Presses de l’ifpo: Beyrouth, Lebanon, 2013. [Google Scholar]
  54. Zohary, M. A vegetation map of Western Palestine. J. Ecol. 1947, 34, 1–19. [Google Scholar] [CrossRef]
  55. Atkinson, K.; Beaumont, P. The forests of Jordan. Econ. Bot. 1971, 25, 305–311. [Google Scholar] [CrossRef]
  56. Liphschitz, N.; Biger, G. Ancient dominance of the Quercus calliprinosPistacia palaestina association in Mediterranean Israel. J. Veg. Sci. 1990, 1, 67–70. [Google Scholar] [CrossRef]
  57. Soto-Berelov, M. Vegetation Modeling of Holocene Landscapes in the Southern Levant. Ph.D. Thesis, Arizona State University, Tempe, AZ, USA, 2011. [Google Scholar]
Figure 1. Main phytogeographical regions covering Asia and Africa (Reprinted/adapted from [7]). Regional zones are represented by: SS = Saharo–Sindian, SS1 = Sahara regional subzone, SS2 = Arabian regional subzone, SS3 = Nubo–Sindian local centre of endemism, M = Mediterranean; IT = Irano–Turanian, IT1 = Western Irano–Turanian regional subcentre, IT2 = Southern Irano–Turanian regional subcentre, IT3 = Northern Irano–Turanian regional subcentre, IT4 = Eastern Irano–Turanian regional subcentre, AC = Central Asiatic, Sa = Sahel, SM = Somalia–Masai.
Conservation 02 00012 g001
Figure 2. The mechanism of actions for producing the map.
Conservation 02 00012 g002
Figure 3. Satellite images in true colour composition.
Conservation 02 00012 g003
Figure 4. Satellite images in false colour composition.
Conservation 02 00012 g004
Figure 5. Land cover/land use map of Jordan produced from the unsupervised classification.
Conservation 02 00012 g005
Figure 6. Site classification based on Agglomerative Hierarchical Clustering analysis.
Conservation 02 00012 g006
Figure 7. Vegetation map based on the interpretation of satellite images.
Conservation 02 00012 g007
Figure 8. Phytogeographical regions of Jordan based on the updated vegetation map.
Conservation 02 00012 g008
Table 1. Land cover statistics in Jordan.
Land Cover ClassTotal Km2PercentageTotal Percentage
ForestsDense Forest398.20.450.89
Sparse Forest394.30.44
Highly productive rangelandsShrubland/Steppe1484.01.6614.1
Desert Scrubs3023.83.38
Wadi Beds8098.09.06
Arable landsRainfed Agriculture3532.43.955.39
Irrigated Agriculture1289.81.44
Dry landsSand5114.65.7277.9
Wadi Deposits15981.417.89
Dry Mudflat1667.41.87
Wet Mudflat342.60.38
Xerophytic Slope1009.41.13
Consolidated Basalt Rocks691.00.77
Disintegrated Basalt Rocks7261.78.13
Chert Plain33744.437.77
Rocky Mountain3788.64.24
OthersWater Body540.70.621.72
Urban Area980.01.1
Table 2. Vegetation groups sorted according to the composition of the perennial plants.
Vegetation GroupVegetation Type
Mesic groupDeciduous Oak Forest
Evergreen Oak Forest
Pine Forest
Garrigue and Batha
Xeric groupJuniper Forest
Acacia Woodland
Steppe Vegetation
Sand Dune Vegetation
Sandy Gravel Hammada Vegetation with Hammada scoparia
Sandy Gravel Hammada Vegetation with Vachellia gerrardii and Artemisia judaica
Granite and Sandstone Shrubland
Mudflat Vegetation
Runoff Hammada Vegetation
Riparian Vegetation
Saline Vegetation
Thermophilous Vegetation
Table 3. Vegetation map statistics in Jordan.
Vegetation TypeTotal Km2Percentage (%)
Gravel Hammada Vegetation45871.951.34
Sand Dune Vegetation1760.71.97
Steppe Vegetation11293.412.24
Granite and Sandstone Shrubland4079.74.57
Acacia Woodland1453.71.63
Sandy Gravel Hammada Vegetation with Hammada scoparia2408.52.70
Sandy Gravel Hammada Vegetation with Vachellia gerrardii and Artemisia judaica2909.83.26
Garrigue and Batha4815.25.39
Runoff Hammada Vegetation11677.413.07
Mudflat Vegetation893.12.00
Saline Vegetation392.70.44
Juniper Forest191.70.21
Deciduous Oak Forest156.30.17
Anthropogenic Pine Forest116.30.13
Riparian Vegetation71.90.08
Thermophilous Vegetation534.30.60
Pine Forest18.30.02
Evergreen Oak Forest156.70.18
Table 4. Vegetation types and the bio-geographic region they represent.
Bio-Geographic RegionVegetation Type
MediterraneanDeciduous Oak Forest
Evergreen Oak Forest
Pine Forest
Garrigue and Batha
Juniper Forest
Riparian Vegetation
Irano–TuranianSteppe Vegetation
Riparian Vegetation
Saharo–Sindian–Arabian regional subzoneMudflat Vegetation
Gravel Hammada Vegetation
Runoff Hammada Vegetation
Sandy Gravel Hammada Vegetation with Hammada scoparia
Saharo–Sindian–Nubo-Sindian subzoneMudflat Vegetation
Granite and Sandstone Shrubland
Riparian Vegetation
Thermophilous Vegetation
Saline Vegetation
Sand Dune Vegetation
Acacia Woodland
Sandy Gravel Hammada Vegetation with Vachellia gerrardii and Artemisia judaica
Table 5. Accuracy and Kappa coefficient for the vegetation maps.
MapAccuracy Assessment (%)Overall AccuracyKappa CoefficientClassification Accuracy
Vegetation map produced by Kasapligil (1956)47Low0.38Weak
Vegetation map produced by Al-Eisawi (1996)50Moderate0.43Weak
Vegetation map produced by Danin (1999a)59Moderate0.47Weak
Vegetation map produced by Albert et al. (2003)61Moderate0.55Weak
Land cover/land use map91High0.90Very good
Current vegetation map95High0.94Very good
Publisher’s Note: MDPI stays neutral with regard to jurisdictional claims in published maps and institutional affiliations.

