
An Electrochemical Impedance Study of Alkaline Water Splitting Using Fe Doped NiO Nanosheets


1
Department of Materials Science and Engineering, Solid State Physics, Uppsala University, SE-75103 Uppsala, Sweden
2
Center for Nano Energy Materials, State Key Laboratory of Solidification Processing, School of Materials Science and Engineering, Northwestern Polytechnical University, Xi’an 710072, China
*
Author to whom correspondence should be addressed.
Physchem 2021, 1(1), 69-81; https://0-doi-org.brum.beds.ac.uk/10.3390/physchem1010005
Submission received: 7 May 2021
/
Revised: 21 May 2021
/
Accepted: 24 May 2021
/
Published: 31 May 2021
(This article belongs to the Special Issue Physical Chemistry Perspectives for the New Decade)
Abstract
:Mixed nickel-iron (Ni-Fe) compounds have recently emerged as promising non-precious electrocatalysts for alkaline water splitting. The understanding of the charge-transfer mechanism involved in the multi-step Faradic reaction, however, is still limited for the overall electrochemical process. In this paper, electrochemical impedance spectroscopy (EIS) measurements of Fe incorporated Ni oxide nanosheets were used to study the reaction kinetics for both hydrogen (HER) and oxygen (OER) evolution reactions in alkaline media. Our results showed that Fe incorporation improves the catalytic property of NiO nanosheets because of the lower reaction resistance and faster intermediate transformations. Detailed EIS modeling enables a separation of the surface coverage relaxation from the charge transfer resistance, with an inductive behavior observed in the low-frequency range for HER, holding important information on the dominating reaction mechanism. For OER, the good agreement between the EIS experimental results and a model with an inductance loop indicated that similar inductive behavior would be determining the EIS response at very low frequencies. The physical significance of the elementary steps gives insight into the governing reaction mechanisms involved in the electron and hole charge transfer, as well as the inherent properties of catalysts and their surface coverage relaxation.

1. Introduction
Electrochemical water splitting is a promising approach to produce hydrogen (H2) for clean energy applications powered by renewable but intermittent energy sources, e.g., solar, tidal, and wind [1,2,3,4]. The sluggish kinetics of the cathodic HER and the anodic OER, however, require large overpotentials (η) above the theoretical thermodynamic value of 1.229 V. This fundamentally restricts the overall reaction efficiency and is important for applications since a high rate of H2 production is needed to offset the high capital cost of an installed system. To improve the energy conversion efficiency at high reaction rates, an effective electrocatalyst is needed to minimize the energy barrier of this uphill reaction [5,6]. Ever since Corrigan et al., [7] reported that iron impurities in nickel oxide electrodes can significantly lower the OER overpotential, Fe doped Ni-based electrocatalysts have been revisited by numerous research groups to reveal the role of Fe on the enhanced kinetics. Miller et al., [8] reported that the OER Tafel slope was reduced from 95 mV/decade (undoped NiOx) to 40 mV/decade for NiO with Fe incorporation, indicating a mechanistic change in the rate-limiting step from the primary discharge of OH ions to the recombination of oxygen radicals. Recently, Boettcher et al., [9] reported that Fe impurities increase the electrical conductivity of Ni(OH)2/NiOOH and exert a partial-charge-transfer activation effect on Ni, leading to an enhanced OER activity. On the other hand, the HER as an indispensable part of an efficient overall reaction has also attracted considerable attention. There are some studies about Fe incorporation into Ni-based electrocatalysts for HER in alkaline electrolytes, which show improved cathodic activity as well [10,11]. Hence, it is clear that adding Fe impurities into Ni-based catalysts is positive for both OER and HER, although the anode and cathode possess different interface behaviors for water electrolysis. Up to now, a variety of NiFe-based electrocatalysis has been investigated [12,13,14,15]; however, there still exists a significant controversy over the catalytically active metal redox state and electron transfer pathways [16,17,18,19,20]. To explore the complete mechanism, different kinds of characterization, e.g., in-situ spectroscopy and density functional theory (DFT) calculations, have been carried out to identify the pathways for the catalytic reactions [21,22,23].
In this work, electrochemical impedance spectroscopy (EIS) is used to investigate the influence of Fe on the intrinsic charge-transfer kinetic of NiO nanosheets, leading to enhanced activities for overall water splitting in alkaline media. The ability of EIS to cover a wide range of frequencies at different direct current (DC) potentials allows us to investigate and understand the electrochemical behavior of multistep processes that influence the catalytic property [24,25]. By monitoring the catalytic current density at different potentials, we found that the presence of Fe could change the reaction route, requiring a lower driving force, and thus, improve the catalytic property for both OER and HER. The observed low-frequency pseudo-inductive loop under HER is quantified to show the coverage change of adsorbed surface species, which also implies which reaction step is rate-determining. The fitting results of OER behavior indicate the probability of an inductive loop in a very low frequency range. Based on an extension of the equivalent circuits (ECs) proposed by Harrington and Conway (HC) [26], we provide an investigation of this effect under operation and elucidate an approach that can rationalize the phenomena involved in the Fe-NiO system, thereby providing the rate-limiting reaction mechanism and kinetic properties for overall alkaline water splitting.
2. Experimental Section
2.1. Chemicals
All chemicals were used as received without any further purification. Sodium hydroxide (NaOH, ≥97%), Nickel (II) nitrate hexahydrate (Ni(NO3)2·6H2O, ≥97%), Iron (III) nitrate nonahydrate (Fe(NO3)3·9H2O, >99.95%) and Poly(vinyl alcohol) (PVA) (Mw = 89,000–98,000, 99%) were purchased from Sigma-Aldrich (St. Louis, MO, USA). Nickel foam (NF) (Porosity ≥ 95%, Purity> 99.99%, 1.6 mm thick) was used as a three-dimensional (3D) substrate, purchased from MTI Corporation, Richmond, CA, USA.
2.2. Catalyst Electrode Fabrication
The catalytic electrodes in this work were synthesized by a chemical bath deposition (CBD) method described in the following. Nickel foam (NF) was soaked under 1 M HCl solution for 30 min to remove any surface layer of NiOX, then cleaned by deionized (DI) water and pure ethanol (volume ratio = 1) and dried in air at 80 °C. Subsequently, 0.5 g PVA was dissolved in 40 mL Milli-Q water at 90 °C under constant magnetic stirring. For Fe-NiO/NF, 0.12 M Fe(NO3)3·9H2O and 1 M Ni(NO3)2·6H2O were added into the solution to complete the precursor preparation. The pre-treated nickel foam was then immersed into the precursor solution and kept at 85 °C for 8 h. The resultant material was cleaned by DI water to remove residual reactants on the surface and annealed in an oven with a heating rate of 5 °C min−1 from room temperature to 550 °C and was kept at 550 °C for 3 h under ambient air conditions. The NiO/NF was prepared analogously without iron salt in the precursor solution and was immersed for 12 h.
2.3. Material Characterization
Scanning electron microscopy (SEM) analyses were performed using a high-performance Schottky field-emission micro-analyzer (Zeiss 1550 with AZtec EDS). X-ray diffraction (XRD) patterns were collected with a Bruker D8 Advance Twin-Twin using Cu Kα radiation (λ = 0.15418 nm). The Raman spectra were collected with a Renishaw micro Raman system (Renishaw, Wotton-under-Edge Gloucestershire, UK. ) at room temperature using 1800 lines/mm grating. A frequency-doubled Nd:YAG laser operating at 532 nm was used as an excitation source where the incident laser intensity was lowered to 10 mW using neutral density filters. All Raman spectra were collected with a resolution of ~1 cm−1.
2.4. Electrochemical Measurements
Electrochemical characterization was carried out on a CH 760C electrochemical workstation (CH Instruments, Inc. Austin, TX, USA) using a standard three-electrode quartz cell in 1 M NaOH at room temperature. The working, counter, and reference electrodes were the as-prepared catalysts, platinum wire, and Ag/AgCl (3M KCl), respectively. The 1 M NaOH electrolyte was prepared from pure NaOH pellets and Milli-Q water. All potentials used in this work were measured vs. Ag/AgCl (3M) and transformed to values relative to the reversible hydrogen electrode (RHE) using the Nernst equation.
ERHE = EAg/AgCl + 0.210 V + 0.059 pH (pH = 14 ± 0.2)
The polarization curves were obtained by linear sweep voltammetry (LSV) with a scan rate of 1 mV s−1. Electrochemical impedance spectroscopy (EIS) measurements were carried out at different applied potentials from −1.4 to 0.7 V vs. Ag/AgCl (3 M KCl) in the frequency range of 1 to 105 Hz with 5 mV ac amplitude. The Tafel slope was obtained from LSV plots using the following equation, η = b × logJ + a where J is current density with 100% iR correction, R is the internal resistance of the electrochemical cell obtained from EIS, η is the overpotential, and b is the Tafel slope.
3. Result and Discussion
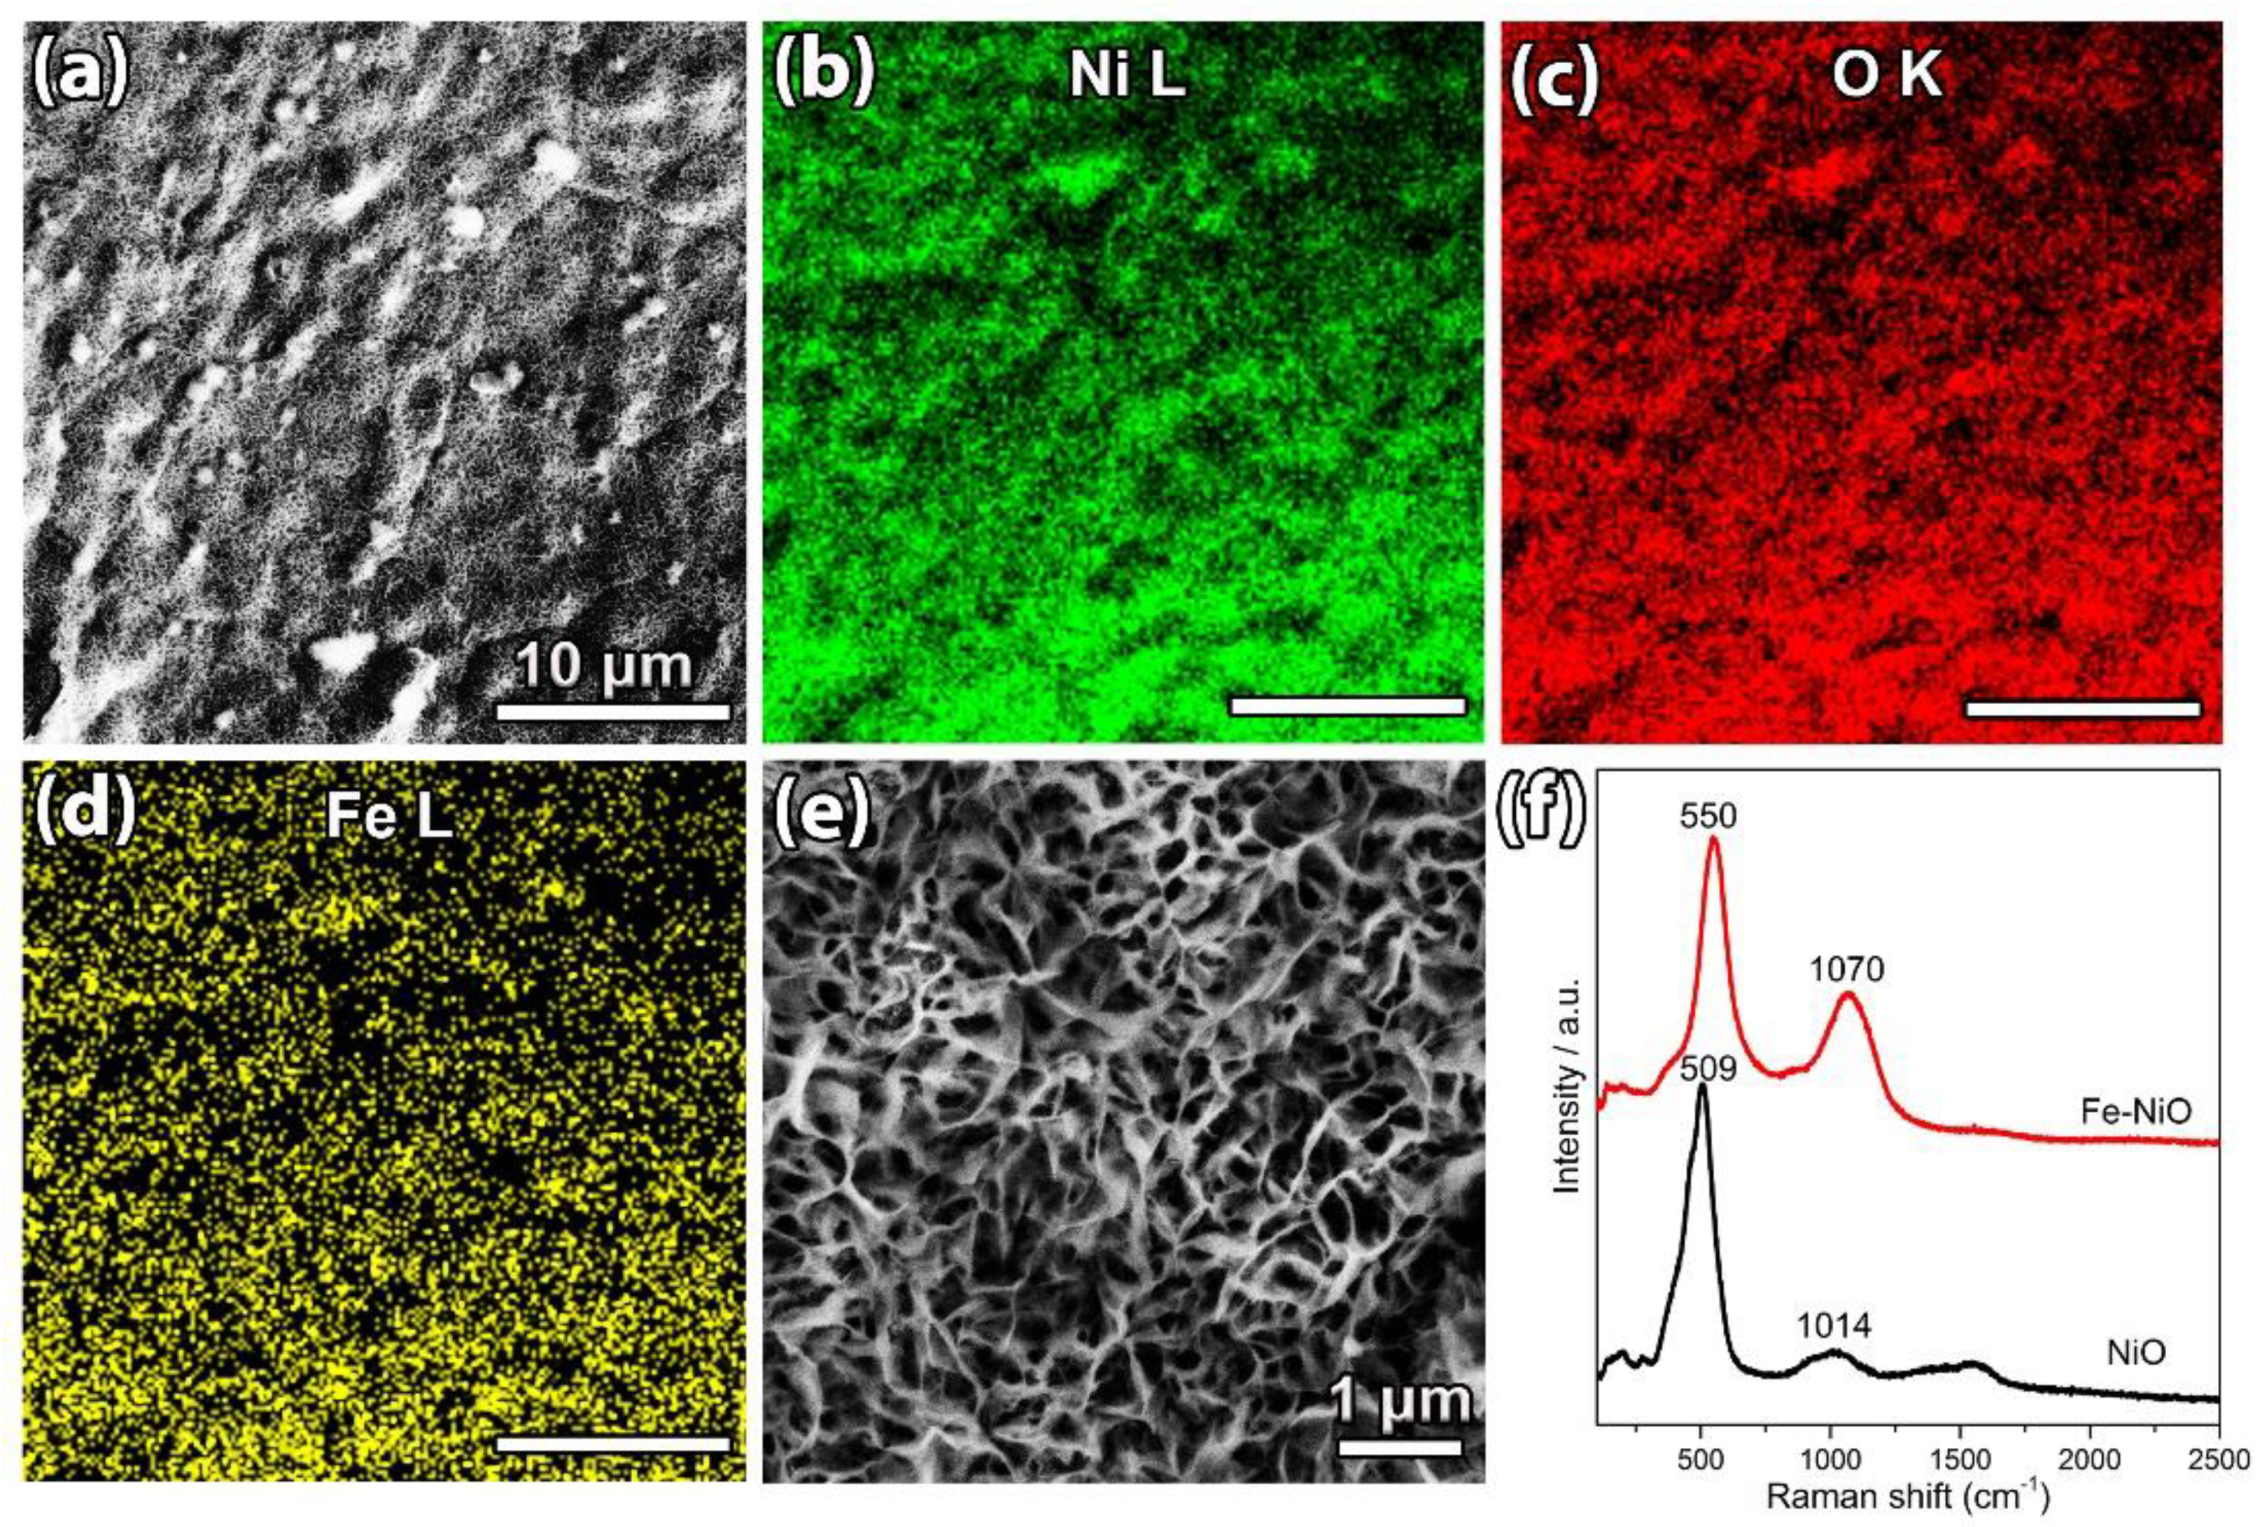
The surface morphology of the electrodes consisting of Fe-NiO (Figure 1a,e) and NiO nanosheets (Figure S1), deposited onto Ni foam, was characterized by scanning electron microscopy (SEM) and energy-dispersive X-ray spectroscopy (EDS) elemental mappings (Figure 1b–d). The latter technique reveals a uniform dispersion of Ni, Fe, and O throughout the nanostructure. As shown in Figure S2, the thickness of the nanosheets is approximately 850 nm. Raman spectroscopy (Figure 1f) is a versatile tool and further confirms that Fe ions are chemically bonded into the NiO lattice, which also corresponds with previous reports for Ni-Fe oxide systems [27,28,29]. The Raman peaks below 600 cm−1 in NiO can be ascribed to one-phonon (1P) Ni–O modes (TO and LO), two-phonon modes between 600 cm−1 and 1200 cm−1 (2TO, TO + LO, and 2LO), and magnon modes above 1200 cm−1 [30]. Magnons are excitations of spin waves that can occur in magnetically ordered materials [31], where a two-magnon (2 M) mode commonly was seen at ~1500 cm−1 for NiO [30,32]. The Raman band at 509 cm−1 and 1014 cm−1 in NiO could be ascribed to the LO mode and the frequency-doubled 2LO mode, respectively. The weak band at ~1500 cm−1 in NiO was well consistent with the 2 M mode [30,33]. The positive shift of the 1P LO Raman band with Fe incorporation (Fe–NiO) indicated that Fe was inserted into the lattice of NiO. The 2 M Raman mode disappeared and this implied a change in the magnetic ordering with Fe incorporation, which agreed with previously reported broadening and damping of the 2 M mode upon increased metal ion doping into NiO [34]. Furthermore, the LO mode at 550 cm−1 for the Fe-doped NiO was not fully frequency doubled into the 2LO mode at 1070 cm−1, reflecting that only the low wavenumber part of the 1P mode was coupled into the 2LO mode of NiO, thereby demonstrating a local disorder of the 1P LO mode with Fe doping. As seen in Figure S3, the X-ray diffraction (XRD) patterns at 37.3°, 43.3°, 63.0°, 75.4°, and 79.4° of the Fe–NiO and NiO nanosheets can be assigned to (111), (200), (220), (311), and (222) planes of cubic NiO (ICDD: 00-004-0835). There are no additional reflections from Fe-containing phases appearing in as-synthesized Fe-NiO. Moreover, the slightly broader peaks for Fe-NiO indicate that Fe substitution leads to the suppression of the grain growth and structural disorder of NiO lattice, which is in agreement with other reported works [35,36].
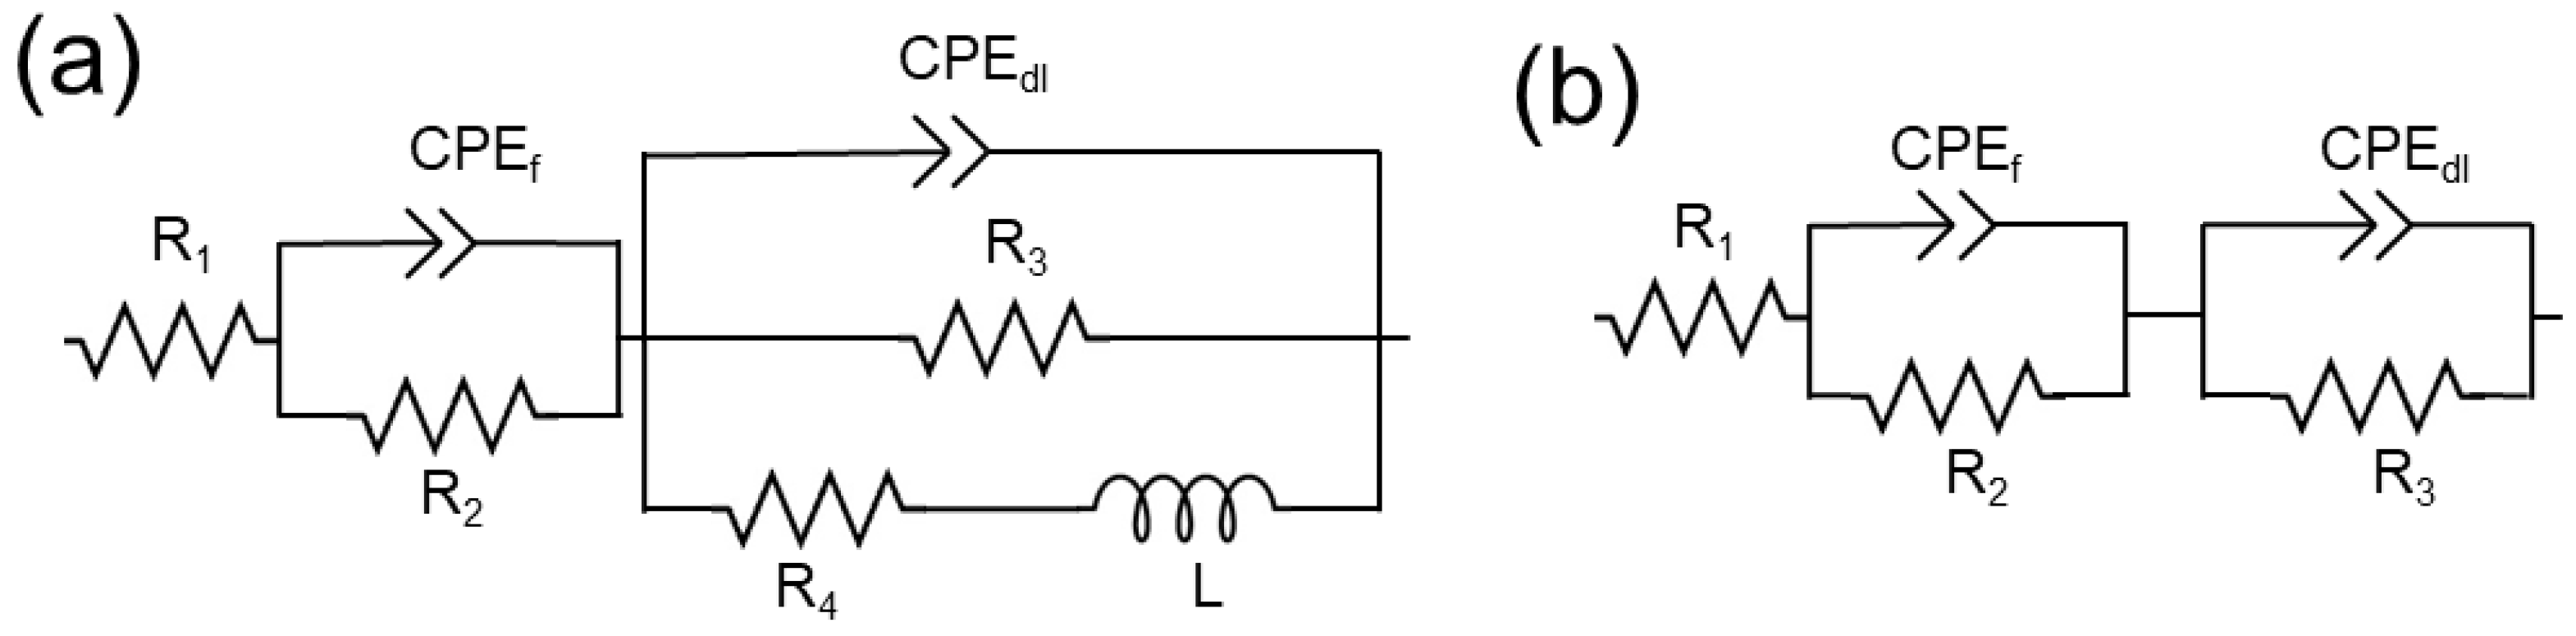
EIS analysis [16,37,38,39] has been widely used to reveal the electrochemical behaviors involved in reaction processes. As reported previously [40,41], the mechanism of HER in alkaline media follows two primary steps: (i) water molecules decompose to yield OH− in the solution together with adsorbed atomic hydrogen (Had) bound to metal (M) atoms on the surface (Volmer reaction) followed by (ii) electrochemical desorption (Heyrovsky reaction) or M-Had recombination (Tafel reaction). The impedance of such a multistep process is complex and can be represented by different ECs, as shown by HC [26]. To model the HER process, we improved the inductive EC of HC by adding a series resistance (R1), due to electrolyte and/or contacts and a high-frequency impedance due to the film or interfacial barriers (represented by R2 and CPEf with α = 1), as illustrated in Figure 2a. In addition, constant phase elements (CPE) were used to replace capacitances. In this so-called L-CPE model, the electrochemical charge-transfer interfacial reaction of the HER process was represented by a parallel connection of CPEdl, R3, and L-R4 and occurred at moderate-to-low frequencies. Here CPEdl denotes the double layer constant phase element, R3 is the reaction charge transfer resistance, while the L-R4 series combination represents the additional part of the impedance response that is due to a changing surface coverage of adsorbed species. A CPE is an equivalent electrical circuit component that represents an imperfect capacitor and can be expressed as:
where ω is the angular frequency, Q is a parameter related to the capacitance, and α is the constant phase exponent.
It is well known that the OER process is more complicated than the HER process, involving many intermediate steps before OH− completely converts to O2/H2O. In the present work, we use both ECs in Figure 2 to evaluate the OER activity. The 2R-CPE model consists of series resistance and two R-CPE combinations (Figure 2b), which represent series resistance (R1), film/barrier impedance (CPEf and R2), and the OER related interfacial reactions (CPEdl and R3). The underlying assumption behind the EC of Figure 2b is that the L-R4 series combination can be neglected since its effect is too small to be measurable in the frequency range of interest.
The CPE is used as a pseudo-capacitive element corresponding to a combination of capacitive and charge-transfer processes, influenced by electrode roughness, porosity, and inhomogeneity. It is frequently used to model the influence of surface heterogeneity on the double-layer behavior, and it is of considerable interest to derive an effective capacitance value from the CPE model. When α = 1, Q represents the capacitance of the interface in units of F/cm2. When α < 1, the system shows interfacial behavior that is attributed to surface heterogeneity or to continuously distributed time constants for charge-transfer reactions. The parameter Q of CPE cannot represent the capacitance when α < 1. Previously, both the Mansfeld formula [42] and the Brug formula [38] have been widely used to extract effective equivalent capacitances from CPE parameters [43,44,45]. To ascertain the suitability of these formulae for our system, they were used to extract values of the effective equivalent capacitance. In the case of a surface time-constant distribution, Brug et al. [38] obtained a relationship between interfacial capacitance and CPE parameters for both Faradaic and blocking systems. For the case in Figure 2, the double-layer capacitance can be described by
Hsu and Mansfeld [42] suggested a different relationship in terms of Q, α based on the characteristic frequency where the imaginary part of the impedance obtains its maximum magnitude. According to the specific case in this study, the double-layer capacitance can be expressed as
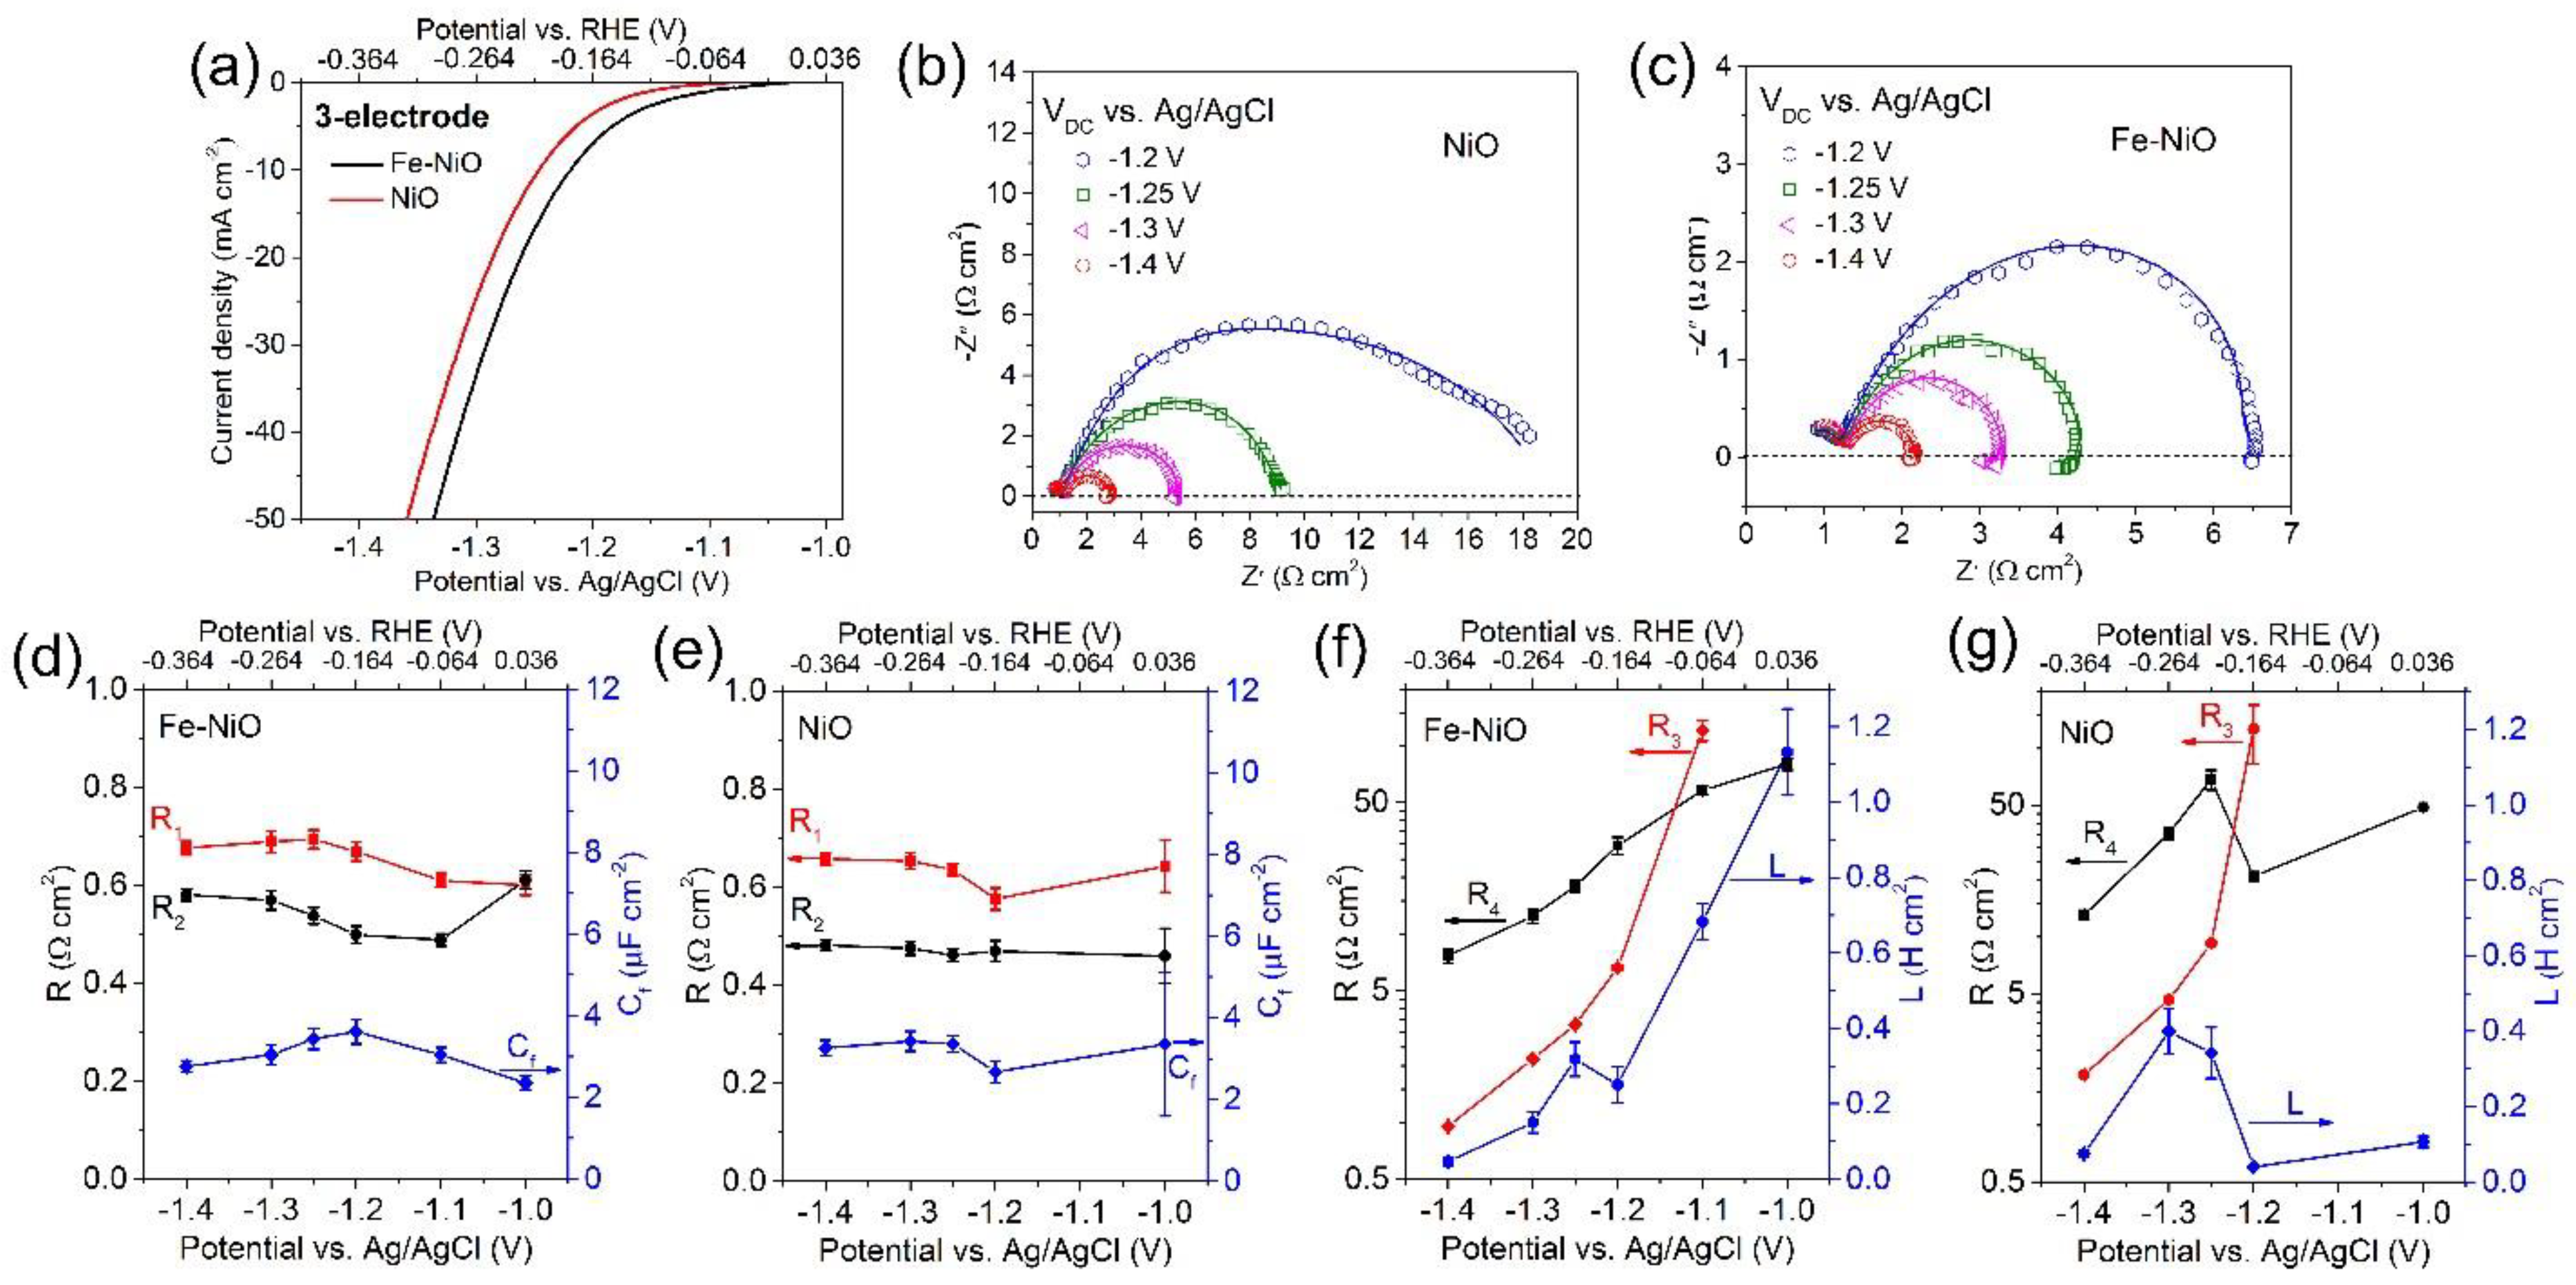
Figure 3a shows the HER performance obtained by LSV, of Fe-NiO and NiO nanosheets on Ni foam, measured in 1 M NaOH solution without iR compensation in a three-electrode electrochemical configuration. The HER efficiency of Fe-NiO nanosheets is better than that of NiO nanosheets, where the overpotential of Fe-NiO nanosheets is 34 mV lower than that of NiO nanosheets at 10 mA cm−2. Figure 3b,c, together with the lower potential data depicted in Figure S4, present the experimental Nyquist plots, for Fe-NiO and NiO nanosheets, of the AC response in a selected potential range from −1 V to −1.4 V vs. Ag/AgCl (3M KCl), respectively. For the HER process, there is a negative loop in the low-frequency range, which means that an inductive element in the EC is needed. An analysis based on the theoretical model of Figure 2a reveals that the series resistance because of the electrolyte, as well as the high-frequency resistance and capacitance, are independent of the electrode type and the applied bias (Figure 3d,e). The fitting shows a perfect capacitive behavior in the high-frequency range, which means that the exponent α is equal to 1. In terms of classical electrostatics, the capacitance of a layer is given by , where A is geometrical area, d is thickness, ε is the dielectric permittivity of the material, and ε0 is the permittivity of free space. Assuming a literature value of ε = 1000 [46,47] for NiO and neglecting effects of porosity, we estimate that d~1 μm. This order of magnitude agrees with the thickness of the nanosheets as shown in Figure S2. The film capacitance Cf of NiO nanosheets is slightly larger than that of Fe-NiO nanosheets, which is likely due to the different surface roughness observed in Figure 1, Figures S1 and S2. In addition, from Figure 3f,g, it is seen that the moderate to low-frequency response exhibits a strong dependence on the applied potential and electrode material, correlating with the reaction rate under the HER process. The variation in the values of R3, R4, and L for Fe-NiO and NiO nanosheets as a function of DC potential is shown in Figure 3f,g. The smaller resistances (R3 and R4) and inductance (L) of Fe-NiO nanosheets revealed that the presence of Fe could promote the hydrogen-related charge transfer and coverage relaxation related to adsorbed intermediates, thereby enhancing the HER catalytic activity. In addition, Figure 3f,g also show that the inductive behavior depends on the applied potential. Furthermore, Diard et al. [48] reported that the inductive behavior can only be observed in the case that the Volmer–Heyrovsky mechanism is the rate-determining. Hence, our data show that the rate of HER is determined by the Volmer–Heyrovsky reaction steps in the Fe-NiO and NiO systems. The HER mechanism is also investigated by empirical Tafel plots in Figure S5. It is shown that the Tafel slopes of Fe-NiO and NiO nanosheets are 105.5 mV dec−1 and 108.1 mV dec−1, respectively, which is between the theoretical values for the rate-determining Volmer (120 mV dec−1) and Heyrovsky (40 mV dec−1) cases, and thus, further indicates that the HER is proceeding via a Volmer-Heyrovsky reaction.
The L-CPE model enabled us to separate the contribution from the double layer capacitance from the response due to the change of surface coverage of adsorbed species, which is determined by the L-R4 arm in Figure 2a. The pseudocapacitance Q and exponent α obtained from the double layer element, CPEdl, for HER is shown in Figure S6. The value of the effective double-layer capacitance was estimated by Equations (2) and (3), respectively. As shown in Figure 4, it is clear that the Brug formula gives a well-defined value of effective capacitance, independent of potential, for our porous film, even though the exponent α is considerably lower than unity (Figure S6). We found consistently a double layer capacitance of 0.2 to 0.3 mF cm−2. The values obtained from the Mansfeld formula were in good agreement with the Brug ones at potentials below −1.25 V but showed an unphysical dependence on potential above −1.25 V.
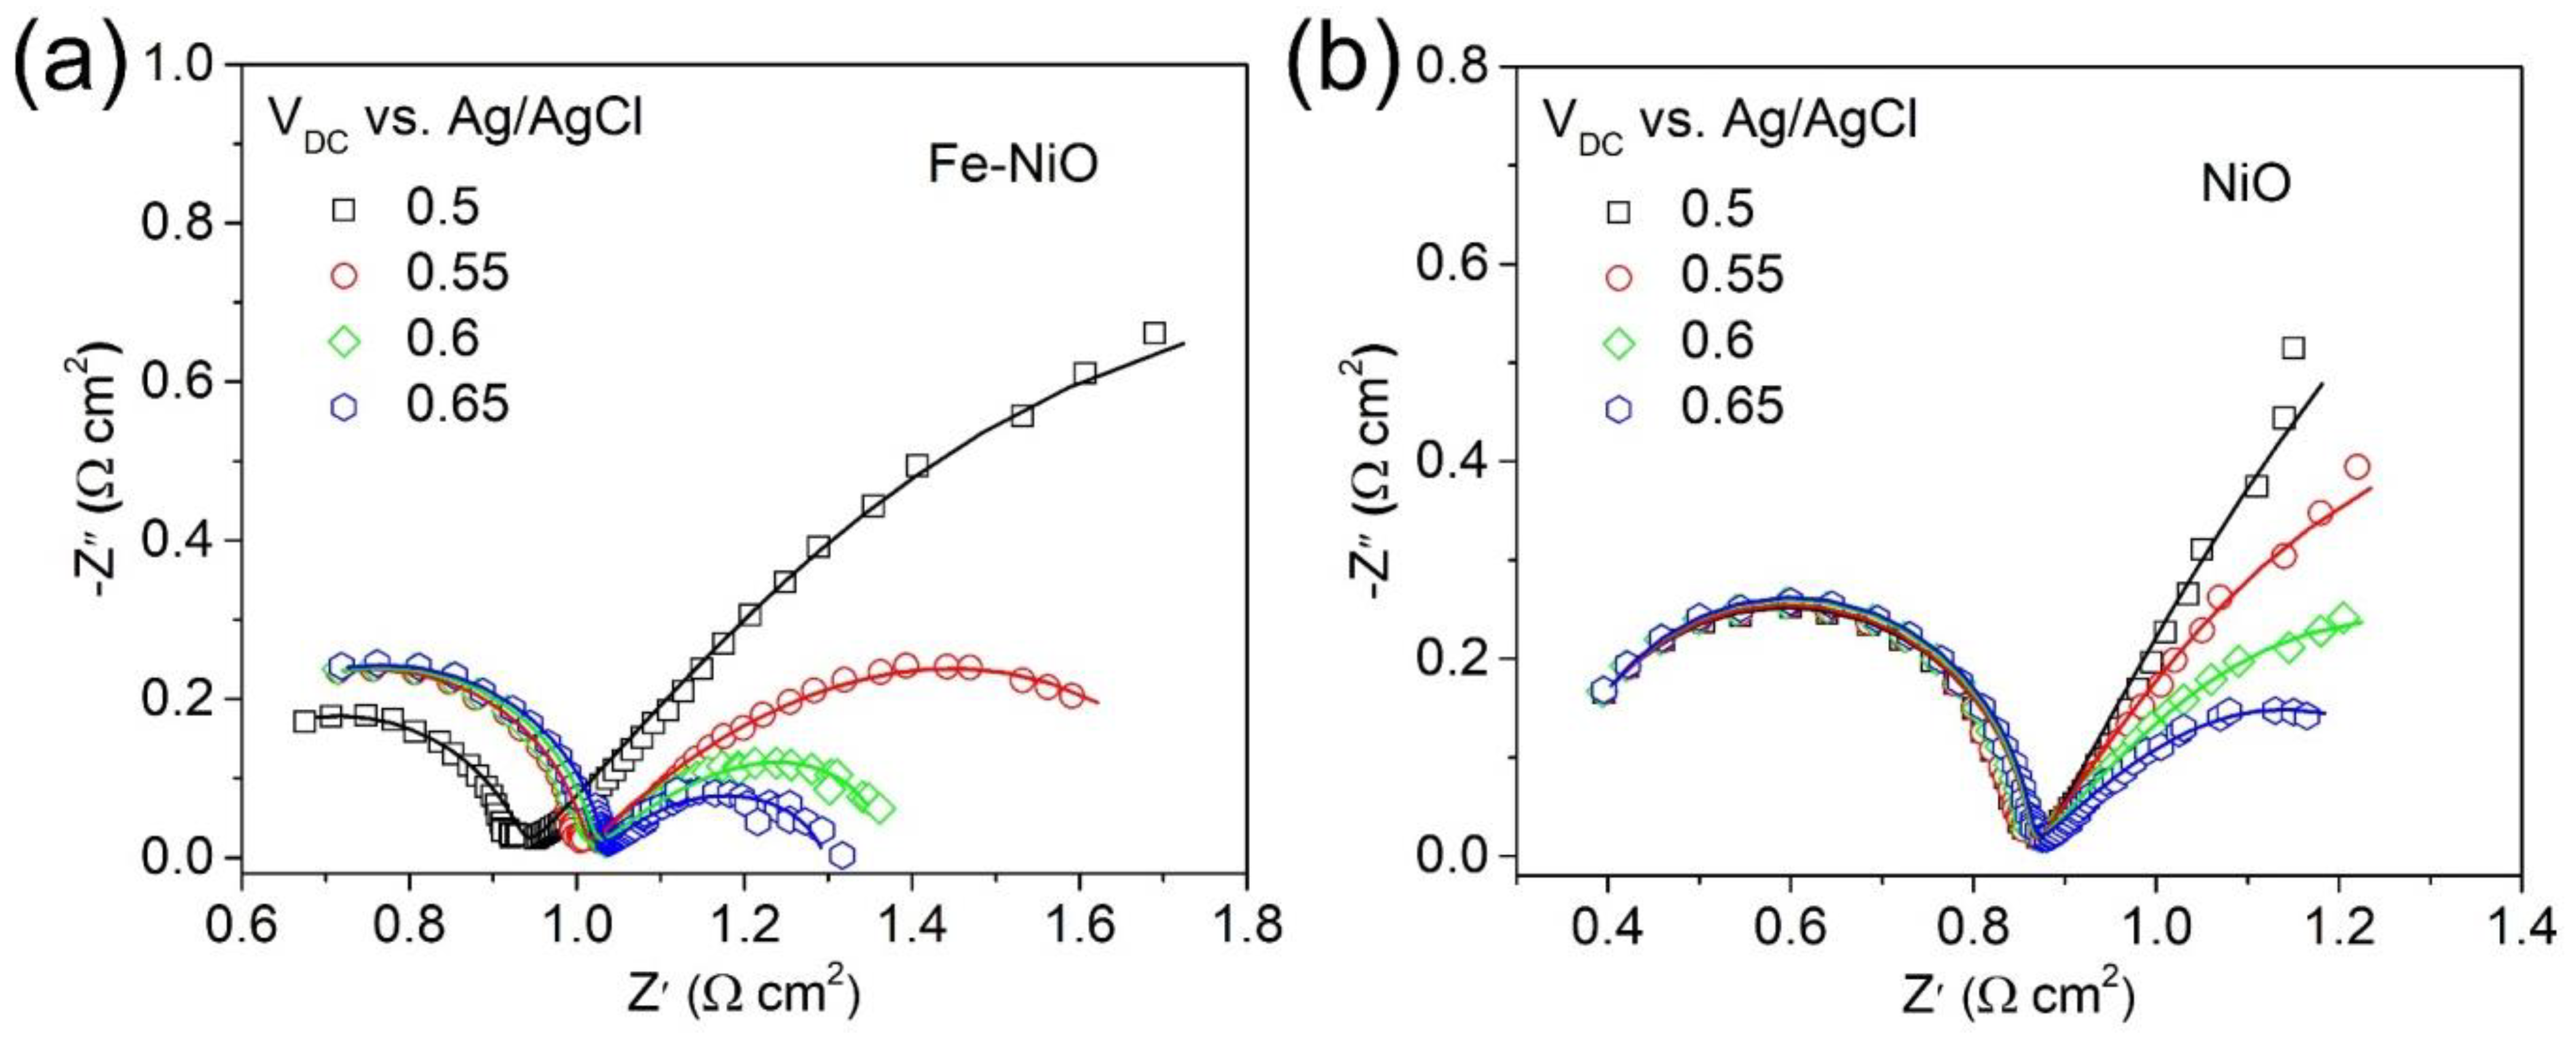
Figure 5a shows the OER activities of Fe-NiO and NiO nanosheets under the same conditions, which indicates that Fe incorporation into the NiO lattice is also positive for the OER, as many groups reported [22,49,50,51]. The electrochemical stability and prolonged activity of Fe-NiO and NiO for both OER and HER were investigated by i–t curves applying a constant anodic and cathodic overpotential, respectively. As seen in Figure S7, there was an insignificant change of current densities on Fe-NiO and NiO under the same constant potential, which indicated that the enhanced activity of Fe-doped NiO was mainly due to Fe incorporation by synthesis rather than the incidental iron from the electrolyte. To investigate the performance of electrochemical cells, the overall water splitting was also measured using as-prepared catalysts as both anode and cathode in a two-electrode configuration (Figure S8). The polarization curves showed that bifunctional catalyst Fe–NiO required only 1.73 V to reach a current density of 10 mA cm−2, which was 124 mV lower than for NiO. It complied well with the performance of Fe-NiO and NiO catalysts for the half-reaction in a three-electrode configuration. For a detailed study of the Fe effect on the OER electrochemical process, EIS was carried out at different applied potentials from 0.3 V to 0.65 V vs. Ag/AgCl (3 M KCl). As shown in Figure 5b,c, the real and imaginary parts of impedance decreases with increasing applied potentials in the low-frequency range, while the high-frequency impedance is not changing appreciably with DC potential. It is clear that the behavior at low frequencies is related to the charge-transfer resistance and results in different OER catalytic properties. As shown in Figure 5b,c, Nyquist plots of Fe-NiO and NiO contain two semicircles with no discernible negative loop at the low-frequency range. Therefore, we interpreted the results by fits to the 2R-CPE circuit in Figure 2b.
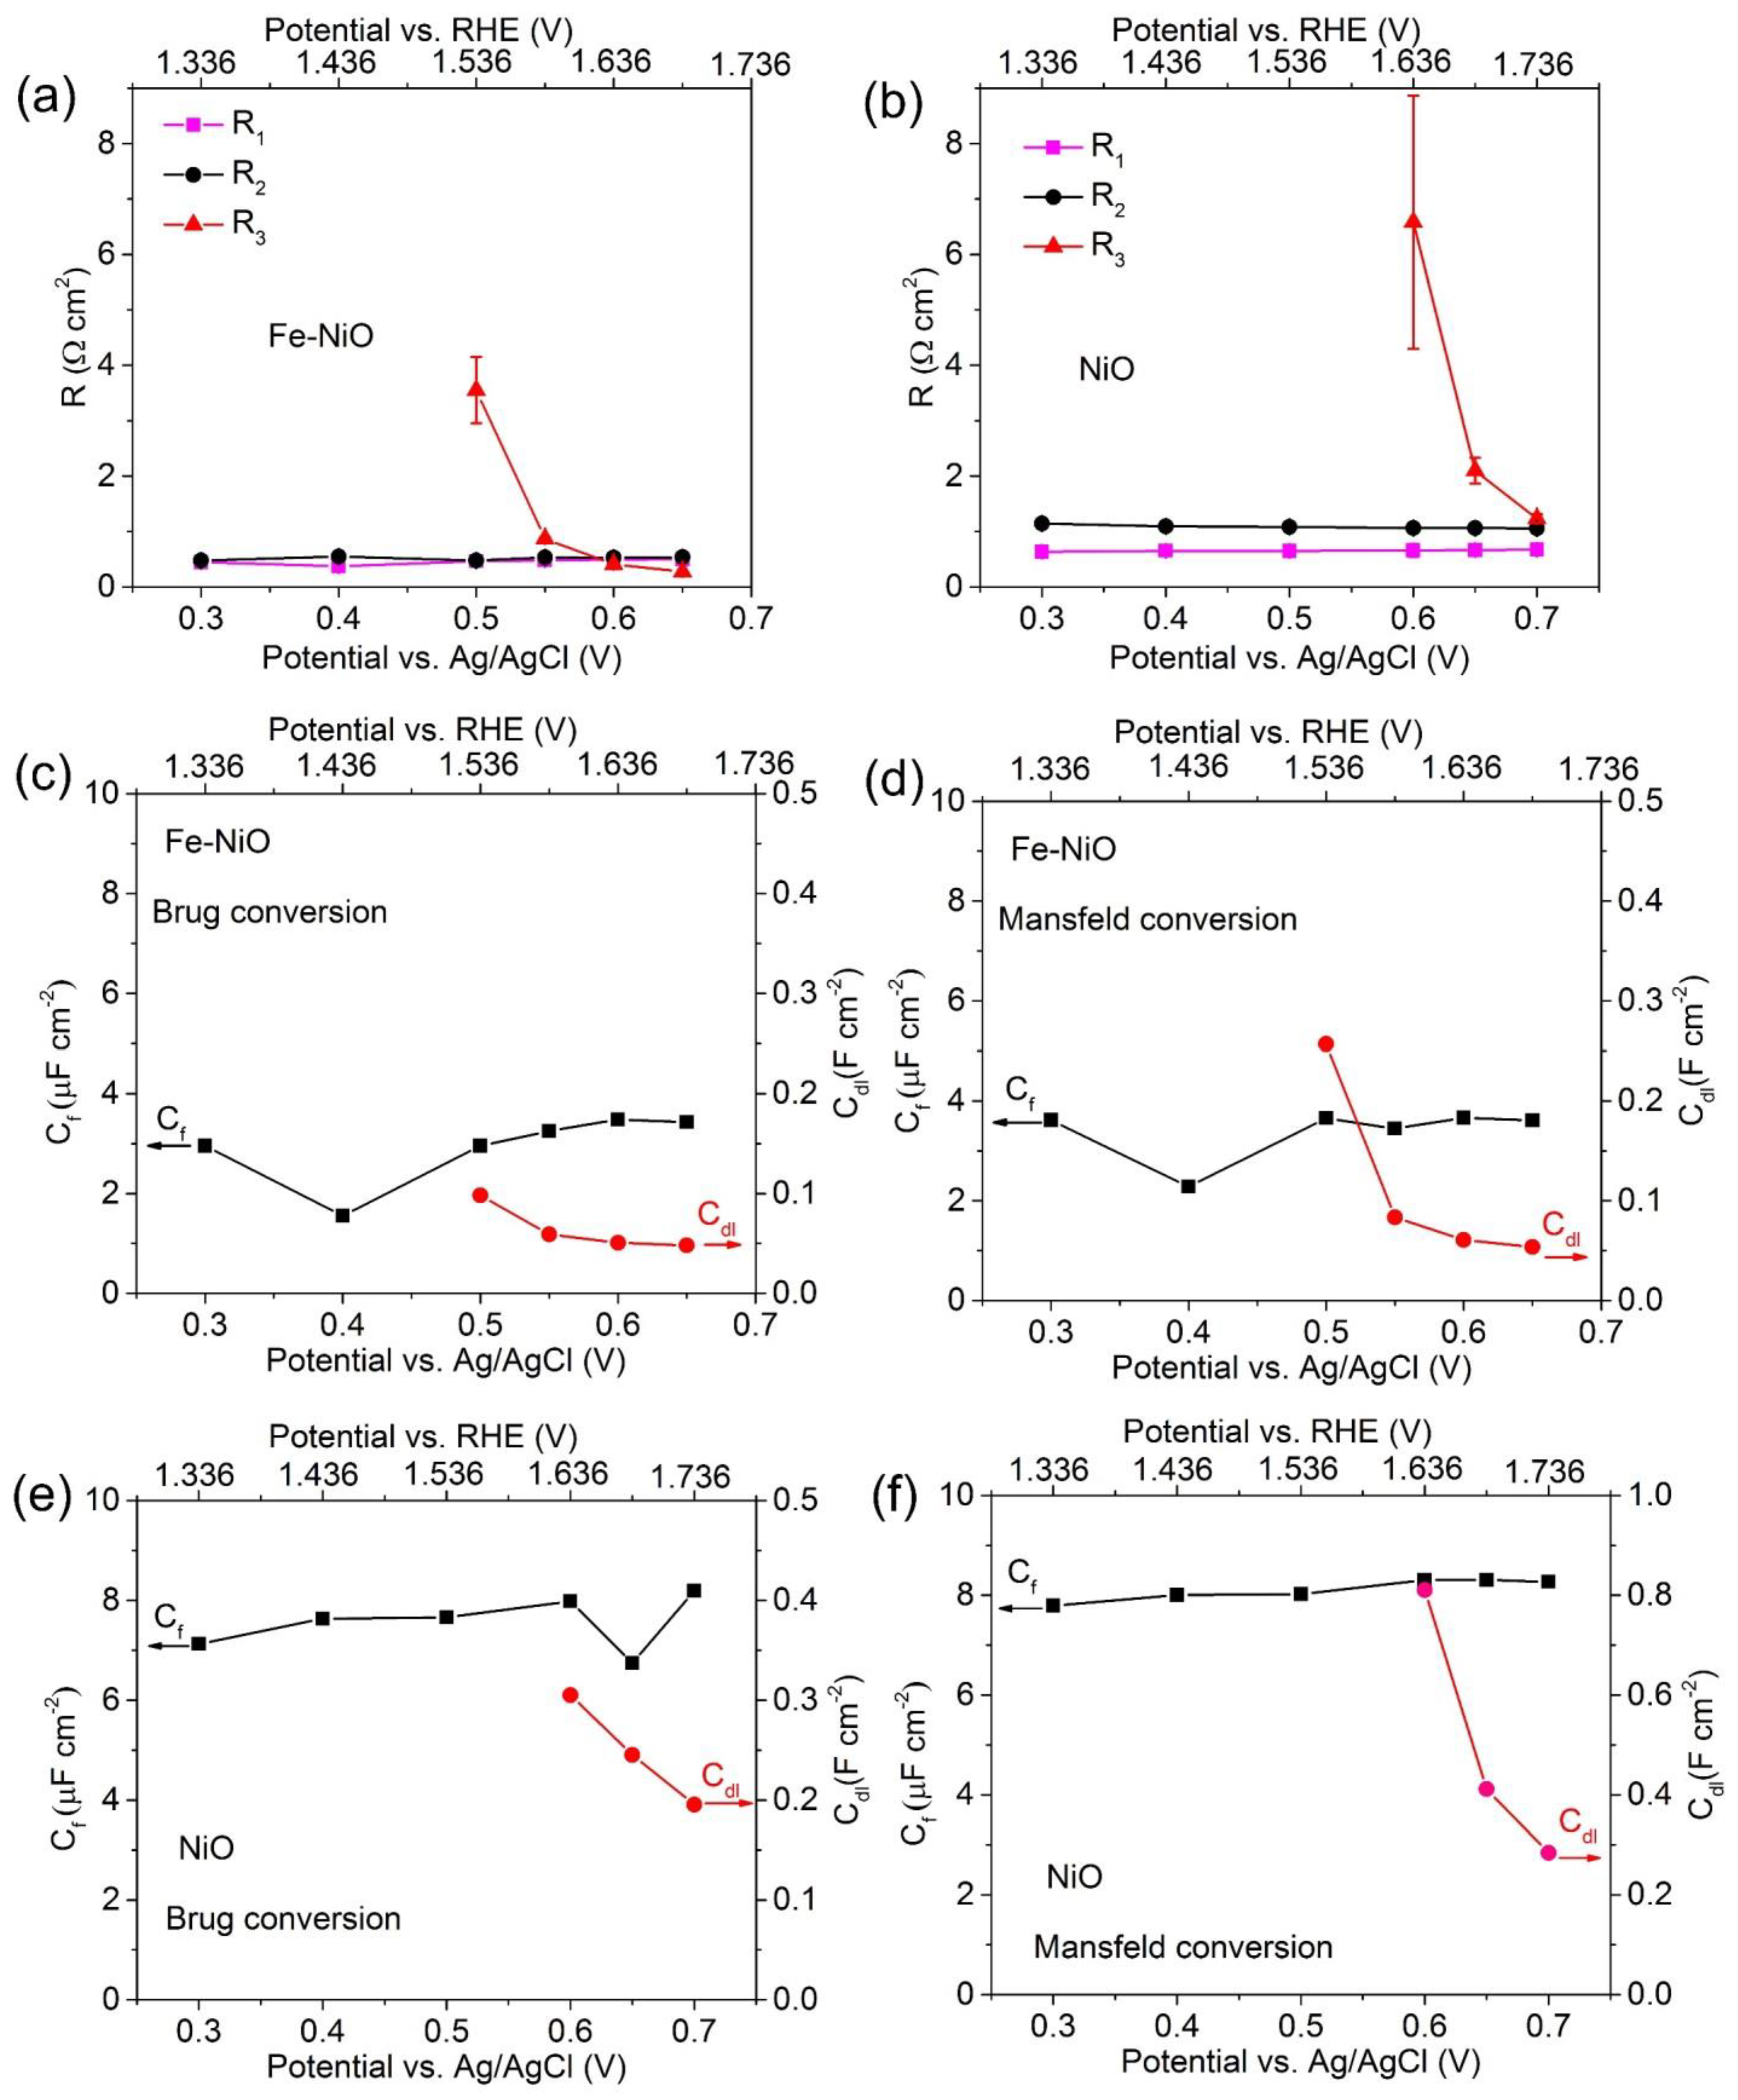
Figure 6a,b show that the values of R1 and R2 exhibit negligible change with potential, while the value of R3 decreases with increasing potential. As before, we attribute R2 and CPEf to the transport properties in the electrode since the effective capacitance Cf (Figure 6c–f) does not show any significant potential dependence. The pseudocapacitance Q and exponent α obtained from the CPE’s for the OER case are shown in Figure S8a,b for the film capacitance and double layer capacitance, respectively. Figure 6c–f compares the calculated values of Cf and Cdl obtained from the Brug equation and Mansfeld formula for Fe-NiO nanosheets and NiO nanosheets in the case of the OER process. The two equations gave similar capacitance values, although Cdl could only be accurately evaluated at a few potentials due to uncertainties in the fit parameters. The double-layer capacitance Cdl of the Fe-NiO and NiO nanosheets was found to be very high, larger than 50 mF cm−2, but the data in Figure 6c–f are observed to display strong potential dependence. The power-law exponents in Figure S9b are always lower than 0.7, indicating that diffusion effects may influence CPEdl. Under these conditions, it was doubtful whether the results from the Brug and Mansfeld equations represented geometrical capacitances. The value of R3 of Fe-NiO nanosheets was smaller than that of NiO nanosheets at the same potential with e.g., a 7-fold decrease of reaction resistance at 0.6 V (Figure 6a,b). This implied a major reduction in reaction resistance by the presence of Fe, facilitating the yield of oxygen generation.
It is not possible to determine by inspection of the measured OER impedance plots in Figure 5 whether the asymptotic low-frequency response is inductive or capacitive. This issue was of considerable importance for the determination of rate-determining reaction mechanisms. There was no visible inductive loop in the low-frequency range shown in the measured OER impedance plots in Figure 5, but similar mechanisms of adsorption and desorption of surface species under the OER process, as under the HER one, should exist. To study this effect in more detail, we attempted to fit the OER experimental data to the L-CPE circuit in Figure 2a but allowing the inductance L to be both positive and negative, to be able to distinguish between capacitive and inductive behavior. However, fitting to the EC in Figure 2a was only possible at potentials in the range 0.5–0.7 V vs. Ag/AgCl (Figure 7), since the model over-parametrized the data at lower potentials. Because only a part of the low-frequency semicircle can be seen in Figure 5b and, especially in Figure 5c, these fits gave a very large uncertainty in many of the circuit elements in the L-CPE model. Preliminary fits indicated that R4 was very small and to decrease the number of parameters, it was put equal to zero. This assumption led to acceptable uncertainties in the other circuit parameters at potentials in the range 0.5 to 0.7 V, especially for the case of Fe-NiO nanosheets. As shown in Figure S10, the parameter values and their trends were similar to those shown in Figure 6, in most cases even quantitatively, for the case of the Fe-NiO nanosheets. However, it was more difficult to use the L-CPE circuit for the NiO nanosheets, since parameter uncertainties were higher, and some parameters could not be obtained at all potentials. In the case of NiO, R1, R2, and Cf exhibited the same trend as in the fit to the simpler circuit 2R-CPE (Figure 6), while R3 and Cdl showed larger discrepancies. The main new and important result obtained from the fits to the L-CPE circuit was that positive values of inductance were consistently obtained (Figure S10a,b). This indicated the presence of an inductive loop but at very low frequencies beyond the range used in our measurements. Furthermore, this suggested that the relaxation due to the change of surface coverage of reaction intermediates was asymptotically inductive also for the OER process in alkaline electrolytes.
4. Conclusions
In summary, in comparison with NiO nanosheets, Fe doped NiO nanosheets exhibit enhanced catalytic activities for both OER and HER in alkaline electrolytes. We explored the electrochemical impedance response of Fe-NiO and NiO nanosheets and investigated two different equivalent circuit models to obtain values of specific physical parameters characterizing the OER and HER. A model including an inductance, the L-CPE model, is theoretically justified for the HER and yields excellent fits to experimental data. The low-frequency behavior is inductive, which shows that the Volmer-Heyrovsky steps are rate determining. This model can in principle be used also for the OER, giving excellent fits, although many parameter values become uncertain. However, the modeling shows the low-frequency impedance to be asymptotically inductive also for the case of the OER. Hence the L-CPE model provides a new strategy to understand the OER process pathway, in cases where data are accurate enough to distinguish it from the simpler empirical 2R-CPE model. The EC modeling quantitatively shows that Fe doping lowers the charge transfer resistance, i.e., the reaction barrier for water splitting on the NiO nanosheets, promotes the reaction activity, and accelerates the transformation of absorbed intermediates in agreement with a recently published study using operando Raman spectroscopy [23]. Our findings provide an EIS approach for an improved understanding of the catalytic reaction mechanism, which is ultimately beneficial for the design and characterization of efficient and low-cost catalyst systems.
Supplementary Materials
The following are available online at https://0-www-mdpi-com.brum.beds.ac.uk/article/10.3390/physchem1010005/s1, Figure S1: (a) Low and (b) high magnification SEM images of NiO nanosheets, Figure S2: The thickness of Fe-NiO nanosheets (a) and NiO nanosheets (b) measured by SEM images, Figure S3: (a) XRD patterns of Fe-NiO and NiO nanosheets as well as the subatrate Ni foam, (b) corresponding magnified image of portions of figure (a), Figure S4: EIS plots for Fe-NiO (a) and NiO (b) nanosheets at different DC potentials vs. Ag/AgCl (3 M KCl) under HER process, Figure S5: The corresponding cathodic Tafel plots at a scan rate of 1 mV s−1 via a three-electrode configuration in 1 M NaOH aqueous elelctrolyte, Figure S6: The pseudo capacitance Q and exponent α of the double layer capacitance as a function ofpotential for HER, Figure S7: J-t curves of Fe-NiO and NiO nanosheets on Ni foam at 1.636 V and −0.214 V vs. RHE for 12 h in 1 M NaOH, Figure S8: Comparison of polarization curves of the overall water splitting using Fe-NiO and NiO as both anode and cathode in a two-electrode configuration at the scan rate of 1 mV s−1 in 1 M NaOH, Figure S9: The pseudo capacitance Q and exponent α of the film (a) and the double layer capacitance (b) as a function of potential for OER, Figure S10: Circuit element values calculated from the fits of EIS data of porous Fe-NiO and NiO films to the EC in Fig. 2a. Inductance and resistances (a,b) as well as effective equivalent capacitances (c–f) are shown as a function of applied potential, error bars for the fit parameters are shown in (a) and (b).
Author Contributions
Z.Q. and T.E. initialized the research project and conceptualized the approach. Z.Q. performed the experimental work and analysis. Y.M. helped with material synthesis. G.A.N. and T.E. provided the idea to improve the equivalent circuit model and participated in the impedance analysis. Z.Q. and T.E. wrote the original draft and all authors participated in reviewing and editing the final manuscript. Project administration, T.E.; funding acquisition, G.A.N., T.E. All authors have read and agreed to the published version of the manuscript.
Funding
This research was funded by the Swedish Energy Agency, the Swedish Research Council (VR 2015-03814; VR 2016-03713), and the Swedish Research Council for sustainable development (2016-00908).
Institutional Review Board Statement
Not applicable.
Informed Consent Statement
Not applicable.
Data Availability Statement
Not applicable.
Conflicts of Interest
The authors declare no conflict of interest.
References
- Schlapbach, L.; Zuttel, A. Hydrogen-storage materials for mobile applications. Nature 2001, 414, 353–358. [Google Scholar] [CrossRef]
- Gasteiger, H.A.; Markovic, N.M. Chemistry. Just a dream--or future reality? Science 2009, 324, 48–49. [Google Scholar] [CrossRef] [PubMed]
- Ardo, S.; Rivas, D.F.; Modestino, M.A.; Greiving, V.S.; Abdi, F.F.; Llado, E.A.; Artero, V.; Ayers, K.; Battaglia, C.; Becker, J.P.; et al. Pathways to electrochemical solar-hydrogen technologies. Energy Environ. Sci. 2018, 11, 2768–2783. [Google Scholar] [CrossRef] [Green Version]
- Shi, Y.; Zhang, B. Recent advances in transition metal phosphide nanomaterials: Synthesis and applications in hydrogen evolution reaction. Chem. Soc. Rev. 2016, 45, 1529–1541. [Google Scholar] [CrossRef] [PubMed]
- Anantharaj, S.; Ede, S.R.; Sakthikumar, K.; Karthick, K.; Mishra, S.; Kundu, S. Recent Trends and Perspectives in Electrochemical Water Splitting with an Emphasis on Sulfide, Selenide, and Phosphide Catalysts of Fe, Co, and Ni: A Review. ACS Catal 2016, 6, 8069–8097. [Google Scholar] [CrossRef]
- Yan, Y.; Xia, B.Y.; Zhao, B.; Wang, X. A review on noble-metal-free bifunctional heterogeneous catalysts for overall electrochemical water splitting. J. Mater. Chem. A 2016, 4, 17587–17603. [Google Scholar] [CrossRef] [Green Version]
- Corrigan, D.A. The Catalysis of the Oxygen Evolution Reaction by Iron Impurities in Thin-Film Nickel-Oxide Electrodes. J. Electrochem. Soc. 1987, 134, 377–384. [Google Scholar] [CrossRef]
- Miller, E.L. Electrochemical Behavior of Reactively Sputtered Iron-Doped Nickel Oxide. J. Electrochem. Soc. 1997, 144, 3072–3077. [Google Scholar] [CrossRef]
- Trotochaud, L.; Young, S.L.; Ranney, J.K.; Boettcher, S.W. Nickel-iron oxyhydroxide oxygen-evolution electrocatalysts: The role of intentional and incidental iron incorporation. J. Am. Chem Soc. 2014, 136, 6744–6753. [Google Scholar] [CrossRef]
- Wang, P.; Pu, Z.; Li, Y.; Wu, L.; Tu, Z.; Jiang, M.; Kou, Z.; Amiinu, I.S.; Mu, S. Iron-Doped Nickel Phosphide Nanosheet Arrays: An Efficient Bifunctional Electrocatalyst for Water Splitting. ACS Appl Mater. Interfaces 2017, 9, 26001–26007. [Google Scholar] [CrossRef]
- Luo, J.; Im, J.H.; Mayer, M.T.; Schreier, M.; Nazeeruddin, M.K.; Park, N.G.; Tilley, S.D.; Fan, H.J.; Gratzel, M. Water photolysis at 12.3% efficiency via perovskite photovoltaics and Earth-abundant catalysts. Science 2014, 345, 1593–1596. [Google Scholar] [CrossRef] [PubMed]
- Smith, R.D.; Prevot, M.S.; Fagan, R.D.; Trudel, S.; Berlinguette, C.P. Water oxidation catalysis: Electrocatalytic response to metal stoichiometry in amorphous metal oxide films containing iron, cobalt, and nickel. J. Am. Chem Soc. 2013, 135, 11580–11586. [Google Scholar] [CrossRef] [PubMed]
- Fillol, J.L.; Codola, Z.; Garcia-Bosch, I.; Gomez, L.; Pla, J.J.; Costas, M. Efficient water oxidation catalysts based on readily available iron coordination complexes. Nat. Chem 2011, 3, 807–813. [Google Scholar] [CrossRef] [PubMed]
- Singh, A.; Chang, S.L.Y.; Hocking, R.K.; Bach, U.; Spiccia, L. Highly active nickel oxide water oxidation catalysts deposited from molecular complexes. Energy Environ. Sci. 2013, 6, 579–586. [Google Scholar] [CrossRef]
- Młynarek, G.; Paszkiewicz, M.; Radniecka, A. The effect of ferric ions on the behaviour of a nickelous hydroxide electrode. J. Appl. Electrochem. 1984, 14, 145–149. [Google Scholar] [CrossRef]
- Delgado, D.; Minakshi, M.; Kim, D.J.; Kyeong, C. Influence of the Oxide Content in the Catalytic Power of Raney Nickel in Hydrogen Generation. Anal. Lett. 2017, 50, 2386–2401. [Google Scholar] [CrossRef]
- Friebel, D.; Louie, M.W.; Bajdich, M.; Sanwald, K.E.; Cai, Y.; Wise, A.M.; Cheng, M.-J.; Sokaras, D.; Weng, T.-C.; Alonso-Mori, R.; et al. Identification of Highly Active Fe Sites in (Ni,Fe)OOH for Electrocatalytic Water Splitting. J. Am. Chem. Soc. 2015, 137, 1305–1313. [Google Scholar] [CrossRef] [Green Version]
- Kim, S.; Tryk, D.A.; Antonio, M.R.; Carr, R.; Scherson, D. In situ x-ray absorption fine structure studies of foreign metal ions in nickel hydrous oxide electrodes in alkaline electrolytes. J. Phys. Chem. 1994, 98, 10269–10276. [Google Scholar] [CrossRef]
- Del Arco, M.; Malet, P.; Trujillano, R.; Rives, V. Synthesis and Characterization of Hydrotalcites Containing Ni(II) and Fe(III) and Their Calcination Products. Chem. Mater. 1999, 11, 624–633. [Google Scholar] [CrossRef]
- Chen, J.Y.C.; Dang, L.; Liang, H.; Bi, W.; Gerken, J.B.; Jin, S.; Alp, E.E.; Stahl, S.S. Operando Analysis of NiFe and Fe Oxyhydroxide Electrocatalysts for Water Oxidation: Detection of Fe4+ by Mössbauer Spectroscopy. J. Am. Chem. Soc. 2015, 137, 15090–15093. [Google Scholar] [CrossRef]
- Qiu, Z.; Tai, C.-W.; Niklasson, G.A.; Edvinsson, T. Direct observation of active catalyst surface phases and the effect of dynamic self-optimization in NiFe-layered double hydroxides for alkaline water splitting. Energy Environ. Sci. 2019, 12, 572–581. [Google Scholar] [CrossRef] [Green Version]
- Li, Y.F.; Selloni, A. Mechanism and Activity of Water Oxidation on Selected Surfaces of Pure and Fe-Doped NiOx. ACS Catal. 2014, 4, 1148–1153. [Google Scholar] [CrossRef]
- Qiu, Z.; Ma, Y.; Edvinsson, T. In operando Raman investigation of Fe doping influence on catalytic NiO intermediates for enhanced overall water splitting. Nano Energy 2019, 66, 104118. [Google Scholar] [CrossRef]
- Lvovich, V.F. Impedance Spectroscopy: Applications to Electrochemical and Dielectric Phenomena; John Wiley & Sons: Hoboken, NJ, USA, 2012. [Google Scholar]
- Barsoukov, E.; Macdonald, J.R. Impedance Spectroscopy: Theory, Experiment, and Applications; John Wiley & Sons: Hoboken, NJ, USA, 2018. [Google Scholar]
- Harrington, D.A.; Conway, B.E. ac Impedance of Faradaic reactions involving electrosorbed intermediates—I. Kinetic theory. Electrochim. Acta 1987, 32, 1703–1712. [Google Scholar] [CrossRef] [Green Version]
- Wu, Z.C.; Zou, Z.X.; Huang, J.S.; Gao, F. Fe-doped NiO mesoporous nanosheets array for highly efficient overall water splitting. J. Catal. 2018, 358, 243–252. [Google Scholar] [CrossRef]
- Liu, S.H.; Jia, J.F.; Wang, J.; Liu, S.J.; Wang, X.C.; Song, H.Z.; Hu, X. Synthesis of Fe-doped NiO nanofibers using electrospinning method and their ferromagnetic properties. J. Magn. Magn. Mater. 2012, 324, 2070–2074. [Google Scholar] [CrossRef]
- Fominykh, K.; Chernev, P.; Zaharieva, I.; Sicklinger, J.; Stefanic, G.; Doblinger, M.; Muller, A.; Pokharel, A.; Bocklein, S.; Scheu, C.; et al. Iron-doped nickel oxide nanocrystals as highly efficient electrocatalysts for alkaline water splitting. ACS Nano 2015, 9, 5180–5188. [Google Scholar] [CrossRef]
- Dietz, R.E.; Parisot, G.I.; Meixner, A.E. Infrared Absorption and Raman Scattering by Two-Magnon Processes in NiO. Phys. Rev. B 1971, 4, 2302–2310. [Google Scholar] [CrossRef]
- Fleury, P.A.; Loudon, R. Scattering of Light by One- and Two-Magnon Excitations. Phys. Rev. 1968, 166, 514–530. [Google Scholar] [CrossRef]
- Aytan, E.; Debnath, B.; Kargar, F.; Barlas, Y.; Lacerda, M.M.; Li, J.X.; Lake, R.K.; Shi, J.; Balandin, A.A. Spin-Phonon Coupling in Antiferromagnetic Nickel Oxide. Appl. Phys. Lett. 2017, 111, 252402. [Google Scholar] [CrossRef]
- Mironova-Ulmane, N.; Kuzmin, A.; Steins, I.; Grabis, J.; Sildos, I.; Pärs, M. Raman Scattering in Nanosized Nickel Oxide NiO. J. Phys. Conf. Ser. 2007, 93, 012039. [Google Scholar] [CrossRef]
- Funkenbusch, E.F.; Cornilsen, B.C. Two-Magnon Raman Scattering in Calcium Doped NiO. Solid State Commun. 1981, 40, 707–710. [Google Scholar] [CrossRef]
- Wang, J.; Cai, J.; Lin, Y.-H.; Nan, C.-W. Room-Temperature Ferromagnetism Observed in Fe-Doped NiO. Appl. Phys. Lett. 2005, 87, 202501. [Google Scholar] [CrossRef]
- Ponnusamy, P.M.; Agilan, S.; Muthukumarasamy, N.; Senthil, T.S.; Rajesh, G.; Venkatraman, M.R.; Velauthapillai, D. Structural, optical and magnetic properties of undoped NiO and Fe-doped NiO nanoparticles synthesized by wet-chemical process. Mater. Charact. 2016, 114, 166–171. [Google Scholar] [CrossRef]
- Bai, L.; Conway, B.E. AC Impedance of Faradaic Reactions Involving Electrosorbed Intermediates: Examination of Conditions Leading to Pseudoinductive Behavior Represented in Three-Dimensional Impedance Spectroscopy Diagrams. J. Electrochem. Soc. 1991, 138, 2897–2907. [Google Scholar] [CrossRef]
- Brug, G.J.; Van den Eeden, A.L.G.; Sluyters-Rehbach, M.; Sluyters, J.H. The Analysis of Electrode Impedances Complicated by the Presence of a Constant Phase Element. J. Electroanal Chem 1984, 176, 275–295. [Google Scholar] [CrossRef]
- Diard, J.P.; LeGorrec, B.; Montella, C. Non-linear impedance for a two-step electrode reaction with an intermediate adsorbed species. Electrochim. Acta 1997, 42, 1053–1072. [Google Scholar] [CrossRef]
- Dinh, C.T.; Jain, A.; de Arquer, F.P.G.; De Luna, P.; Li, J.; Wang, N.; Zheng, X.L.; Cai, J.; Gregory, B.Z.; Voznyy, O.; et al. Multi-site electrocatalysts for hydrogen evolution in neutral media by destabilization of water molecules. Nat. Energy 2019, 4, 107–114. [Google Scholar] [CrossRef]
- Conway, B.E.; Tilak, B.V. Behavior and characterization of kinetically involved chemisorbed intermediates in electrocatalysis of gas evolution reactions. In Advances in Catalysis; Eley, D.D., Pines, H., Weisz, P.B., Eds.; Academic Press: San Diego, CA, USA, 1992; Volume 38, pp. 1–147. [Google Scholar]
- Hsu, C.H.; Mansfeld, F. Technical Note: Concerning the Conversion of the Constant Phase Element Parameter Y0 into a Capacitance. Corrosion 2001, 57, 747–748. [Google Scholar] [CrossRef]
- Elezović, N.R.; Jović, V.D.; Krstajić, N.V. Kinetics of the hydrogen evolution reaction on Fe–Mo film deposited on mild steel support in alkaline solution. Electrochim. Acta 2005, 50, 5594–5601. [Google Scholar] [CrossRef]
- Chen, L. Study of the Kinetics of Hydrogen Evolution Reaction on Nickel-Zinc Alloy Electrodes. J. Electrochem. Soc. 1991, 138, 3321–3328. [Google Scholar] [CrossRef]
- Van Schaftinghen, T.; Deslouis, C.; Hubin, A.; Terryn, H. Influence of the surface pre-treatment prior to the film synthesis, on the corrosion protection of iron with polypyrrole films. Electrochim. Acta 2006, 51, 1695–1703. [Google Scholar] [CrossRef]
- Nilsson, T.M.J.; Niklasson, G.A. Comparison of dielectric and optical properties of nickel-oxide-based electrochromic coatings. Proc. Spie 1990, 1272, 129–138. [Google Scholar]
- Biju, V.; Khadar, M.A. Dielectric properties of nanostructured nickel oxide. J. Mater. Sci. 2003, 38, 4055–4063. [Google Scholar] [CrossRef]
- Diard, J.P.; LeGorrec, B.; Maximovitch, S. Etude de l’activation du degagement d’hydrogene sur electrode d’oxyde de nickel par spectroscopie d’impedance. Electrochim. Acta 1990, 35, 1099–1108. [Google Scholar] [CrossRef]
- Qi, J.; Zhang, W.; Xiang, R.; Liu, K.; Wang, H.-Y.; Chen, M.; Han, Y.; Cao, R. Porous Nickel–Iron Oxide as a Highly Efficient Electrocatalyst for Oxygen Evolution Reaction. Adv. Sci. 2015, 2, 1500199. [Google Scholar] [CrossRef]
- Pebley, A.C.; Decolvenaere, E.; Pollock, T.M.; Gordon, M.J. Oxygen evolution on Fe-doped NiO electrocatalysts deposited via microplasma. Nanoscale 2017, 9, 15070–15082. [Google Scholar] [CrossRef]
- Gong, M.; Dai, H. A mini review of NiFe-based materials as highly active oxygen evolution reaction electrocatalysts. Nano Res. 2015, 8, 23–39. [Google Scholar] [CrossRef] [Green Version]
Figure 1.
(a–d) Low-magnification SEM image and EDS elemental mapping of Ni, O, and Fe for Fe-NiO nanosheets with the same scale bar. (e) High-magnification SEM image of Fe-NiO nanosheets. (f) Comparison of Raman spectra of Fe-NiO and NiO nanosheets under 532 nm laser irradiation.
Figure 1.
(a–d) Low-magnification SEM image and EDS elemental mapping of Ni, O, and Fe for Fe-NiO nanosheets with the same scale bar. (e) High-magnification SEM image of Fe-NiO nanosheets. (f) Comparison of Raman spectra of Fe-NiO and NiO nanosheets under 532 nm laser irradiation.

Figure 2.
ECs models abbreviated L-CPE (a) and 2R-CPE (b) used for fitting data of as-prepared catalysts.
Figure 2.
ECs models abbreviated L-CPE (a) and 2R-CPE (b) used for fitting data of as-prepared catalysts.

Figure 3.
(a) Cathodic polarization curves of Fe-NiO and NiO nanosheets on Ni foam, at a scan rate of 1 mV s−1. EIS plots for (b) NiO and (c) Fe-NiO nanosheets at different DC potentials vs. Ag/AgCl (3 M KCl) under the HER process. The symbols show the experimental points, while solid lines are the fitting curves using the EC of Figure 2a. (d–g) Circuit element values calculated from the fits of EIS data of porous Fe-NiO and NiO films to the EC of Figure 2a. The values of R3 at the smallest negative potentials were not plotted in (f) and (g) because they could not be determined accurately by the EC fitting.

Figure 4.
The effective double layer capacitance was calculated from the Brug equation (a) and the Mansfeld equation (b) as a function of applied potential under the HER process in 1 M NaOH.
Figure 4.
The effective double layer capacitance was calculated from the Brug equation (a) and the Mansfeld equation (b) as a function of applied potential under the HER process in 1 M NaOH.

Figure 5.
(a) Anodic polarization curves of Fe-NiO and NiO nanosheets on Ni foam without iR correction, taken at a scan rate of 1 mV s−1. Impedance curves for OER at different DC potentials vs. Ag/AgCl (3 M KCl) on porous Fe-NiO (b) and NiO (c) nanosheets. The symbols show the experimental points, while solid lines are the fitting curves using the EC of Figure 2b (2R-CPE).
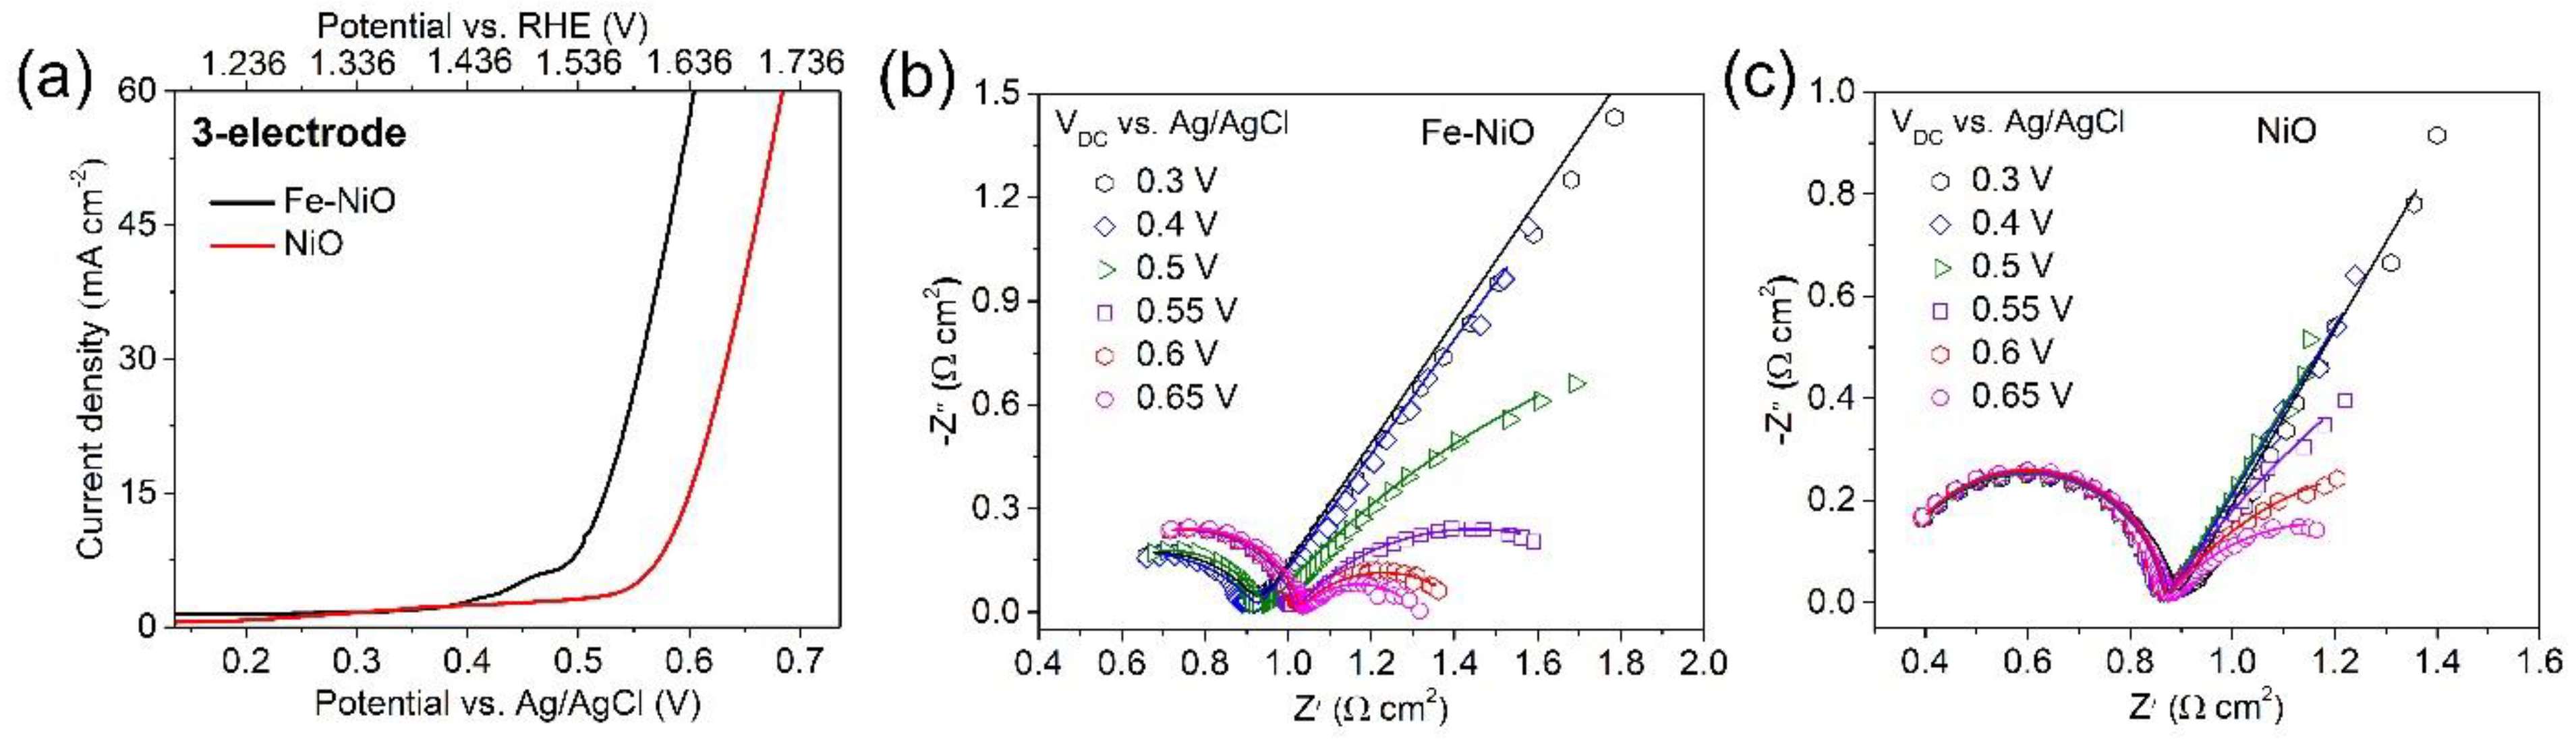
Figure 6.
Circuit element values calculated from the fits of EIS data of porous Fe-NiO and NiO films to the EC of Figure 2b. Resistances (a,b) and effective equivalent capacitances (c–f) are shown as a function of applied potentials.
Figure 6.
Circuit element values calculated from the fits of EIS data of porous Fe-NiO and NiO films to the EC of Figure 2b. Resistances (a,b) and effective equivalent capacitances (c–f) are shown as a function of applied potentials.

Figure 7.
Nyquist plots obtained at different applied potentials vs. Ag/AgCl (3 M KCl) on porous Fe-NiO (a) and NiO (b) nanosheets in 1 M NaOH. The data were also shown in Figure 5. Symbols denote experimental data and full lines are fitted by the L-CPE model.
Figure 7.
Nyquist plots obtained at different applied potentials vs. Ag/AgCl (3 M KCl) on porous Fe-NiO (a) and NiO (b) nanosheets in 1 M NaOH. The data were also shown in Figure 5. Symbols denote experimental data and full lines are fitted by the L-CPE model.

Publisher’s Note: MDPI stays neutral with regard to jurisdictional claims in published maps and institutional affiliations. |
© 2021 by the authors. Licensee MDPI, Basel, Switzerland. This article is an open access article distributed under the terms and conditions of the Creative Commons Attribution (CC BY) license (https://creativecommons.org/licenses/by/4.0/).
Share and Cite
MDPI and ACS Style
Qiu, Z.; Ma, Y.; Niklasson, G.A.; Edvinsson, T. An Electrochemical Impedance Study of Alkaline Water Splitting Using Fe Doped NiO Nanosheets. Physchem 2021, 1, 69-81. https://0-doi-org.brum.beds.ac.uk/10.3390/physchem1010005
AMA Style
Qiu Z, Ma Y, Niklasson GA, Edvinsson T. An Electrochemical Impedance Study of Alkaline Water Splitting Using Fe Doped NiO Nanosheets. Physchem. 2021; 1(1):69-81. https://0-doi-org.brum.beds.ac.uk/10.3390/physchem1010005
Chicago/Turabian StyleQiu, Zhen, Yue Ma, Gunnar A. Niklasson, and Tomas Edvinsson. 2021. "An Electrochemical Impedance Study of Alkaline Water Splitting Using Fe Doped NiO Nanosheets" Physchem 1, no. 1: 69-81. https://0-doi-org.brum.beds.ac.uk/10.3390/physchem1010005