
A Review of the Mechanical and Physical Properties of Polyethylene Fibers
by
 ,
,
Coline Roiron
1,2,* ,
,
Eric Lainé
1,
Jean-Claude Grandidier
1,
Nicolas Garois
3 and
Cathie Vix-Guterl
2 1
Institut Pprime, UPR3346 CNRS, ISAE-ENSMA, Université de Poitiers, CEDEX, 86962 Futuroscope Chasseneuil, France
2
TOTAL S.A., Tour Coupole La Défense, 2 Place Jean Millier, 92078 Paris, France
3
Centre de Recherche Hutchinson, Rue Gustave Nourry BP31, 45120 Châlette-sur-Loing, France
*
Author to whom correspondence should be addressed.
Textiles 2021, 1(1), 86-151; https://0-doi-org.brum.beds.ac.uk/10.3390/textiles1010006
Submission received: 29 April 2021
/
Revised: 13 May 2021
/
Accepted: 20 May 2021
/
Published: 4 June 2021
(This article belongs to the Special Issue Fibrous Materials (Textiles) for Functional Applications)
Abstract
:Since the 1970s and 1980s, a major effort has been made to study UHMWPE (Ultra-High Molecular Weight PolyEthylene) fibers with remarkable mechanical properties, based on a basic polymer such as PE (PolyEthylene). These performances are above all associated with a very strong alignment of the molecules and the microfibrillar structures formed using various processes. However, they vary greatly depending on many parameters, and particularly on the draw ratio. Thus, these characteristics have been extensively analyzed by dynamic, static tensile, and creep tests, and are predominantly viscoelastic. The behavior appears to be associated with physical considerations and with the characteristic orthorhombic-hexagonal solid phase transition. The presence of a hexagonal phase is detrimental to the behavior because the chains slide easily relative to each other. Shifting this transition to higher temperatures is a challenge and many factors influence it and the temperature at which it takes place, such as the application of stress or annealing. The objective here is to give an overview of what has been done so far to understand the behavior of UHMWPE yarns. This is important given future numerical modeling work on the dimensioning of structural parts in which these UHMWPE yarns will be reinforcements within composites.
1. Introduction
1.1. Context
The use of polymers in structural parts is generally done for economic reasons. When replacing metal parts, lightweight considerations are added to the low cost. However, polymers are sometimes limited in their use or not used at all in certain industries (automotive, aeronautics). They are intended primarily for use in cladding parts and, in the case of stiffer polymers, for lightly filled structural elements. In highly filled parts, composites sometimes compete with metals, in which case the polymers act as a matrix that maintains the coherence of the composites and protects the fibers. Thermoplastic matrices are increasingly used, whereas thermosetting matrices previously dominated the composites market. The appearance of thermoplastic prepregs has contributed to an increase in the use of this family of polymers in composites since 1980. This interest is also based on faster processes and, above all, the possible reuse of thermoplastics by melting them [1].
The automotive industry is subject to requirements in terms of lighter structures as well as environmental impact. Also, using carbon or glass fiber reinforcements raises questions. Laws are pushing manufacturers to consider more carefully the impact of their products at each stage of the life cycle, including recycling and end-of-life disposal. Indeed, manufacturers are trying to ensure that every part is recyclable. Between 2015 and 2018, EU countries had to achieve reuse and recycling rates of more than 85% and reuse and recovery rates of more than 95% for individual vehicles, based on the average weight per vehicle [2]. When glass or carbon reinforcements are reused, their mechanical properties are degraded, and they cannot be burnt. It is important to underline that 95% of the composites produced are reinforced with glass fibers on the European market [3], and the reuse of carbon fibers is marginal. Furthermore, the fields of application of these recycled fibers are therefore restricted. One possibility is to use natural fibers such as hemp or flax, which are recyclable and can be burned, but whose mechanical properties are reduced when recycled because of their low thermal stability. Whatever the nature of the reinforcing fiber, when it is different from that of the matrix, recycling seems to be compromised or very expensive to implement. To summarize, on the one hand, the separation of the components is very expensive or even impossible or ecologically devastating (dissolving chemicals), and on the other hand, the reuse as shred often leads to a loss of properties that worsens with each cycle. The method of shredding and the size of the pellets, influence the properties of the recycled material.
The concept of self-reinforced polymers (later called SRP) was then introduced by Capiati and Porter in 1975 [4]. It is a composite material whose matrix and reinforcement are made from the same polymer or the same chemical family. Thus, unlike more conventional composites, an SRP is much easier to recycle [1]. If the morphology differs between the reinforcement (fibrillar microstructure due to the drawing process) and the matrix (spheroidal morphology), the chemical structures are close and therefore a strong chemical adhesion is possible between the fibers and the matrix [5,6]. This structural homogeneity then has no impact on biocompatibility and biodegradation, as no chemical agents are added to promote reinforcement or adhesion of the matrix [5]. These composites are used in fields such as automotive (engine crankcase, bumpers, door panels, among others), audio (loudspeakers), medical (prosthesis parts), ballistic (armoring and bullet-proof vests), consumer products (luggage, orthoses, sports equipment (hockey and football)), construction (architectural panels, among others), and nautical (reinforcement for sailing), but also for valves, pipelines, and containers [7,8,9,10,11,12,13,14,15].
In the literature, many authors have focused on studying the behavior of SRP, regardless of the nature of the constituent polymer. The behavior of SRP differs from that of non-reinforced polymers in terms of greater rigidity and tensile strength [5,16,17] and compressive strength [18], greater longitudinal bending performance [13,19], improved tenacity [17], impact strength [7,11], and creep resistance [7,13]. The behavior of SRPs compared to composites with glass, carbon, or natural fiber reinforced matrices was also investigated. The specific modulus and strength of SRPs compete with those of composites with glass-fiber reinforced polymers [1]. But SRPs stand out above all for their high energy absorption capacity and therefore their impact resistance, which is superior to any conventional composite [1,9,18,19]. These studies demonstrate that SRPs are plausible alternatives to current composites with better prospects in terms of large-scale recyclability. The viscoelastic reinforcements are the principal reason for the attractive use of SRPs in industry. A major disadvantage of traditional composites is their low strain at break under stress in the direction of the fiber [20], and taking advantage of viscoelastic fibers as reinforcements brings these ductility properties to composites. This type of fiber also guarantees vibration damping in certain structural elements [12]. However, some polymer fibers, e.g., PE, are compatible with only a few matrices because their molecular polarity is low, so self-reinforcement is one of the only solutions to overcome this problem [21,22].
So, given the attractiveness of these composites for lightweight and strong structural parts, understanding their behavior is essential. The use of such composites could, for example, reduce the thickness of parts that are currently made of unreinforced polymer. However, to design such parts, it is necessary to understand the behavior of composites, and the complete knowledge of the reinforcement behavior is essential.
The advantage of PE is its low cost and its biological neutrality, but it allows, in addition, very high drawing ratios with a limited number of defects and consequently very high mechanical properties and a damping capacity due to a viscous part in their mechanical behavior. The specific stiffness far exceeds those of glass and their recyclability is much higher. The use of SRPE composites with such fibers can be considered to compete with glass-fiber reinforced epoxy composites, but with the disadvantage of a proven limitation concerning temperature and creep resistance in hot environments. However, a better knowledge of the mechanical behavior of these fibers is a prerequisite for their use in SRPEs and to extend their use in mass-produced structures with a need for an increasingly high recycling rate.
In the 1980s, fibers have been commercially developed by several companies, including Spectra® (Honeywell (formerly Allied-Signal Inc.), Colonial Heights, VA, USA), Dyneema® (DSM, Geleen, The Netherlands), Tenfor® (Snia Fiber, Milan, Italy), Hifax®, Doyentrontex® (BJTYZ, Beijing, China), and Tekmilon® (Mitsui Petrochemical, Tokyo, Japan). However, most studies focused on Dyneema® [12,13,14,22,23,24,25,26,27,28,29,30,31,32] or Spectra® fibers [28,33,34,35], or even Hifax® [36,37,38,39].
Consequently, different types of PE reinforcements are available on the market, both fabrics and fibers. In the literature, several terms are used. To create a frame of reference, the terminology used in this review considers a fiber, also called a filament by some authors, as the smallest entity. A filament bundle is then referred to as a yarn, a strand, or a tow. Fabrics can be made from these strands or yarns.
Many authors have focused on studying unique fiber [23,24,29,33,40,41,42,43]. For several reasons related to experimental difficulties, which will be explained below, and because composite reinforcements are made of yarns or fabrics, some authors focus on yarns and not fibers [13,14,21,22,26,28,44,45,46].
In addition to the remarkable properties that can be achieved with stretched PE reinforcements, and their compatibility with very few matrices, the reason this review focuses on PE reinforcements is the subject of the next section.
1.2. Focus on PE Fibers
PolyEthylene (PE) has always been of great interest because it is one of the most important basic polymers for scientists but also for industry. The ambition to obtain a mechanically performing polymer material by taking advantage of the intrinsic properties of covalent bonds was first observed in 1932 by Carothers and Hill [47] on polyester and polyamide, notably processed by cold drawing. Thus, PE fibers were quickly introduced to the market and were subsequently used in many areas, as they show real potential as reinforcement. Low density and high tensile strength make the use of PE reinforcements interesting. In his review, Ohta [48] compared different tenacities obtained on commercial fibers from several polymers and it is PE, one of the most basic polymers, that has the highest tenacity. UHMWPE (Ultra-High Molecular Weight PolyEthylene) has a good set of properties, good abrasion resistance, a low density, the highest impact resistance of all plastics at cryogenic temperatures, good corrosion resistance, a low friction coefficient, and good impact and noise reduction properties. These industrial fibers have high strength, a more moderate modulus, compared to glass fibers, but a higher elongation at break.
However, their low melting temperature compared to other reinforcements may also be an obstacle to their use for certain applications. Due to its properties, UHMWPE reinforcement is today used in limited fields such as ballistics (bullet-proof vest [45]), medicine (prosthetic joints [49]) for protective equipment (helmets [29]), or towing lines [29]. These fibers have not been integrated into the primary structures in the automotive and aeronautic industry. To widen their use in these fields of activity, it would be mandatory to know and control their thermomechanical behavior under different load paths (loads at different speeds, fatigue, creep, load fluctuations coupled with temperature fluctuations) and the field of knowledge of this behavior is by no means exhaustive today.
PE is a viscoelastic material and is in its rubbery state at room temperature, which favors time-dependent processes. Reinforcements are therefore very sensitive to creep due to the low cohesive energy density of PE and structural irregularities [29]. To explore new applications or to design structural parts, the influence of temperature and time on the mechanical performance of PE reinforcements must, therefore, be better known. This is all the more true concerning fibers, which are the main elements of SRPs. For example, the behavior of glass and carbon fibers is well known and is linearly elastic, and the creep of glass fiber is very small, so exploiting glass or carbon reinforcements is easy, and engineers handle the behavior. In conclusion, a precise characterization of SRPs and fibers is necessary to simulate and dimension parts, because often, the values given by the manufacturers and those published are different and the performance of the reinforcements is then not mastered [23]. As reinforcement is the fundamental element that affects the stiffness and breakage of the composite part, it is essential to perfectly know its mechanical characteristics. Moreover, understanding yarn behavior is a necessary step in predicting the response of fabrics within a matrix of the same nature.
In the current context which imposes the use of reusable lightweight composites, and following what has just been discussed, it seems interesting to make an inventory of the current state of knowledge on UHMWPE yarns given their future use in structures supporting significant mechanical loads. More precisely, the objective of this review is to bring together the different studies and conclusions, obtained on the analysis of the mechanical and thermal behavior of PE reinforcements.
In the first section, how remarkable properties can be obtained from basic PE and the associated processes are briefly described. Then, on a very fine scale, the representation of the molecular structure and its formation during the process are detailed. The different phases that can be distinguished are depicted. After explaining the main ways of testing UHMWPE reinforcements and the associated difficulties, an important, but non-exhaustive literature synthesis of the thermal and mechanical characterization results is proposed. Tensile, creep, and DMA (Dynamic Mechanical Analysis) performances are given at the macroscopic scale but are mostly related to morphological considerations at a smaller scale. The influence of time and temperature on its behavior is also examined.
2. Basic Principles of Property Enhancement
2.1. Outstanding Performance from a Basic Polymer
For applications exploiting SRP composites, if remarkable properties are desired, the reinforcement is only the component that takes up the load and ensures the mechanical performance of the part. To achieve superior properties from a basic polymer such as PE, it is necessary to orient and align the molecules (Figure 1a,b) [50]. By nature, all linear polymers can be solid and rigid due to the covalent bonds present. Concerning the optimum theoretical modulus achievable under ideal molecular alignment conditions, several values were proposed based on theoretical calculations and experiments on the calculation of crystallite stiffness [51,52]. Yeh et al. [53] suggested that for a perfect PE crystal, a modulus of 324 GPa is attainable. However, many fibers on the market have properties that are about two orders of magnitude lower than the theoretical maximum properties, which would then be achieved if all the molecules chains were perfectly aligned and extended. The difference between theoretical and actual resistance can mainly be attributed to the presence of structural irregularities and the widespread tendency for chains to slip [29].
In particular, the ultimate strength, not necessarily achievable, is governed by the rupture of the carbon-carbon bonds and can be calculated as follows [48]:
with the molecular cross-sectional area, which is 0.193. The value taken for the density is 0.96. To convert it to a more widely used unit, such as GPa, the following conversion must be made:
The theoretical resistance calculated in this way is just over 30 GPa. Song and Hu [54] proposed a method for predicting strength based on kinetic equations of bond breaks of over-stressed taut tie molecules (TTM) and/or trapped entanglements (TEC) present in the domain defined as the disordered domain. A correlation was finally obtained between tensile strength, primary molecular weight, process, test conditions, and durability. By extrapolating the molecular weight and draw ratio to infinity, the theoretical strength can then be estimated to be between 30 and 40 GPa. This theoretical resistance can also be predicted by an energy potential function, which describes the forces between atoms from the distance between them. However, the values of the theoretical resistance are very dependent on this function. Smook et al. [37] made a small synthesis of the functions that can be used for a good estimation, and the values obtained are between 19 and 25 GPa at room temperature and 66 GPa at 0 K.
2.2. Processes
Processes were then developed to be as close as possible to this theoretical maximum and numerous studies were carried out to highlight the key process and initial polymer parameters (such as molecular weight, for example) that impede the achievement of theoretical optimum performance. Depending on the intended application, it is then possible, when the process is well controlled and the influence of its parameters is well understood, to produce fibers with a suitable modulus or a good energy absorption capacity.
Numerous articles focused on the processes and their impact on the structure and properties of UHMWPE fibers used in the industry. Some reviews dealt with them [48,50,55] and others [56,57] provided a summary of the various processes for obtaining PE reinforcements with good mechanical performance. Only a brief presentation of these articles will be made.
Several families of processes are used and all of them consist of a high drawing. What differentiates them is the state of the material at the beginning of the process. Quite different technologies certainly result. The hot drawing consists of stretching an extrudate, made from a molten polymer. The drawing temperature must be higher than the crystalline dispersion temperature, otherwise, ultra-stretched reinforcements (i.e., with a ratio higher than 20) are not possible. Chains folded into lamellae can then be stretched. The zone drawing technique is close to the previous one, but the heating of the stretched reinforcement is done locally with a device that moves along the fiber. This avoids the bending of the extended chains and prevents as much as possible the degradation of the polymer. Peterlin [58] in his review was more interested in the molecular approach of drawing or extrusion. Barham and Keller [50] proposed in their review a chronological history of the process of gel drawing from a solution. The first to attempt to stretch polymers to maximize their performance was a group of researchers at the University of Leeds in the 1970s [59,60,61]. To create a frame of reference, Barham and Keller in their review [50] proposed a scale that relates the mechanical properties to the kind of stretching (Figure 2). This one provided an idea of the theoretical values that could be achieved, and the real performance obtained.
Solid-state extrusion is done from already formed billets, through a conical device at a temperature close to the melting temperature of the polymer. This process is often done in two stages. The first stage involves rapid drawing, has a ratio that does not exceed 7, and is called natural drawing. The second stage, or super-drawing, is done at a lower draw rate and controlled temperature.
Gel drawing appears to also be a promising process in the literature. Indeed, this technique makes it possible to align polymers such as PE quite easily by transforming a dilute gel entanglement network into a highly oriented crystalline structure. The prepared solution initially contains between 2 and 5 wt.% PE in the solvent [48,62]. These gels correspond to very disorganized networks. The drawing process can be divided into two parts: firstly, the preparation of a non-oriented gel filament and, secondly, the treatment of this filament to form a rigid and resistant highly oriented fiber.
Depending on the nature of the polymer to be stretched, not all techniques are feasible [24,63]. For example, melt drawing is complex when the polymer is highly viscous. Whereas this technique of drawing from a gel state is possible even for large molecular weights (greater than 4,000,000). Dessain et al. [24] explained in more detail the differences between gel and melt drawing. For a drawing from a gel solution, the control of the solvent extraction, as well as the recycling of the solvent, is important. The extraction is done either by heating or by solvent exchange, either upstream or at the same time as the drawing. The way the solvent is removed does not affect the behavior of hot-drawing films [64].
Finally, the last process that can be used is fibrillar crystal growth, which is developed for PE to form fibers with the widest possible chains. Fluid solutions consisting of between 0.1 and 0.5% wt.% of PE in the solvent are the source of crystal growth. Again, polymers with high initial molecular weights can be used [34]. The two main techniques used are solid-state extrusion and drawing from solution (gel or crystal growth) [29]. In their review, Barham and Keller [50] synthesized many works concerning the latter group of processes in a rather comprehensive manner. The two processes constituting this group have as a common denominator the dissolution of the polymer. This one is a good means of disentangling the polymer which will allow the very large deformation necessary during the drawing process to align and lengthen the chains, to produce solid and rigid fibers. Industrially speaking, continuous processes are preferred, and one or the other of the gel drawing techniques could then be suitable.
Processes deeply affect morphology. The endotherms resulting from DSC (Differential Scanning Calorimetry) tests differ depending on the process used to draw the UHMWPE fibers. Comparing different results obtained in the literature, Chodak [56] pointed out that for melt-spun fibers, a single endotherm is discernible, whereas, for gel-spun fibers, three peaks were observed [65,66].
In summary, different processes can be used to engender this fibrillar microstructure, and consequently, the generated microstructures can differ and lead to variable properties. In the following paragraph, the structure resulting from these processes is discussed according to the parameters inherent to each technology.
3. Molecular Structure
3.1. Microstructural Model
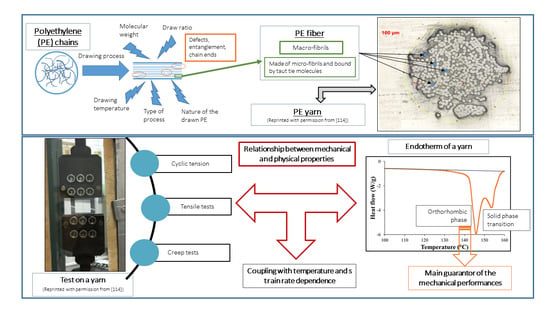
The specific performance induced during the drawing process is related to the modification of the morphology and, in particular, to specific configuration patterns of the carbon skeleton. The complex structural organization of macromolecules is partly responsible for the unique properties obtained. Several microstructural models are proposed for drawn polymers in the literature. These models are often generic, as suggested by the work of Taylor and Clark [67] who found a similar fibrillar structure in the case of PP filaments to those of the PE. In their attempt to describe mathematically the evolution of Young’s modulus in the fiber axis, Irvine and Smith [68] modeled the molecular chains of fibers using two elements. The helix elements are oriented in the draw axis while the coils are not oriented. Porter and Wang mentioned these models in one article [69]. In the same spirit, a microfibrillar model is proposed composed of a series of crystalline blocks with highly oriented and amorphous crystals. Peterlin [58] suggested one specific schematization to represent such a structure. He describes the fibers as a bundle of fibrils that are oriented along the axis of the fiber. Each of these fibrils is composed of bundles of microfibrils that are parallel to the axis of the fibrils. The latter are made up of chains folded in the crystalline parts. The individual crystalline parts are bonded together with taut tie molecules. These bonds occur both between the microfibrils and adjacent fibrils and within each of the microfibrils (Figure 3a).
It is then possible to deduce that the resumption of tensile stress in fiber with such a structure is due to the taut tie molecules, which act as connectors. The processes listed above aim to maximize the number of taut tie molecules while reducing the number of folded chains in the crystalline parts. This maximization of taut tie molecules is done during the super-drawing step. The greater the crystallization rate and molecular weight, the greater the number of taut tie molecules. They play on the tenacity but also on the ease of being plastically deformed. However, as they create bonds between the microfibrils, they limit the achievable draw ratio for the microfibrils in the cold drawing process [70]. In the super-drawing process that follows drawing at a lower ratio, the natural draw ratio, two mechanisms compete: the unfolding of the chains to form additional taut tie molecules and the shear displacement of the microfibrils relative to each other [67]. While the former promotes the continuity of the covalent bonds, the latter allows the draw ratio to be increased without greatly altering the structure of the microfibrils. The predominance of one process over the other depends on several factors such as temperature and speed during the super-drawing stage. The low lateral consistency of the strong segments of the chains offers great potential for low-temperature processing and is an essential condition for rubber elastic and viscoelastic behavior [29]. On a smaller scale, NMR analyses have highlighted the presence of fibrillar crystals. These crystals are composed of both crystalline and non-crystalline material in series [71,72,73].
On a higher scale, to represent the microstructure of a macro fibril, two types of models seem to be mainly suggested (Figure 4a) according to Berger et al. [29]. In the first, it is indicated that microfibrils, composed of very extensive crystalline chains, form macro fibrils. In a continuous crystalline model authors [64,67,69,74] suggested for a super drawing process, macro fibrils are assumed to consist of a more or less continuous crystalline phase with some scattered defects. The movement of the defects allows the deployment of the folded chains within a microfibril; this movement can only be generated at an optimal temperature [75]. The range of drawing speed is restricted because if the drawing is done at a speed higher than that which allows for possible defectsmovement, the sample will break. The final structure sought is a continuous crystal structure (Figure 3b). In this model, it seems that the discontinuities between neighboring microfibrils have been depreciated by their coalescence. This could be explained by the arrangement of the taut tie molecules between the fibrils.
Clark and Scott [74] pointed out the need to propose four different models which they have simplified—for ease of understanding, the amorphous part is not shown. The first model shows the “row” lamellar structure, in the case of hard elastic fibers [76,77] (Figure 4(bA)). The second model is the one Peterlin worked on (Figure 4(bB)). The third is a more continuous structure with folded chains that are defects [74] (Figure 4(bC)). The last model with extended chains can be observed when polymerization is induced by radiation from single crystals [78] or within the central region of a polymer as it is extruded under certain conditions. Indeed, it undergoes high pressure and shear in the pressure capillary viscometer [79,80,81] (Figure 4(bD)).
A description of a drawn macro fibril as a series of large crystal blocks interspersed with smaller, more disordered areas was put forward and taken up by several authors [28,38,57,64,82]. This representation is shown in Figure 4c. These messier areas include entanglements and other defects such as chain ends and twists. The strength is thus attributed to the taut tie molecules in the disordered domain and the crystalline fraction that spreads the load. The elongation of the fiber at break is established by the elongation at break of the disordered domains but also of the crystal blocks. Finally, the tensile modulus can be defined as the ratio between the length of the crystal block and the disordered domains as well as the fraction of taut tie molecules [38]. As a result of experimental considerations, regions with defects are added to a model that includes extended chains and crystal regions in series [29]. The intensity of the charge transfer between the microfibrils is perceived in different ways. On the condition that the cohesion within them is more important than the lateral interactions between them, they act as structural entities. Gibson et al. [83] suggested a crystalline tie model that accounts for this. Berger et al. [29] provided an interesting schematic (Figure 4c) of the structural elements of a fibril where crystalline regions with stretched chains are connected by non-crystalline segments. The charge is then transmitted by shear at the interface between the blocks and thus probably not to adjacent crystals [84,85]. During the drawing step, crystalline perfection increases with the draw ratio and small, unstable fibrils break and reorganize. The structures’ diameters homogenize, to allow uniform load distribution across the diameter [27].
As explained in the previous section, the gel drawing process, for example, consists of several steps that complicate its morphological structure. Analysis of the nanostructure of commercial fibers, using WAXS (Wide-Angle X-ray Scattering) and AFM (Atomic Force Microscope) [27] or dark-field electron microscopy, allows the quantification of the size of the characteristic elements. Thus, for fibers with an effective diameter of 25 to 40 µm, the macro fibrils measure between 100 nm and 3 µm, and the microfibrils constituting them measure between 8 nm and 100 nm [27]. The bundles they form are of the order of a hundred nanometers and a few micrometers wide. According to Peterlin [70], the closely aligned microfibrils measure a few hundred angstroms in width and several tens of microns in length for a cold-drawn polyethylene. For gel-drawn fibers with a diameter of 55 µm, the diameter of the macro fibrils is estimated to be 0.5 µm [37,57]. The diameter of the constituent microfibrils is estimated to be between 15 and 20 nm. As the draw ratio increases, the width distribution of these structures is narrower, according to NMR analyses [27]. On the surface of the fiber, epitaxial patterns are visible (Figure 5). These are ordered structures that appear perpendicular to the fiber and extend across several microfiber widths. They are on the order of tenths to hundredths of a nanometer. These structures thicken when annealed at a temperature above 120 °C. The patterns begin to grow from lamellae of folded chains that then nucleate on the microfibrils. These epitaxial crystals can only form if there are sufficient voids to grow. Thus, these patterns do not appear in the case of post-drawn fiber because the stretching and melting have consolidated the voids between the filaments. Using WAXS analysis and dark-field electron microscopy [86], gel-drawn fiber crystal blocks were measured and estimated to be at least 70 nm long and 20 nm wide, exactly the diameter of the microfibrils according to the authors. The more disordered domain that intersects the crystal blocks is estimated at 4 nm.
3.2. Structure Formation during the Process
The PE initially used for processing has a crystalline part and an amorphous part in which lamellae are randomly dispersed. The space between the spherulites is less organized than in the crystalline part. Short lamellae are taken from the amorphous part of the material (Figure 6a). When the PE is drawn, the spherulites originally present will align in the stretching axis. Li and Lee [87] described in detail the evolution of morphology during the die drawing process, solid-state extrusion from a billet. From the beginning of the drawing process, these structures become more aligned in the direction of the drawing. The lamellae between them grow and are more numerous, due to the recrystallization induced by the deformation during drawing. Small oriented spherulites also emerge between the large ones. If the drawing process carries on, these structures change in shape and become ordered in rows in the direction of the stretching axis. This arrangement is constrained by the melting of the short lamellae, which are located around the spherulites, under the thermal effect of the extrusion process. The spherulites are smaller and aligned. The lamellae become thinner and longer. Kawai et al. [88] also pointed this out for drawing from the molten state, noting a melting temperature that increases with the drawing of the polymer, so cooling must be greater, and the lamellae are thinner. The stack of lamellae is due to intramolecular nucleation within the same molecule from segments that have been brought together. The nuclei grow along the molecular chain and agglomerate into a bundle. These formed are then able to orient themselves in the direction of the molecular orientation. A second crystallization takes place. This is the crystallization of the taut tie molecules that grow laterally between the adjacent lamellae.
If a draw ratio of 7 is reached (Figure 6b), complete spherulites are few and the ordered rows disappear [87]. This results in a sample that becomes transparent due to the reduction in the size of the crystalline phase. Only predominantly oriented lamellae persist and some merge. The lamellae are more oriented, thinner, and longer than in the initial plot. Beyond a draw ratio of 12.6 (Figure 7), the lamellae undergo plastic strain allowing the appearance of microfibrils [87]. Some of them retain small waves that tend to disappear further down the die. Thus, thanks to the recrystallization induced by the strain during drawing, local melting, and plastic strain of the lamellae, fibrils can then be formed. During crystallization, the disordered chains thus change their structure to adopt a regular conformation in the crystalline phase [30].
Peterlin [70] also proposed a model to describe the deformation process in the cold drawing process. He considered three steps to form the microfibrils of the oriented material, which are:
- The continuous plastic deformation of the spherulites before necking, which occurs in the entire sample at approximately the same low stress;
- The transformation of the spherulites into fibrils, which he attributes to the breaking of the small crystal blocks that are present in the lamella packs, the reorientation, and rearrangement into stacks. This discontinuous transformation of the spherulitic into fiber structure is done by micro-necking. Indeed, the formation of bundles of microfibrils is encouraged by the cracking of the folded chain lamellae and by the presence of many micro-necks at the crack;
- The plastic deformation of these fibrils after the neck. The sliding of the microfibrils relative to each other stretches the taut tie molecules. The chain sections by which these molecules are attached to the crystalline blocks can then unfold. The density, crystallinity, and draw resistance then increase. The strain-hardening process then continues until breakage.
Thus, the mechanism underlying the deformation is defined. It is associated with the phase transformation, the twinning, the inclination of the chain, and its sliding. This leads to the complete breakage of the initial crystals into smaller blocks which are incorporated into the stretched fibrils [89]. It is the tilting and sliding of the chains that allow the very large crystal deformation. The latter takes advantage of the presence of linear defects and makes possible the formation of fibrils which are strongly aligned macromolecular chains that are extracted from the strongly inclined crystalline lattice [90]. The molecular model suggested by Peterlin [70] to represent plastic deformation can also be applied to polypropylene.
According to this representation into three steps of the deformation process for a cold-drawn specimen, the natural draw ratio thus corresponds to the draw ratio of the microneckage process. The model described can be applied to the hot drawing process but with some reservations. Indeed, the addition of temperature during the process leads to the random distribution of the destruction zones, a decrease of the tie molecules, a healing of the crystalline defects, and more mobile chains. Consequently, no yield strength is present. Li and Lee [87] did not observe the plastic strain of spherulites. During solid-state extrusion drawing, the spherulitic structure initially present in the amorphous phase was transformed into a final structure composed of coalesced microfibrils separated by the amorphous phase.
As a reminder, the c axis is parallel to the macromolecular chain. The a and b axes, on the other hand, are arranged in directions transverse to the chains. Concerning the orientation of the molecular chains with the drawing process, Peterlin [89] noticed, using wide-angle X-ray diagrams, that the displacement of the a and b axis with the drawing direction and the orientation of the c axis are progressive in this direction. A small-angle scattering analysis allows the suppression of the lamellae perpendicular to the drawing axis to be observed. The strong inclination of the lamellae facilitates the sliding of the chains. Judge and Stein [91] were more specifically interested in the growth of crystals according to the draw ratio (Figure 8a,b) for a melt-state process. In the case of a high draw ratio, the crystals will grow with a c-axis in the direction of elongation to form crystallite bundles while for a lower draw ratio they assumed a growth mode with the a-axis parallel to the draw axis to allow the formation of lamellae.
In the case of drawing from solution, chains crystallize by the formation of lamellae, within which the chains are folded [50]. For stationary solutions, the precipitation of the crystals takes place during cooling. The platelets then remain in suspension and have a folded configuration (Figure 9a). Another mode of crystallization is possible for flowing solutions. It is induced by chain stretching and this is done by stirring the solution [92]. The solution must be stirred at a sufficiently high temperature so that the folded crystals that usually form do not appear. The crystals may, however, precipitate on the stirrer in the form of fibrous networks. The fibrous structure is characterized by a platelet-fiber assembly also called shish-kebab. This type of crystallization is facilitated by high molecular weights. The third mode of crystallization highlighted leads to the formation of gels. These are swollen networks in which junctions are formed between crystalline regions. These junctions can take several forms: platelet chains, fibrous crystals (shish-kebab), or tiny micelles (Figure 9b) [50]. Again, gelling crystallization is aided by high molecular weights but also by the concentration of the initial solution. In both lamellar single crystal and gel crystallization, the chains are neither extended nor oriented. This alignment step is necessary to obtain fibers with good performance. Monocrystalline mats, characterized by suspended platelets, are composed of separate lamellar entities but with high cohesion between the different layers. It is then possible to stretch them.
3.3. Particular Structure of Shish-Kebab
The characteristic shish-kebab structure of the microfibrils generated during drawing is important to emphasize and explain. The shish structures are represented as extended chains while the kebab structures are associated with crystalline platelets of lamellae (Figure 10). During stretching, the lamellae are elongated and then merge with the extended chains. Li and Lee [87] did not observe this structure in the case of solid-state extrusion drawing of slugs, either because of limitations in the microscopic equipment or because the microfibrils are a continuous crystalline phase, formed by strain-induced recrystallization during drawing. These extended chain morphologies are dependent on the gel drawing process parameters, such as temperature and the draw ratio achieved [27]. Thus, over a certain temperature range, above the crystallization temperature of the single crystals, the formation of aggregates of shish-kebab structures can be obtained on the stirrer during drawing from an S solution [92]. These particular structures can only occur when vortices are generated during stirring. As explained upstream, a high molecular weight facilitates crystallization into fibrous structures. Indeed, agitation that lengthens chains is more efficient on long molecules [93]. Chains that are shorter than a certain length, and this for a given agitation speed, cannot be stretched in shish and then lead to the creation of platelets, in the form of folded lamellae—part of the structure called kebab. To optimize the performance of the fibers used, it is interesting to minimize the formation of these platelets. This can be achieved by filtration at stirring temperature, as platelets are more soluble than shish structures. Shish structures are never perfectly smooth [94,95] and are also in themselves shish-kebab structures. A distinction between structures with removable (macro shish-kebab) and permanent platelets with a strong molecular connection (micro shish-kebab) can be made.
The cooling type as well as the length of time the material remains at the maximum temperature affects the size and spaces in the structure [97]. These latter characteristic parameters of the platelets can also be influenced after their development by storage at a given temperature below the initial fiber formation temperature. The formed fibers are “hairy” with loose hairs that are pendulous and capable of crystallizing into chains under the influence of cooling conditions. The hairs can metamorphose into platelets consisting of folded chains or smooth fibers [97]. A particular elongation flow in the case of drawing from a solution creates the conditions for the continuous growth of the fibers, which is necessary to produce shish-kebab structures. These conditions are not necessarily met in the case of traditional spinning where the draw ratios are not very high.
Thus, two mechanisms can lead to the formation of high-performance fibers. The “free growth” method [86], the surface growth method, and wet gel drawing under agitation [98] meet the practical requirements of continuous production of a parallel assembly of shish-kebabs at high temperatures such that single crystals cannot form or survive. The second mechanism is the large-scale deformation of single crystals. This mechanism can occur during the drawing of all gels in which single crystals have been able to grow.
These structures appear to be strongly related to the performance of the fibers used (Figure 11) [99]. The process conditions and the characteristics of the initial polymer allowing their development must therefore be known and analyzed. The influence of the conditions and these characteristics will be detailed later in a paragraph.
3.4. Morphology Study and Polymorphism
Fiber morphology depends on the initial material (chain length, entanglements, and crystal morphology) and the drawing process, from solution or solid-state extrusion. Song and Hu [54] considered that fibers were made up of four elements, the stretched chains, the folded crystallites, the taut tie molecules, and the entangled and trapped chains. The fractions of the first two can be obtained by DSC analyses as they correspond to the fibrillar and lamellar morphology, respectively. The crystallinity is then calculated as the sum of the lamellar and fibrillar fractions. At room temperature, UHMWPE fibers consist of three phases: a crystalline phase, an amorphous phase, and a moderately oriented phase [22,100]. The latter consists of moving chains that have a preferred direction but not periodically. The mechanical properties are dominated by crystalline and moderately oriented phases. As an indication, the degree of fiber crystallinity for Dyneema® SK60 fibers is reported to be 71% [29] and 82% for Spectra® 1000 [28]. The main crystalline phases present are an orthorhombic phase, at 85%, and a monoclinic phase, at 15%, often present on the fiber skin for these same fibers. The amorphous phase represents less than 5% [101]. It includes conformation irregularities, taut tie molecules, and defects of the crystalline phases. The rest is made up of crystalline segments, entanglements, and folds. Similarly, but for non-commercial gel-drawn fibers, the signal associated with NMR with the amorphous phase is very weak [102], as revealed by the WAXS [34] and HTWAXD (High-Temperature Wide-Angle X-ray Diffraction) [28] analyses. The main NMR signal is associated with the orthorhombic crystalline phase. The monoclinic phase corresponds to a weaker signal. Mc Daniel et al. [27] estimated this phase to be less than 4% by WAXD. These last two phases are transformed into each other by a simple change of side chains, which are perpendicular to an orthorhombic phase and parallel in the other case. A model representing the transformation mechanism was proposed [103]. The boundary between the monoclinic and orthorhombic phases is defined by a plane parallel to the monoclinic plane (010) and the orthorhombic plane (110). A reorientation of the molecules in the monoclinic plane (010) occurs around the molecular axis and these molecules are transformed into molecules in the orthorhombic plane (110). Besides, an oriented amorphous phase was observed [27]. In this phase, the conformations of the polymer chains are trans zigzag. However, their lateral package is not the same as in a crystal.
The fusion of the fiber center begins in defects due to chain ends, bent or trapped entanglements, among others. The main orthorhombic structure melts and then transforms into a pseudo-hexagonal structure that melts at higher temperatures. The melting of the molecules crystals thus occurs in two stages: a transition and the melting or formation of dislocations which is comparable to the melting of atomic crystals and which gives rise to minor changes in the chain conformation. This last hexagonal phase is generated by the fusion of the orthorhombic phase under stress. The characteristics of the hexagonal phase have been approximated by X-ray and FTIR (Fourier Transform InfraRed) analysis [30]. It then appears that this phase is composed of parallel bundles of molecules of disordered conformation. Within these packets, trans-gauche isomers are randomly distributed. The average orientation of the molecular chains is rather preserved except near the melting temperature. The transformation of the orthorhombic phase into a hexagonal or pseudo-hexagonal phase is only possible when the expansion of the unit cell in direction a is √3 times greater than the expansion in direction b, according to WAXD analysis [28]. Orthorhombic cells grow linearly with temperature [26]. The total volume of the gel-drawn fibers increases non-linearly and deviates from the volume expansion of the orthorhombic cells. This is less visible for less crystallized reinforcements. Concerning the monoclinic phase present in the fiber sheath, Ratner et al. [22] noted a peak at 135 °C for Dyneema® fibers. Crystalline lamellae melt and this melting is followed by that of thicker lamellae. Sometimes this peak may be hidden under the larger peak associated with the melting of the orthorhombic phase. This monoclinic phase can still be detected by WAXS analyses [100]. A monoclinic peak was also noticed by Hsieh and Hu [28] through WAXD studies of Spectra® fibers.
Several endotherms are thus identified during the DSC analysis of UHMWPE fibers. They were associated with different phases. Attached Table A1 summarizes the different melting temperatures observed according to various parameters such as the type of fibers, whether they are stressed or not, the heating rate and the mass of the sample as well as the molecular weight when they are known. All these parameters have an impact on the position and size of the peaks.
Peak values of the endotherms are strongly related to the heating rate in the DSC tests [34,86]. Hellmuth and Wunderlich [104] studied the time dependence of the melting of the different crystals that form polyethylene. As the heating rate increases, the melting temperature of extended chains increases while that of the lamellar crystals decreases. In DSC, the tested fiber length in the capsule also impacts the peaks observed [86], as well as the fixed elongation of the sample and the crystallization temperature [105].
The drawing process plays a role in the morphology obtained. Smook and Pennings [57] noted a single discernible peak for undrawn fibers at around 137 °C, which then disappears in favor of two peaks at higher temperatures after drawing. The proportions of these two peaks, sometimes three, are modified according to the draw ratio. The peaks are associated with transitions and fusions of the orthorhombic, hexagonal, or pseudo-hexagonal phases. Comparing different results from the literature, the presence of these peaks is also a function of the process used [56]. Indeed, the endotherms of melt-spun and gel-spun fibers show differences. For the first process, a single peak even after drawing is visible [65], whereas more peaks can be observed in the second case [65,66]. However, Dijkstra et al. [39], only got one main endotherm for constrained gel-spun hot-drawn fibers.
The crystallinity and orientation of the crystals increases in the samples at increasing draw ratios in the range of 20 to 40 (Figure 12a) which has an impact on the mechanical properties [44]. Folded chains in kebab crystals appear to convert to shish shape with a more pronounced alignment and orientation. Above a ratio of 20, only shish crystals are visible. For ratios in the range of 40 to 150, monoclinic crystals grow gradually to replace orthorhombic crystals. Better thermal stability is therefore distinguishable with high draw ratios [61]. Tenacity and modulus are influenced by the draw ratio and this is the consequence of a change in morphology. The influence of process conditions on mechanical behavior will be further detailed in the following section. More precisely, Capaccio and Ward [59] and Yeh et al. [44,53] noted that the main peak observed in DSC testing of UHMWPE films shifts to higher temperatures as the draw ratio increases (Figure 12b). A second endotherm appears around 148 °C, and it becomes more important and observable for ratios above 20 [44]. A similar observation was made by Capaccio and Ward [59]. It is associated with the transition of orthorhombic crystals which are the main guarantors of the remarkable properties of UHMWPE reinforcements into hexagonal or pseudo-hexagonal crystal phase. With an increasing draw ratio, these two peaks are practically not shifted for all that. The melting of monoclinic crystals is not discernible because the larger peak of the melting of orthorhombic crystals is superimposed on it. As the draw ratio increases, some molecules initially present in the amorphous phase have probably crystallized under stress and transformed into orthorhombic oriented crystals, which impacts mechanical properties.
The polymorphism of the PE fibers shows up well in DSC analyses. The presence and proportion of a given phase, influenced by process parameters such as the draw ratio or the initial characteristics of the polymer used, has an impact on the mechanical properties of the fibers. This effect will be further developed in a future section. However, to fully understand the structure/properties relationship, it is necessary to know the geometry and spatial distribution at the meso/nanoscale because the basis of the performance of these fibers derives from the meso-nanostructural components. The optimization of the processing, chain alignment, and the formation of structures such as shish-kebabs, but also of the material to be used initially, makes it possible to obtain fibers with interesting mechanical and thermal properties for the use of UHMWPE fibers as reinforcements in composites on structural parts.
In brief, the various drawing processes presented in the previous section make it possible to obtain fibers whose mechanical performance is of interest with different microstructures or phases. Drawing from a gel solution is efficient to generate a good microstructure and the history of the temperature conditions defines the final properties. More precisely, the influence of the orthorhombic phase, predominant over the other crystalline phases, contributes mainly to the mechanical properties [100]. According to the authors, the melting of this phase, which prevails at room temperature, takes place between 141 and 146 °C (see the section on the morphology study), limiting the use of these fibers for certain fields of application. However, the characteristic orthorhombic-hexagonal phase transition that follows the melting endotherm can be detrimental to the performance of the fibers and thus sets an upper limit on the use of the fibers in terms of temperature [106].
3.5. Consequence of a Stress on the Fiber Morphology
Constraining the fibers could be a means of increasing this limiting melting temperature. It seems that pressure increases the melting temperature and the onset of recrystallization. Indeed, several authors have analyzed the effect of hydrostatic pressure on phase transitions and the morphology of PE [86,106] in particular. More precisely, phase transition behavior is more or less affected by the history of the sample, depending on the setup and the way the sample is constrained. Thus, endotherms resulting from calorimetric tests are sensitive to the stress distribution in the sample. Also, they differ depending on whether or not the fiber, obtained from a gel, is stressed during the test. Tsubakihara et al. [66] noted for the unconstrained sample a large pic around 143–144 °C (Figure 13a). It is related to the melting of extended chains under their unconstrained state. Whereas with the addition of a constraint, three peaks are observable: a small one at 143 °C, and two others at 155 and 159 °C, and it shows up more or less markedly with the molecular weight of the sample. So, constraining the specimen inhibits this melting process (Figure 13a), and Kwon et al. [100] observed the same trends. This small peak is seen because of the melting of the stress-free taut tie molecules [66]. Complementary X-ray analyses have been performed, and they allow one to affirm that this peak at 155 °C is associated with the transition from the orthorhombic phase to the hexagonal phase. These two phases coexist between the second and third peaks. The temperature range over which they are both present depends on the molecular weight of the sample (Figure 13a). The main endotherm is shifted by 10 to 15 K with the addition of stress [66]. A brief thermal contraction and breakage of the sample are noticeable when the hexagonal phase melts. The hexagonal phase has a thermodynamic origin. As described briefly in a previous section, the heating rate influences also the calorimetric results. A decrease in the area of the transition and melting peaks of the hexagonal phase is especially noticeable. And the shift due to the overheating phenomenon, between heating rates of 0.3 and 5 K/min, is only 2 K [66].
Also, crystallization at elevated pressure and temperature influences the morphology of the folded chains. At very high pressure, extended chain crystals can even be formed. Using X-ray diffraction analysis at the synchrotron, Rein et al. [31] estimated that the melting temperature increased by 35.2 °C every kilobar. For example, at 100 bars, the reflections of the monoclinic (100) and orthorhombic (110 and 200) phases are visible at 100 °C. The monoclinic phase disappears at 177 °C and the hexagonal phase (100) appears at 179 °C. At 209 °C, the orthorhombic phase is no longer present, but traces of the hexagonal phase remain up to 250 °C. At 260 °C, the sample is fully amorphous. According to Figure 13b, stress can therefore stabilize the fibers against melting and thus increase the previously restricted application interval of the fibers since the orthorhombic to hexagonal transition occurs at higher temperatures as soon as pressure is applied [31]. However, other authors do not observe changes in the endotherms obtained for lateral pressures of several kilobars in DSC [107]. The melting process of constrained fibers can be described throughout a free energy diagram [66].
Even at low pressure, the hexagonal phase is observed during melting and recrystallization. Torfs and his colleague [41] measured a difference of 4 °C in the phase transition temperature when a stress of 0.8 GPa was applied. This difference is due to stress relaxation. It is a metastable phase over a certain temperature range, which is pressure-dependent. Only the complete melting of this phase is highly dependent on pressure. This metastable characteristic allows sufficient mobility for the melting of the fibers without causing a great loss of orientation of the extended chains. An intermediate hexagonal phase appears predominantly on the surface of the fibers. In the case of the use of UHMWPE fibers in SRPE composites, this phase promotes good fiber bonding while preserving the core-orientated fiber structure when a hot-compaction process is used [9]. In the case of compression-stressed fibers, Ratner et al. [22] observed a double peak, the first at 145 °C associated with the transition from the orthorhombic to the hexagonal phase and then the melting of the hexagonal phase at 159 °C. WAXS analyses [34] also highlighted the significant increase in dimensions (200) and (110) of the majority orthorhombic structure of Spectra® fibers when compressed in the direction perpendicular to the fiber axis. These analyses also showed an increase in monoclinic forms, probably a part of the amorphous, which reduced the degree of transition into the hexagonal phase. Thus, the formation of a monoclinic shape prevents the structural transformation characteristic of UHMWPE fibers [28]. The stresses in the sample that prevent the molecules from reaching perfect isotropy may explain these shifts [100]. An additional peak around 138 °C also appears, associated with the melting of the folded chains obtained by recrystallization, if the temperature during processing is excessive [22]. A triple endotherm is also sometimes reported [86], with an additional triclinic phase. In similar analyses, Kwon et al. [100] on Spectra® fibers noted two peaks at 142 and 149 °C and Van Aerle and Lemstra [106] at 153 °C and 176 °C for stressed fibers and that all fibers remain generally orthorhombic until the main melting. They pointed out, however, that a quantity of orthorhombic fibrillar crystals transformed into the hexagonal phase, as did Clough [105,108] around 177 °C. This occurs only in stressed fibers, which implies that this hexagonal phase is a phase that is not initially present in the original fiber. It is thereby an out-of-equilibrium phase. Similarly, for Hsieh and Hu [28], axial stress with heating to 110 °C may explain the structural transformation between an orthorhombic and a pseudo-hexagonal phase.
The impact of the duration of the lateral stress was studied [34], and it is presented in Figure 13c. The longer the duration, the more the enthalpy is reduced, up to 2 min for which the enthalpy stabilizes but then the second peak tends to disappear. The transformation into the hexagonal phase then seems no longer allowed. The widening of the peak suggests a decrease in the size of the original crystals.
Tsubakihara et al. [66] concluded that there is little influence of sample types and constrained methods. Therefore, a significant increase in the transition point cannot be expected. A chemical method could be more hard-hitting. Indeed, in the case where PE is cross-linked and compressed [22], a shift in these endotherms can be seen in Figure 14a, which was supported by Yeh et al. [44]. An additional endotherm was reported by Clough [105,108] around 150 °C for slightly cross-linked, stress-crystallized PE. The characteristic transition of linear PE is also less pronounced even if the material is just irradiated [109,110].
3.6. Effect of Sample Mass
Besides, associated with a phase transition and a process to make the fiber anisotropic, the two peaks considered can also be related to the fusion of lamellae of two different thicknesses [35,100] or the excessive growth of lamellae [86]. The different peaks are influenced by the mass effects of the test samples, and by the arrangement in the capsule and thermal conductivity. For very low fiber masses in the capsule (between 25 µg and 1.15 mg), the highest peak disappears [100]. It is then suggested that the double peak is caused by higher lateral stress when a higher mass is introduced into the constant volume of the capsule. If these stresses are removed, the highest peak in temperature is no longer present [35] (Figure 14b). Kwon et al. [100] did the same experiments and a double peak is observed for each mass. Only the ratio of sizes of the two endotherms is affected by the sample mass. Boller and Wunderlich [35] noted the broadening of the melting peak and the development of a bump that turns into a secondary peak as soon as the sample mass increases, as can be seen in Figure 14b. The enthalpy of fusion also decreases with the mass of the sample. They even attribute the multiple peaks to an artifact due to the conditioning of the sample in the capsule, such as the non-uniform positioning of the sample in the capsule, or the instrumentation. One suggested solution is to decrease the mass of the sample or improve thermal conductivity. A change in experimental conditions seems to induce the disappearance of the double peak. As soon as the fiber is well placed at the bottom of the capsule or when the capsule is filled with alumina powder, a single peak persists. This corroborates the artifact theory of Boller and Wunderlich [35] for the double peak. Fibers hanging in the capsule may also lead to aberrations in the DSC results. The sample preparation then appears to be a decisive step. The mass of the sample should not be too large, but the very thin fiber should be in sufficient quantity to ensure a good heat transfer with the capsule. A single peak was also observed by Rudnik and Dobkowski [49] in the case of the study of a UHMWPE powder and the peak value increased with the mass of the tested sample.
3.7. Consequence of Annealing on the Fiber Morphology
Since the unique structure of UHMWPE fibers is temperature-controlled during the process, the effect of annealing on the morphology needs to be analyzed. Fouad et al. [15] highlighted the effect of heat treatments on the degree of crystallinity upstream of calorimetric and micro-hardness tests. The influence of the temperature of this annealing and the duration is studied. It seems then that for annealing at 50, 80, and 100 °C between 2 and 4 h, the degree of crystallinity increases with the temperature and the duration of the annealing. It rises from 55% for a virgin sample to 67% crystallinity for a sample maintained 4 h at 100 °C before testing. For annealing temperatures between 115 and 130 °C [27], with 15 min of temperature stabilization after 3 min of rising, the effect of annealing is congruent with the annealing of crystals of lamellae consisting of folded chains. Indeed, a shift in thickness distributions is observed for each annealing temperature with larger changes at 130 °C.
Higher annealing temperatures were analyzed by Hsieh and Ju [34] at 120, 140, 144, 150, and 155 °C for ten minutes (Figure 15). Annealing at 120 °C does not seem to have any effect since this temperature is lower than the melting temperature of the less stable phase. Small endotherms appear for annealing between 140 and 144 °C, close to these temperatures. For this temperature range, the relaxation of the inter-crystalline chains is then allowed. For annealing at 150 °C, the double endotherm separates. The reduction of stresses in the fibrils and between the crystals by annealing can explain the reduction of the heat of fusion for annealing between 141 and 151 °C, melting temperatures associated with the melting of crystals between the fibrils, and orthorhombic crystals. At 155 °C, endothermic peaks and enthalpies decrease further as the deformed chains have relaxed and the orthorhombic crystals have almost completely melted, preventing possible recrystallization. As the annealing temperature increases, the total heat enthalpy and the size of the main endotherm decreases [28]. The structural transformation between the orthorhombic and pseudo-hexagonal phases then seems to be reduced. With increasing temperatures, the thermal expansion coefficients increase in directions a and b, directions transverse to the direction of the macromolecular chains. If the coefficient of thermal expansion becomes substantial, the transformation of orthorhombic crystals into the pseudo-hexagonal phase is facilitated. The annealing caused by the extended annealing time and the holding time in a HTWAXD test prevents phases transition. When heating is accompanied by tension along the axis, in the case of HTWAXD tests, this leads to the increased structural transformation between the orthorhombic and monoclinic forms [28]. Based on X-ray diffraction measurements taken during annealing at 80 °C for 30 min, the reflection of the monoclinic phase loses intensity in favor of the orthorhombic phase. Thus, a monoclinic-to-orthorhombic phase transition takes place and the transformation rate increases with increasing annealing temperature [103]. As a reminder, the monoclinic phase prevents the characteristic structural transformation of UHMWPE fibers between orthorhombic and hexagonal. The transition from the orthorhombic to the hexagonal phase can be achieved not only by stress but also by heating under hydrostatic pressure [106].
For some authors, the apparent PE polymorphism is due to an artifact during sample preparation. The highlighted phase transitions may be affected by sample preparation and experimental conditions, even if it is originally the same fiber. Indeed, when a weak constraint is applied, and this will be the case as soon as these fibers are used as reinforcements in composites, the formation of a hexagonal phase, out-of-equilibrium, seems inevitable. This stress may be the consequence, not necessarily desired, of a too-large mass of fibers introduced into a capsule during a calorimetric test. The greater the stress, the more the phase transition takes place at high temperatures. Therefore, stress could allow the fibers to be thermally stabilized over a longer temperature range. This stabilization can also be achieved chemically (cross-linking by irradiation), by reducing the free volume (stress in DSC capsules), by adding hydrostatic pressure or annealing, within a given temperature range, or a combination of these factors. Embedding in a matrix could be a means of preventing the fibers’ relaxation and thus allowing the fibers to be used at temperatures above 155 °C, although the orthorhombic to hexagonal transition is an intrinsic property of the fibers, a property which is reversible in the configuration of embedded in a matrix [106]. If the phase transitions appear identical by X-ray diffraction [31] with and without the addition of epoxy resin, impregnation of the fibers may however allow a more uniform distribution of pressure on the sample to further stabilize them thermally.
3.8. Physical Properties: An Overview
A variety of processes exists for the manufacture of fibers from PE. The main ones are as follows: hot drawing and zone drawing techniques made from a molten polymer, solid-state extrusion from a billet, gel drawing, and the fibrillar crystal growth from a solution. They align the chains of molecules that are initially disoriented and thus allow the theoretical maximum of PE properties to be approached. In particular, drawing from the gel state seems to be promising but the preference of one process over another depends on several parameters and in particular on the viscosity and molecular weight of the PE, whereas hot drawing is very complex for high molecular weights. The microstructures obtained then vary according to the process used. A fibrillar structure is put forward for the different processes. Depending on the processes used from molten polymers, the drawing ratios achieved, and the molecular weight of the grade, the plastic strain of the spherulites, and their transformation into fibrils took place to a greater or lesser extent. In the case of extraction from a solution, the chains crystallize through the formation of lamellae, within which the chains are folded. In the case of gel-spun fibers or fibers processed by the surface growth method, the microfibrils described have a particular structure called shish-kebab. To describe the microstructure, several models have been suggested. Some models are based on helix and coil elements to represent the parts that are oriented during the drawing process and those that remain disoriented. Other models are based on the representation of bundled fibrils oriented in the direction of the fiber. On a smaller scale, these fibrils (macro fibrils) are made up of microfibrils, composed of chains folded in the crystalline parts. The latter is bound by taut tie molecules and also binds the microfibrils and fibrils together. Another category of models proposes the representation of macro fibrils as a continuous crystalline phase with defects. A lamellar row structure is also suggested. Defects, which can take the form of entanglements, chain ends, or twists, are created during the PE orientation process and have an impact on the draw ratio that can be achieved and thus have a direct influence on the mechanical properties. At low temperatures, entanglements are considered to be the weak bonds of the fibers. Also, process conditions such as drawing rate, gelation conditions, and the initial concentration of the oriented polymer, among others, have an impact on the number of entanglements. However, they seem to be reduced when a process of drawing from a gel solution is used, compared to, for example, a melt crystallization process.
The fibers are polymorphic and the main phases are monoclinic, orthorhombic, and pseudo-hexagonal. The process parameters used affect the presence of these phases and their proportion. The draw ratio affects the thermal stability of the fibers. Indeed, the main peak observed in DSC shifts to higher temperatures for higher draw ratios. One explanation may be the crystallization under the stress of molecules present in the amorphous part during the drawing process. Besides, the initial characteristics of the drawn PE grade have an influence. The temperature range in which the transition takes place and thus that the orthorhombic and hexagonal phases coexist depends on the molecular weight of the oriented sample. DSC tests highlight them, but the conditions of these tests (mass of the sample and heating rate) influence the melting temperatures obtained as well as the presence of the different peaks. As these parameters impact the morphology, they then have a consequence on the mechanical properties. PE reinforcements with outstanding mechanical properties are characterized by a high draw ratio.
An overview of the physical properties of PE-based reinforcements and in particular of highly stretched UHMWPE reinforcements was given. The knowledge of the structure of such reinforcements is important because physical properties and mechanical properties are intimately linked as will be detailed in the next section.
4. Mechanical Behavior
4.1. Test Protocol
Concerning the way to test the UHMWPE material, many approaches to tensile or creep testing are described in the literature. For tensile tests, the way to set up the sample differs according to the authors. Indeed, Kromm et al. [23] tested specimens bonded with epoxy resin to a stiff frame, whereas in the case of Dessain et al. [24] fibers were simply gripped in the jaws between pieces of thin cardboard to prevent damage. In creep tests, yarns are also mostly bonded with cardboard tabs [12,32,46]. Special devices are sometimes added to standard tensile test machines. Schwartz et al. [33] developed capstan inserts that fit pneumatic jaws. Russell et al. [14] created a device for testing between 10−4 and 103 s−1, consisting of a semi-circular anchor. Pneumatic clamps are widely used because sample slippage is then prevented by adjusting the air pressure [12,25,36]. For temperature tests, the oven used is thermostatically controlled [25,46]. A system was also proposed by Dijkstra et al. [41], consisting of a brass cylinder that surrounds the clamps and sample, and which is itself surrounded by glass. The brass cylinder can then be cooled through a nitrogen flow between the two cylinders. For tests at temperatures above room temperature, heating is done employing two heated brass blocks, which encircle the sample. Part of the creep tests consisted of dead-load tests [32,40,111,112]. Berger et al. [29] carried out these tests using an in-house-built machine, just as Wilding and Ward [112] designed a purpose-built system for carrying out stress relaxation tests. A summary table of the different tests that will be introduced in this review and the associated conditions is presented in Table A2, given in Appendix A. The intervals of values of the mechanical characteristics are always given in ascending order and not according to the range of temperature, strain rate, or gauge length studied. The protocols are quite varied as many experimental difficulties must be overcome.
4.2. Experimental Difficulties
Data reported in the literature or by manufacturers are averaged data with a large standard deviation. This is related to many experimental difficulties associated with measuring cross-sections. However, the recording of displacement with accuracy during the test is a challenge. The validity of this test is not evident, even more so when using the scale effect to determine the behavior of yarns. Moreover, the mechanical parameters depend on chemical aspects and the kind of process on a larger scale [13], thus defining a unique value has no sense. These difficulties are presented in the following section.
The very small size of the filaments can be an obstacle to the extraction of a single fiber from a bundle for their precise characterization. It selects the strongest fibers because the weakest are broken or damaged during extraction [43]. Measuring the diameter of fibers or yarns to determine stress is not easy because the drawing process causes changes in the cross-sectional area [13,23,27,43]. An optical measure is therefore not suitable. To have a representative filament diameter, it must be measured many times and then averaged. Kromm et al. [23] proposed a microscope observation of the cross-section of the multiple filaments that make up the yarn. The filaments are counted, and the cross-section of the stressed yarn is then known (Figure 16). The cross-section can also be deduced from the density [14,33,37,113]. To overcome the variation in the cross-sectional area of the drawn filament, Schwartz et al. [33] used the cross-sections of each filament tested and not the average of these cross-sections, and work with areas rather than diameters since the cross-section is not perfectly round. Marais et al. [13] argued that in the literature the true cross-section of yarn is by no means known. The most accurate possible measurement of the section solicited is necessary because the distribution of strength is greatly influenced by the variation in the cross-section of the reinforcements. It seemed from R’Mili and Murat [42] that yarn tests gave a more reliable measure of strain and reduced the impact of the variation of the cross-section of the filaments on the calculation of the cross-section of the stressed yarn. Also, no extraction is performed as in the case of individual filament tests. Yarn tests are more statistically representative. Only a few tests on yarns allow the characterization of the reinforcement, and the result is even more reliable as the number of fibers is large (N > 1000 fibers).
As shown in Table A2, set out in Appendix A, the strain can be achieved in several ways, directly or indirectly, and its determination is a key point. Some authors used extensometers [12,15,29,32,46]. However, as the samples tested are very small in diameter (mostly less than 1 mm), the use of extensometers is very complex [23]. The deformation of the specimen was then calculated from the grip displacement [12,23,24,25,38,40,45,111,112]; slippage between the sample and the clamps may not have been considered. With this method of defining, one must consider the compliance of the machine to deduce the real elongation of the sample [23,42]. However, in most cases, the greatest contribution of this displacement is between the grips, given the material of the machine compared to the PE tested. However, in addition to the compliance of the machine, the compliance associated with the load transfer between the clamps and the fibers must also be integrated if necessary. Chi et al. [43] assumed that the relative displacement of the sample between the jaws is linearly proportional to the load applied in a tensile test. Nevertheless, a non-uniform distribution of stress along the useful length persists because an inhomogeneous stress field resides near the clamping region. To minimize this, the specimen length should be close to infinity [40]. Thus, significant differences in mechanical characteristics can be observed depending on how the strain was defined [14]. Direct identification of the useful length of the yarns and their elongation is essential to best determine the mechanical parameters. A DIC (Digital Image Correlation) approach was then proposed by Russell et al. [14]. However, in the case of a marker tracking technique, problems associated with the type of paint to be used and the unsharp outlines of the markers were raised [114].
The choice of the sample length is a key point, especially when there is a will to change the scale from sample lengths to concrete lengths. If the chosen lengths are not relevant, the cost associated with predicting the entire behavior from a small-scale behavior can be substantial. Sensitivity studies of this useful length on the behavior of the reinforcements tested were carried out. Schwartz et al. [33] tested fibers from 10 to 200 mm and this did not impact the determined Weibull parameters. Long fibers thus appeared to be as strong as the shortest. The authors then questioned and attributed this by hypothesizing a distribution of critical defects over a period shorter than the shortest gauge length tested or the critical flaws that exist at a very high frequency. Kromm et al. [23] observed an influence of the useful lengths tested, greater than 80 mm. For large samples, it seems that the weakest filaments are excluded. The longer the length, the greater the frictional forces and therefore the more successful the selection of filaments. Tests carried out on long filaments are then invalidated because the volume is not representative of the diameter fluctuation. For some tests, e.g., when using capstan inserts, because of the very low amount of slack in the specimens, and the small extensions that occur during fiber tension, strain measurements were not reliable for small useful lengths [33]. This also corroborates the fact that it is preferable to characterize reinforcements in bundles rather than filaments alone because of the mechanical performance that is difficult to assess. The adequate operational length thus depends on the frequency of critical defects and thus on the chemistry and the drawing process. For example, Wilding and Ward [40] noticed useful length effects for lengths greater than 6 cm, the length chosen for their study is 9 cm, for filaments made by BP Chemicals International Ltd.
As a result, and this applies to all types of fibers, some authors aimed to reconstruct the behavior of yarns using data obtained from fibers of various gauge lengths for example. To be representative, a very large amount of data is required. Weibull distribution functions were proposed to analyze, for example, the resistance of fibers [115,116,117]. However, the presence of defects on their surface implies variations in fiber strength. To avoid damage to the bundle by friction it must be lubricated [42] but this may also modify the behavior in some cases. As reported by Roiron et al. [114], when adding silicone grease to a tensile-tested yarn, the strain at break and maximum strength then decrease compared to a virgin yarn. This is due to the compaction effect of the fibers that constitute the yarn since there are significant gaps between the fibers. The stress cannot be transferred from one fiber to another and therefore the performance of the yarn is degraded. It is then relevant, to predict the strength of a composite, for example, to consider the average strength of fiber but also the distribution of fiber strength. Such extrapolation from tests at small lengths, using a unimodal Weibull distribution, showed some limitations even for carbon, glass, or alumina fibers [115,116,117] because two main types of flaws seem to appear. Another function was then suggested by Phani [115]. It has a lower and upper limit, associated with physical phenomena and is represented by two shape parameters and two local parameters. A method was proposed by Phani [115] based on an approach previously developed by Chi et al. [43] and applied to carbon fibers. Since it is complex to establish the two parameters experimentally, they put forward two methods to achieve this. The first is based on the relationship between the shape of the yarn curves and fiber subsistence, and the second uses the relationship between the maximum load reached on the tensile curve and the shape parameter of the Weibull distribution related to fiber strength. Shape parameters vary when fiber bundles, i.e., yarns are studied. Bimodal distributions were proposed for glass fibers [42] or Kevlar fibers [116]. The latter authors made two parameters of the distribution function dependent on strain rate and temperature to construct a damage constitutive model for fiber bundles. However, in the case of PE fibers, the behavior is not brittle elastic. A significant non-linear contribution is observable. Kromm et al. [23] used, in the first instance, a Weibull approach in terms of probability of subsistence as a function of tensile strength. However, the Weibull approach was not relevant for this type of fiber because stiffness obtained for filaments and bundles are very different. These differences cannot be explained simply by variations in filament diameter. They then proposed a coupling model between the filaments to explain this. The different couplings show that the connections between the filaments significantly increase the stiffness of the bundle. A redistribution of the stress is made through the local links between the filaments when a filament is about to break. This difference in stiffness between bundles and filaments is justified by the links between the filaments alone in the bundles but also by the twist which induces friction between the filaments.
To validate tests on yarns, the fracture must occur within the operational length, which allows a stress concentration at the ends to be ruled out [42]. It must also be unique and lead to the complete separation of the filaments [42], otherwise, it is synonymous with inhomogeneous stress on all the fibers that constitute the yarn [25]. Multiple breaks are associated with the late loading of certain fibers. The presence of waves in the yarn may be a cause of this non-uniform load [43]. The yarn setup can have an impact on the stress distribution imposed on the fibers as a whole. Indeed, Roiron et al. [114] highlighted the influence of yarn setup during tensile tests and, in particular, the effect of the number of twists imposed on the ends.
4.3. Influence of Process Conditions and Initial Polymer Characteristics on Reinforcement Behavior
In addition to time and temperature dependencies that will be developed further in the following section, the parameters associated with the process, and the very nature of the polyethylene used, influence the mechanical properties. Indeed, the draw ratio is the process condition that has a major impact on the performance of the UHMWPE fibers used. As a reminder, the draw ratio is defined as the ratio of the speed of the drafting roller to the speed of the feed roller. High draw ratios can be obtained in the case of drawing from a gel solution because the crystals of the resulting platelets are very plastic [50].
In his review, Ohta [48] highlighted the fact that a draw ratio greater than 20 was associated with ultra-drawing. That makes it possible to increase the number of taut tie molecules and the degree of molecular orientation, and therefore the mechanical properties. The maximum theoretical draw ratio depends on the rigidity and length of a given chain. Irvine and Smith [68] proposed a formula to relate this maximum theoretical ratio to the number of chain segments that have a length , a projected length and a characteristic ratio :
Ohta [48] compared the effect of draw ratio on tenacity and modulus for different processes: hot drawing, zone drawing, solid-state extrusion, and drawing from gels (Figure 17a,b). Thus, ultra-drawing appeared to maximize the tenacity of the reinforcements used in all processes except solid-state extrusion [117]. In their 1983 patent dealing with the drawing of PE and PP fibers, Kavesh and Prevorsek [118] studied the parameters of temperature, drawing speed, die diameter, and the nature of the solvent, among others, and the influence of several drawing stages on the mechanical performance of the fibers produced. Surface-grown fibers have a much higher creep rate than gel-spun fibers produced from the same polymer. Williams and Peterlin [119] defined the critical draw ratio in terms of mass transport properties. Large molecules have difficulty in changing from a lamellar to a microfibrillar structure. At the transition zone, the increase in microfibrils hinders the diffusion of the molecules.
High tenacities seem to be achievable mainly in the gel drawing process and are very important for the fibrillar crystal growth process (between 34 and 55 g/d or between 2.8 and 4.7 GPa [48]). This seems to underline the fact that the increase of the taut tie molecules, which play a major role in the performance like strength, is a prerequisite for the obtaining of high tenacities. The control of defects, defects that lead to the initiation of sample fracture, must also be monitored [48]. Since structure and properties are closely related, the effect of the draw ratio on the microstructure was an object of study. As the material is stretched, the size of the (200), (020), and (110) domains increases. With the increase of the drawing, these domains grow laterally, i.e., perpendicular to the fiber axis, corresponding to the width of the microfibrils. On the other hand, the orientation of the crystals may vary with the draw ratio [27]. A second successive drawing step of the material results in an increase in strength and may lead to some changes in crystal orientation.
The fraction of material stressed increases and the number of trapped defects decreases as the draw ratio increases [29]. As for the modulus, it seems to increase with the draw ratio, first rapidly for ratios below 20 and then more gradually in the case of ultra-drawing (Figure 17) [48,53,56]. For most of the processes analyzed [48], high moduli seem to be achievable. In their review, Barham and Keller [50] similarly suggested that the stiffness of melt-crystallized fibers depended mainly on the draw ratio. This overriding dependence on the draw ratio seems not to be impacted by the draw temperature (Figure 18a), especially in the case of the gel drawing process for a wet gel and draw temperatures below 135 °C [120]. When stretching from a gel solution, the trapped entanglements are reduced, so the chains can extend more easily than in a melt crystallization process where, due to the presence of many entanglements, friction is generated [125].
At higher temperatures, the modulus increases but less noticeably (Figure 18b). Maximization of modulus is done for drawing around 110 °C for wet gel-fibers, a temperature associated with the dissolution of single crystals, whereas for dried gel-fibers, the maximum draw ratio increases with the drawing temperature [120]. The drawing of melt-crystallized PE films is optimal at 130 °C [120]. The draw ratio that can be achieved is greater at high temperatures because the fibrillation phenomenon decreases due to greater plastic strain at high temperatures than when drawing at room temperature [125]. Yeh et al. [53] reported that apart from the drawing temperature, the gel-forming temperature had an impact. Indeed, it appeared that for a given drawing temperature, the drawing ratio of a sample prepared at various forming temperatures increased as the forming temperature decreases. The mechanical performance, strength, and tensile modulus are then more important for samples prepared at lower temperatures than when they are prepared at higher temperatures. Less perfect crystals obtained from preparation at lower temperatures can be more easily drawn and oriented than more perfect crystals formed at higher temperatures.
Thus, the draw ratio is a key parameter, strongly associated with the performance in terms of modulus or the tenacity of the yarns. Maximizing the draw ratio is major to obtain interesting properties for the use of UHMWPE fibers or films as reinforcements. However, this one also depends on the characteristics of the initial polymer. Barham and Keller [50] pointed out in their review that the draw ratio and thus the achievable modulus was determined by the intrinsic entanglement density of the polymer (Figure 18c). Whether the gel used is wet or dry, it contains inherently fewer entanglements than the molten polymer, the draw ratios and therefore the reachable chain extension is higher. Indeed, Smith et al. [64] observed that the draw ratio increased with the gel concentration for dried gel films. They proposed a relationship in which the maximum drawing ratio depended linearly on the processing temperature of dried films crystallized from solution, and on the inverse of the square root of the initial volume fraction of the polymer. Once the concentration of the initial polymer decreases, the slope of the stress-strain curve decreases too, and the draw ratio increases greatly. If the lattice structure of the gel to be stretched is loose, it will be easier to stretch it at high ratios.
Barham and Keller [50] also pointed out in their review that while the relationship between modulus and draw ratio appeared to be independent of molecular weight and the nature of the stretched material, the maximum draw ratio that can be achieved was influenced by the initial sample, both for dried gels and monocrystalline mats. For the former, the draw ratio increases with the initial solution concentration and for the latter, it increases with the molecular weight.
Another key parameter is the molecular weight of the initial sample, which will play an important role in the achievable draw ratio. The results obtained by Capaccio and Ward [59] also showed that high modulus did not necessarily require the presence of extended chain crystals when cold drawing samples. Thus, the influence of the draw ratio appeared to be valid only as a first approximation, for a range of draw ratios below 30. The effect of molecular weight and its distribution should not be neglected. Capaccio and Ward [59,60] did indeed observe a discernible impact of the average molecular weight (comparison of samples 1–2 and 3–4 in Figure 19) on the achievable natural draw ratio. The different samples were, during their preparation, quenched at different temperatures to obtain different molecular weights and a varied distribution. For a given number-average molecular weight value, as the molecular weight distribution decreases, the achievable draw ratio increases sharply. The higher the ratio, the more crystallinity increases, more or less depending on the range of the ratio, which is like what was observed in DSC by Yeh et al. [44]. The need for a high molecular weight then seems to be a prerequisite for the possibility of drawing at high ratios (sample 1), but this is not enough as the other samples seem to be limited in stretching. Factors such as the extent of segregation or the nature of the material are suspected to affect the plastic strain process that takes place during processing [59]. For these authors, the quantity of material with a high molecular weight could even limit the maximum attainable modulus. Peterlin [70] stated in his model that the plastic strain of the fibrillar structure comes exclusively from the sliding of the microfibrils relative to each other. The connections between the fibrils restrict this sliding. As a result, samples with a higher molecular weight that have many links between the lamellae are limited in terms of the draw ratio compared to samples with a lower molecular weight. If the crystallization is done from the molten state or by quenching, thus depending on the solidification speed, large deviations from the molecular weight dependence of the draw ratio were put forward by many authors as Barham and Keller, Capaccio and Ward, and Smith and his coworkers [50,61,64], because the solidification speed impacts the fact that the chains may or may not slip and the number of entanglements in particular.
In their review, Barham and Keller [50] pointed out that strength is more dependent on the molecular weight of the polymer. The fibers used have a strength rather far from the theoretical one. This can be explained by the fact that if the molecular weight is too high, very high draw ratios are not possible experimentally speaking, except for gel drawing processes where the drawing is done from a solution. For a gel drawing process, Barham [98] suggested that an increase in the average length of the crystals in the regions of the nuclei (kebabs) was observed with the formation temperature. This appeared to the author to be responsible for the associated increase in modulus. The efficiency of such a crystal for fiber reinforcement is more important as it is long. The influence of chain length and thus molecular weight was also underlined by Ohta in his review [48] for several processes. This influence is especially emphasized for tenacity (Figure 20a), more than for modulus (Figure 20b). Tenacity increases with chain length because then the number of chain ends decreases in the sample. A polymer in gel means that it has long chains by definition, without which its gelation is not possible, as explained in a previous section [50]. Thus, a low molecular weight is comparable to a lubricant that facilitates stretching [131] and a higher molecular weight allows the formation of more taut tie molecules that are responsible for a high modulus and strength [132,133].
For Irvine and Smith [68], low molecular weight polymers are more easily stretchable and can have correspondingly higher modulus. Conversely, they suggested that Young’s modulus was independent of molecular weight and was only determined by the absolute draw ratio because during the drawing process only a little chain slippage occurs.
In addition to the effect on the maximum attainable ratio, the distribution and molecular weight of the initial sample influence the morphology that can be achieved. For example, when looking at the curves in Figure 21, traces for samples 3 and 4 show a particular behavior which suggests that the formation of material with extended chains is related to a given range of molecular weights [59]. The distribution of these weights is also important, shown in Figure 21b, with a narrow distribution, the specimen (sample 4) appears to be independent of the initial sample and the draw ratio, whereas, for wider distribution (sample 3), the phenomenon of the appearance of two peaks is present only in a certain draw ratio range. Appropriate conditions of molecular weights and their distribution are required for an optimum cold drawing of the samples and therefore for optimal mechanical properties [59].
Finally, for a drawing from a gel solution, the temperature and the drawing speed have an impact on the maximum achievable ratio. For a given drawing speed, a maximum limit value is observed when the films are stretched at a temperature close to the optimum temperature. The latter increases with the stretching speed [53]. To obtain the expected behavior, from the drawn polymer, the preparation of the gel to be stretched should not be neglected and should be optimized [48]. In the case of drawing from solution, a large increase in modulus and tensile strength has been observed when the crystallization temperature of the stirred solution was high [96]. While the concentration of the initial polymer is important, for a certain concentration of polyethylene, the achievable draw ratio depends on the drawing temperature [120,137], the speed of the crosshead [138], and the film gelation conditions [64], as these parameters affect the number of entanglements trapped. It was noted that the maximum draw ratio decreased only slightly with increasing crosshead speed. Smith and his colleagues pointed out that the number of such entanglements trapped was a notable point when drawn at temperatures above about 70 °C.
In general, what then seems to characterize PE reinforcements with remarkable mechanical properties is a high draw ratio, facilitated by the texture and morphology of the initial material, which is possible partly due to high molecular weight. In the above, the link between the process parameters and the basic mechanical properties (modulus and tenacity) has been clarified. However, these parameters are insufficient to determine the potential of these reinforcements. The incorporation of these fibers in composites should allow the transfer of off-axis loads while taking advantage of the mechanical properties along the axis of the fibers. As one of the major disadvantages of using PE fibers is its time and temperature-dependent behavior, determining its mechanical properties in detail, as well as the mechanisms which arise under a complex history loading (cyclic or constant loads), is essential. Consequently, the next paragraph completes the knowledge base by evaluating the type of behavior (viscoelastic, viscoplastic) and the coupling with temperature. In what follows, the discussion will be focused on UHMWPE reinforcement.
The performance analyses, following thermal-mechanical tests, made in the literature, will be summarized in a non-exhaustive way, as well as the highlighting of the close link between these properties and the morphology.
4.4. Tensile Tests
In this part, the behavior is presented by considering different families of thermomechanical loading; cyclic tension, the effect of time, different temperatures, coupling effects of temperature and time. The section also presents the failure modes.
4.4.1. Cyclic Tension
To assess polymer behavior, cyclic load-unload tests can be carried out. However, only a few of these tests are reported in the literature, to the author’s knowledge. Smook et al. [37] highlighted the large plastic part of the strain by unloading after a 3% strain at the same crosshead speed. The stress was then zero at the end of the unload step. The strain rate during reloading was higher. The strength and the initial modulus of the second curve were independent of the first. In cyclic tension with relaxation time [36], below critical stress, no permanent strain was observed. Between two cycles (Figure 22a), the dissipated energy appears different, but the recovered energies are close because the curves are also similar for the unload step. The total energy has therefore varied, and this can be attributed to a change in the fiber properties. Most of the energy is dissipated as heat and a very small part is dissipated because of structural changes. The draw ratio influences the fraction of elastic energy; it is low when the draw ratio is low. The total energy from strain at break remains close for all types of fibers tested, whether fibers are drawn in the molten state or from a gel solution. The dissipation energy can be related to the elongation viscosity and the strain rate. If the fibers plasticize during the deformation of the sample, a permanent deformation remains even after 64 h of recovery between two cycles. The plastic flow thus leads to an irreversible dissipation of energy.
When many cycles are carried out with small strains and without recovery, after 35 cycles the unload curves become similar and the cycle becomes purely elastic, as noticeable in Figure 22b [36]. However, if a recovery is then made, the behavior changes as the viscous elements are reactivated and energy is dissipated. Indeed, if a model with Voigt elements is used to represent fibers, after several cycles, the elements that will be activated will be those whose contraction time is less than or even equal to the cycle time. If a recovery is made, viscous elements with longer contraction times are then activated. Stress relaxation is observed because, to achieve a given strain, the required stress decreases with the number of cycles, attributed to the plastic flow that changes the structure of the fiber. Indeed, the transition between the orthorhombic and hexagonal phases is strongly linked to this relaxation, because it can then be achieved by the sliding of the chains in the crystal lattice and not by the amorphous flow. To predict the cyclic behavior, a relationship allowing to estimate the modulus as a function of the stress is then deduced [36]. A linear dependency is given for low stresses, which is related to the chain pullout from the crystal block, and a non-linear dependency is given for higher stresses, for which the flow mechanism achieves a stress-induced melting which corresponds to the sliding of the microfibrils relative to each other. This relationship has a term associated with the initial modulus, whereby the actual stress relaxation modulus is changed by a flow process. This last process is difficult to translate into microscopic terms because the morphology of flexible chains is rather complex. The phenomenological stress/strain relationship makes possible the description of the experimental curves satisfactorily. A structure/property relationship is highlighted.
During cyclic loading, the effect of transient deformation mechanisms is visible, in the case where during the first cycle the modulus increases and decreases during the second cycle. This is explained by the fact that most of the deformation heterogeneities are reduced in the first cycle, the dissipated energy is reduced, and therefore, the area of the hysteresis loop is reduced [29,36]. It is the presence of the defects that lead to these heterogeneities, and thus, to local stress variations.
UHMWPE fibers, being made from PE, have predominantly viscoelastic behavior. Therefore, to fully characterize this behavior, load-unload tests at different temperatures are unavoidable. Roiron et al. [114] studied the variation in hysteresis shape and tangent modulus values measured at several locations in the loops for non-recovering load-unload tests at 23, 60, and 100 °C and three strain levels. Thus, counter-curvatures appear at the two lowest temperatures, which is synonymous with a hyperelastic type of behavior. However, at 100 °C, no loops are observed, as noticeable in Figure 22c,d. At this higher temperature, an elasto-viscoplastic behavior type is observed. Similarly, identical trends are visible at 23 and 60 °C when the tangent moduli at the end of loading, beginning, and end of unloading, as well as the beginning of reloading, are measured. At these two temperatures, the tangent moduli at the beginning of unloading and reloading are similar regardless of the loop considered, whereas at 100 °C the moduli at the end of unloading and beginning of reloading are close. A change in behavior between 23, 60, and 100 °C is noticeable. Any effect of the yarn setup being tested has been ruled out.
Given the type of behavior observed, a more in-depth study of the time and temperature dependence of the mechanical response of UHMWPE yarns or fibers seems unavoidable.
4.4.2. Time Dependence
The time dependency must be well controlled, as when using these yarns for loaded applications. Therefore, the effect of strain rate has also been the subject of several studies. At low velocity, a distinct yield strength was observed and then disappeared in tests on filaments [33]. At higher velocities, there is a tendency in the literature for more elastic behavior. Indeed, Russell et al. [14] evaluated the behavior of Dyneema® yarns over a wide range of strain rates, between 10−4 and 103 s−1. They proposed a procedure for testing yarns at high speeds, above 100 s−1, and thus measured the stress response as a function of strain when a projectile strikes the anvil to which the yarn is attached. The same device allows tests to be carried out at lower speeds. The strain was measured by a high-speed camera and not by the displacement of the jaws, as the slippage of the yarn was then not considered. Strength becomes more variable with increasing strain rate [33]. The absence of failure mechanisms related to relaxation phenomena at a higher strain rate could explain this. SEM imagery has determined that necking and very low energy release characterize the lowest strain rates, whereas at higher strain rates, the fracture is brittle, and the amount of energy released is greater.
Russell et al. [14] compared their results with some findings observed in the literature in Figure 23. If the tensile response of the yarns depends on the strain rate below 0.1 s−1, for higher strain rates the response is linear up to breakage. They attributed the behavior of the fibers at a strain rate below 0.1 s−1 to creep. Differences in failure strain and initial modulus values, even for the same type of fiber, Dyneema® SK76 in this case, were underlined and this was attributed to the indirect measurement of strain from the jaw displacement by Russell et al. [14]. A transition occurs at a rate of 10−1 s−1. Van der Weff and Pennings [36] found that the fiber strength increases with crosshead speed and then stabilizes, which brings out the presence of the brittle-ductile transition for the maximal strength at 32 mm/min for a Hifax® 1900 type. Roiron et al. [114] noted the same transition at a strain rate of 10−4 s−1 for Doyentrontex® yarns for different parameters as strain at break, maximal strength, and modulus at 0.5%. In this case, curves were carried out at several temperatures, and strain rates were shifted, and the strain was calculated from crosshead displacement. Schwartz et al. [33] reported for Spectra® 900 fibers a transition at 0.1 min−1. Whatever the type of fibers or the way of calculating the strain, the presence of a transition seems to be confirmed. Some authors may not have enough data to report this transition.
When the tensile results of the fibers and the associated yarn are compared, a large difference can be seen in Figure 24a [14]. This can be attributed to several parameters such as stress concentrations, wick abrasion leading to premature failure, and the crimp of the fibers constituting the yarn and prevent uniform loading. This last explanation is the most relevant. In this case, the strength of a single fiber can dominate that of a yarn [12,23,24,139,140].
These results were confirmed by Schwartz et al. [33] where the difference in the impact of the strain rate was visible at 0.1 min−1. Strength variability increases with increasing strain rate. This may be due to the absence of a failure mechanism associated with relaxation phenomena at higher strain rates. At such rates, failure results in the release of a large amount of energy as a result of the fibrillation of the fracture sites. As with temperature, which will be detailed later, a ductile/fragile transition occurs [36]. In the ductile zone, the strength increases with increasing strain rate. In the brittle region, no influence of the displacement speed of the crosshead is perceived. Concerning the results obtained in Figure 24b, Kromm et al. [23] denied any dependence of mechanical properties, modulus and strength in particular, on the strain rate, for tests between 1%/min and 100%/min, except for strain at break for Dyneema® reinforcements. They attributed this to the high degree of crystallinity of the fibers in a given direction after the drawing process, which results in a reduction of the viscoelastic contribution.
4.4.3. Temperature Dependence
Many authors have also studied the effect of temperature on UHMWPE fibers. Kromm et al. [23] observed a significant decrease in properties between 20 and 70 °C, then more gradual. Dessain et al. [24] reported a high-temperature dependence of strength and strain at break of gel stretched monofilaments tested between −175 and 100 °C. Figure 25a,b show the evolution of these two parameters with temperature. A change in the slope of the strength of fiber at 5 °C is shown and is related to an evolution in morphology. For temperatures above 5 °C, the drop in strength properties is greater. This variation is attributed to a transition of solid phases and more particularly to the passage from the orthorhombic phase to the hexagonal phase. As described in the previous sections, this transition takes place between 150 and 155 °C depending on the type of fiber, process, etc. As a reminder, in the hexagonal phase, even if a certain orientation is maintained, the chains slide more easily with each other and the material is more temperature-dependent. This explains the very large increase in strain at break after 5 °C (Figure 25b). Dessain et al. [24] pointed out, however, that this transition could occur at lower temperatures under stress. The stress should be greater the colder the temperature, but up to a certain limit at which the filament breaks before sufficient stress causes the phase transition. This is because, below 5 °C, the main orthorhombic shape does not facilitate chain slippage. Dijkstra et al. [41] studied the linear decrease in strength until it becomes zero at 152 °C, a temperature associated with the transformation of the orthorhombic lamellae into the hexagonal phase. This decrease was induced by the introduction of the hexagonal phase when stress is applied. The transition in behavior, evidenced by a slope break, is however noticed at a temperature of 20 °C, above which the strength is more strongly temperature-dependent.
As previously explained, Irvine and Smith [68] have proposed the modeling of PE reinforcement using two elements: helix and coils. The fraction of helix elements is dependent on the draw ratio. The modulus of the helix elements is imposed as independent of temperature and equivalent to the theoretical axial modulus [41]. Only the modulus of the coil element is temperature-dependent, corroborated by the temperature increase with the a-axis temperature of orthorhombic PE cells. This modulus decreases with temperature and becomes zero at the melting temperature. It then seems to be closely related if not equal to the smallest shear modulus of the crystalline phase. Govaert et al. [113] used the same two elements and their characteristics. They highlighted the direct correlation between the dependence of the modulus of the coil elements and the crystalline shear modulus on temperature. The influence of temperature on the dimensions of the unit cell of the orthorhombic crystalline phase was measured. While the b-axis remains constant, the a- and c-axes evolve, the first increases remarkably while the second decreases slightly (Figure 26). Matsuo et al. [141] explained the dependence of Young’s modulus on the temperature in terms of the change in the proportion of phases with temperature. They attributed this dependence to an increase in the amorphous phase and a decrease in the modulus associated with this phase.
The effect of annealing on the tensile properties has also been studied. For example, annealing between 149 °C and 152 °C for 24 h doubles the strain at break, as shown in Figure 27a, also results in a decrease in modulus but does not affect the strength of gel-drawn fibers [37,39]. Torfs [41] also did not observe an increase in strength for UHMWPE fibers annealed at 130 °C for various stresses. For an annealing temperature so close to the transition temperature between orthorhombic and hexagonal crystal lattices, a variation of half a degree has a remarkable effect on the properties [39]. The reduction in modulus for annealing temperatures above 140 °C is permanent. At lower annealing temperatures, no change in properties was observed for gel-drawn fibers. Here, annealing not only restores the defects in the crystal lattice but also enlarges the perimeter of the taut tie molecules which are then pull away from the crystalline blocks to which they were attached.
As developed in an earlier section, Dijkstra and Pennings [38] proposed a model in which the fraction of the taut tie molecules that regain the charge between the crystal blocks determined the strength. The elongation of the fiber at break was established by the strain at break of the disordered domains as well as that of the crystal blocks, and the tensile modulus could be defined as the ratio between the length of the crystal block and the disordered domains as well as the fraction of taut tie molecules. This model then made it possible to reduce the modulus without affecting the strength by reducing the length between the crystalline and disordered blocks if the fraction of taut tie molecules remains constant.
At temperatures close to 152 °C and thus for a hexagonal phase, the taut tie molecules are then in a very relaxed state, and their number decreases. Peterlin [89] observed by dyeing, for example with iodine, the amorphous parts, that annealing had the effect of rearranging the folds on the surfaces of the crystals, and the relaxation of the taut tie molecules between the crystals, they could then be integrated into the existing crystals. So, the annealing phenomenon and its consequences could then be expressed in terms of relaxation of the taut tie molecules but also by entanglements, whose contribution was underlined by Lacher et al. [142]. Thus, due to the stability of the strength, this property is more determined by entanglements in the disordered domain.
An annealing process allows a decrease in residual stresses and therefore more homogeneous stress in the sample during the solicitation. This could explain an increase in strength with temperature [143]. A remarkable change in modulus for lower annealing temperatures between 60 and 120 °C is also underlined but this effect depends on the draw ratio [144]. During annealing, the author highlighted a slight modification of the crystallinity. Also, the reduction in modulus with annealing was associated with changes in the non-crystalline regions or the mutual arrangement and connection between the non-crystalline and crystalline regions. The amorphous regions could undergo several changes such as the number of taut tie molecules or their state, the healing of crystal defects, or the interpenetration of folded chains. A greater quantity of taut tie molecules should result in a higher Young’s modulus and lower heat content of amorphous regions [144]. The fibers in the latter case were processed by drawing the lamellae that constituted the polymer. Annealing of stressed fibers at temperatures below the characteristic transition temperature did not lead to an increase in tensile strength, but an increase in elongation at break was nevertheless highlighted [41]. Arridge et al. [145] noted that for annealed samples, obtained by primary crystallization, with fixed ends, Young’s modulus gradually recovered. This self-hardening effect depends on the initial modulus before annealing and the annealing temperature.
Higher annealing temperatures result in high modulus immediately after annealing. The ratio of the measured modulus after annealing to the initial modulus increases with the annealing temperature [145]. Continuity between the elements that take up the load is gradually restored over time at room temperature after annealing. This is associated with a gradual rise in crystallinity followed by a consequent drop in annealing. A model to explain this effect is suggested. It is halfway between a quantitative model like this of Takayanagi [146], and one that considers structural elements such as Peterlin’s model, already described earlier. Takayanagi’s model corresponds to Hosemann’s [147] slightly modified model, i.e., the representation of the hot-drawn crystalline polymer by crystalline and amorphous regions connected in parallel, and this block is itself connected to a crystalline region in series, in the direction perpendicular to the drawing, discontinuously. A composite model consisting of needle crystals aligned in an amorphous matrix could represent such a behavioral effect, especially when working with the shear-lag theory of composite fibers. A stiffening of the amorphous matrix of the material could account for the remarkable effect of self-reinforcement. The structural and therefore physical aspects will be discussed in the next paragraph. Super-drawn PE samples do not show any loss of elastic modulus during annealing [67]. Thus, super-drawing at a temperature close to the melting point is most likely a combination of drawing and annealing [148].
Peterlin [148] tried to explain the effects of annealing with microfibrillar models. Annealing affects the contour length of the taut tie molecules. During annealing, the chain sections by which they are attached to the crystalline blocks are removed. If the ends of the specimen are free, the entropic retraction forces of the taut tie molecules tend to bring the blocks back to their position before drawing. Once relaxed, they tend to crystallize. For samples with fixed ends, this crystallization takes place gradually at room temperature. The increase in the length of the contour forms crystals consisting of folded chains. The unfolded sections crystallize and then connect the blocks of fibrils and microfibrils close together. These bridges act as load transfers between the different elements. As a result, the modulus of elasticity is high. Since the chains are attached to the crystalline blocks, the fusion of these bridges is only possible when the attached chains become detached from the lattice. They do not shrink during subsequent annealing, even if their ends are not fixed. Therefore, such a specimen, even if its ends are not held, does not shrink during subsequent annealing. Thus, the history of the stretched and then annealed sample does not seem to be forgotten [149]. This has also been observed on PP. After annealing, holding the specimen with or without the addition of stress brings the properties after annealing closer to those of the initial specimen just after stretching. Thus, the performance is better a few times after annealing than immediately after. The formation of crystalline bridges by crystallization of some of the stressed taut tie molecules may be one explanation. This crystallization takes place very slowly at room temperature, a temperature at which the chains can move very little because of the very high viscosity.
When UHMWPE fibers, obtained by gel-drawing or hot drawing, are annealed before irradiation, an impressive drop in tensile strength has been highlighted. During annealing, the over-stressed tie molecules decrease [150].
Temperature as an aging factor has also been studied [45]. To accelerate thermal degradation, gel-drawn UHMWPE yarns are exposed to high temperatures. A decrease in tensile strength has been reported, which is greater for aging between 90 and 115 °C than at low temperatures (43 °C). The degree of oxidation increases with aging temperature and time. An oxidation index is also calculated. From its variation, it can be deduced that the greater the aging temperature, the faster the drop in tensile strength. Morphological changes resulting from exposure to temperature can explain this phenomenon. A master curve of the percentage loss of tensile strength as a function of exposure time at 43 °C has been constructed in Figure 27b [45], according to an Arrhenius law. A combination of the morphological factor and oxidation can explain the loss of strength. However, as long as one is not able to separate these two factors, it remains complex to precisely identify an aging mechanism and thus to construct a failure model.
4.4.4. Coupling Effect of Temperature and Time
DMTA (Dynamic Mechanical Temperature Analysis) tests on UHMWPE fibers highlight their possible use for vibration damping in structures but especially the coupling effect of temperature and time on elastic and viscous parameters. The time dependence on the fiber behavior is particularly emphasized by this type of test. It appears that the loss modulus decreases with frequency and the storage modulus increases with test frequency [15]. Alpha relaxation temperatures increase with test frequency (Figure 28a). This is attributed to the increase in crystallinity during preheating. The storage modulus increases with crystallinity, but no influence is visible on the loss modulus. From curves obtained at several temperatures and frequencies, master curves can be reconstructed by horizontally shifting the loss and storage moduli and knowledge of the behavior over a larger frequency range is available. Such master curves are presented in Figure 28b [12] and compare the dynamic behavior of Spectra® fibers [12] and two types of Dyneema® fibers [32,151]. At very high speeds, above 104 s−1, the storage modulus is independent of the test frequency. For the shift of the dynamic moduli, an Arrhenius law is proposed [113]. The activation energy of this Arrhenius process increases with temperature.
So, similar influences of time and temperature occur on classical tensile tests. An increase in strain rate and/or a decrease in temperature leads to an increase in the modulus, and strength of the fibers, a decrease in the work at the break of the fibers, and a transition from ductile to brittle fiber fracture [12,36,46], which was confirmed by other authors. Fracture work has a constant minimum at high strain rates [46]. Furthermore, according to Govaert and Peijs [46], at low temperatures and/or high strain rates, fibers exhibit brittle behavior and high dependence of the strain rate and temperature for tensile strength. As a reminder, at high temperature and/or low strain rate, there is a transition from brittle to ductile fracture. From two curves obtained at two different temperatures and strain rates in Figure 29, a time-temperature superposition appears possible [41]. Similarly, from tensile tests performed at several temperatures and strain rates, Peijs et al. [12] reconstructed the strength and 1% modulus in tension over a wider range of strain rates. Figure 30a,b show the curves that allowed the reconstruction and the master curve of the obtained strength [12]. The reference temperature is ambient. Two Arrhenius laws with different activation energies are used. The activation energy found is 115 kJ/mol for modulus and 85 kJ/mol for strength [12,46]. However, as the set of curves is superimposed, the option of choosing a single law can be made to reconstruct over a wider range of strain rates the evolution of different parameters such as maximum strength, modulus, and strain at break [114]. Since UHMWPE fibers are made from a semi-crystalline polymer, the choice of a modified Arrhenius law for semi-crystalline polymers [152] may also appear judicious. The activation energy of 107 kJ/mol was obtained when studying Doyentrontex® yarns [114]. Such superposition work was also done from tensile tests at several temperatures and several imposed true strains, relative to the stress relaxation modulus in the linear viscoelastic region [25]. A decrease in the relaxation time by the same factor was assumed as soon as the temperature increases. The description of this modulus in the linear viscoelastic region was done using a power law [23,25,46].
Different failure modes compete, whose physical origin will be detailed in the following section, and the transition temperature depends on the strain rate [46]. A simple model was suggested to predict the strain rate dependence of this transition temperature [46]. This model was first developed by Wilding and Ward [40,111,112] for melt-spun drawn fibers and further investigated by Sweeney and Ward particularly [153] and expanded to solution spun-ultra drawn fibers [25,32], and was also able to predict the behavior over short times. The deformation then additively decomposes into a recoverable elastic component, which prevails over short times, and an unrecoverable and plastic component that dominates over the long term. It can predict the behavior over both short and long times. It will be further explained in the following section. It includes the temperature and strain rate dependence of the strength to be able to distinguish the transition. This ductile/fragile transition is associated with a change in morphology [12,36] among others. Govaert and Peijs [46] linearly extrapolated the ultimate stress at several temperatures and strain rates and showed that the yield strength decreases from 0 to 152 °C. The molecular flow mechanism is attributed to the transition from the orthorhombic to the hexagonal crystalline phase which occurs at 152 °C for stressed PE fibers. Since a small change in strain rate greatly influences the point of intersection with the temperature axis, the authors questioned this.
4.4.5. Failure Mode
This part focus on the mode of rupture. Dijkstra et al. [41] distinguished two mechanisms of rupture which depended on temperature. More precisely, 20 °C seemed to be a stage at which the rupture mechanism changed and constituted a transition temperature.
Below 20 °C, strength was determined by the breaking of covalent bonds or primary bonds of the taut tie molecules and/or entangled and trapped chains. The scission of these bonds can be achieved by the application of stress or by thermal vibration. The stress to induce the characteristic transition may, at certain temperatures, exceed the strength of the overstressed carbon-carbon bonds. The control of rupture by carbon-carbon covalent bonds was also asserted by Dessain et al. [24], below the transition temperature of 5 °C in this case. Since the crystalline phase is more important than the amorphous phase in UHMWPE fibers, this phase dominates throughout the rupture.
Above the transition temperature of 20 °C [41], the fibers break in creep, associated with the stress-dependent transition from orthorhombic to hexagonal phase. Molecular chain mobility is increased in this phase. The rupture is by molecular flow and the strength is thus determined by the rupture of the secondary bonds. This mode of rupture was corroborated by Govaert and Peijs [46]. If no stress is applied, the fracture occurs around 150 °C and the fibers break in creep. Cyclic tests show that the flow process, creep and stress relaxation dominate in addition to the elastic process [36]. As a consequence of the recovery of the behavior after cyclic tensile tests up to a strain of 3–4%, the flow process is considered reversible. Until rupture, no amount of deformation energy is detected to break the bridges of polymeric chains.
For Smook et al. [37], 100 °C marked a plateau for failure mechanisms. Highly fibrillated fracture surfaces can be seen in Figure 31. Melting of some fibrils thanks to a large amount of energy released appears. However, this fibrillation is invisible in the case of cross-linked fiber rupture (Figure 32). It is prevented by chemical cross-linking, which leads to brittle fracture. For these fibers, the lifetime is more sensitive to stress reduction than for conventional fibers because the chains are then connected via covalent bonds.
Except in the case of cross-linking, regions with defects, which consist of the chain ends or trapped entanglements, are created during the drawing process. Cracks can then grow at these weaker sites. Fibril scission appears to occur at topological defects by a combination of chain breaks of the taut tie molecules or entangled molecules. The cause of the rupture is surface irregularities, such as sliding strips, which can cause crack formation [37]. These sliding strips are mainly developed during hot drawing, by compressive stresses but also by thermal stresses. Indeed, in the case of thicker filaments, for example, the drawing temperature is first reached in the skin before the core of the filament. The breaking strength depends on the fiber diameter [37]. A relationship has been demonstrated which emphasizes that the breaking strength of fibers is inversely proportional to the square root of the diameter. If the filaments are fine, the amount of slip band is less and the fibers are more crystalline and more continuous [37]. Extrapolation to 0 of the diameters leads to a strength of 26 GPa, which is close to the theoretical strength of PE.
Several theories suggest that the taut tie molecules that take up the charge in the disordered domain and join the crystalline blocks are precursors of cracks that initiate rupture. But the activation energy leading to the rupture of the trapped entanglements is smaller than that of the rupture of the taut tie molecules. The entanglements are then considered to be the weak fiber bonds [41] at the origin of fiber failure, especially at low temperatures.
On the other hand, it seems complex to create a life model that can perfectly explain the fracture behavior of these polymer fibers, because the fracture mechanism depends on many conditions: morphology, molecular weight, time, molecular orientation, temperature, structural defects, impurities, entrapped entanglements [37]. A phenomenological and continuous approach to the fracture process would not consider the links with the microscopic structure of the fiber. At high temperatures, above 100 °C, existing models cannot be used because constant stress is required. The different models examined by these authors [37] can describe the fracture process quantitatively but in no case, they are based on and agree with the physical interpretations.
Temperature and strain rate play similar roles in the behavior of UHMWPE fibers. So, in addition to temperature, which appears to mark a change in the fracture mechanisms, strain rate also has an important influence on the tensile fracture surfaces [33]. Thus, at low strain rates, fiber necking occurs, and little energy is released, whereas, at higher strain rates, the fracture is more brittle with a lot of energy released from the fibrillation of the fracture sites. Slip bands are visible on the sample.
Raman spectroscopy [29] provides an understanding of the destruction of the structure at finer scales. An absence of chain splitting, as well as an important dependence of the breaking stress on temperature and strain rate, and a sliding of the chains along the skeleton seem to lead mainly to the disintegration of the highly oriented structure. Chain slippage includes chain pull-out, crystal plasticity, and whole block slippage. To increase the number of chain segments loaded to their maximum capacity initially estimated at 6%, the presence of defects must be limited and sliding made more difficult. Limiting the presence of defects and slippage can be achieved by extending chains at higher draw ratios [29], at higher temperatures [154], by cross-linking chains by irradiation [155], or by chemical modification of the polymer backbone by introducing methyl branches [156]. The addition of methyl branches does not, however, affect the boundary slip of the grain. Also, the greater the number of methyl branches, the greater the strength and modulus [156].
The strength is therefore limited by imperfections and cracks. It depends not only on the covalent bonds but also on the morphology and dimensions of the fibers.
4.4.6. Creep Tests and Modeling
At finer scales, knowledge and understanding of the distribution of molecular stresses in the direction of solicitation and their temporal variation in creep and relaxation is necessary to approach the nature of the strain mechanisms. Raman spectroscopy makes this possible [29]. In multi-stress creep tests, the modulus increases for 30 s and then decreases. Microscopically, this can be attributed to competition between several mechanisms including slippage of highly stressed chains or microfiber pieces, unelastic strain, and elimination of deformation heterogeneities. The increase in modulus corresponds to the straightening of the taut tie molecules between the crystalline blocks, which is reversible, and the elimination of defects present in the structure. However, as soon as these molecules are pulled from the blocks they join; the strain becomes non-reversible. Thus, when the stress on the taut tie molecules exceeds the acceptable limit, the pullout of the chain leads to the creation of a defect that will move until it encounters an obstacle such as an entanglement for example. In this case, stress can increase.
At the macroscopic scale, the creep properties of UHMWPE fibers were also examined. They are also highly dependent on temperature, time, and stress. Indeed, a decreasing exponential reflects the dependence of strain rate on temperature [25,32]. Some authors then focused on modeling creep characteristics. Thus, a simple model in which two processes are activated in parallel was suggested to translate the creep behavior at the equilibrium of UHMWPE fibers as well as stress relaxation. This model was first developed by Wilding and Ward [40,65,111,112] for melt-spun drawn fibers and further investigated by Sweeney and Ward, and Kein et al. [153] among others and expanded to solution spun-ultra drawn fibers [25,32] and is also able to predict the behavior over short times. Sweeney and Ward [153] pointed out that this model was relevant over a certain stress range, between 150 and 280 MPa. However, even if the model initially developed is not perfectly accurate, the stress transfer process corresponds well to what happens in the case of viscoelasticity. A more complex model with a multitude of thermally activated Maxwell branches could represent stress relaxation as well as creep. Some branches would be relieved while others would be more stressed. A two-branch model was then the first approximation, and the parameter values of these branches would depend on the stress loading. Assuming constant parameters was not relevant. Assigning to strain-hardening the particularity of the UHMWPE behavior was first done and then it was considered that the behavior was related to stress transfer between two thermally activated processes.
The final mathematical model built up, can depict the behavior at any load and given temperature [153]. As a reminder, the deformation then decomposes additively. The distinction is made between a recoverable linear viscoelastic component and a non-recoverable non-linear component and can be related to morphological considerations.
The first term dominates for short load times, low-stress levels, or low temperatures. The second term prevails for long times or high stresses and temperatures. Non-recoverable deformation can be identified by creep tests. With this model, the criteria for selecting the fibers, for application to structures, are not changed because the failure will occur over short loading times [12]. For short loading times, stress does not influence the strain. However, for longer loading times, stress affects the creep rate stage. A power law can represent this dependence. The slope of this law is independent of the temperature [12,46]. The temperature dependence of the non-recoverable component can be described by a single thermally activated (Eyring) process [40,46,111,112]. The activation energy of this single process is very similar to whether the samples are cross-linked or not and are homopolymers or copolymers [111]. It is similar to that of alpha dielectric relaxation. A relationship including the diffusion of warp defects in the crystalline regions is then assumed. If stress is applied, this 180 °C rotational movement or translation of the crystalline rod through a lamella can cause chain slippage [46]. Govaert and Peijs [46] introduced a plastic strain to be able to speculate a yield strength for constant applied strain rates. At low temperature/high strain rates, the estimated yield strength is sometimes higher than the strength of the material. Fiber breakage then occurs before the yield strength. A power law can describe the variation of the stress relaxation modulus to time.
Both terms are equally affected by the draw ratio and molecular weight [111]. For fibers with large molecular weights, made from a copolymer or an irradiated polymer, the unrecoverable part of the creep is negligible below given critical stress, the flow process does not take place. An identical influence of high molecular weight and cross-linking is explained by the presence of junction points in the networks, entanglements, and chemical cross-linking which reduce the creep sensitivity. This term decreases as the draw ratio increases or the molecular weight decreases because the degree of strain hardening is reduced [40]. Increasing the draw ratio results in the removal of obstacles such as the lamellar structure. The non-recoverable part is then considered as a prolongation of the drawing. At low molecular weights, creep is achieved by sliding a crystal which leads to the removal of a folded chain. In this case, a greater deformation of the lattice can be achieved by the plastic strain of the crystalline regions. Whereas for larger molecular weights, creep is attributed to the stretching of entanglement or the breaking of a taut tie molecule, localized between the crystals and a higher strain is necessary to destroy or break the entanglements to which the lattice is connected in the first place. These parameters (draw ratio and molecular weight), on the other hand, have only a little influence on the term related to the recoverable viscoelastic behavior [40].
Thus, the model proposed and taken up by various authors [40,46,111,112,153] allows both long-term and shorter-term creep behavior to be translated and is related to molecular considerations. The irreversible part is related to the sliding of the chains in the crystals while the reversible part comes from the entropic nature of the chain segments, related to imperfect chain extension.
A Bayley-Norton-type exponential creep law was proposed by Kromm et al. [23] to be able to predict creep strain without necessarily having to consider the distinction between recoverable and non-recoverable parts. The different parameters were determined from creep tests carried out at several temperatures and loads. The function that related strain to time was linear up to rupture because there is no tertiary creep. This suggests an exponential growth of the strain rate up to the melting temperature, although the tests were only done up to 100 °C here, following the work of Dessain et al. [24] (Figure 33). This non-linearity was also noted by Berger et al. [29]. The changes in behavior linked to a dependence of stress and temperature are attributed to the solid phase transformation characteristic of an orthorhombic to hexagonal structure, which induces strain rates much higher than those observed at lower temperatures. The stress to be applied to obtain these changes in the structure as a function of temperature can be established [24]. These crystallographic modifications are also evidenced by inflection points on the strain at break curves as a function of the applied stress and the lifetime of the specimen as a function of the same stress and at different temperatures. Following creep tests conducted at different temperatures and stress levels, Roiron et al. [114] performed a time-temperature-stress level superposition by adapting WLF (Williams, Landel, Ferry) law to reconstruct the creep behavior of Doyentrontex® yarns at room temperature at 40% of the stress leading to failure at this temperature. From dead-load tests, Smook et al. [37] showed an exponential dependence of the lifetime with the applied load.
4.5. Relation between Mechanical and Physical Properties: An Overview
The analysis of tensile, creep and dynamic performance demonstrates the viscoelastic behavior of the fibers and the effect of temperature. The behavior of the fibers under different ways of stress can be explained by physical considerations based on different phases. More precisely, the orthorhombic-hexagonal solid phase transition, which occurs at approximately 150 °C without stress, changes the behavior of the UHMWPE fibers. Due to the ease with which the chains slide relative to each other in the hexagonal phase, flow is made possible. However, many factors influence this transition and the associated temperature, such as the application of stress, annealing, chemical modification (cross-linking, the addition of methyl branches), or factors related to the initial nature of the polymer, the process conditions, or even a combination of these factors. Concerning annealing, if it is carried out at temperatures below the melting temperature of the least stable phase little impact is observed. At higher annealing temperatures, the total enthalpy decreases, and the microstructural transition is restricted. Stress annealing seems to prevent this transition and lead to a transformation between the orthorhombic and monoclinic phases. The application of stress proves to shift the melting temperature of the characteristic transition phase to higher temperatures and the start of recrystallization into a hexagonal phase. The imposed stress stabilizes the fibers thermally and increases the interval over which the fibers, in their orthorhombic phase, can be used. A chemical cross-linking method also makes it possible to shift the temperature at which the damaging phase transition occurs to higher temperatures. The presence of defects also has an impact on behavior. It is strongly linked to the drawing process and its parameters, which allow the transformation of a polymer into an oriented reinforcement with unique mechanical properties.
The macroscopic behavior in tension, creep and DMA has been extensively studied. It is therefore possible to superimpose curves obtained from tensile tests at several temperatures and different strain rates. The displacement of these curves is, in the majority of cases, done according to a classical or modified Arrhenius law. It, therefore, seems more relevant to make the different parameters coincide when rearranging the curves with the same law.
So, mechanical and physical properties are intrinsically linked and understanding one requires understanding the other.
5. Conclusions
The contribution of this review lies mainly in the overview of the range of studied mechanical properties of UHMWPE reinforcements that it presents. Process parameters allow the production of more and more efficient reinforcements by limiting defects. The microstructure and mesostructure impact the physical properties through specific phase transitions and influence the thermomechanical behavior of the fibers. The yarn architecture plays an equally important role. This last parameter is all the more important when these yarns are embedded in a thermoplastic matrix that uses different processing methods. This review gives an overview of the possibilities offered by these fibers, which should allow engineers to consider them in multiple applications.
However, in light of this non-exhaustive assessment, certain gaps and prospects seem to emerge.
Indeed, regarding various articles in the literature, the influence of the choices made during the experimental protocol (the type of fibers, length of the sample, way of determining the deformation of the sample, alternative ways of testing fibers or yarns...) on the mechanical performances obtained underlines the need to redefine a common framework and perhaps a standard. Taylor and Clark [67] had already noticed in 1978 a difference of a factor of three between the mechanical properties of super-drawn PP filaments according to the test method and the strain rate. They then encouraged a careful comparison of the mechanical data of the filaments concerning the latter elements. Besides, the processes still have room for improvement to perfect the circularity of the fibers, which affects the cross-section to be considered as well as the cooling and thus the achievable structure and properties.
Moreover, considering the macroscopic behavior, using some superimposition to predict the behavior over a wider range of time avoids the cost in time and money of developing devices to carry out tests in conditions of extreme speeds, while obtaining trends such as those reported in the case of many tests carried out. This tool is interesting and could be used for future large-scale characterizations.
UHMWPE fibers, being made from PE, have a predominantly viscoelastic behavior but this behavior seems to become more complex depending on the test conditions. Therefore, to fully characterize this behavior, and in anticipation of numerical modeling, load-unload tests at different temperatures are unavoidable, and few papers deal with them, to the author’s knowledge. To fully understand the behavior and its transitions, more temperatures need to be tested, as well as more strain rates. Also, post-tensile or creep DSC tests could provide additional information on what happens at the morphological level under various test conditions. Indeed, structure, process, and property are closely related. The work to reveal the microstructure was mainly carried out at the end of the 20th century. Therefore, taking advantage of new test methods, such as in situ SEM or tomography testing, could lead to a better understanding of the deformation mechanisms and the structures involved. All these steps are important for future work on numerical modeling of self-reinforced polymers, for example, in which UHMWPE reinforcements would be integrated. Since, as soon as a composite is stressed in the direction of the reinforcements that make it up, these govern the behavior. If SRP structural parts are subjected to cyclic loading, then a complete understanding of the behavior of the reinforcements under repeated loading is essential. Therefore, another perspective could be to study the fatigue behavior of UHMWPE fibers and analyze the occurrence of possible self-heating.
Author Contributions
Methodology, C.R.; validation, C.R.; investigation, C.R.; writing—original draft, C.R.; writing—review and editing, C.R., E.L. and J.-C.G.; visualization, C.R.; conceptualization, E.L., J.-C.G. and N.G.; supervision, E.L., J.-C.G. and N.G.; project administration, N.G. and C.V.-G. All authors have read and agreed to the published version of the manuscript.
Funding
This research received no external funding.
Institutional Review Board Statement
Not applicable.
Informed Consent Statement
Not applicable.
Data Availability Statement
No new data were created or analyzed in this study. Data sharing is not applicable to this article.
Acknowledgments
The authors would like to thank the Corporate R&D Department of the Total Group for its support for this research, as well as the ANRT.
Conflicts of Interest
The authors declare no conflict of interest.
Appendix A

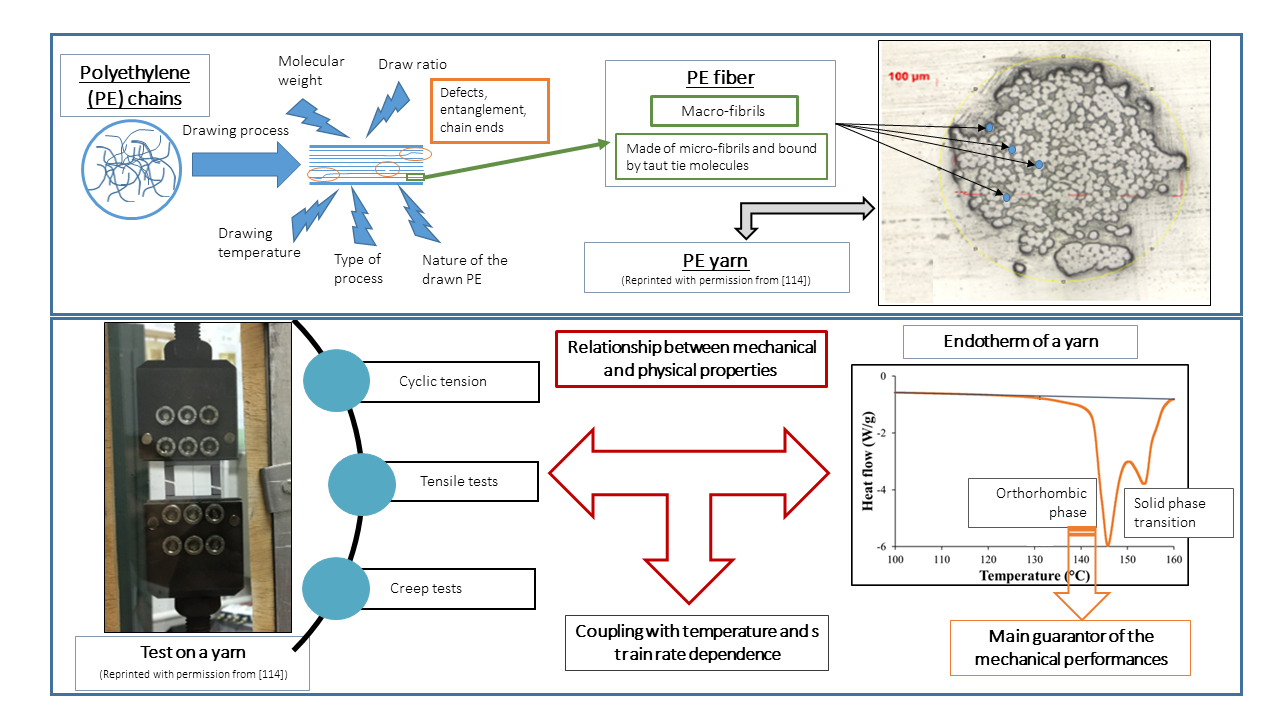
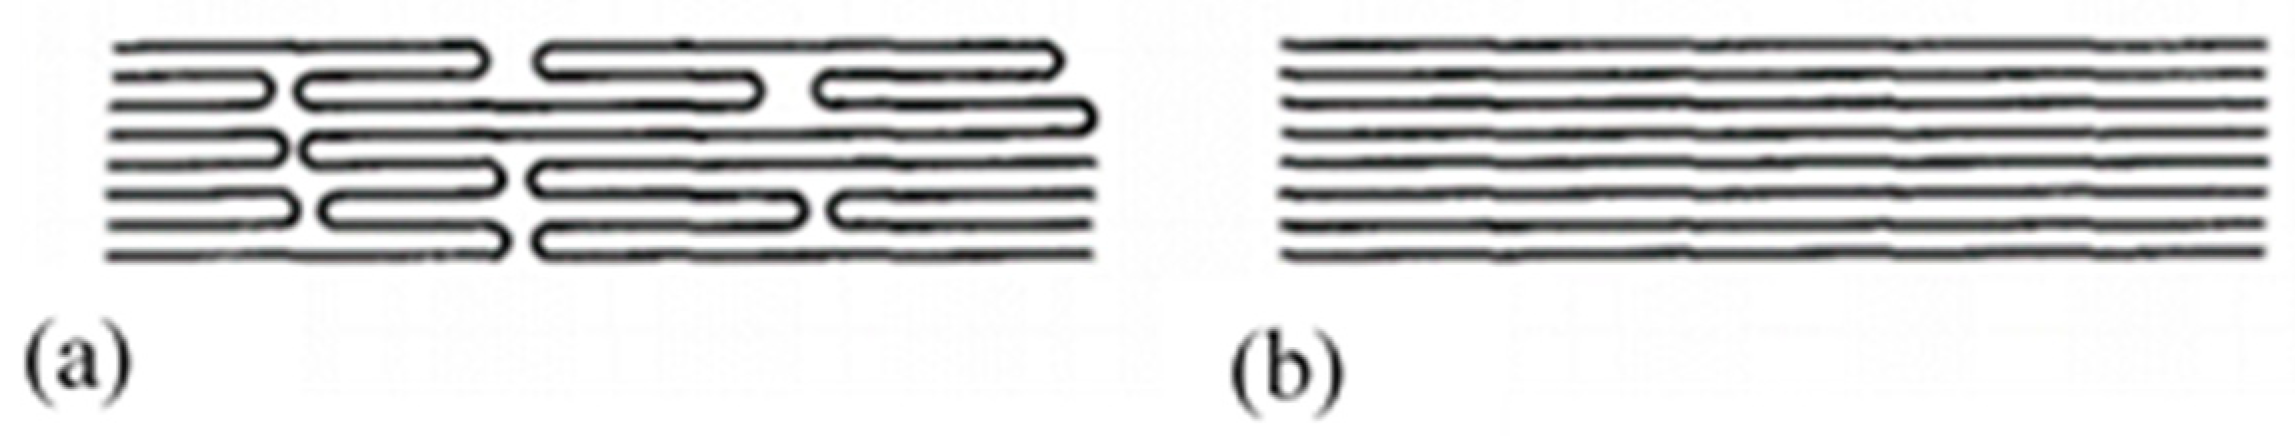
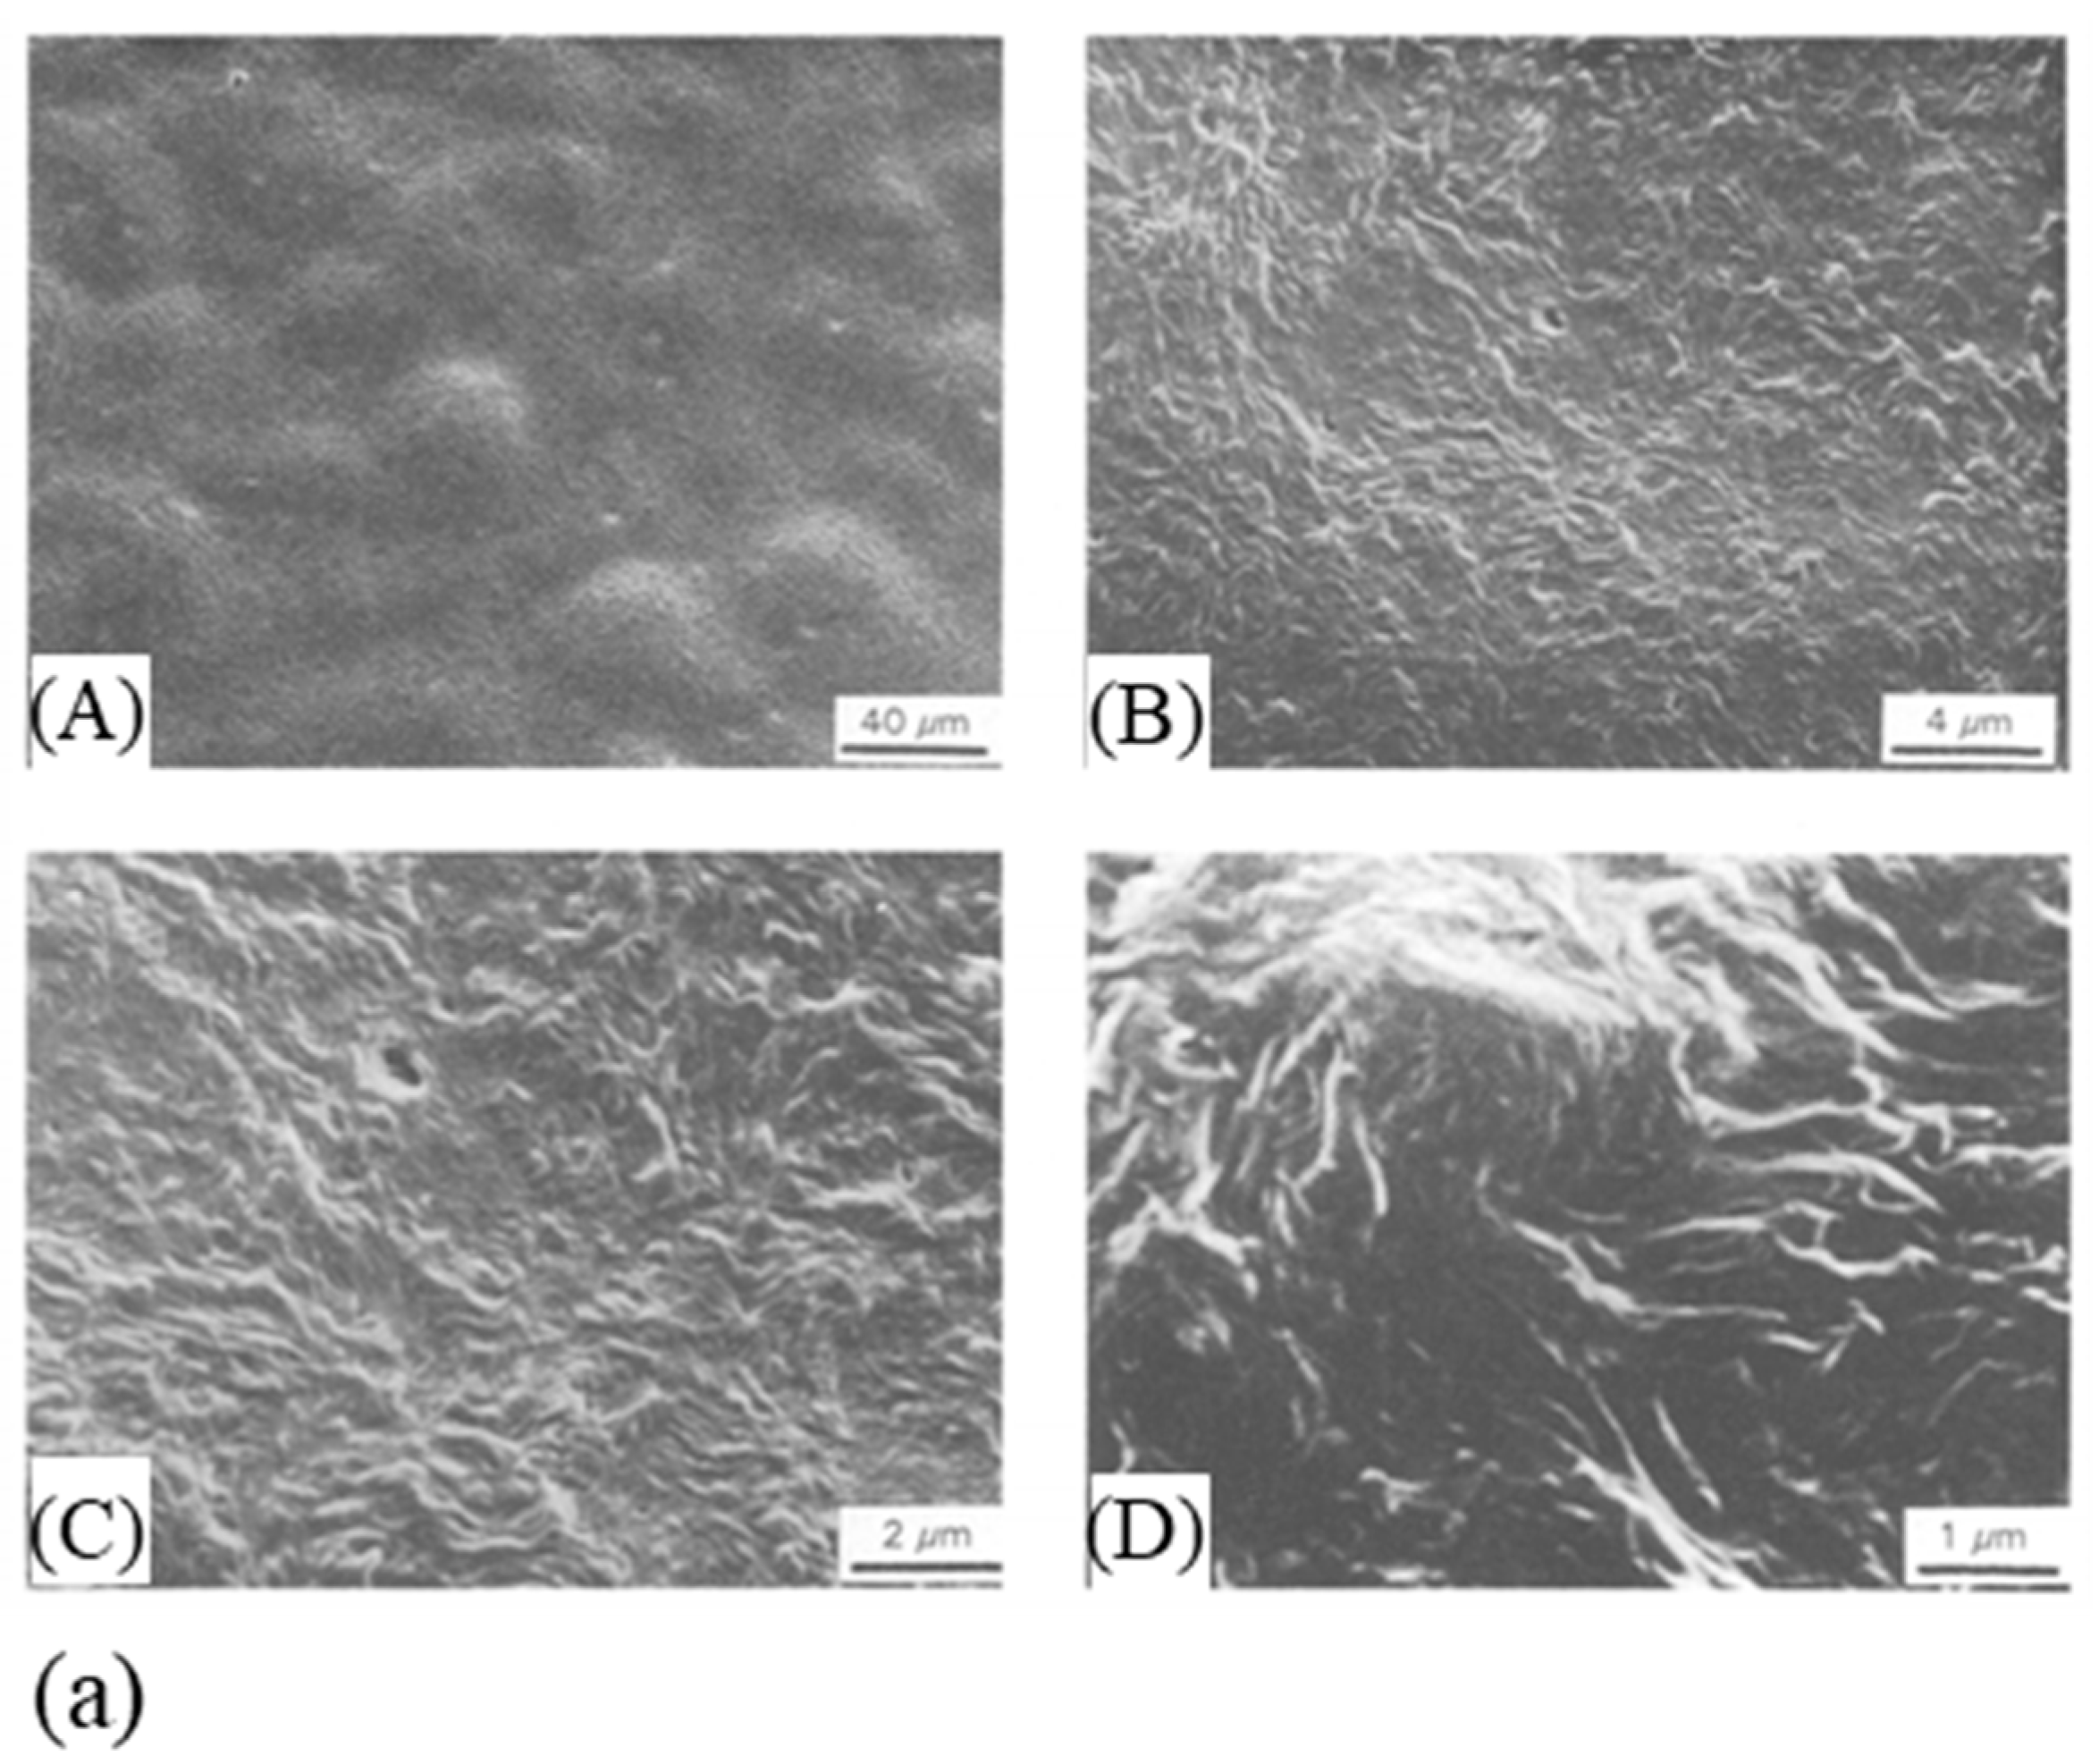
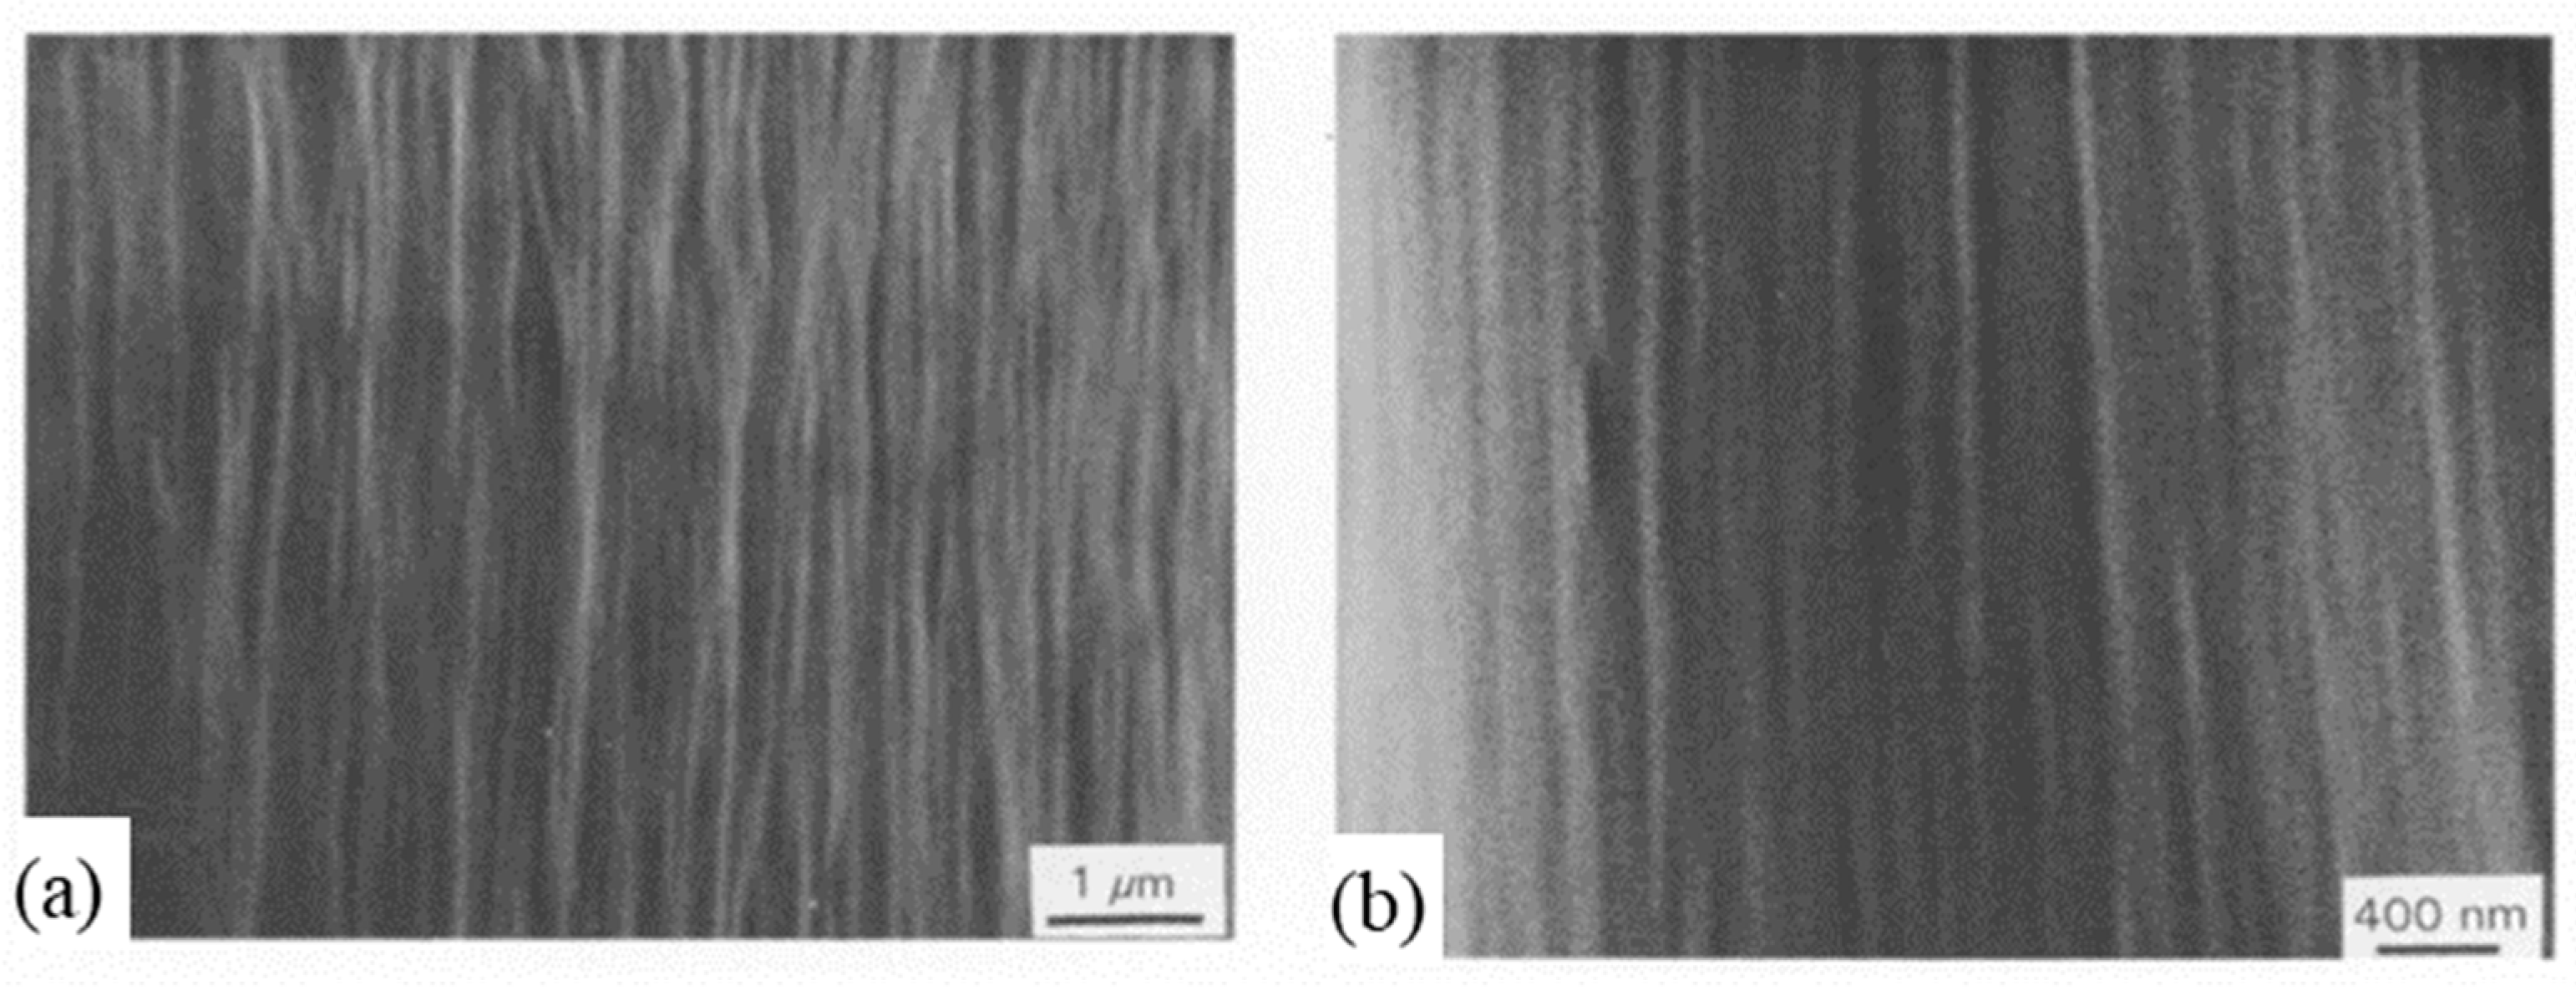
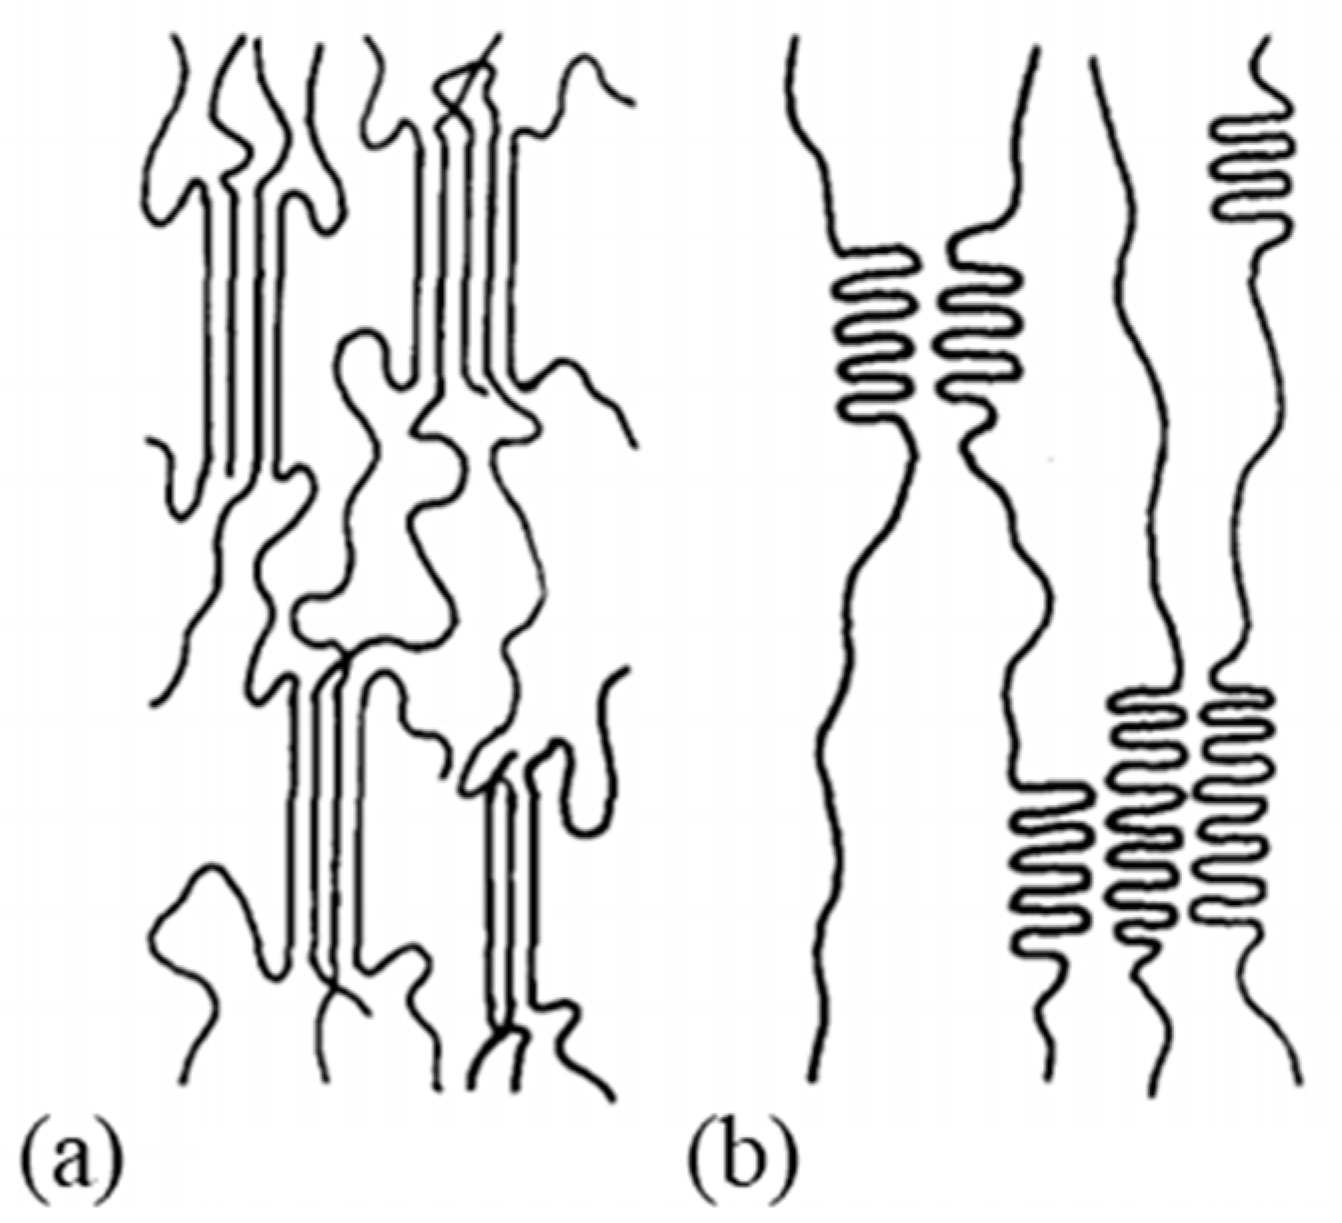
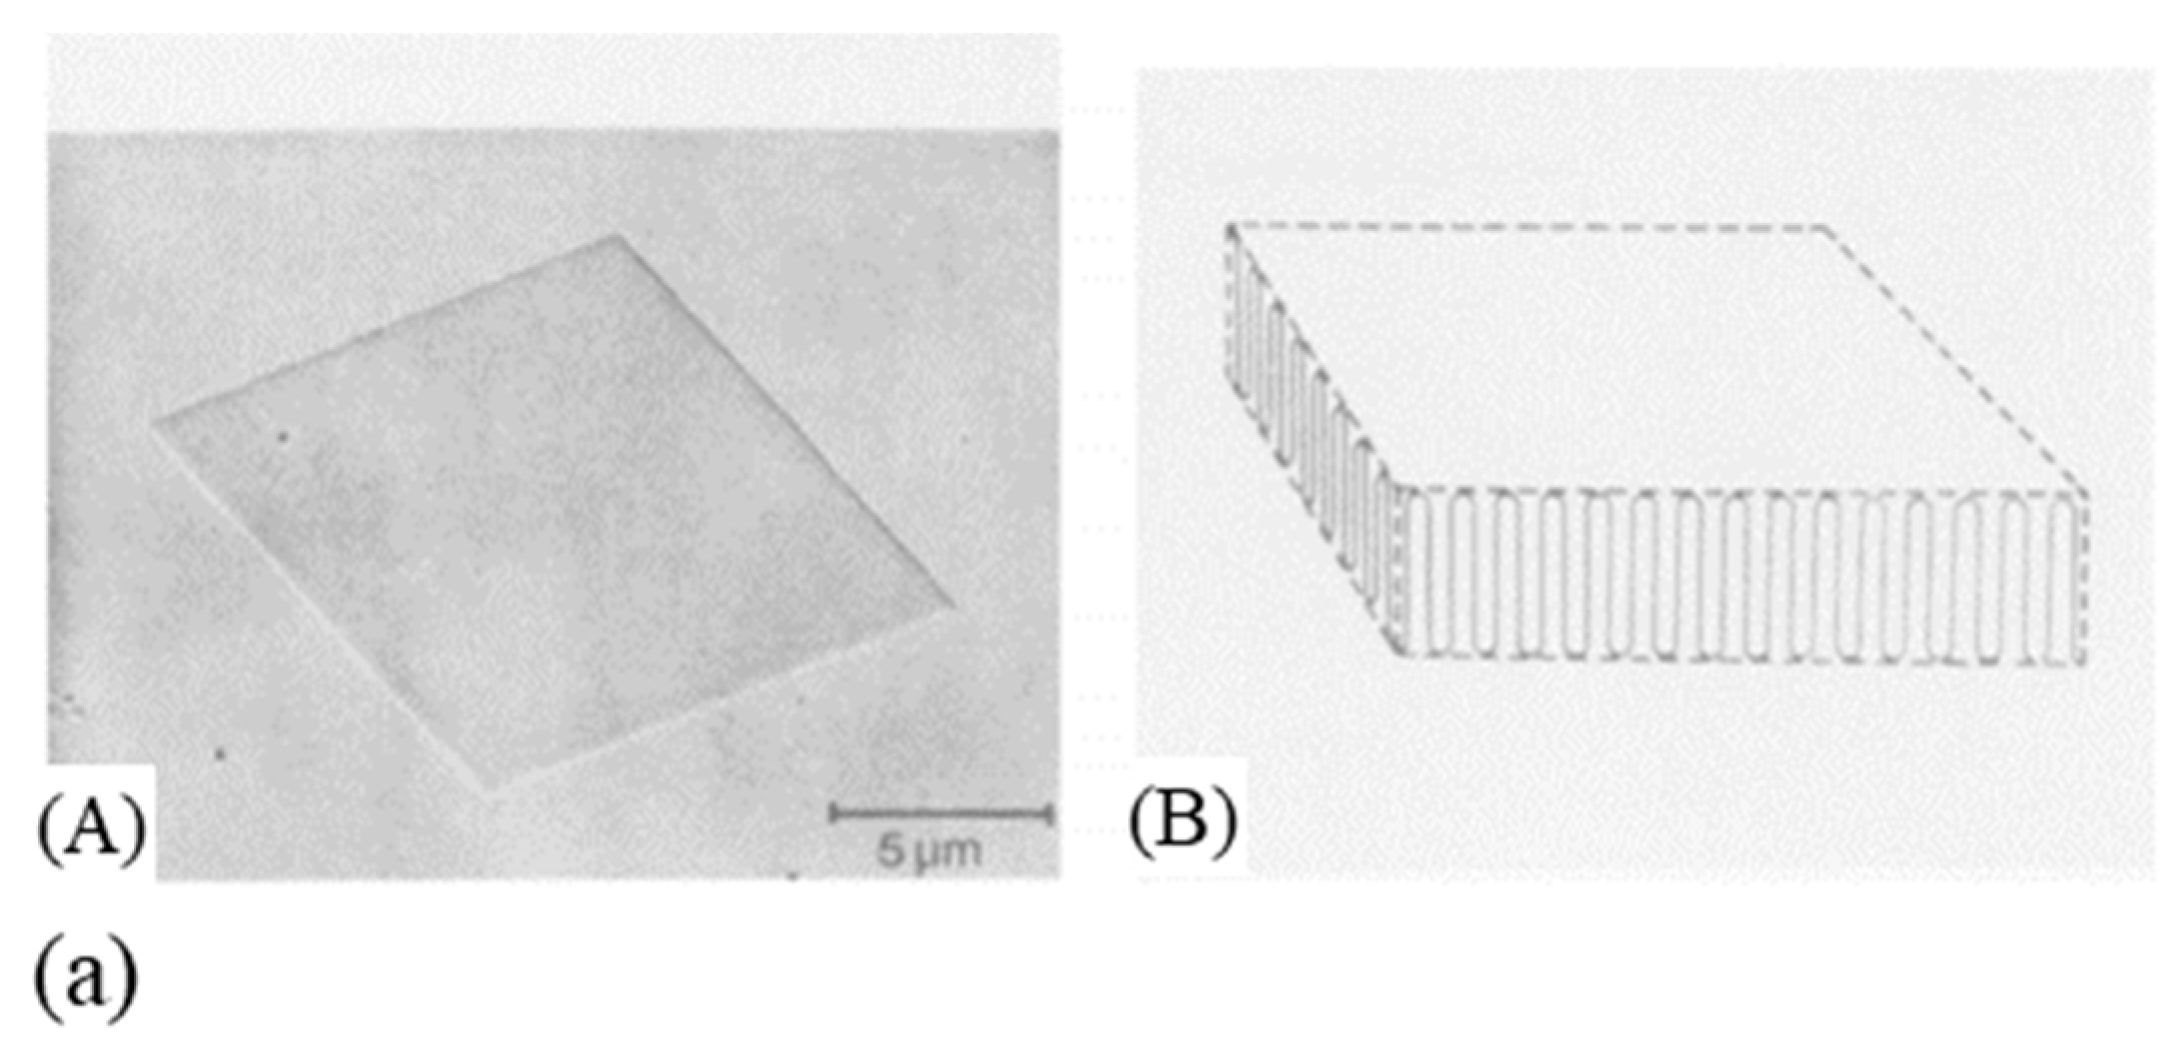
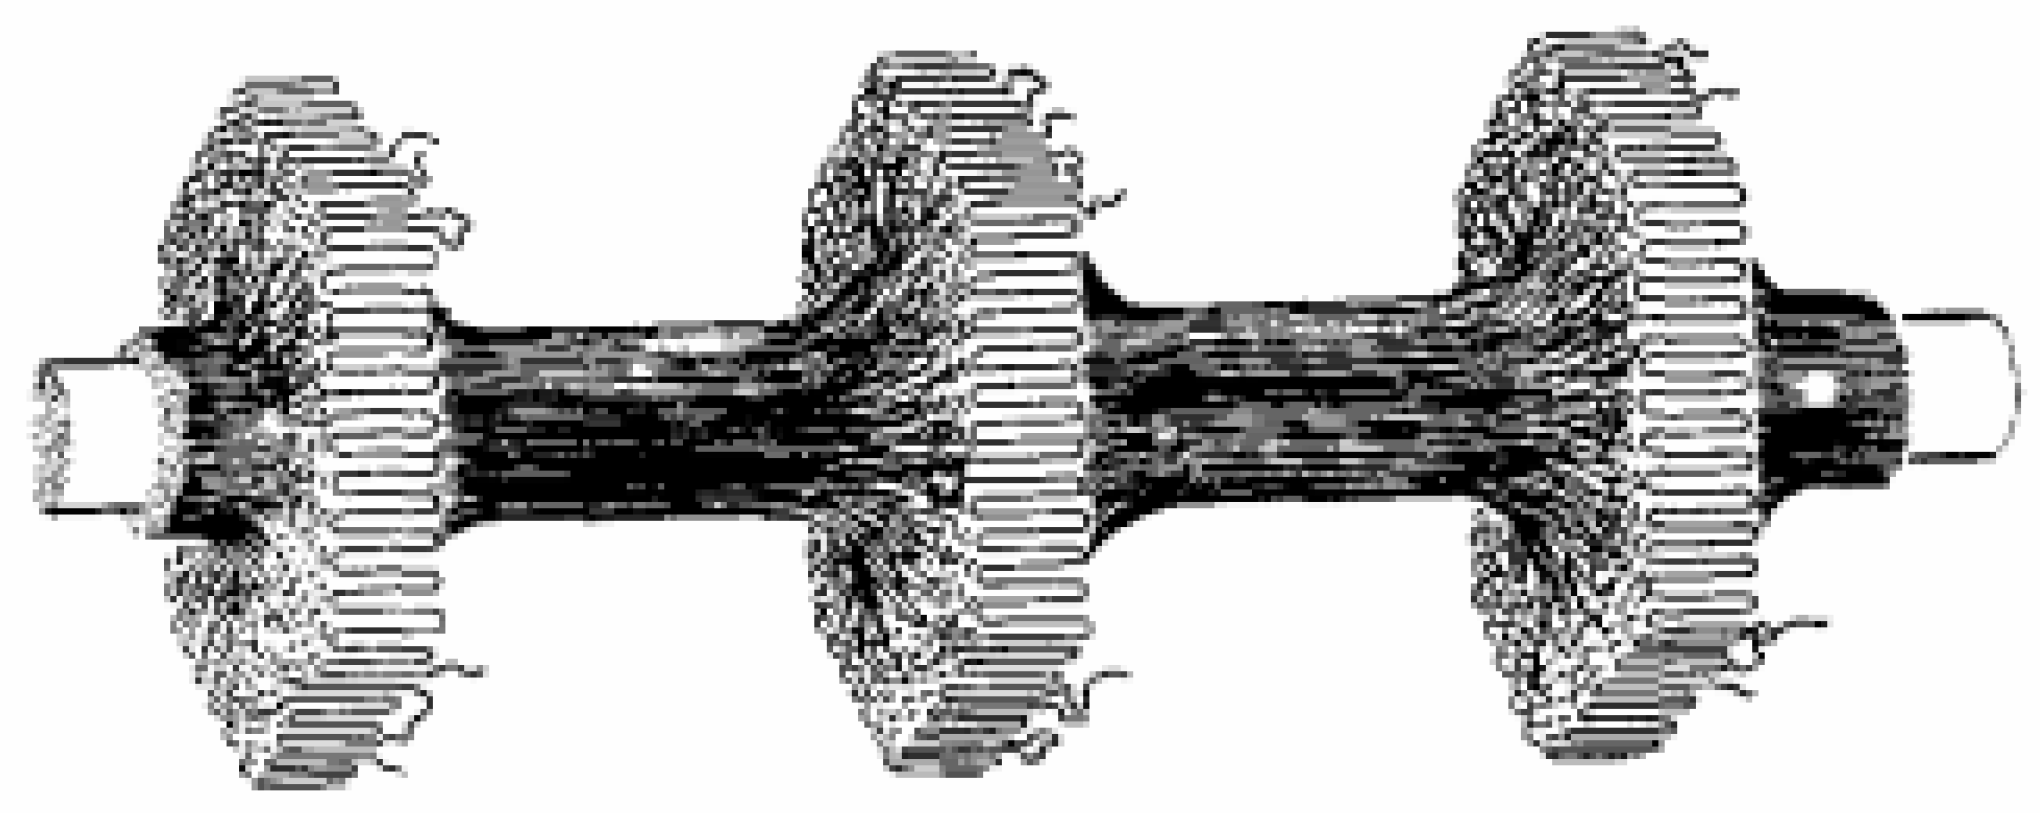
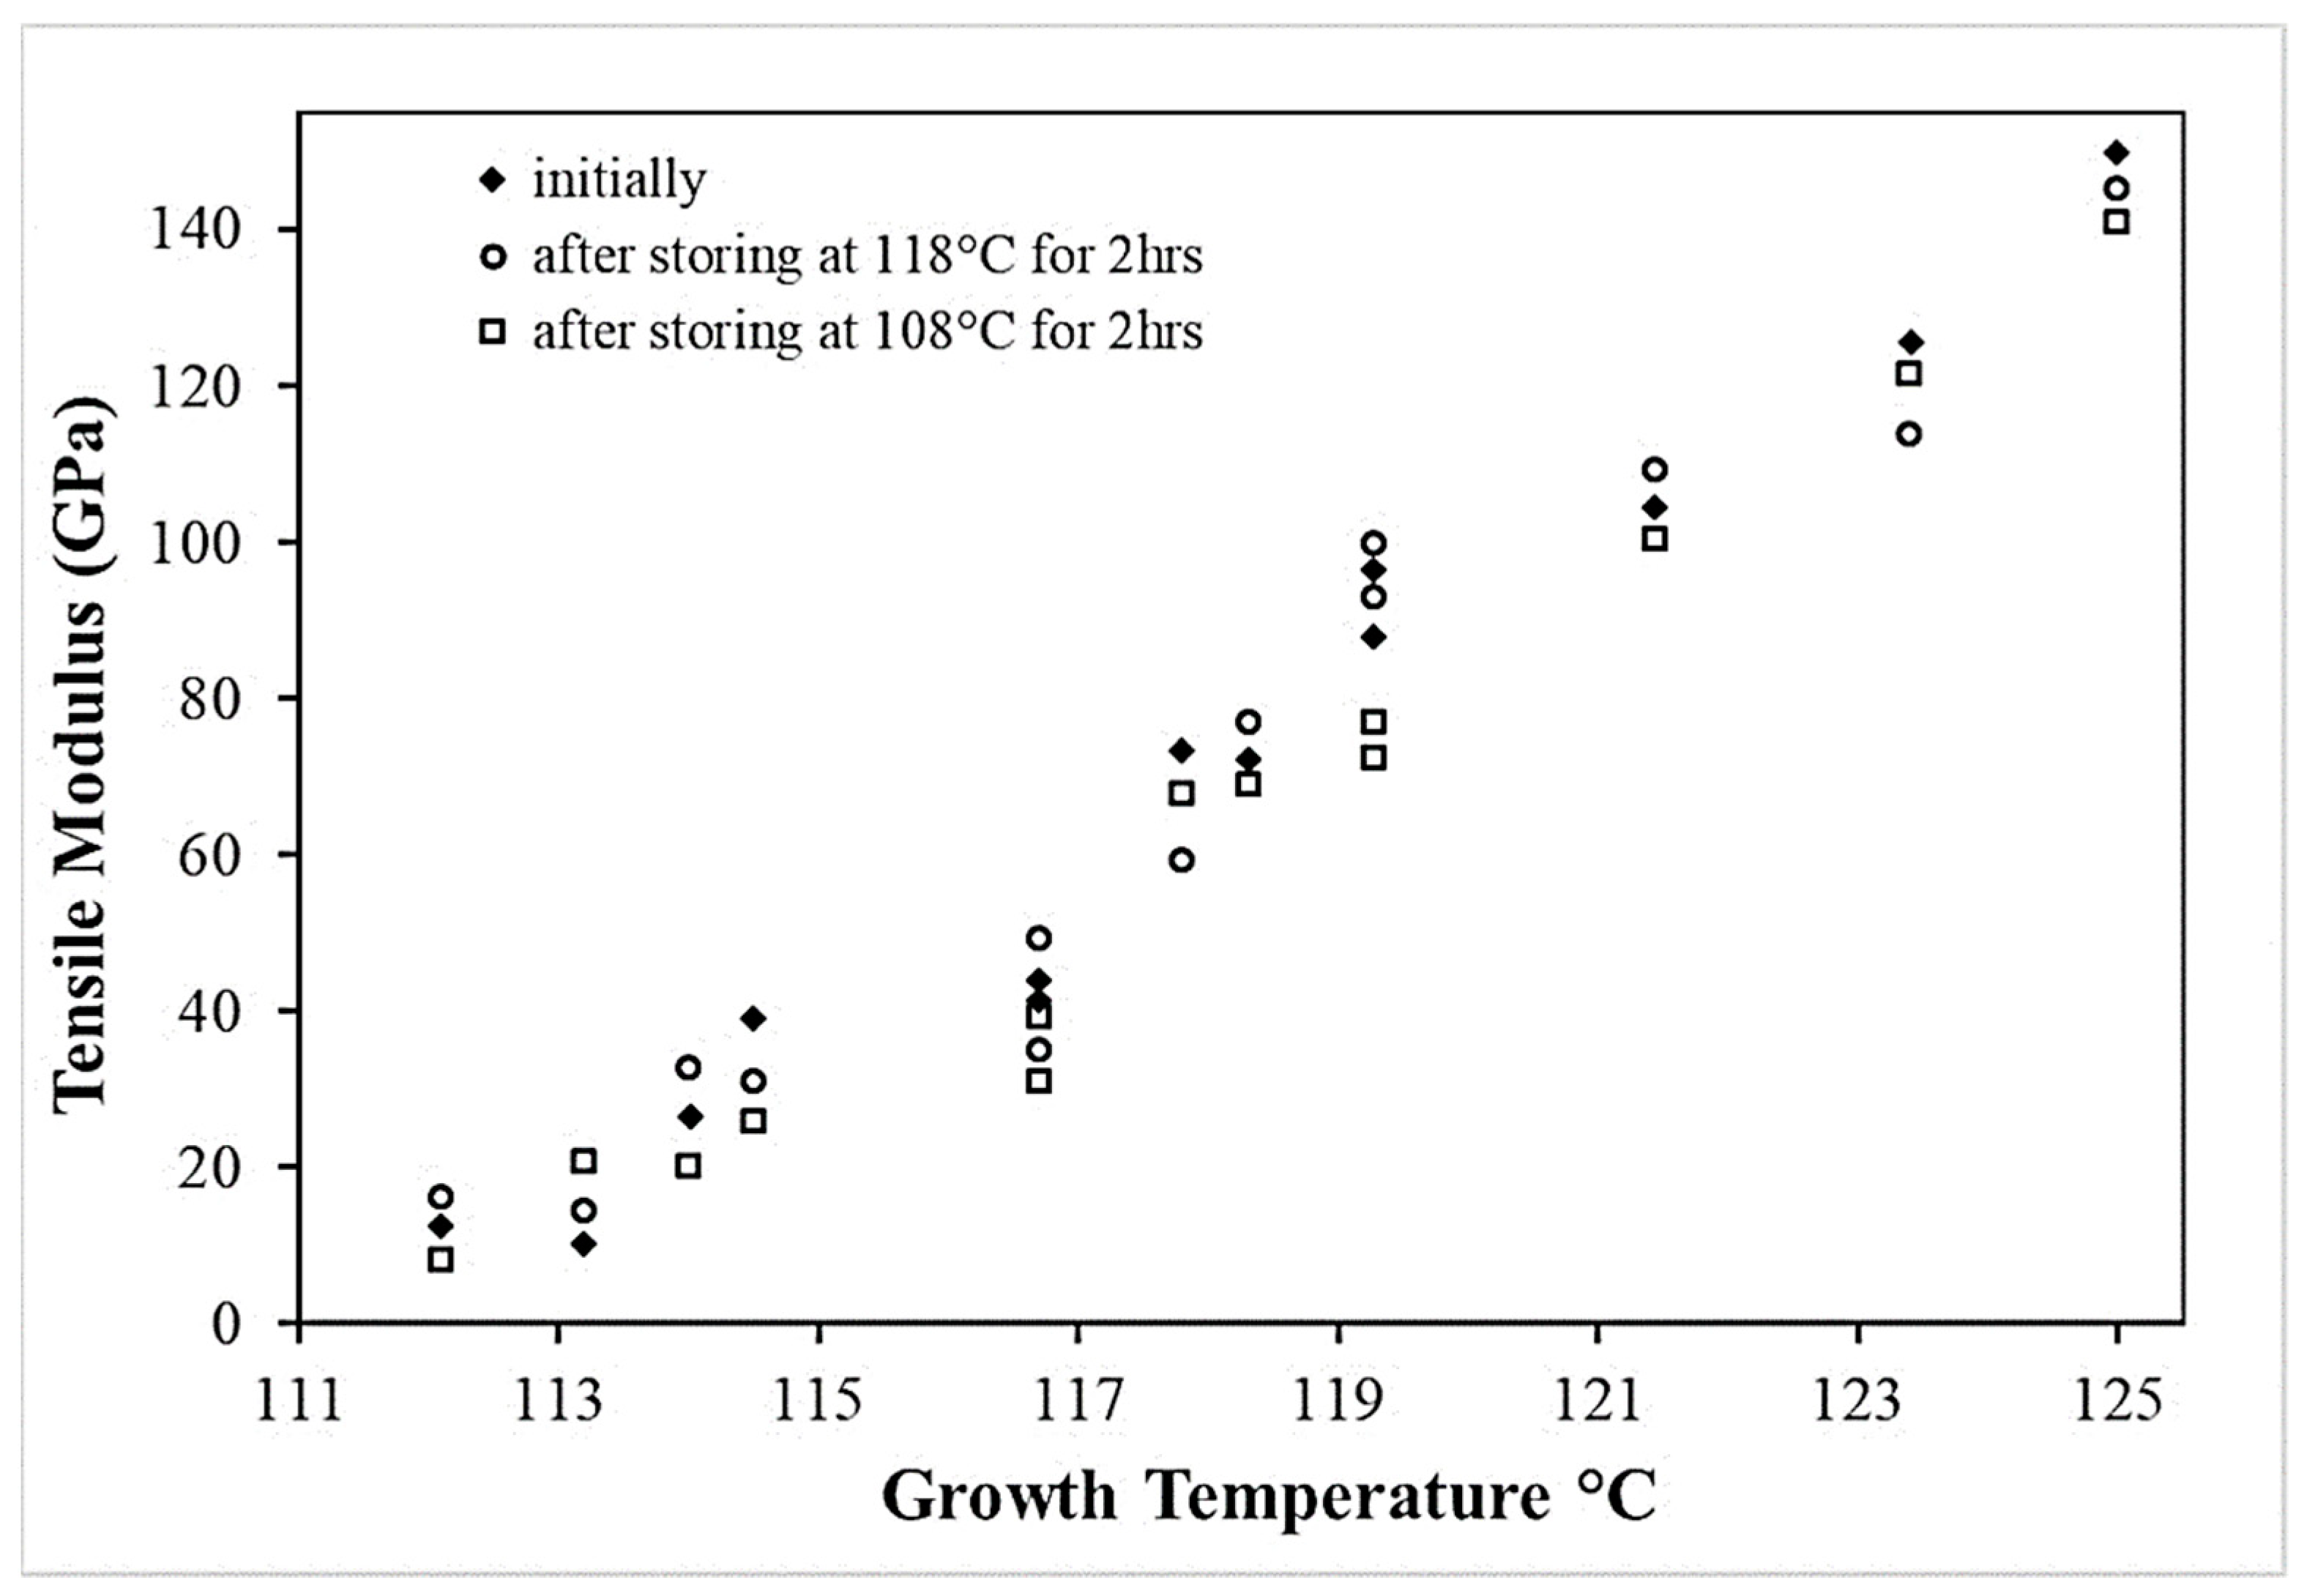
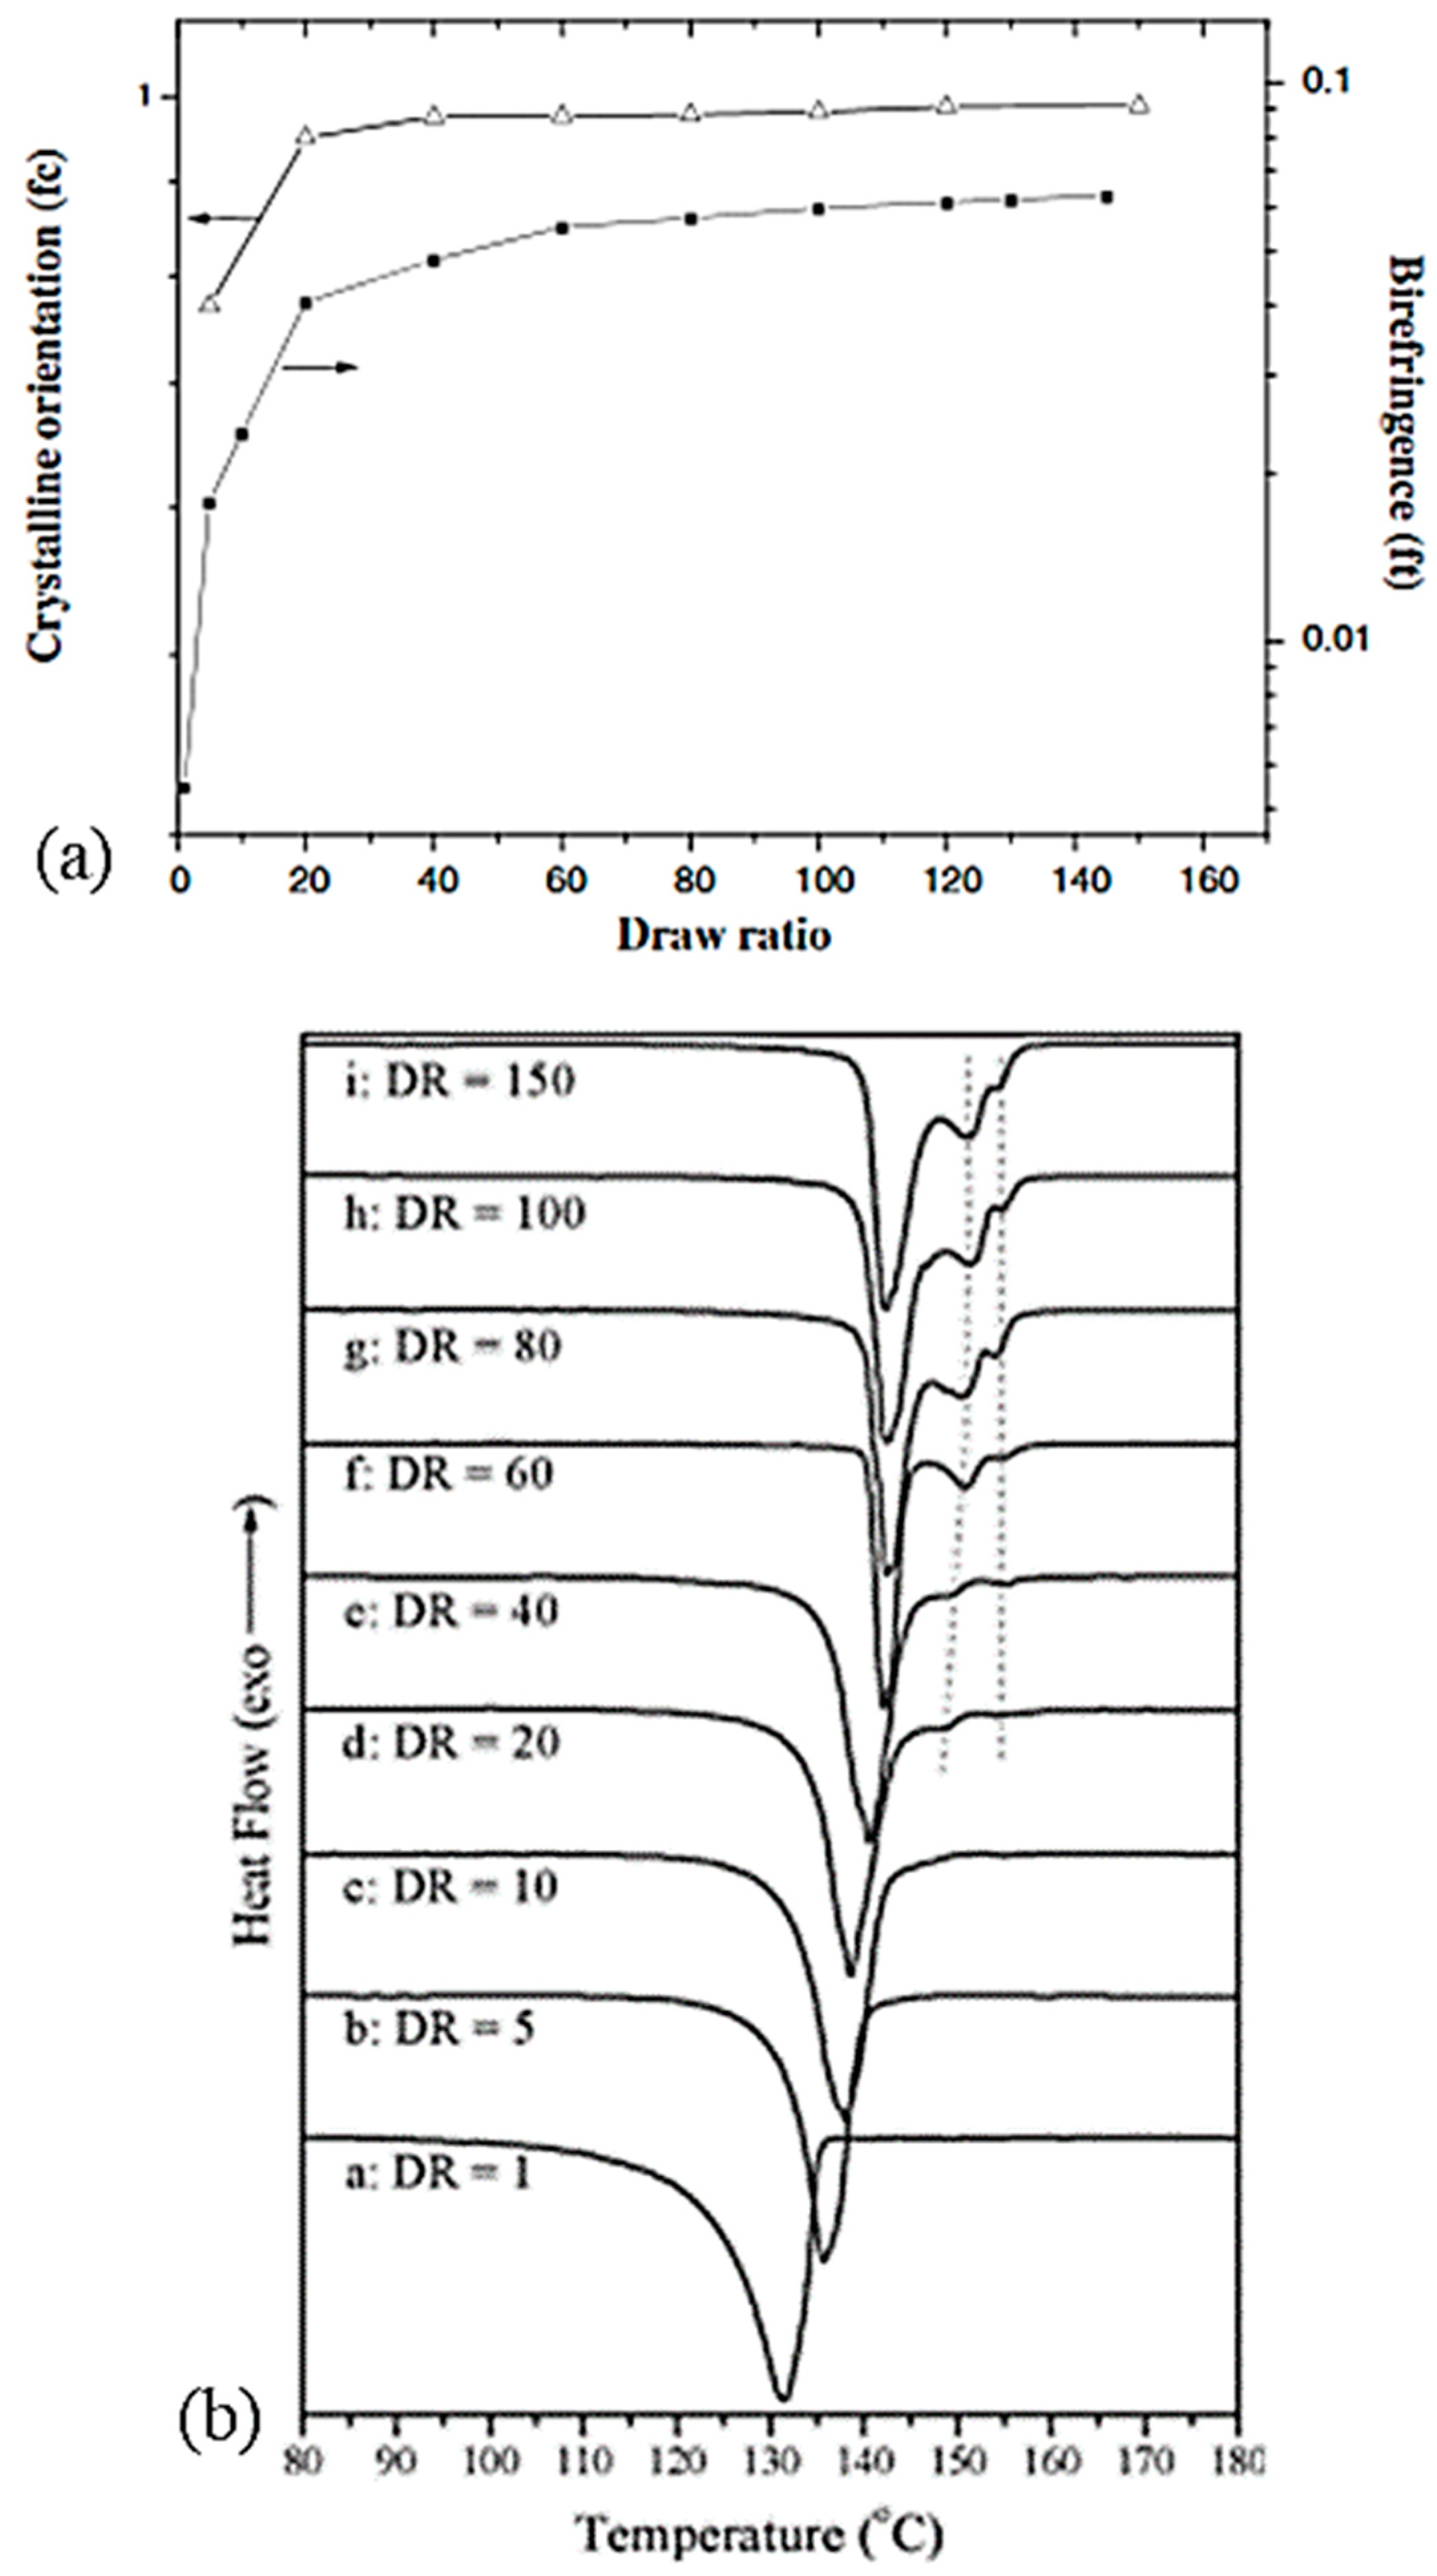
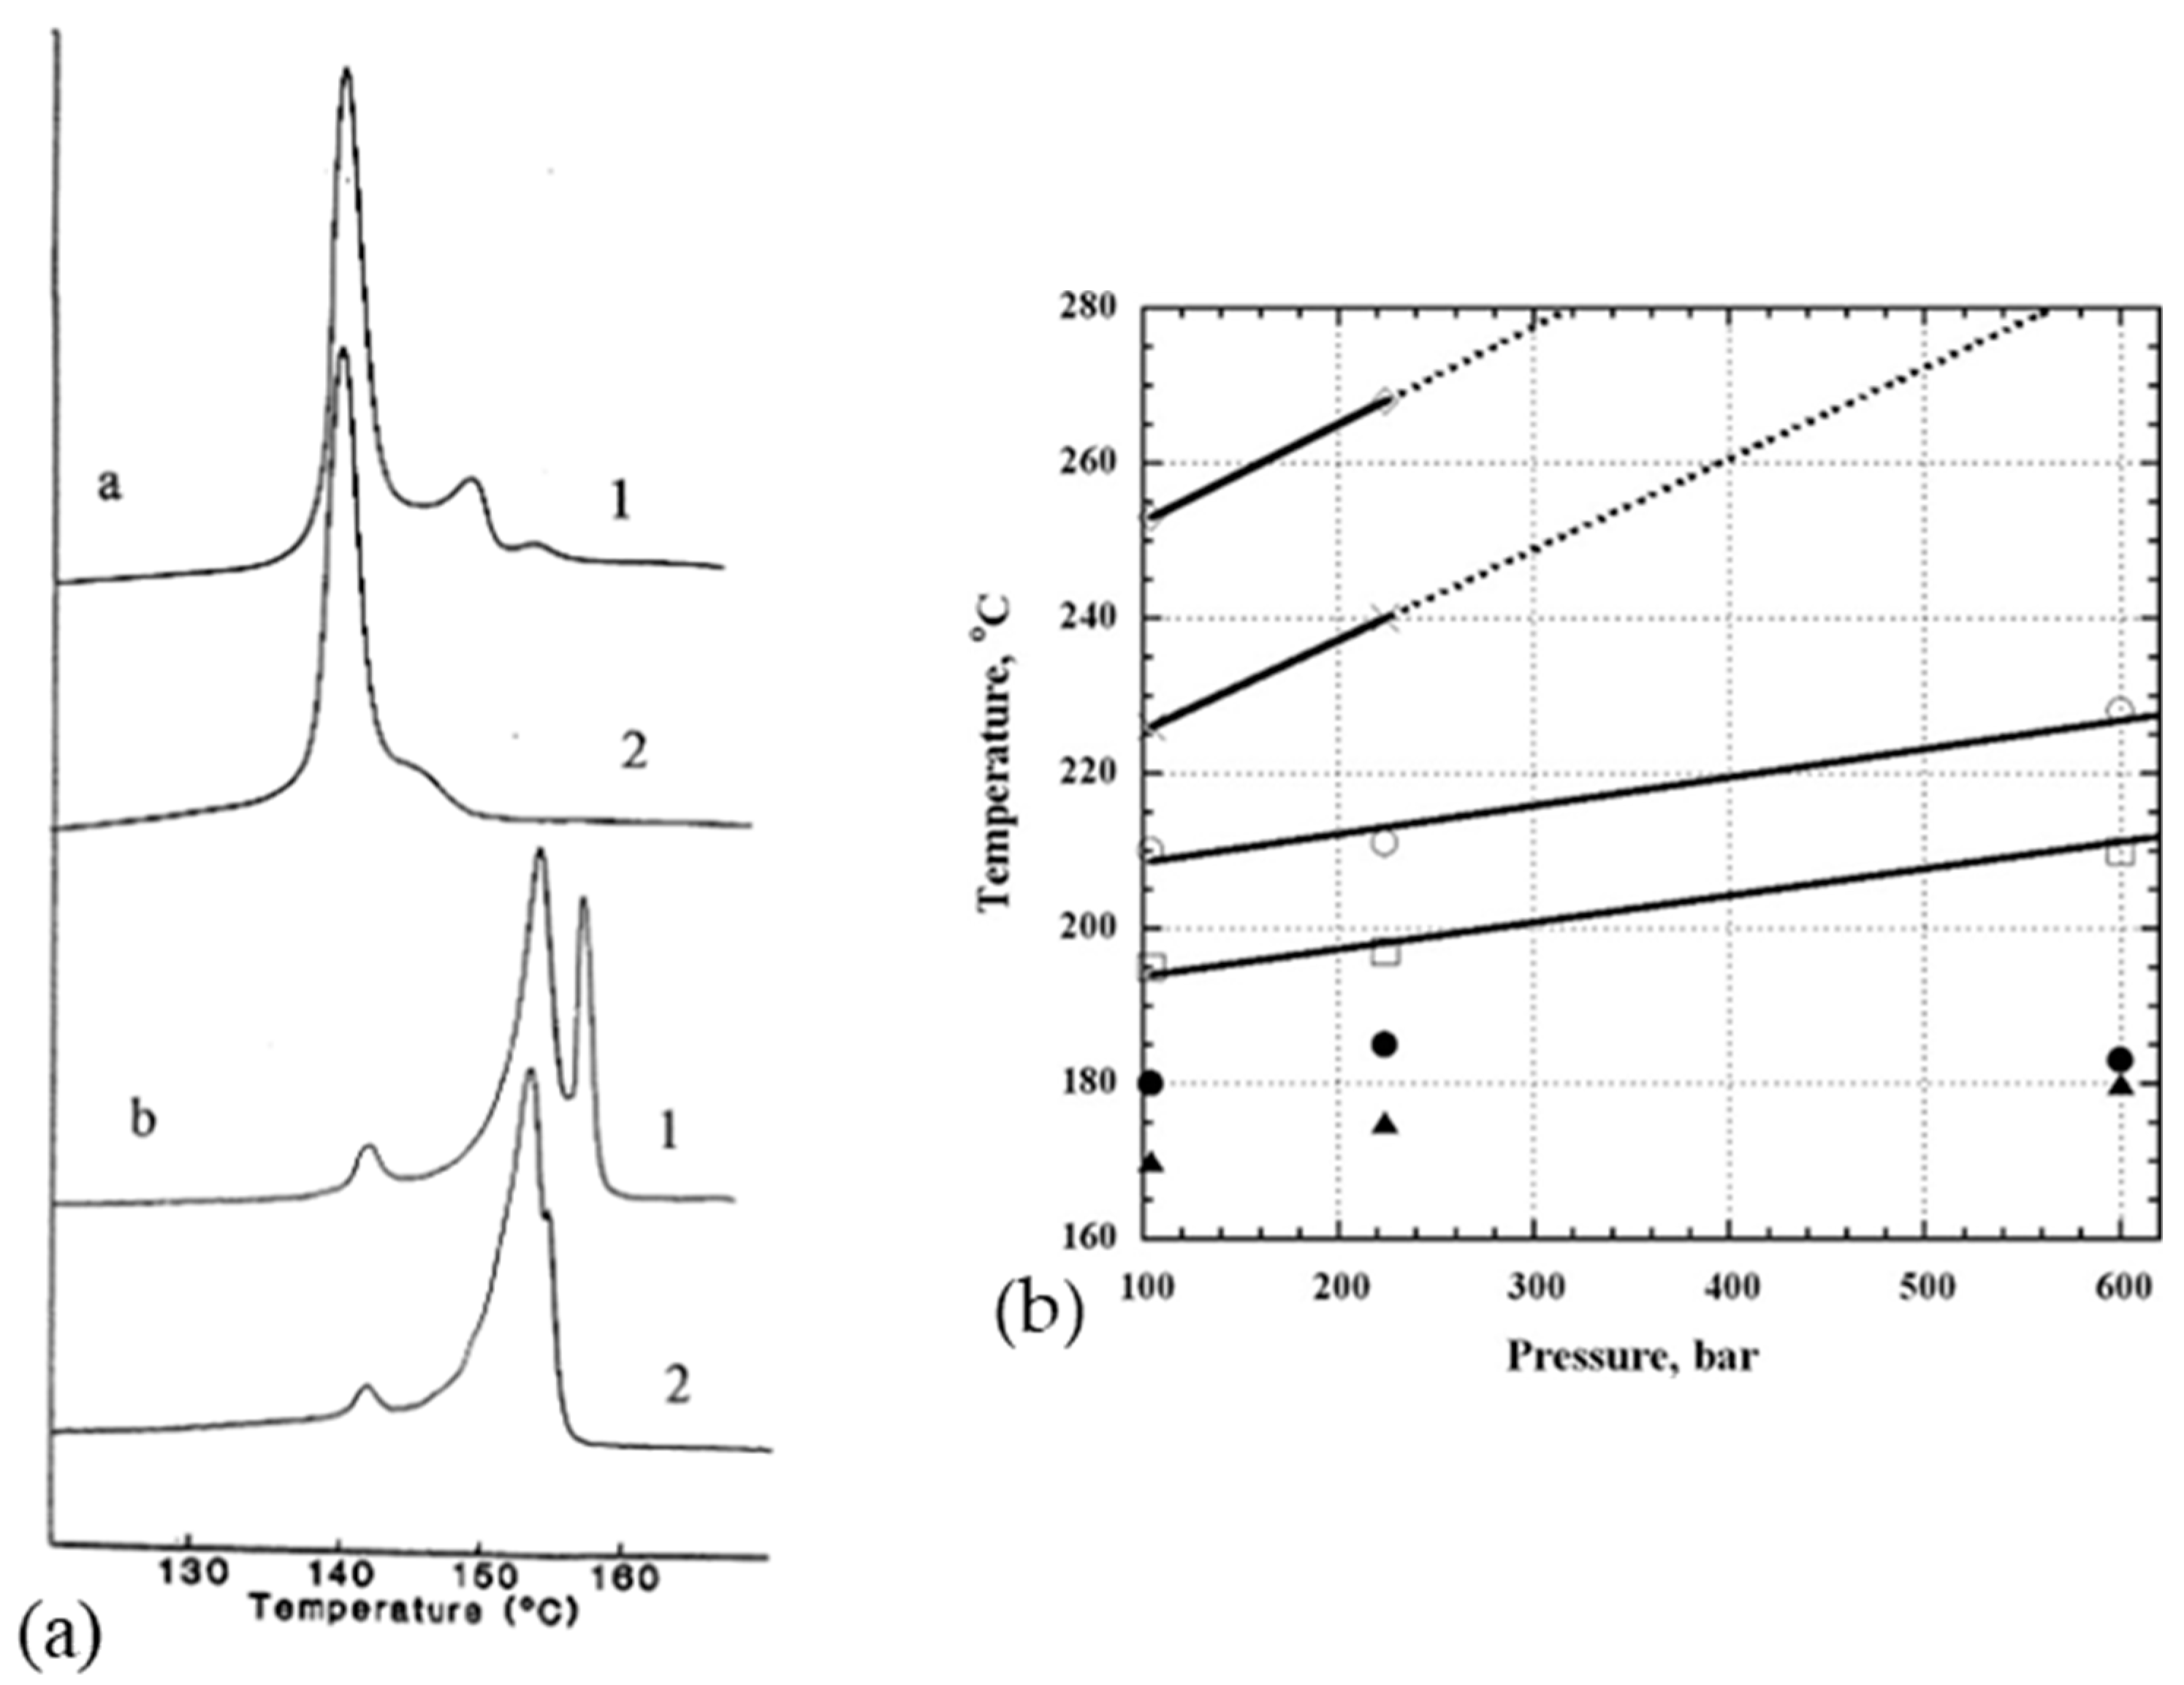
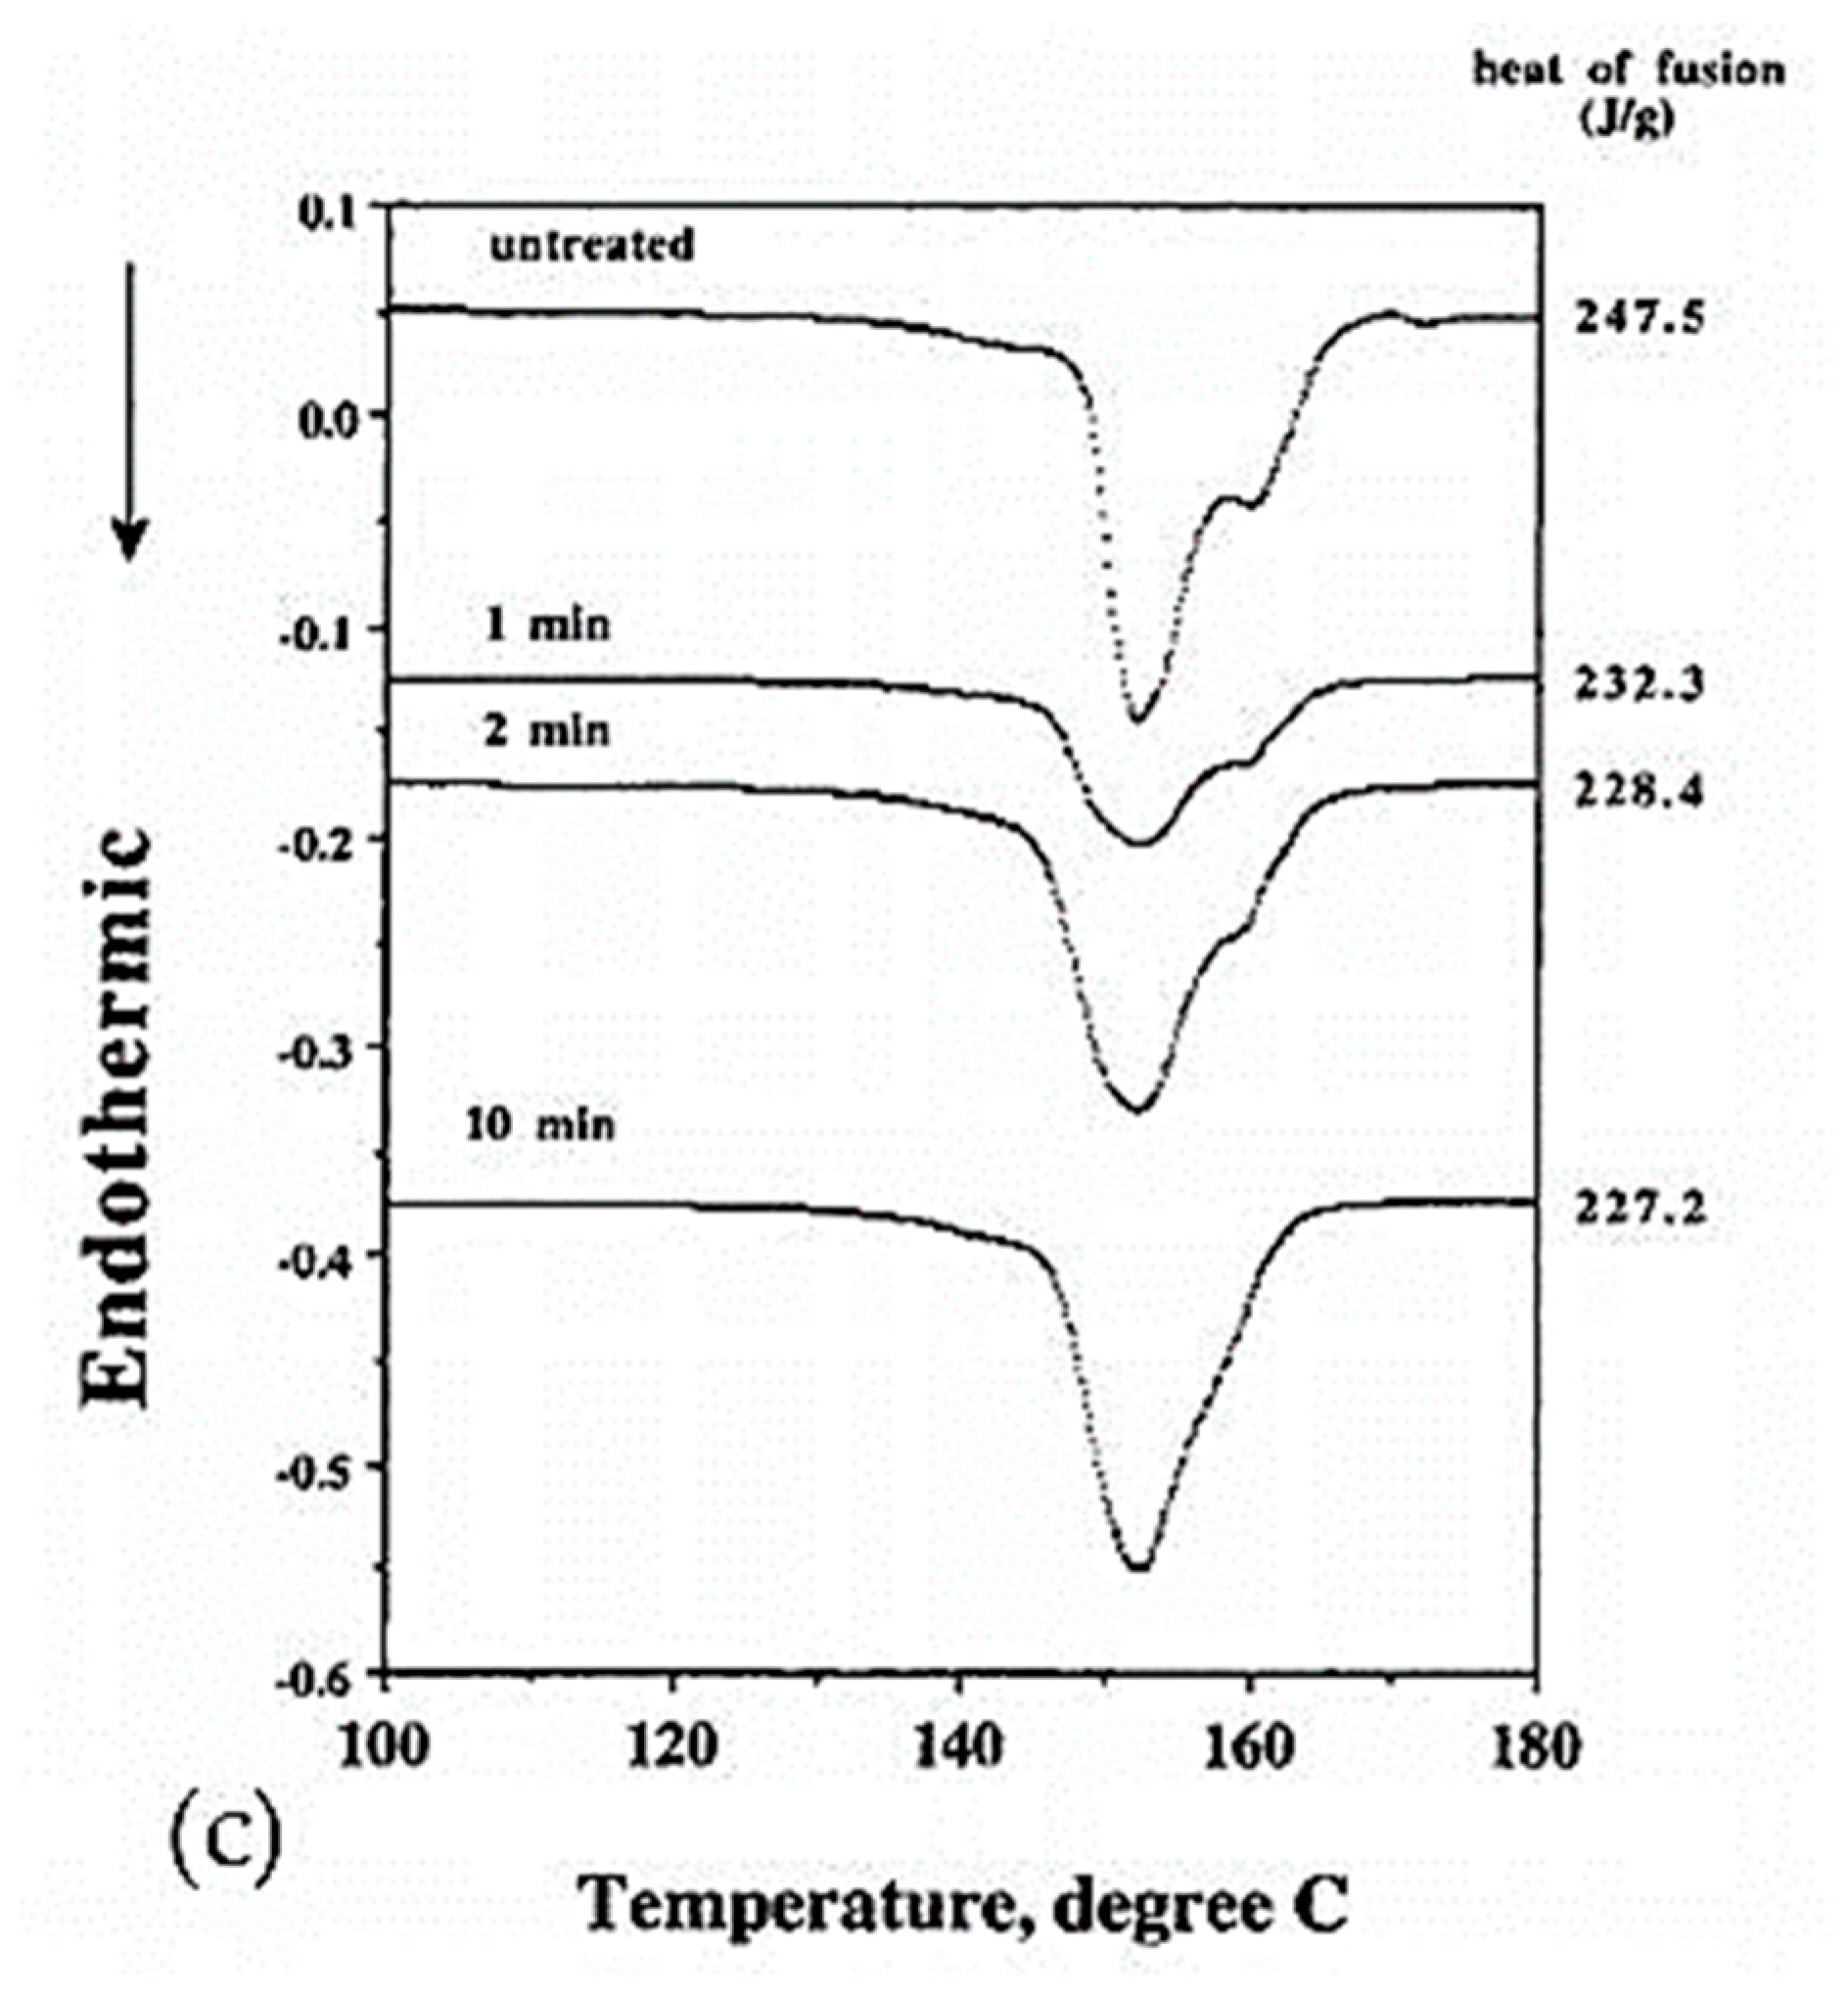
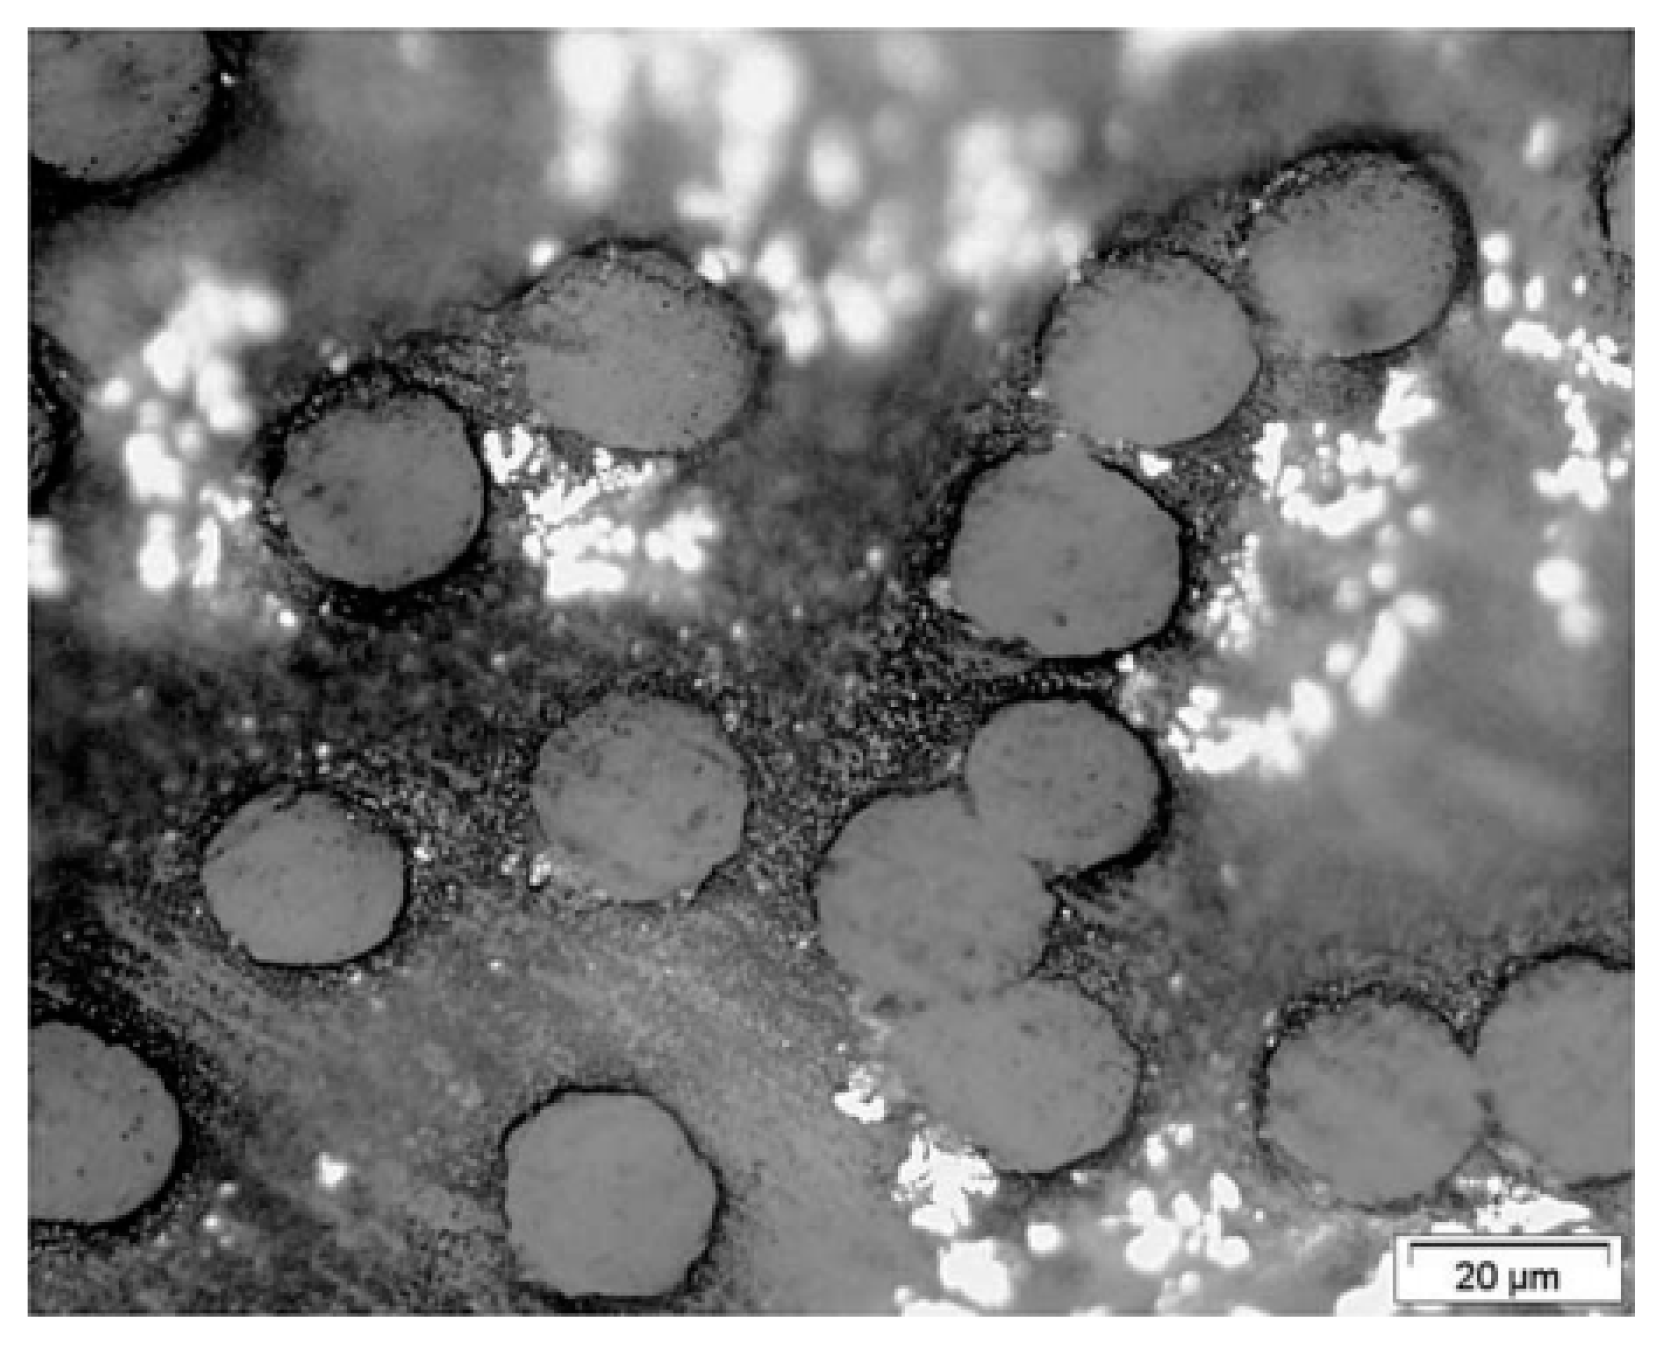
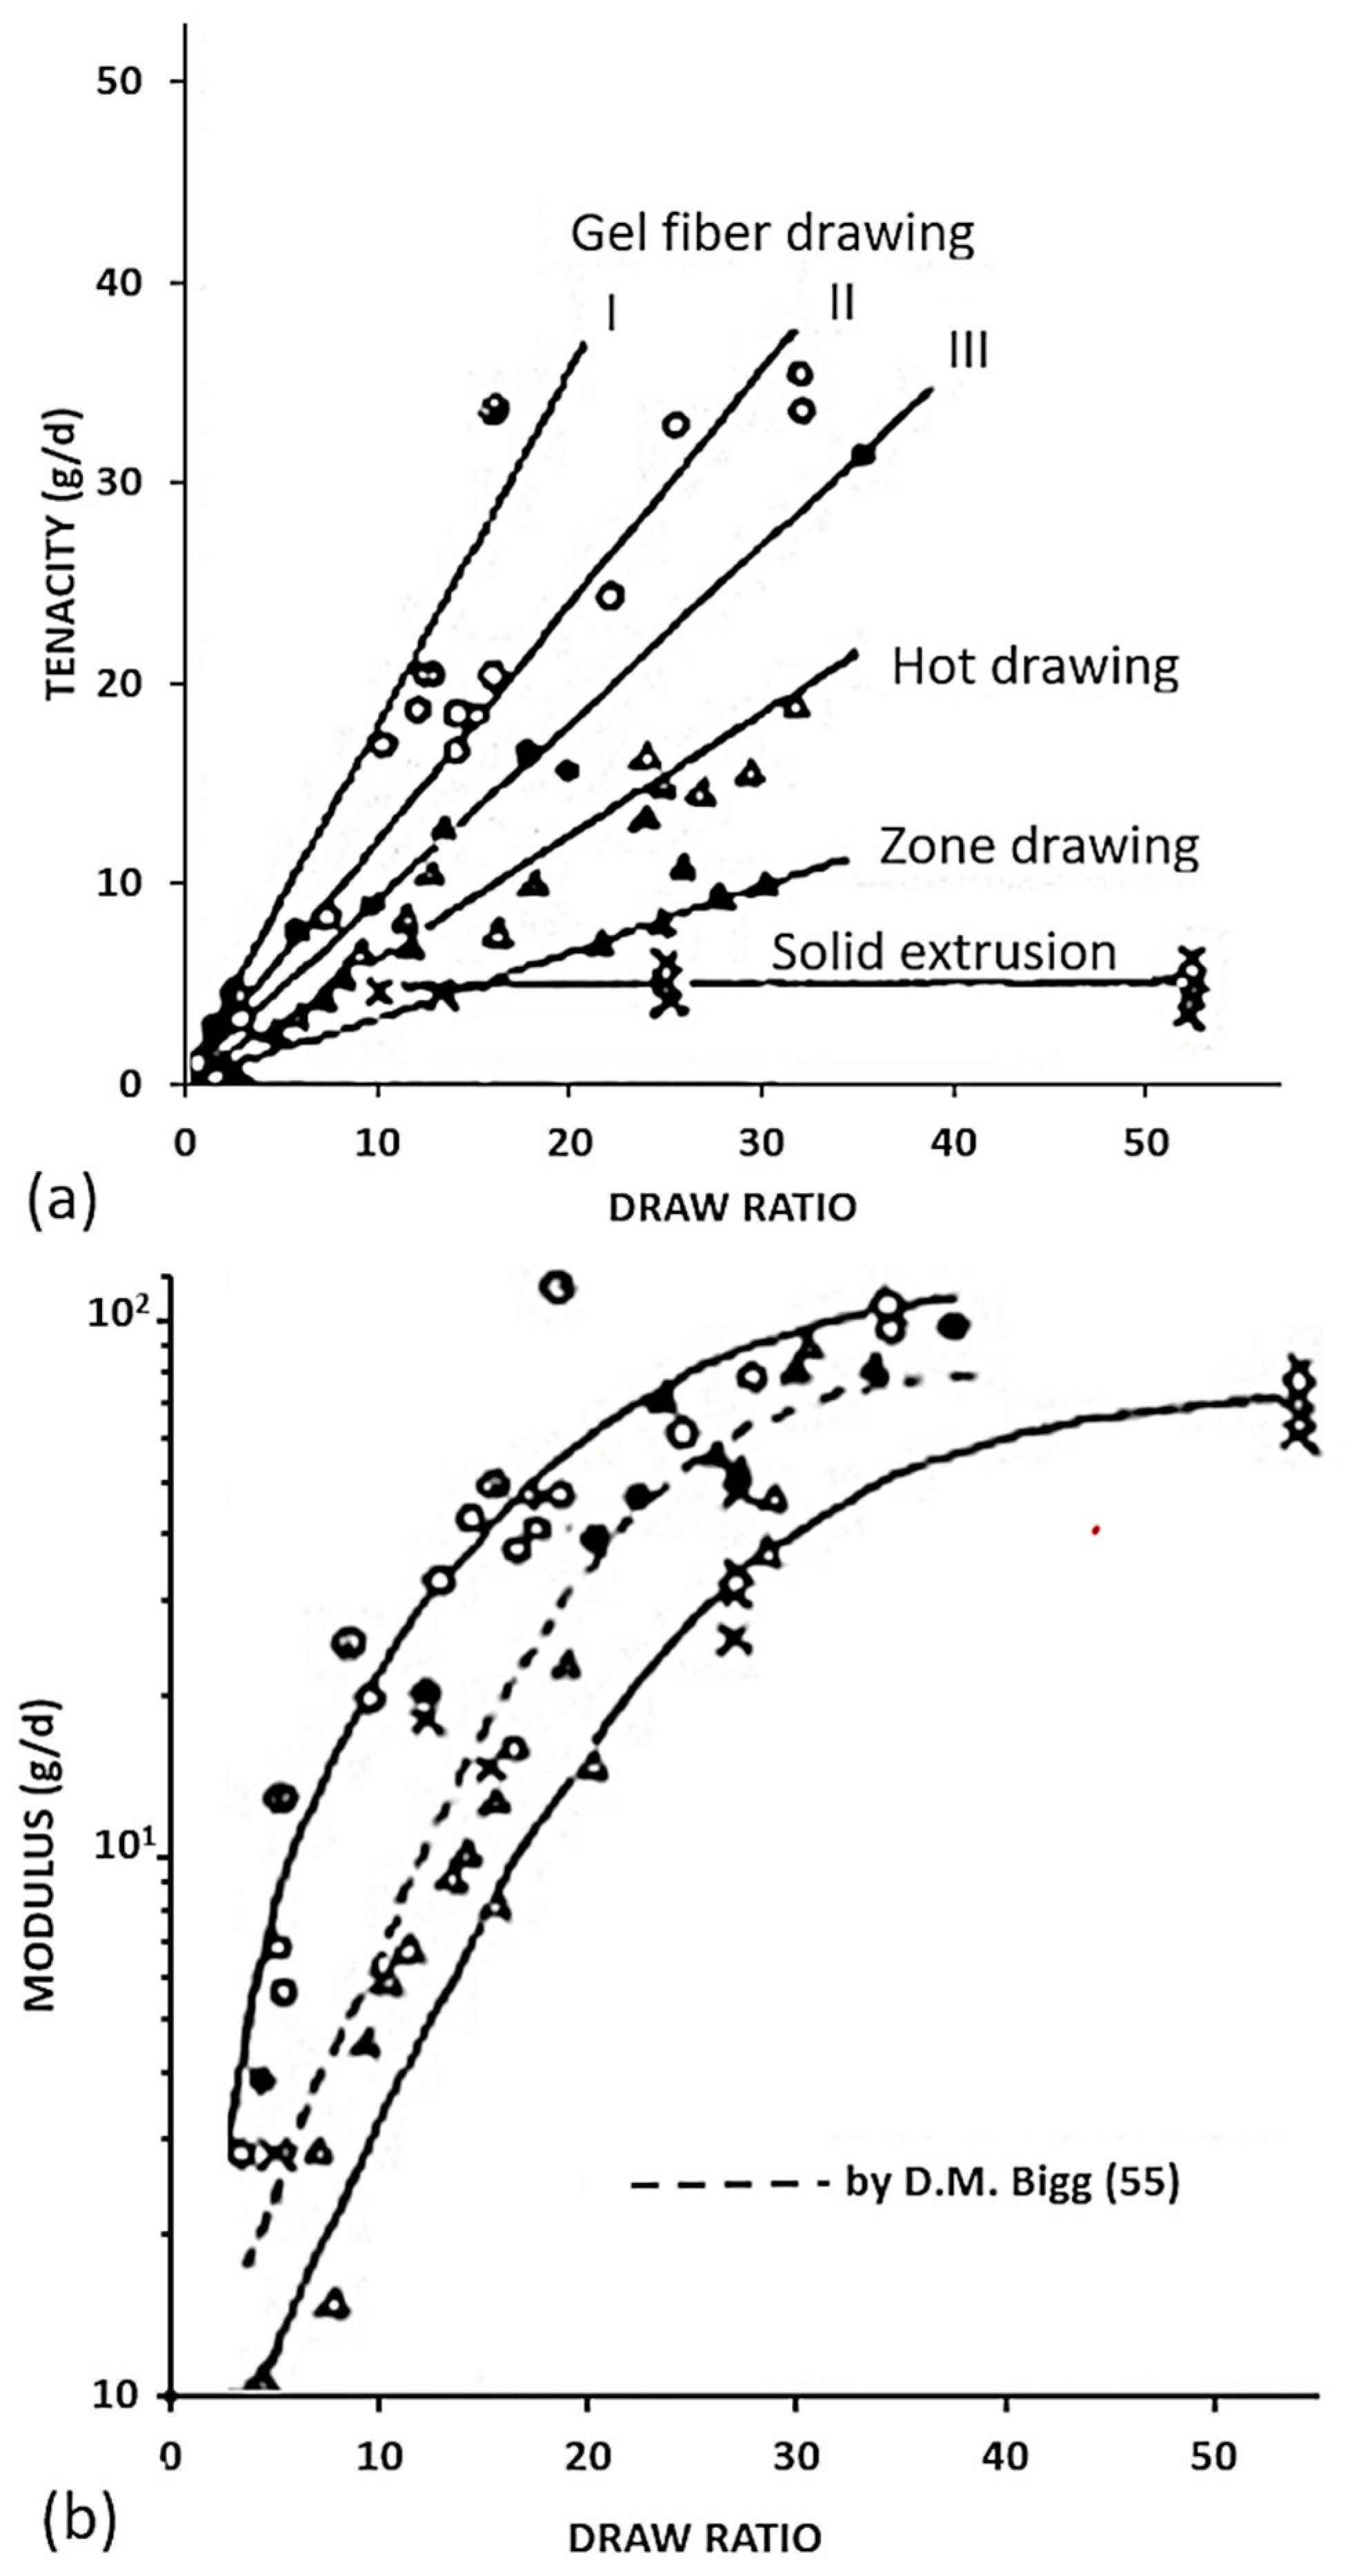
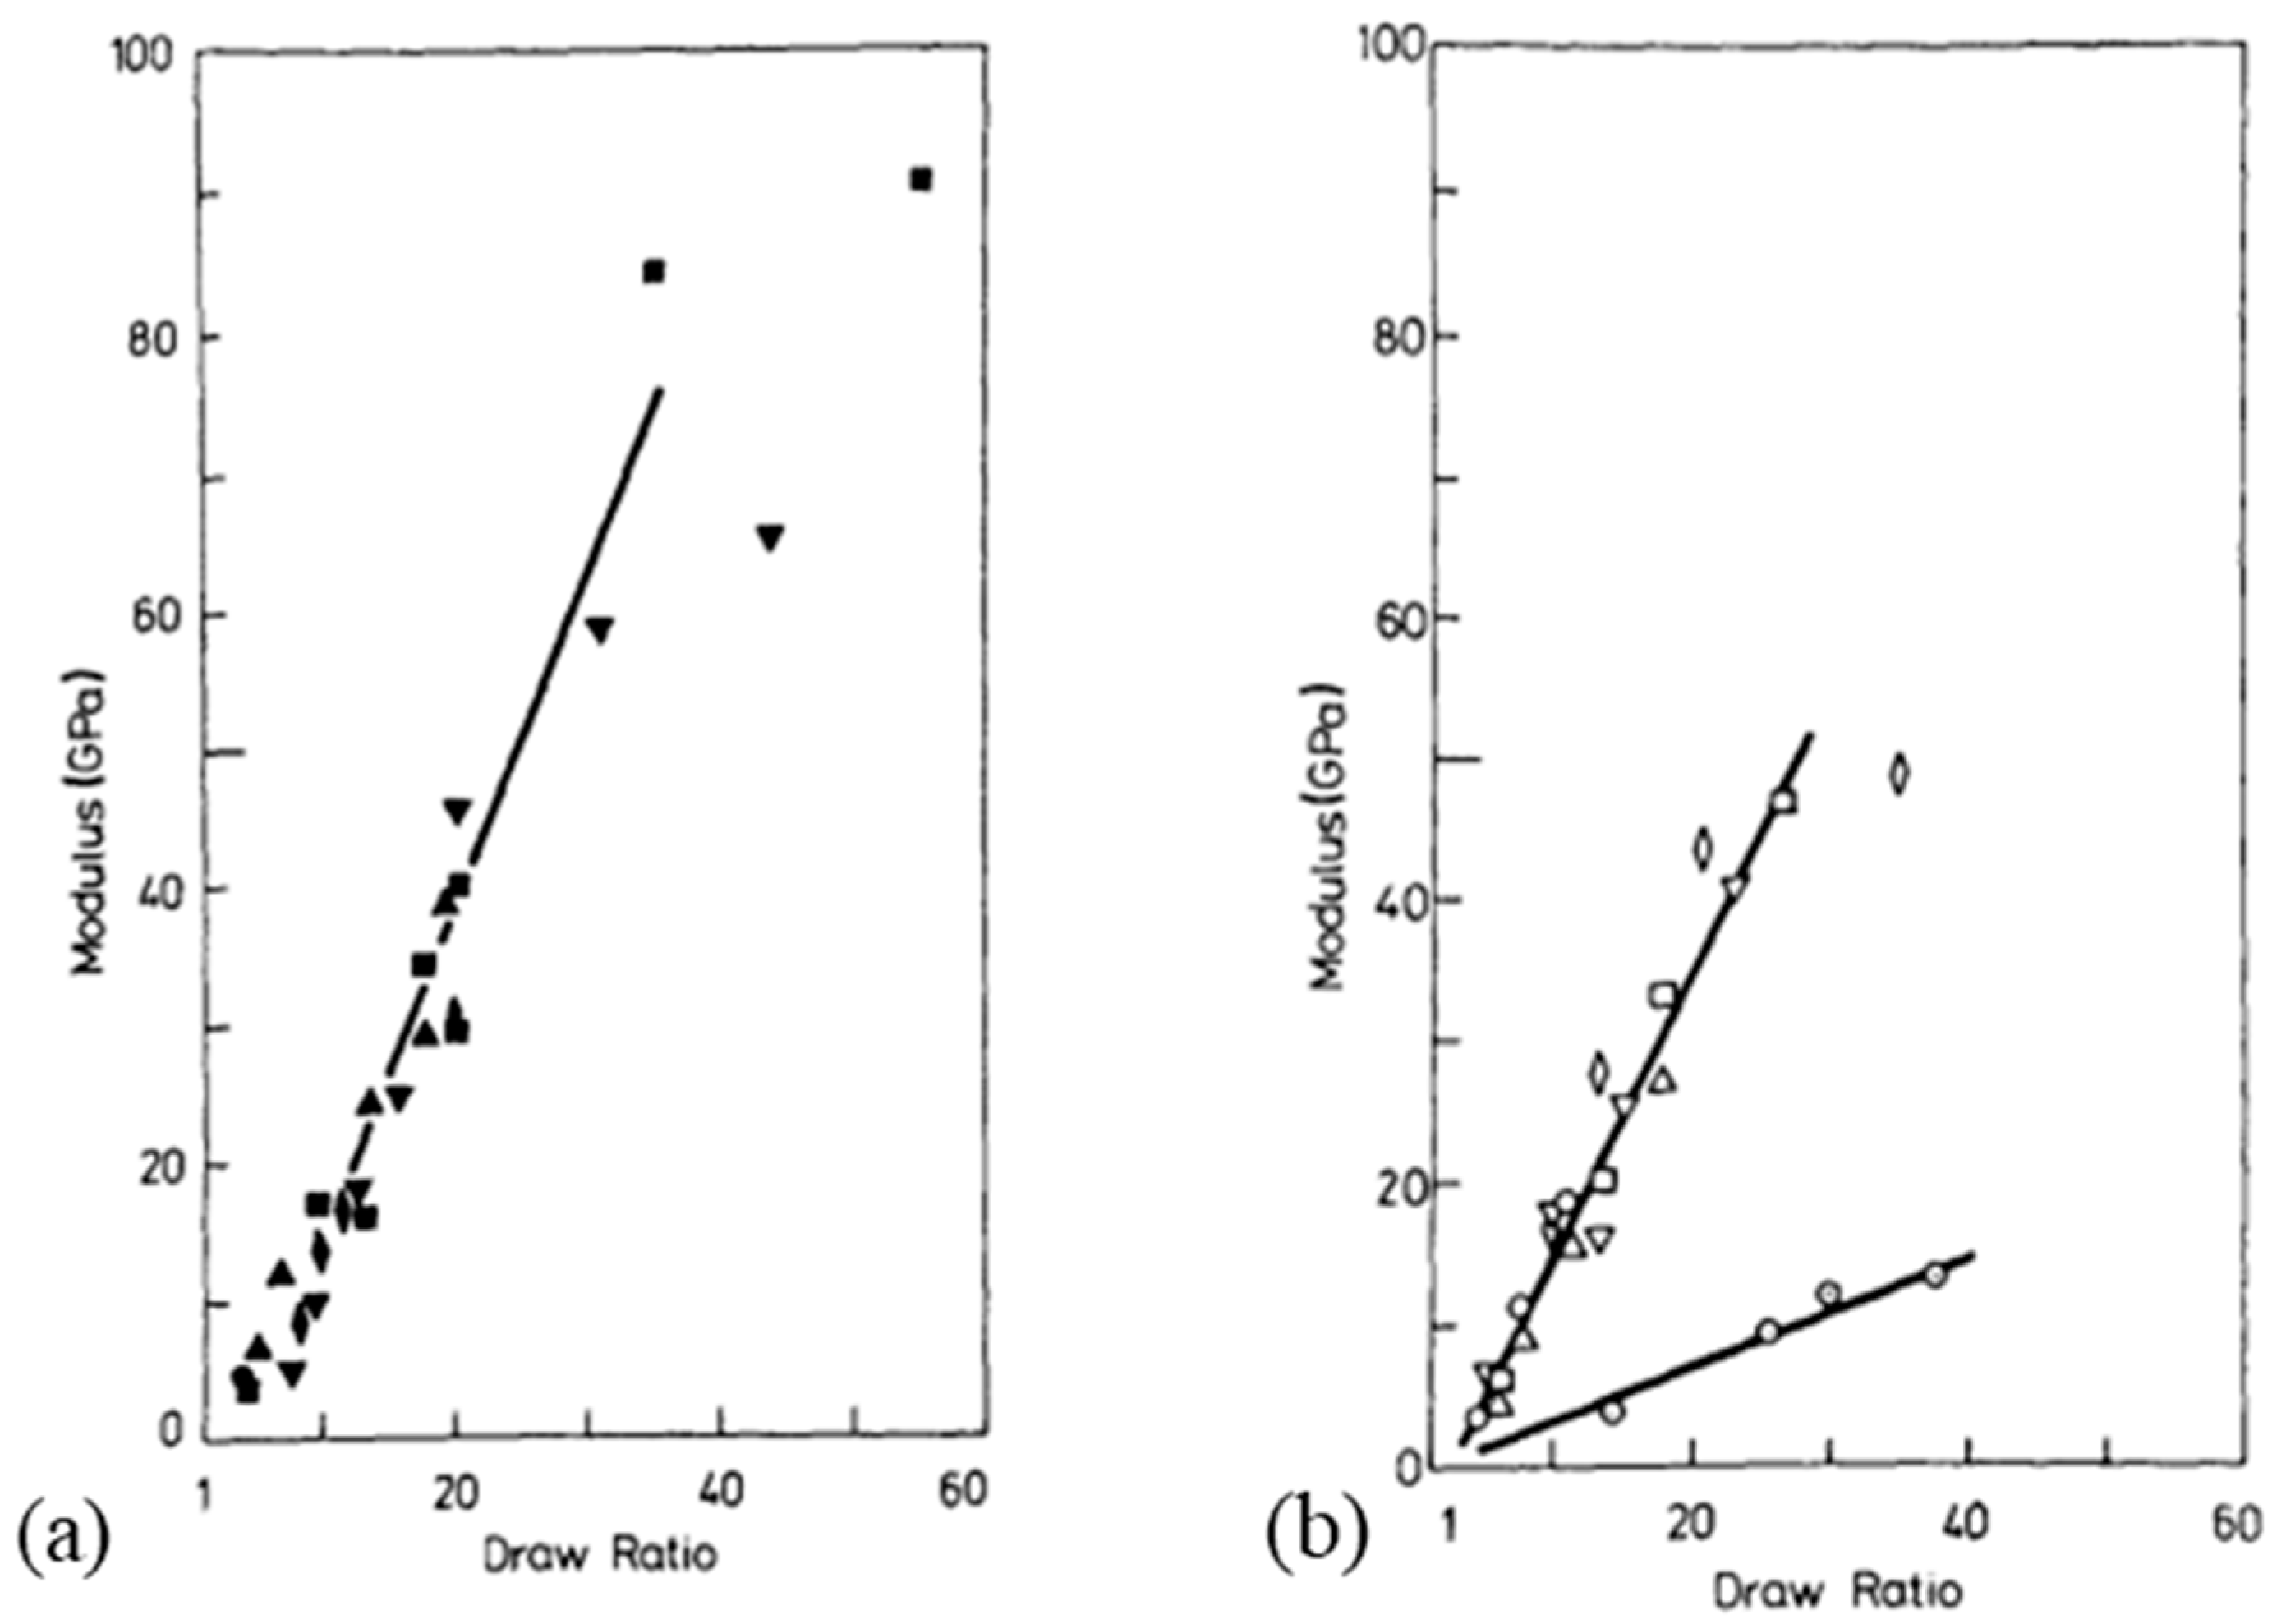
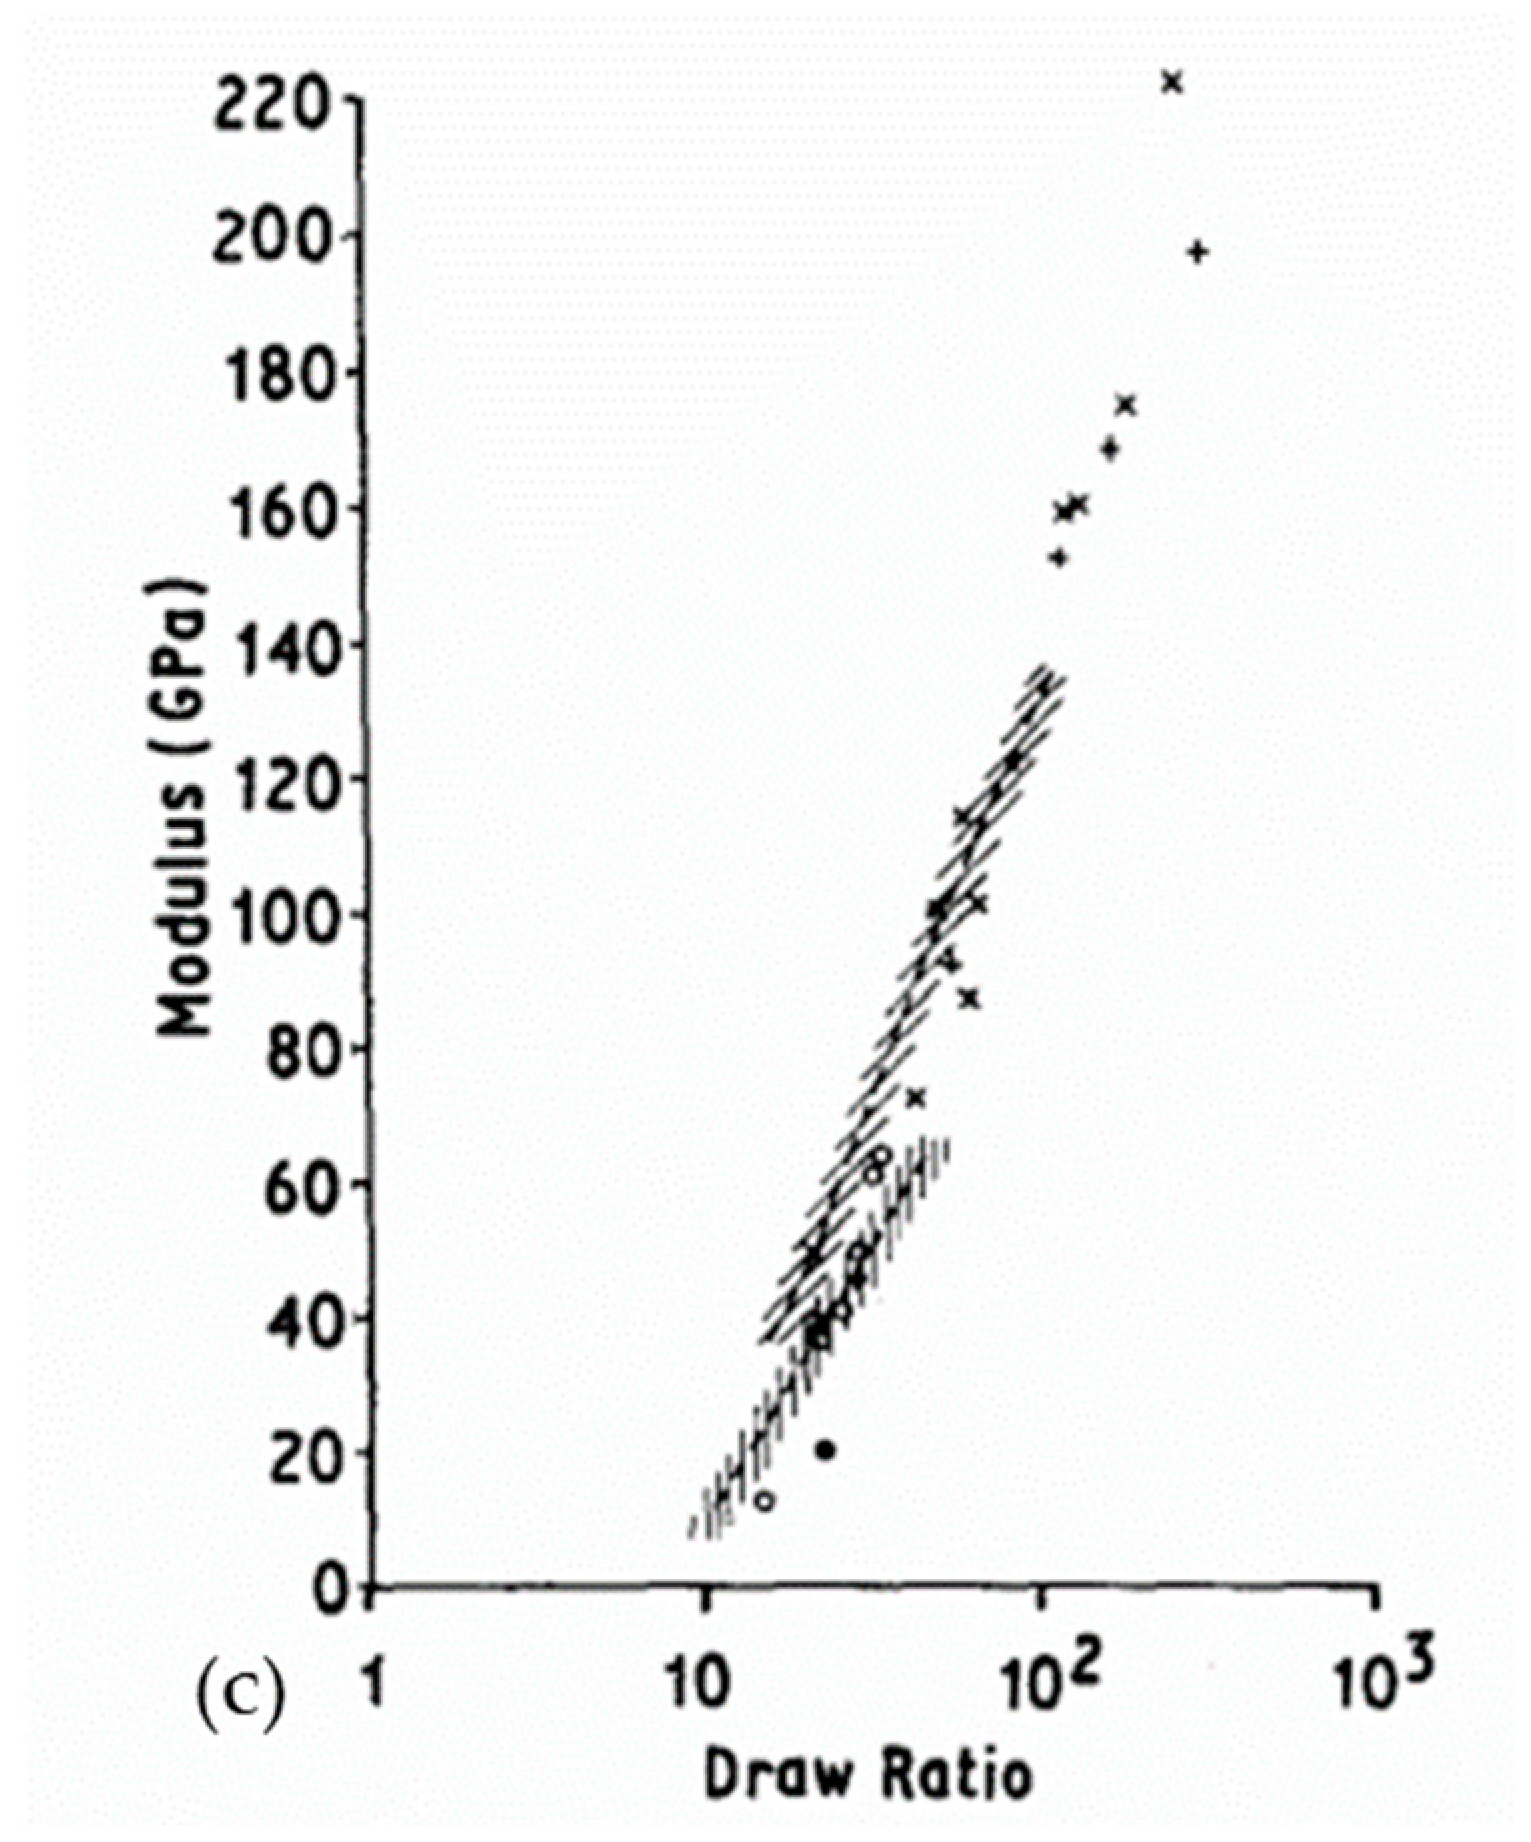
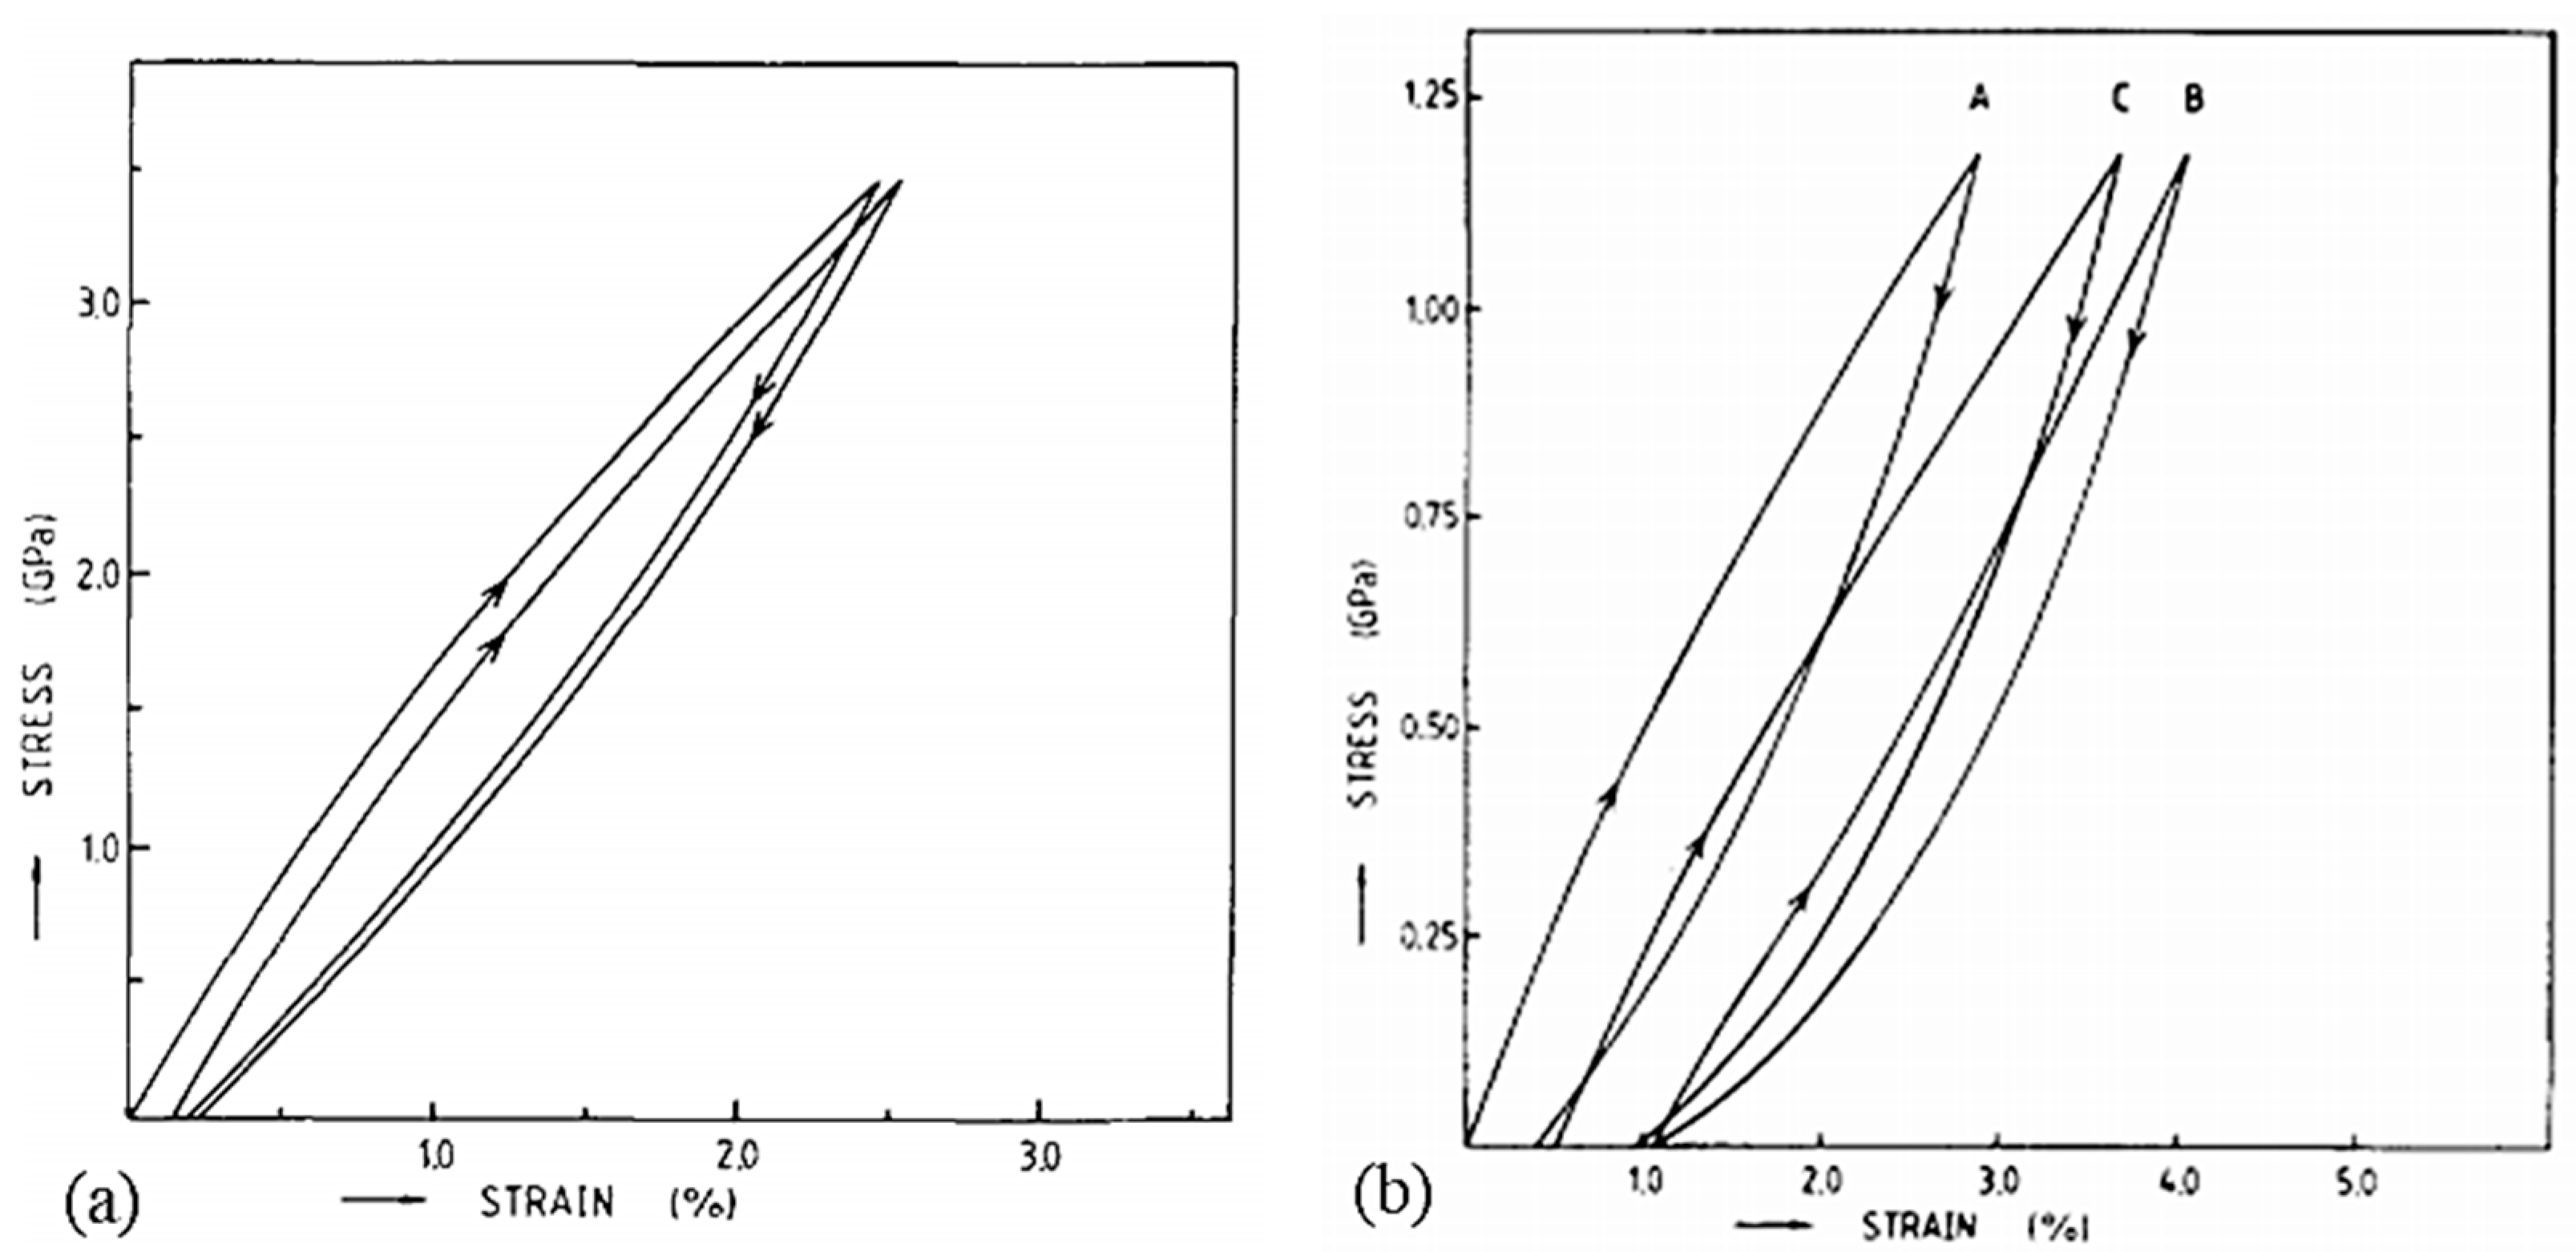
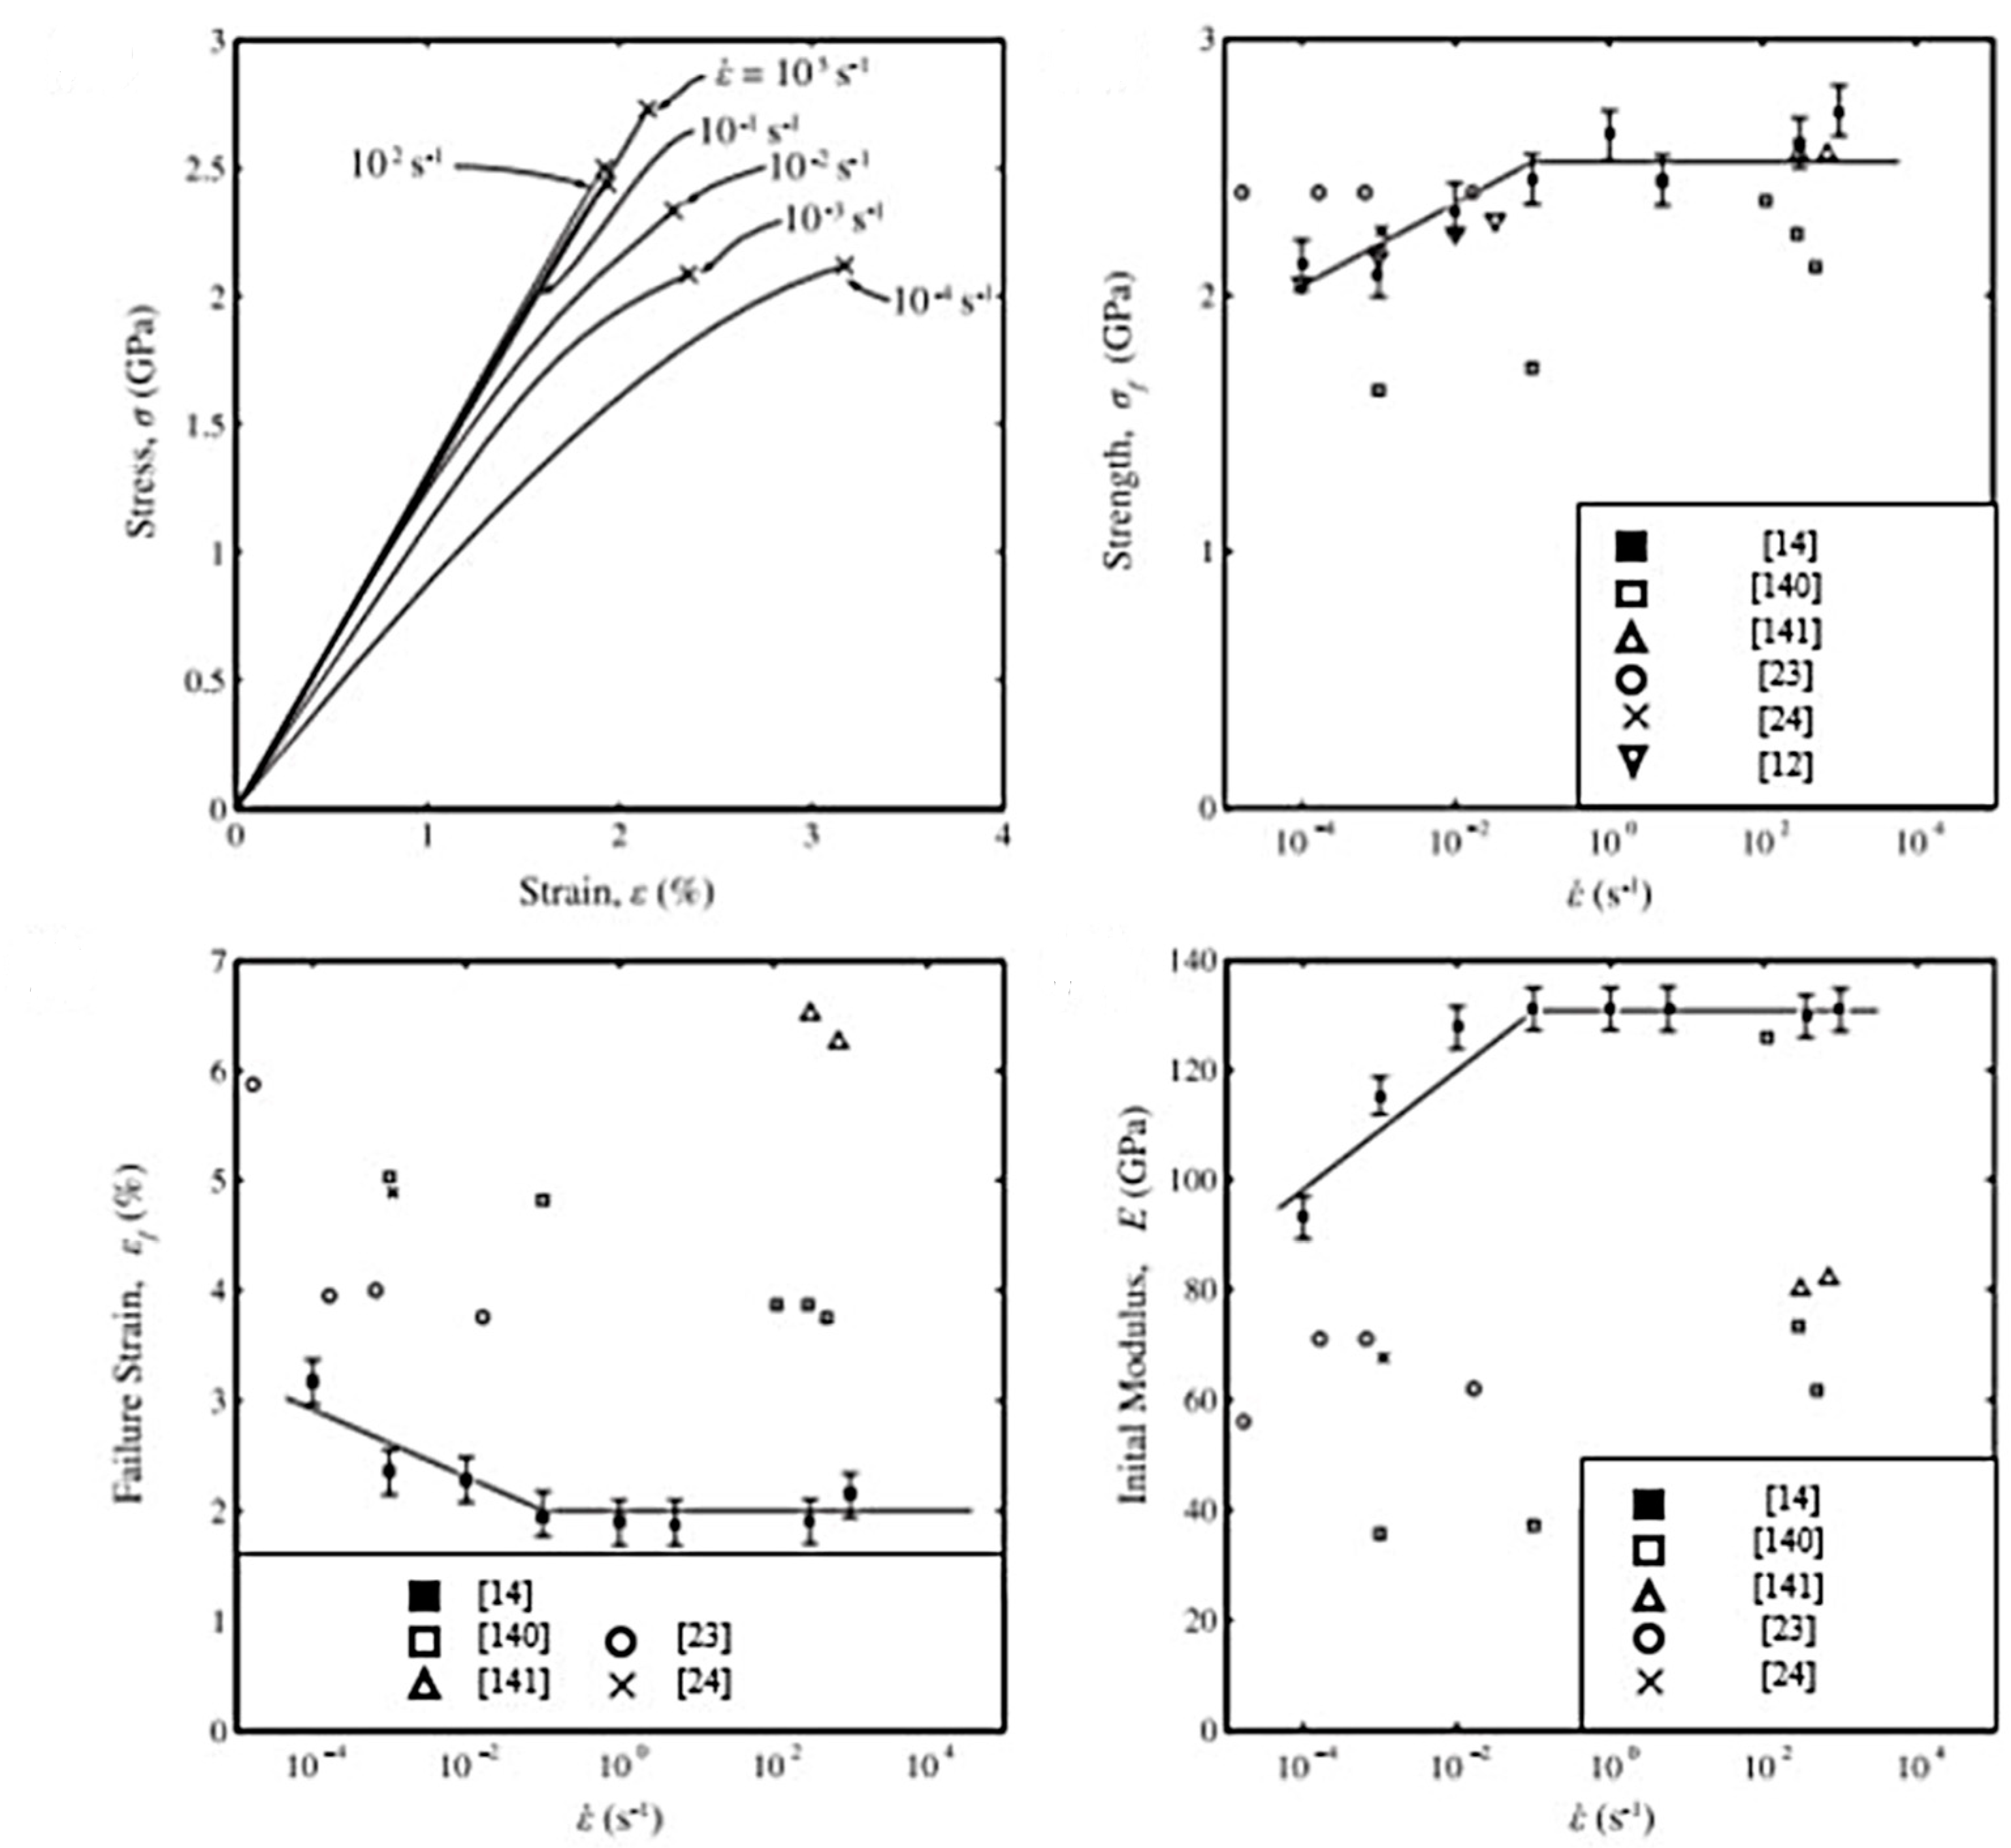
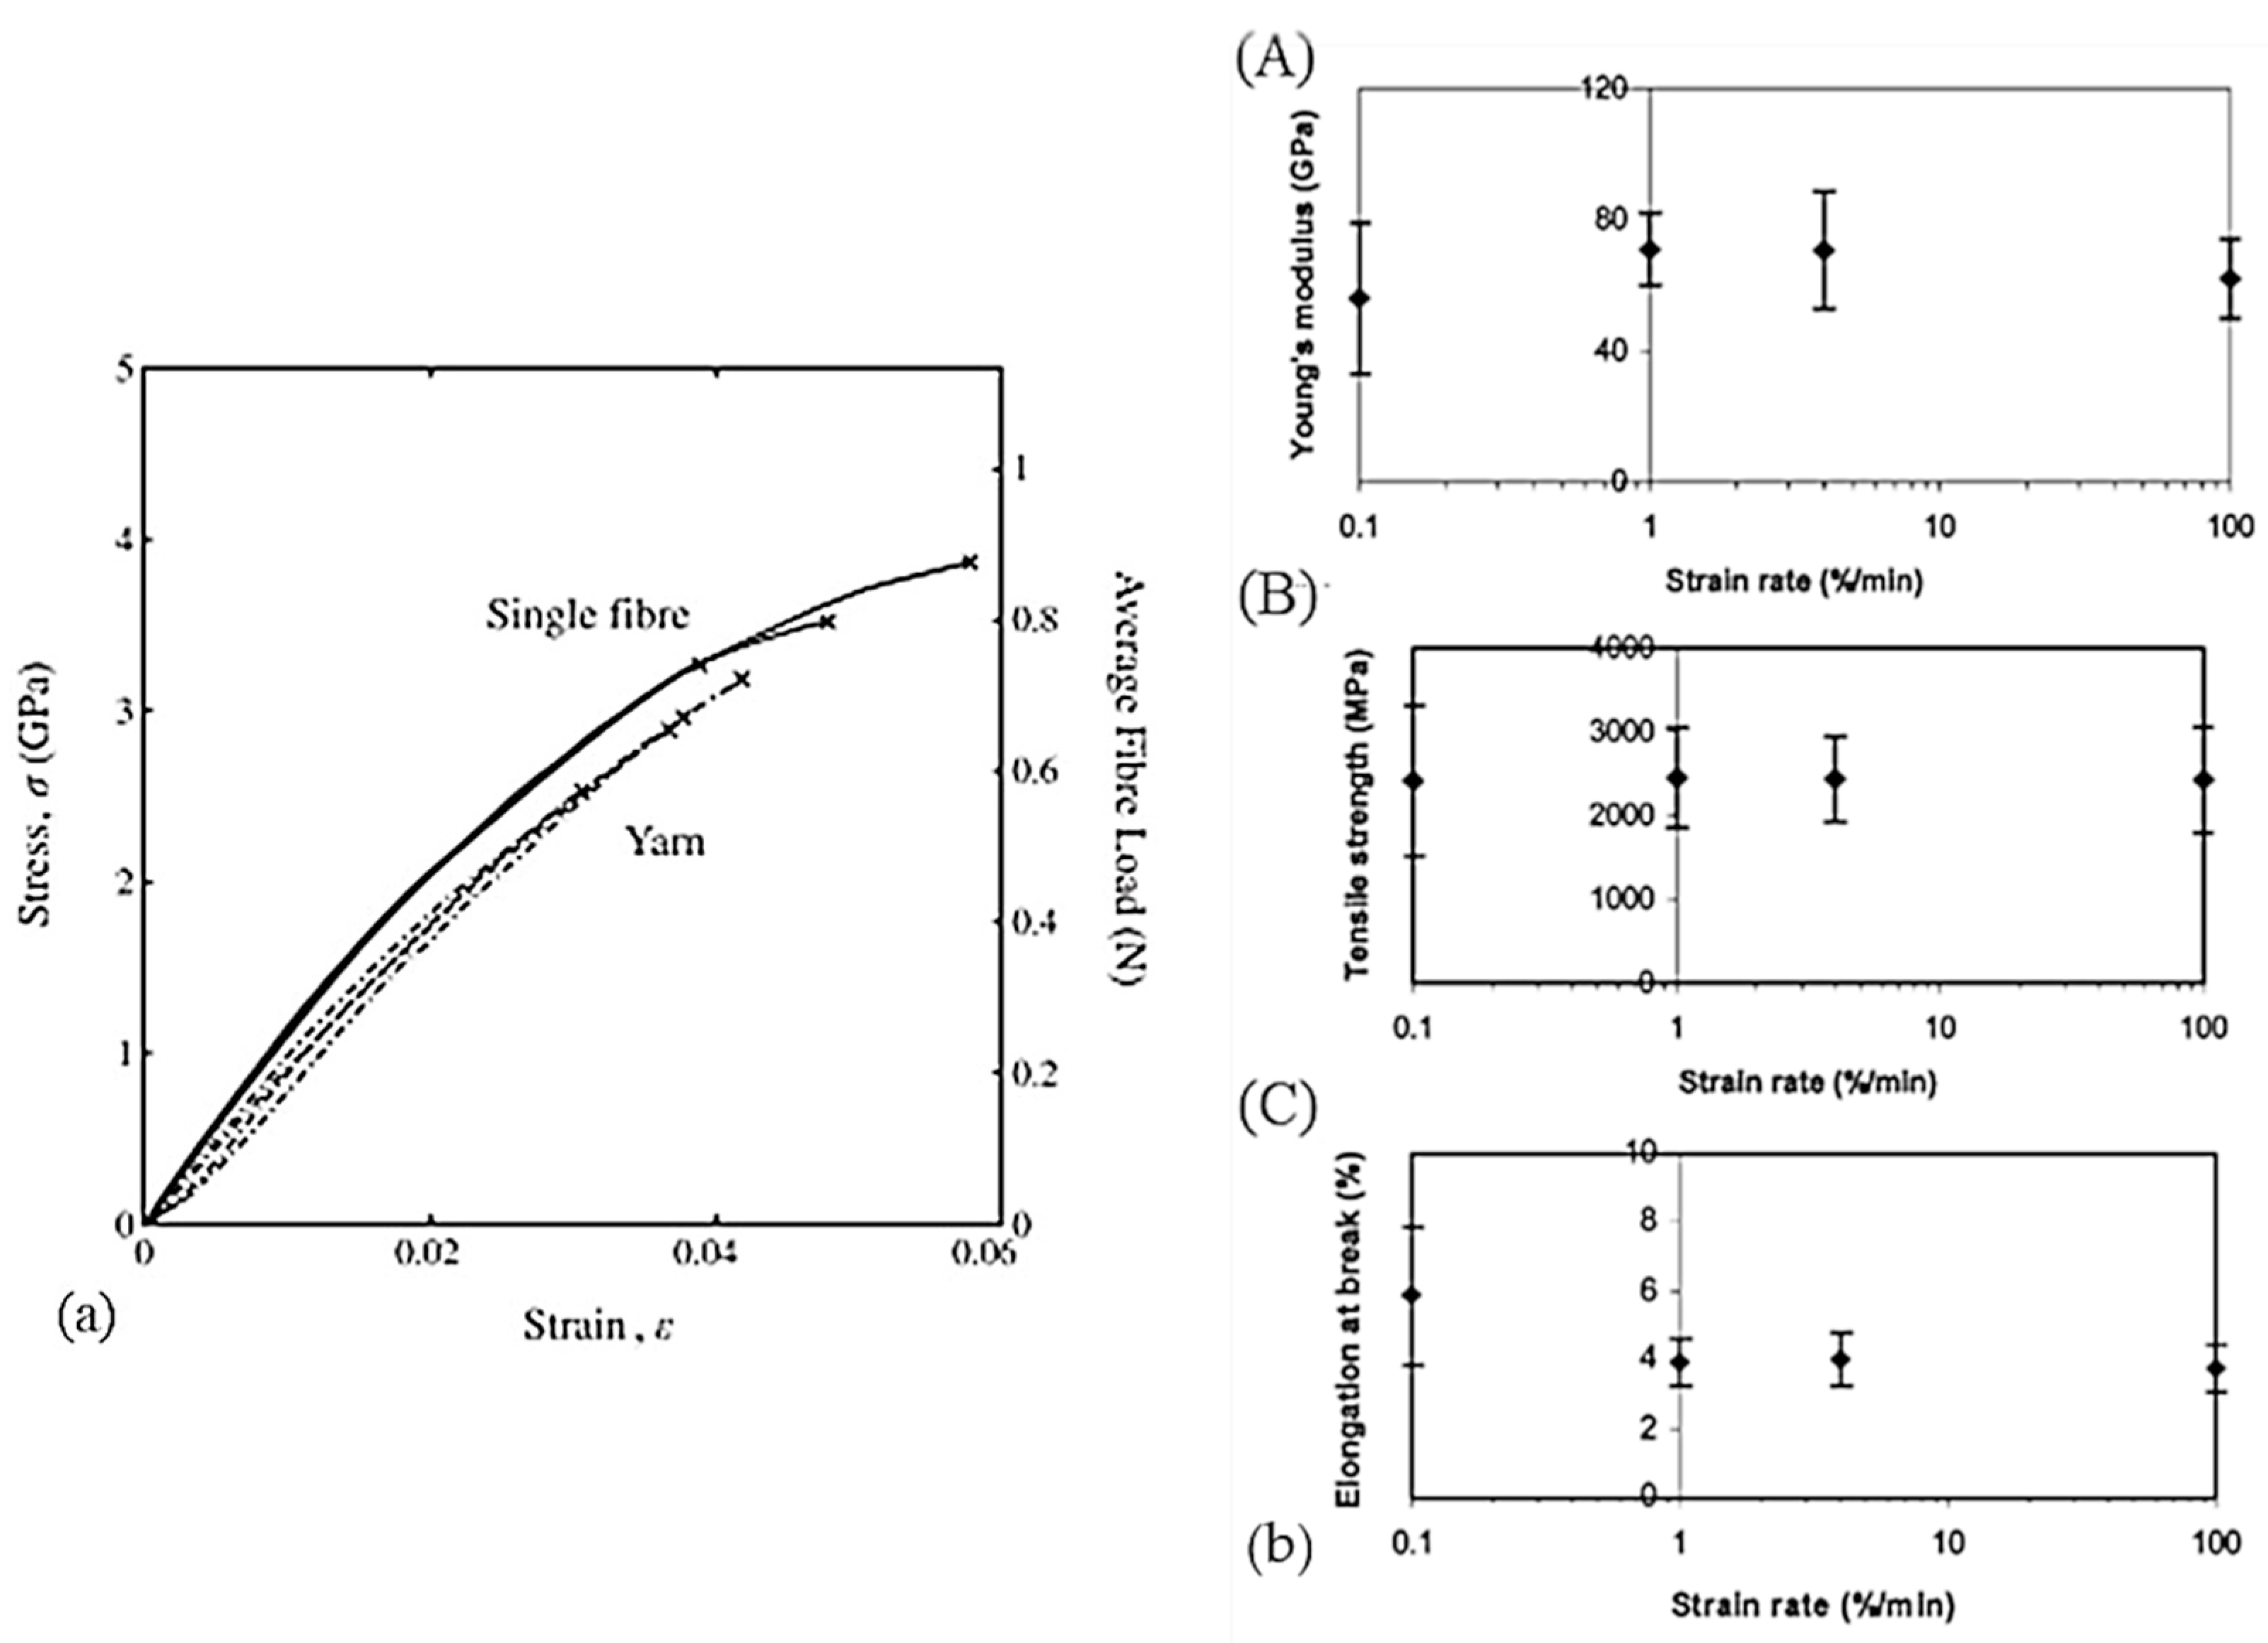
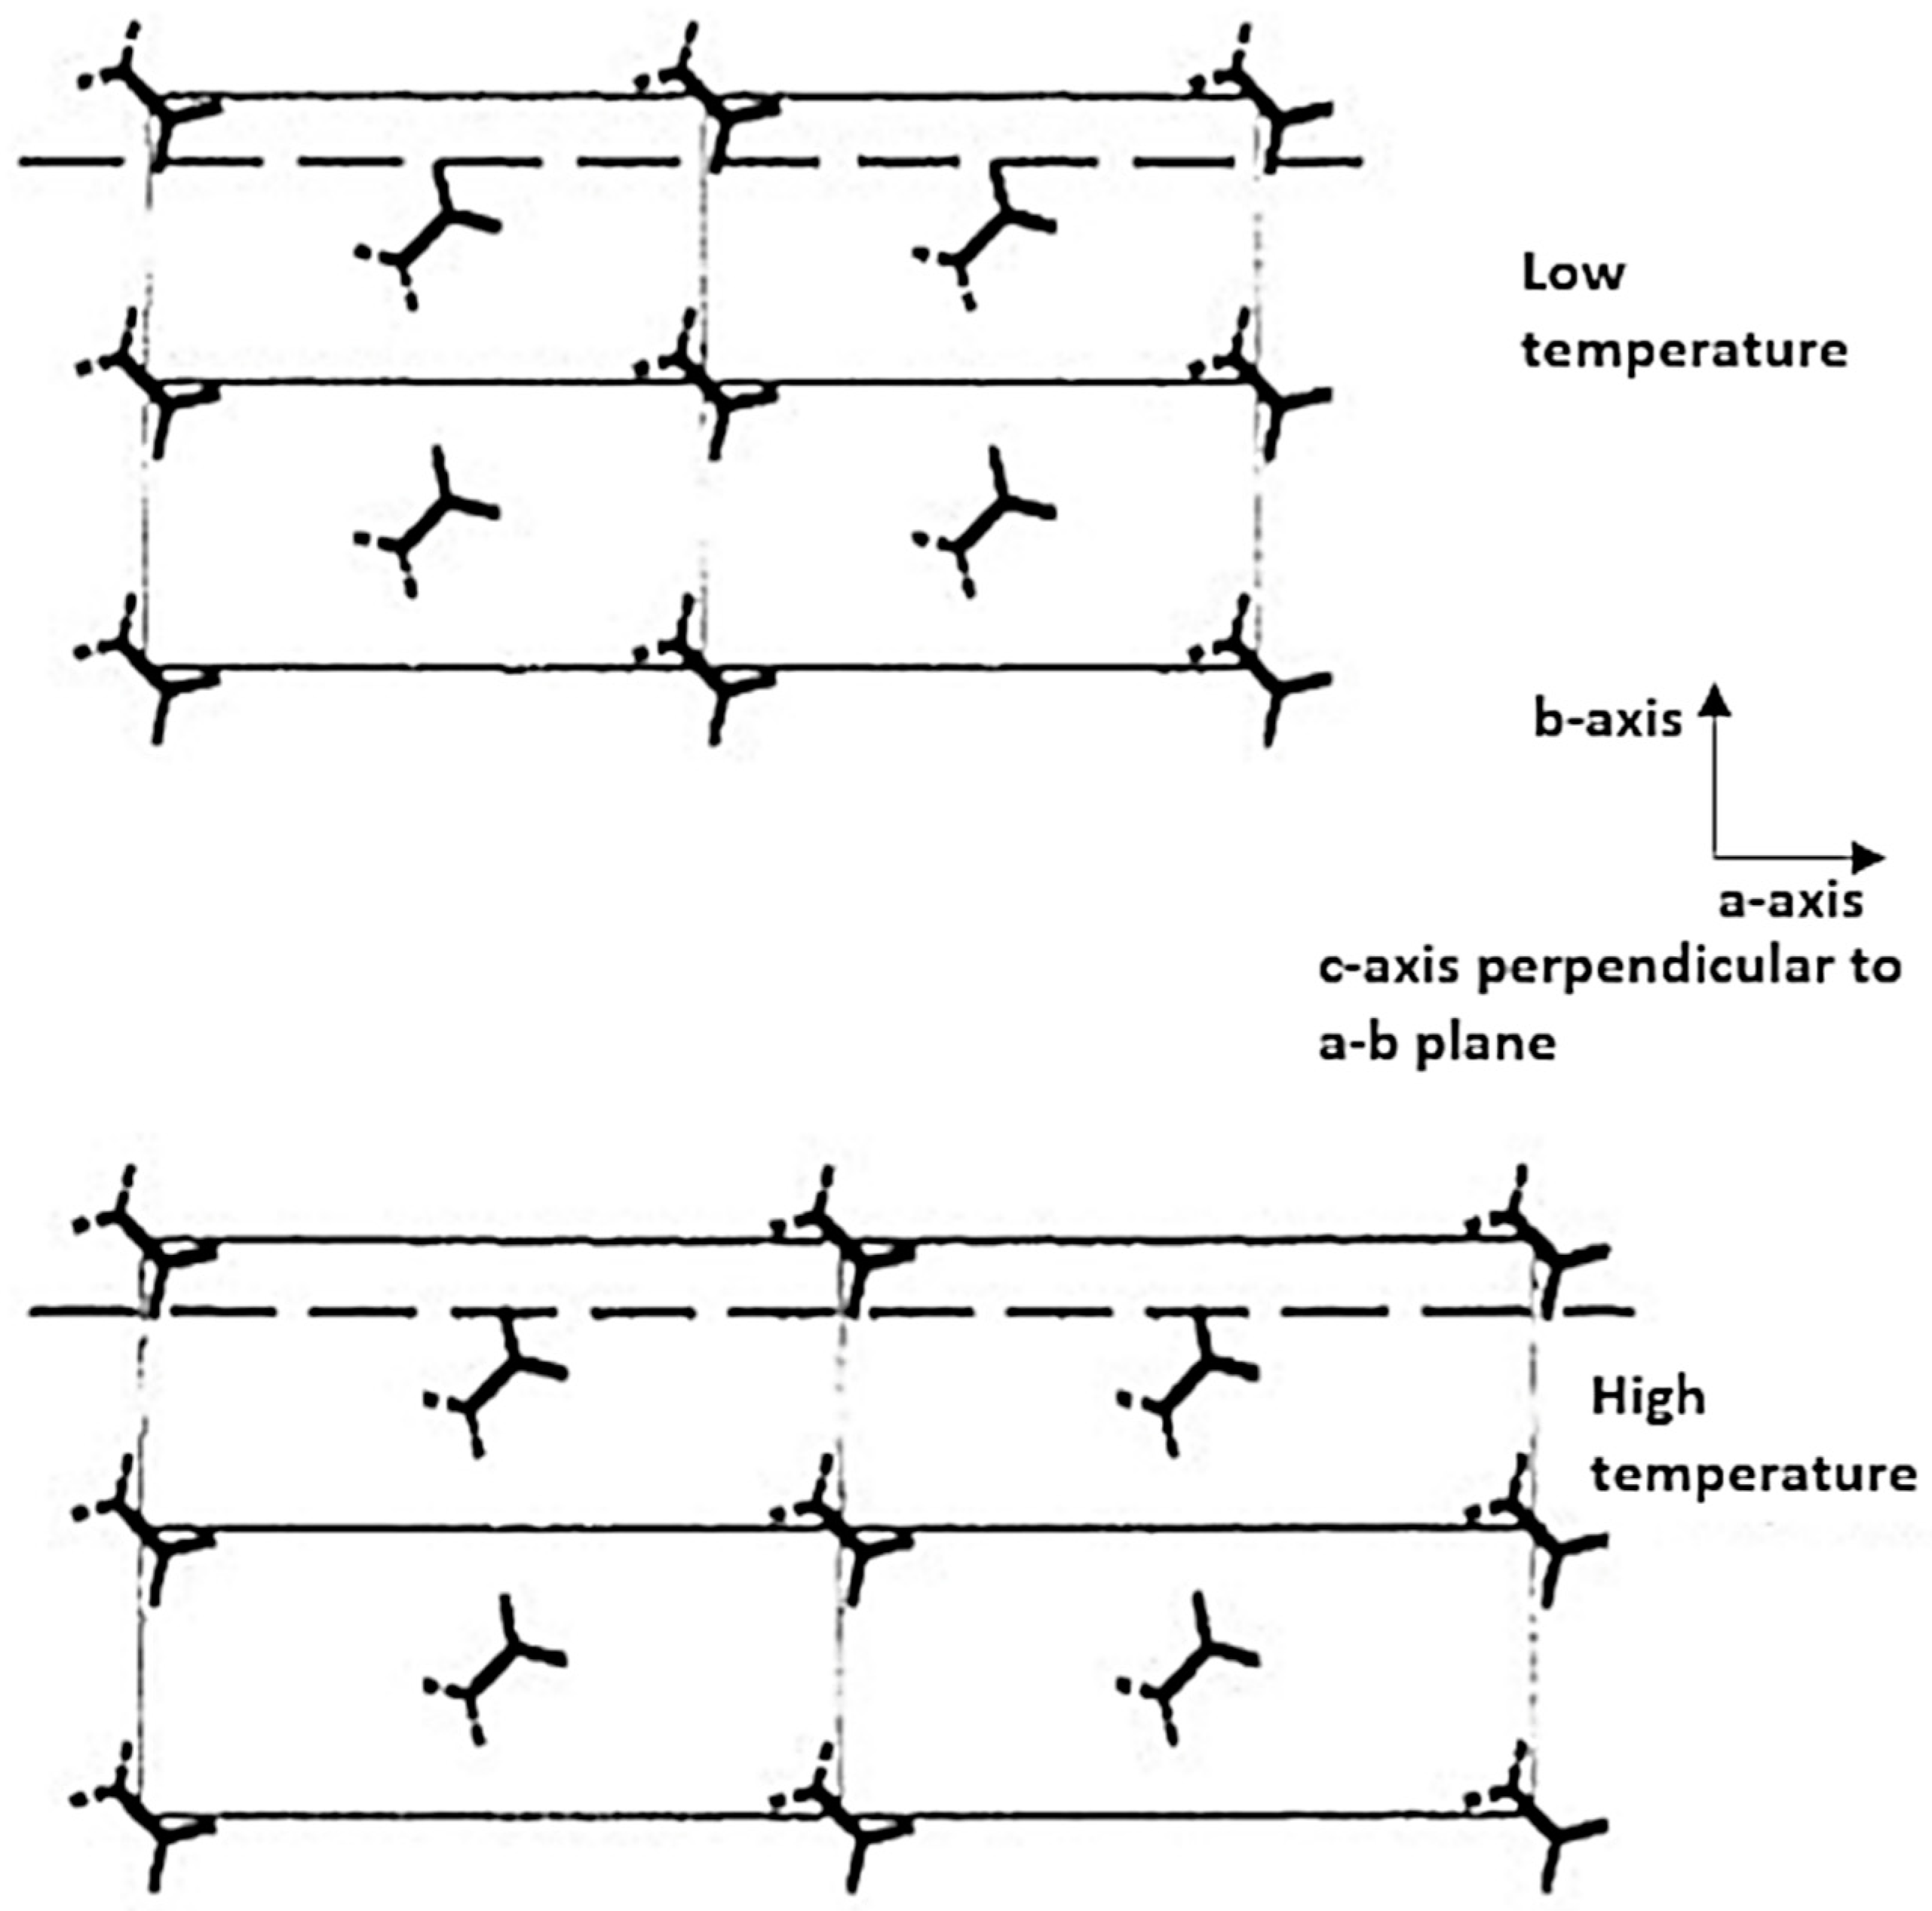
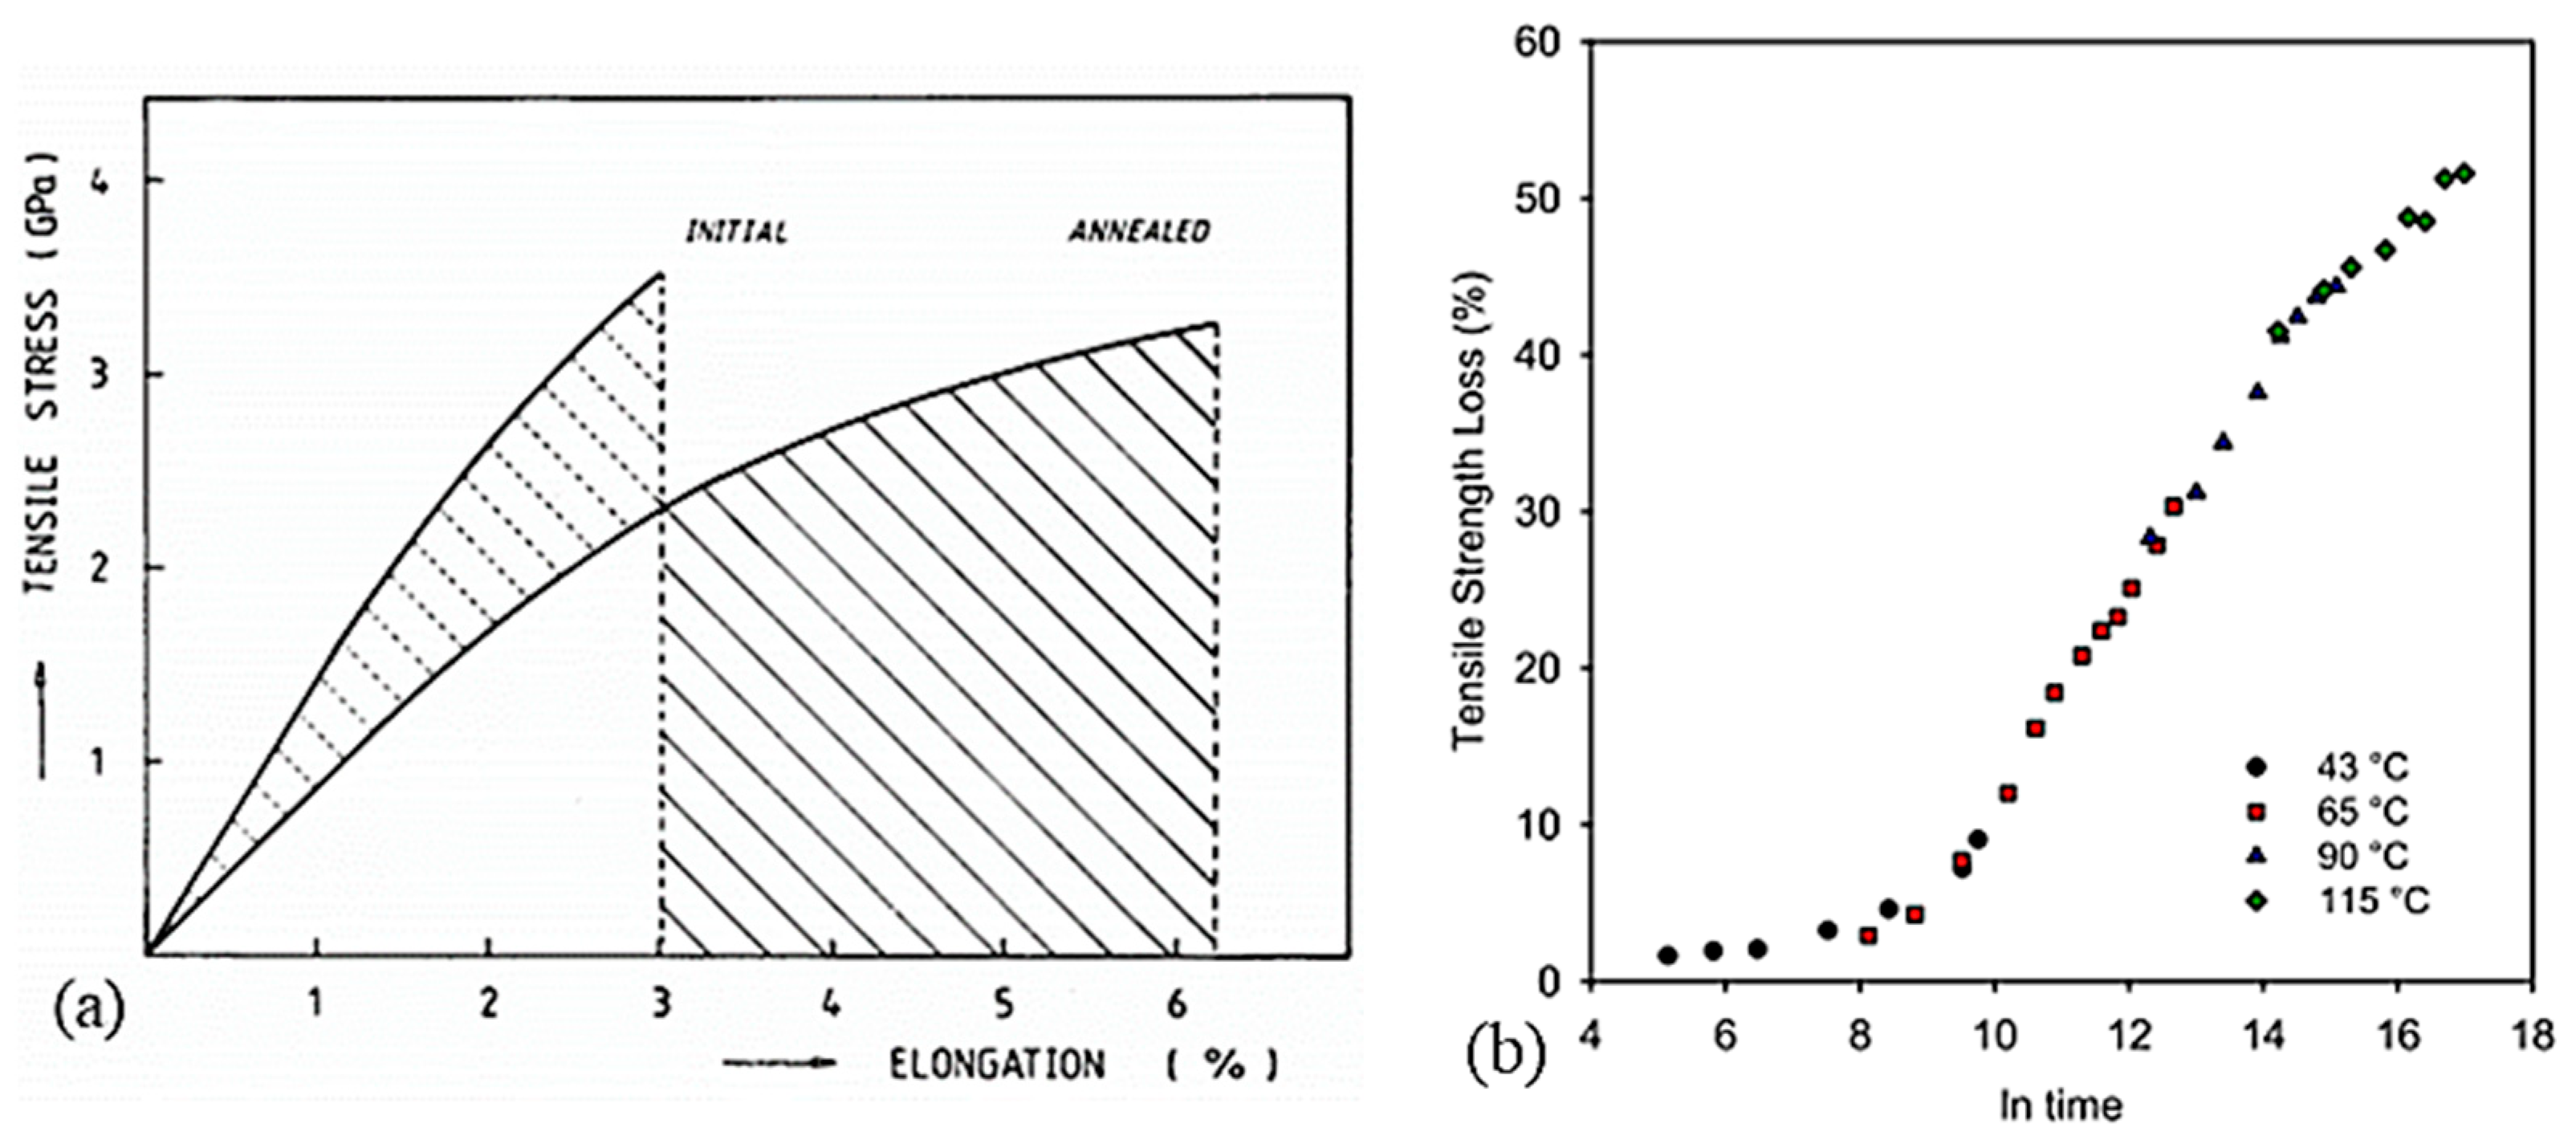
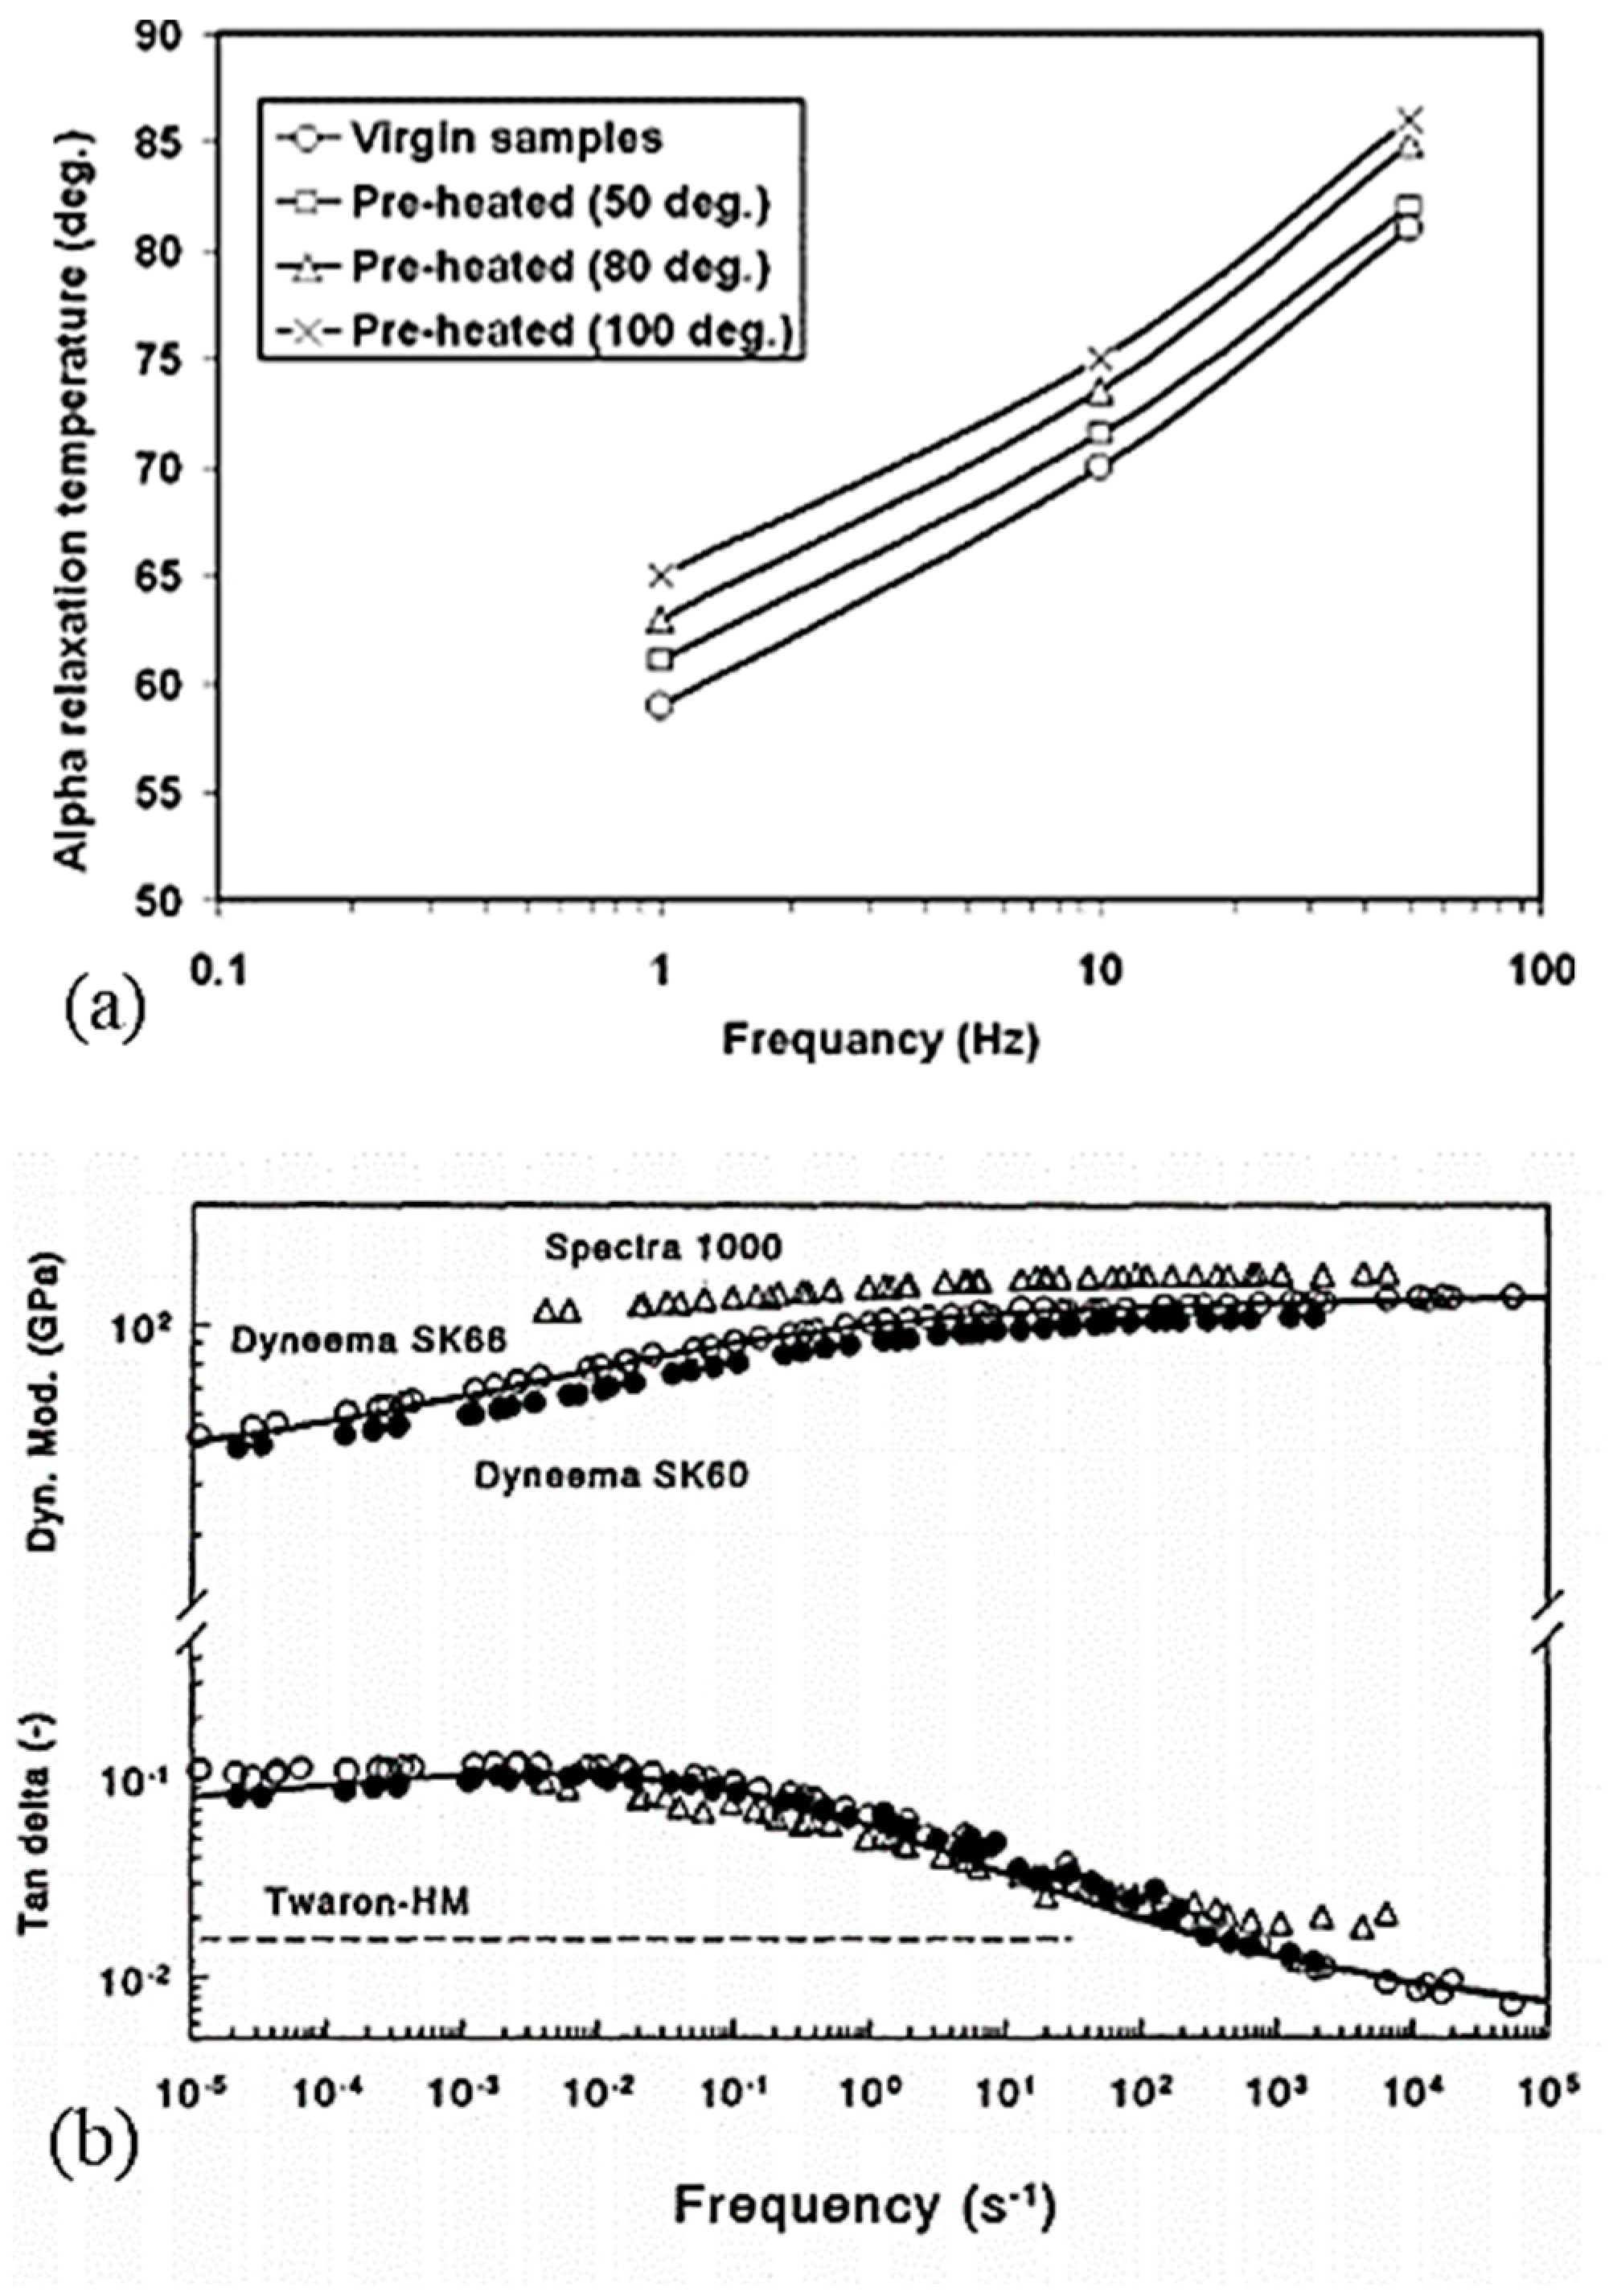
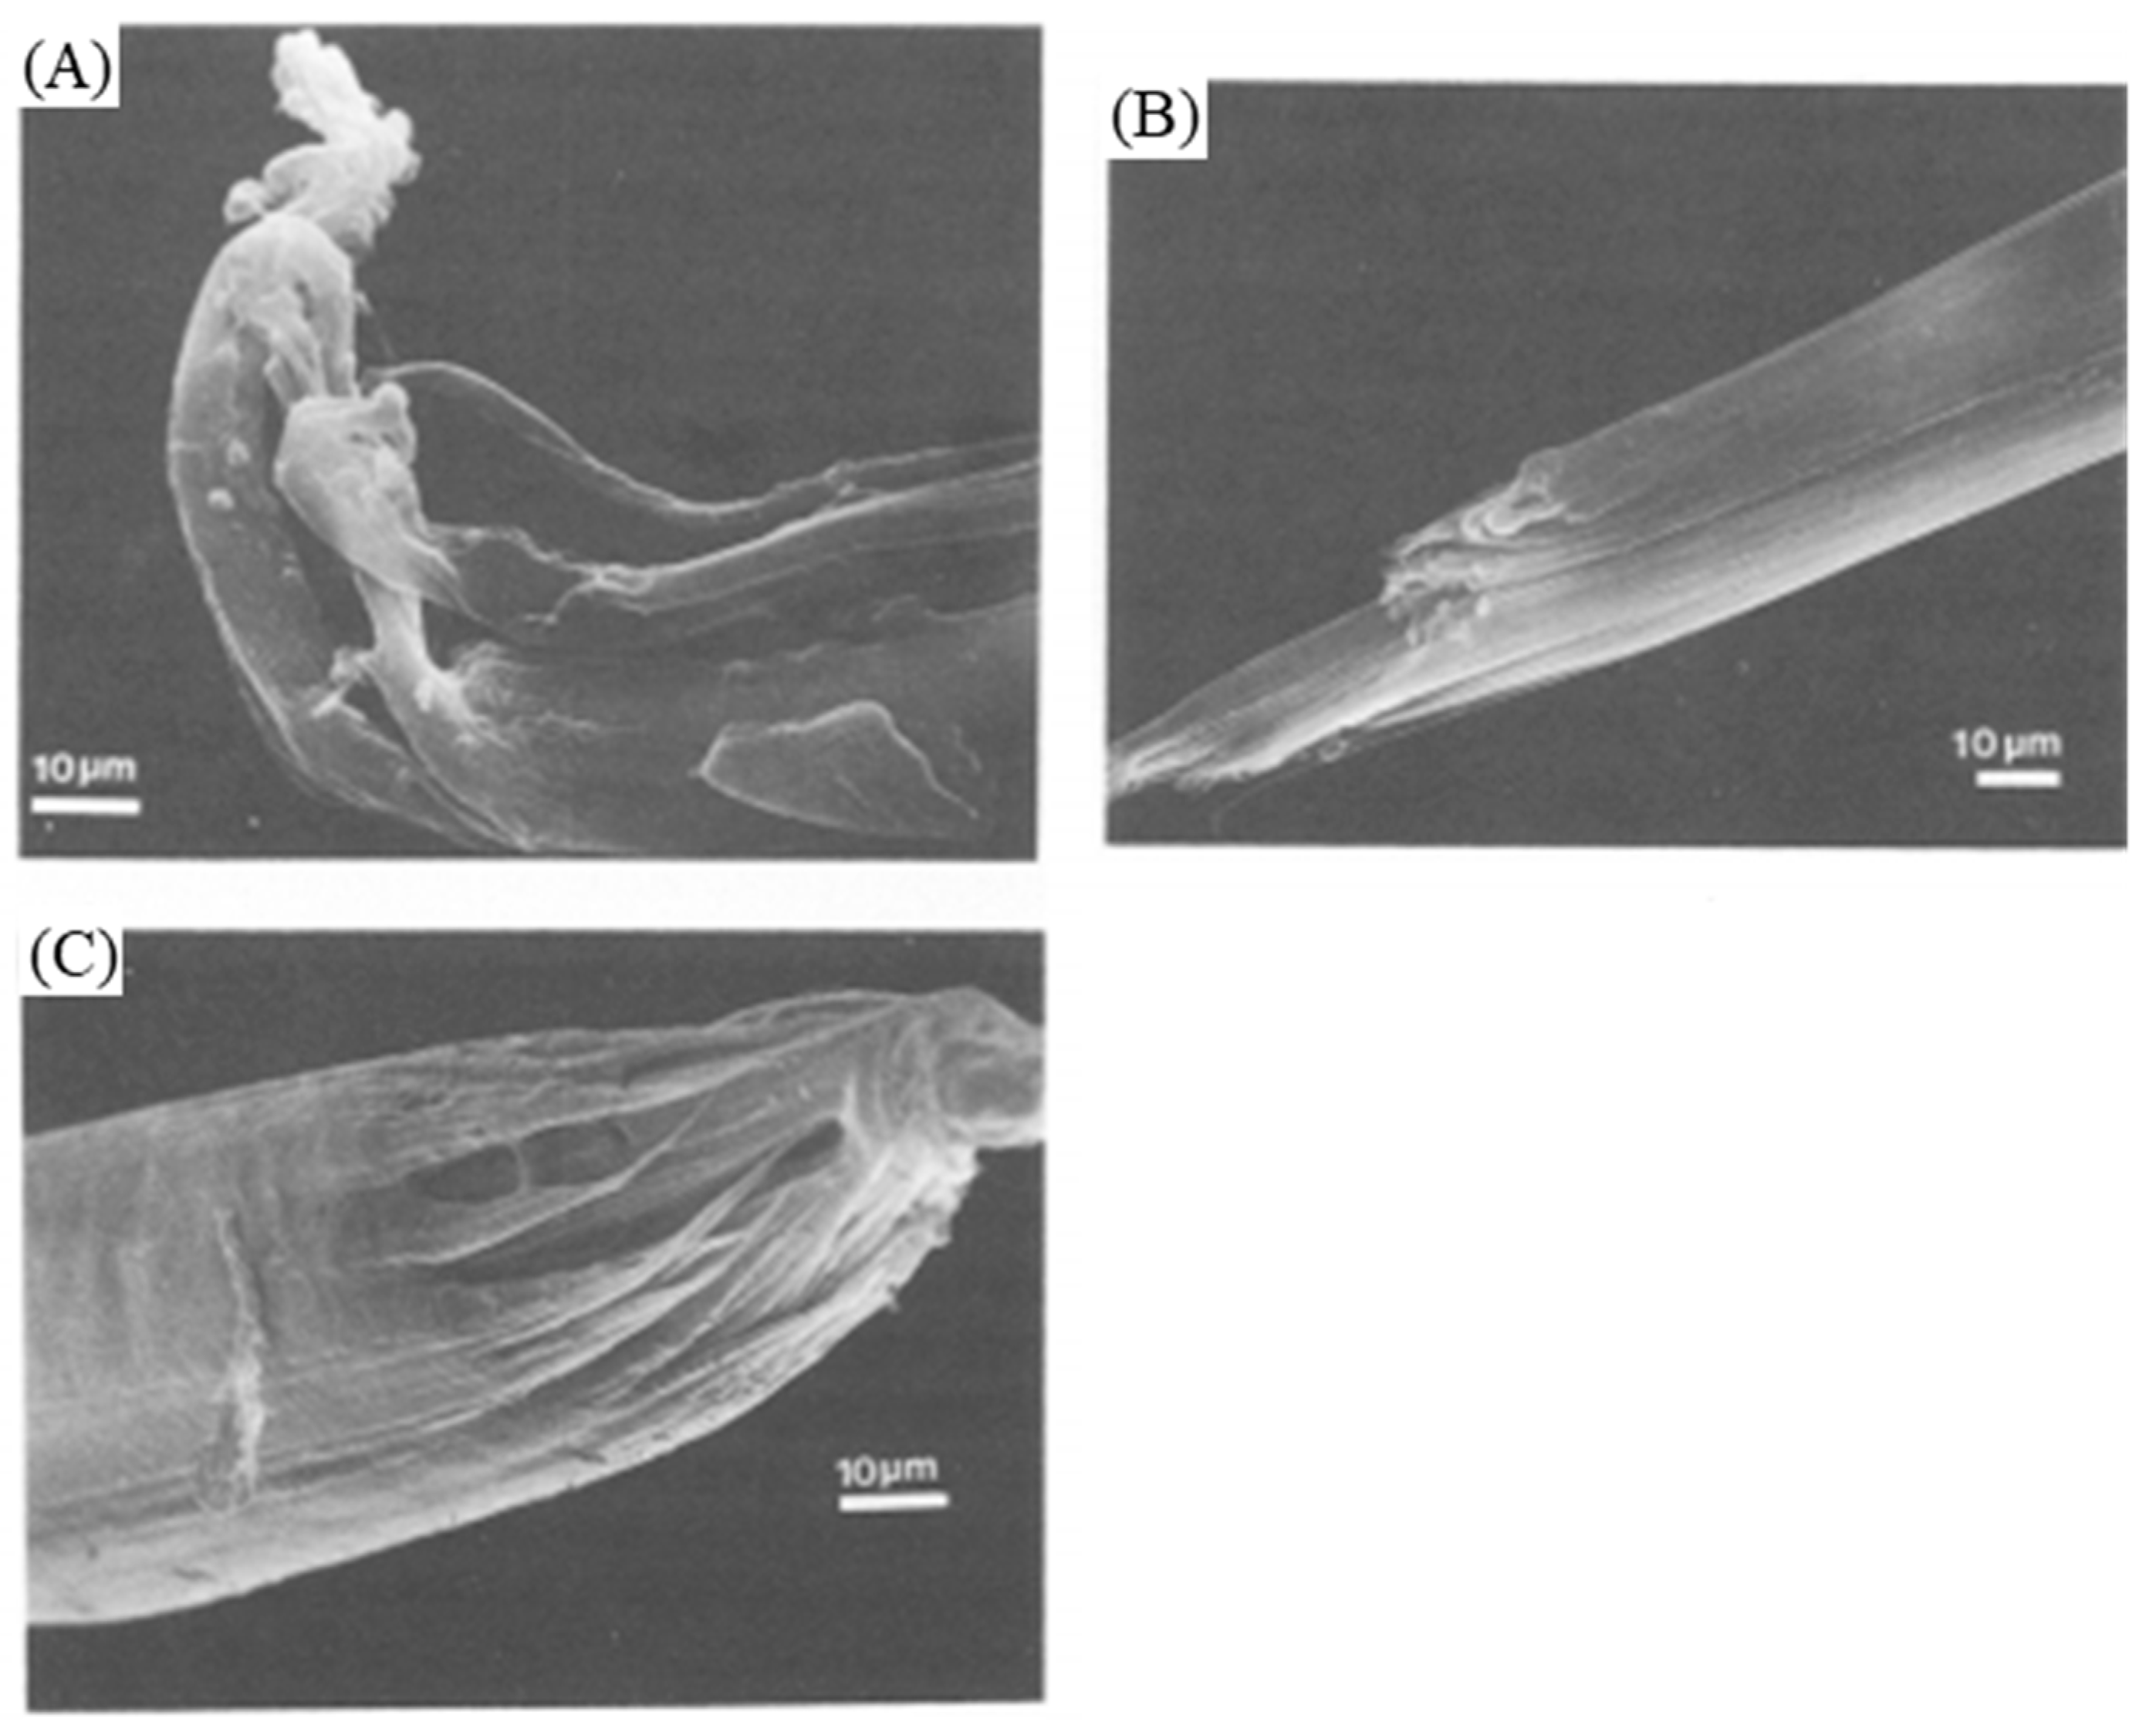
Table A1.
A summary table of the remarkable phases, resulting from DSC analysis presented in this review and the related conditions.
Table A1.
A summary table of the remarkable phases, resulting from DSC analysis presented in this review and the related conditions.
| Authors | Type of Fiber | Condition | Mass of the Sample in mg | Heating Rate | Melting Temperature in °C | |||
|---|---|---|---|---|---|---|---|---|
| Orthorhombic Phase | Orthorhombic Phase to Hexagonal Phase Transition | Hexagonal Phase | Other Phases | |||||
| [66] | Spectra® 900 | Unconstrained; Mw = 2 × 10⁶ | 5 K/min | ≃143–144 | ||||
| Spectra® 900 | Constrained; Mw = 2 × 10⁶ | 5 K/min | 143 | 155 | 159 | |||
| Spectra® 900 | Unconstrained; Mw = 7 × 10⁵ | 5 K/min | 143 | 155 | ||||
| Spectra® 900 | Constrained; Mw = 7 × 10⁵ | 5 K/min | 142 | 153 | 155 | |||
| [86] | Non-commercial | Constrained | [0.4; 0.8] | [1.25 °C/min; 20 °C/min] | [142; 147] | [152; 154] | [160; 166] | |
| Constrained | [0.4; 0.8] | 5 °C/min | 143.5 | 153 | 164 | |||
| [106] | Non-commercial | Unconstrained | 10 °C/min | 145 | ||||
| Constrained fibers with epoxy resin | 10 °C/min | 153 | 176 | |||||
| [39] | Hifax 1900 | Constrained; one winded a piece of 30 cm | 0.1 °C/min | 152 | ||||
| [13] | Dyneema® SK60 | 141 | ||||||
| [34] | Spectra® 1000 | Constrained; First heating | [3.5; 4] | 5 °C/min | 150 | 160 | ||
| Spectra® 1000 | Constrained; Second heating | [3.5; 4] | 5 °C/min | 141 | ||||
| Spectra® 1000 | Constrained; First heating | [3.5; 4] | [5 °C/min; 29.9 °C/min] | [150; 172] | [160; 188] | |||
| [28] | Spectra® 1000 | Constrained during 2 and 10 min | [3.5; 4] | 5 °C/min | 150 (superheating of the crystals) | ≃152 | ||
| Spectra® 1000 | Unconstrained | [3.5; 4] | 5 °C/min | 150 (superheating of the crystals) | ≃152 | 160 | ||
| [35] | Spectra® 900 | 0.024 | 10 K/min | ≃143 | ||||
| Spectra® 900 | [0,891; 4] | 10 K/min | ≃146–147 | [150; 155] | ||||
| [49] | Hizex powder (Mitsui Petrochemical Industries) | Mw = [89.6; 456]. 10−4 | 10 | 10 °C/min | [145; 150] | |||
| HF210 HDPE pellets (Idemitsu) | 10 | 10 °C/min | 130 | |||||
| [100] | Constrained Spectra® 900 | Cut fibers of ≃ 0.5 mm; Mw > 106 | [0.025; 1.2] | 10 K/min | [142.05; 143.65] | [150.35; 152.6] | ||
| Unconstrained Spectra® 900 | Cut fibers of ≃ 0.5 mm; Mw > 106 | [0.025; 1.2] | 10 K/min | 144 | ||||
| [44] | Non-commercial | Draw ratio = 1; Mw = 4.5 × 10⁶ | 0.5 | 3 °C/min | 132 | |||
| Draw ratio between 20 and 150; Mw = 4.5 × 10⁶ | 0.5 | 3 °C/min | [136; 142] | [148; 152] | 154 | |||
| [22] | Dyneema® SK75 | Fibers compacts, prepared at 145 °C | [9; 12] | 1 K/min | 145 | 151 and a shoulder at 152 | 155 | |
| Cross-linked fibers compacts, prepared at 145 °C | [9;12] | 1 K/min | ≃146–147 | 151 | 155 | |||
| Cross-linked fibers compacts, prepared at 150 °C | [9; 12] | 1 K/min | 148 | 153 | 156 | Melting of the orthorhombic folded chain at 138 | ||
Table A2.
A summary table of the various mechanical tests presented in this review and the related conditions.
Table A2.
A summary table of the various mechanical tests presented in this review and the related conditions.
| Authors | Type of Test | Type of Fiber | Condition | Test Control | Gauge Length | Study Range | Strain Calculation | Mechanical Characteristics |
|---|---|---|---|---|---|---|---|---|
| [23] | Tensile test | Dyneema® SK75 | Fibers provided are bonded with epoxy resin to a stiff frame | Machine cross head displacement at speeds [0.04; 160 mm/min] | [40; 200 mm] | Several strain rates: 0.1; 1; 4 and 100%/min | Determined through the displacement of the testing machine crosshead | 1%/min: 71 (Y), 2.4 (S), 3.95 (E) 4%/min: 71 (Y), 2.4 (S), 4 (E) 100%/min: 62 (Y), 2.4 (S), 3.76 (E) 0.1%/min: 56 (Y), 2.4 (S), 4.88 (E) |
| Tensile test | Dyneema® SK75 | Fibers provided are bonded with epoxy resin to a stiff frame | Machine cross head displacement at speeds [0.04; 160 mm/min] | Several temperatures [70; 140 °C] | Only curves but Y ≃ [5; 71] and S ≃ [0.250; 2.4] | |||
| Creep test | Dyneema® SK75 | A constant load was applied to specimens through a small metallic lever. | Constant load | Several temperatures [70; 140 °C] and constant loads 360 and 575 MPa | Only curves | |||
| [24] | Tensile test | Dyneema® SK60 | The fibers were simply gripped in the jaws between pieces of thin cardboard to prevent damage. “For tests below room temperature, the fibers were taped to a mounting board to allow them to be quickly positioned in the machine and to avoid too great a temperature rise”. | A strain gauge bridge system with appropriate amplification provides signals directly proportional to the maximum and average load on the fiber under test and actuates a servomechanism. | 150 mm and 30 mm for zero and negative temperatures | Several temperatures [−175; 100 °C], 10 mm/min | Defined from grip displacement | All values for these temperatures: −175, −160, −125, −100, −60, −30, 0, 24, 40, 70, 100 °C; Y = [114.1; 29.3], S = [0.6; 3.76] |
| Tensile test | Dyneema® SK60 | The fibers were simply gripped in the jaws between pieces of thin cardboard to prevent damage. | A strain gauge bridge system with appropriate amplification | Different gauge lengths | 24 °C, 50% relative humidity, 10 mm/min | |||
| Creep test | Dyneema® SK60 | Constant load hold by the machine | 150 mm | Constant load at 70% of the average breaking for many temperatures [25; 100 °C] | All values for 25, 40, 55, 70, 85, 100 °C; Er = [7.15; 20.16], T = [1561; 7816] | |||
| [24] | Creep test | Dyneema® SK60 | Constant load hold by the machine | 150 mm | Constant load between [50; 85%] of the average breaking at 70 and 100 °C | For 70 °C, all values for 50, 60, 70, 80 and 85%; Er = [8.5; 16.78], T = [306; 9194] For 100 °C, all values for 50, 60, 70, 80 and 85%; Er = [17.53; 21.20], T = [556, 2957] | ||
| [41] | Tensile test | Non-commercial | The sample and clamps were surrounded by a brass cylinder, which was also surrounded by a glass dewar. A flow of cold nitrogen was used to cool the brass cylinder if necessary. For temperatures above room temperature, the test was conducted in a dynamometer anda heating device, consisting of two heated brass blocks. The sample is placed in a cavity left. | Elongation rate: 3.3 × 10⁻³ s−1 | 50 mm | Many temperatures: [−150; 139 °C] | Only curves | |
| [39] | Tensile test | Hifax 1900 | Machine crosshead speed: 24 mm/min | 50 mm | Room temperature, annealing temperatures between [149; 152 °C] during [1; 24 h] | For initial fiber, Y = 150 and E = 3 and for annealing at 149 °C during 24 h, Y = 70 and E = 6, otherwise no precise value, only curves | ||
| [38] | Dead-load test | Hifax 1900 | Various weights are attached to the free end of the specimen | 50 cm | Room temperature | Defined from grip displacement | Only curves | |
| Tensile test | Hifax 1900 | Several crosshead speeds corresponding to [3.3 × 10⁻⁵; 3.6 × 10⁻² s−1] | Room temperature | Only curves but E ≃ [3; 6.5] and S ≃ [2.3; 4] | ||||
| [37] | Dead-load test | Hifax 1900, then fibers are crosslinked | 25 cm | Various temperatures: [25; 143 °C] | Only curves for lifetime at 25, 43, 73, 98, 121, 138, and 143 °C for various nominal stresses | |||
| Tensile test | Hifax 1900, then fibers are crosslinked | Machine crosshead speed: 12 mm/min | 25 mm | At 20 °C | ||||
| [45] | Tensile test | Gel-spun yarns | Experiments carried out according to ISO 2062 | Machine crosshead speed: 250 mm/min | 25 cm | With aging temperature of 43, 65, 90, and 115 °C for weeks | Standard ISO 2062 | Only curves for various aging at 43, 65, 90, and 115 °C |
| [33] | Tensile test | Spectra® 900 | Special capstan inserts were developed to fit standard Instron pneumatic grips. | 50 mm | Several strain rates: [0.004; 1.0 min−1], at 21 °C and 65% RH | 0.004 min−1: S = 2.126 0.04 min−1: S = 2.652 0.10 min−1: S = 2.982 0.40 min−1: S = 3.040 1.0 min−1: S = 3.336 | ||
| Tensile test | Spectra® 900 | Special capstan inserts were developed to fit standard Instron pneumatic grips. | Various gauge lengths: [10; 100 mm] | At 21 °C, 65% RH, and 0.1 min−1 | 10 mm: S = 2.992 50 mm: S = 2.982 100 mm: S = 3.025 200 mm: S = 3.053 | |||
| [14] | Tensile test | Dyneema® SK76 | Yarn is wrapped around a semicircular anvil. For rate tests > 100 s−1, a projectile load the system, whereas for test < 100 s−1, the load is applied by a servo-hydraulic machine. It is connected to the device by a loading rod. | Various gauge lengths: [5; 20 mm] | Several strain rates: [10−3; 104 s−1] | DIC from the identification of two marker bands. Measurements verified with a LVDT system on the machine crosshead | Only curves but Y ≃ [92; 130], S ≃ [2; 2.6], and D ≃ [2; 3.2] | |
| [36] | Cyclic deformations | Hifax 1900 (2 different Mw) | Pneumatic action grips are used. Fibers can’t slip because the gripping force is adjusted via the air pressure. | Constant crosshead speed: 50 mm/min | 500 mm | Only curves | ||
| Stress relaxation | Hifax 1900 (2 different Mw) | Only curves | ||||||
| [36] | Tensile test | Hifax 1900 (2 different Mw) | 28 mm | Several crosshead speeds: [0.5; 512 mm/min] | Only curves but S ≃ [0.88; 1.15] | |||
| Tensile test | Hifax 1900 specimen b | Constant crosshead speed: 50 mm/min | 500 mm | Various draw ratio: 15, 30 and 70 | S = [0.85; 4.16]; Y = [22.6; 175], Elastic D = [2.38; 3.8] and Plastic D = [1.56; 21.17] | |||
| [46] | Tensile test | Dyneema® SK60 | The oven is thermostatically controlled and pneumatic clamps are used. | 250 mm | Several strain rates: [10−5; 101 s−1]; and temperatures: [−40; 80 °C] | Only curves but Y ≃ [20; 100] and S ≃ [1; 2.2] | ||
| Creep test | Dyneema® SK60 | The oven is thermostatically controlled and pneumatic clamps are used. Yarns are glued on cardboard tabs. | Different stress levels: [250; 1250 MPa]; and temperatures: [23; 90 °C] | Determined through an extensometer | Only curves | |||
| [29] | Creep test | Dyneema® SK60 | Two tensile test machines used: one commercial and an in-house-built. | Stress range 0.65–2 GPa for a period of 30 h | Measured from an optical extensometer with a video camera | Only curves | ||
| [15] | Tensile test | Made from UHMWPE sheets (GUR 410) | After pre-heat treatments, return to room temperature in an oven. | Constant crosshead speed: 3 mm/min | Before the test, pre-heat treatments of the UHMWPE specimens at 50, 80, and 100 °C for 2 and 4 h. Tests at room temperature. | Defined from an extensometer clipped on to the specimen | Virgin: 1.136 (Y), 0.025 (S) 50 °C 2 h: 1.264 (Y), 0.026 (S) 50 °C 4 h: 1.350 (Y), 0.0276 (S) 80 °C 2 h: 1.358 (Y), 0.0268 (S) 80 °C 4 h: 1.410 (Y), 0.02865 (S) 100 °C 2 h: 1.390 (Y), 0.0275 (S) 100 °C 4 h: 1.420 (Y), 0.0292 (S) | |
| DMA tests | Made from UHMWPE sheets (GUR 410) | Before the test, pre-heat treatments of the UHMWPE specimens at 50, 80, and 100 °C for 2 and 4 h. Frequency range from 0.01 to 100 Hz at temperatures from 30 to 100 °C, achieved using a heating rate of 1 °C/min. | Only curves | |||||
| [25] | Stress relaxation | Dyneema® SK60 | The oven is thermostatically controlled and pneumatic clamps are used. | Constant crosshead speed | Several temperatures: 13, 50 and 90 °C, and different Hencky strains: [0.2; 2%] | Only curves | ||
| Creep tests | Dyneema® SK60 | The oven is thermostatically controlled and pneumatic clamps are used. | Constant stresses | At 50 °C, and different stresses: 0.4 and 0.8 GPa | Only curves | |||
| Stress build-up under a constant Hencky strain rate | Dyneema® SK60 | Pneumatic clamps are used. | Constant Hencky strain rates | Several Hencky strain rates: [8.4 × 10⁻⁴; 4.2 × 10⁻⁷ s−1] | Only curves | |||
| [32] | DMA tests | Dyneema® SK66 | To prevent creep, a relatively low static stress level of 150 MPa was chosen. | 20 mm | Different frequencies: [0.2; 3 Hz]; and temperatures: [−20; 105 °C] | Only curves but DM ≃ [40; 120] | ||
| Stress relaxation | Dyneema® SK66 | Fiber ends were glued on cardboard tabs with an epoxy resin, to improve clamping. | 255 mm | Several strains: [0.5; 2.5%]; and temperatures [30; 70 °C], loading times < 150 h | Defined from an extensometer | Only curves | ||
| [32] | Creep test (dead-load test) | Dyneema® SK66 | Fiber ends were glued on cardboard tabs with an epoxy resin, to improve clamping. | 255 mm | Different loads: [200; 1500 MPa], and temperatures: [30; 90 °C], loading times < 50 h | Only curves | ||
| [40] | Creep test (dead-load test) | Made from commercial PE grades (Rigidex 50 and H020-54P) | Constant load | Test at 20 °C and several applied stresses: [0.05; 0.5 GPa] depending on the sample | Determined from grip displacement | Curves and values of the modulus and the viscosity of each element of the four elements mechanical model proposed | ||
| [111] | Creep test (dead-load test) | Made from commercial PE grades (Rigidex 50, H020-54P and 002-55) | Constant load | 10 cm | Loading times between 24 and 48 h, temperature [20; 70 °C], and stress levels [0.1; 0.2 GPa] | Determined from grip displacement | Only curves | |
| [112] | Creep test (dead-load test) | Made from commercial PE grades (Rigidex 50 and H020-54P) | Constant load | 10 cm | Stress levels [0.093; 0.3 GPa] | Determined from grip displacement | Curves and fitted parameters to modified model | |
| Authors | Type of test | Type of fiber | Condition | Test control | Gauge length | Study range | Strain calculation | Mechanical characteristics |
| [112] | Stress relaxation | Made from commercial PE grades (Rigidex 50) | A purpose-built device was designed. the fixed-grip was attached to a bending beam load cell, and the second one was driven, via an electro-magnetic clutch, by a variable speed gearbox. | Maximum stress applied: 0.27 GPa, stress relaxation between 0.2 and 106 s. | Only curves | |||
| [12] | Tensile test | Dyneema® SK60 | Pneumatic fiber clamps are used. | 250 mm | Several strain rates: [10−5; 10−1 s−1], and temperatures [−40; 80 °C] | Determined from grip displacement | Only curves but Y ≃ [20; 100] and S ≃ [1; 2.2] | |
| Creep tests | Dyneema® SK60 | Yarns are provided with adhesive cardboard tabs. | Constant load | Several stresses: [250; 1250 MPa], and temperatures [23; 90 °C] | Defined from an extensometer | Only curves | ||
| DMA tests | Spectra® 1000 | Uniaxial extension tests were carried out. | Different frequencies: [0.2; 3 Hz]; and temperatures: [−20; 105 °C] | Only curves | ||||
| [153] | Step stress relaxation tests | Alathon 7050 | An electric motor operating via a gearbox, controlled by an electromagnetic clutch, allows the application of a strain and the force in the specimen sensed by a strain gauge transducer. A microcomputer controls the motor and clutch with digital signals. | Fast loading at 1.2 × 10⁻³ s−1 | 65 mm | Lower limit stress: 205 MPa, and different steps: [13.7; 58.4 MPa] | Only curves |
Y: Young’s Modulus (GPa); S: Tensile Strength (GPa); E or D: Elongation or strain at rupture (%); Er: Average strain to failure (%); Tr: average lifetime (s); DM: dynamic modulus (GPa).
References
- Cabrera, N.; Alcock, B.; Loos, J.; Peijs, T. Processing of all-polypropylene composites for ultimate recyclability. Proc. Inst. Mech. Eng. Part L J. Mater. Des. Appl. 2004, 218, 145–155. [Google Scholar] [CrossRef]
- Eurostat. End-of-Life Vehicle Statistics. 2020. Available online: https://ec.europa.eu/eurostat/statistics-explained/pdfscache/24943.pdf (accessed on 22 April 2021).
- Witten, E.; Mathes, V.; Sauer, M.; Kühnel, M. Composites Market Report 2018, Market Developments, Trends, Outlooks and Challenges. In Federation of Reinforced Plastics; Available online: https://compositesuk.co.uk/system/files/documents/2018%20European%20Market%20Report.pdf (accessed on 2 June 2021).
- Capiati, N.J.; Porter, R.S. The concept of one polymer composites modelled with high density polyethylene. J. Mater. Sci. 1975, 10, 1671–1677. [Google Scholar] [CrossRef]
- Gao, C.; Meng, L.; Yu, L.; Simon, G.P.; Liu, H.; Chen, L.; Petinakis, S. Preparation and characterization of uniaxial poly(lactic acid)-based self-reinforced composites. Compos. Sci. Technol. 2015, 117, 392–397. [Google Scholar] [CrossRef]
- Karger-Kocsis, J.; Bárány, T. Single-polymer composites (SPCs): Status and future trends. Compos. Sci. Technol. 2014, 92, 77–94. [Google Scholar] [CrossRef] [Green Version]
- Wu, C.M.; Lin, P.C.; Murakami, R. Long-term creep behavior of self-reinforced PET composites. Express Polym. Lett. 2017, 11, 820–831. [Google Scholar] [CrossRef]
- Stellbrink, K.K.U.; Hausser, G.; Steegmuller, R. One-component composites as functionally gradient materials. J. Thermoplast. Compos. Mater. 1999, 12, 188–200. [Google Scholar] [CrossRef]
- Ward, I.M.; Hine, P.J. The science and technology of hot compaction. Polymer 2004, 45, 1413–1427. [Google Scholar] [CrossRef]
- Gao, C.; Yu, L.; Liu, H.; Chen, L. Development of self-reinforced polymer composites. Prog. Polym. Sci. 2012, 37, 767–780. [Google Scholar] [CrossRef]
- Deng, M.; Shalaby, S.W. Properties of self-reinforced ultra-high-molecular-weight polyethylene composites. Biomaterials 1997, 18, 645–655. [Google Scholar] [CrossRef]
- Peijs, T.; Smets, E.A.M.; Govaert, L.E. Strain rate and temperature effects on energy absorption of polyethylene fibres and composites. Appl. Compos. Mater. 1994, 1, 35–54. [Google Scholar] [CrossRef]
- Marais, C.; Feillard, P. Manufacturing and mechanical characterization of unidirectional polyethylene-fibre/polyethylene-matrix composites. Compos. Sci. Technol. 1992, 45, 247–255. [Google Scholar] [CrossRef]
- Russell, B.P.; Karthikeyan, K.; Deshpande, V.S.; Fleck, N.A. The high strain rate response of Ultra High Molecular-weight Polyethylene: From fibre to laminate. Int. J. Impact Eng. 2013, 60, 1–9. [Google Scholar] [CrossRef]
- Fouad, H.; Mourad, A.H.; Barton, D.C. Effect of pre-heat treatment on the static and dynamic thermo-mechanical properties of ultra-high molecular weight polyethylene. Polym. Test. 2005, 24, 549–556. [Google Scholar] [CrossRef]
- Hine, P.J.; Ward, I.M.; Jordan, N.D.; Olley, R.; Bassett, D.C. The hot compaction behaviour of woven oriented polypropylene fibres and tapes. I. Mechanical properties. Polymer 2003, 44, 1117–1131. [Google Scholar] [CrossRef]
- Vecchione, P.; Acierno, D.; Abbate, M.; Russo, P. Hot-compacted self reinforced polyamide 6 composite laminates. Compos. Part B Eng. 2017, 110, 39–45. [Google Scholar] [CrossRef]
- Schneider, C.; Kazemahvazi, S.; Åkermo, M.; Zenkert, D. Compression and tensile properties of self-reinforced poly(ethylene terephthalate)-composites. Polym. Test. 2013, 32, 221–230. [Google Scholar] [CrossRef] [Green Version]
- Rojanapitayakorn, P.; Mather, P.T.; Goldberg, A.J.; Weiss, R.A. Optically transparent self-reinforced poly(ethylene terephthalate) composites: Molecular orientation and mechanical properties. Polymer 2005, 46, 761–773. [Google Scholar] [CrossRef]
- Kazemahvazi, S.; Schneider, C.; Deshpande, V.S. A constitutive model for self-reinforced ductile polymer composites. Compos. Part A Appl. Sci. Manuf. 2015, 71, 32–39. [Google Scholar] [CrossRef]
- Li, L.; Liu, X.; Zhou, X.; Hong, J.; Zhuang, X.; Yan, X. Mechanical properties of unidirectional continuous fiber self-reinforced polyethylene graded laminates. Polym. Compos. 2015, 36, 128–137. [Google Scholar] [CrossRef]
- Ratner, S.; Weinberg, A.; Wachtel, E.; Moret, P.M.; Marom, G. Phase transitions in UHMWPE fiber compacts studied by in situ synchrotron microbeam WAXS. Macromol. Rapid Commun. 2004, 25, 1150–1154. [Google Scholar] [CrossRef]
- Kromm, F.X.; Lorriot, T.; Coutand, B.; Harry, R.; Quenisset, J.M. Tensile and creep properties of ultra high molecular weight PE fibres. Polym. Test. 2003, 22, 463–470. [Google Scholar] [CrossRef]
- Dessain, B.; Moulaert, O.; Keunings, R.; Bunsell, A.R. Solid phase change controlling the tensile and creep behaviour of gel-spun high-modulus polyethylene fibres. J. Mater. Sci. 1992, 27, 4515–4522. [Google Scholar] [CrossRef]
- Leblans, P.J.R.; Bastiaansen, C.W.M.; Govaert, L.E. Viscoelastic properties of UHMW-PE fibers in simple elongation. J. Polym. Sci. Part B Polym. Phys. 1989, 27, 1009–1016. [Google Scholar] [CrossRef] [Green Version]
- Govaert, L.E.; Lemstra, P.J. Deformation behavior of oriented UHMW-PE fibers. Colloid Polym. Sci. 1992, 270, 455–464. [Google Scholar] [CrossRef]
- McDaniel, P.B.; Deitzel, J.M.; Gillespie, J.W. Structural hierarchy and surface morphology of highly drawn ultra high molecular weight polyethylene fibers studied by atomic force microscopy and wide angle X-ray diffraction. Polymer 2015, 69, 148–158. [Google Scholar] [CrossRef]
- Hsieh, Y.-L.; Hu, X.-P. Structural transformation of ultra-high modulus and molecular weight polyethylene fibers by high-temperature wide-angle X-ray diffraction. J. Polym. Sci. Part B Polym. Phys. 1997, 35, 623–630. [Google Scholar] [CrossRef]
- Berger, L.; Kausch, H.; Plummer, C.J. Structure and deformation mechanisms in UHMWPE-fibres. Polymer 2003, 44, 5877–5884. [Google Scholar] [CrossRef]
- Tashiro, K.; Sasaki, S.; Kobayashi, M. Structural investigation of orthorhombic-to-hexagonal phase transition in polyethylene crystal: The experimental confirmation of the conformationally disordered structure by X-ray diffraction and infrared/raman spectroscopic measurements. Macromolecules 1996, 29, 7460–7469. [Google Scholar] [CrossRef]
- Rein, D.M.; Shavit, L.; Khalfin, R.L.; Cohen, Y.; Terry, A.; Rastogi, S. Phase transitions in ultraoriented polyethylene fibers under moderate pressures: A synchrotron X-ray study. J. Polym. Sci. Part B Polym. Phys. 2004, 42, 53–59. [Google Scholar] [CrossRef]
- Govaert, L.; Bastiaansen, C.; Leblans, P. Stress-strain analysis of oriented polyethylene. Polymer 1993, 34, 534–540. [Google Scholar] [CrossRef]
- Schwartz, P.; Netravali, A.; Sembach, S. Effects of strain rate and gauge length on the failure of ultra-high strength polyethylene fibers. Text. Res. J. 1986, 56, 502–508. [Google Scholar] [CrossRef]
- Hsieh, Y.L.; Ju, J. Melting behavior of ultra-high modulus and molecular weight polyethylene (UHMWPE) fibers. J. Appl. Polym. Sci. 1994, 53, 347–354. [Google Scholar] [CrossRef]
- Boller, A.; Wunderlich, B. Multiple melting peak analysis with gel-spun ultra-high molar mass polyethylene. J. Therm. Anal. 1997, 49, 343–349. [Google Scholar] [CrossRef] [Green Version]
- Van der Werff, H.; Pennings, A.J. Tensile deformation of high strength and high modulus polyethylene fibers. Colloid Polym. Sci. 1991, 269, 747–763. [Google Scholar] [CrossRef]
- Smook, J.; Hamersma, W.; Pennings, A.J. The fracture process of ultra-high strength polyethylene fibres. J. Mater. Sci. 1984, 19, 1359–1373. [Google Scholar] [CrossRef]
- Dijkstra, D.J.; Pennings, A.J. The role of taut tie molecules on the mechanical properties of gel-spun UHMWPE fibres. Polym. Bull. 1988, 19. [Google Scholar] [CrossRef]
- Dijkstra, D.J.; Pennings, A.J. Annealing of gel-spun hot-drawn ultra-high molecular weight polyethylene fibres. Polym. Bull. 1988, 19, 481–486. [Google Scholar] [CrossRef]
- Wilding, M.; Ward, I. Tensile creep and recovery in ultra-high modulus linear polyethylenes. Polymer 1978, 19, 969–976. [Google Scholar] [CrossRef]
- Dijkstra, D.J.; Torfs, J.C.M.; Pennings, A.J. Temperature-dependent fracture mechanisms in ultra-high strength polyethylene fibers. Colloid Polym. Sci. 1989, 267, 866–875. [Google Scholar] [CrossRef]
- R’Mili, M.; Murat, M. Caractérisation des fibres par amélioration de l’essai sur mèche avec mesure directe de la déformation. Comptes Rendus Académie Sci. Ser. IIB Mech. Phys. Chem. Astron. 1997, 324, 355–364. [Google Scholar] [CrossRef]
- Chi, Z.; Chou, T.W.; Shen, G. Determination of single fibre strength distribution from fibre bundle testings. J. Mater. Sci. 1984, 19, 3319–3324. [Google Scholar] [CrossRef]
- Yeh, J.-T.; Lin, S.-C.; Tu, C.-W.; Hsie, K.-H.; Chang, F.-C. Investigation of the drawing mechanism of UHMWPE fibers. J. Mater. Sci. 2008, 43, 4892–4900. [Google Scholar] [CrossRef]
- Forster, A.L.; Forster, A.M.; Chin, J.W.; Peng, J.-S.; Lin, C.-C.; Petit, S.; Kang, K.-L.; Paulter, N.; Riley, M.A.; Rice, K.D.; et al. Long-term stability of UHMWPE fibers. Polym. Degrad. Stab. 2015, 114, 45–51. [Google Scholar] [CrossRef]
- Govaert, L.E.; Peijs, T. Tensile strength and work of fracture of oriented polyethylene fibre. Polymer 1995, 36, 4425–4431. [Google Scholar] [CrossRef]
- Carothers, W.H.; Hill, J.W. Studies of polymerization and ring formation. XV. Artificial fibers from synthetic linear condensation superpolymers. J. Am. Chem. Soc. 1932, 54, 1579–1587. [Google Scholar] [CrossRef]
- Ohta, T. Review on processing ultra high tenacity fibers from flexible polymer. Polym. Eng. Sci. 1983, 23, 697–703. [Google Scholar] [CrossRef]
- Rudnik, E.; Dobkowski, Z. Thermal degradation of UHMWPE. J. Therm. Anal. 1997, 49, 471–475. [Google Scholar] [CrossRef]
- Barham, P.J.; Keller, A. High-strength polyethylene fibres from solution and gel spinning. J. Mater. Sci. 1985, 20, 2281–2302. [Google Scholar] [CrossRef]
- Frank, F.C. The strength and stiffness of polymers. Proc. R. Soc. Lond. Math. Phys. Sci. 1970, 319, 127–136. [Google Scholar] [CrossRef]
- Holliday, L. The stiffness of polymers in relation to their structure. In Structure and Properties of Oriented Polymers; Ward, I.M., Ed.; Springer: Dordrecht, The Netherlands, 1975; pp. 242–263. [Google Scholar] [CrossRef]
- Yeh, J.; Chang, S. Ultradrawing behavior of gel films of ultrahigh molecular weight polyethylene and low molecular weight polyethylene blends at varying drawing conditions. Polym. Eng. Sci. 2002, 42, 1558–1567. [Google Scholar] [CrossRef]
- Song, M.S.; Hu, G.X. Study on the relationship between the mechanical properties and processing for self-reinforced polymers: A method for estimating the theoretical strength of UHMWPE fiber. Polym. Test. 1991, 10, 367–378. [Google Scholar] [CrossRef]
- Bigg, D.M. A review of techniques for processing ultra-high modulus polymers. Polym. Eng. Sci. 1976, 16, 725–734. [Google Scholar] [CrossRef]
- Chodák, I. High modulus polyethylene fibres: Preparation, properties and modification by crosslinking. Prog. Polym. Sci. 1998, 23, 1409–1442. [Google Scholar] [CrossRef]
- Smook, J.; Pennings, J. Influence of draw ratio on morphological and structural changes in hot-drawing of UHMW polyethylene fibres as revealed by DSC. Colloid Polym. Sci. 1984, 262, 712–722. [Google Scholar] [CrossRef]
- Peterlin, A. Drawing and extrusion of semi-crystalline polymers. Colloid Polym. Sci. 1987, 265, 357–382. [Google Scholar] [CrossRef]
- Capaccio, G.; Ward, I.M. Preparation of ultra-high modulus linear polyethylenes; effect of molecular weight and molecular weight distribution on drawing behaviour and mechanical properties. Polymer 1974, 15, 233–238. [Google Scholar] [CrossRef]
- Capaccio, G.; Ward, I.M. Properties of ultra-high modulus linear polyethylenes. Nat. Phys. Sci. 1973, 243, 143. [Google Scholar] [CrossRef]
- Capaccio, G.; Ward, I.M. Ultra-high-modulus linear polyethylene through controlled molecular weight and drawing. Polym. Eng. Sci. 1975, 15, 219–224. [Google Scholar] [CrossRef]
- Smith, P.; Lemstra, P.J. Ultra-high-strength polyethylene filaments by solution spinning/drawing. J. Mater. Sci. 1980, 15, 505–514. [Google Scholar] [CrossRef] [Green Version]
- Lemstra, P.J.; Kirschbaum, R.; Ohta, T.; Yasuda, H. High-strength/high-modulus structures based on flexible macromolecules: Gel-spinning and related processes. In Developments in Oriented Polymers—2; Ward, I.M., Ed.; Springer: Dordrecht, The Netherlands, 1987; pp. 39–77. [Google Scholar] [CrossRef] [Green Version]
- Smith, P.; Lemstra, P.J.; Booij, H.C. Ultradrawing of high-molecular-weight polyethylene cast from solution. II. Influence of initial polymer concentration. J. Polym. Sci. Polym. Phys. Ed. 1981, 19, 877–888. [Google Scholar] [CrossRef] [Green Version]
- Klein, P.G.; Woods, D.W.; Ward, I.M. The effect of electron irradiation on the structure and mechanical properties of highly drawn polyethylene fibers. J. Polym. Sci. Part B Polym. Phys. 1987, 25, 1359–1379. [Google Scholar] [CrossRef]
- Tsubakihara, S.; Nakamura, A.; Yasuniwa, M. Melting and crystallization of ultra-high molecular weight polyethylene with appearance of hexagonal phase I. Melting processes of fibers under constrained state. Polym. J. 1996, 28, 489–495. [Google Scholar] [CrossRef] [Green Version]
- Taylor, W.N.; Clark, E.S. Superdrawn filaments of polypropylene. Polym. Eng. Sci. 1978, 18, 518–526. [Google Scholar] [CrossRef]
- Irvine, P.A.; Smith, P. Development of the axial Young’s modulus with draw ratio of flexible-chain polymers. Macromolecules 1986, 19, 240–242. [Google Scholar] [CrossRef]
- Porter, R.S.; Wang, L.-H. Uniaxial extension and order development in flexible chain polymers. J. Macromol. Sci. Part C Polym. Rev. 1995, 35, 63–115. [Google Scholar] [CrossRef]
- Peterlin, A. Molecular model of drawing polyethylene and polypropylene. J. Mater. Sci. 1971, 6, 490–508. [Google Scholar] [CrossRef]
- Grubb, D.T.; Keller, A. Thermal contraction and extension in fibrous crystals of polyethylene. Colloid Polym. Sci. 1978, 256, 218–233. [Google Scholar] [CrossRef]
- Grubb, D.T.; Li, Z.-F. Molecular stress distribution and creep of high-modulus polyethylene fibres. Polymer 1992, 33, 2587–2597. [Google Scholar] [CrossRef]
- Hu, W.-G.; Schmidt-Rohr, K. Characterization of ultradrawn polyethylene fibers by NMR: Crystallinity, domain sizes and a highly mobile second amorphous phase. Polymer 2000, 41, 2979–2987. [Google Scholar] [CrossRef]
- Clark, E.S.; Scott, L.S. Superdrawn crystalline polymers: A new class of high-strength fiber. Polym. Eng. Sci. 1974, 14, 682–686. [Google Scholar] [CrossRef]
- Reneker, D.H. Point dislocations in crystals of high polymer molecules. J. Polym. Sci. 1962, 59, S39–S42. [Google Scholar] [CrossRef]
- Sprague, B.S. Relationship of structure and morphology to properties of “hard” elastic fibers and films. J. Macromol. Sci. Part B 1973, 8, 157–187. [Google Scholar] [CrossRef]
- Clark, E.S. Structure and Properties of Polymer Films; Springer: Boston, MA, USA, 1973. [Google Scholar] [CrossRef]
- Patell, Y.R.; Schultz, J.M. Microstructure and tensile behavior of solid-state polymerized polyoxymethylene. J. Macromol. Sci. Part B 1973, 7, 445–464. [Google Scholar] [CrossRef]
- Southern, J.H.; Porter, R.S. The properties of polyethylene crystallized under the orientation and pressure effects of a pressure capillary viscometer. J. Appl. Polym. Sci. 1970, 14, 2305–2317. [Google Scholar] [CrossRef]
- Southern, J.H.; Porter, R.S. Polyethylene crystallized under the orientation and pressure of a pressure capillary viscometer. Part I. J. Macromol. Sci. Part B 1970, 4, 541–555. [Google Scholar] [CrossRef]
- Desper, C.R.; Southern, J.H.; Ulrich, R.D.; Porter, R.S. Orientation and structure of polyethylene crystallized under the orientation and pressure effects of a pressure capillary viscometer. J. Appl. Phys. 1970, 41, 4284–4289. [Google Scholar] [CrossRef]
- Zachariades, A.; Kanamoto, T. High Modulus Polymers with Stiff and Flexible Chains; Marcel Dekker Inc.: New York, NY, USA, 1987. [Google Scholar]
- Gibson, A.G.; Davies, G.R.; Ward, I.M. Dynamic mechanical behaviour and longitudinal crystal thickness measurements on ultra-high modulus linear polyethylene: A quantitative model for the elastic modulus. Polymer 1978, 19, 683–693. [Google Scholar] [CrossRef]
- Arridge, R.G.C.; Barham, P.J. A fibre composite model of drawn crystalline polymers. Polymer 1978, 19, 654–658. [Google Scholar] [CrossRef]
- Gao, X.; Jensen, R.E.; Li, W.; Deitzel, J.; McKnight, S.H.; Gillespie, J.W. Effect of fiber surface texture created from silane blends on the strength and energy absorption of the glass fiber/epoxy interphase. J. Compos. Mater. 2008, 42, 513–534. [Google Scholar] [CrossRef]
- Pennings, A.J.; Zwijnenburg, A. Longitudinal growth of polymer crystals from flowing solutions. VI. Melting behavior of continuous fibrillar polyethylene crystals. J. Polym. Sci. Polym. Phys. Ed. 1979, 17, 1011–1032. [Google Scholar] [CrossRef]
- Li, J.; Lee, Y.-W. Evolution of morphology in high molecular weight polyethylene during die drawing. J. Mater. Sci. 1993, 28, 6496–6502. [Google Scholar] [CrossRef]
- Iguchi, M.; Tonami, H.; Kawai, T. Crystallization of polyethylene under molecular orientation. Kolloid Z. Z. Polym. 1967, 221, 28–40. [Google Scholar] [CrossRef]
- Peterlin, A. Crystalline character in polymers. J. Polym. Sci. Part C Polym. Symp. 1965, 9, 61–89. [Google Scholar] [CrossRef]
- Kobayashi, K.; Geil, P.H. Polymer Single Crystals; Interscience Publisher: New York, NY, USA, 1963. [Google Scholar]
- Judge, J.T.; Stein, R.S. Growth of crystals from molten crosslinked oriented polyethylene. J. Appl. Phys. 1961, 32, 2357–2363. [Google Scholar] [CrossRef]
- Pennings, A.J. Fractionation of polymers by crystallization from solutions. II. J. Polym. Sci. Part C Polym. Symp. 1967, 16, 1799–1812. [Google Scholar] [CrossRef]
- Mackley, M.R.; Keller, A. Flow induced polymer chain extension and its relation to fibrous crystallization. Philos. Trans. R. Soc. Lond. Ser. Math. Phys. Sci. 1975, 278, 29–66. [Google Scholar] [CrossRef]
- Wikjord, A.G.; John Manley, R.S. The morphology of fibrillar polyethylene crystals. J. Macromol. Sci. Part B 1968, 2, 501–537. [Google Scholar] [CrossRef]
- Keller, A.; Willmouth, F.M. Some macroscopic properties of stirring-induced crystals of polyethylene. J. Macromol. Sci. Part B 1972, 6, 493–537. [Google Scholar] [CrossRef]
- Pennings, A.J. Bundle-like nucleation and longitudinal growth of fibrillar polymer crystals from flowing solutions. J. Polym. Sci. Polym. Symp. 1977, 59, 55–86. [Google Scholar] [CrossRef]
- Pennings, A.J.; Lageveen, R.; de Vries, R.S. Hydrodynamically induced crystallization of polymers from solution: VII.: On the origin of persistent lamellar overgrowth of Shish-kebab fibers. Colloid Polym. Sci. 1977, 255, 532–542. [Google Scholar] [CrossRef]
- Barham, P.J. Gelation and the production of stiff polyethylene fibres. Polymer 1982, 23, 1112–1122. [Google Scholar] [CrossRef]
- Hill, M.J.; Barham, P.J.; Keller, A. On the hairdressing of shish-kebabs. Colloid Polym. Sci. 1980, 258, 1023–1037. [Google Scholar] [CrossRef]
- Kwon, Y.K.; Boller, A.; Pyda, M.; Wunderlich, B. Melting and heat capacity of gel-spun, ultra-high molar mass polyethylene fibers. Polymer 2000, 41, 6237–6249. [Google Scholar] [CrossRef]
- Tzou, D.L.; Schmidt-Rohr, K.; Spiess, H.W. Solid-state n.m.r. studies of crystalline phases in gel-spun ultrahigh molecular weight polyethylene. Polymer 1994, 35, 4728–4733. [Google Scholar] [CrossRef]
- Kaji, A.; Ohta, Y.; Yasuda, H.; Murano, M. Phase structural analysis of ultra high-molecular weight polyethylene fibers by solid state high resolution NMR. Polym. J. 1990, 22, 455–462. [Google Scholar] [CrossRef] [Green Version]
- Takahashi, Y.; Ishida, T.; Furusaka, M. Monoclinic-to-orthorhombic transformation in polyethylene. J. Polym. Sci. Part B Polym. Phys. 1988, 26, 2267–2277. [Google Scholar] [CrossRef]
- Hellmuth, E.; Wunderlich, B. Superheating of linear high-polymer polyethylene crystals. J. Appl. Phys. 1965, 36, 3039–3044. [Google Scholar] [CrossRef]
- Clough, S.B. Melting of stress-crystallized polyethylene. J. Macromol. Sci. Part B 1970, 4, 199–214. [Google Scholar] [CrossRef]
- Van Aerle, N.A.J.M.; Lemstra, P.J. Chain-extended polyethylene in composites—Melting and relaxation behaviour—. Polym. J. 1988, 20, 131–141. [Google Scholar] [CrossRef] [Green Version]
- Tsubakihara, S.; Nakamura, A.; Yasuniwa, M. Hexagonal phase of polyethylene fibers under high pressure. Polym. J. 1991, 23, 1317–1324. [Google Scholar] [CrossRef] [Green Version]
- Clough, S.B. Melting of drawn polyethylene films. J. Appl. Polym. Sci. 1971, 15, 2141–2148. [Google Scholar] [CrossRef]
- Vaughan, A.S.; Ungar, G.; Bassett, D.C.; Keller, A. On hexagonal phases of paraffins and polyethylenes. Polymer 1985, 26, 726–732. [Google Scholar] [CrossRef]
- Ungar, G.; Keller, A. Effect of radiation on the crystals of polyethylene and paraffins: 1. Formation of the hexagonal lattice and the destruction of crystallinity in polyethylene. Polymer 1980, 21, 1273–1277. [Google Scholar] [CrossRef]
- Wilding, M.A.; Ward, I.M. Creep and recovery of ultra high modulus polyethylene. Polymer 1981, 22, 870–876. [Google Scholar] [CrossRef]
- Wilding, M.A.; Ward, I.M. Creep and stress-relaxation in ultra-high modulus linear polyethylene. J. Mater. Sci. 1984, 19, 629–636. [Google Scholar] [CrossRef]
- Govaert, L.; Brown, B.; Smith, P. Temperature dependence of the Young’s modulus of oriented polyethylene. Macromolecules 1992, 25, 3480–3483. [Google Scholar] [CrossRef]
- Roiron, C.; Lainé, E.; Grandidier, J.-C.; Olivier, D.; Garois, N.; Vix, C. Study of the thermomechanical behavior of UHMWPE yarns under different loading paths. Polym. Test. 2020, 89, 106717. [Google Scholar] [CrossRef]
- Phani, K.K. Evaluation of single-fibre strength distribution from fibre bundle strength. J. Mater. Sci. 1988, 23, 941–945. [Google Scholar] [CrossRef]
- Wang, Y.; Xia, Y.M. Experimental and theoretical study on the strain rate and temperature dependence of mechanical behaviour of Kevlar fibre. Compos. Part A Appl. Sci. Manuf. 1999, 30, 1251–1257. [Google Scholar] [CrossRef]
- Perkins, W.G.; Capiati, N.J.; Porter, R.S. The effect of molecular weight on the physical and mechanical properties of ultra-drawn high density polyethylene. Polym. Eng. Sci. 1976, 16, 200–203. [Google Scholar] [CrossRef]
- Kavesh, S.; Prevorsek, D.C. High Tenacity, High Modulus Polyethylene and Polypropylene Fibers and Intermediates Therefore. U.S. Patent No. 4,413,110, 1 November 1983. [Google Scholar]
- Williams, J.L.; Peterlin, A. A study of the sorption and permeability of gases and vapors in solvent-drawn polyethylene. Makromol. Chem. 1970, 135, 41–47. [Google Scholar] [CrossRef]
- Smith, P.; Lemstra, P.J. Ultra-high strength polyethylene filaments by solution spinning/drawing. 3. Influence of drawing temperature. Polymer 1980, 21, 1341–1343. [Google Scholar] [CrossRef] [Green Version]
- Smith, P.; Lemstra, P.J. Ultrahigh-strength polyethylene filaments by solution spinning/drawing, 2†. Influence of solvent on the drawability. Makromol. Chem. 1979, 180, 2983–2986. [Google Scholar] [CrossRef]
- Kalb, B.; Pennings, A.J. General crystallization behaviour of poly(l-lactic acid). Polymer 1980, 21, 607–612. [Google Scholar] [CrossRef]
- Wu, W.; Simpson, P.G.; Black, W.B. Morphology and tensile property relations of high-strength/high-modulus polyethylene fiber. J. Polym. Sci. Polym. Phys. Ed. 1980, 18, 751–765. [Google Scholar] [CrossRef]
- Zachariades, A.; Kanamoto, T.; Porter, R.S. Solid-state coextrusion of high-density polyethylene. II. Effect of molecular weight and molecular weight distribution. J. Polym. Sci. Polym. Phys. Ed. 1980, 18, 575–585. [Google Scholar] [CrossRef]
- Smith, P.; Lemstra, P.J.; Pijpers, J.P.L.; Kiel, A.M. Ultra-drawing of high molecular weight polyethylene cast from solution: III. Morphology and structure. Colloid Polym. Sci. 1981, 259, 1070–1080. [Google Scholar] [CrossRef] [Green Version]
- Furuhata, K.; Yokokawa, T.; Miyasaka, K. Drawing of ultrahigh-molecular-weight polyethylene single-crystal mats. J. Polym. Sci. Polym. Phys. Ed. 1984, 22, 133–138. [Google Scholar] [CrossRef]
- Kanamoto, T.; Sherman, E.S.; Porter, R.S. Extrusion of polyethylene single crystals. Polym. J. 1979, 11, 497–502. [Google Scholar] [CrossRef] [Green Version]
- Statton, W.O. Coherence and deformation of lamellar crystals after annealing. J. Appl. Phys. 1967, 38, 4149–4151. [Google Scholar] [CrossRef]
- Ishikawa, K.; Miyasaka, K.; Maeda, M. Drawing of single-crystal mats of linear polyethylene. J. Polym. Sci. Part A-2 Polym. Phys. 1969, 7, 2029–2041. [Google Scholar] [CrossRef]
- Maeda, M.; Miyasaka, K.; Ishikawa, K. Properties and structures of films drawn from polyethylene single-crystal mats. J. Polym. Sci. Part A-2 Polym. Phys. 1970, 8, 355–369. [Google Scholar] [CrossRef]
- Barham, P.J.; Keller, A. A study on the achievement of high-modulus polyethylene fibres by drawing. J. Mater. Sci. 1976, 11, 27–35. [Google Scholar] [CrossRef]
- Jarecki, L.; Meier, D.J. Ultra-high modulus polyethylene. 1 Effect of drawing temperature. Polymer 1979, 20, 1078–1082. [Google Scholar] [CrossRef]
- Bashir, Z.; Odell, J.A.; Keller, A. High modulus filaments of polyethylene with lamellar structure by melt processing; the role of the high molecular weight component. J. Mater. Sci. 1984, 19, 3713–3725. [Google Scholar] [CrossRef]
- Barham, P.J.; Keller, A. Some observations on the production of polyethylene fibres by the surface growth method. J. Mater. Sci. 1980, 15, 2229–2235. [Google Scholar] [CrossRef]
- Pennings, A.J.; Schouteten, C.J.H.; Kiel, A.M. Hydrodynamically induced crystallization of polymers from solution. V. Tensile properties of fibrillar polyethylene crystals. J. Polym. Sci. Part C Polym. Symp. 1972, 38, 167–193. [Google Scholar] [CrossRef]
- Smook, J.; Torfs, J.C.; van Hutten, P.F.; Pennings, A.J. Ultra-high strength polyethylene by hot drawing of surface growth fibers. Polym. Bull. 1980, 2, 293–300. [Google Scholar] [CrossRef]
- Capaccio, G.; Crompton, T.A.; Ward, I.M. The drawing behavior of linear polyethylene. I. Rate of drawing as a function of polymer molecular weight and initial thermal treatment. J. Polym. Sci. Polym. Phys. Ed. 1976, 14, 1641–1658. [Google Scholar] [CrossRef]
- Smith, P.; Lemstra, P.J. Ultra-drawing of high molecular weight polyethylene cast from solution. Colloid Polym. Sci. 1980, 258, 891–894. [Google Scholar] [CrossRef] [Green Version]
- Koh, A.C.P.; Shim, V.P.W.; Tan, V.B.C. Dynamic behaviour of UHMWPE yarns and addressing impedance mismatch effects of specimen clamps. Int. J. Impact Eng. 2010, 37, 324–332. [Google Scholar] [CrossRef]
- Huang, W.; Wang, Y.; Xia, Y. Statistical dynamic tensile strength of UHMWPE-fibers. Polymer 2004, 45, 3729–3734. [Google Scholar] [CrossRef]
- Matsuo, M.; Sawatari, C. Temperature dependence of the crystal lattice modulus and the Young’s modulus of polyethylene. Macromolecules 1988, 21, 1653–1658. [Google Scholar] [CrossRef]
- Lacher, R.C.; Bryant, J.L.; Howard, L.N.; Sumners, D.W. Linking phenomena in the amorphous phase of semicrystalline polymers. Macromolecules 1986, 19, 2639–2643. [Google Scholar] [CrossRef]
- Kausch, H.H.; Becht, J. Elektronenspinresonanz, eine molekulare Sonde bei der mechanischen Beanspruchung von Thermoplasten. In Aktuelle Probleme der Polymer-Physik III; Fischer, E.W., Müller, F.H., Eds.; Steinkopff: Heidelberg, Germany, 1972; pp. 56–73. [Google Scholar] [CrossRef]
- Meinel, G.; Peterlin, A. Changes in noncrystalline regions of polyethylene during annealing. J. Polym. Sci. Part B 1967, 5, 613–618. [Google Scholar] [CrossRef]
- Arridge, R.G.C.; Barham, P.J.; Keller, A. Self-hardening of highly oriented polyethylene. J. Polym. Sci. Polym. Phys. Ed. 1977, 15, 389–401. [Google Scholar] [CrossRef]
- Takayanagi, M.; Imada, K.; Kajiyama, T. Mechanical properties and fine structure of drawn polymers. J. Polym. Sci. Part C 1966, 15, 263–281. [Google Scholar] [CrossRef]
- Hosemann, R. Crystalline and paracrystalline order in high polymers. J. Appl. Phys. 1963, 34, 25–41. [Google Scholar] [CrossRef]
- Peterlin, A. Drawing and annealing of fibrous material. J. Appl. Phys. 1977, 48, 4099–4108. [Google Scholar] [CrossRef]
- Decandia, F.; Vittoria, V.; Peterlin, A. Time dependence of mechanical and transport properties of drawn and annealed linear polyethylene. J. Polym. Sci. Polym. Phys. Ed. 1985, 23, 1217–1234, juin. [Google Scholar] [CrossRef]
- De Boer, J.; Pennings, A.J. Crosslinking of ultra-high strength polyethylene fibers by means of γ-radiation. Polym. Bull. 1981, 5, 317–324. [Google Scholar] [CrossRef]
- Govaert, L.E.; D’Hooghe, E.L.J.C.J.; Peijs, A.A.J.M. A micromechanical approach to the viscoelasticity of unidirectional hybrid composites. Composites 1991, 22, 113–119. [Google Scholar] [CrossRef]
- Seitz, J.T.; Balazs, C.F. Application of time-temperature superposition principle to long term engineering properties of plastic materials. Polym. Eng. Sci. 1968, 8, 151–160. [Google Scholar] [CrossRef]
- Sweeney, J.; Ward, I.M. A unified model of stress relaxation and creep applied to oriented polyethylene. J. Mater. Sci. 1990, 25, 697–705. [Google Scholar] [CrossRef]
- Marichin, V.A.; Mjasnikova, L.P.; Zenke, D.; Hirte, R.; Weigel, P. Ultra-high strength and ultra-high modulus fibers from polyethylene. Polym. Bull. 1984, 12, 287–292. [Google Scholar] [CrossRef]
- Woods, D.W.; Busfield, W.K.; Ward, I.M. Improved mechanical behaviour in ultra high modulus polyethylenes by controlled crosslinking. Polym. Commun. 1984, 25, 298–300. [Google Scholar]
- Ohta, Y.; Yasuda, H. The influence of short branches on the α, β and γ-relaxation processes of ultra-high strength polyethylene fibers. J. Polym. Sci. Part B Polym. Phys. 1994, 32, 2241–2249. [Google Scholar] [CrossRef]
Figure 1.
Sketch of moderately (a) and completely extended molecular chains (b), respectively without and with molecular drawing (reprinted with permission from ref. [50]. 2021 Roiron.).
Figure 1.
Sketch of moderately (a) and completely extended molecular chains (b), respectively without and with molecular drawing (reprinted with permission from ref. [50]. 2021 Roiron.).

Figure 2.
Modulus and strength scales for PE (reprinted with permission from ref. [50]. 2021 Roiron.).
Figure 2.
Modulus and strength scales for PE (reprinted with permission from ref. [50]. 2021 Roiron.).
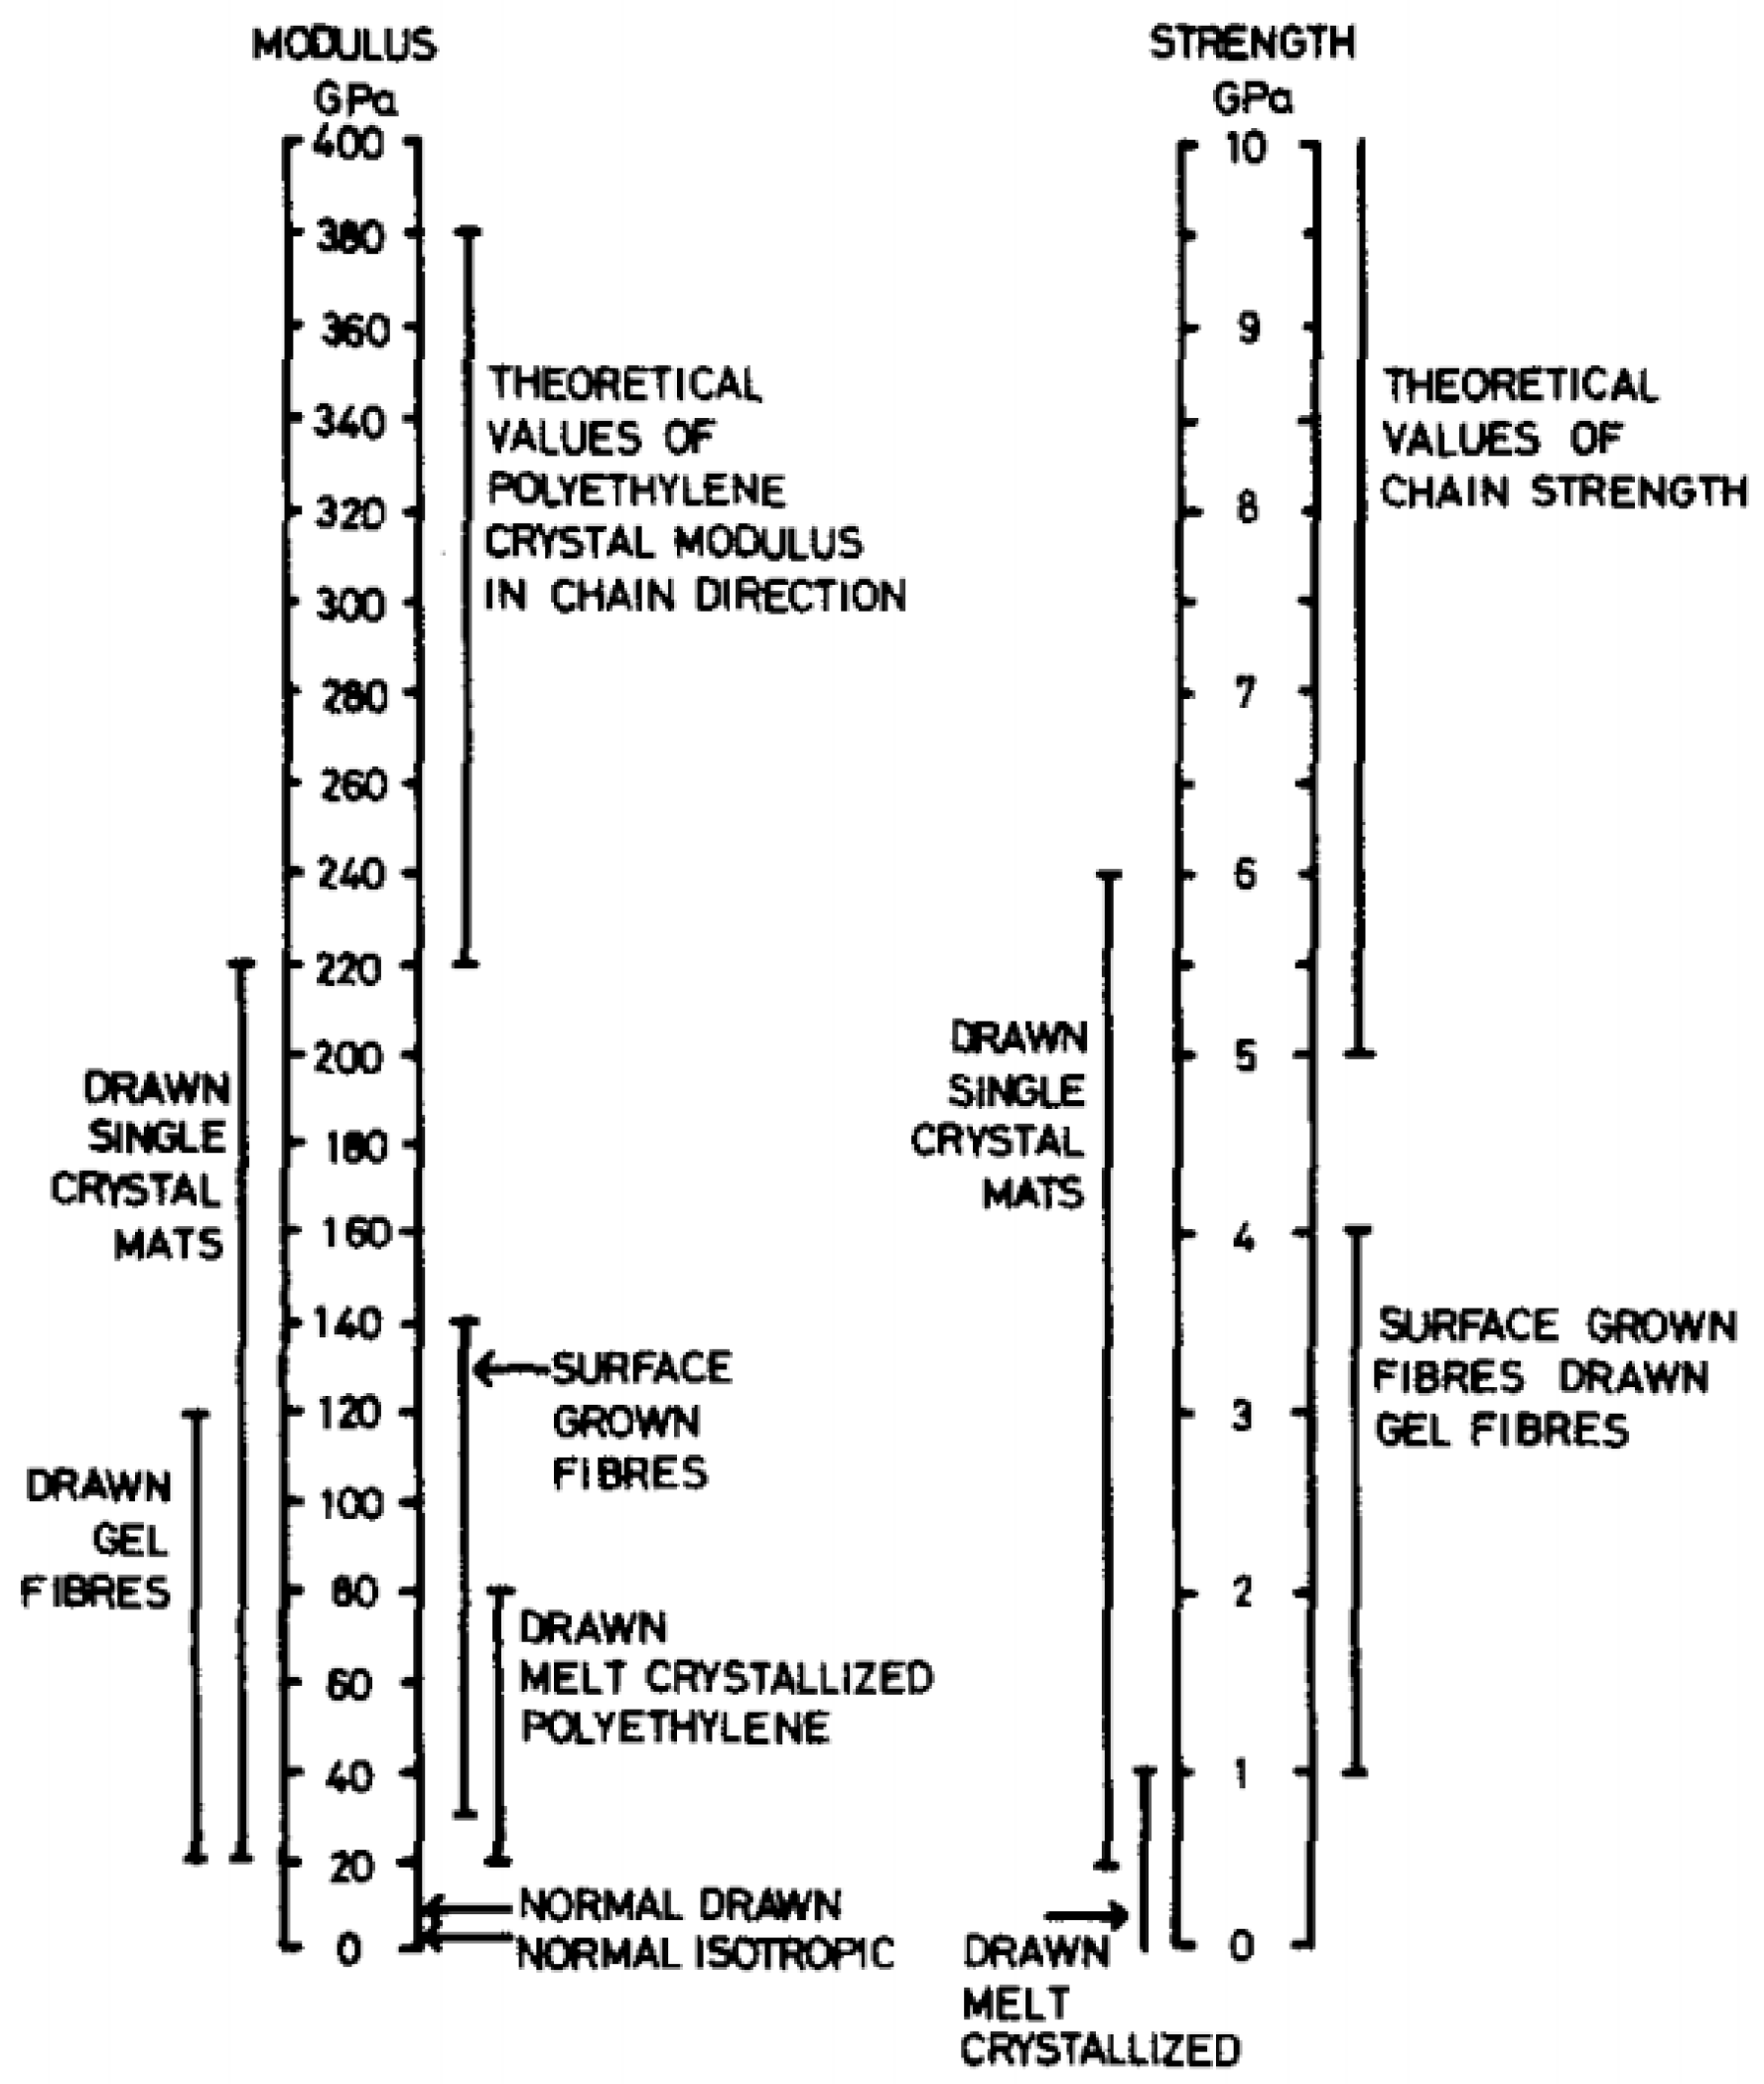
Figure 3.
(a) Fiber (A) (reprinted with permission from [48]) and fibrils (reprinted with permission from ref. [65]. 2021 Roiron.) (B) structure model for a natural draw ratio; (b) Model of a continuous crystalline structure at the ultra-drawing stage (reprinted with permission from ref. [65]. 2021 Roiron.).
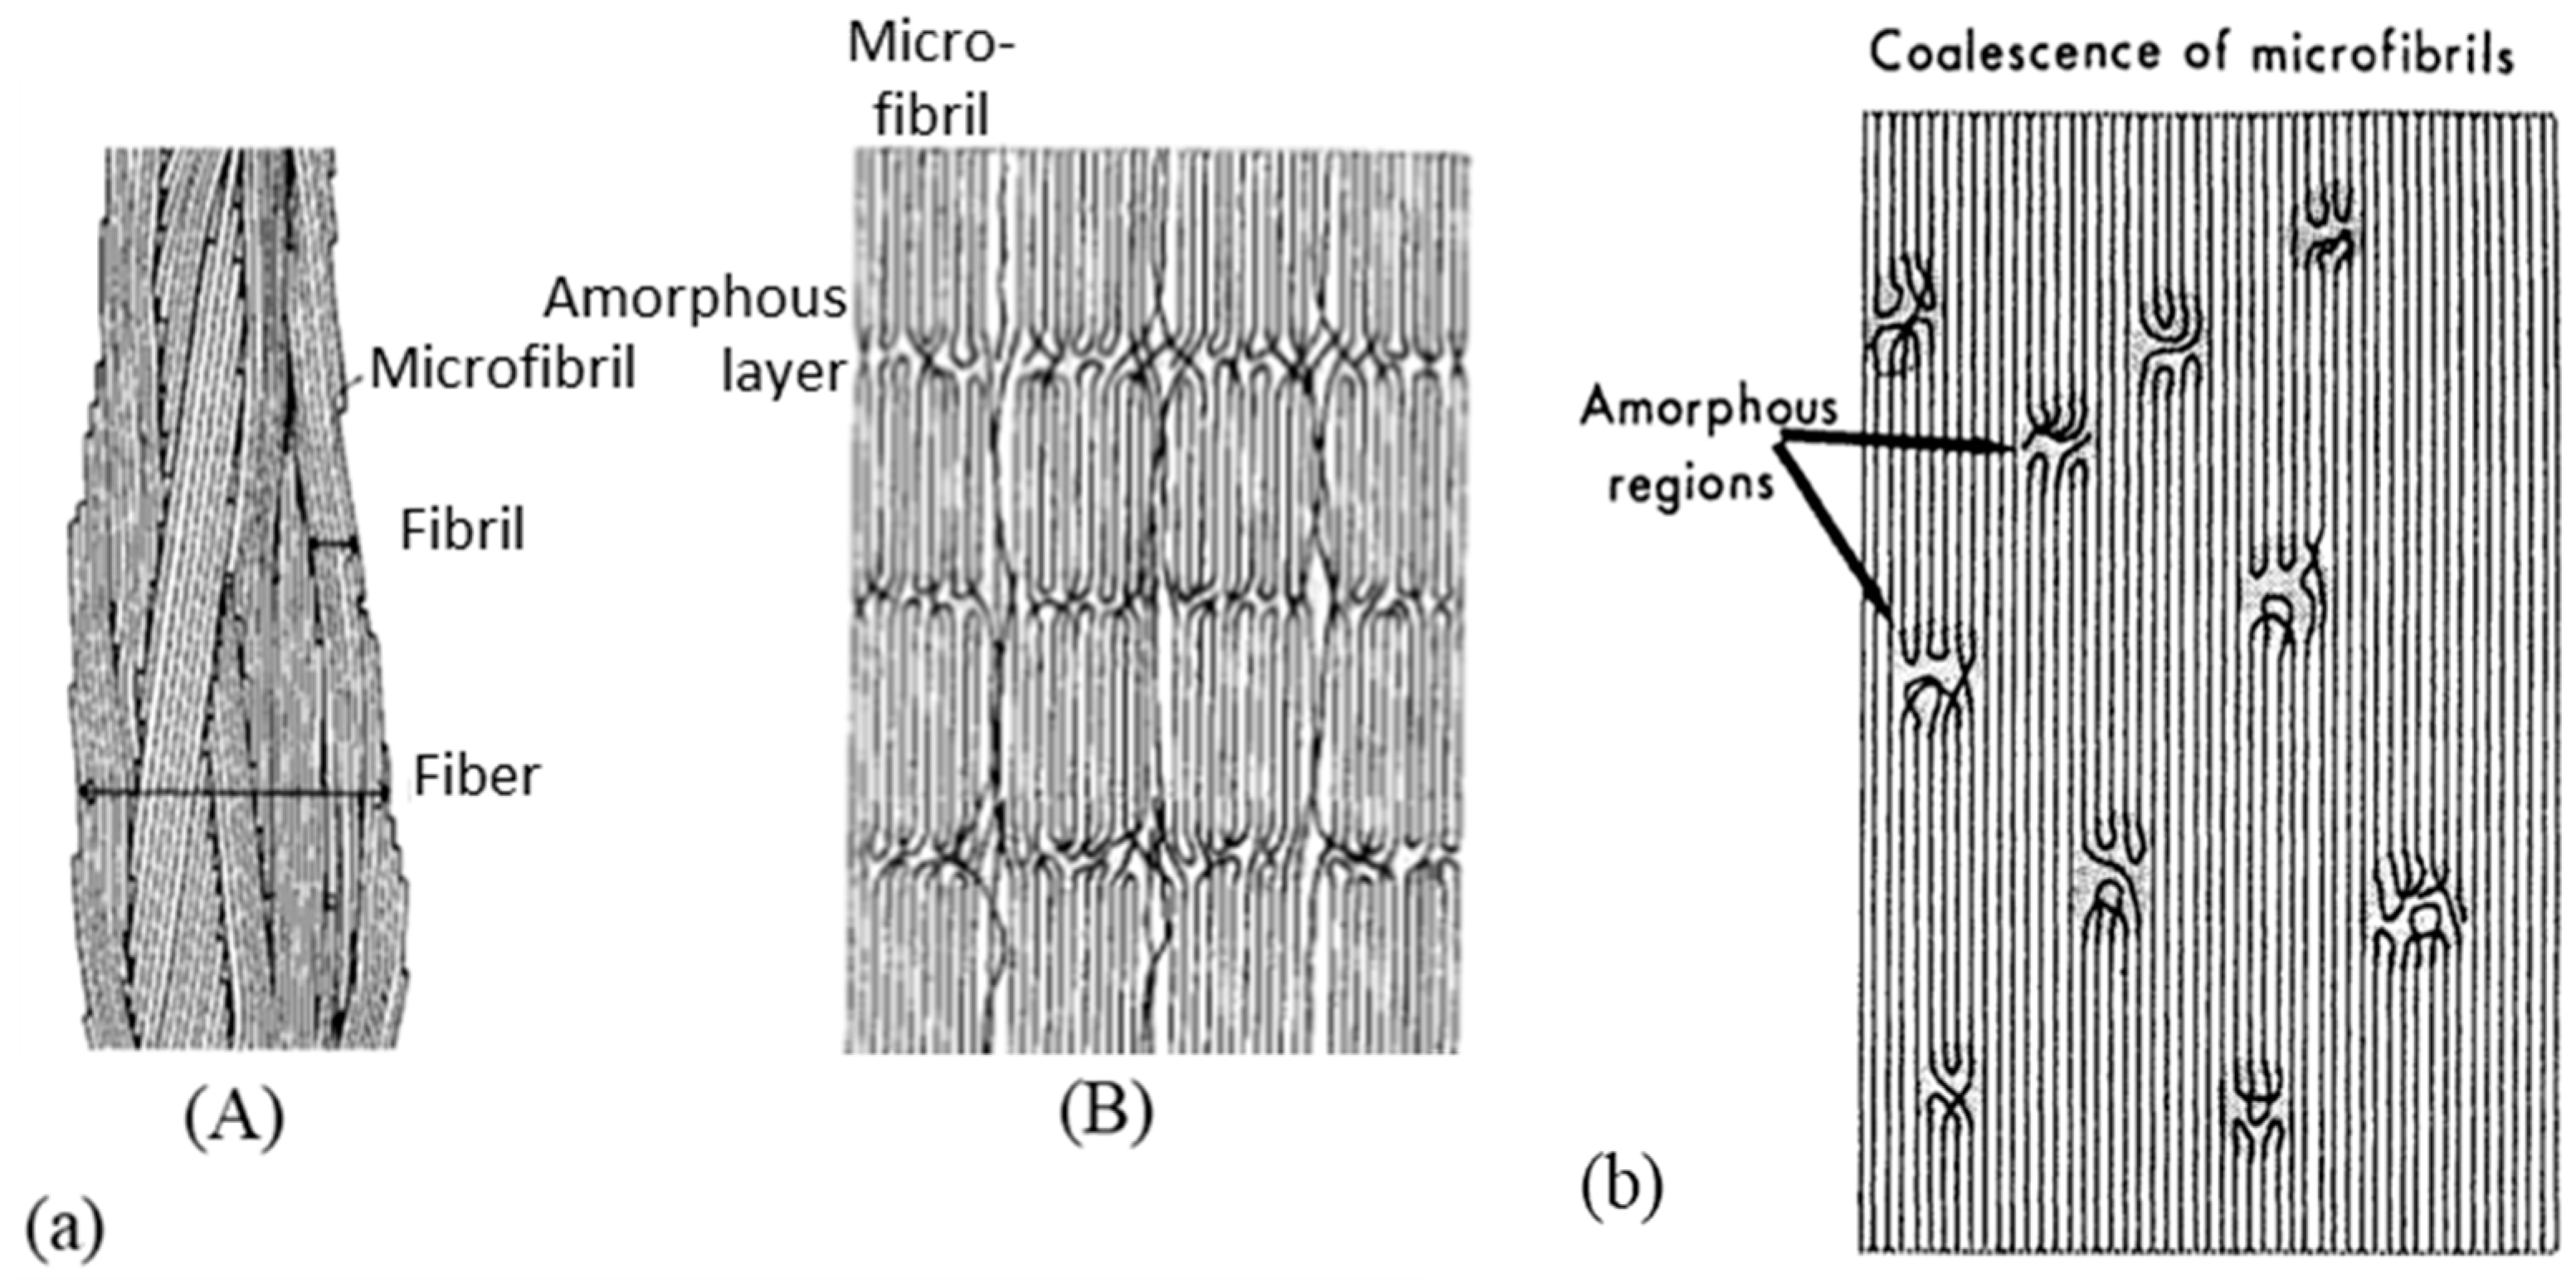
Figure 4.
(a) Description of the microstructure of a Dyneema SK60 fiber (reprinted with permission from ref. [29]. 2021 Roiron.), (b) Schematization of four models ((A) Lamella folded chain model for rigid elastic fibers; (B) Lamella block model for a drawn fibril; (C) Continuous crystalline matrix with folded chain defects; (D) Extended chain model for a drawn fibril) (reprinted with permission from ref. [74]. 2021 Roiron.)), and (c) Two-dimensional mechanical model of a macro fibril of UHMWPE (reprinted with permission from ref. [29]. 2021 Roiron.).
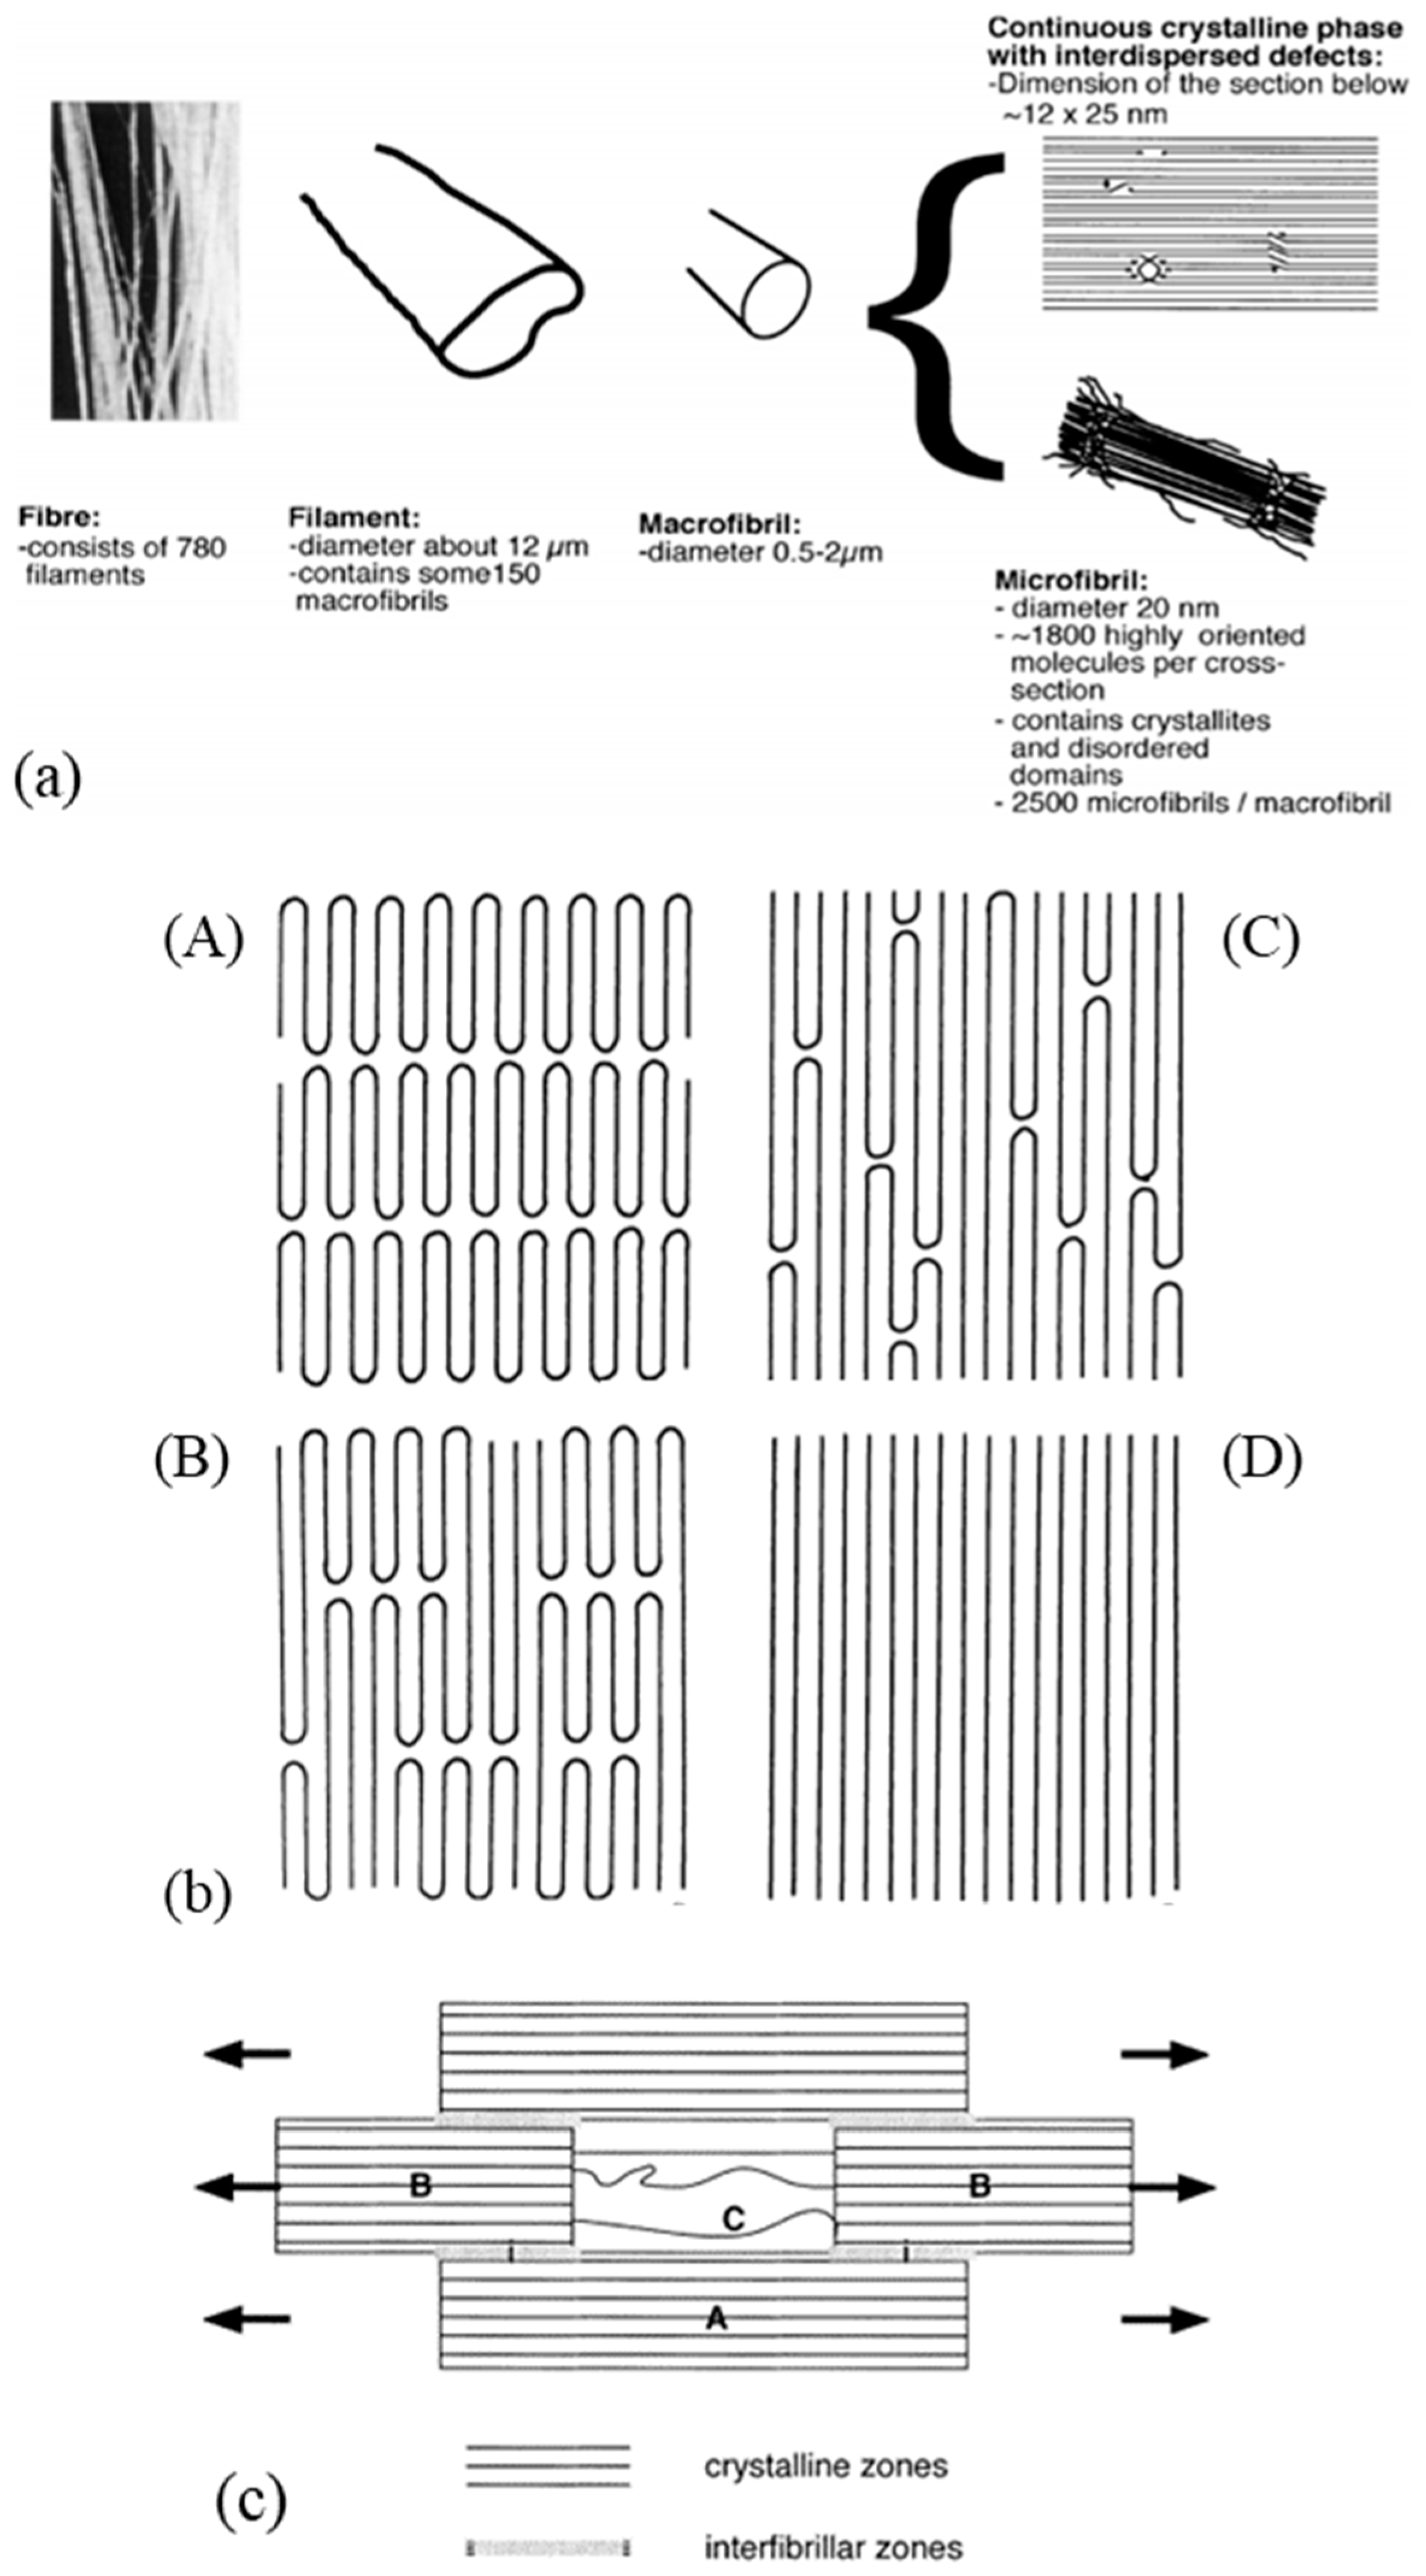
Figure 5.
Observation of (A) the fibrillar structure on a surface of an S130 fiber (5 µm scan) and of (B) epitaxial patterns on the surface of the macro fibrils (1.5 µm scan) (reprinted with permission from ref. [27]. 2021 Roiron.).
Figure 5.
Observation of (A) the fibrillar structure on a surface of an S130 fiber (5 µm scan) and of (B) epitaxial patterns on the surface of the macro fibrils (1.5 µm scan) (reprinted with permission from ref. [27]. 2021 Roiron.).

Figure 6.
(a) Electron microscopic observations of the structure of an undrawn billet ((A) entire spherulites, (B,C) sheaf-like lamellae and (D) the core) (reprinted with permission from ref. [87]. 2021 Roiron.) (b) Electron micrographs of a drawn billet (disintegration of the spherulites at a draw ratio of 6 (A) and 7.5 (B), (C) zoom of (B), and (D) details of the lamellae) (reprinted with permission from ref. [87]. 2021 Roiron.).

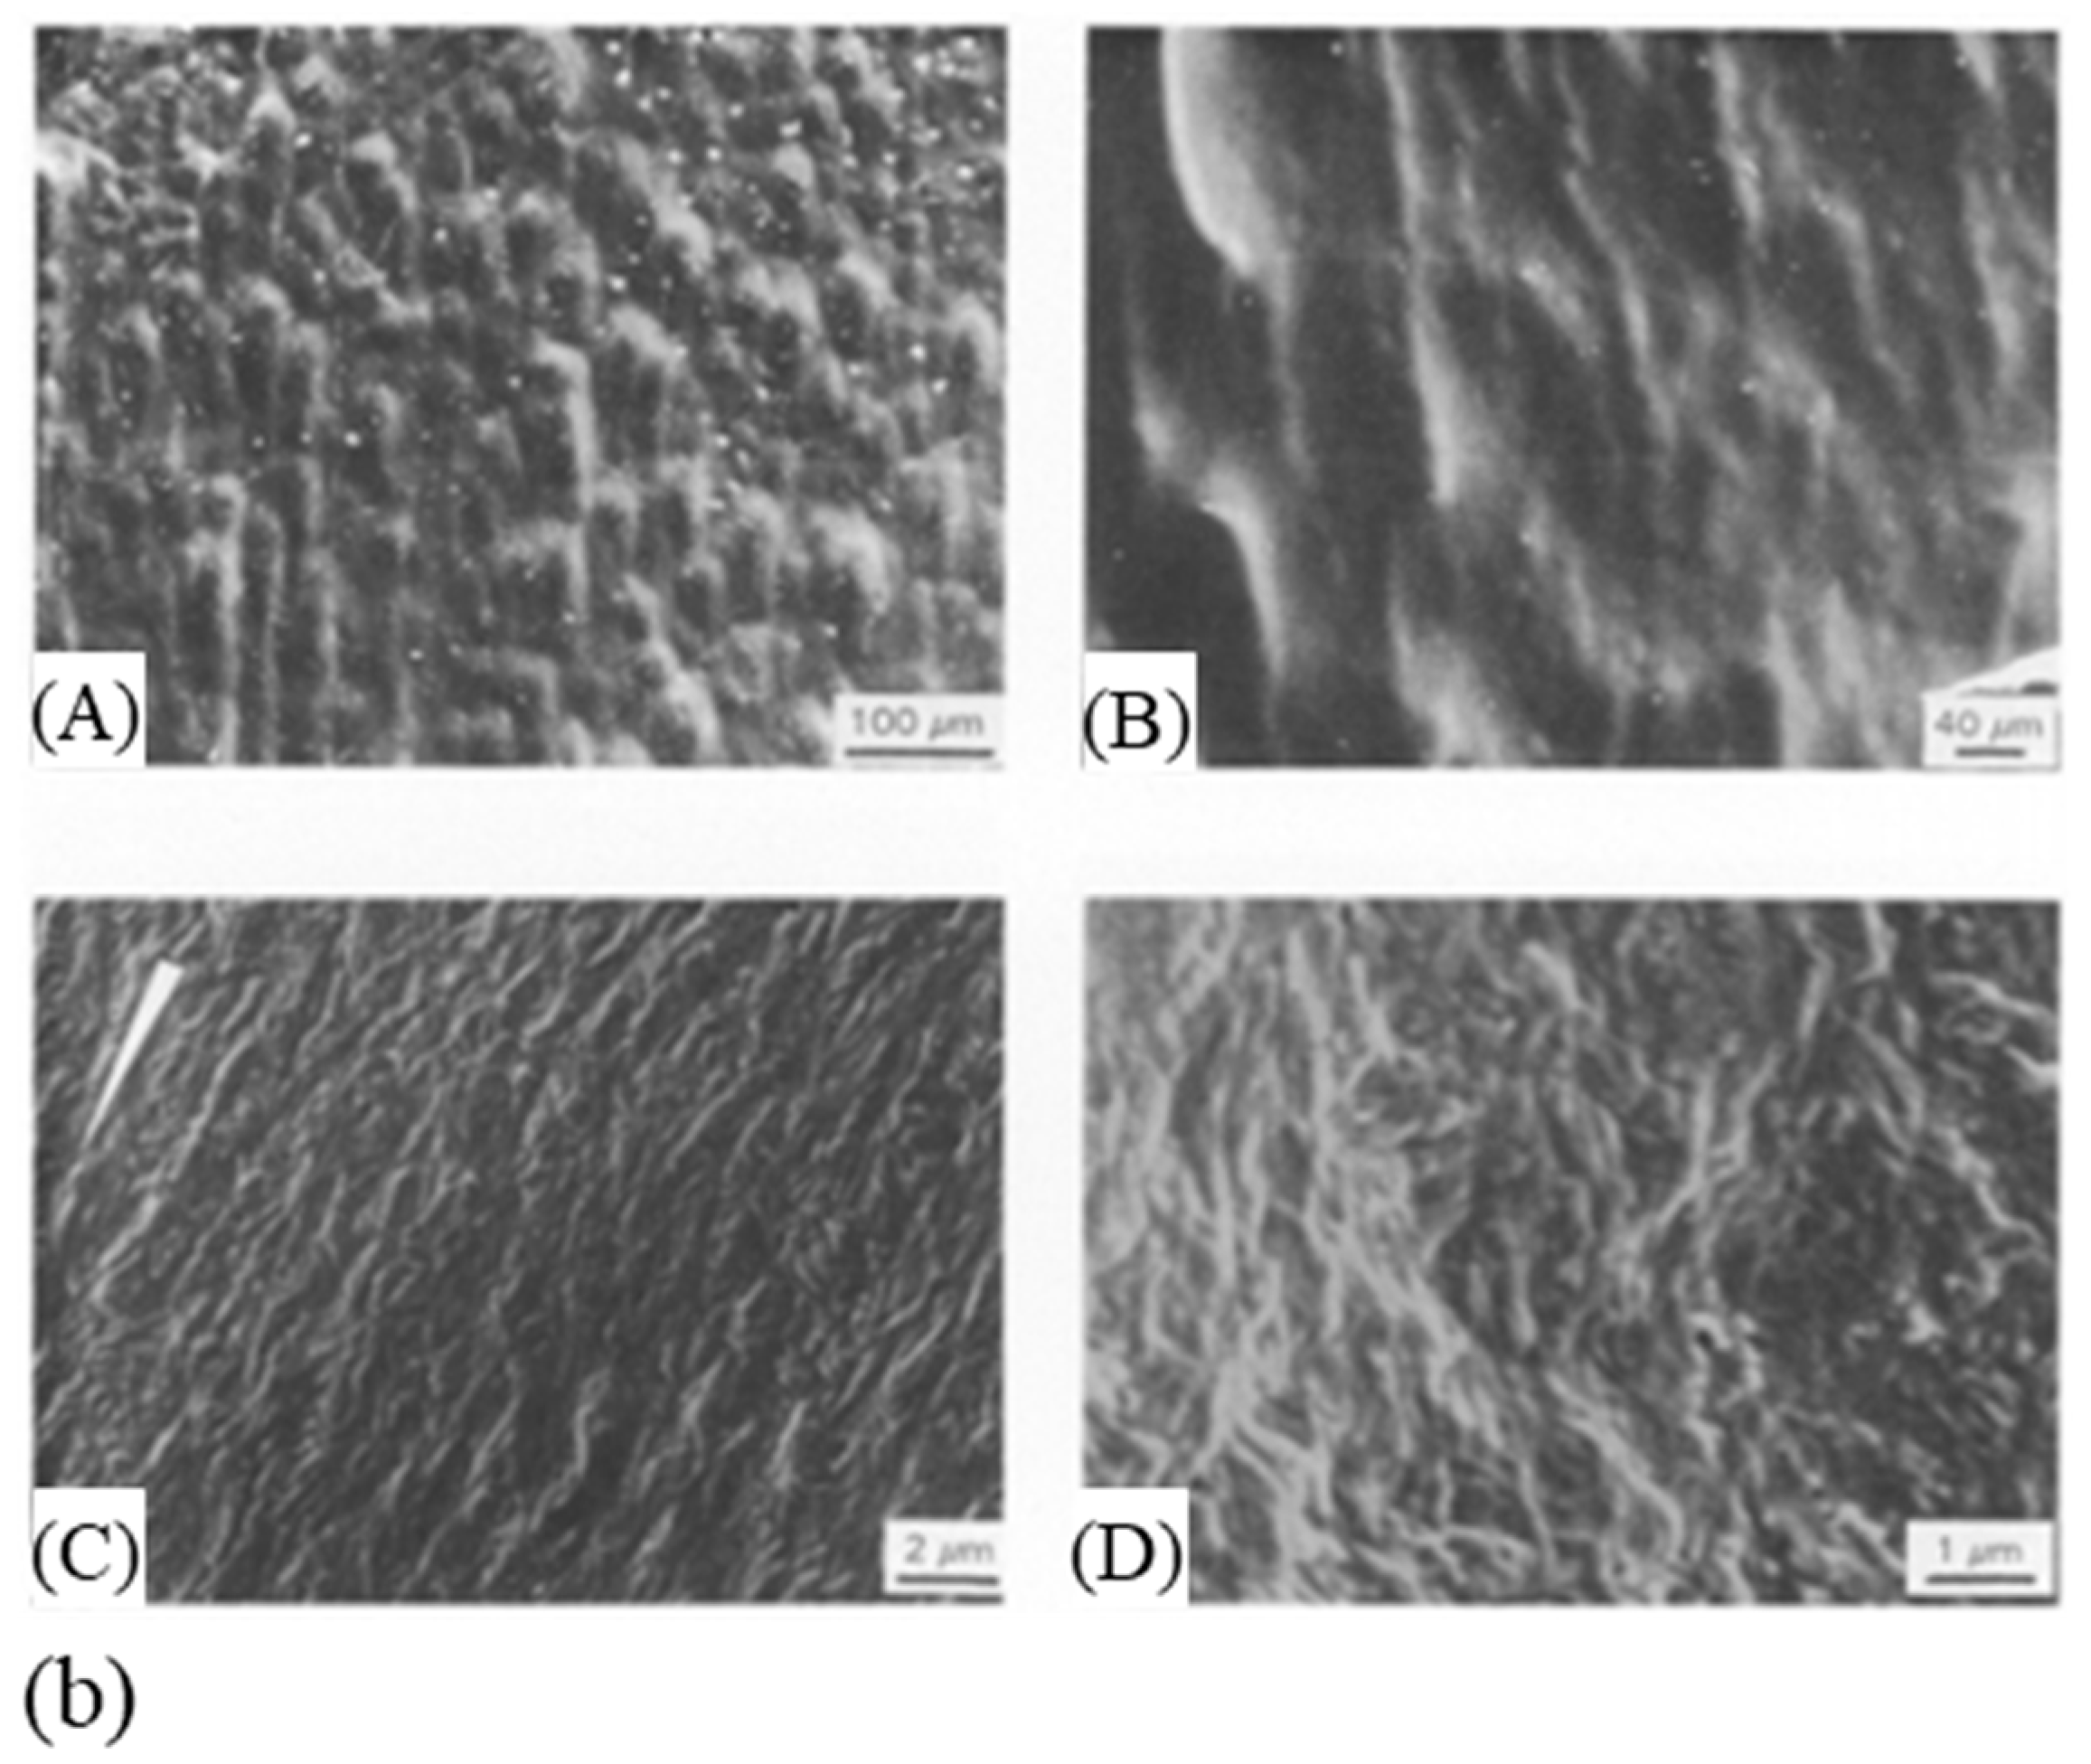
Figure 7.
Electron microscopic observations of the structure of a billet drawn at a ratio of 12.6, (a) at about 100 mm and (b) 200 mm from the exit of the die, with the drawing direction downwards (reprinted with permission from ref. [87]. 2021 Roiron.).
Figure 7.
Electron microscopic observations of the structure of a billet drawn at a ratio of 12.6, (a) at about 100 mm and (b) 200 mm from the exit of the die, with the drawing direction downwards (reprinted with permission from ref. [87]. 2021 Roiron.).

Figure 8.
The model proposed by Judge and Stein for the growth of crystals for crystallization at (a) high and (b) more moderate orientation (reprinted with permission from ref. [91]. 2021 Roiron.).
Figure 8.
The model proposed by Judge and Stein for the growth of crystals for crystallization at (a) high and (b) more moderate orientation (reprinted with permission from ref. [91]. 2021 Roiron.).

Figure 9.
Illustration of (a) a polyethylene single crystal ((A) electron micrograph and (B) a sketch of the molecular arrangement), and (b) a gel with micellar junctions (reprinted with permission from ref. [50]. 2021 Roiron.).
Figure 9.
Illustration of (a) a polyethylene single crystal ((A) electron micrograph and (B) a sketch of the molecular arrangement), and (b) a gel with micellar junctions (reprinted with permission from ref. [50]. 2021 Roiron.).


Figure 10.
Schematic representation of a micro shish-kebab structure, connection between the platelets (reprinted with permission from ref. [96]. 2021 Roiron.).
Figure 10.
Schematic representation of a micro shish-kebab structure, connection between the platelets (reprinted with permission from ref. [96]. 2021 Roiron.).
Figure 11.
Dependence of the module on the growth temperature of shish-kebab structures, symbols refer to three different morphologies which can be obtained depending on the treatment after the formation (reprinted with permission from ref. [99]. 2021 Roiron.).
Figure 11.
Dependence of the module on the growth temperature of shish-kebab structures, symbols refer to three different morphologies which can be obtained depending on the treatment after the formation (reprinted with permission from ref. [99]. 2021 Roiron.).

Figure 12.
Influence of the draw ratio on (a) crystal orientation (∆) and birefringence (■) and also (b) on endotherms (reprinted with permission from ref. [44]. 2021 Roiron.).
Figure 12.
Influence of the draw ratio on (a) crystal orientation (∆) and birefringence (■) and also (b) on endotherms (reprinted with permission from ref. [44]. 2021 Roiron.).

Figure 13.
(a) Endotherms of constrained and unconstrained gel-drawn fibers with two different molecular weights ([1; 2] × 106, [2; 7] × 105) (reprinted from ref. [56]. Copyright 1998 Elsevier/INIST-CNRS), data from ref. [66]; (b) Influence of pressure on the temperature at the heating and present phases (●: appearance of the hexagonal reflection, ○: disappearance of the orthorhombic reflections, ◊: disappearance of the hexagonal reflection (sample melting) and at the sequential cooling, ×: reappearance of the hexagonal reflection, □: reappearance of the orthogonal reflections, and ▲: disappearance of the hexagonal reflection, dotted lines represent extrapolation) (reprinted with permission from ref. [31]. 2021 Roiron.); (c) Evaluation of the effect of lateral compression and its duration (reprinted with permission from ref. [34]. 2021 Roiron.).


Figure 14.
(a) DSC test to analyze the effect of fiber compaction and cross-linking on the endotherms ((A) non-crosslinked sample prepared at 145 °C, (B) a cross-linked sample prepared at 145 °C, (C) a cross-linked sample prepared at 150 °C) (reprinted with permission from ref. [22]. 2021 Roiron.); (b) DSC test to assess the influence of the mass of the sample (Spectra 900) in a cold-welded pan on the endotherms, heated at 10 K·min−1 (reprinted with permission from ref. [35]. 2021 Roiron.).
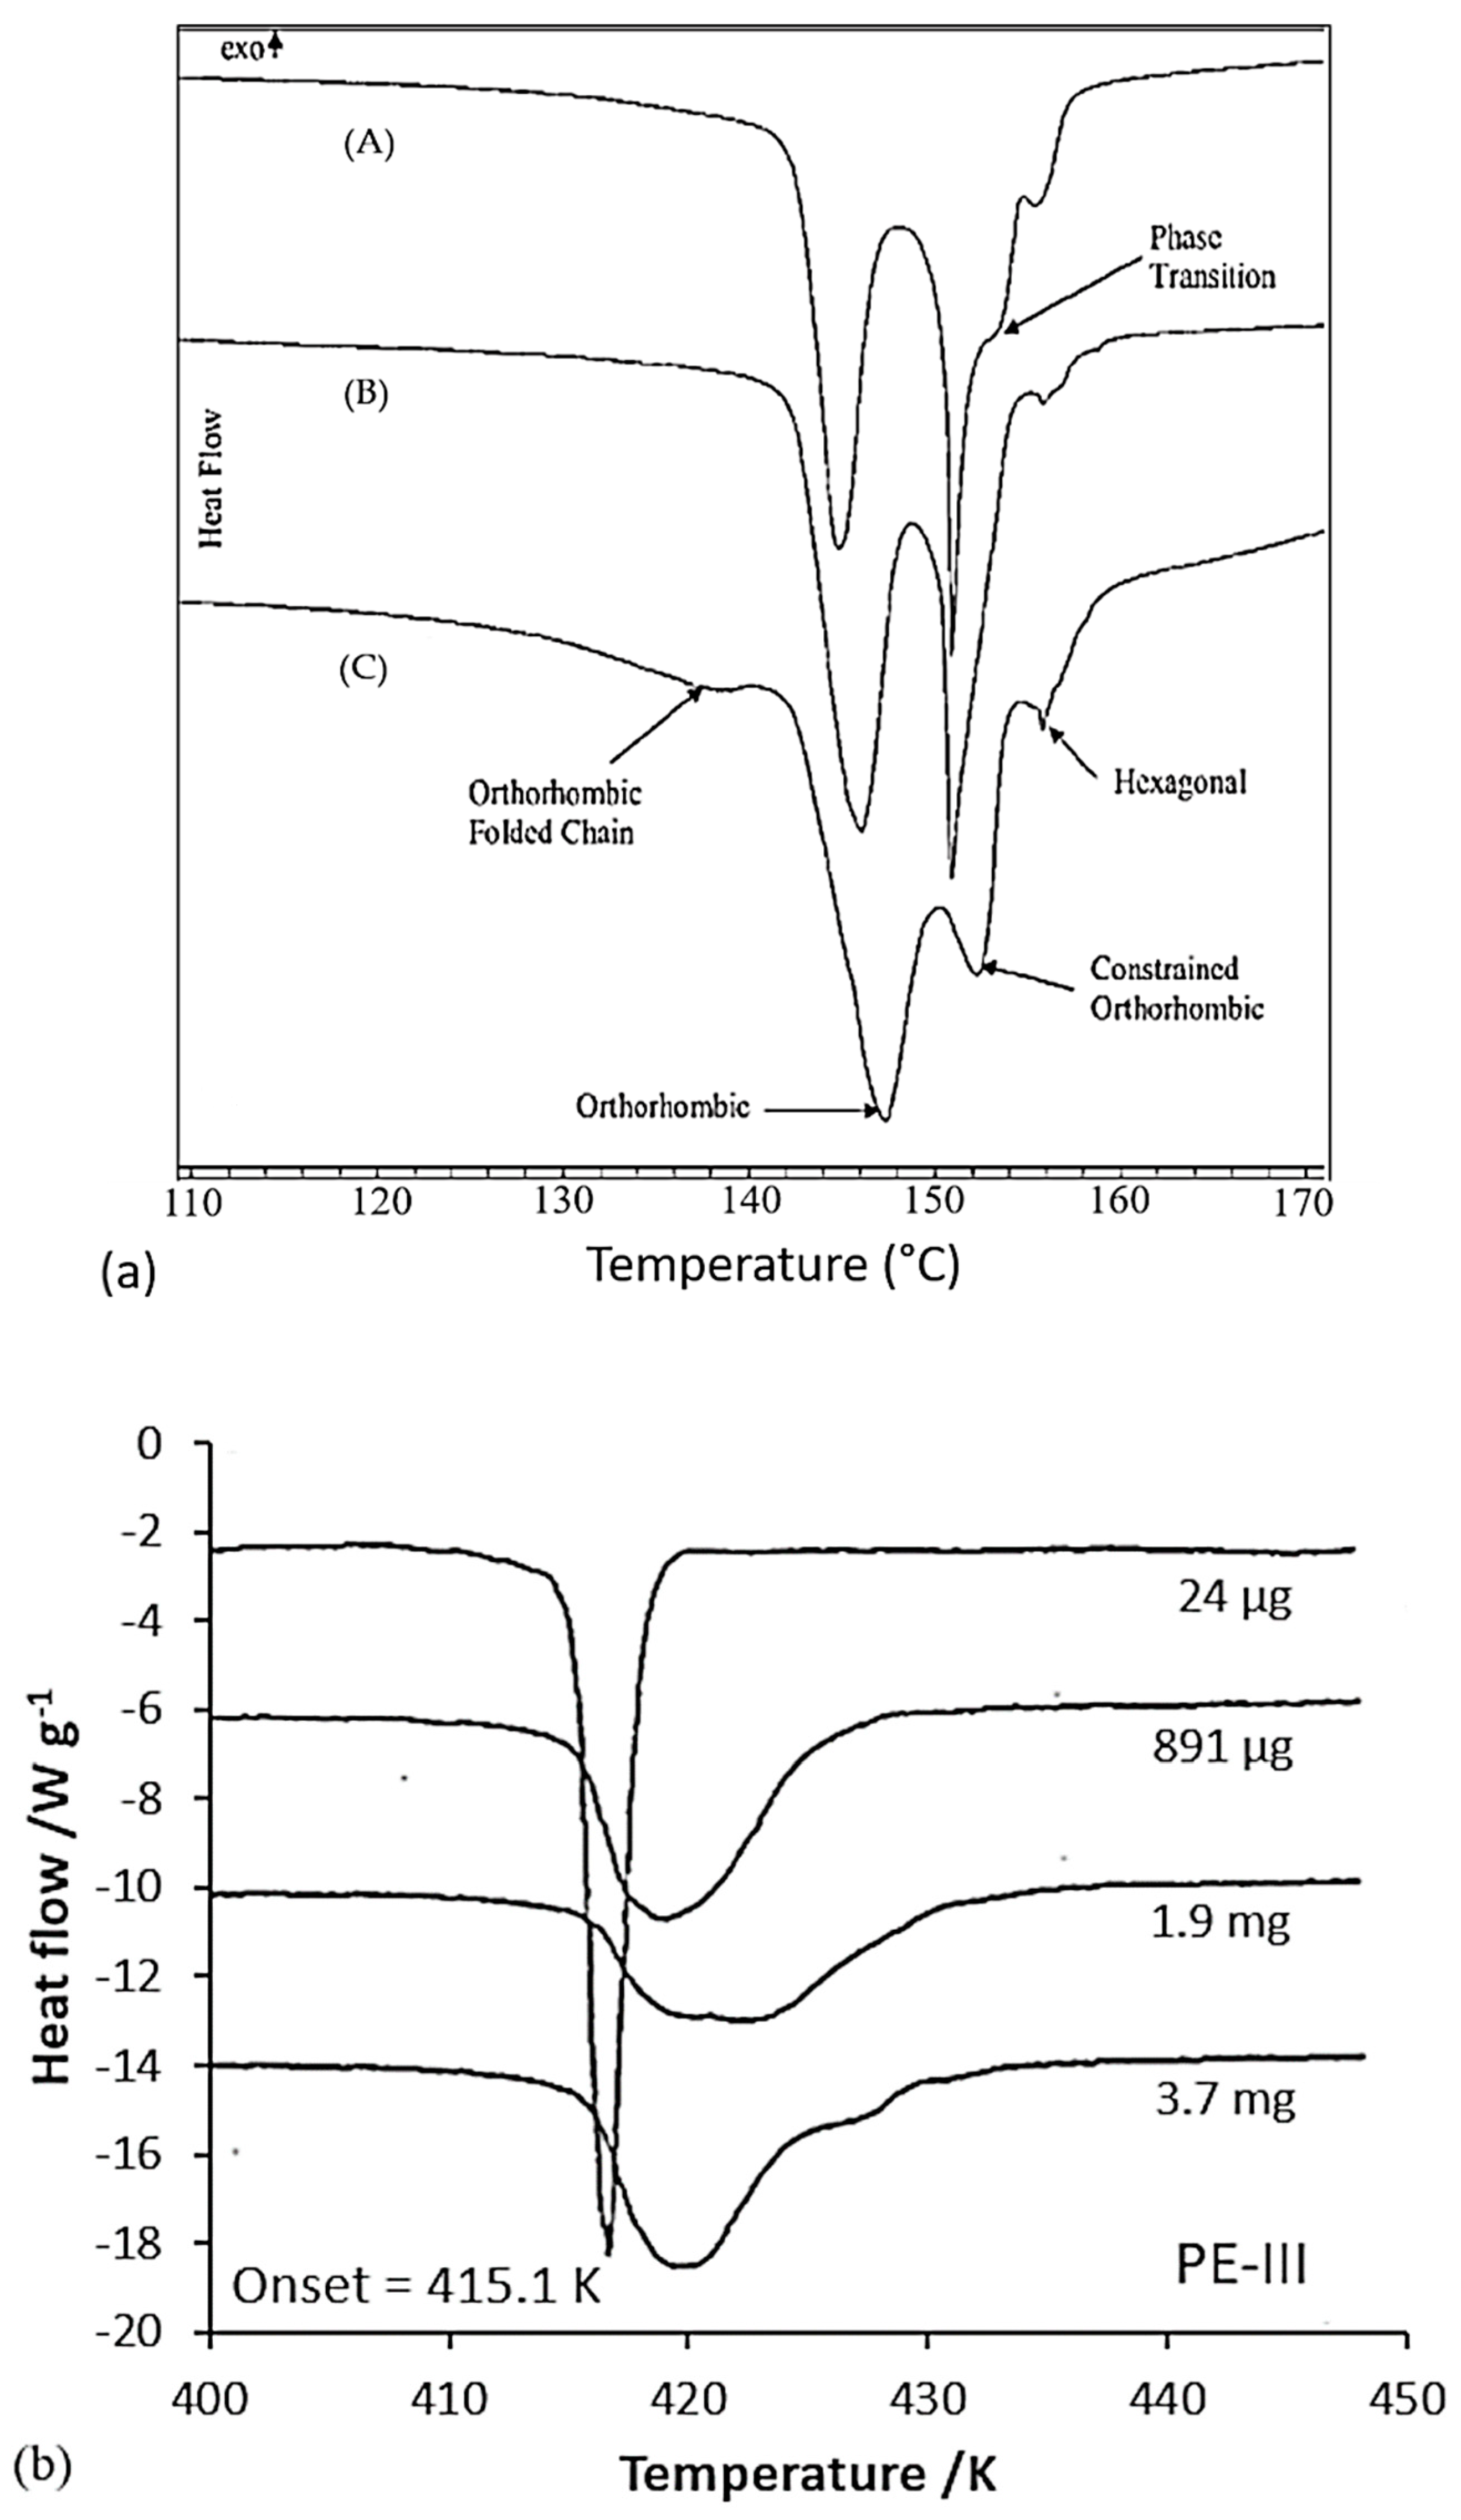
Figure 15.
Thermograms following DTA tests to study the effect of annealing on morphology (reprinted with permission from ref. [34]. 2021 Roiron.).
Figure 15.
Thermograms following DTA tests to study the effect of annealing on morphology (reprinted with permission from ref. [34]. 2021 Roiron.).

Figure 16.
Microscopic observation of a UHMWPE single filament cross-section in a bundle (reprinted with permission from ref. [23]. 2021 Roiron.).
Figure 16.
Microscopic observation of a UHMWPE single filament cross-section in a bundle (reprinted with permission from ref. [23]. 2021 Roiron.).

Figure 17.
Curves showing the effect of draw ratio on (a) tenacity and (b) modulus for different processes (Gel fiber I [120] (●), II [62,121] (◯), III [122] ( ![Textiles 01 00006 i001]() ), Hot drawing [123] (∆), Solid-state extrusion [55,117,124] (x)) (reprinted with permission from ref. [48]. 2021 Roiron.).
), Hot drawing [123] (∆), Solid-state extrusion [55,117,124] (x)) (reprinted with permission from ref. [48]. 2021 Roiron.).
 ), Hot drawing [123] (∆), Solid-state extrusion [55,117,124] (x)) (reprinted with permission from ref. [48]. 2021 Roiron.).
Figure 18.
Curve underlining the dependence of the modulus on the draw ratio for single-crystal gel fibers (a), and for a single-crystal film (b), (the different symbols are associated with different drawing temperatures between 70 and 133 °C for the steep slope (a circle for 70 °C, a triangle for 93 °C, a square for 106 °C, an inverted triangle for 120 °C, and a diamond for 133 °C) and a dot in a circle for 143 °C for the weaker slope) (reprinted with permission from ref. [120]. 2021 Roiron.); (c) Modulus depending on the draw ratio of dry gel films (lines [120]) and single-crystal mats (horizontal hatching [126,127] for several initial samples (normal molecular weight single-crystal mats [128,129,130,131] (◯) and high molecular single-crystal mats (+) [50]) (reprinted with permission from ref. [50]. 2021 Roiron.).


Figure 19.
Evolution of the draw ratio as a function of the quenching temperature for different samples, drawn at 75 °C at a draw speed of 10 cm/min, sample 1 (□), sample 2 (■), sample 3 (○), and sample 4 (●) (reprinted with permission from ref. [59]. 2021 Roiron.).
Figure 19.
Evolution of the draw ratio as a function of the quenching temperature for different samples, drawn at 75 °C at a draw speed of 10 cm/min, sample 1 (□), sample 2 (■), sample 3 (○), and sample 4 (●) (reprinted with permission from ref. [59]. 2021 Roiron.).
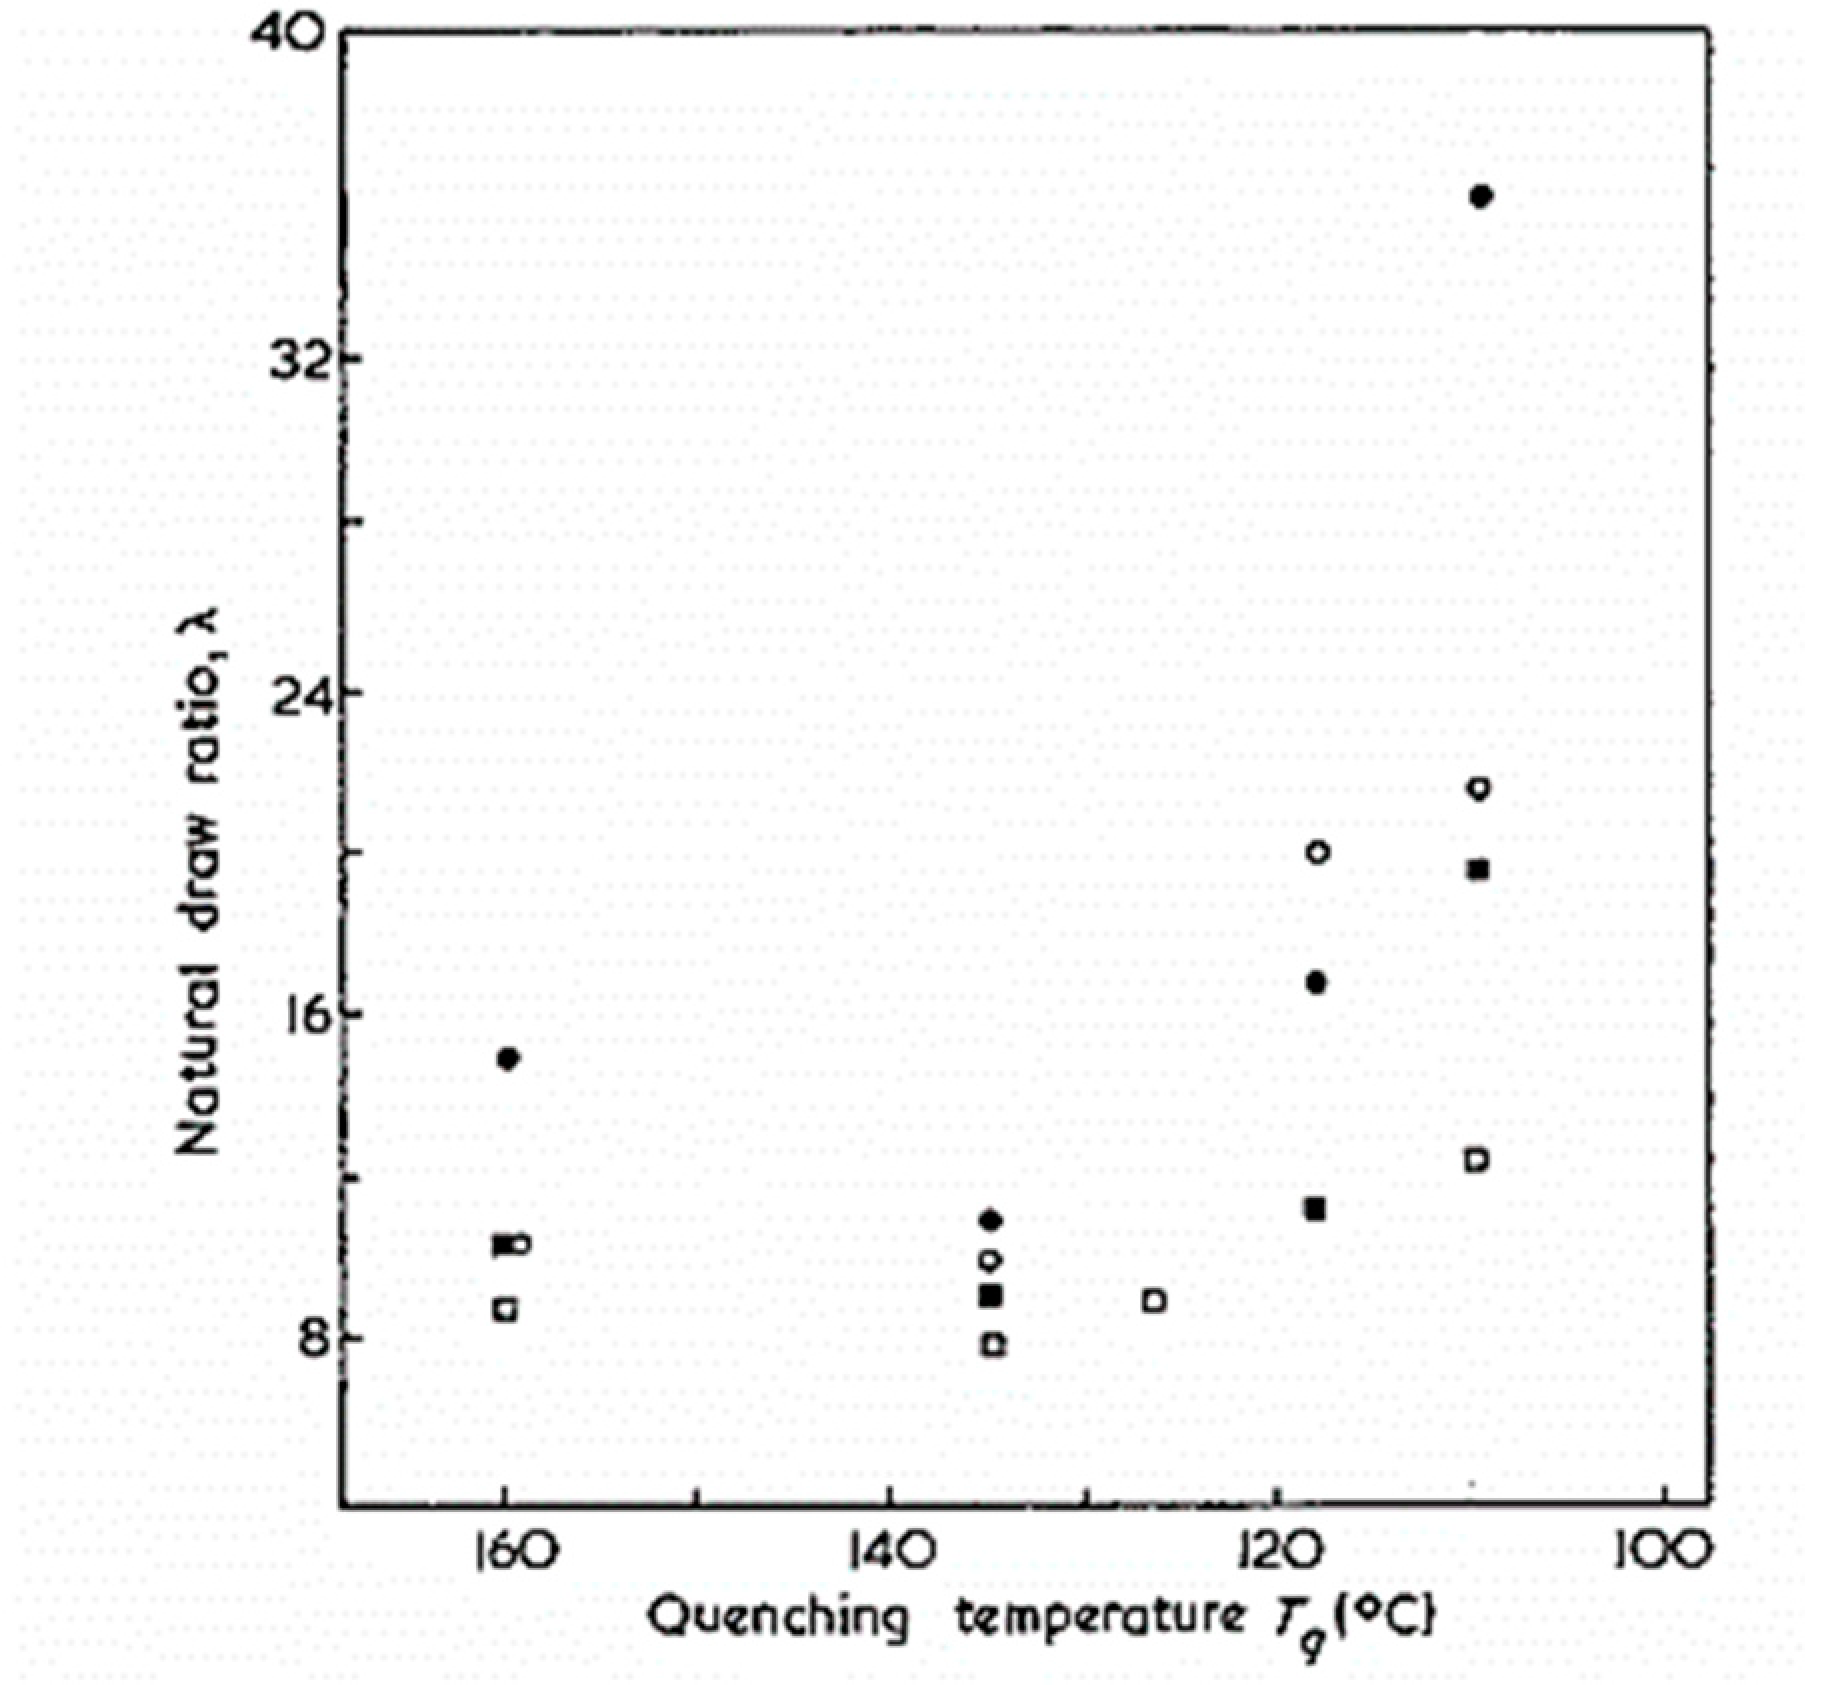
Figure 20.
For various processes, influence of chain length on (a) tenacity, and (b) modulus, (fibrillar crystal growing (○) [134,135,136], gel fiber drawing (∆) [62,64,120,121,122], hot drawing, zone drawing, and solid-state extrusion (×) [55,117,123,124]) (reprinted with permission from ref. [48]. 2021 Roiron.).
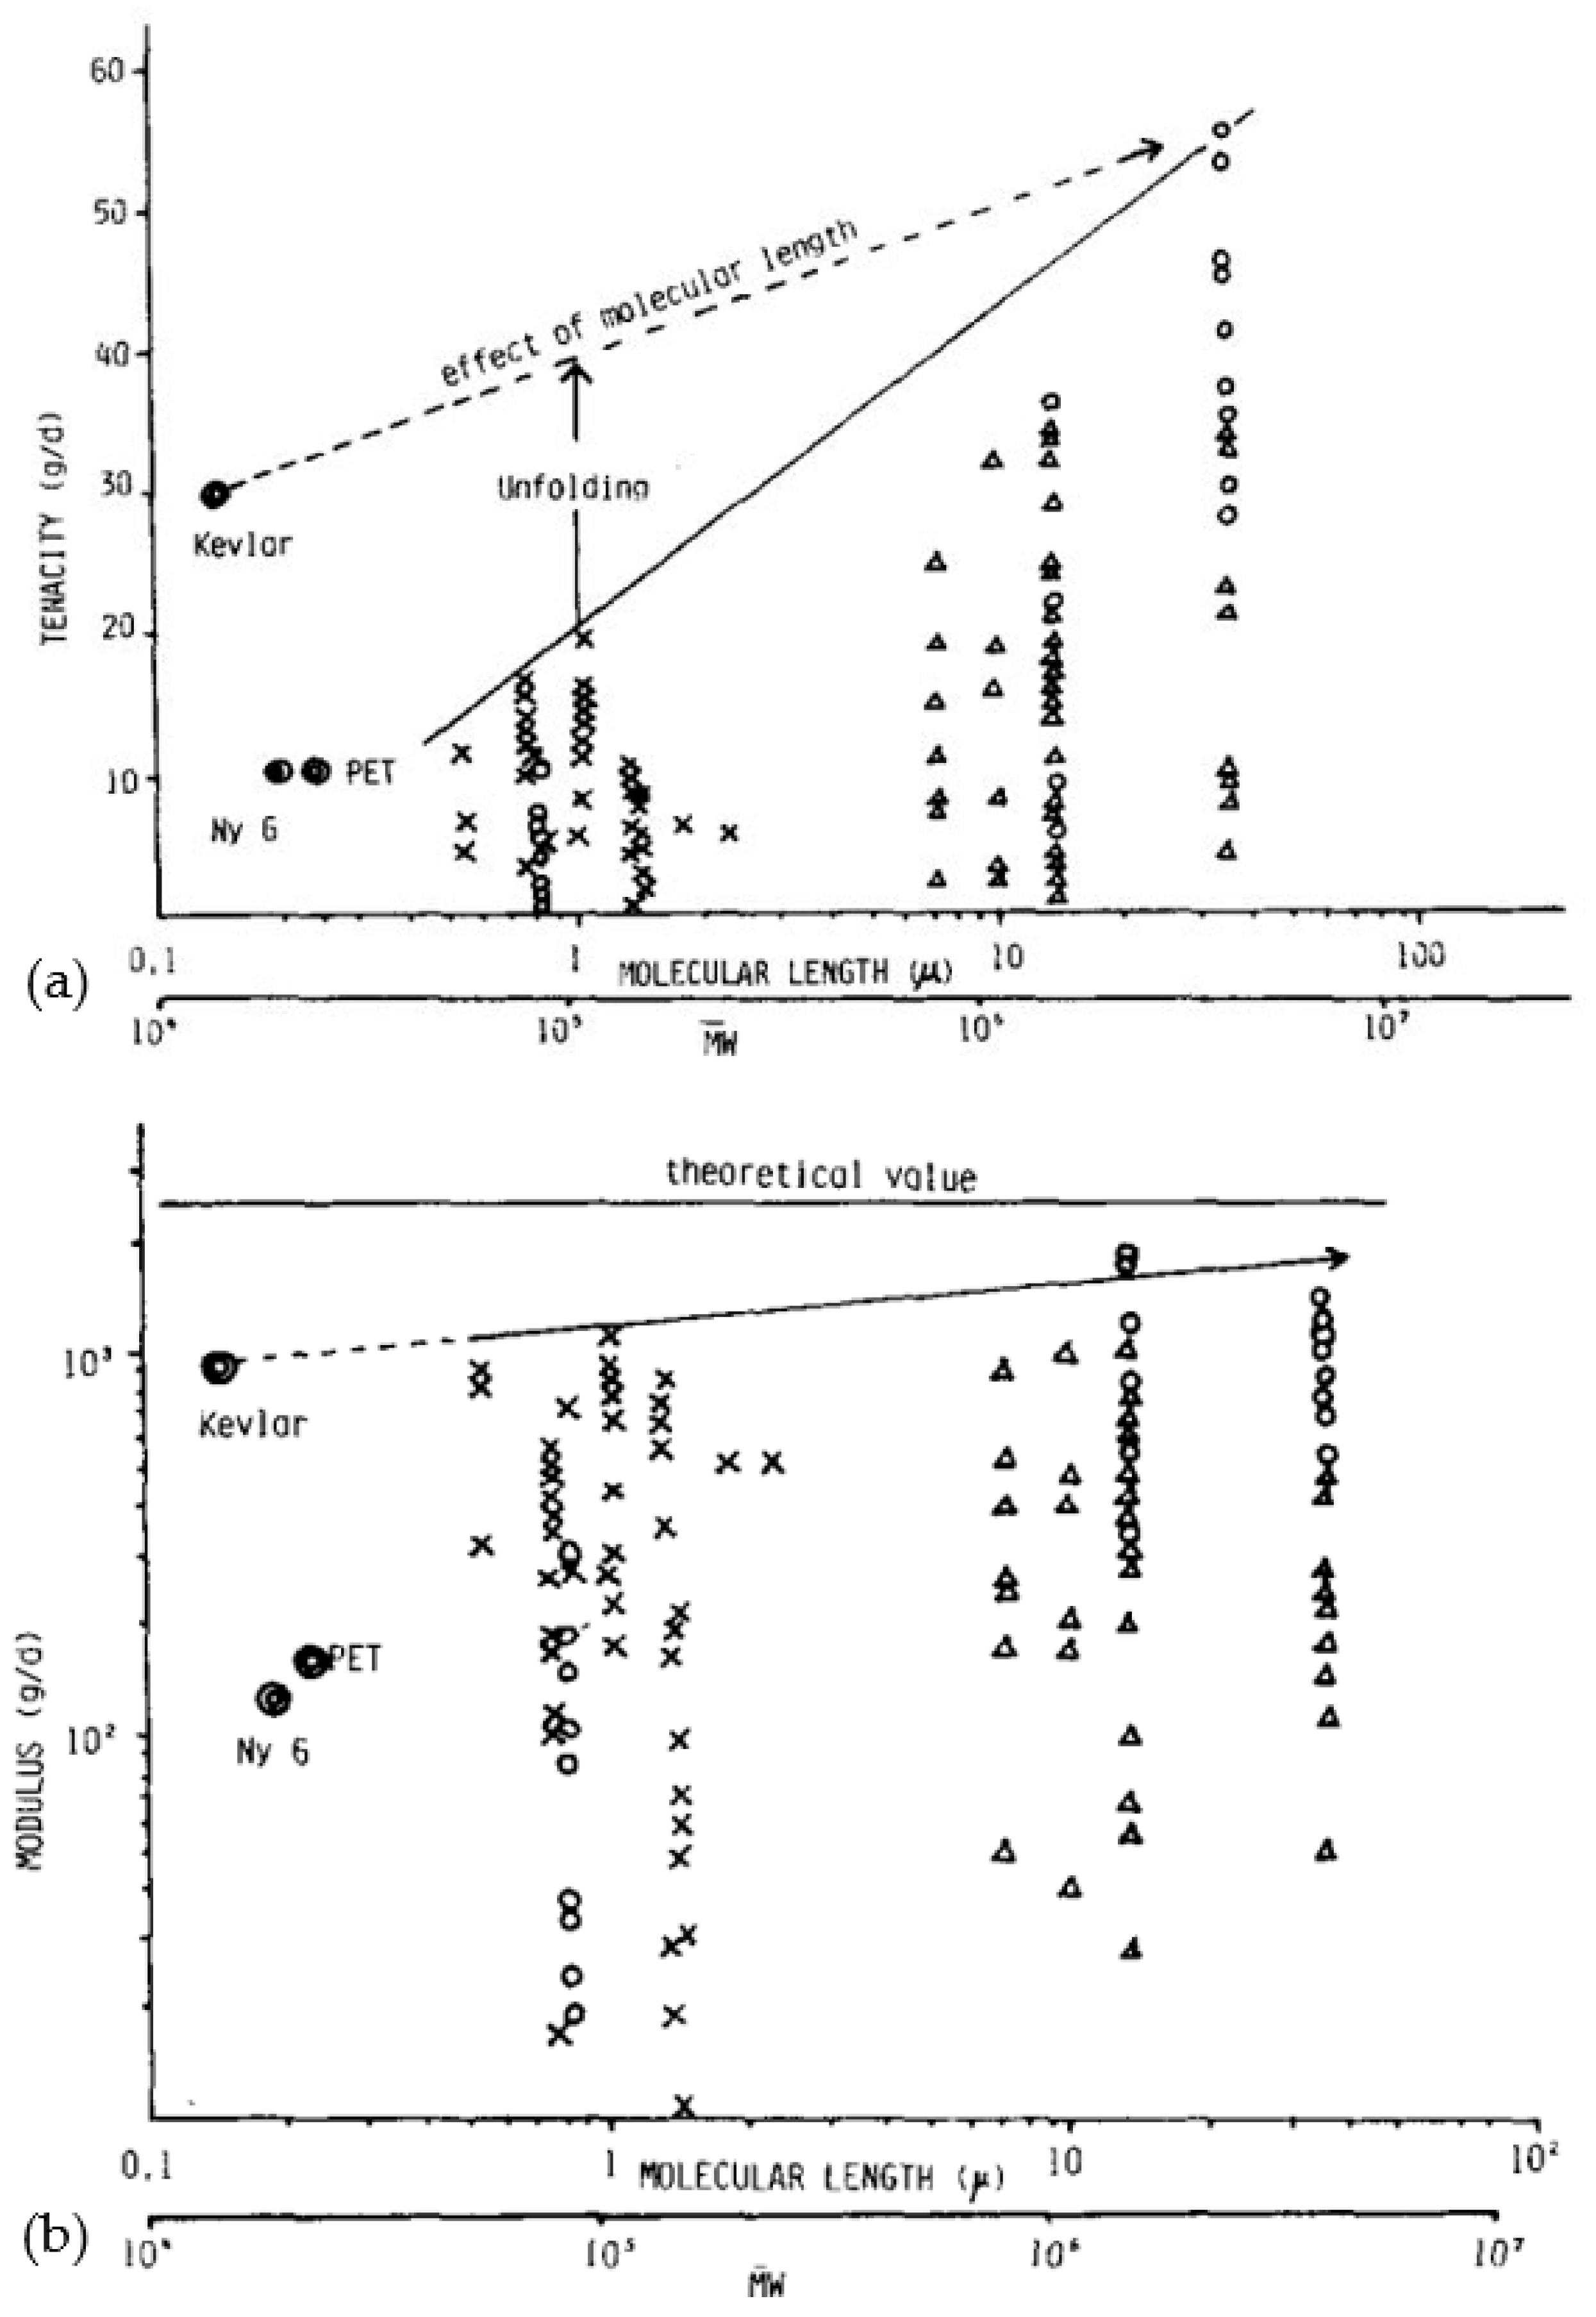
Figure 21.
Endotherms obtained from DSC tests on cold-drawn samples 1–2 (a) and 3–4 (b) at several draw ratios (reprinted with permission from ref. [59]. 2021 Roiron.).
Figure 21.
Endotherms obtained from DSC tests on cold-drawn samples 1–2 (a) and 3–4 (b) at several draw ratios (reprinted with permission from ref. [59]. 2021 Roiron.).
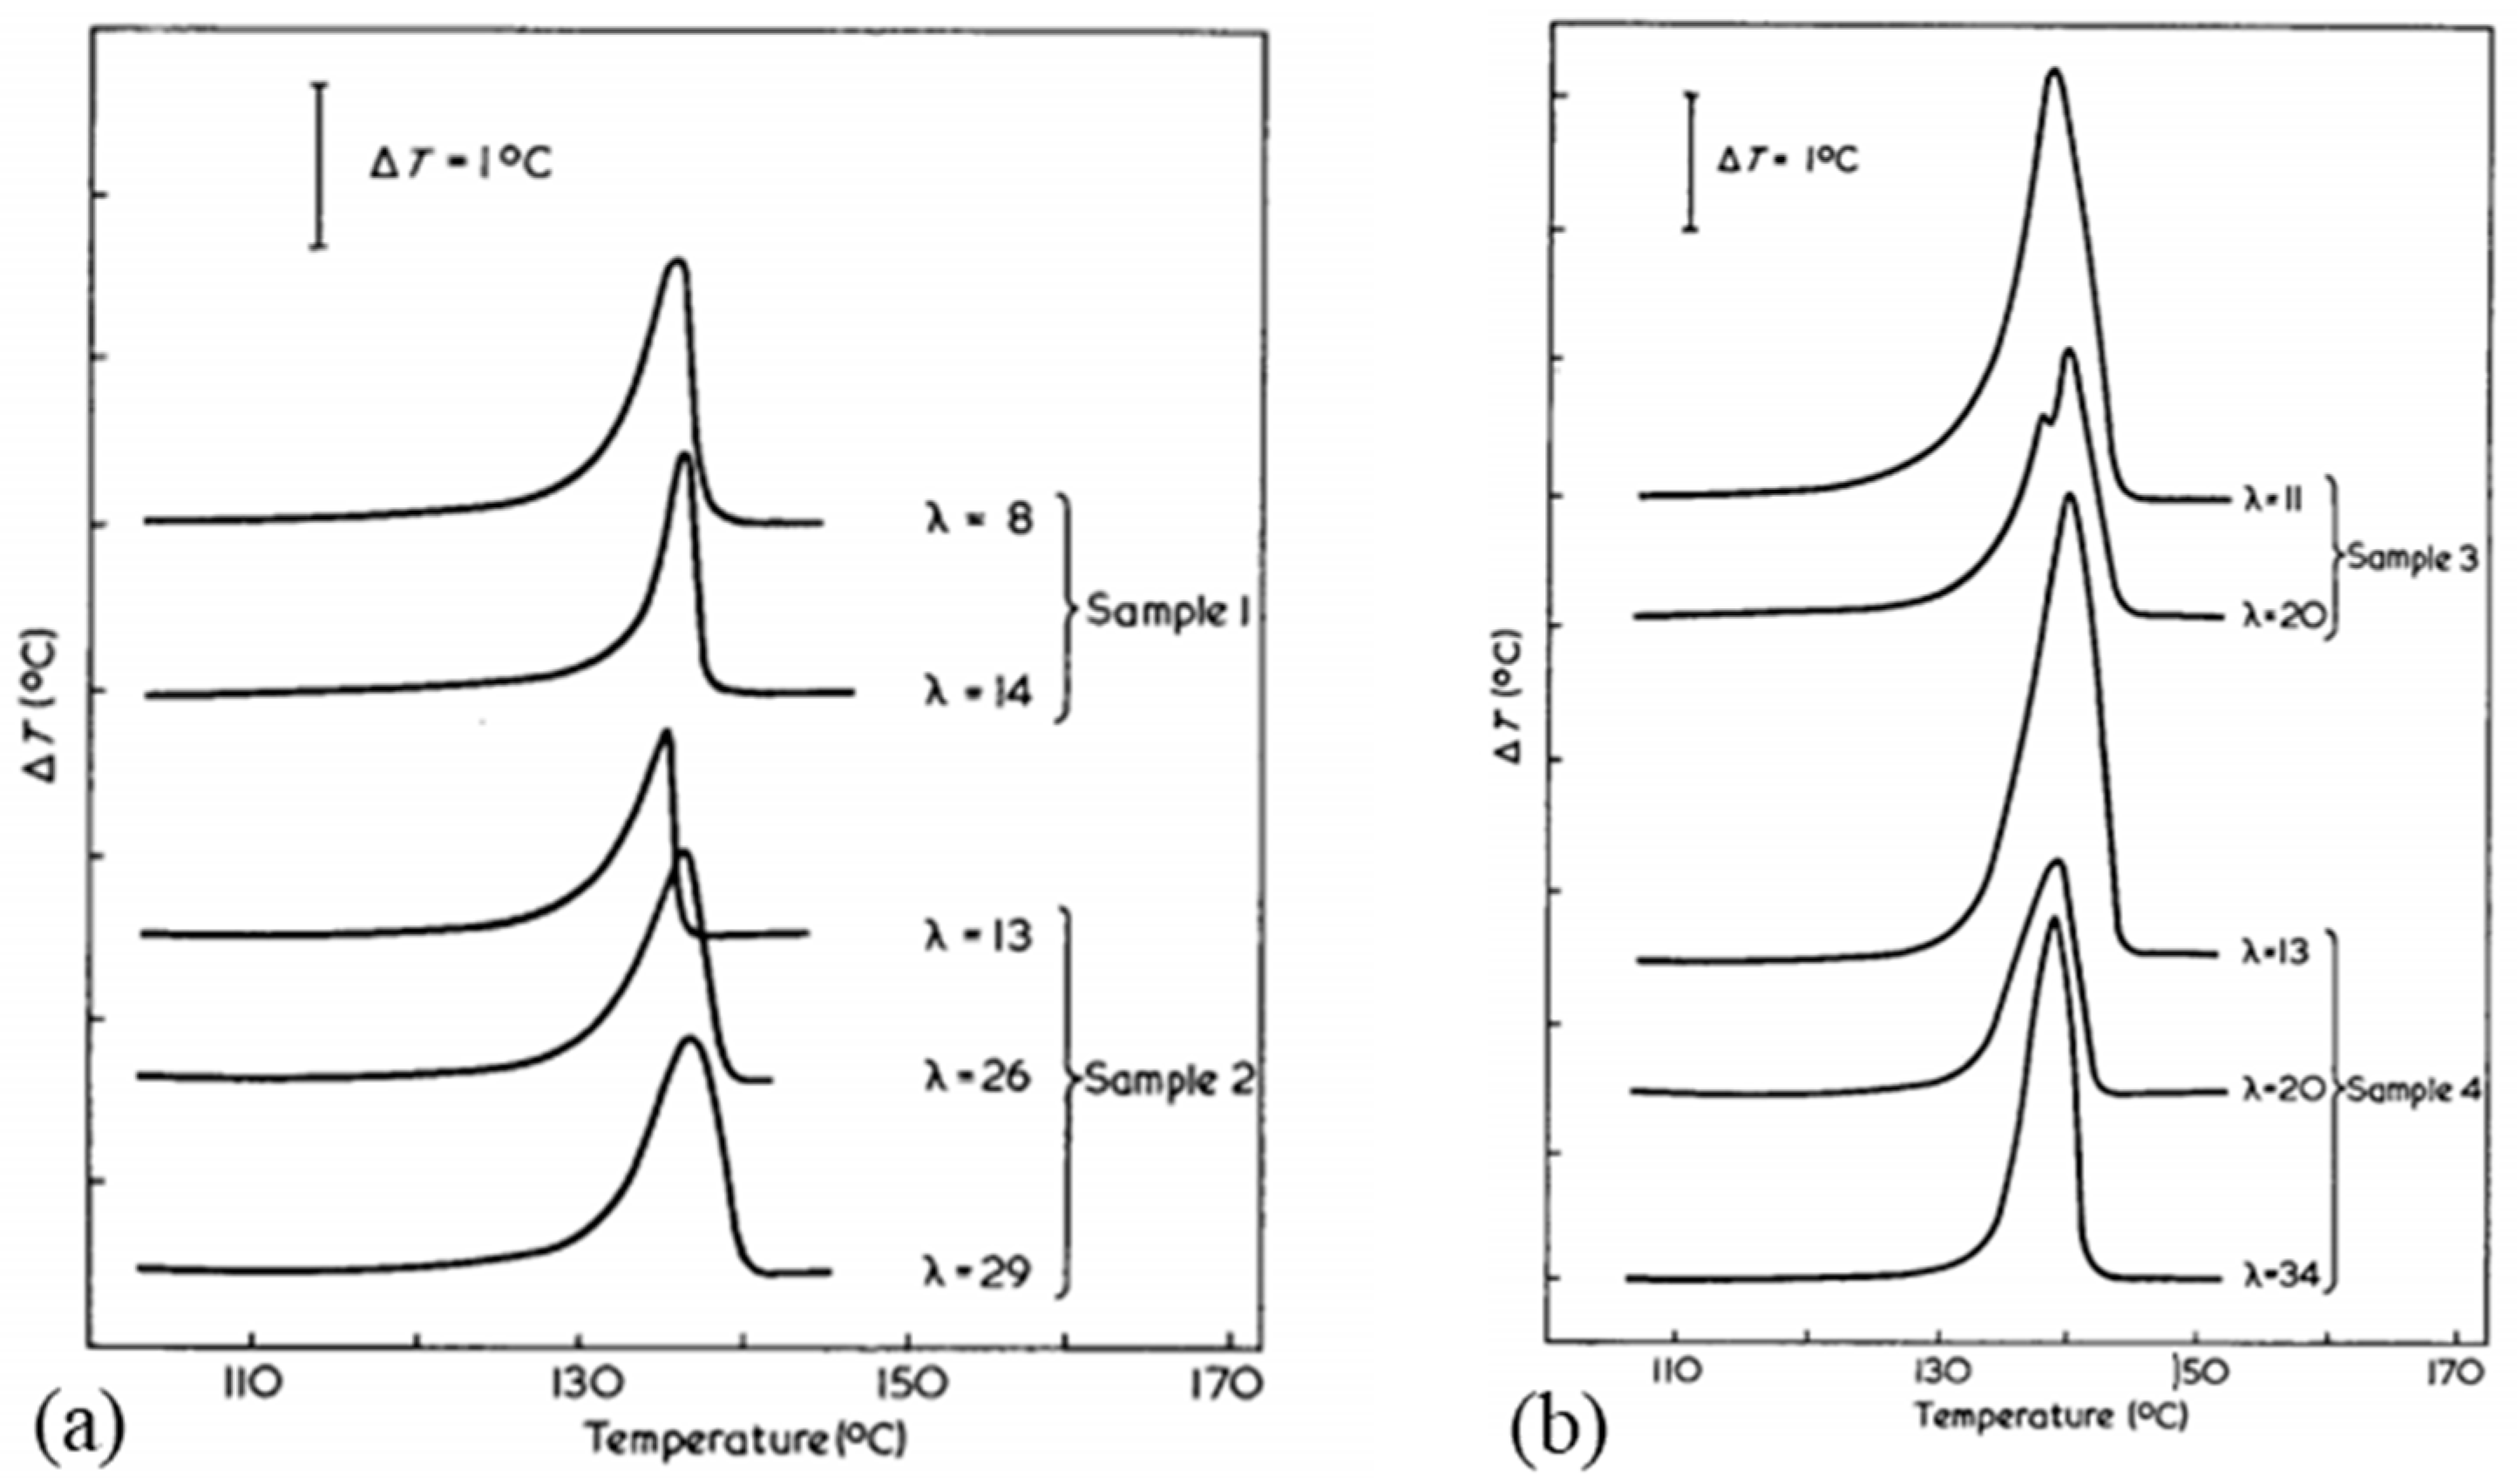
Figure 22.
For fibers (draw ratio of 60, 2.5 wt.% Hifax B), (a) Two consecutive tensile cycles for a UHMWPE fiber; (b) Cycles performed in tension in small deformations at three consecutive deformation cycles up to 1.2 GPa (first cycle (A), 35th cycle (B), 36th cycle (C)), no recovery for the first 35 cycles and one of 75 min between the 35th and the 36th (reprinted with permission from ref. [36]. 2021 Roiron.); Beginning of the nominal stress/nominal strain curves of tensile tests and load-unload tests on UHMWPE Doyentrontex® commercial yarns at (c) 23 °C and (d) 100 °C (reprinted with permission from ref. [114]. 2021 Roiron.).

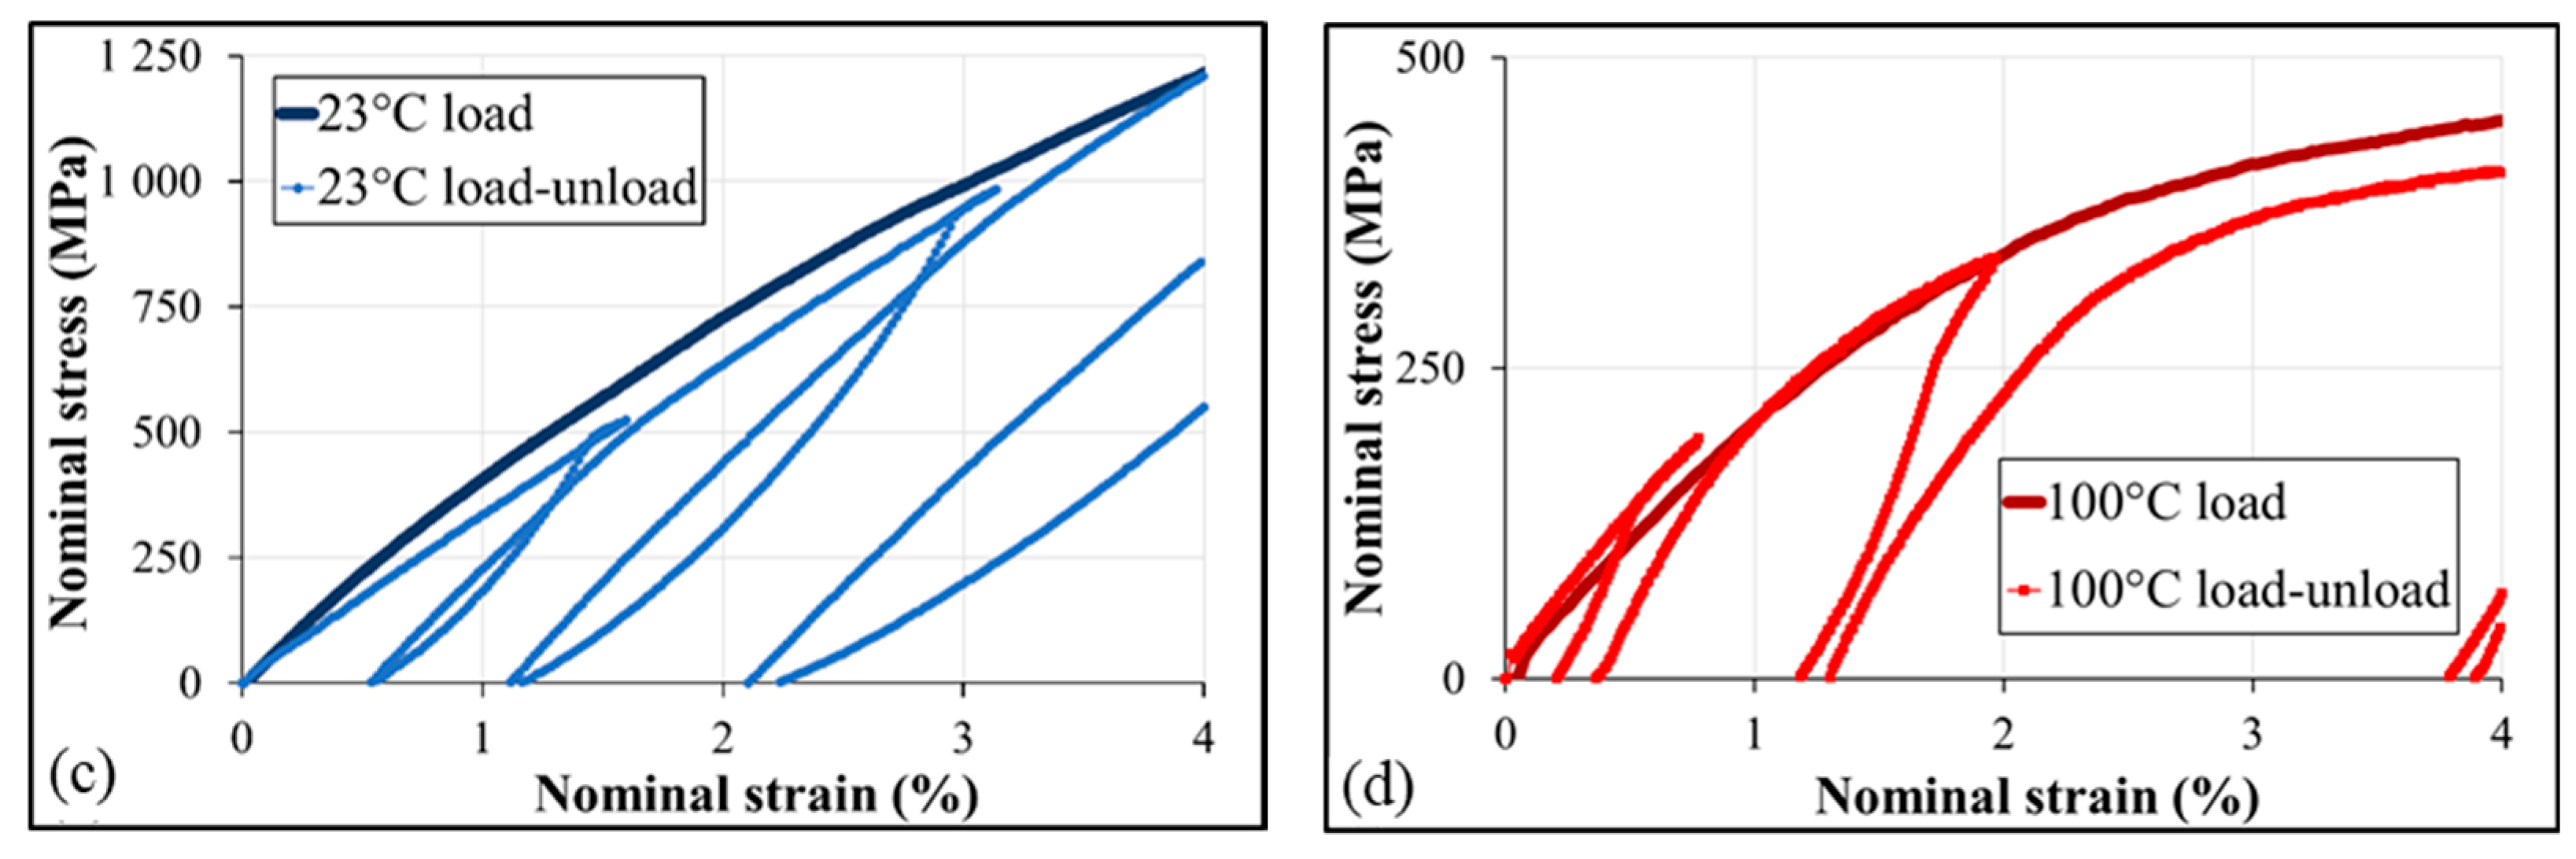
Figure 23.
Influence of strain rate (0.004, 0.1, and 0.4 min−1) on the mechanical properties of UHSPE filaments (reprinted with permission from ref. [14]. 2021 Roiron.).
Figure 23.
Influence of strain rate (0.004, 0.1, and 0.4 min−1) on the mechanical properties of UHSPE filaments (reprinted with permission from ref. [14]. 2021 Roiron.).

Figure 24.
(a) Comparison of stress-strain curves for single yarn and a single fiber (reprinted with permission from ref. [14]. 2021 Roiron.); (b) Influence of Young’s modulus (A), strength (B), and strain at break (C) of the strain rate (reprinted with permission from ref. [23]. 2021 Roiron.).

Figure 25.
Evolution of strength (a), and strain at break (b) as a function of temperature (reprinted with permission from ref. [24]. 2021 Roiron.).
Figure 25.
Evolution of strength (a), and strain at break (b) as a function of temperature (reprinted with permission from ref. [24]. 2021 Roiron.).

Figure 26.
Exaggerated representation of the effect of temperature on the dimensions of the a-b plane of the orthorhombic unit cell, the dotted line depicts the plane of the lowest shear modulus (reprinted with permission from ref. [113]. 2021 Roiron.).
Figure 26.
Exaggerated representation of the effect of temperature on the dimensions of the a-b plane of the orthorhombic unit cell, the dotted line depicts the plane of the lowest shear modulus (reprinted with permission from ref. [113]. 2021 Roiron.).

Figure 27.
(a) Influence of annealing at 149 °C for 24 h on the mechanical performance of gel-spun hot drawn UHMWPE fibers, hatches show the increase in the elastic energy absorbance (reprinted with permission from ref. [39]. 2021 Roiron.); (b) Master curve of the thermal degradation of UHMWPE yarns at a reference temperature of 43 °C, standard uncertainty is about 5% (reprinted with permission from ref. [45]. 2021 Roiron.).

Figure 28.
(a) Evolution of the alpha transition temperature with frequency for virgin samples, or samples previously heated at different temperatures (reprinted with permission from ref. [15]. 2021 Roiron.); (b) Master curves of the dynamic moduli obtained in DMA at a reference temperature of 30 °C, for several UHMWPE fibers (DyneemaTM SK60 (●) and SK66 (◯), SpectraTM 1000 (∆)) (reprinted with permission from ref. [12]. 2021 Roiron.).

Figure 29.
Nominal stress-strain curves of a gel-spun hot-drawn UHMWPE fiber at two conditions of temperature and strain rate (reprinted with permission from ref. [41]. 2021 Roiron.).
Figure 29.
Nominal stress-strain curves of a gel-spun hot-drawn UHMWPE fiber at two conditions of temperature and strain rate (reprinted with permission from ref. [41]. 2021 Roiron.).
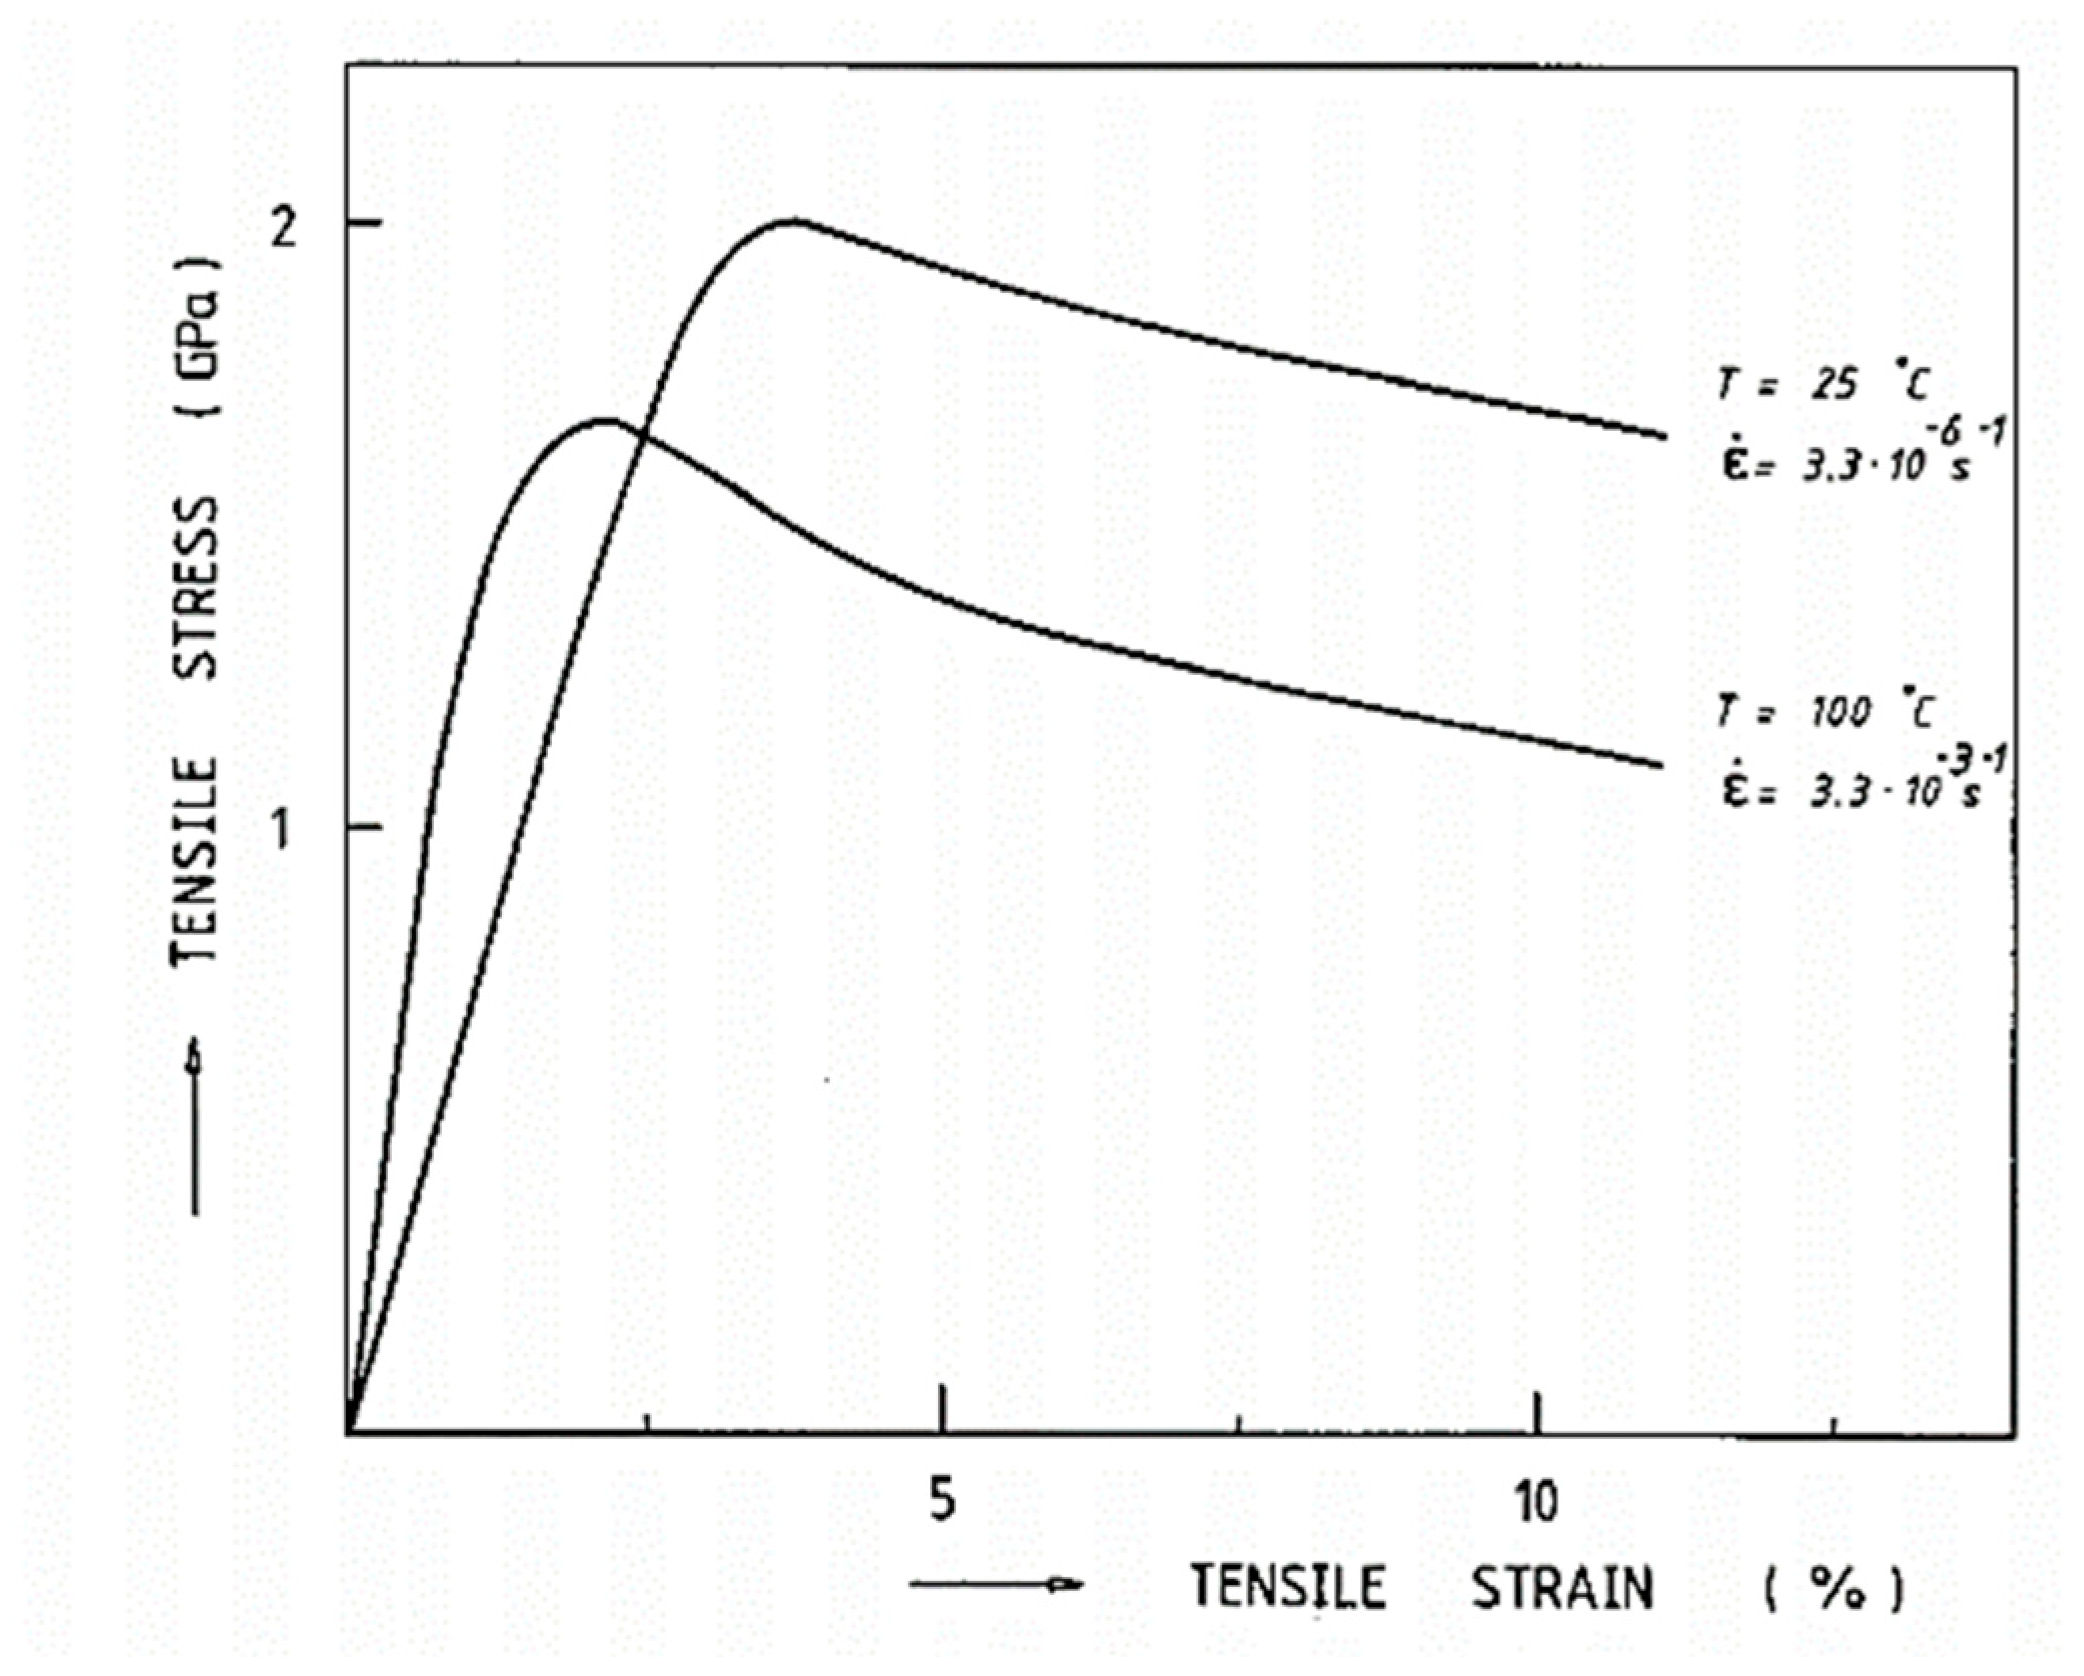
Figure 30.
(a) Evolution of UHMWPE fiber strength as a function of strain rate between 23 and 80 °C, (open symbols denote yielding); (b) Master curve of fiber strength as a function of strain rate at room temperature (reprinted with permission from ref. [12]. 2021 Roiron.).
Figure 30.
(a) Evolution of UHMWPE fiber strength as a function of strain rate between 23 and 80 °C, (open symbols denote yielding); (b) Master curve of fiber strength as a function of strain rate at room temperature (reprinted with permission from ref. [12]. 2021 Roiron.).
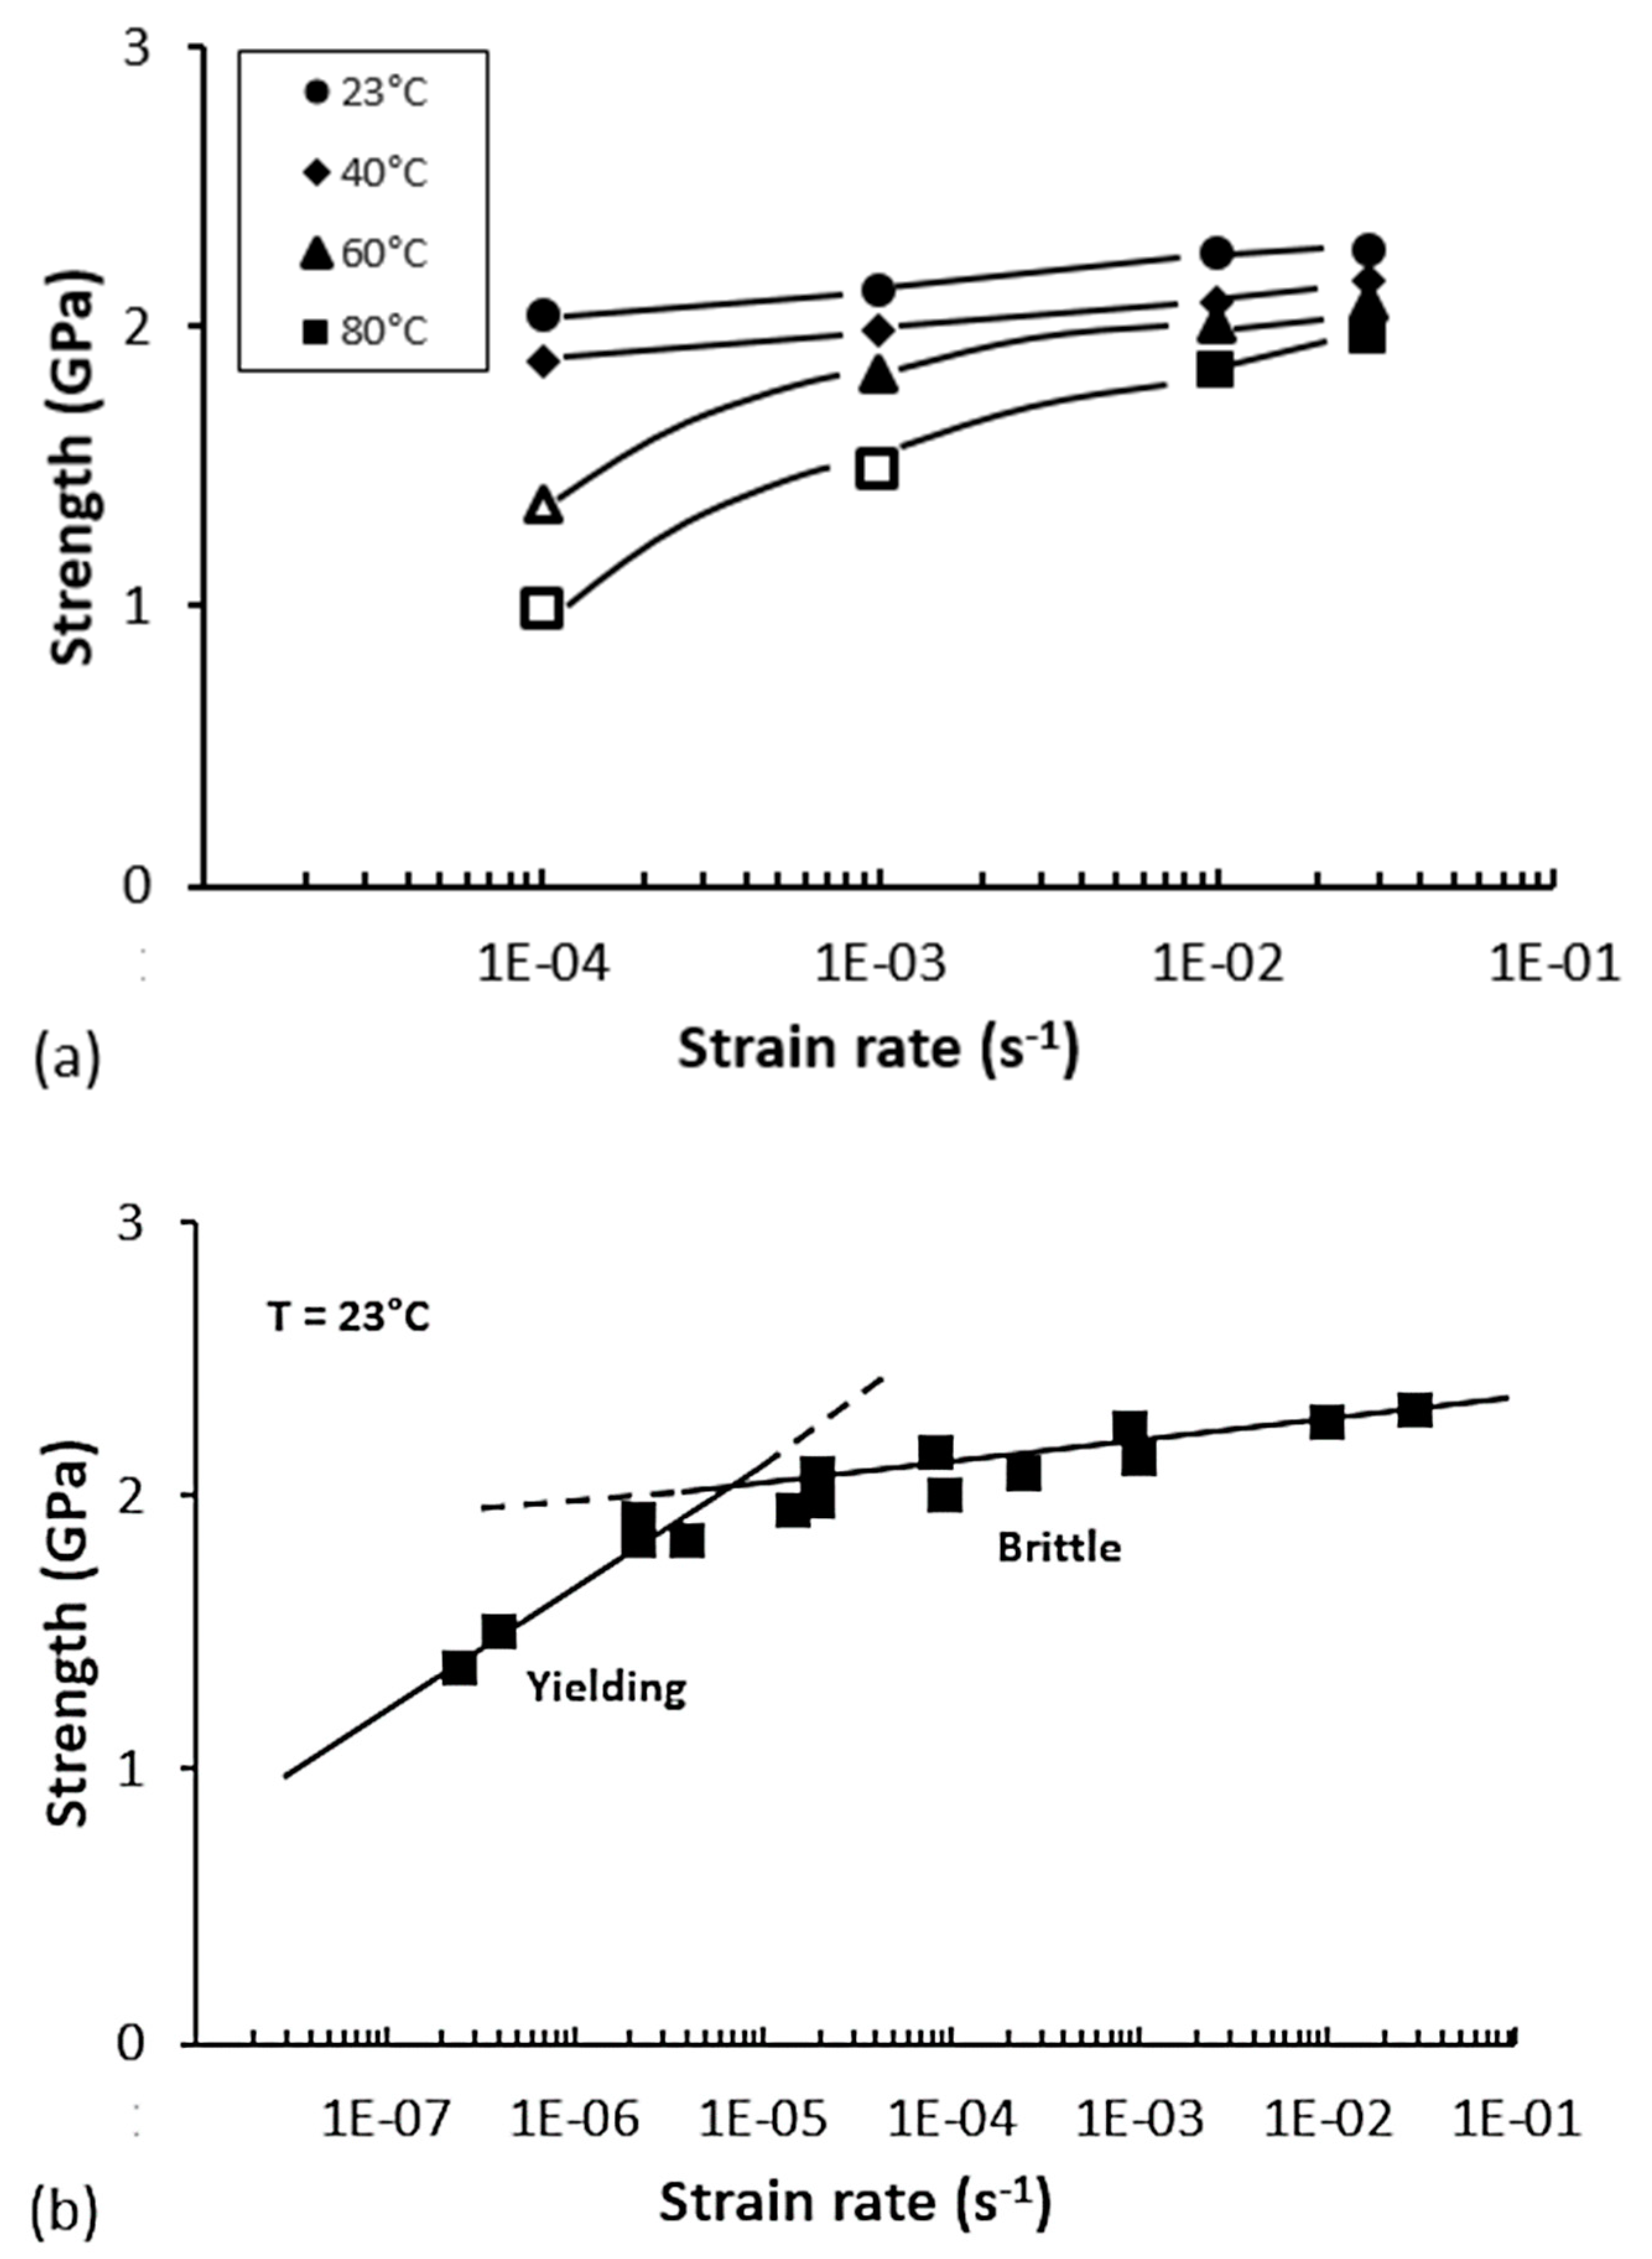
Figure 31.
Microscopic SEM observations of the fracture surface of a non-crosslinked UHMWPE fiber tested in tension at (A) room temperature and normal tensile testing, (B) 73 °C and 0.37 GPa, and (C) 138 °C and 0.06 GPa (reprinted with permission from ref. [37]. 2021 Roiron.).
Figure 31.
Microscopic SEM observations of the fracture surface of a non-crosslinked UHMWPE fiber tested in tension at (A) room temperature and normal tensile testing, (B) 73 °C and 0.37 GPa, and (C) 138 °C and 0.06 GPa (reprinted with permission from ref. [37]. 2021 Roiron.).

Figure 32.
Microscopic SEM observations of UHMWPE fiber after a dead-load test at 25 °C and a nominal stress of 0.77 GPa (reprinted with permission from ref. [37]. 2021 Roiron.).
Figure 32.
Microscopic SEM observations of UHMWPE fiber after a dead-load test at 25 °C and a nominal stress of 0.77 GPa (reprinted with permission from ref. [37]. 2021 Roiron.).
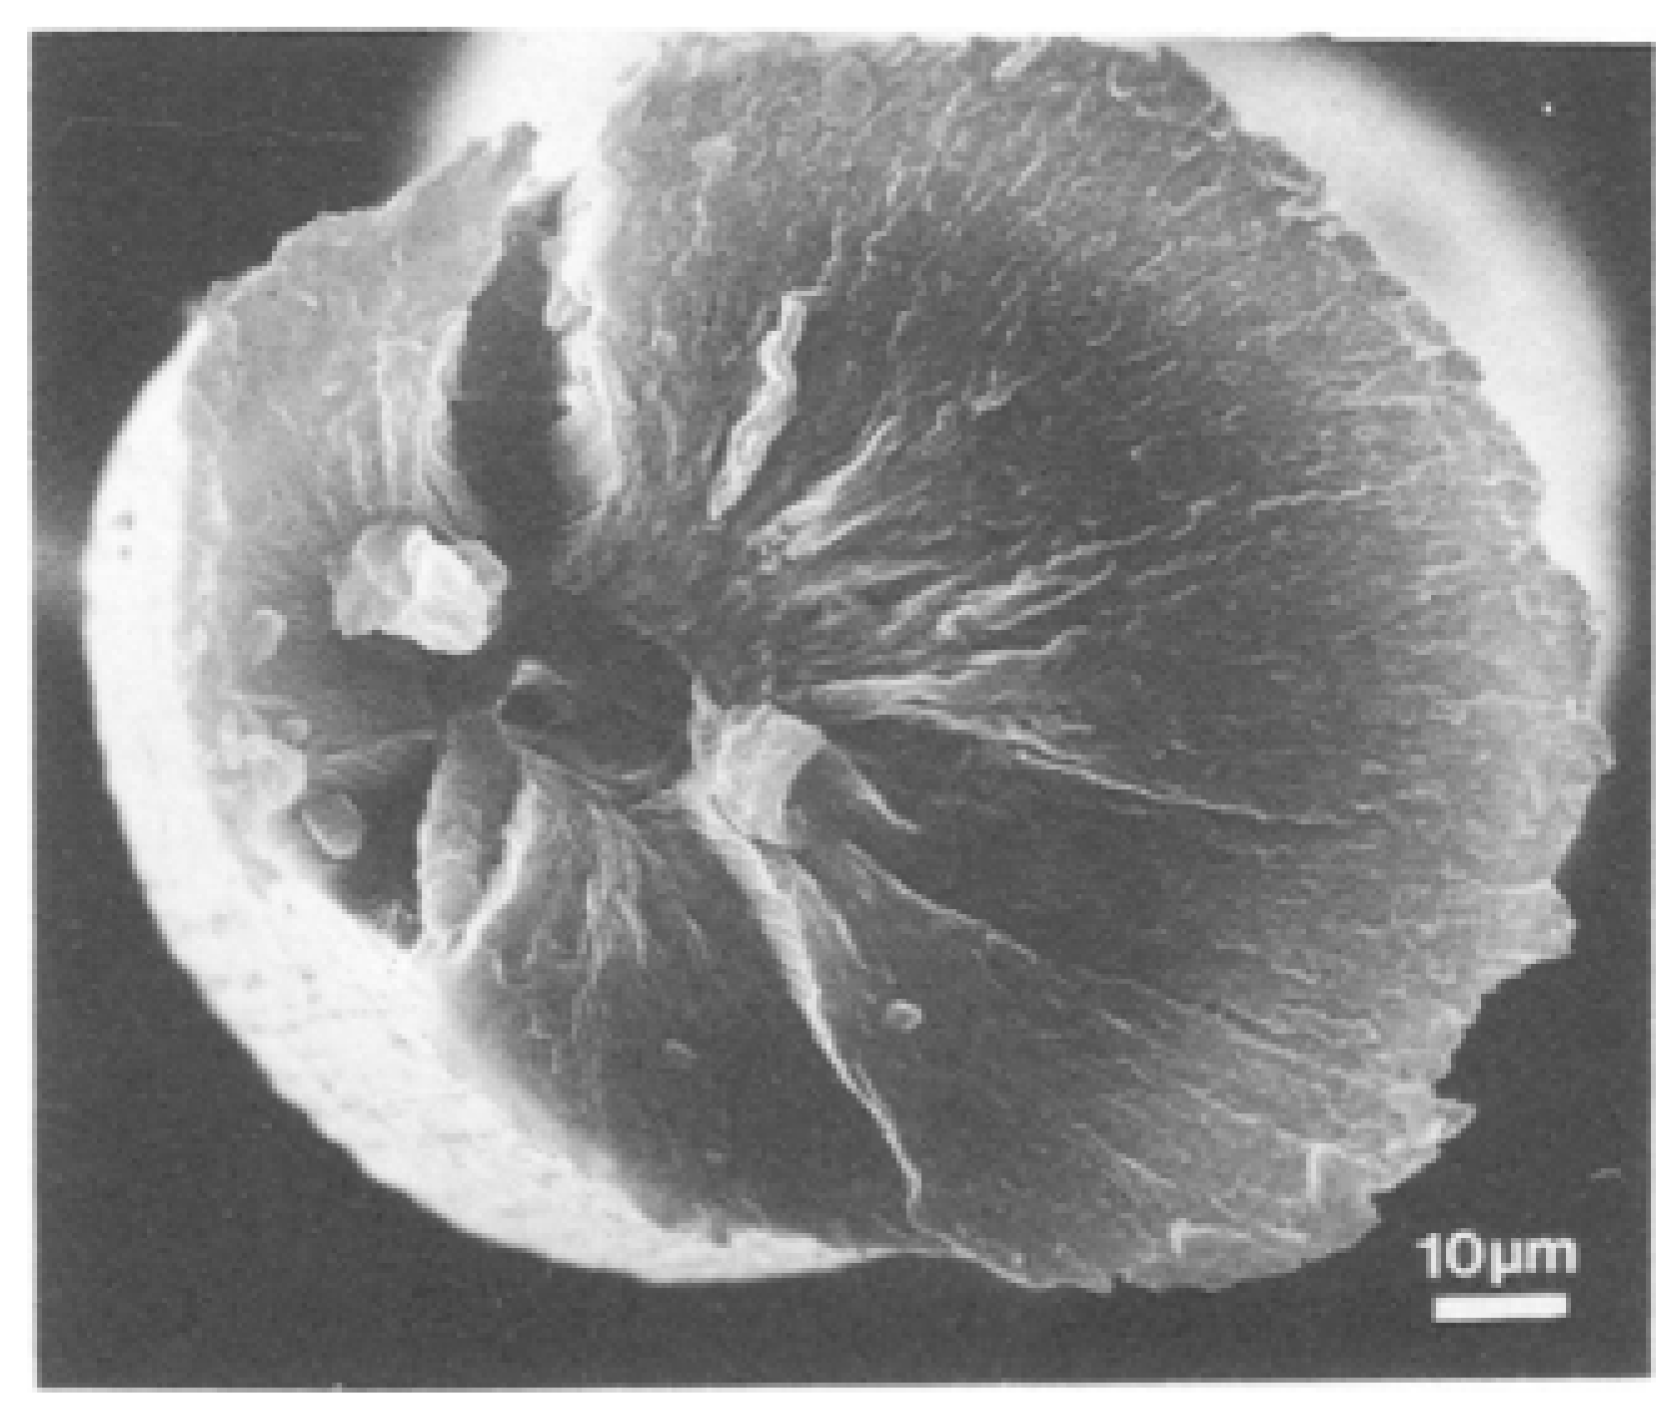
Figure 33.
Creep rate as a function of applied stress for tests performed at 100 °C (reprinted with permission from ref. [24]. 2021 Roiron.).
Figure 33.
Creep rate as a function of applied stress for tests performed at 100 °C (reprinted with permission from ref. [24]. 2021 Roiron.).
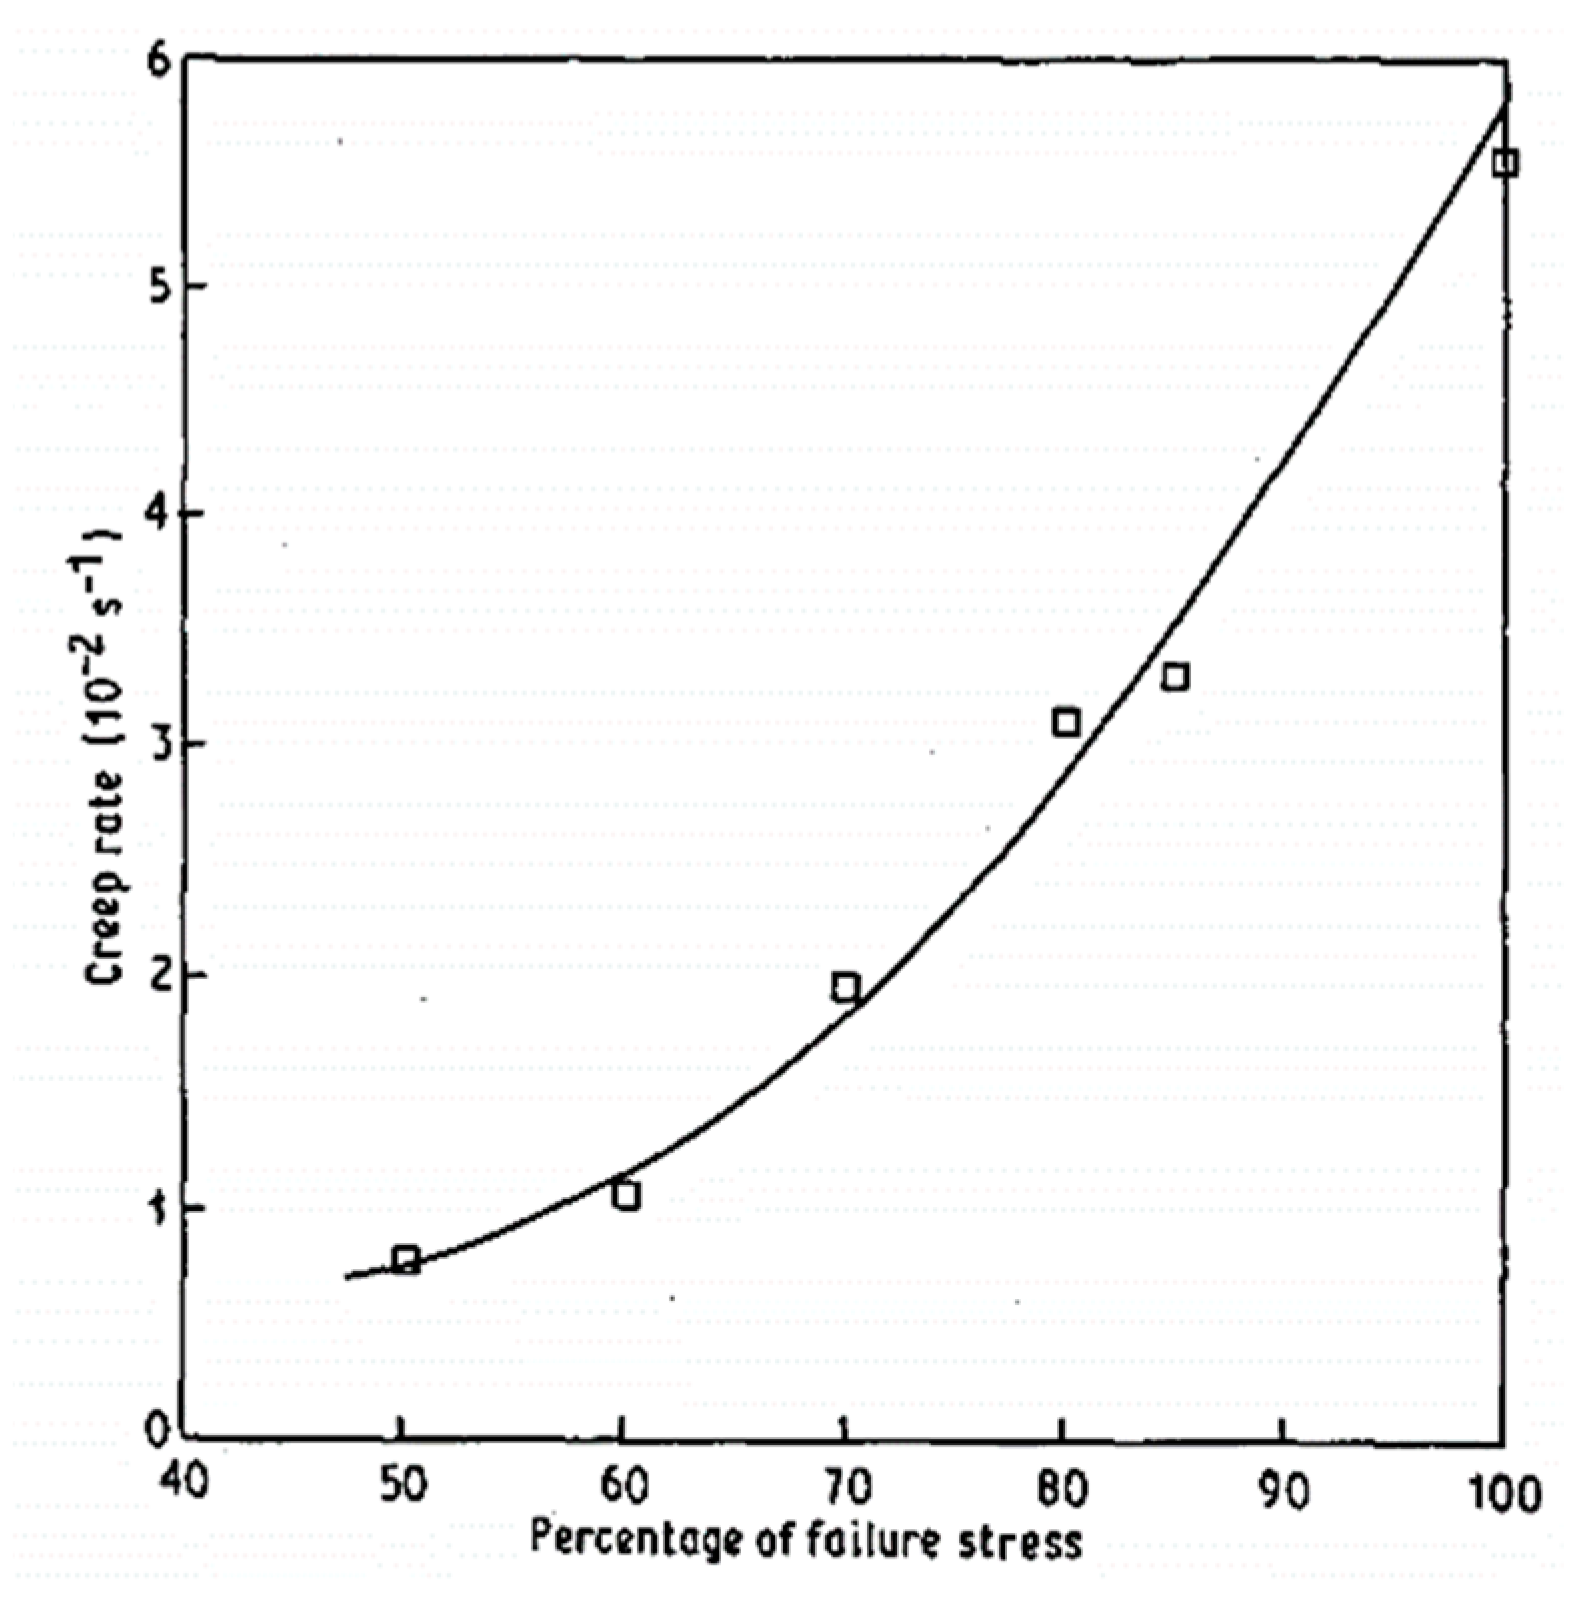
Publisher’s Note: MDPI stays neutral with regard to jurisdictional claims in published maps and institutional affiliations. |
© 2021 by the authors. Licensee MDPI, Basel, Switzerland. This article is an open access article distributed under the terms and conditions of the Creative Commons Attribution (CC BY) license (https://creativecommons.org/licenses/by/4.0/).
Share and Cite
MDPI and ACS Style
Roiron, C.; Lainé, E.; Grandidier, J.-C.; Garois, N.; Vix-Guterl, C. A Review of the Mechanical and Physical Properties of Polyethylene Fibers. Textiles 2021, 1, 86-151. https://0-doi-org.brum.beds.ac.uk/10.3390/textiles1010006
AMA Style
Roiron C, Lainé E, Grandidier J-C, Garois N, Vix-Guterl C. A Review of the Mechanical and Physical Properties of Polyethylene Fibers. Textiles. 2021; 1(1):86-151. https://0-doi-org.brum.beds.ac.uk/10.3390/textiles1010006
Chicago/Turabian StyleRoiron, Coline, Eric Lainé, Jean-Claude Grandidier, Nicolas Garois, and Cathie Vix-Guterl. 2021. "A Review of the Mechanical and Physical Properties of Polyethylene Fibers" Textiles 1, no. 1: 86-151. https://0-doi-org.brum.beds.ac.uk/10.3390/textiles1010006