
Development of Piezoresistive Sensor Yarn to Monitor Local Fabric Elongation


GEMTEX–Laboratoire de Génie et Matériaux Textiles, University of Lille, ENSAIT, F-59000 Lille, France
*
Author to whom correspondence should be addressed.
Textiles 2021, 1(2), 170-184; https://0-doi-org.brum.beds.ac.uk/10.3390/textiles1020008
Submission received: 4 June 2021
/
Revised: 29 June 2021
/
Accepted: 30 June 2021
/
Published: 2 July 2021
(This article belongs to the Special Issue Fibrous Materials (Textiles) for Functional Applications)
Abstract
:The performance of bulletproof vests is mainly based on the energy absorption capacity of the flexible fibrous reinforcements. To understand the in situ behaviour of these textile structures during a ballistic impact, we find the use of sensor yarns integrated into these fibrous reinforcements to be a non-invasive and reliable solution. Measurements of the dynamic deformation of the sensor yarns will provide a new and useful source of information. The design and manufacturing stages of a sensor yarn, made with the same structural yarns of the fabric, are detailed successively. Then, different batches of sensor yarns were designed, and electromechanical tensile tests were performed in quasi-static mode. These experiments provide encouraging results for the measurement of the deformation of a textile structure subject to a dynamic impact.
1. Introduction
Textile structures can be used as a flexible protection solution alone (bullet-proof vest), for low-speed protective level ammunition (NIJ II to IIIA standard) or fragment simulating projectile (FSP) (STANAG 2920 standard), or coupled with very rigid materials, metallic or ceramic, for personal protection from high-speed STANAG 2920 (or NIJ IV to V) level ammunition or FSP (STANAG 2920). During an impact event, the energy transmitted by the projectile breaks down into several forms of energy, the main one being absorbed by the fibrous reinforcement defined according to several parameters, such as the number of plies of the fibrous reinforcement, the bond and contact between the plies, the thickness of each ply, the nature of the threads in a ply, the densities of the yarns in the fabric, and the type of weave diagram of the fabric [1,2,3,4].
During ballistic tests using conventional ammunition, impacts by FSPs or shock waves resulting from an explosive charge (or sometimes a combination of the two), X-ray, or high-speed camera means can be used to observe the dynamic deformation modes of the multi-layer woven protective structure [5]. However, these measuring instruments do not allow for the observation of precisely the in situ dynamic behaviour of the fibre reinforcement within the textile structure. Only numerical models applied to woven structures can provide the different dynamic deformations of the yarns over time [6,7]. Depending on the accuracy and complexity of the numerical models used, the dynamic deformations of the yarns inserted into a woven structure are more or less faithfully represented [8,9].
One of these solutions to measure locally the behaviour of a fibrous reinforcement subjected to impact or shock at high speed consists of integrating sensor yarns, having the same mechanical behaviour as the structural yarns. In recent studies, we have been able to monitor the forming behaviour of a 3D fabric with the help of glass/polypropylene commingled yarns coated with an innovative piezoelectric solution [10] or during the monitoring of production cycles on a weaving machine with E glass yarns coated with a suitable piezoelectric solution [11,12]. Other solutions for the in situ structural health monitoring textile (that can be used in textile-reinforced thermoplastic composites) can be found in the literature [13,14,15,16].
The use of sensors yarn integrated in the textile materials will ensure the same mechanical behaviour as the structural yarn while being impacted. Thus, the sensor yarn will be deformed similarly as structural yarn in a dynamic event. These new sensor yarns integrated into the fibre reinforcements will enable the evolution of the structures under dynamic stress to be monitored. A better understanding of dynamic deformations and the associated energy absorption modes will make it possible to design fibre materials that are lighter and more resistant to shock or impact.
However, the difficulty lies in the design and manufacture of a sensor yarn, made from the same structural yarns of the fabric, which allows for a precise and dynamic response to an impact. The objective of this article was to identify the different parameters of the manufacturing process to obtain the sensor yarn to measure a local elongation in quasi-static and subsequently dynamic mode.
2. Materials and Methods
2.1. Material
2.1.1. Sensor Substrate: 930 dTex Twaron® Yarn
The 930 dTex—i.e., 10,000 m of this yarn weighing 930 g—Twaron® yarn (Teijin) was used as sensor substrate. This yarn contains 1000 para-aramid filaments per section. This kind of yarn is widely used in ballistic protection (e.g., bullet-proof vest) due to its high strength-to-weight ratio, its low linear density, and its high performance against ballistic impacts once woven. To facilitate the weaving process, besides the addition of the sizing agent on the yarns done by manufacturers, we also applied a twisting value of 25 twists per meter. This twist allows for a better cohesion between the filaments, but also provides a slight additional elasticity that could facilitate the weaving process by reducing the mechanical stress on the yarns.
2.1.2. Pre-Coating: PVA
Polyvinyl alcohol, commonly known as PVA, is a water-soluble polymer widely used in the textile field as a sizing agent to facilitate the weaving process. The PVA is characterised by an improved adhesion resistance, an easy solubility in water, and an enhanced ability to emulsify, which allows for the development of thin films with high resistance. The PVA used in pellet form (Mw = 9000–10,000) by Sigma-Aldrich.
PVA pellets were dissolved in ionised water at 70 °C into a 50 mL beaker. The beaker was deposited on a magnetic stirrer with a hot plate. The stir (magnetic) bar was immersed in the water, providing a stirring action. The stirring speed applied was about 800 rpm in the beginning. The PVA pellets were added as we went along. In parallel, the stirring was gradually increased to reach 1200 rpm to maintain a homogeneous PVA/water blending throughout the process. Finally, 25 drops of rhodamine B (red dye in powder form beforehand diluted in water) were added to better observe the PVA coating into the Twaron® yarn under the microscope.
After many experiments, the most appropriate PVA aqueous solution was found to be a PVA solution with a concentration of 9% by mass.
At this concentration, a good compromise was found. Indeed, this concentration permitted having both a uniform, homogeneous, and thin thickness PVA coating in order to keep a good cohesion between the filaments constituting the Twaron® yarn (c.f. Section 2.1.1) and to maintain certain flexibility while keeping sufficient rigidity to wind the connectors (c.f. Section 2.1.3).
2.1.3. Connecting Wires
The connecting wires, manufactured by Dahmen, are made of nickel alloys (NiCu 30 Fe), whose diameter is equal to 0.10 mm. They permit the transmission of the electronic signal that came from the sensor yarns zone to a data acquisition unit connected to a computer. Experimentally, the electrical resistance of the wire according to the length was measured as 50 Ohm/m.
2.1.4. Piezoresistive Coating: CleviosTM F020 Commercial Formulation
PEDOT is a polymer resulting from the polymerisation of 3,4-ethylene dioxythiophene (EDOT). In a conductive state (i.e oxidised), the PEDOT contains some positive charges. To balance and reach electrical neutrality, an addition of anions is essential. This is achieved during the synthesis phase. Today, the most important anion source used is the PSS (poly(styrene sulfonate)), because the PEDOT/PSS synthesis is better controlled. The latter plays the role of dopant source (i.e., oxidant source). In particular, the Heraeus Deutschland GmbH has developed a range of aqueous dispersions marketed under the brand name CleviosTM. Among the CleviosTM product range, our choice was focused on the commercial aqueous dispersion CleviosTM F020 (abbreviated CF020 in this article), which has been proven to be the most conductive aqueous dispersion of their range, with a sheet resistance less than 103 Ohm/sq. This can be directly applied on plastic surfaces such as PE, PET, PP, PC, or PA, and it is a dark blue liquid.
2.2. Design and Manufacturing Piezoresistive Sensor Yarns
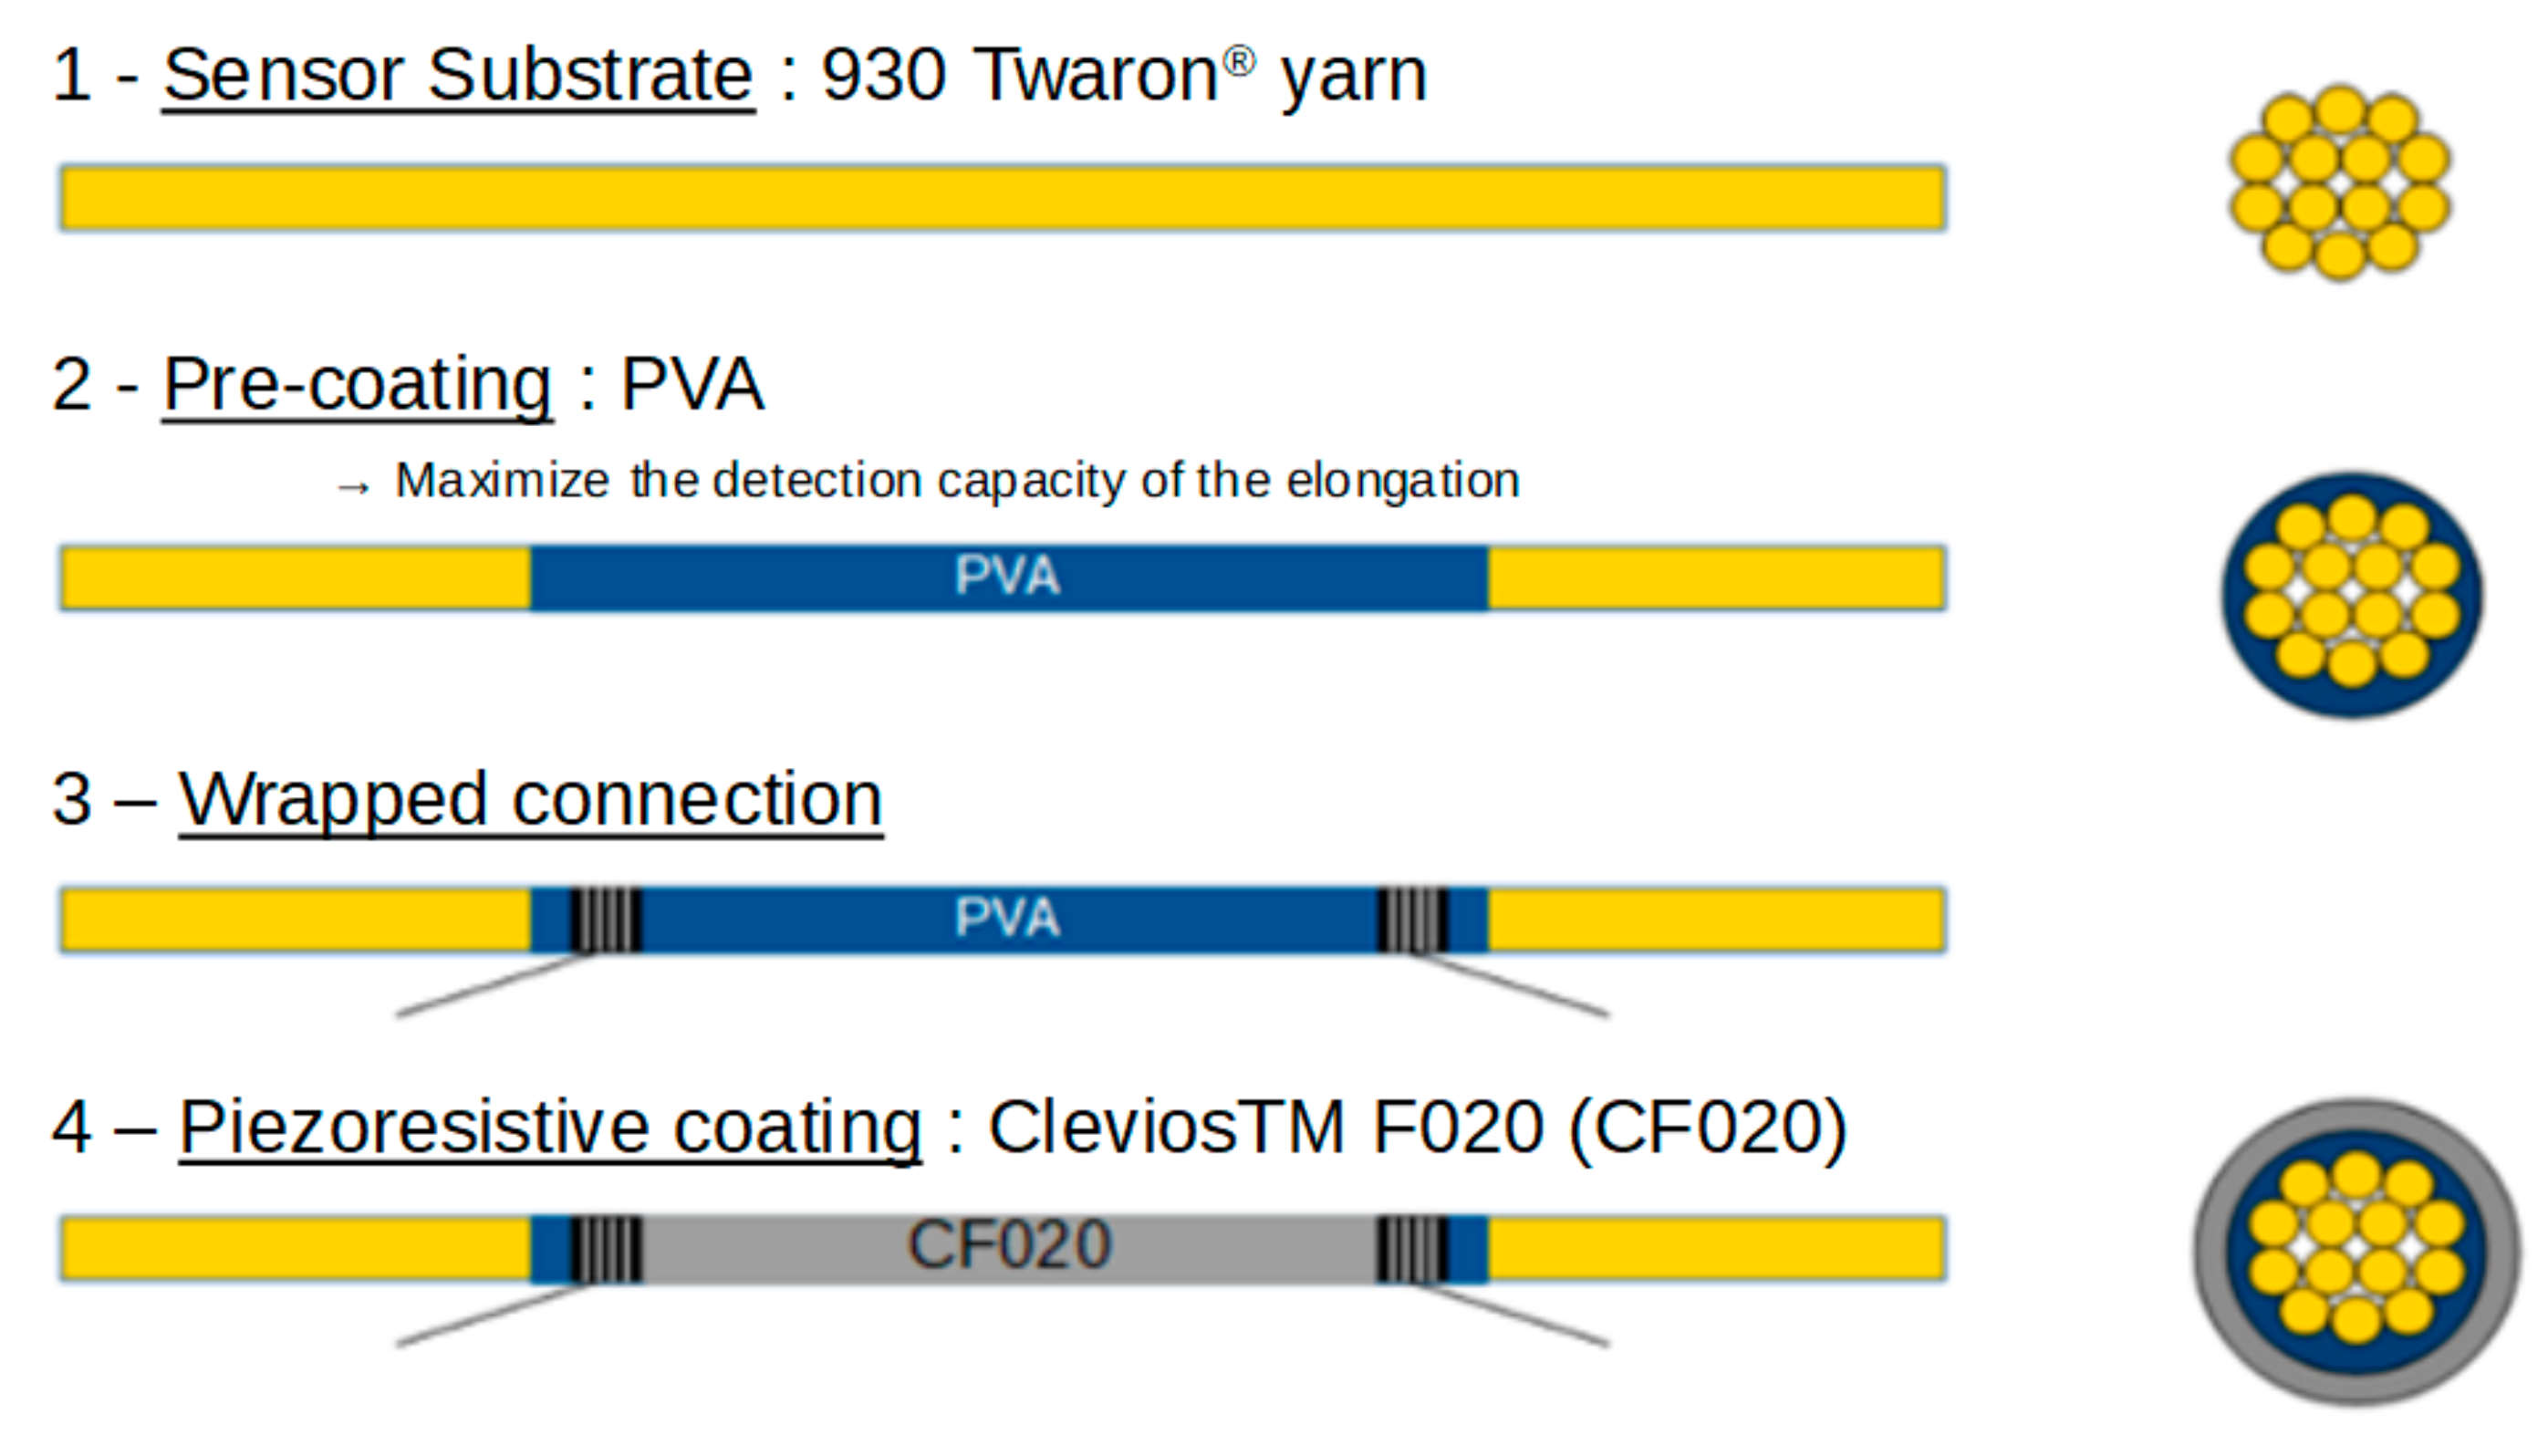
The sensor yarn developed in this study was composed of a yarn substrate, a pre-coating, two wrapped connections, and a piezoresistive coating (Figure 1).
The yarn substrate (Twaron® yarns) was chosen to have the same characteristic of other yarn that constitute a standard bulletproof vest (Figure 1, step 1)
The PVA pre-coating was chosen for three reasons (Figure 1, step 2). First, according to Trifigny, it is preferable that the piezoresistive coating does not penetrate the core of the yarn (between filaments). Thus, the capacity of the sensor yarns to detect an elongation is maximised [17]. Secondly, the PVA solution permits the generation of a thin electrical insulation coating to maintain the piezoresistive coating closer to the yarn to better follow the deformation when it used as an elongation deformation sensor and have to save space. The third and final reason is that the PVA solution has to maintain certain flexibility while keeping enough rigidity (cohesion between filaments) to wrap connecting wires around the pre-coated Twaron® yarn.
Connecting wires (c.f. Section 2.1.3) were chosen for their thin thickness, as well as their good electrical conductivity and handling of the material. Thus, it is possible to realise a wrapped connection. The length between the two wrapped connections was about 25 mm, slightly less than the length used in the PhD thesis of Trifigny [17], which was 30 mm. This dimension permits the balance between: an accurate measurement in line with what we want to measure (point of ballistic impact onto woven structure), a good aspect ratio to amplify the piezoresistive effect (aspect ratio corresponds to the length of sensor divided by the width of the sensor—in our case the perimeter—equal to 21), and a low resistance of the sensor to facilitate electrical measurements (less thermal noise, for example).
2.2.1. PVA Pre-Coating on Twaron® Yarns
Before the deposition of PVA pre-coating on Twaron® yarns, the yarns (l = 36 cm) were maintained onto a rectangular frame. They had a slight tension to their end to obtain yarns straight during the application of the coating.
Many coating methods of deposition exist in the literature. Among these methods, we chose to manually apply the PVA aqueous solution with a fine brush. To obtain PVA pre-coating length from 35 to 45 mm (with an average of 37.8 ± 2.7 mm), it is necessary to apply PVA aqueous solution on 20 mm to consider the phenomenon of PVA solution diffusion by capillarity (between filaments of yarn).
Once the PVA aqueous solution was applied to the yarns, a drying step was required to remove water from the PVA aqueous solution to form the coating on the yarn surface. The drying of the aqueous solution was carried out at 80 °C for 1 h in a heat chamber (Memmert UF110 plus). The temperature was chosen to be well below the degradation temperature of PVA, which was from 200 °C. The Twaron® yarn was not degraded either at such temperature because its degradation temperature is above 400 °C.
2.2.2. Realisation of the Wrapped Connection
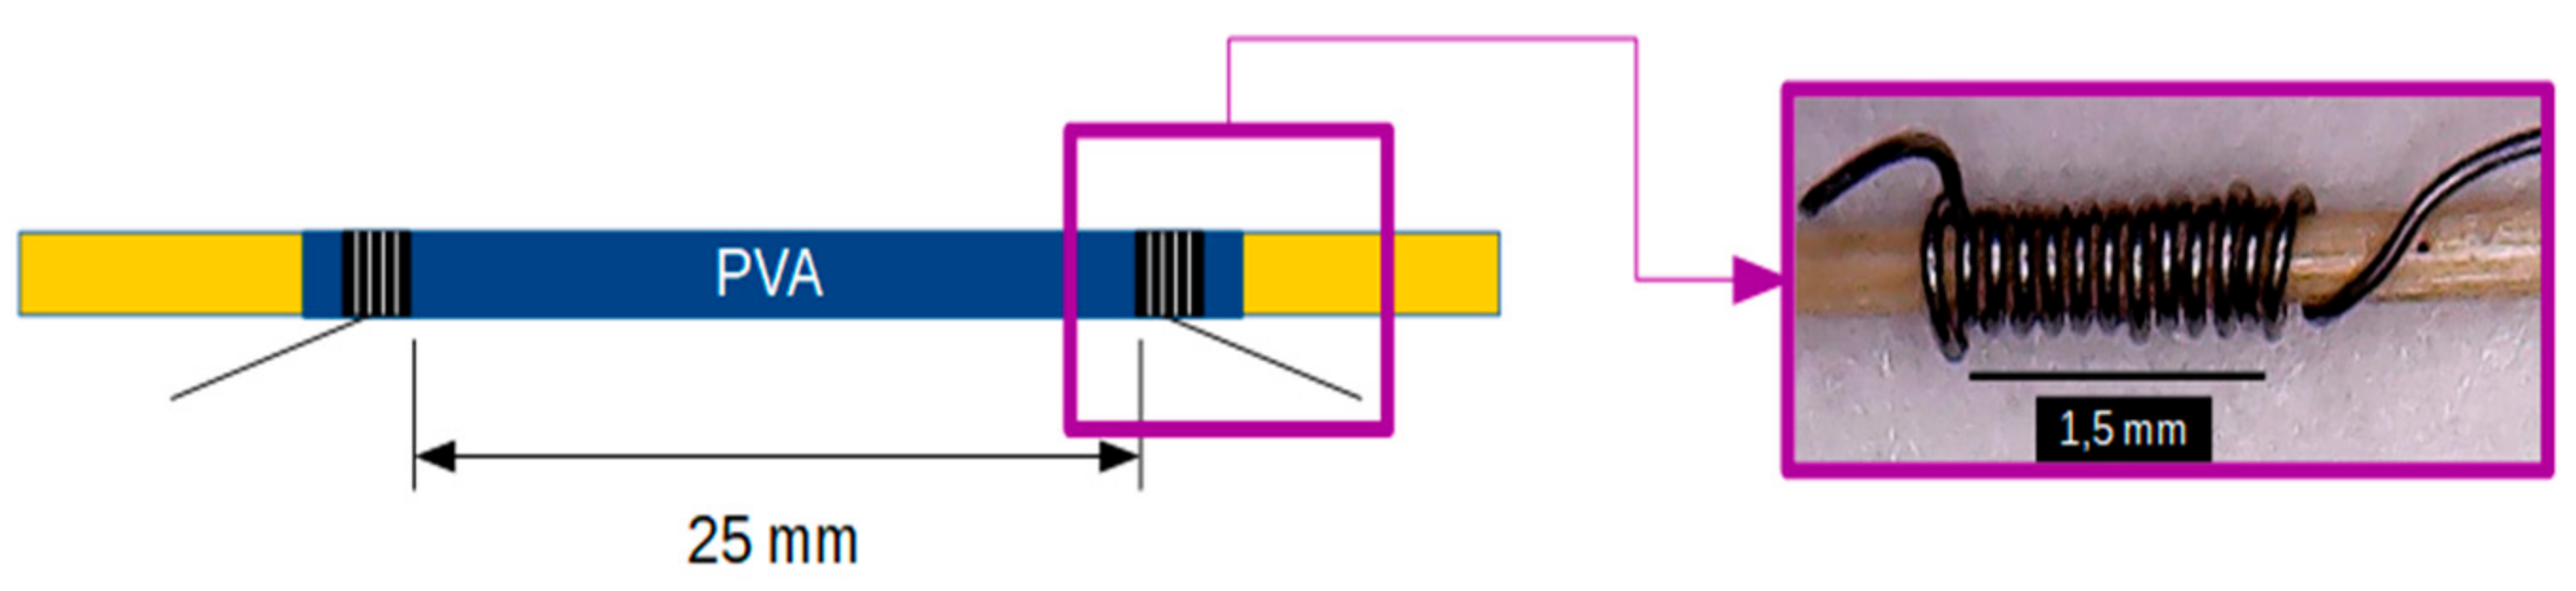
The wrapped connection was realised by connecting copper-based wires by tightly wrapping a few coils of a wire around the Twaron® yarn. Arbitrarily, the number of wires was set roughly at 12 (±1). The length between the two wrapped connection was about 25 mm (Figure 2) and defined the length of the sensor.
2.2.3. Piezoresistive Coating
Many coating methods to add electrical functionalities exist in the literature, such as manual deposition [17], electro-deposition [18], dip-coating [19,20], and chemical vapor deposition (CVD) [21,22]. In our case, the PEDOT/PSS aqueous dispersion (CleviosTM F020) was applied on PVA pre-coating Twaron® yarns with a fine brush. For the implementation, the yarns were maintained parallel onto a rectangular frame to applicate a slight tension to obtain straight yarns during the coating application. After coating, yarns were dried at 150° C in a heat chamber (Memmert model UF 110 plus) for 3 min. Such temperature was chosen according to the work of Akerfeldt [23] to improve the conductivity while reducing the resistance gap between different fabricated samples (in other words, allowing better reproducibility).
To evaluate the influence of the number of piezoresistive coating layers on the electric resistance and on the thickness of the sensor, we developed some batch of sensor yarns from 1 to 8 layers of piezoresistive coating. The same drying conditions (described in the previous paragraph) were applied between each piezoresistive coating. Then, mechanical and electromechanical behaviour were evaluated to understand the characteristics of our piezoresistive sensor yarn.
2.3. Experimental Methods for the Characterisation of Piezoresistive Sensor Yarns
2.3.1. Electrical Resistance Measurement
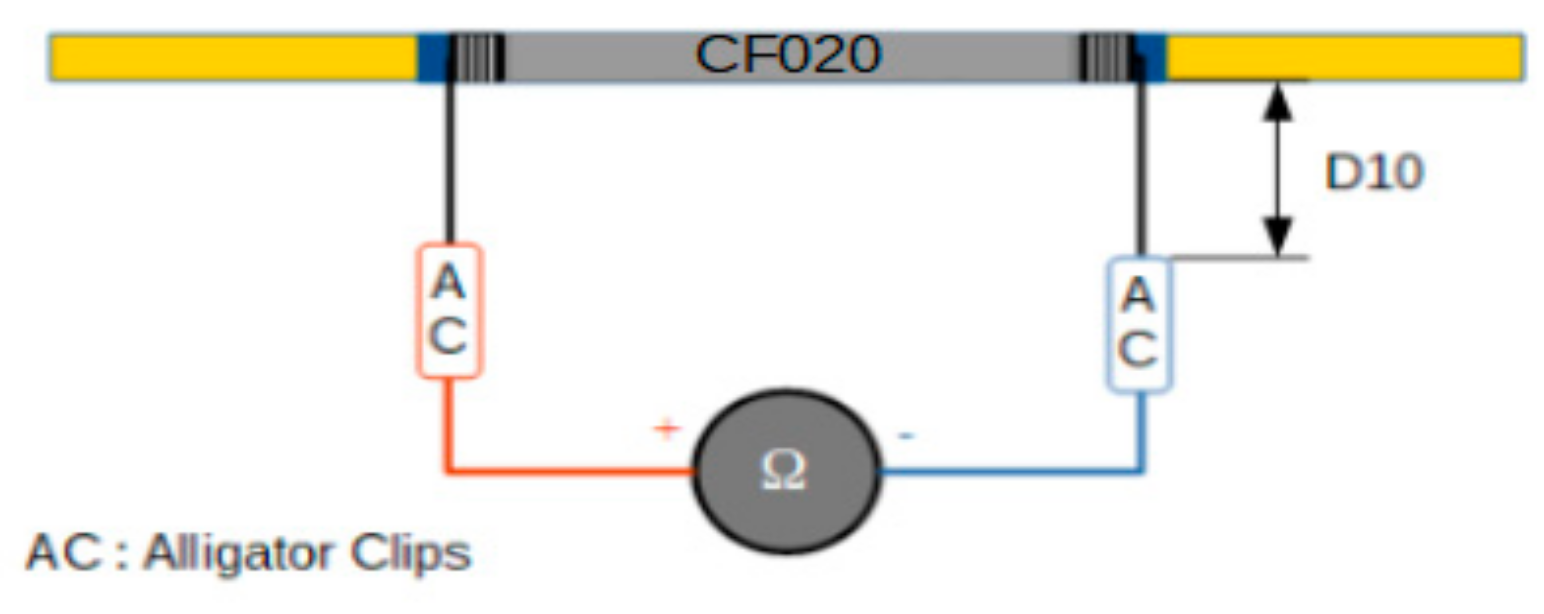
The electric resistance measurements of sensor yarns according to the number of piezoresistive coating layers were performed using an ohmmeter by connecting alligator clips onto the connecting wires. The clips were located onto the connecting wires at 10 cm (D10) from the end of the piezoresistive coating (Figure 3). The electric resistance was measured 24 h after application and dying of piezoresistive coating at standard atmosphere (20 °C, 65% RH).
For each configuration of piezoresistive sensor yarn (i.e., configurations sensor yarns ranging from 1 to 8 layers of piezoresistive coating), the determination of the average electric resistance was performed on 12 sensor yarns.
2.3.2. Optical Microscopy and Image Analysis
Optical image analysis was used to measure the apparent diameter of the pre-coated Twaron® yarns. The average apparent diameter value was obtained from five pictures taken along the pre-coated Twaron® yarn. For each picture, six points of measurement were performed using an optical microscope. The image analysis was performed with ImageJ software. Finally, 30 apparent diameters were measured and used for the calculation of the mean value.
For the determination of the average apparent diameter of sensor yarns, in configurations ranging from 1 to 8 layers of piezoresistive coating, the same method was performed. For each configuration, the method was performed on 12 sensor yarns to obtain a robust average value. In the end, 150 apparent diameters were measured and used for the calculation of the average apparent diameters for each configuration.
2.3.3. Tensile Testing
Tensile tests of sensor yarns were performed on MTS Criterion Model 43 tensile testing machine using 10 kN load cell at standard atmosphere (20 °C, 65% RH). Initially, the distance between the two jaws of the tensile testing machine was 150 mm for a speed of 150 mm/min. This low speed was applied to limit the slipping of the yarn in the jaws. A pre-load of 0.465 N was applied as required by the NF EN ISO 2062 standard. Tensile tests were steered in displacement and recorded the effort in the sensor yarn until the breakage of the yarn. The steering was ensured by TW Elite and TW Essential software.
Mechanical behaviour of yarn was obtained by plotting the applied strength as a function of the strain of the sensor yarn, which is defined by Equation (1).
with L the extended length of the sensor yarn (in mm) and L0 the initial length between the two jaws (i.e., 150 mm).
To check the influence at each step of the sensor yarns manufacturing on their mechanical behaviours, we performed mechanical tensile tests according to five configurations:
- Configuration 1: the virgin Twaron® yarns (VTY).
- Configuration 2: the PVA pre-coating Twaron® yarns (PVA-VTY).
- Configuration 3: the PVA pre-coating Twaron® yarns with connectors (COPVA-VTY).
- Configuration 4a: the elongation sensor yarns with 3 layers of CF020 (3-CF20-CO-PVA-VTY). It was the configuration 3 with the addition of 3 layers of CleviosTM F020. Drying conditions (c.f. Section 2.2.3) were applied between each coated layer of CleviosTM F020.
- Configuration 4b: the elongation sensor yarns with 8 layers of CF020 (8-CF20-CO-PVA-VTY). It was the configuration 4a with the addition of 5 layers of CF020.
For each configuration, 10 samples were fabricated and tested with the MTS Criterion Model 43 tensile testing machine.
Finally, to obtain an accurate mechanical characterisation of the virgin Twaron® yarn, 20 samples measuring 250 mm were tested at a speed of 250 mm/min with a pre-load of 0.465 N to strictly follow the NF EN ISO 2062 standard and to compare the value with the datasheet.
The majority of tested yarns were at 150 mm/min tensile load speed, which made it easier to understand their dynamic behaviour but thus meant they could not be directly compared with coated and sensor yarns tested at 250 mm/min.
2.3.4. Electromechanical Tensile Testing
To evaluate the performance and the reproducibility of the piezoresistive sensor yarns as elongation strain gauges, we performed electromechanical tensile tests.
Thus, in order to understand the influence of the number of piezoresistive coating (CleviosTM F020) layers on the electromechanical behaviour of our sensor yarns, we performed electromechanical tensile tests on two types of sensor yarns, with 3 and 8 piezoresistive coating layers. For each configuration, 6 and 5 samples, respectively, were tested.
During the tensile test (same procedure described previously in Section 2.3.3), the electrical resistance of the sensor yarn was recorded over the time with data acquisition chain. This chain was composed of a voltage divider and a National Instruments USB-6003 data acquisition (DAQ) device with a built-in voltage source of 5 V (Ve).
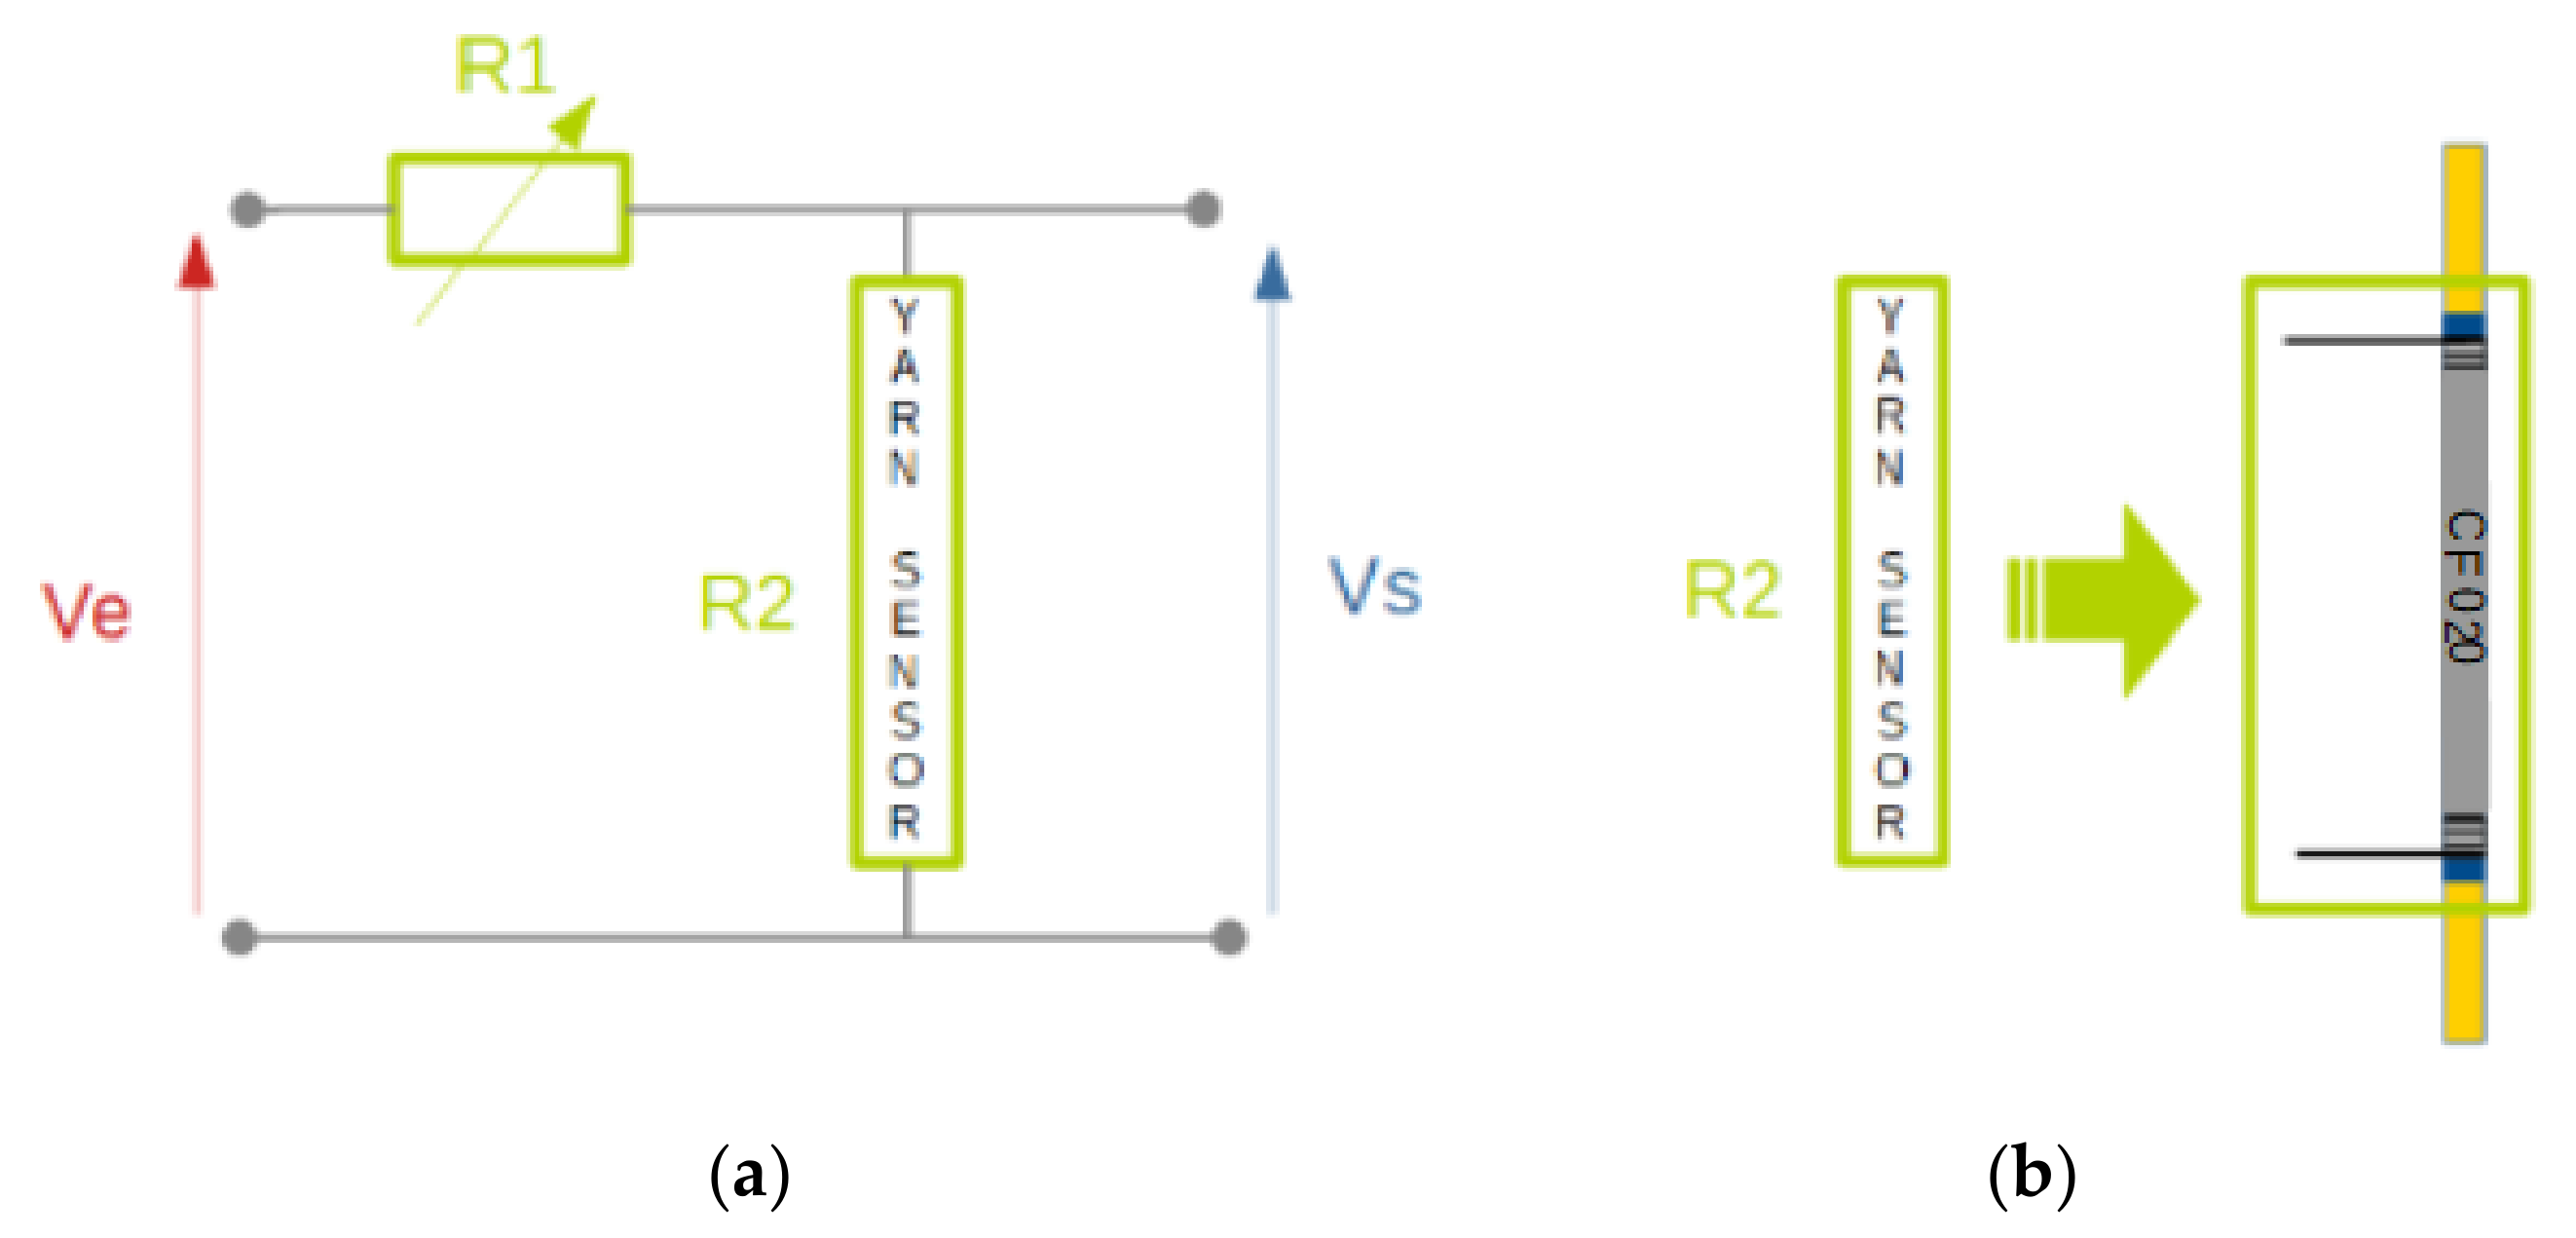
The voltage divider is composed of two resistors (R1 and R2) in series. Usually, this kind of device is used to provide a smaller output voltage from a higher input voltage. In our study, we used it to measure the voltage (Vs) across the resistor (R2), which are our sensor yarns, in order to deduce the variation of electrical resistance (R1) during a tensile test. The resistor (R1) is an RM6 decade resistance box that allows us to adjust the resistance as we wish. This device has the advantage of being easy to implement and robust over time, as represented in Figure 4. From a Kirchhoff law and an Ohm law applied across R2, we obtained the equation of the voltage divider (Equation (2)). If we want to determine R1 by knowing R2 and Ve (beforehand, we isolate R1 from the previous equation), we then obtain Equation (3).
The device used is a National Instruments USB-6003 data acquisition (DAQ) device. This device permitted us to record and digitise Vs on 32 bits. By connecting this device to the USB port of a computer, we were able to use an interface that allows for the use of the DAQExpress™ software to measure electrical signals during the tensile test. The acquisition frequency is around 1000 Hz.
Thanks to the data acquisition device, many resistance measurements of the sensor yarns during the tensile test were recorded. All of these values generated a basic signal. This basic signal did not allow for the evaluation of the amplitude variations of the signal, and therefore needed to be reformatted. This is why the signal must consider the initial resistance of the sensor yarn as given in Equation (4). Thus, the evolution of the resistance is calculated as the ratio between the relative variation of resistance (i.e., the resistance difference of the sensor at the instant of measurement (Ri) compared to the initial resistance (R0)) and this same initial resistance (R0) of the sensor yarns.
To reduce the noise of the signal, we applied a moving average statistical treatment (Equation (5)) onto the raw values of the basic signal recorded with our data acquisition devices.
The number of raw values chosen to average the electrical resistance was a period of 20 values for an acquisition frequency around 1000 Hz with the data acquisition device. This method allowed for smoothing of the signal. This method can be compared to a low-pass filter and can be written as Equation (6).
The electromechanical characterisation makes it possible to calculate the gauge factor k (Equation (7)). It is the ratio between the evolution of the resistance (Δ R⁄R0) compared to the geometric deformation (ε) (i.e., relative elongation Equation (1)). Generally, the higher the gauge factor, the more sensible the sensor yarn is, and therefore also the accuracy and the effectiveness.
On the basis of the result obtained thanks to the linear regression analysis, we determined a linear relationship between the resistance (ΔR/R0) of the sensor yarn and the strain (ε) of the sensor yarn. Thus, it can be deducted the factor K.
Beforehand, it is important to synchronise the time base intrinsically linked to the electric signal obtained by the data acquisition devices and the time base intrinsically linked to the relative elongation of sensor yarn obtained by the sensor of the MTS Criterion Model 43 tensile testing machine.
2.4. Statistical Analysis
Experimental results are expressed as mean value (M) ± standard deviation (SD). One-way analysis of variance (ANOVA) was performed with Excel Stat to establish a significant difference on the mechanical property (tensile test) at each step, allowing the realisation of sensor yarns. Each mean was compared with each of the others, and two results were considered statistically different if a p-value of less than 0.05 was obtained for one of the mechanical properties. As ANOVA is a linear model, assumptions about residual (the same that regression assumptions) are assumed or verified: independence: not obvious relationship between measurements (assumed), normality: verified by Shapiro–Wilk’s test, equal variance: verified by Levene’s test and not too many outliers observed among residual value. Finally, the one-way ANOVA was followed by Fisher’s post hoc test, which is used to determine significant differences between group means in an analysis of variance. To help visualise the significant differences between group means, we used letters as population “label”. If populations shared the same letters, there were no differences; if not, they were different.
3. Results and Discussion
3.1. Influence of the Number of Piezoresistive Coating Layers on the Resistance of the Sensor Yarns
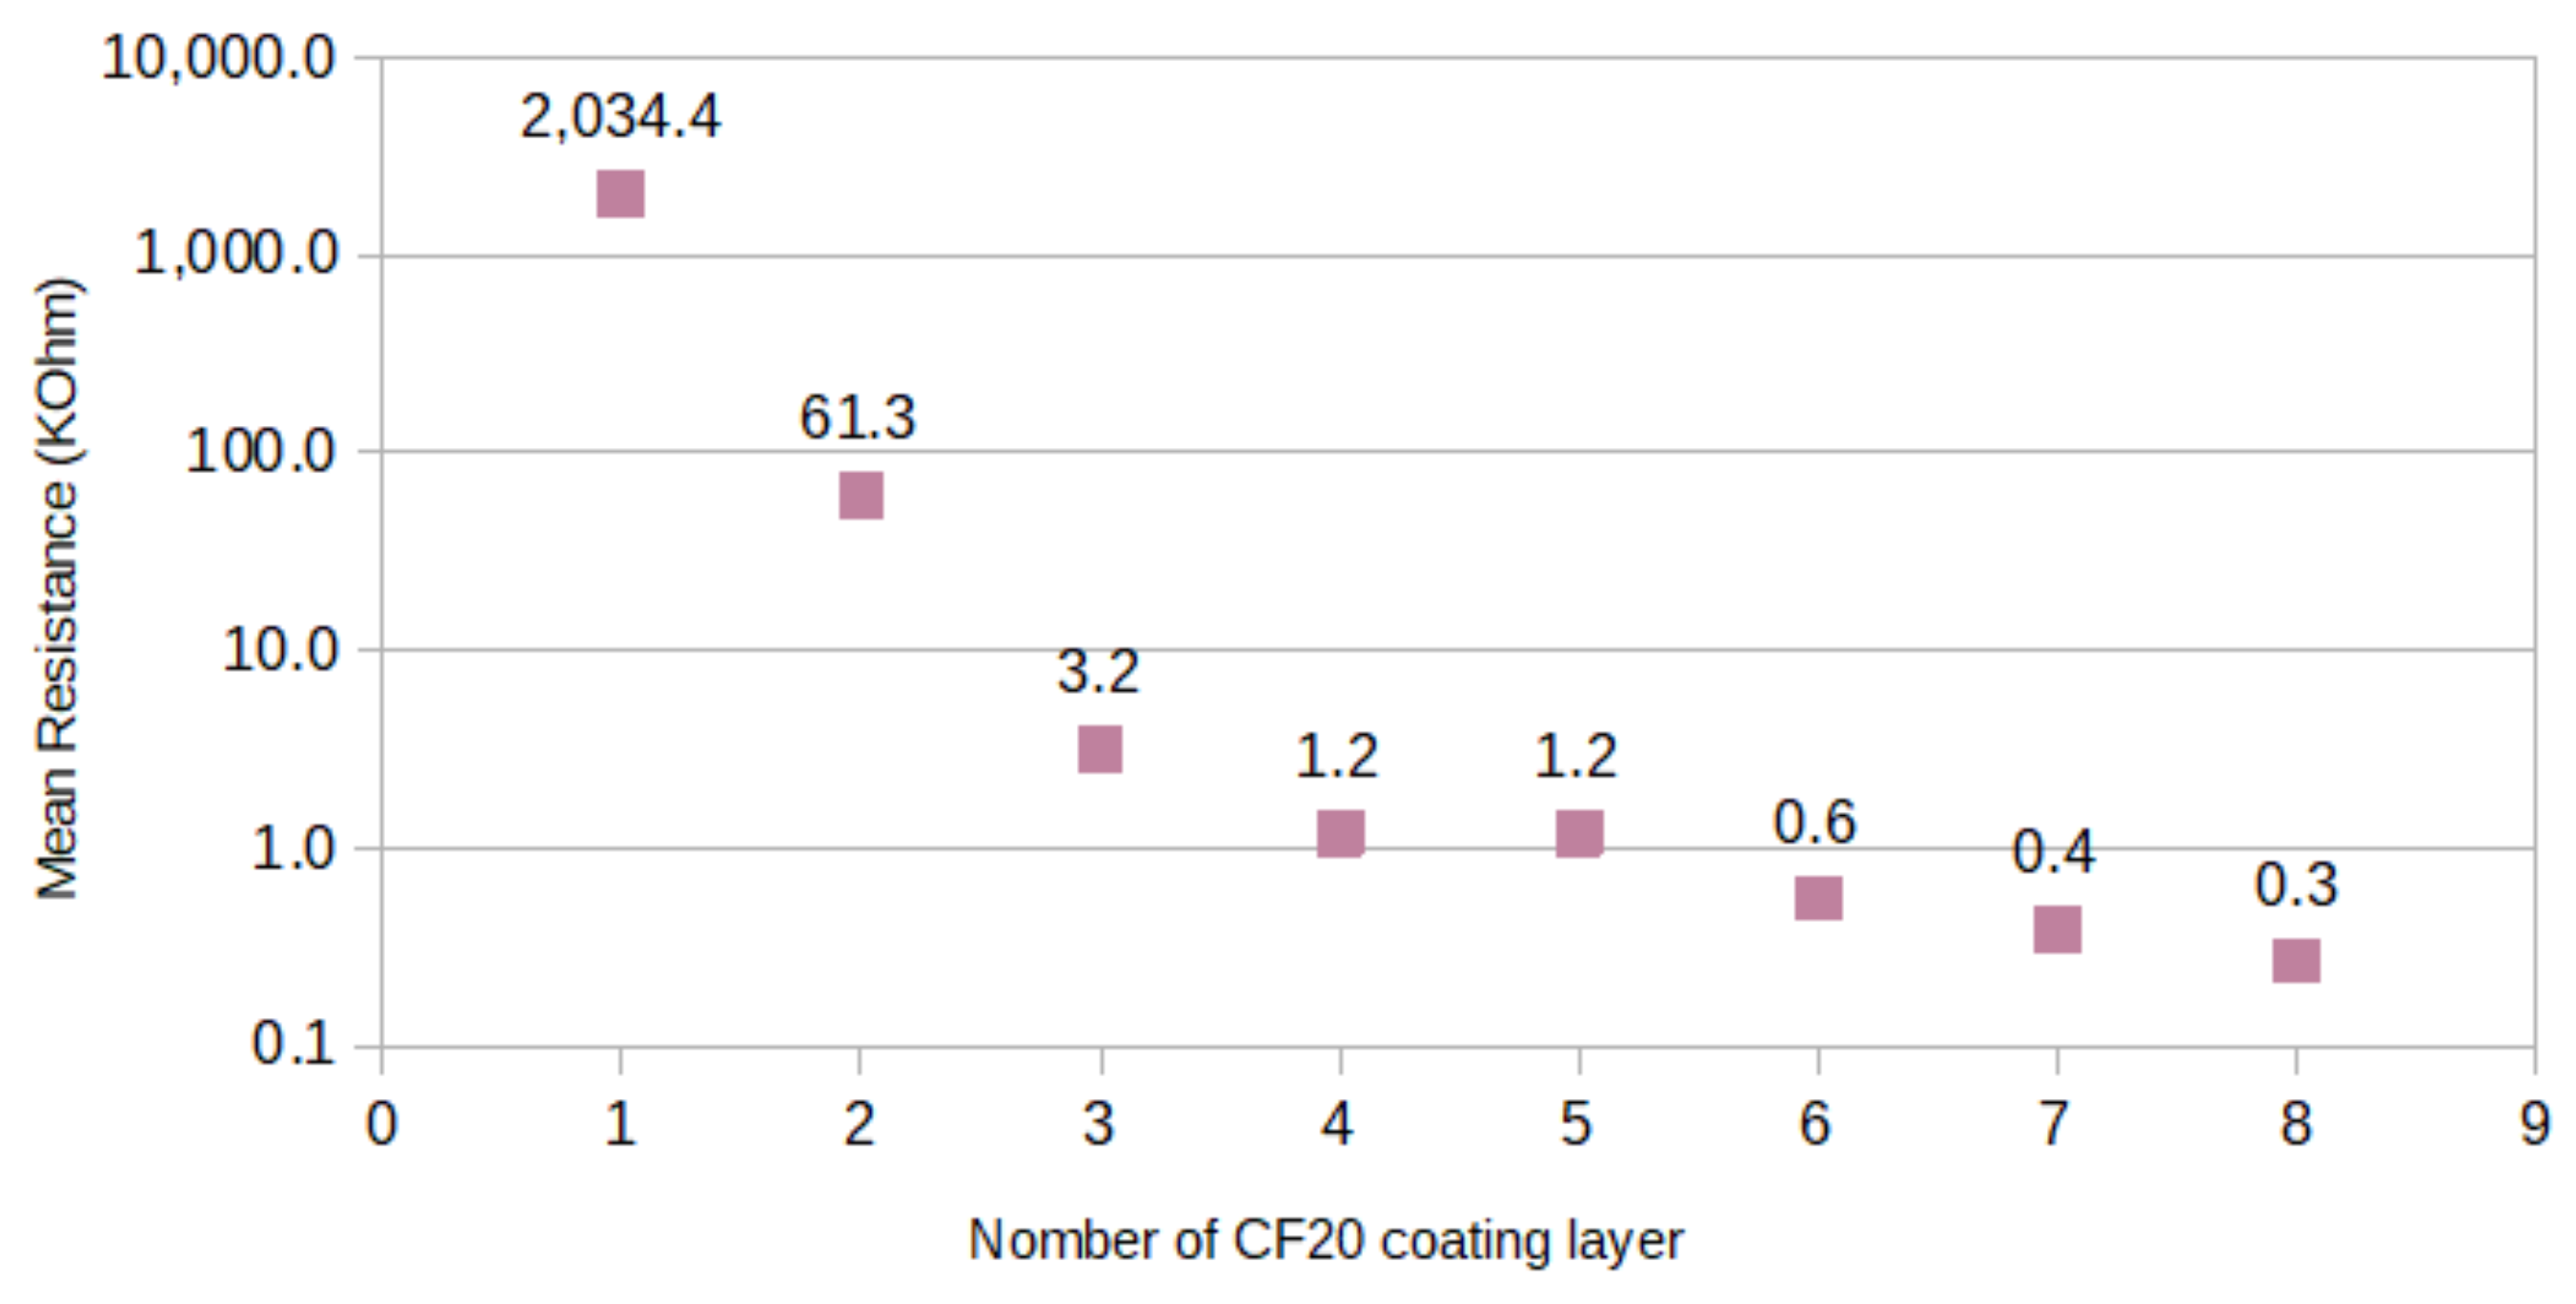
The average electrical resistance of sensor yarns for different layers of CleviosTM F020 (CF020) coating applied on the PVA pre-coating Twaron® yarns is shown in Figure 5.
Overall, it was observed that the higher number of layers, the more the resistance decreased. In particular, from one to three piezoresistive coating (CF020) layers, we observed a sudden drop in resistance. The resistance moved from 2034.4 to 3.2 kΩ. This high resistance at the beginning can be explained by the heterogeneity of the coating on the PVA pre-coated Twaron® yarn surface. Some areas of the yarn were covered, while others were not. Thereafter, the increase in the number of layers applied would cause homogenisation of the coating. It allowed for a reduction in the difference of resistance between each sensor yarn. We observed a decrease in the standard deviation (SD). In addition, in the same way, the coefficient of variation (CV%) decreased: from 124% for one layer to 18% for eight layers of piezoresistive coating. Then, from three to six layers of piezoresistive coating, the resistance decrease was low. The resistance values moved from 3.2 to 0.6 kΩ. Finally, from six and eight layers of piezoresistive coating, the resistance values seemed to level off 0.3 kΩ.
3.2. Influence of the Number of Piezoresistive (CF020) Coating Layers on the Sensor Yarn Thickness
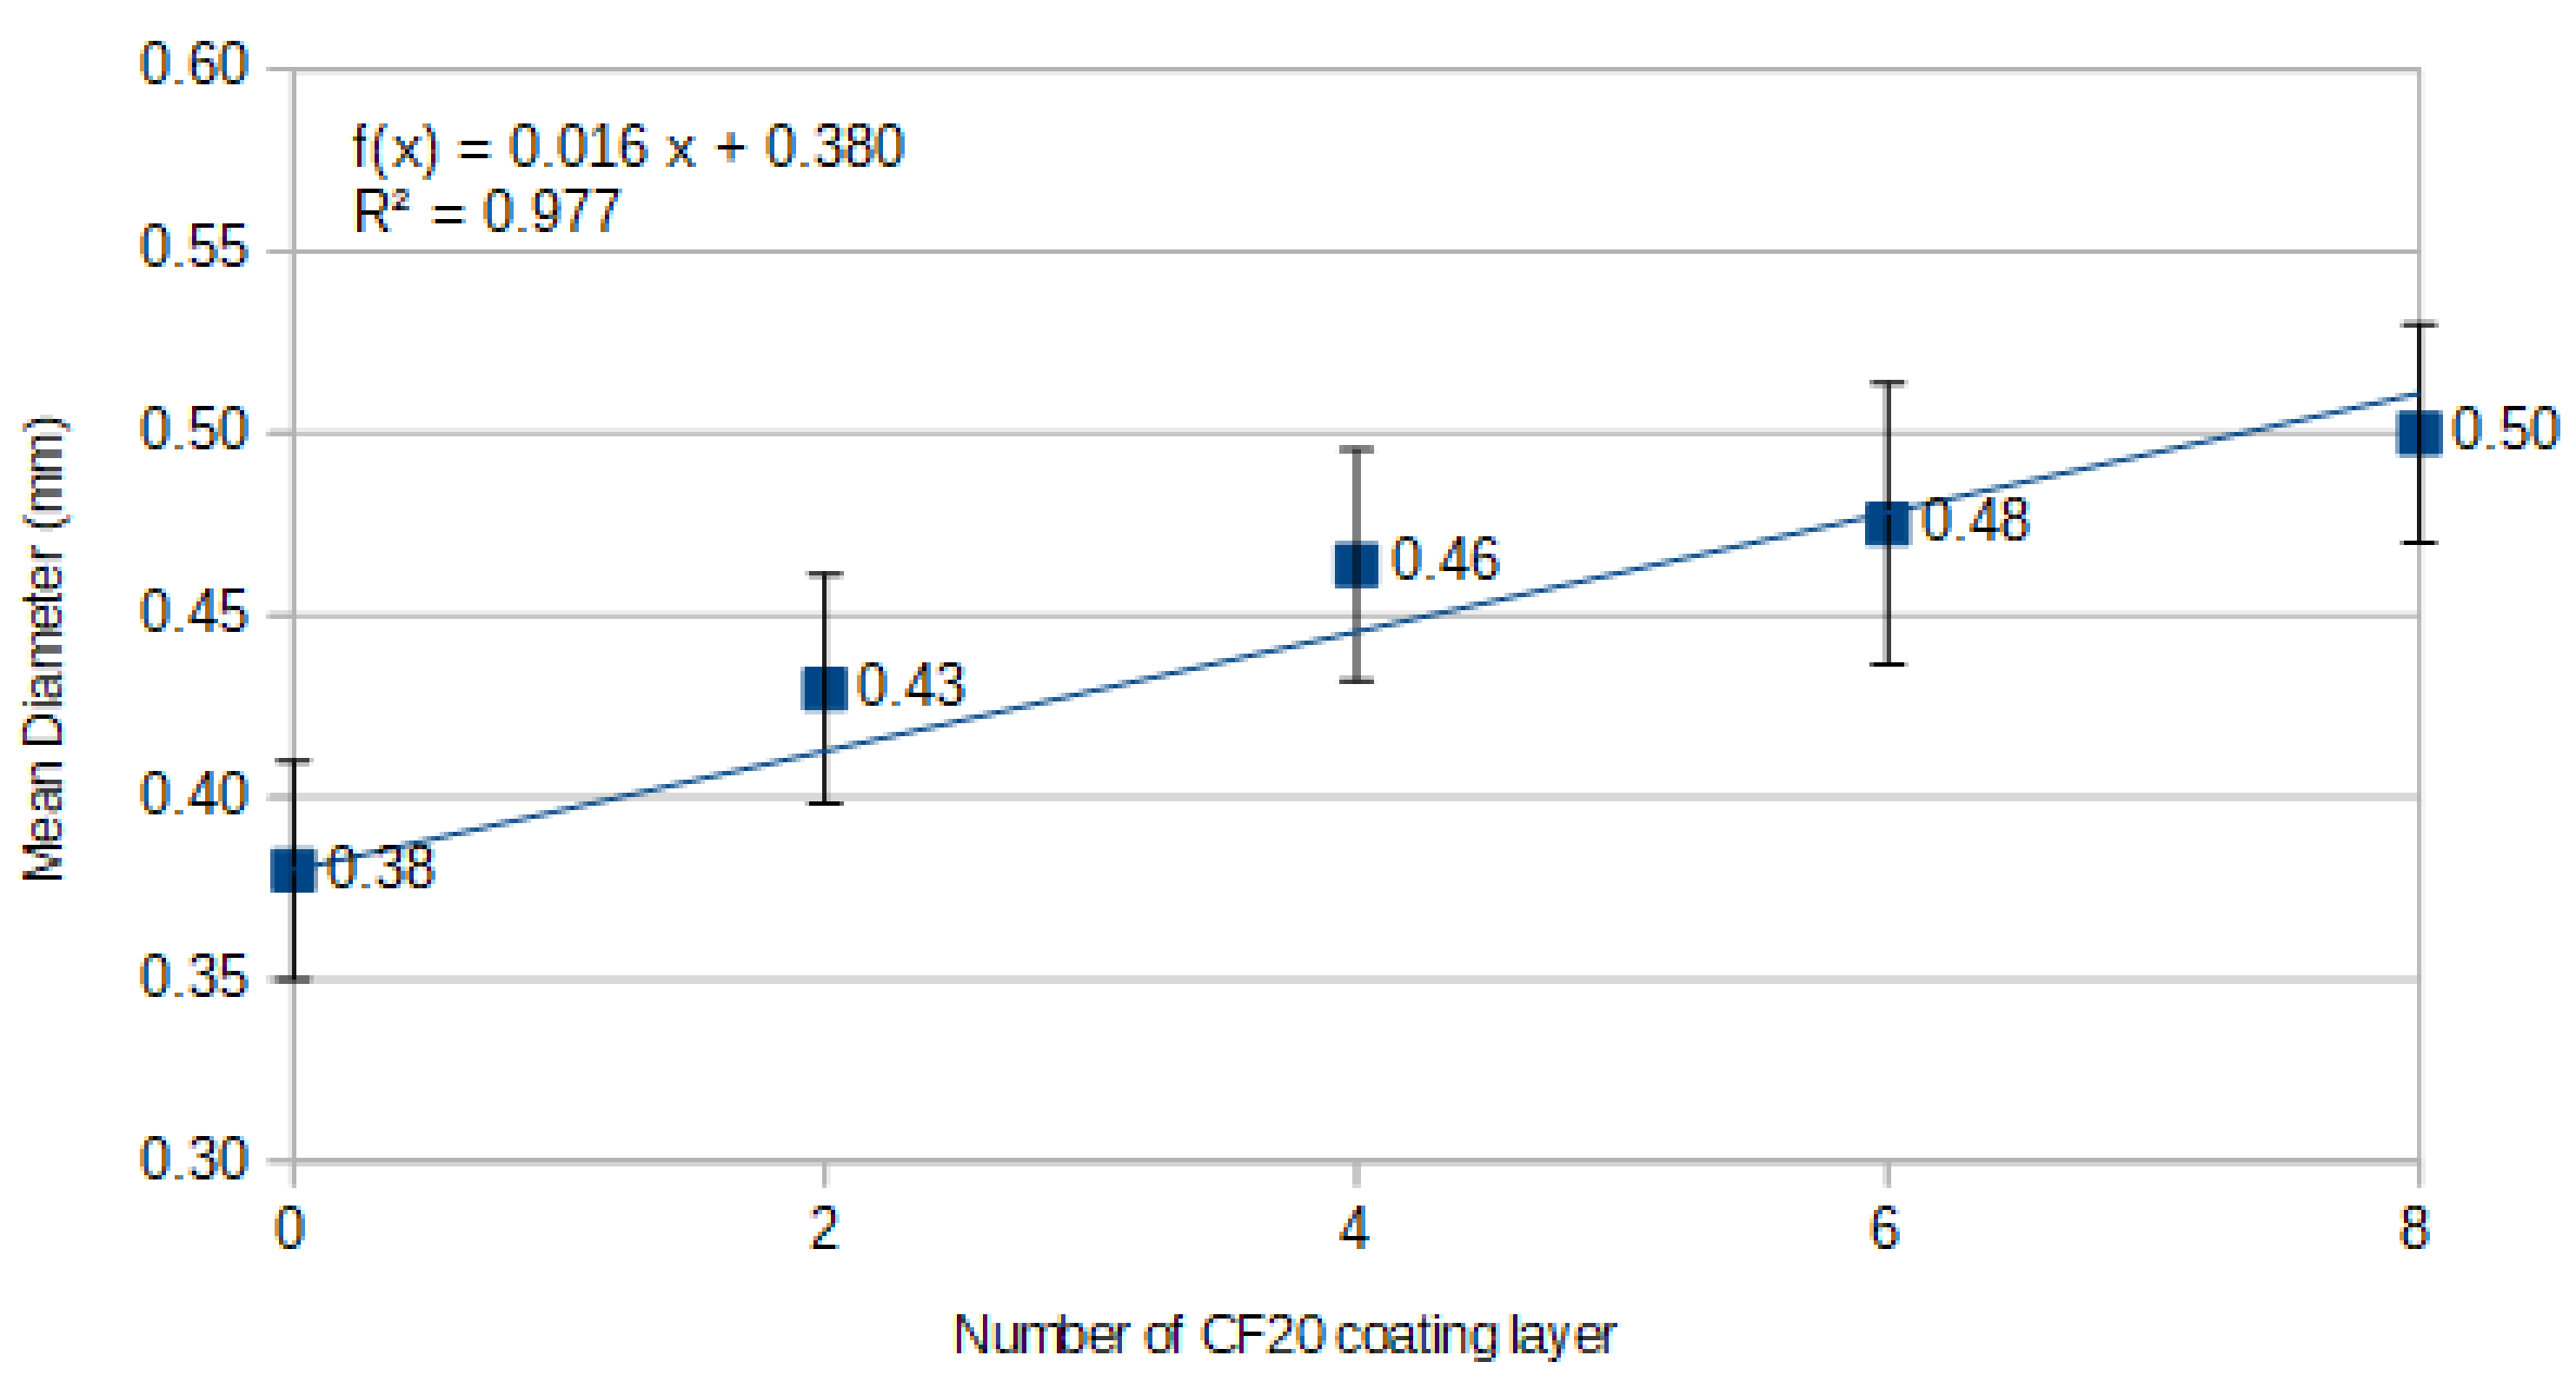
In parallel with the measurement of the electric resistance, the diameter of sensor yarns was measured (after each layer of piezoresistive (CF020) coating applied). Beforehand, the apparent diameter of PVA pre-coating yarns was measured to 0.38 ± 0.03 mm. Thus, it can be inferred with the thickness of the piezoresistive coating. Resulting from the measurement of the apparent diameter with an optical microscope and the ImageJ software, we show in Figure 6 the apparent diameter of sensor yarns for different layers of piezoresistive coating. The number « 0 » corresponds to the apparent diameter of PVA pre-coating yarns. As a reminder, each point on the graph corresponds to an average of 150 measurements. Linear regression was plotted to pass through all the points with a coefficient of determination (R2) equal to 0.977. We can therefore conclude that there was a linear relationship—written in the form of an equation ax + b—between the number of piezoresistive coating layers and the apparent diameter of the sensor yarns. The linear regression coefficient « a » was equal to 0.016, and the coefficient « b » to 0.38. The constant « b » represents the apparent diameter of the pre-coated PVA yarns, and the coefficient « a » was 0.02. This means that per each piezoresistive coating layer, the apparent diameter of the sensor yarn increased by 0.016 mm (16 μm). In other words, the thickness of the coating increased by 0.008 mm (8 μm) per layer added by brush. This point shows that the manually coating methods were controlled.
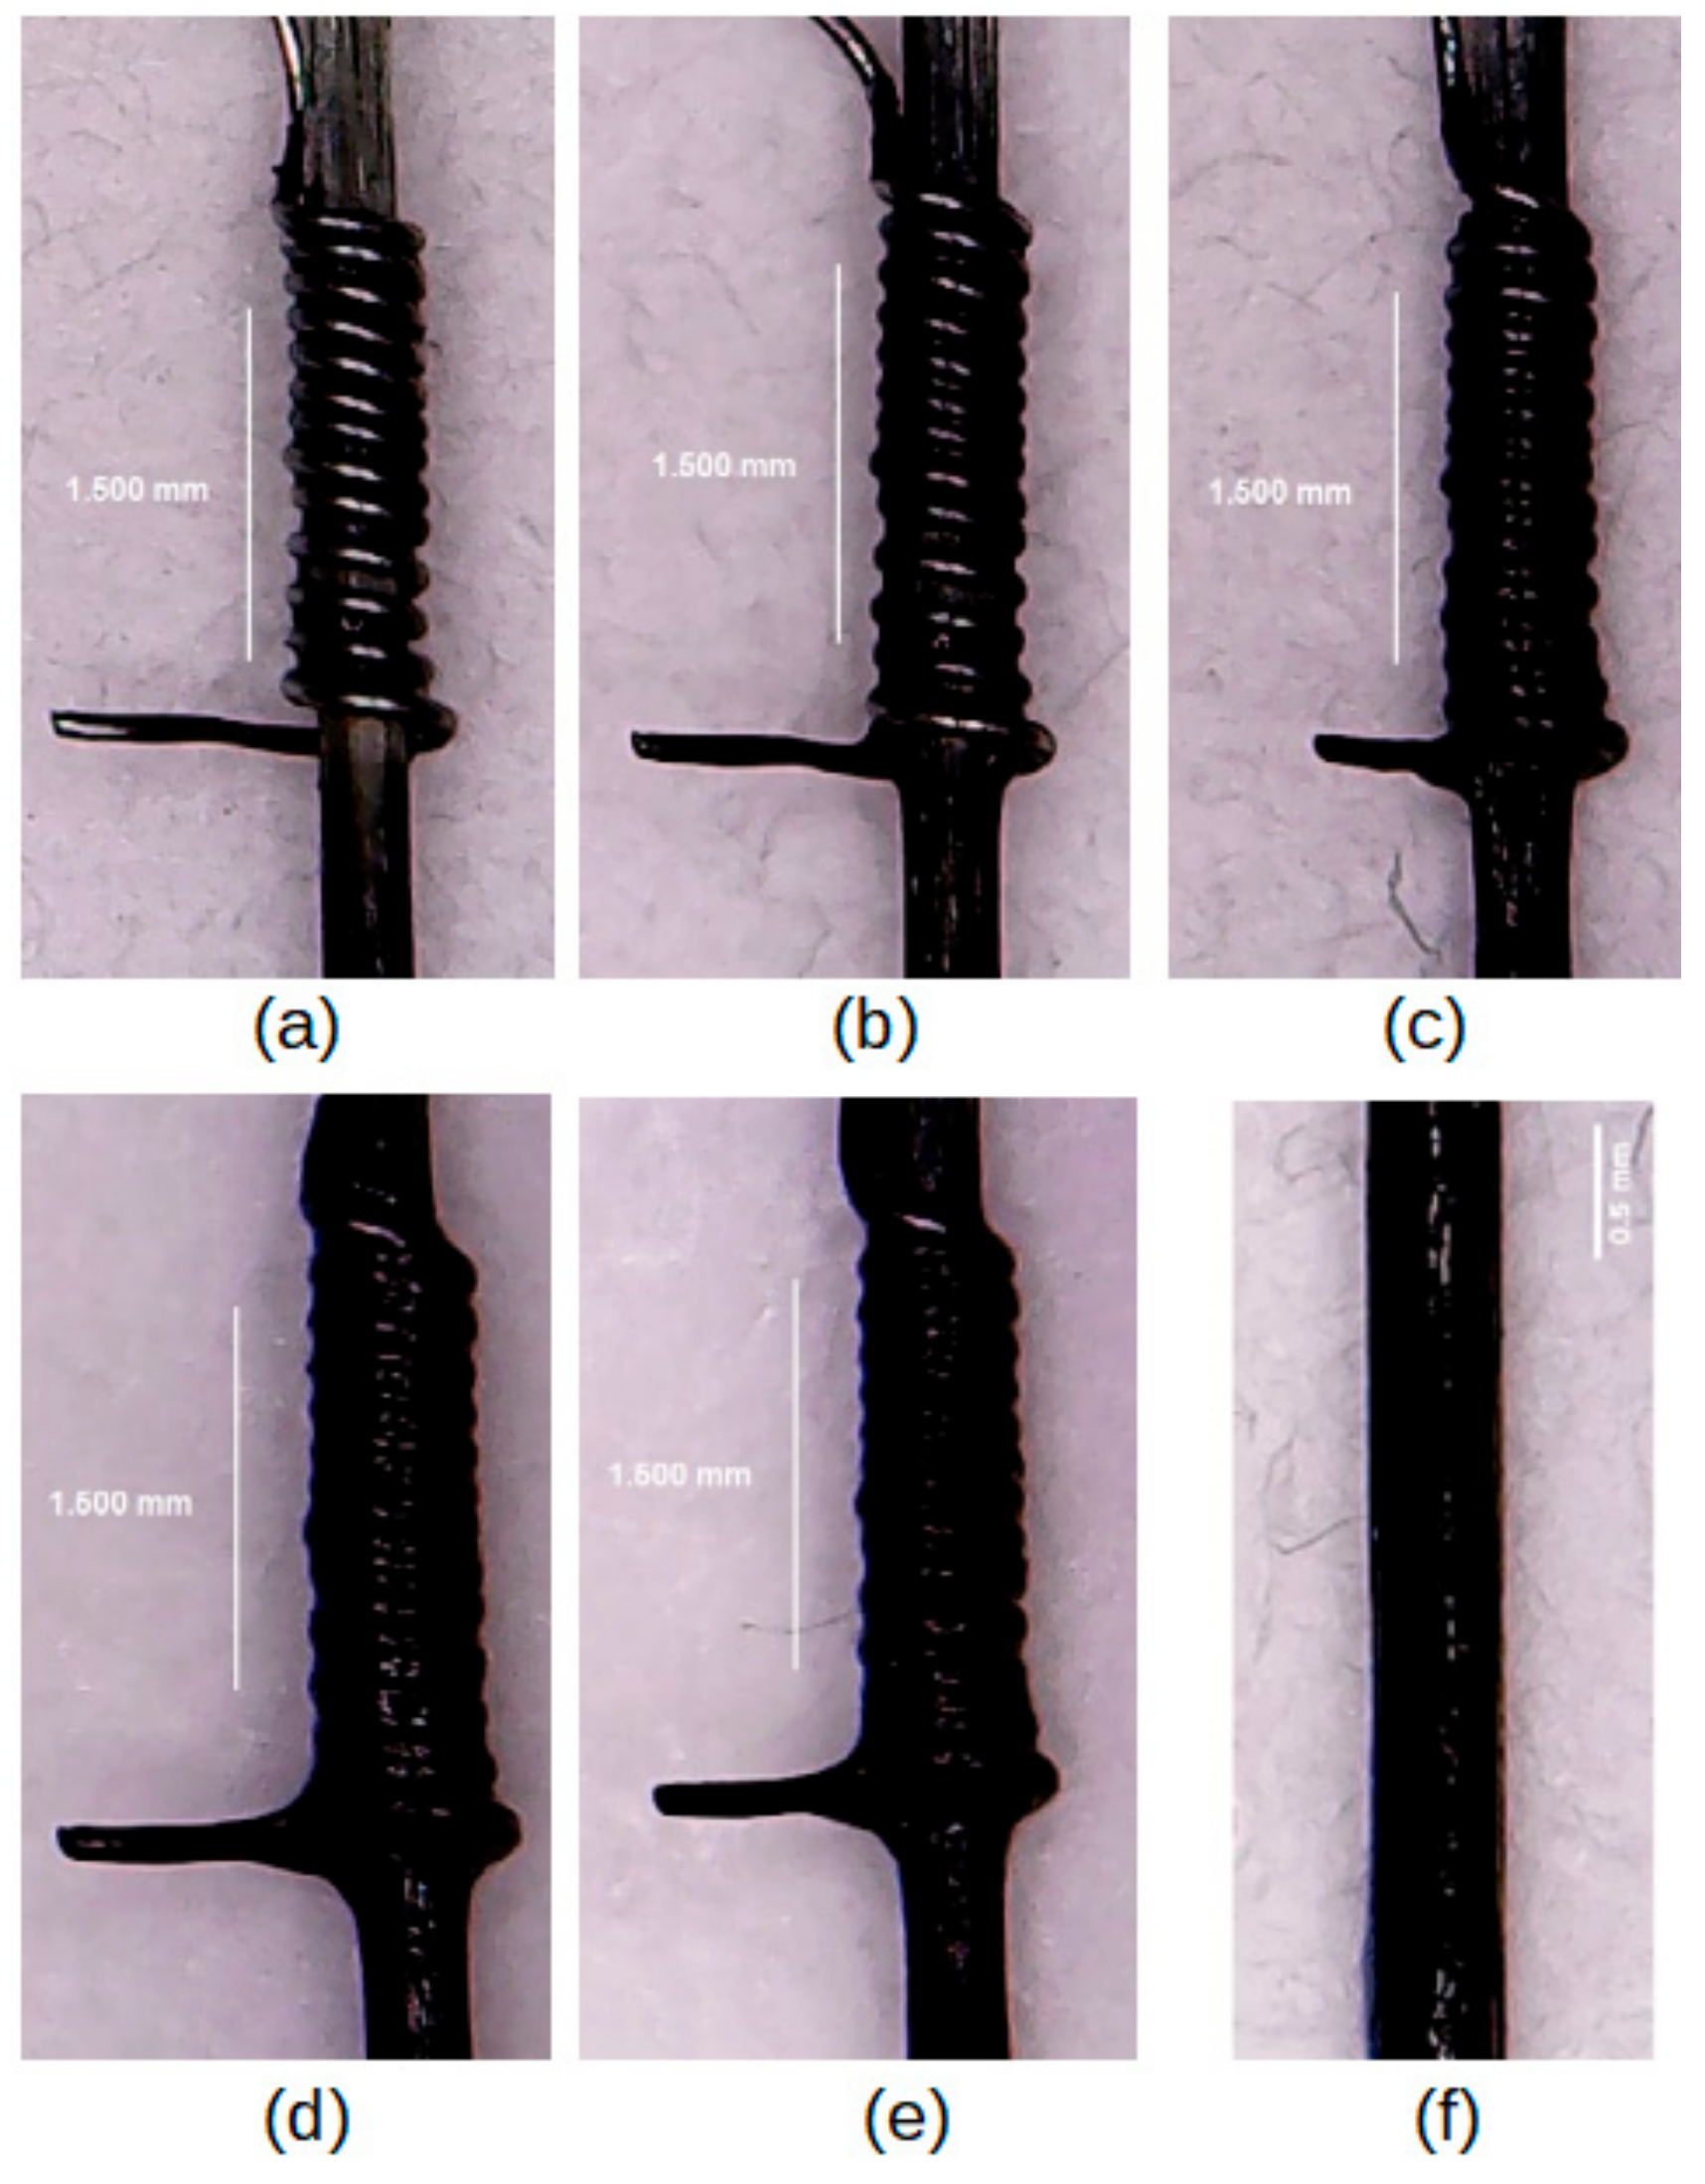
Visually, we obtained the images shown in Figure 7. According to Figure 7f, we can observe that with eight layers of CleviosTM F020 aqueous solution, a dark blue coating with a good surface coverage on its surface (no drop effect here, but sometimes this phenomenon can occur) was obtained. In Figure 7a–e, it can be observed that the greater the number of layers, the more the surface coverage was homogeneous and the more the space between the turns was filled by the CleviosTM F020 aqueous solution. The white line on Figure 7a–e represents 1.5 mm, and on Figure 7f, the white line length is 0.5 mm.
In Figure 7a, we can observe that the surface coverage was not homogeneous. This can be explained by the higher electric resistance value for one layer of piezoresistive coating (c.f. Section 3.1).
3.3. Mechanical Characterisation of the Piezoresistive Sensor Yarns
3.3.1. Evaluation of the Tensile Properties of the Subtract: The Virgin Twaron® Yarns
Before characterising the mechanical behaviour of sensor yarns, we needed to know the mechanical behaviour of the virgin Twaron® yarns with an added twist value of 25 twists/m. Twenty tensile tests were carried out, and the resulting mechanical properties are presented in Table 1.
According to the technical sheet, the elongation of our virgin Twaron® yarns was higher than the characteristics of the technical sheet (5.1% on average, instead of 3.5%). This difference could have been due to the additional twist that was added, as well as a possible slippage inside the clamping jaws. Still, through comparison with the elements of the technical sheet, we also note that the breaking strength was lower for the twisted yarn compared to the untwisted yarn (on average 200.4 instead of 225 N). This could also be caused by the additional twist to the yarn. Another explanation for this difference in properties between the data from the technical sheet and our tested yarns was that very often in spinning, between limited production (from which the data in the technical sheets very often come from) and the mass production, the yarn properties are different, usually lower.
3.3.2. Evaluation of the Tensile Properties at Each Stage, Allowing for the Realisation of Sensor Yarns
One of these solutions to measure locally the behaviour of a textile structure subjected to impact at high (or low) speed consists in integrating sensor yarns, having the mechanical behaviour close to the structural yarns (Virgin Twaron® yarns in this case).
In this part, we focus on the mechanical behaviour at each stage, allowing the realisation of the sensor, namely, on the sensor substrate (Virgin Twaron® yarns—VTY), when adding the pre-coating of PVA (PVA-TVY), then when adding the wrapped connections (CO-PVA-TVY), and finally when adding the three or eight piezoresistive coating layers (3-CF020-CO-PVA-TVY and 8-CF020-CO-PVA-TVY, respectively).
These steps are described in detail in Section 2.3.3 and Figure 1. For each step, the strength–strain graph (Figure 8) and box-plot figures in strength (Figure 9) and in strain (Figure 10) were plotted.
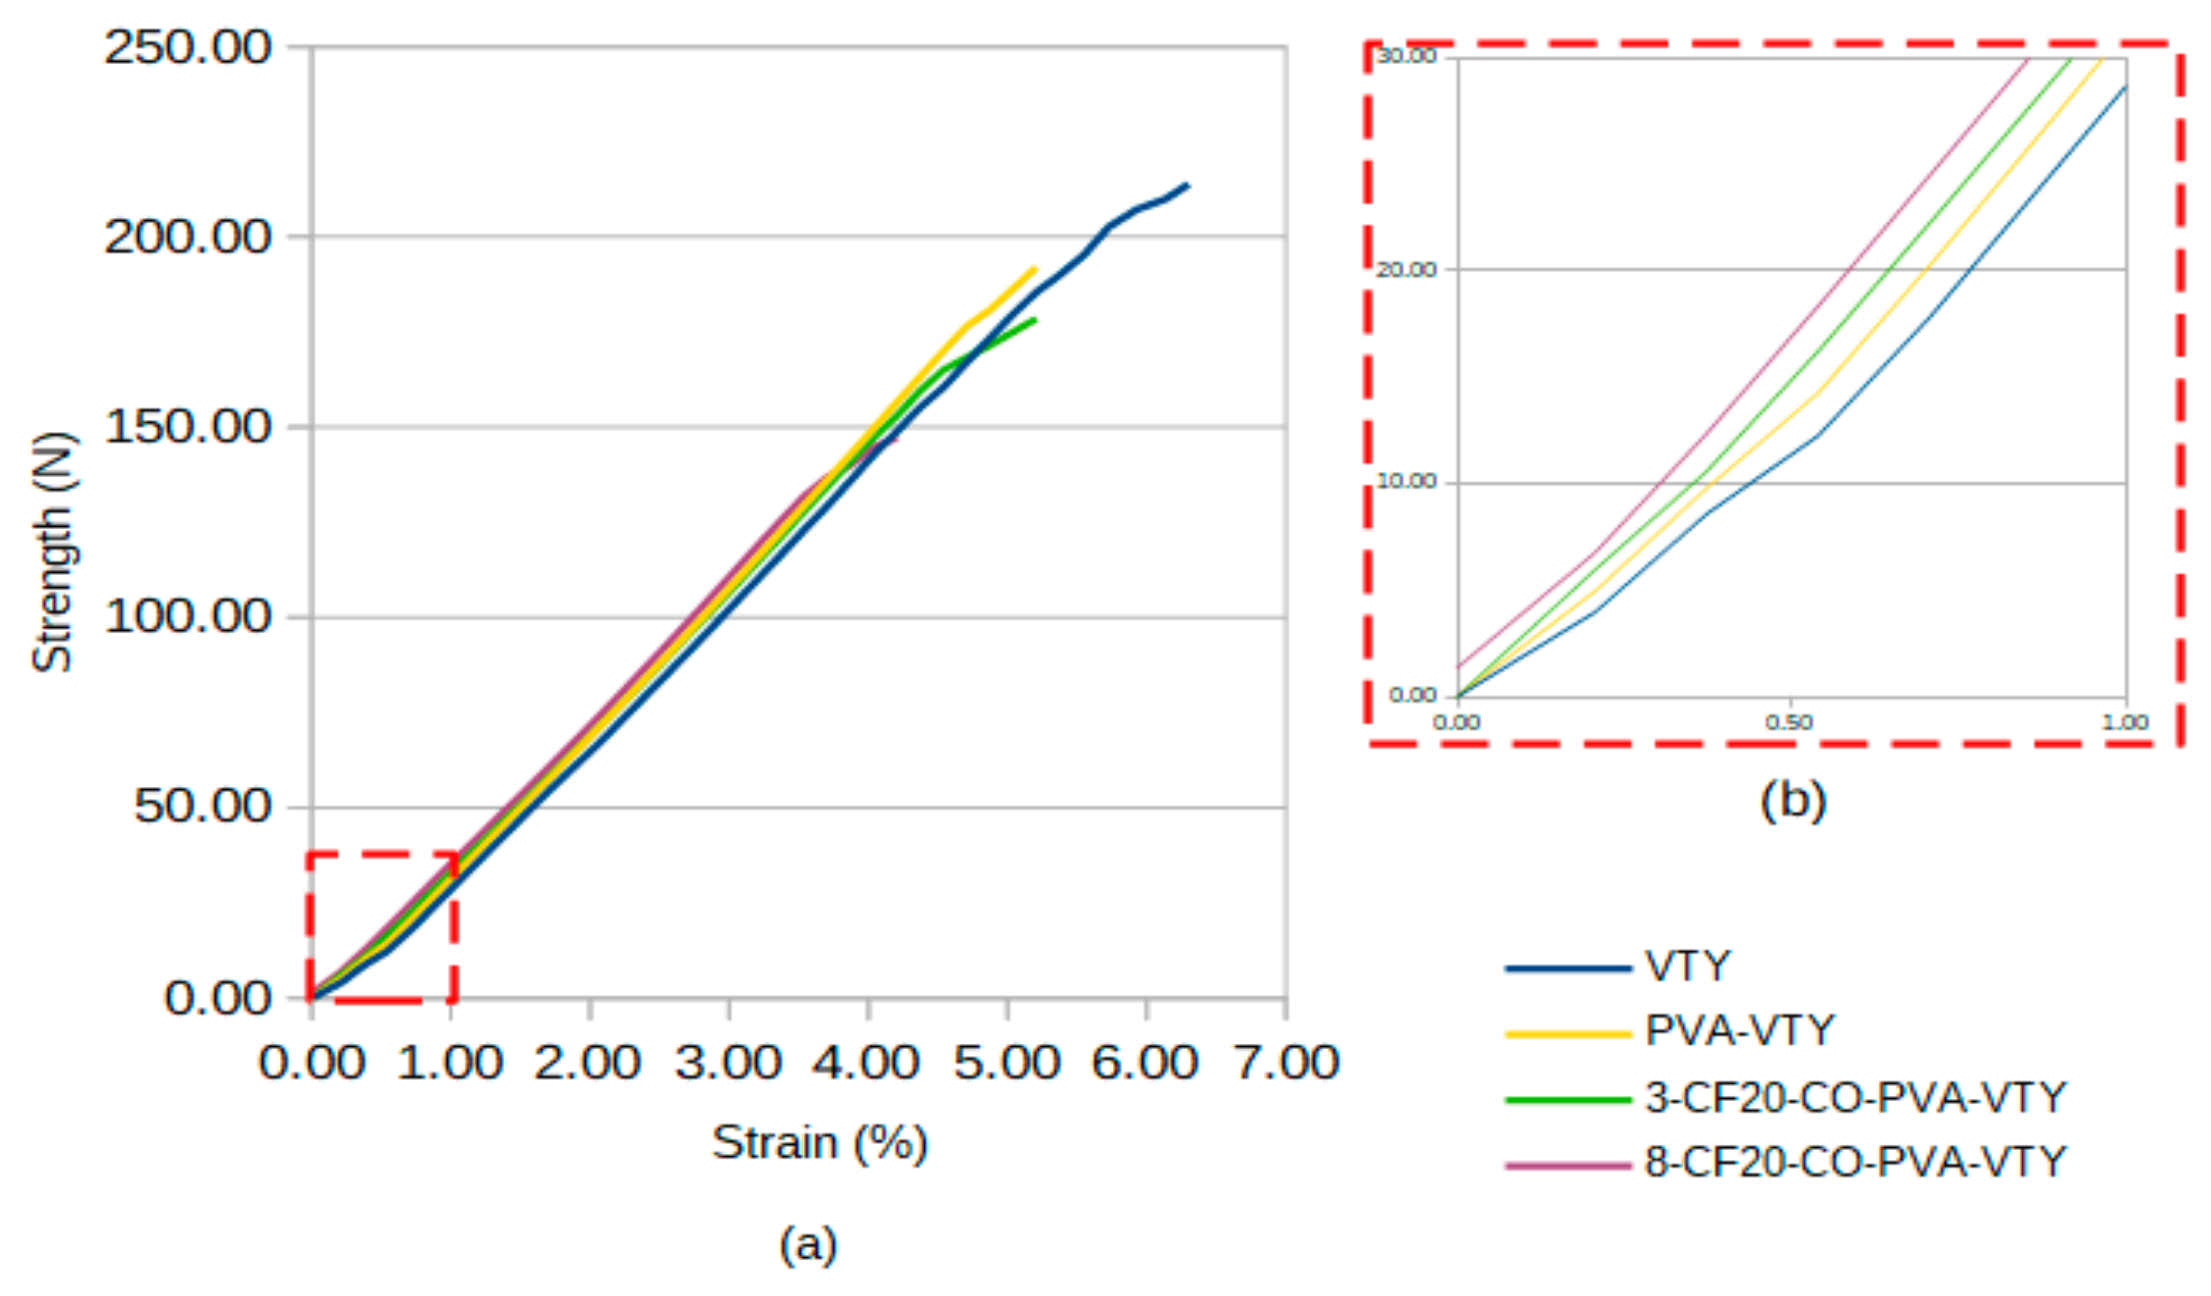
As can be seen in Figure 8a, no drastic change of the mechanical behaviour was observed after each step allowing the production of sensor yarns. The graph represents the tensile strength versus strain of the sensor yarns at different manufacturing steps until its completion with three and eight piezoresistive coatings (CleviosTM F020) layers. We observed that the curves for the different cases had a similar appearance. Each plotted curve corresponded to the average value of 10 samples subjected to tensile tests, the same ones that were used in Figure 9 and Figure 10.
In particular, if we focused our attention on the first percentage of deformation (Figure 8b), we observed that the yarn with PVA (PVA-VTY) was positioned above the virgin Twaron® yarn (VTY). Therefore, the PVA pre-coated stiffened the sensor yarns. Adding three layers of piezoresistive coating (3-CF020-CO-PVA-TVY) also increased the stiffness of the virgin Twaron® yarns, which was even more so in the case of eight layers of piezoresistive coating (8-CF020-CO-PVA-TVY). It can be assumed that the greater the thickness of the piezoresistive coating, the higher the stiffness of sensor yarns.
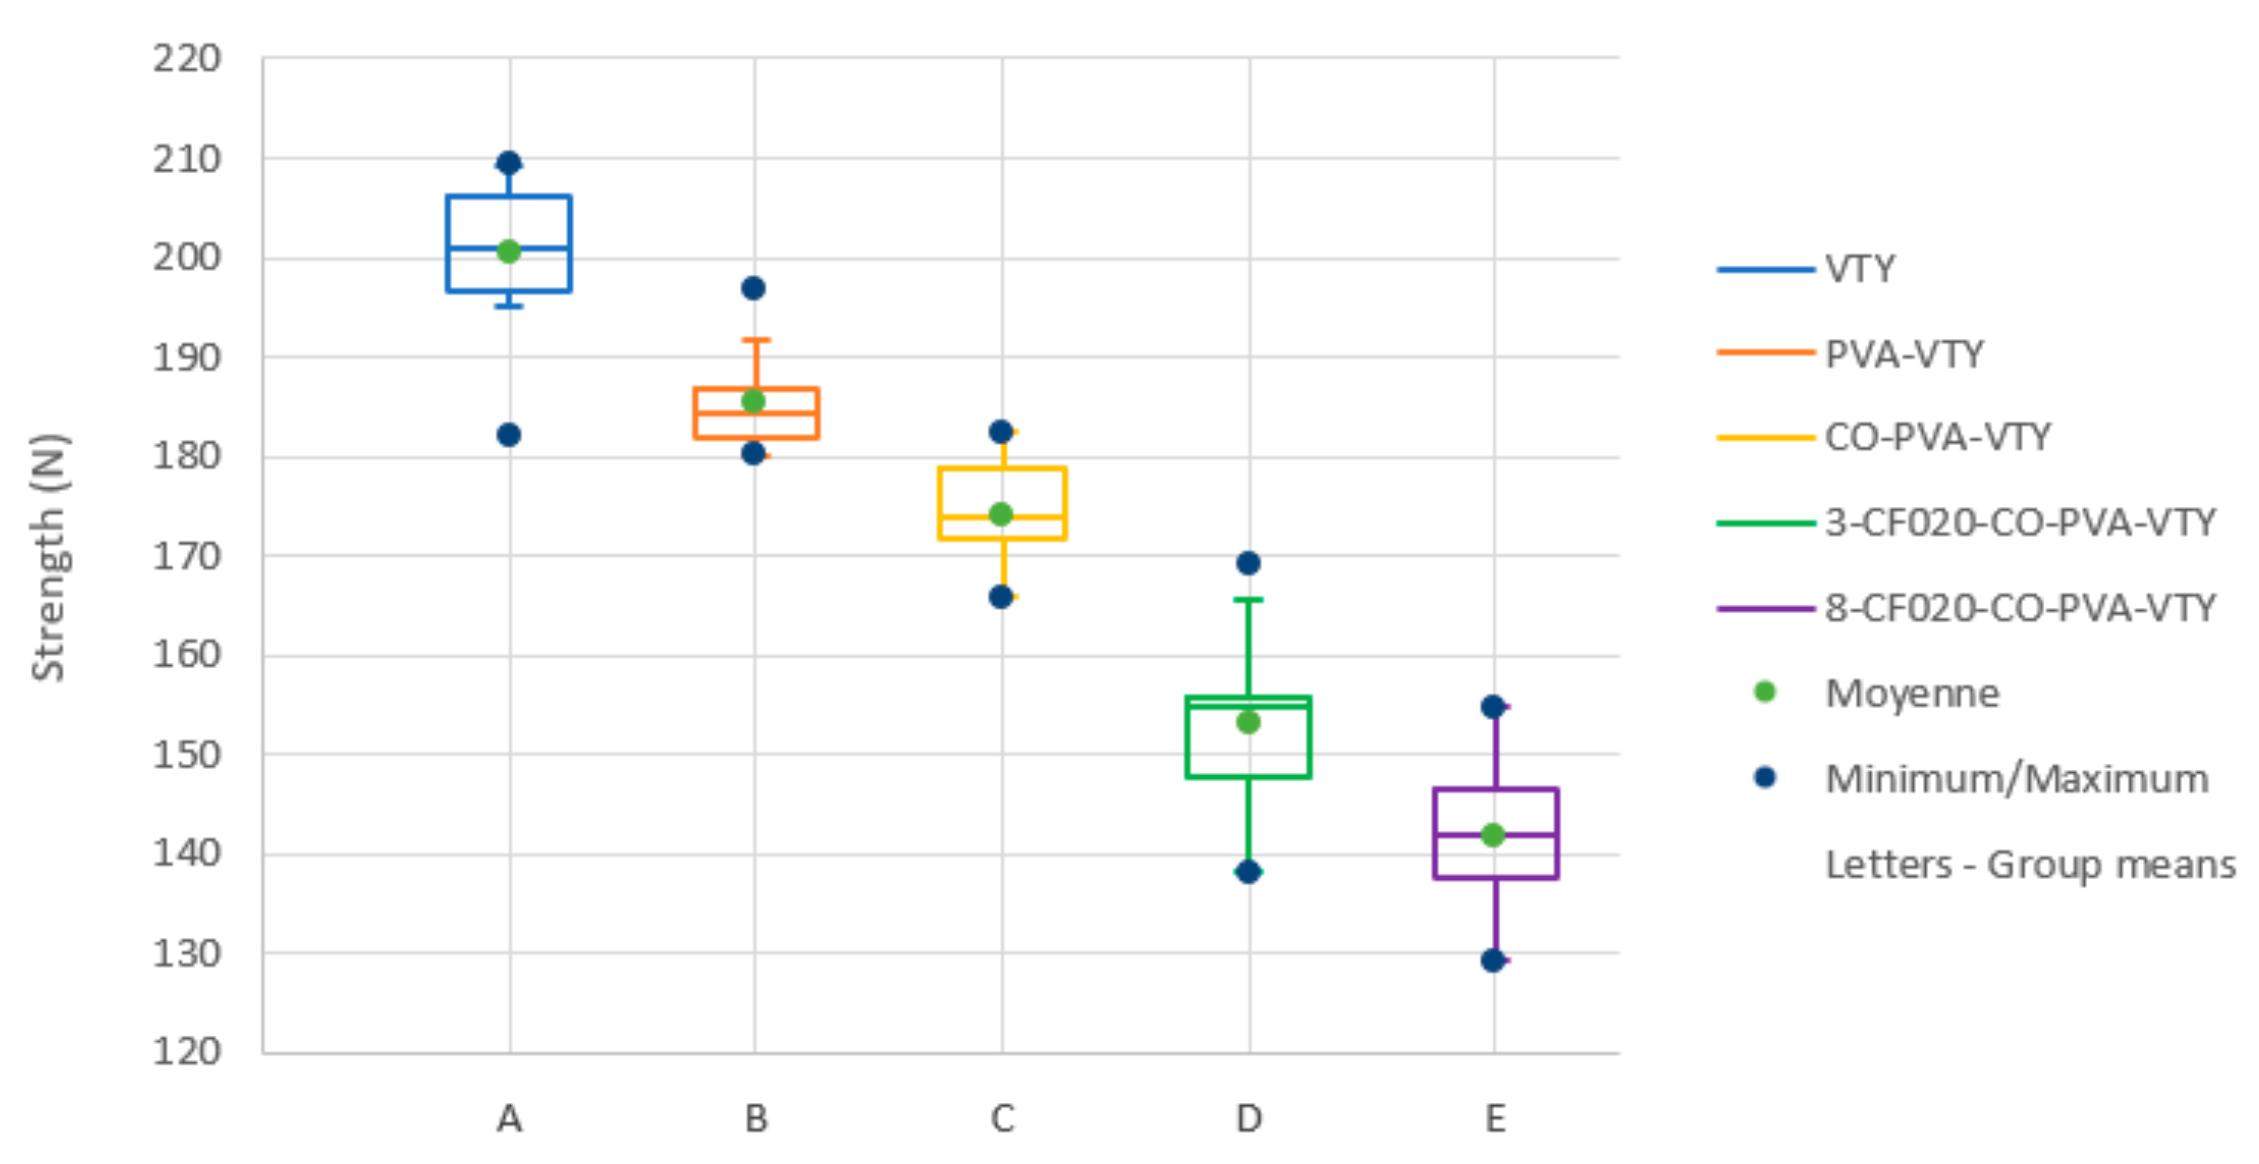
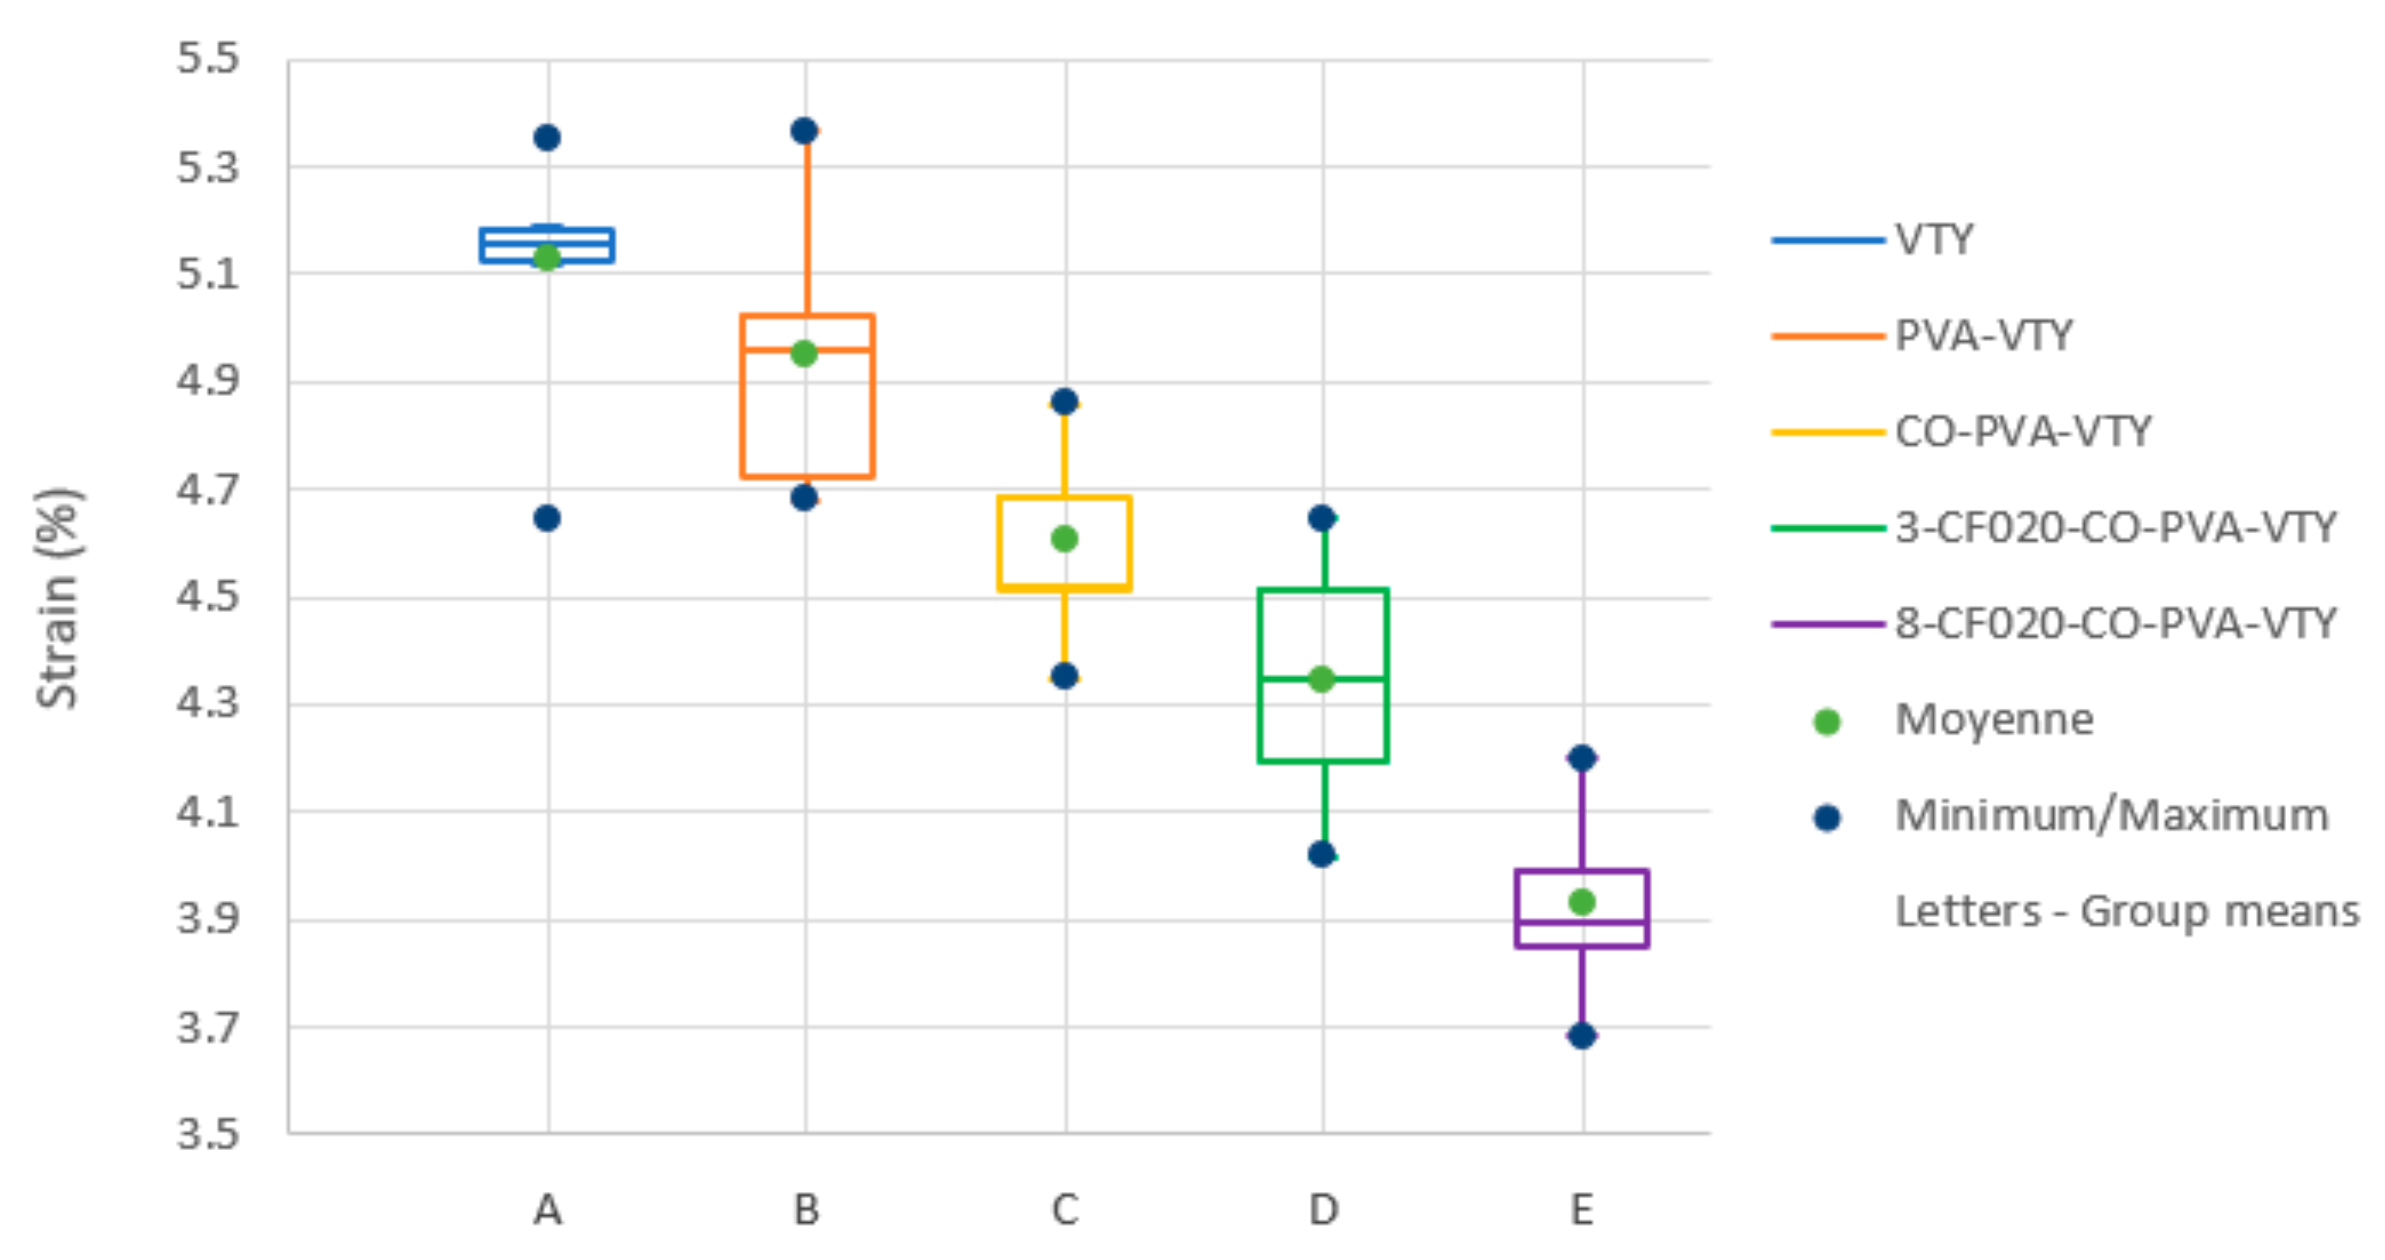
Then, if we focused our attention on the boxplot figures (Figure 9 and Figure 10), we observed a decrease of mechanical properties at each step allowing the production of sensor yarns. Although the measurement of VTY was somewhat dispersed, the different steps that permit the achievement of yarn sensors did not severely disperse mechanical values.
Moreover, one-way ANOVA was conducted to compare the effect of each step allowing the production of sensor yarns on the mechanical property (strength and strain). There was a significant effect of each step at the p < 0.05 level for the four modifications that were made on the substrate (Virgin Twaron® yarn twisted—VTY) in the case of strength (F(4,43) = 95.4, p < 0.0001) and for the case of strain (F(4,43) = 61.5, p < 0.0001). Post hoc comparisons using Fisher’s (LSD) test for strength and strain indicated that the mean score for each step allowing the production of sensor yarns was significantly different, as shown by letters A to E in Figure 9 and Figure 10, which are used to visualise the significant differences between group means obtained by Fisher’s test.
The decrease in mechanical properties between VTY and PVA-VTY can be explained by the fact that the addition of PVA pre-coating on the virgin Twaron® yarn locally stiffened the yarn. As a result, the elongation of the filaments (of yarn) was reduced due to its embedding into the PVA coating. Consequently, a less consistent strength was necessary to break the yarn because the elongation at break was reached more quickly. Then, when the wrapped connections (CO-PVA-VTY) on Twaron® yarn with PVA pre-coating (PVA-VTY) were added, this one tended towards a second decrease in mechanical properties. We can explain this drop in mechanical properties by the addition of connectors that can be responsible locally for a stress concentration on the PVA pre-coating yarns (where they are positioned), and therefore can cause premature breakage of the yarn. Finally, the application and the number of piezoresistive coating layers decreased the mechanical properties. This decrease can be physically explained. On one hand, the addition of the piezoresistive coating material onto the PVA pre-coating Twaron® yarns led to higher local rigidity. As a result, the connectors had a better grip with the pre-coating yarns, therefore leading to more stress concentration. On the other hand, for the series of sensor yarns with eight layers of piezoresistive coating, the wrapped connections could be tighter than usual around the pre-coating Twaron® yarns, causing even more important stress concentration. This may have been possible because the wrapped connections were handmade. Therefore, the reproducibility of the sensor yarn manufacturing remains something relatively complex.
Although there was a decrease of mechanical properties at each step allowing the production of sensor yarns, these did not result in a drastic change in the mechanical behaviour of Twaron® yarn, as can be seen in Figure 8a. Indeed, yarn sensors integrated into a woven structure should behave almost similar to the other yarn of the fabric except that this latter will give way a slight amount before leaving change in strength and elongation at break.
3.4. Electromechanical Characterisation of the Piezoresistive Sensor Yarns
Results of the electrical response of piezoresistive sensor yarns for the configurations of three and eight piezoresistive coating layers are shown in Table 2 and Table 3. For each configuration, six and five samples, respectively, were tested.
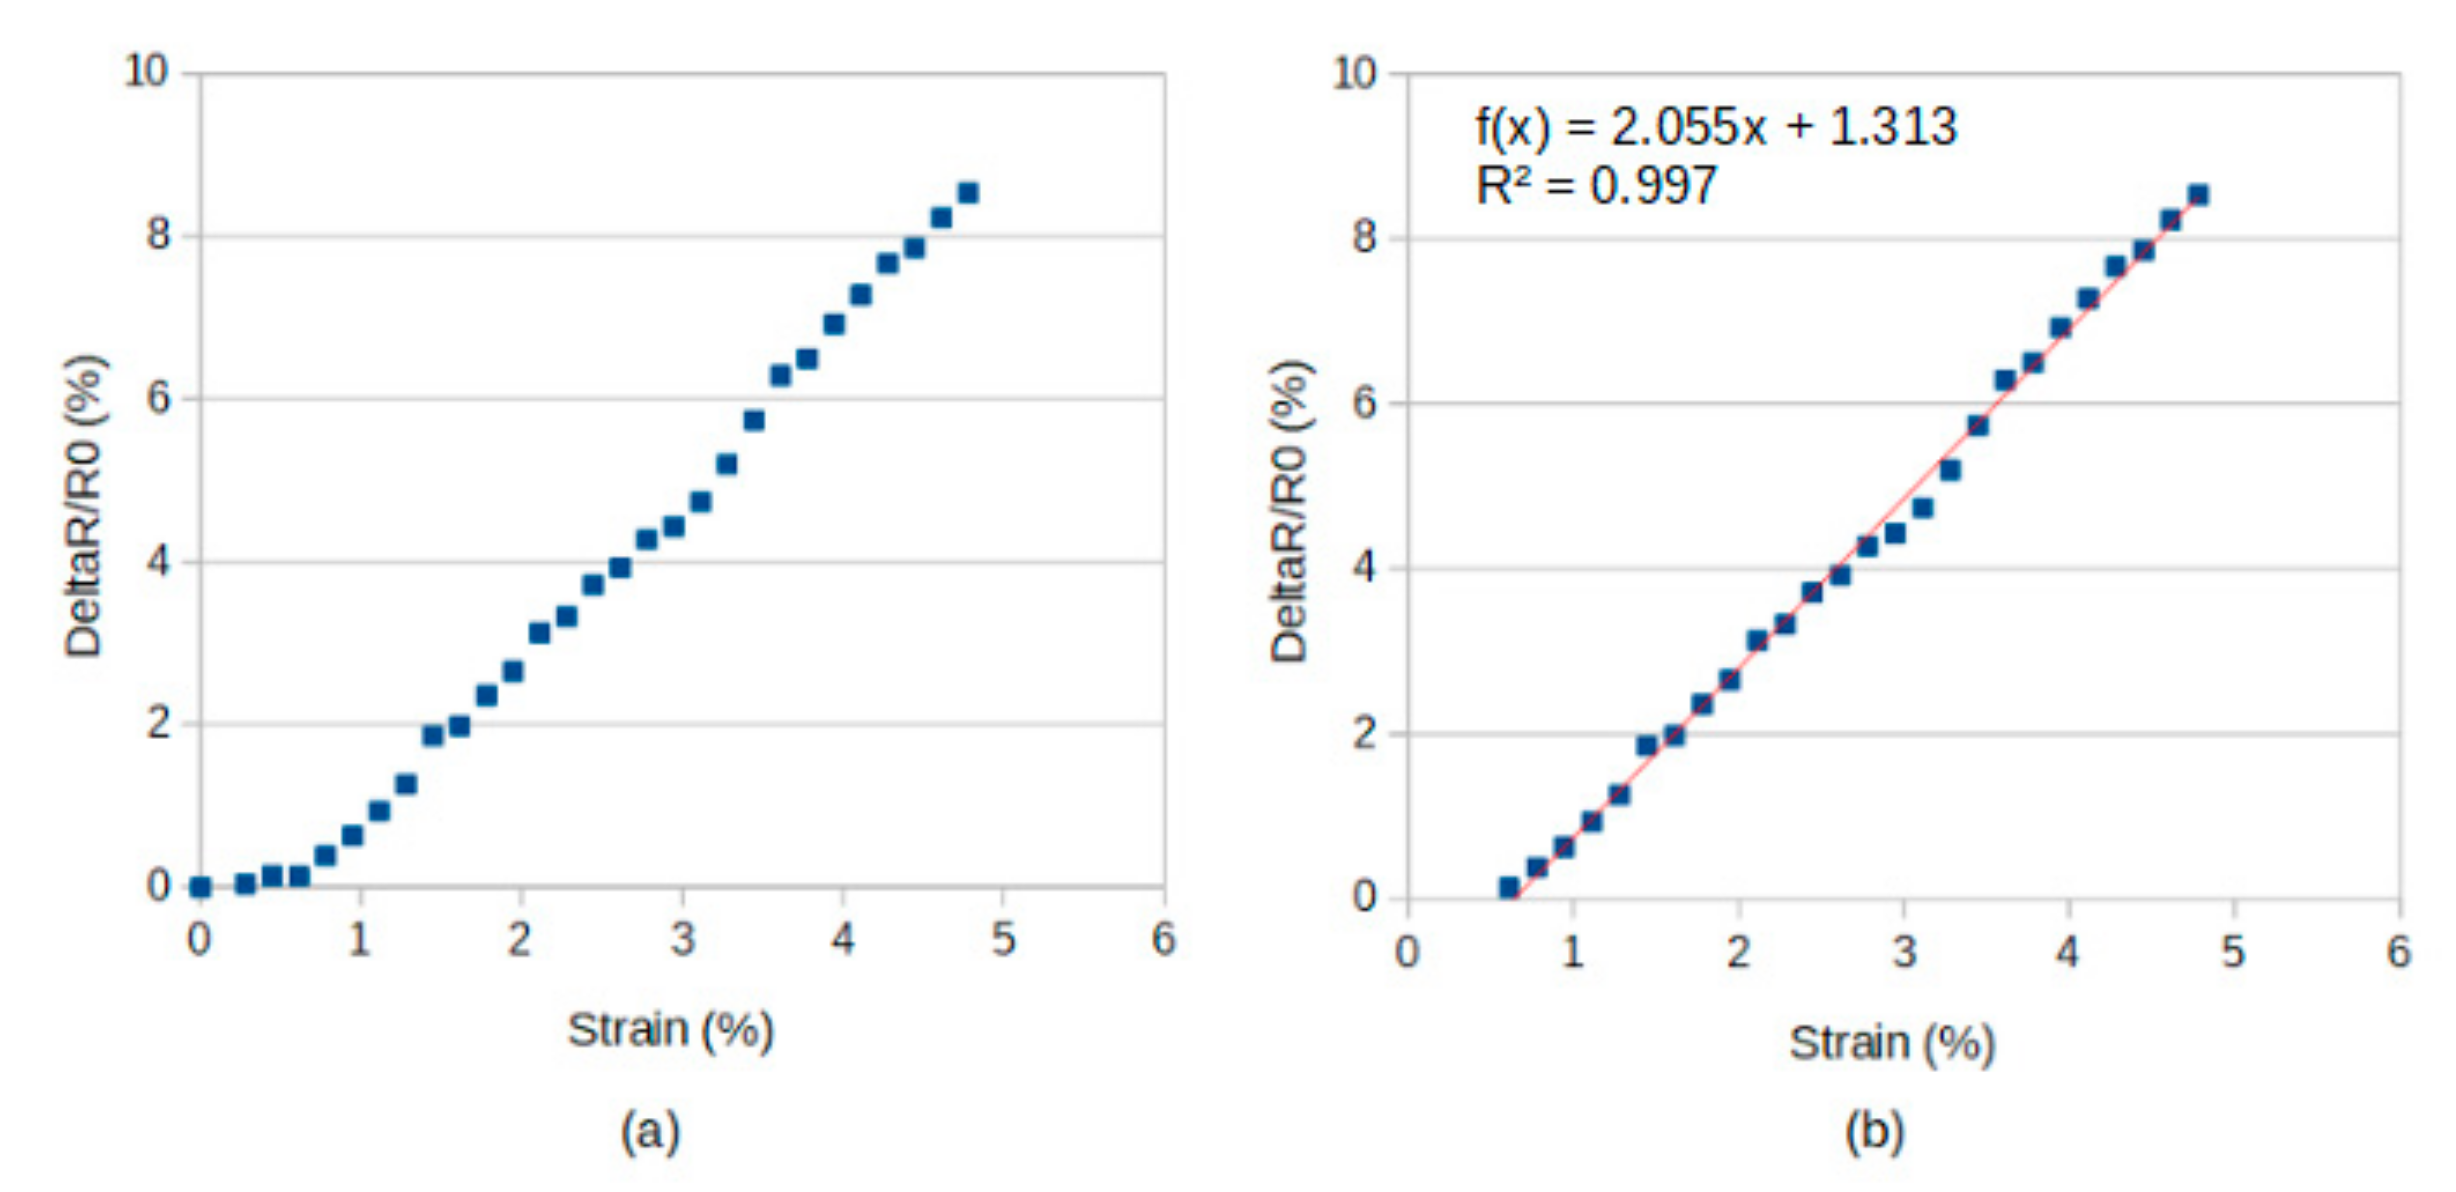
However, prior to Table 2, the evolution of the resistance (ΔR⁄R0) of the sensor yarn versus the strain (ε) is plotted in Figure 11a. Only one curve was plotted for the configuration with three piezoresistive coating layers to better visualise the shape of the curve. For the configuration with three piezoresistive coating layers, the same shape of the curve is observed.
In Figure 11b, we observe an elongation of the sensor yarn in the first time where the electrical response of the piezoresistive coating did not change and remained at zero. Beyond a certain threshold of elongation (0.69%), the electrical response—i.e., evolution of the resistance—became proportional to the elongation of the sensor yarn.
When we compare the two configurations of sensor yarn (with three and eight piezoresistive coating layers) in Table 2 and Table 3, we find that the number of layers was not mainly influential because we focused on average initial strengths (respectively R0 = 1.58 ± 0.36 and 1.01 ± 0.39 kΩ), variations in average resistance (Δ R/R0 = 10.38 ± 2.71 and 6.75 ± 3.26%), and mean gauge factors (K = 2.32 ± 0.46 and 2.04 ± 0.75) of the same order of magnitude. We can, however, note a slight decrease in the evolution of the resistance (ΔR/R0) and K, but in the two cases, we observed an overlap of standard deviation. Concerning the instance of elongation (or strain) beginning a linear relation with ΔR/R0, it was close (0.65 and 0.68% in means, respectively). Nevertheless, we note that the average elongation at break was more important in the configuration with three piezoresistive coating layers than that with eight layers.
Physically, the decrease of ΔR/R0 can be explained by the stiffer sensor zone (by adding five layers of Clevios F020), which contributed to a reduction of elongation at break (Figure 11) and involved a restriction of the evolution of the electrical resistance. This also can explain the decreasing of the gauge factor value k in the configuration with eight piezoresistive coating layers compared to the configuration with three layers. We can notice that the gauge factor in the two configurations was close to the metallic gauges sold on the market, as well as the values obtained by Trifigny and al. [17].
4. Conclusions
This paper focused on the realisation of piezoresistive sensors made from the same structural yarns of the fabric. Different parameters of the manufacturing process were investigated to obtain a sensor able to measure local deformation into fabric structure in quasi static mode. Thus, taking into account the physical (thickness), mechanical, and electrical properties, we found that a sensor yarn composed of three layers of CLEVIOS F020 seems to be optimal. The average gauge factor value (K = 2.06) was comparable with that found in studies on similar sensing materials [24] or on textile substrate [25]. The general properties of the piezo-resistive sensor yarn will allow its development into a fabric for in situ deformation measurements.
In future works, we will implement several sensor yarns into a fabric to monitor multi-impact behaviour as well as sensing dynamic deformation thanks to sensor yarns distributed into different locations. To improve the global knowledge on these sensors yarns, we will perform multicycle load at different strain rates.
Author Contributions
Conceptualisation, C.C.; methodology, F.B., C.C., and B.B.-M.; validation, F.B. and C.C.; investigation, B.B.-M.; writing—original draft preparation, B.B.-M.; writing—review and editing, B.B.-M., C.C., and F.B.; supervision, F.B. and C.C.; project administration, F.B. All authors have read and agreed to the published version of the manuscript.
Funding
This research received no external funding.
Institutional Review Board Statement
Not applicable.
Informed Consent Statement
Not applicable.
Data Availability Statement
The data presented in this study are available on request from the corresponding author.
Acknowledgments
We acknowledge GEMTEX Laboratory for financial support.
Conflicts of Interest
The authors declare no conflict of interest.
References
- Ha-Minh, C.; Imad, A.; Boussu, F.; Kanit, T. On analytical modelling to predict of the ballistic impact behaviour of textile multi-layer woven fabric. Compos. Struct. 2013, 99, 462–476. [Google Scholar] [CrossRef]
- Abtew, M.A.; Boussu, F.; Bruniaux, P.; Loghin, C.; Cristian, I. Ballistic impact mechanisms—A review on textiles and fibre-reinforced composites impact responses. Compos. Struct. 2019, 223, 110966. [Google Scholar] [CrossRef]
- Abtew, M.A.; Boussu, F.; Bruniaux, P.; Loghin, C.; Cristian, I. Engineering of 3D warp interlock p-aramid fabric structure and its energy absorption capabilities against ballistic impact for body armour applications. Compos. Struct. 2019, 225, 111179. [Google Scholar] [CrossRef]
- Abtew, M.A.; Boussu, F.; Bruniaux, P.; Loghin, C.; Cristian, I.; Chen, Y.; Wang, L. Ballistic impact performance and surface failure mechanisms of two-dimensional and three-dimensional woven p-aramid multi-layer fabrics for lightweight women ballistic vest applications. J. Ind. Text. 2021, 50, 1351–1383. [Google Scholar] [CrossRef]
- Abtew, M.A.; Boussu, F.; Bruniaux, P.; Loghin, C.; Cristian, I.; Chen, Y.; Wang, L. Influences of fabric density on mechanical and moulding behaviours of 3D warp interlock para-aramid fabrics for soft body armour application. Compos. Struct. 2018, 204, 402–418. [Google Scholar] [CrossRef]
- Ha-Minh, C.; Imad, A.; Kanit, T.; Boussu, F. Numerical analysis of a ballistic impact on textile fabric. Int. J. Mech. Sci. 2013, 69, 32–39. [Google Scholar] [CrossRef]
- Ha-Minh, C.; Imad, A.; Boussu, F.; Kanit, T. Experimental and numerical investigation of a 3D woven fabric subjected to a ballistic impact. Int. J. Impact Eng. 2016, 88, 91–101. [Google Scholar] [CrossRef]
- Chevalier, C.; Kerisit, C.; Klavzar, A.; Boussu, F.; Coutellier, D. Measurements of dynamic properties of ballistic yarns using innovative testing devices. In Advanced Fibrous Composite Materials for Ballistic Protection; Elsevier: Amsterdam, The Netherlands, 2016; pp. 199–215. [Google Scholar]
- Chevalier, C.; Kerisit, C.; Boussu, F.; Coutellier, D.; Faderl, N.; Klavzar, A. A new experimental setup to characterize the dynamic mechanical behaviour of ballistic yarns. Meas. Sci. Technol. 2016, 27, 105902. [Google Scholar] [CrossRef]
- Dufour, C.; Boussu, F.; Wang, P.; Soulat, D. Local strain measurements of yarns inside of 3D warp interlock fabric during forming process. Int. J. Mater. Form. 2018, 11, 775–788. [Google Scholar] [CrossRef]
- Trifigny, N.; Kelly, F.; Cochrane, C.; Boussu, F.; Koncar, V.; Soulat, D. PEDOT:PSS-Based Piezo-Resistive Sensors Applied to Reinforcement Glass Fibres for in Situ Measurement during the Composite Material Weaving Process. Sensors 2013, 13, 10749–10764. [Google Scholar] [CrossRef] [PubMed]
- Boussu, F.; Trifigny, N.; Cochrane, C.; Koncar, V. Fibrous sensors to help the monitoring of weaving process. In Smart Textiles and Their Applications; Elsevier: Amsterdam, The Netherlands, 2016; pp. 375–400. [Google Scholar]
- Rausch, J.; Mäder, E. Health monitoring in continuous glass fibre reinforced thermoplastics: Manufacturing and application of interphase sensors based on carbon nanotubes. Compos. Sci. Technol. 2010, 70, 1589–1596. [Google Scholar] [CrossRef] [Green Version]
- Rausch, J.; Mäder, E. Health monitoring in continuous glass fibre reinforced thermoplastics: Tailored sensitivity and cyclic loading of CNT-based interphase sensors. Compos. Sci. Technol. 2010, 70, 2023–2030. [Google Scholar] [CrossRef] [Green Version]
- Nauman, S.; Lapeyronnie, P.; Cristian, I.; Boussu, F.; Koncar, V. Online Measurement of Structural Deformations in Composites. IEEE Sens. J. 2011, 11, 1329–1336. [Google Scholar] [CrossRef]
- Jerkovic, I.; Grancaric, A.M.; Koncar, V. Structural Health Monitoring of Composites with Newly Developed Textile Sensors In Situ. IOP Conf. Ser. Mater. Sci. Eng. 2018, 460, 012046. [Google Scholar] [CrossRef]
- Trifigny, N. Mesure In Situ Et Connaissance Des Phénomènes Mécaniques Au Sein d’Une Structure Tissée Multicouches. Ph.D. Thesis, Université de Lille, Lille, France, 2013. [Google Scholar]
- Zhao, Z.; Yan, C.; Liu, Z.; Fu, X.; Peng, L.-M.; Hu, Y.; Zheng, Z. Machine-Washable Textile Triboelectric Nanogenerators for Effective Human Respiratory Monitoring through Loom Weaving of Metallic Yarns. Adv. Mater. 2016, 28, 10267–10274. [Google Scholar] [CrossRef] [PubMed]
- Hu, L.; Pasta, M.; La Mantia, F.; Cui, L.; Jeong, S.; Deshazer, H.D.; Choi, J.W.; Han, S.M.; Cui, Y. Stretchable, Porous, and Conductive Energy Textiles. Nano Lett. 2010, 10, 708–714. [Google Scholar] [CrossRef] [PubMed] [Green Version]
- Shim, B.S.; Chen, W.; Doty, C.; Xu, C.; Kotov, N.A. Smart Electronic Yarns and Wearable Fabrics for Human Biomonitoring made by Carbon Nanotube Coating with Polyelectrolytes. Nano Lett. 2008, 8, 4151–4157. [Google Scholar] [CrossRef] [PubMed]
- Bashir, T.; Skrifvars, M.; Persson, N.-K. Synthesis of high performance, conductive PEDOT-coated polyester yarns by OCVD technique. Polym. Adv. Technol. 2012, 23, 611–617. [Google Scholar] [CrossRef]
- Neves, A.I.S.; Bointon, T.H.; Melo, L.V.; Russo, S.; de Schrijver, I.; Craciun, M.F.; Alves, H. Transparent conductive graphene textile fibers. Sci. Rep. 2015, 5, 9866. [Google Scholar] [CrossRef] [Green Version]
- Åkerfeldt, M.; Strååt, M.; Walkenström, P. Influence of coating parameters on textile and electrical properties of a poly(3,4-ethylene dioxythiophene):poly(styrene sulfonate)/polyurethane-coated textile. Text. Res. J. 2013, 83, 2164–2176. [Google Scholar] [CrossRef]
- Correia, V.; Caparros, C.; Casellas, C.; Francesch, L.; Rocha, J.G.; Lanceros-Mendez, S. Development of inkjet printed strain sensors. Smart Mater. Struct. 2013, 22, 105028. [Google Scholar] [CrossRef]
- Eom, J.; Jaisutti, R.; Lee, H.; Lee, W.; Heo, J.-S.; Lee, J.-Y.; Park, S.K.; Kim, Y.-H. Highly Sensitive Textile Strain Sensors and Wireless User-Interface Devices Using All-Polymeric Conducting Fibers. ACS Appl. Mater. Interfaces 2017, 9, 10190–10197. [Google Scholar] [CrossRef] [PubMed]
Figure 1.
Different steps allowing for the realisation of piezoresistive sensor yarns: profile views (on the left) and frontal views (on the right).
Figure 1.
Different steps allowing for the realisation of piezoresistive sensor yarns: profile views (on the left) and frontal views (on the right).

Figure 2.
Diagram of sensor yarn with a focus on the wrapped connection.

Figure 3.
Diagram of the resistance measurement of sensor yarn with an ohmmeter using alligator clips.
Figure 3.
Diagram of the resistance measurement of sensor yarn with an ohmmeter using alligator clips.

Figure 4.
Diagram of the voltage divider (a) and the correspondence between the electrical resistance R2 and the sensor zone of the sensor yarn (b).
Figure 4.
Diagram of the voltage divider (a) and the correspondence between the electrical resistance R2 and the sensor zone of the sensor yarn (b).

Figure 5.
Basic graph representing the electrical resistance (log scale) of sensor yarn depending on the number of layers of CleviosTM F020 (CF020) coating.
Figure 5.
Basic graph representing the electrical resistance (log scale) of sensor yarn depending on the number of layers of CleviosTM F020 (CF020) coating.

Figure 6.
Basic graph representing the apparent diameter of sensor yarn depending on the number of layers of CleviosTM F020 (CF020) coating.
Figure 6.
Basic graph representing the apparent diameter of sensor yarn depending on the number of layers of CleviosTM F020 (CF020) coating.

Figure 7.
Pictures of connector for 1 (a), 2 (b), 4 (c), 6 (d), and 8 (e) layers of CleviosTM F020 and sensor zone located between two connectors with 8 layers of CleviosTM F020 (f) obtained by using optical microscope.
Figure 7.
Pictures of connector for 1 (a), 2 (b), 4 (c), 6 (d), and 8 (e) layers of CleviosTM F020 and sensor zone located between two connectors with 8 layers of CleviosTM F020 (f) obtained by using optical microscope.

Figure 8.
Line chart representing the strength as a function of the strain for each step allowing the realisation of sensor yarns (a) with a zoom on the first percentage of deformation (b).
Figure 8.
Line chart representing the strength as a function of the strain for each step allowing the realisation of sensor yarns (a) with a zoom on the first percentage of deformation (b).

Figure 9.
Box-plots of strength for each step allowing the realisation of sensor yarns. Letters A, B, C, D, and E on box-plot diagrams are the result of ANOVA analyses (Fisher’s test). NB: sample with different letters are scientifically different.
Figure 9.
Box-plots of strength for each step allowing the realisation of sensor yarns. Letters A, B, C, D, and E on box-plot diagrams are the result of ANOVA analyses (Fisher’s test). NB: sample with different letters are scientifically different.

Figure 10.
Box-plots of strain for each step allowing the realisation of sensor yarns. Letters A, B, C, D, and E on box-plots diagrams are the result of ANOVA analyses (Fisher’s test). NB: sample with different letters are scientifically different.
Figure 10.
Box-plots of strain for each step allowing the realisation of sensor yarns. Letters A, B, C, D, and E on box-plots diagrams are the result of ANOVA analyses (Fisher’s test). NB: sample with different letters are scientifically different.

Figure 11.
The curve representing the evolution of the resistance as a function of strain for a sensor yarn with 3 layers of piezoresistive coating (a) and a focus on the linear part of the curve from 0.61 to 4.78% of strain (linear regression in red), with a gauge factor K = 2.06 (b).
Figure 11.
The curve representing the evolution of the resistance as a function of strain for a sensor yarn with 3 layers of piezoresistive coating (a) and a focus on the linear part of the curve from 0.61 to 4.78% of strain (linear regression in red), with a gauge factor K = 2.06 (b).


Table 1.
Mechanical properties of Virgin Twaron® yarns (from the data sheet) and Virgin Twaron® yarns twisted (experimental value).
Table 1.
Mechanical properties of Virgin Twaron® yarns (from the data sheet) and Virgin Twaron® yarns twisted (experimental value).
| Virgin Twaron® Yarns | Breaking Strength (N) | Elongation (%) |
|---|---|---|
| Untwisted yarn | 225.0 | 3.5 |
| Twisted yarn (25 twists/m) | 200.4 (± 5.13) | 5.1 (± 0.41) |
Table 2.
Statistical results of the electromechanical behaviour of sensor yarns with 3 layers of piezoresistive coating.
Table 2.
Statistical results of the electromechanical behaviour of sensor yarns with 3 layers of piezoresistive coating.
| Initial Resistance R0-(KΩ) | ΔR/R0 (%) | Gauge Factor K-(-) | Coefficient of Determination-R2 (-) | Zone of Linearity Concerning the Elongation at Break (%) | |
|---|---|---|---|---|---|
| Mean value | 1.58 | 10.38 | 2.32 | 0.988 | 0.65–4.71 |
| Standard deviation | 0.36 | 2.71 | 0.46 | 0.01 | 0.53/0.31 |
| CV% | 22.78 | 26.11 | 19.83 | 1.22 | 81.58–6.64 |
| Median | 1.54 | 10.15 | 2.31 | 0.991 | 0.57–4.61 |
Table 3.
Statistical results of the electromechanical behaviour of sensor yarns with 8 layers of piezoresistive coating.
Table 3.
Statistical results of the electromechanical behaviour of sensor yarns with 8 layers of piezoresistive coating.
| Initial Resistance R0-(KΩ) | ΔR/R0 (%) | Gauge Factor K-(-) | Coefficient of Determination-R2 (-) | Zone of Linearity Concerning the Elongation at Break (%) | |
|---|---|---|---|---|---|
| Mean value | 1.01 | 6.75 | 2.04 | 0.970 | 0.68–4.01 |
| Standard deviation | 0.39 | 3.26 | 0.75 | 0.02 | 0.45/0.16 |
| CV % | 38.79 | 48.28 | 36.80 | 2.40 | 59.17/4.04 |
| Median | 0.742 | 4.89 | 2.10 | 0.979 | 0.58–4.01 |
Publisher’s Note: MDPI stays neutral with regard to jurisdictional claims in published maps and institutional affiliations. |
© 2021 by the authors. Licensee MDPI, Basel, Switzerland. This article is an open access article distributed under the terms and conditions of the Creative Commons Attribution (CC BY) license (https://creativecommons.org/licenses/by/4.0/).
Share and Cite
MDPI and ACS Style
Barthod-Malat, B.; Cochrane, C.; Boussu, F. Development of Piezoresistive Sensor Yarn to Monitor Local Fabric Elongation. Textiles 2021, 1, 170-184. https://0-doi-org.brum.beds.ac.uk/10.3390/textiles1020008
AMA Style
Barthod-Malat B, Cochrane C, Boussu F. Development of Piezoresistive Sensor Yarn to Monitor Local Fabric Elongation. Textiles. 2021; 1(2):170-184. https://0-doi-org.brum.beds.ac.uk/10.3390/textiles1020008
Chicago/Turabian StyleBarthod-Malat, Benjamin, Cédric Cochrane, and François Boussu. 2021. "Development of Piezoresistive Sensor Yarn to Monitor Local Fabric Elongation" Textiles 1, no. 2: 170-184. https://0-doi-org.brum.beds.ac.uk/10.3390/textiles1020008