
Light and Autofluorescence, Multitasking Features in Living Organisms


1
Institute of Molecular Genetics, Italian National Research Council (CNR), Via Abbiategrasso 207, I-27100 Pavia, Italy
2
Department of Biology & Biotechnology, University of Pavia, Via Ferrata 9, I-27100 Pavia, Italy
Photochem 2021, 1(2), 67-124; https://0-doi-org.brum.beds.ac.uk/10.3390/photochem1020007
Submission received: 7 June 2021
/
Revised: 1 July 2021
/
Accepted: 1 July 2021
/
Published: 3 July 2021
(This article belongs to the Special Issue Autofluorescence Spectroscopy and Imaging II)
Abstract
:Organisms belonging to all life kingdoms may have the natural capacity to fluoresce. Autofluorescence events depend on the presence of natural biomolecules, namely endogenous fluorophores, with suitable chemical properties in terms of conjugated double bonds, aromatic or more complex structures with oxidized and crosslinked bonds, ensuring an energy status able to permit electronic transitions matching with the energy of light in the UV-visible-near-IR spectral range. Emission of light from biological substrates has been reported since a long time, inspiring unceasing and countless studies. Early notes on autofluorescence of vegetables have been soon followed by attention to animals. Investigations on full living organisms from the wild environment have been driven prevalently by ecological and taxonomical purposes, while studies on cells, tissues and organs have been mainly promoted by diagnostic aims. Interest in autofluorescence is also growing as a sensing biomarker in food production and in more various industrial processes. The associated technological advances have supported investigations ranging from the pure photochemical characterization of specific endogenous fluorophores to their possible functional meanings and biological relevance, making fluorescence a valuable intrinsic biomarker for industrial and diagnostic applications, in a sort of real time, in situ biochemical analysis. This review aims to provide a wide-ranging report on the most investigated natural fluorescing biomolecules, from microorganisms to plants and animals of different taxonomic degrees, with their biological, environmental or biomedical issues relevant for the human health. Hence, some notes in the different sections dealing with different biological subject are also interlaced with human related issues. Light based events in biological subjects have inspired an almost countless literature, making it almost impossible to recall here all associated published works, forcing to apologize for the overlooked reports. This Review is thus proposed as an inspiring source for Readers, addressing them to additional literature for an expanded information on specific topics of more interest.
1. Early History
Studies on fluorescence started from the first observations on the light rising from vegetable components. As reminded by Acuna and F. Amat Guerri [1], in the 6th century the Spanish physician Nicolas Monardes was fascinated by the flora of the New World with its potential curative properties, and described in his book of the bluish opalescent light of the infusion of the Lignum nephriticum wood. The wood was collected from a tree used in Mexico to treat kidney disorders, likely corresponding to Eysenhardtia polystachya, a small tree belonging to the family of Leguminosae. In fact, this tree was reported by studies on pre-Hispanic people as the source of the wood called coatli, used to prepare infusions and already testified by them to have a bluish color. The blue light emission from the Eysenhardtia polystachya wood was subsequently ascribed to its rich content in Coatline B, a rare C-glucosyl-α-hydroxydihydrochalcone [1]. In 1852, George Gabriel Stokes published his famous monograph [2], describing the first report of Sir. J. Herschel on the “beautiful celestial blue color” observable from the colorless water solution of quinine when exposed to incident light, and the subsequent note from Sir. D. Brewseter who, using a lens to focalize the light and a rhomb of calcareous spar, demonstrated a different polarization between the less and the more “refrangible” blue light. In the same publication G. G. Stokes supported the remark of Sir. D. Brewseter on the frequent ability of vegetal solutions to give rise to “light dispersion”, including the red light from green leave extracts lately related to chlorophyll, and coined the term “fluorescence” in place of “dispersive reflection”. Observations were also reported on the general occurrence of fluorescence emission at wavelengths longer than excitation, the effect named Stokes’ shift. At the beginning of the XX century, the first fluorescence microscopes allowed the initial detection of components of plant cells. As recalled by F. H. Kasten [3] the red fluorescing chlorophyll allowed M. Tswett to distinguish chloroplasts, while G. Klein and H. Linser observed fluorescence of variable color in the blue-yellow range from various plant tissues [4]. The fluorescence emissions were tentatively ascribed to substances which were anyway almost excluded by W. Larcher [5], who for example suggested that not better-defined impurities accompanied to tannins could actually account for their fluorescence. Inspired by W. Larcher, H. R. Oppenheimer and B. Jaeoby [6] investigated in about one hundred of species of 57 families of vascular plants the role of autofluorescence as possible indicator of plant damage in living of death leaves. They concluded that in general the red fluorescence of chlorophyll persists in death leaves, contrarily to the blue-yellow fluorescence of substances at that time still undefined. Scheme in Figure 1 summarizes key points starting history of autofluorescence studies.
Specific fluorescing substances derived from vegetables have been then identified over time, and characterized as to both chemical and optical properties (Figure 2).
The mostly fluorescing vegetable fluorophores with excitation and emission properties are summarized in Table 1. Similarly, in each subsequent section a table will summarize the related, most relevant fluorophores.
2. Plants and Algae
2.1. Pigments Involved in Light Harvesting and Photosynthesis
2.1.1. Chlorophyll Photophysical Properties
Chlorophyll a and b are the main components of photosynthetic complexes in plant and green algae. Both chlorophylls show well shaped light absorption bands in the 350–475 nm and 625–690 nm spectral regions.
As compared with chlorophyll a, the blue band of chlorophyll b is slightly shifted toward longer wavelengths, and the red one toward shorter wavelengths, making them distinguishable from different analogues [10,18] (Figure 3).
Chlorophyll a is considered mostly crucial for light harvesting to initiate the photochemical processes, and chlorophyll b is for the stabilization of proteins in the photosynthetic complex. The two kinds of chlorophylls can be reciprocally converted into each other by specific enzymes according to the “chlorophyll cycle”, in the adaptation of photosynthetic cores to the plant requirement, during growing or to respond to stress stimuli from external factors [18].
To avoid damages from light exceeding leaf requirements, energy can be dissipated by chlorophyll as heat or fluorescence (ref. [19] and references therein). This latter rises from chlorophyll a, consists in two well defined bands in the 640–850 nm and its changes are relatable to the conditions and functionality of photosystem II [11,20]. Besides being activated by proper light irradiation, the emission of red fluorescence of chlorophyll accompanying photosynthesis is regarded as a protective way to dissipate excessive light energy in an inverse relationship with the photosynthetic process and heat dissipation (ref. [19,21] and references therein). Anyway, protection from excessive light energy is greatly ensured by carotenoids, the biosynthetic pathway of which has been proposed to be balanced with that of the photosensitizing porphyrins under conditions favoring photooxidation [22]. In addition to the participation to light harvesting, carotenoids contribute to regulate energy flow in photosynthesis and to the dissipation of excessive energy depending on changes in wavelength and dose of irradiating light, and on more general environment conditions. In this regard, a spectroscopic investigation on absorption and fluorescence properties of pure compounds in solution has led to propose that chlorophyll a can interact with β-carotenoid, which absorb in the 400–520 nm interval [10,23] through both electron transfer and energy transfer mechanisms, with the yield of transfer and the consequent quenching of chlorophyll a signal being dependent on the environment [24].
Various factors can influence optical properties of chlorophyll as well as other pigments, making the overall absorption, reflectance and fluorescence signals of plants and leaves to act as valuable intrinsic biomarkers exploitable for various studies. Investigations can vary from the basic mechanisms of photosynthetic processes to the noninvasive characterization of leaf growing or plant adaptation to stress inducing factors such as changes in light irradiation and soil components, for applications ranging from industry and farming to environmental surveillance [25,26,27,28].
Several studies have been performed on pigments extracted from vegetable substrates [10]. Purified chlorophyll a has revealed a minor absorption band in the long red spectral region. The dependence on temperature and its matching with energy vibrational levels suggested that this red band is unlikely participating to light harvesting, while playing a possible functional role in energy transfer in the photosynthetic complex [29]. On the other hand, the decay of flash-induced fluorescence of chlorophyll in isolated photosystem II membranes allowed to assess a similarity between UV-A and UV-B injuring mechanisms, differently from mechanisms activated by the light at a longer and photosynthetically active wavelength [30].
2.1.2. Chlorophyll as Photophysical Biomarker
Chlorophyll in chloroplasts can be easily detected by exciting its red fluorescence by proper artificial light irradiation. Fluorescence light microscopy, for example, has been applied to confirm the presence of the endosymbiotic Chlorella variabilis in cells of Paramecium bursaria, when investigating the persistence of the infective capacity of the alga following many cycles of its extra-host cultivation [31] (Figure 4).
The optical analysis of chlorophylls directly from the leaves has opened interesting perspectives to define the steps of its own biosynthesis and adaptation during leaf greening and plant growing, or in responses to changes in irradiating light and other environmental factors [32,33,34]. Stimulating results have been provided by preliminary investigations based on multispectral imaging applied to the leaves of soybean, submitted to stress induced by exposure to herbicide or to ozone. These treatments were found to remarkably affect fluorescence, opening interesting perspectives for the set-up of procedures for the remote assessment of stress induced to plants be exogenous factors [35] (Figure 5).
The non-destructive, in situ optical procedures may take advantage of the use of artificial light or of sun light as irradiating sources to excite fluorescence, making them to be respectively classified as active or passive methods. The diagnostic potential of remote optical measurements on vegetables can be also supported by a laboratory study on leaves and modelling based on the PROSPECT model of radiative transfer, representing plant leaf optical properties in the 400 nm–2500 nm spectral interval [36]. Numerous studies have been afterwards reported, using methods such as hyperspectral and multispectral imaging and spectroscopy, RGB imaging, thermography and fluorescence imaging and spectroscopy, with the aim to detect chlorophyll fluorescence combined with additional parameters as biomarkers of the response plant functional conditions to stress factors, as well as of fruit ripening [37]. The advances and lowering costs of digital, thermal and hyperspectral cameras, and the increasingly sensitive smartphone cameras have promoted the set-up of portable detection devices for in field monitoring of plant health. The implementation of data sets and the development of machine learning algorithms, such as the “Support Vector Machine” and “Artificial Neuronal Network” and deep learning derivatives using a convolutional neural network, can additionally promote the infield detection of plant stress induced by abiotic, namely water and light, nutrients or toxic substances, and biotic factors [25,37]. An example is given by the measurement of chlorophyll fluorescence of the orchid Phalaenopsis Aphrodite along with parameters of photosynthesis functionality, sucrose content and antioxidant enzymes as assessed biomarker of the plant acclimation to the blue light, proved to decrease photo-inhibition and suffering to light changes in the young sprouts and plants transferred in greenhouses, improving their growing and commercial value [38]. Also, the proximal measurement of original reflectance and data preprocessing procedures support the in situ hyperspectral analysis of the leaves of Eutrema japonicum, called the Japanese horseradish or wasabi, to assay chlorophyll and carotenoids as biomarkers of the plant stress in response to changes in pH and sulfur. This procedure has been thus proposed as a suitable tool to support a proper greenhouse cultivation of highly sensitive plants, particularly helpful for inexpert farmers [39]. Chlorophyll fluorescence can be also exploited as indirect biomarker for the in situ optical measurement of anthocyanins in grape [40] (Figure 6).
In fact, anthocyanins and more generally flavonoids, which are more deeply described in the next sub-section, exhibit optical properties able to influence at different extent the emission profile of chlorophyll. On this basis, the optical absorption of these pigments allows to take advantage of chlorophyll fluorescence measured at different excitation wavelengths to indirectly estimate anthocyanins in the whole bounces of grape [40].
The combined analysis of the fluorescence emitted by chlorophyll and phenolics derivatives has been also applied to investigate the response of grape vine leaves to the infection with the virus GLRaV-3. The optical signatures significant of changes in chlorophyll and phenolic derivatives upon infection are promising biomarkers for the early detection of the infection [41] (Figure 7).
A similar strategy has been also applied in the set-up of a portable leaf clip-based device has been also set-up for the indirect, nondestructive assay of nitrogen in cabbage leaves, though the measurement of chlorophyll fluorescence. In fact, a correlation has been found to occur between the content of nitrogen in leaves and the ratio between the chlorophyll fluorescence signals measured under excitation at 650 nm and 365 nm, two wavelengths respectively unaffected or absorbed by flavonols and anthocyanins [42].
Chlorophyll optical properties have been also exploited to verify the stability of the pigment encapsulated in cremophor-nano-micelles, to overcome the pigment hydrophobicity and facilitate its use as an additive in food or drugs [43]. The optical properties of chlorophyll and of its derivatives naturally present in alimentary oils extracted from fruits and seeds are also used as biomarkers for quality controls, as to kind of cultivar, country and adulteration [44,45,46,47].
2.1.3. Chlorophyll and Algae
The industrial cultivation of algae is worldwide increasing to produce biomass for various uses, from food and dietary supplements to additives and dyes for alimentary and drug products. Chlorophyll is the intrinsic biomarker suitable to carefully monitor growing and quality of algae, which are very sensitive to changes in culture medium depending on the increase in their own growing biomass or on external factors. Devices based on cell counters detecting directly chlorophyll fluorescence together with additional parameters have been proposed to support and facilitate the industrial cultivation of microalgae [48,49]. This could help to adapt the production response to the increasing worldwide commercial interest in algae, because of their remarkable value as food and source of products valuable for dietary, nutraceutical and pharmacology purposes. In this respect, algae are proposed to fight metabolic syndrome and obesity and even to improve the growth of bones in early development, for their content in antioxidant bioactive products with anti-inflammatory, antimicrobial and their demonstrated ability in modulating browning of adipocytes and hormones in growth regulation [50,51,52].
Particular consideration is commonly paid to Spirulina species, for their nutritional value due to the content in proteins, unsaturated fatty acids, vitamins, fibers and trace elements, besides for their richness in pigments [53,54]. In particular, it is to recall that Spirulina species belong to cyanobacteria and contain both chlorophyll and phycocyanins, the respective green and blue pigments involved in photosynthesis, making Spirulina species to be commonly defined as a blue-green alga. Phycocyanins exhibit special spectral properties in term of high absorbance and fluorescence yields, accounting for their photoprotection role in cyanobacteria and for more general strong antioxidant properties, which have stimulated the use of phycocyanins in nutriceutics and pharmacology, besides the use in food and pharmaceutics as a mere dye [15,50,51,54,55,56,57,58,59]. The absorption and fluorescence properties of purified phycocyanin and allophycocyanin have been also analyzed by time-resolved techniques to investigate ultrafast kinetic components of excitation energy transfer in phycobilisome, with the aim to improve the collection of solar energy for photovoltaic applications [15].
Cultivation of algae, and of Spirulina species in particular, requires huge amounts of water entailing waste of clean water and related costs. To solve these problems the use of zootechnic farm wastewaters has been proposed, for their richness in nutrients improving the biomass production. This advantage is however often counterbalanced by the hazardous presence of toxic heavy metals, mainly copper and zinc, in particular in swine wastewaters. Hence, chlorophyll fluorescence has been exploited to investigate the effects of zinc accumulation in the algae, in terms of changes in their growing and quality. Interestingly, this investigation has indicated two different positive outcomes, consisting respectively in the ability of the alga to remove zinc from wastewater with positive perspectives for environment protection, and in the ability of zinc at suitable concentrations to improve the content of chlorophyll, carotenoids and fatty acids in the biomass [60].
As to copper, the in vivo measurement of chlorophyll a fluorescence relatable to photosystem II in the marine green macroalga Ulva compressa helped to investigate the engagement of mitogen-activated protein kinases in counteracting the toxicity of the metal, by modulating its accumulation to maintain the photosynthetic homeostasis [61]. Similarly, the freshwater green algae, Chlorella species and Chlorella pyrenoidoas in particular, have been used to investigate the potential of chlorophyll fluorescence as a biomarker of changes in pH in the natural environment, or of the potential harmful effects of some ionic liquid derivatives used in the industry, helping to assess damages to photosystem concurrently with intracellular increase in reactive oxygen species (ROS) [62,63]. It is important to recall that algae growing in natural environments may be dangerous for ecosystems. In this regard, optical properties of chlorophyll contained in harmful algal blooms have been successfully exploited in a remote satellite sensing multi source approach to monitor lake water eutrophication depending on changes in meteorological and environmental factors [64].
As for harmful algal blooms, the remote sensing of chlorophyll fluorescence is becoming also a powerful means for the direct surveillance of plants, also in forestry and crops for environmental purposes. In fact, the transfer of analytical procedures from the proximate leaf level to remote airborne and satellite measurements, based on solar light as the natural irradiation source, is increasingly applied to vegetables optical measurements. This is for example the case of space earth satellite observation of chlorophyll fluorescence combined with the use of data statistics to monitor the heat induced stress on the yield of wheat in India [65]. The remote sensing-based procedures, however, have been recommended to pay attention to additional factors, in particular to the atmospheric effects and consequent need for correction, as well as attention to the validation of fluorescence retrieval methods developed from large data measured on different kinds of vegetal samples [66]. The main fluorophores described in this section are summarized in Table 2.
2.2. Pigments Not Involved in Photosynthesis
Many vegetable compounds not involved in photosynthesis and energy metabolism are defined as secondary metabolites. These are essential for the survival of the plant as well as primary metabolites, namely carbohydrates, fatty acids, amino-acids and nucleic acids, indispensable for the maintenance of tissue structure and activity of energy metabolism [68].
2.2.1. Phenols and Polyphenols
Phenols and polyphenols are a very numerous groups of secondary metabolites contributing to manifold plant functions such as the growth of sprouts and roots, control of rhizosphere and interactions between plant, besides protecting plants from pathogens and predators by means of different strategies, by acting as phytoalexins or causing unpleasant taste and stringency [69,70]. Polyphenols are characterized by the common presence of a phenolic group in biomolecules, as well as by a high variability in chemical structure and polymerization degree [71]. Depending on the basic chemical structure, polyphenols have been classified in at least 10 classes, including the simplest phenolic acid, coumarins, stilbenes, anthraquinones, lignins and flavonoids [7,72]. Flavonoids, in turn, include numerous derivatives mostly responsible for the color and taste of flowers and fruits [70] (Figure 8).
In general, colored derivatives help to protect plants from environmental abiotic stress triggered by changes in light, salts and metals, besides improving the appearance of flowers and fruits and thus helping pollination and seed dispersion favoring the survival of the species [68,69,72,73,74]. Flavonols and anthocyanins are the major responsible for the colors of flowers, along with carotenoids and chlorophylls. The ability of several flavonoid derivatives to act as chromophores and/or fluorophores has been extensively investigated for different application purposes. Flavonols and carotenoids absorb, respectively, in the UV and blue spectral regions, and may greatly result in pale yellow or yellow-orange colors, while anthocyanins can absorb along the overall visible spectrum, resulting in a wide range of flower colors. Anyway, the anthocyanin sensitivity to pH associated with their prevalent localization in acidic vacuoles of epidermal cells affects their color depending on plant basal conditions and functional changes. These factors have been studied for their evolutionary sense and for their roles in plant adaptation to environmental stress or to attract pollinators [74,75]. Research on these compounds has been also devoted to overcome some color limitations in flowers with remarkable commercial value. The great demand of blue flowers, in particular, has inspired different approaches, such as genetic engineering aimed to introduce genes encoding for enzymes producing delphinidin as the elective anthocyanin blue dye in flowers, or the modulation of vacuolar pH and metal transportation essential to obtain the effective blue color. In this view, good results have been obtained for some flowers, such as carnation and chrysanthemum, while a rose with the real blue color is still to be achieved [76,77,78,79].
The autofluorescence of anthocyanins has been proposed as a useful intrinsic biomarker to investigate their own metabolism and to monitor their trafficking and sequestration in cells vacuoles, as in the studies on the stigma cells of black rice (Oriza sativa L.) [80] or in grapevine (Vitis vinifera) hairy roots [81] (Figure 9).
The influence of anthocyanins on plant functions has been elegantly investigated on two cultivars of Fittonia albiveni, distinguished by their green or red leaves. The study has reported that the anthocyanin role as optically screening agent is supported by its inverse relationship with some photosynthetic parameters, such as the ratio between the fluorescence signals of chlorophyll a and chlorophyll b, the heat dissipation of energy relatable to the non-photochemical quenching and carotenoids.
The optical screening effect of anthocyanins has been also proposed to be in agreement with an improved resistance to drought [27]. In this respect, it can be also recalled that plant adaptation against abiotic stress in terms of improved salt tolerance, as well as dry matter production are better in genotypes of wheat with colored seeds with larger flavonol, anthocyanin and anthocyanidin accumulation in sprouts and leaves, as compared with non-colored wheat [82]. Also, water deprivation applied to in vitro cultures of the inner and colorless layers of epidermal cells of red onions was found to induce an increase in anthocyanins, characterized by fluorescence spectra comparable to the native ones. Even more importantly, in the same study the in situ detection of anthocyanins by microscope imaging along with the analysis of absorbance ratio and of fluorescence allowed to investigate the functions of anthocyanins in the control of the expression of exogenous transcription factors derived from different plant species [83].
Besides the mere light screening effects, the polyphenol protective issues in plants are greatly ascribable to their direct and indirect antioxidant properties [70]. The functional photoprotection role of flavonoids with their catechol group, is greatly explained with their scavenging ability against ROS and H2O2. This action, anyway, can also influence the sensing roles of these oxidizing species, as in the case of H2O2 capacity to trigger specific mitogen-activated protein kinases and the consequent cascades of signals in the maintenance of redox homeostasis, entailing also plant morphology responses [84].
The optical properties of anthocyanins may also change after interaction with ozone, making them possible biomarkers of this oxidizing agent. In fact, the changes in the fluorescence of the pigment contained in the cells of the blue flower petals of Saintpaulia ionantha have been proposed as an indoor and outdoor biomarker of the presence of this harmful oxidizing agent [85]. Likewise, anthocyanin transmittance spectra recorded directly from grape berries have been proposed along with other parameters to assess the quality of the grape purposely exposed to ozone, used as a protective agent against the fungus Botrytis cinerea to decrease the loss of grape during the post-harvesting withering phase requested by the disciplinary of production of the wine, Amarone [86].
The presence of natural polyphenolic compounds in animal and human diet has depended at all times on their occurrence in vegetables and fruit. The pleasing effects of polyphenol derivatives on taste and color of alimentary products, along with the increasing awareness on their nutritional and healthy properties account for the gathering efforts to improve their natural content in edible vegetables or their use as additives in food and beverage. The antioxidant properties of phenolic compounds are considered the main reason for their anticancer, antidiabetic, anti-inflammatory, anti-osteoporotic and cardioprotective effects, [55,71,72,87,88,89,90,91]. Actions on the pathways of glucose metabolism, as well as on the signaling pathways regulating cell proliferation, apoptosis, host immune response and inflammation, or on estrogenic or anti-estrogenic activity are reported in the literature to explain the manifold therapeutic effects of polyphenols, with particular attention to the cyanidin-3-O-galactoside, the colored derivative commonly present in different kinds of seeds and fruits [71,92].
Optical properties of flavonoids and anthocyanins are exploited as useful parameters to guide the development of strategies to improve quality, or assist piking of fruits containing these beneficial compounds. An approach based on UV excitation and cryo-imaging of autofluorescence in apple and grape tissue slices has allowed the topological localization of chlorophyll and flavonols in cuticle and cell walls, as a helpful technique to assess fruit quality and resistance to biotic and abiotic stress [93]. A fluorescence nondestructive spectral analysis of some cultivars of yellow peaches has also shown that fruit ripening is accompanied by a decrease in the signals typical of chlorophyll, the 683, 820 nm bands, and of flavonols and carotenoids, the 450–600 nm spectral region, in parallel with an increase in the band in the 600–650 nm range, consistently with the fluorescence spectral position of anthocyanins reported in the literature for grapes or onions [83,94,95]. Similarly, the content of anthocyanins estimated indirectly from the ratios of chlorophyll fluorescence measured in situ under different excitation wavelengths, by means of a portable fluorometric sensor device, has been proposed to optimize the harvest time for the table grape, Crimson seedless cultivar [96].
Interestingly, the indirect estimation of leaf flavonoids or anthocyanins from the chlorophyll fluorescence signal detected under different excitation wavelengths has been suggested to be more reliable than hyperspectral analysis based on reflectance measurements in the set-up of supportive procedures in the breeding and selection of herbal plants, such as chicory and lettuce, to enhance their nutraceutical value [97,98]. All these findings are promising to improve technology to control fruit condition in harvesting, packaging and supply in the chain from the producer to the consumers.
Besides the improvement in the natural content of flavonoids or anthocyanins in vegetables, a goal of the research activity is also to enhance the yield of their extraction and preservation as food additives, very appreciated for their water solubility facilitating their use, and for their intense colors in the blue-red range. Anyway, as already recalled for anthocyanins in flowers, microenvironmental factors such as pH, light, temperature and aging may affect the color of these biomolecules, besides their yield of extraction form natural substrates and subsequent preservation. To counteract these problems different strategies have been proposed, consisting for example in pigment encapsulation, copigmentation with polyphenol, interaction with substrates such as pectins, gums or proteins. The assessment of the color maintenance through the analysis of chromaticity parameters is used along with other techniques to estimate the effectiveness of these strategies. When proteinaceous substrates are used, their own fluorescence has also been used to monitor their association with anthocyanin molecules [99,100,101,102].
2.2.2. Betalains
Before continuing on additional phenol derivatives, it is to worth recall that some plant families lack anthocyanins, which are substituted by betalains, chemically based on the tyrosine group. These derivatives can be found in plants belonging to the order of Cariophyllales and in some higher fungi. Although chemically different from anthocyanins, betalains exhibit similar properties as to the contribution to the color of flowers, fruits and seeds, localization in the cell cytoplasmic vacuoles and antioxidant and protective functions both as intrinsic components in plants and as nutraceutical products in alimentary products [103].
Similarly to anthocyanins, betalain pigments are greatly considered as food additives and dyes, leading to the development of technologies to improve the yield and lower the costs in their extraction from the red beetroot to be used in alimentary industry [104].
Betalains include yellow betacyanins and red betaxanthins. The latter can give rise to a yellow fluorescence signal under blue light excitation [105] (Figure 10).
This yellow fluorescence, however, is quenched when betacyanins are present, acting as an inner filter because of their absorption spectrum overlapping betaxanthin emission [106]. The engineering of the expression of betalains in plants different from their native producers has opened interesting perspectives of multiple purpose applications. Production of betalain has been obtained in plants commonly producing anthocyanins by combining a gene modification resulting in expression of dihydroxyphenylalanine (DOPA) dioxygenases, and administration of the substrate l-DOPA [107].
The engineering of the expression of betalains in plants different from their native producers has opened interesting perspectives of multiple purpose applications. Production of betalain has been obtained in plants commonly producing anthocyanins. The successful engineered combinatorial expression of genes related to betalain synthesis in Nicotiana tabacum has been proved to improve the resistance to Botritis cinerea in eggplants, potatoes and tomatoes, where the production of betalains concurrently with anthocyanins is also expected to increase their nutriceutical values. The success of the procedure is demonstrated also by changes in the color of flowers as well as the increasing greenish fluorescence relatable to the enrichment in betaxanthins [108] (Figure 11).
2.2.3. Additional Polyphenols
Coming back to flavonol derivatives, compounds different from anthocyanins such as kaempferol, myricetin and quercetin have been shown to fluoresce grossly in the 520–570 nm region. Some small spectral differences have allowed to discriminate these compounds by means of a parallel factor analysis of excitation/emission matrices, evidencing a particular abundance of quercetin in paprika, commonly used as spice and as food red coloring agent [109].
Following a study on the overall fluorescence of honey, able to discriminate different botanical products independently from the identification of fluorescing species [110], a variability in quercetin and other phenolic acid derivatives, such as coumaric, caffeic, folic, vanillic and hydroxybenzoic ones, besides carotenoids was evidenced with a fluorescence based spectral investigation on ethanol extracts of pollen from different flowers harvested in Tuscany. Interestingly, the direct relationship between fluorescence intensity emission and in vitro antioxidant activity of pollen led to suggest a relationship between fluorescence and nutraceutical quality, depending on the botanical specie of flowers [111]. Also, flower pollen and anthers have been shown to fluorescence under UV excitation. Fluorescence has been ascribed to hydroxycinnamoyl derivatives, proposed to favor the visual attraction for pollination insects as well as to protect from potential UV damage [112].
A similar function might also account for the blue emission at the border of the pitcher trap of some carnivorous plants, when excited at 366 nm. This emission has been ascribed to the presence of phenolic derivatives, including p-coumaric and ferulic acids and quercetin. In this case light may attract and guide insects to the pitcher trap, where preys are then digested [113] (Figure 13).
Catechins
Catechins are polyphenol derivatives characterized by spectral absorption and fluorescence properties sensitive to oxidation.
Such compounds are particularly abundant in green and black tea and may have beneficial effects on human health or influence on drug pharmacokinetics in human plasma [114,115]. For these reasons spectral fluorescence analysis has been recently successfully proposed as a valuable support to assess quality and origin of tea [116,117].
Ferulate
Ferulate is a widespread phenolic compound, present as free form or in phytochemical polymers in leaves, fruits and seeds, regarded positively for its antioxidant properties and beneficial health properties (ref. [118] and references therein). The fluorescence of ferulate is sensitive to pH, with a blue emission at neutral pH and brighter green at high pH, allowing its differentiation in vegetable tissues from other fluorescing components of cell walls, namely suberin and lignin. An interesting application of this property has regarded the topologically localization of ferulate in pine needle tissue sections, in the absence of specific histochemical procedures, with the perspective of a fluorescence-assisted diagnosis of plant functionality disorders (ref. [119] (Figure 14)).
Coumarins
Coumarins are phenolic compounds present in plants, fungi and bacteria. The p-coumaric acid is characterized by an emission fluorescence band peaking at about 400 nm. In wheat leaves the band amplitude has been found to decrease in the presence of infection by the fungal pathogen Puccinia striiformis, in an inverse relationship with the emission at longer wavelength, ascribed to other components including carotenoids and anthocyanins. Interestingly, the simultaneous detection of different phenolic compounds by fluorescence spectroscopy senses the fungal infection in apparently diseased as well as in asymptomatic specimens, before the advent of the characteristic stripe-like lesions in leaves caused by the pathogen, helping to timely prevent its rapid spread and crop losses [120]. Coumarins are also among the natural phenolic compounds cause of phyto-photodermatitis following the accidental skin contact with plants or their ingestion, and their photosensitizing and fluorescence properties have inspired the synthesis of derivatives used as fluorescent labelling agents in the biomedical research and diagnosis, besides for therapeutic medical applications (ref. [121,122] and references therein). Psoralenes, in particular, are photosensitizing coumarin derivatives able to intercalate in the double helix of DNA accounting for some ancient attempts to treat skin diseases, such as vitiligo, eczema and psoriasis (ref. [123] and references therein).
2.2.4. Lignins
Lignins are very large and complex biopolymers of wood and sclerenchyma cells, which may include different moieties such as stilbene, coniferil, coumaryl and coumaran derivatives. Lignin excitation in the short UV may give rise to a wide emission spectrum, depending on the variable contributions of its components [7]. Lignin is a valuable biomarker to estimate wood compression, an anomalous and unfavorable quality of wood, as well the quality of paper [124,125]. In fact, lignin along with polysaccharide derivatives, namely cellulose, is a variable component of biomass material derivable from vegetable substrates such as wood, grass and waste from crops, which are increasingly considered green and sustainable source of various bio-materials. In this context, lignin as the formerly unwanted component in cellulose extraction from the biomass for paper production or saccharification, has now become a valuable by-product to produce bio-based materials [126]. In this view the inverse relationship between lignin fluorescence and the yield of biotransformation of the biomass has been proposed as a reliable, fast and cost-effective parameter to monitor the processing of the lignocellulosic biomass [127].
The main fluorophores described in this section are summarized in Table 3.
2.2.5. Other Photoactive Phytocompounds
Additional photoactive phytocompounds and their synthetic derivatives have been investigated to be applied in experimental research and in clinics for both diagnosis and therapeutic purposes, including cancer treatment (ref. [137] and references therein).
The tetrapyrrole based porphyrins such as protoporphyrin IX (PPIX) are produced in cell plants as precursors in the biosynthesis of chlorophylls [13]. Anyway, the fluorescence of porphyrins in plant has been rarely used, as in the case of their extract assay when investigating the effects of herbicides on photooxidation pathways [22]. On the contrary, fluorescence of porphyrins has deserved a much greater attention in bacteria and biomedicine, for photo-diagnosis and photo-dynamic therapy (PDD, PDT) application purposes, as from the following Section 3 and Section 6, “Bacteria”, and “Normal and altered cell and tissue discrimination”. The remarkable intrinsic autofluorescence of the alkaloids campothecin and berberine and of their derivatives has made these compounds to act as their own biomarkers to investigate their pharmacokinetic inside living cells in the anticancer research [135,136]. Within alkaloids, a particular mention is also to be deserved to quinine, contained in the bark of the Cinchona, or quina-quina tree, original from Andean region in South America. In fact, as recalled in “Early history” Section 1, quinine is the subject of the ancient observations on light rising from its aqueous solution, following only the reports on the infusion of Lignum nephriticum wood. Those observations have guided the initial uncovering of the principles of the fluorescence related phenomena. Besides, the quinine fluorescence properties in terms of high quantum yield and constant spectral shape in the controlled conditions of acidic solution account for its use as the most common and reliable fluorescence reference standard [9].
It is also to remark that the early interest in quinine was greatly stimulated by its therapeutic potential, since it has been for a long time used as antipyretic, anti-malarian and anti-inflammatory, even to treat rheumatoid arthritis and systemic lupus erythematosus [132,133]. The increasing awareness on unwanted hazardous side effects of quinine, however, is limiting its pharmacological use, posing also the question on soft drinks containing it for its appreciated bitter taste [134].
3. Bacteria
Beyond cyanobacteria, reminded in the former “Pigments involved in photosynthesis” subsection for their content in photosynthetic the fluorescing pigments chlorophyll and phycocyanin, bacteria in general may exhibit different autofluorescence properties.
These are particularly important for the human health, as to both environment protection and the clinics. Autofluorescence imaging has been proposed as a helpful procedure for the in-situ detection of infective agent in chronic and acute wounds, to set up timely and properly dressing and antibiotic therapy [138,139,140].
Green and red fluorescence are typically detected in wounds. Green fluorescence is commonly ascribed to the presence of Pseudomonas aureaginosa, in agreement with the identification of pyoverdine as its specific endogenous fluorophore and agent likely favoring the formation of biofilms [138,141] (Figure 15).
Red fluorescence rises from endogenous porphyrins, present in different kinds of bacteria [139,142]. Among these, Propionibacterium acnes is a lipophile bacterium belonging to the normal flora of the skin, which may play a role in the development of acne vulgaris when the skin equilibrium if disrupted. Endogenous porphyrins in Propionibacterium acnes have been confirmed by fluorescence spectra and response to photo-irradiation, inspiring their use as intrinsic photosensitizing agents in the photodynamic treatment of acne, proposed to overcome antibiotic resistance [143,144]. A study on the red and green fluorescence detected in variable proportions in various microorganisms isolated form the oral cavity has also directed to the conclusion that in dentistry red fluorescence seems to be indicative of the presence of bacteria causing caries [145,146]. A successive study based on the characterization of spectral and tridimensional excitation-emission matrices recorded from different species of oral bacteria has provided specific fluorescence fingerprints in the green-red spectral region for each kind of microorganisms, providing a promising perspective for the development of a user friendly, rapid and relatively low-cost procedures to identify oral microorganisms [147]. The analysis of fluorescence in terms of excitation emission matrices collected in the overall UV-visible spectral range has been also used to characterize eleven kinds of bacteria of clinical interest, valuable for the application translation to the search of possible surface contaminations on hospital equipment [148].
These useful perspectives for diagnostic applications have been attained irrespectively from the estimation of changes in the specific bacterial endogenous fluorophores, commonly aromatic amino acids and the coenzymes NAD(P)H and flavins, contributing to the overall emission besides the above-mentioned porphyrins and pyoverdine [149]. In this regard, it is anyway to recall that procedures based on fluorescence excitation emission matrix collected in the spectral region limited to the UV-blue spectral range and reflecting a different presence in the fluorescing aromatic amino acids could distinguish between E. coli, Salmonella and Campylobacter bacteria [150].
Spectral positions of bacterial endogenous fluorophores have been also taken into account to interpret excitation emission matrices recorded from the sludge in bioreactors for the treatment of wastewaters. To this end proteins, NAD(P)H and flavin coenzymes as intracellular fluorophores and no more defined additional components of humic and fulvic material, along with still proteins as extracellular components were indicated as biomarker of changes in intra and extracellular products relatable to the metabolic activity of bacteria, and thus of the bioreactor performance in degradation of waste biomaterial [151]. In this regard, the need to improve the surveillance of the impact on environment and human population of bioaerosol from treatment of wastewater has driven to the necessity of a most exhaustive assessment of related fluorescing species. To this end, a “Spectral Intensity Bioaerosol Sensor” has been applied to collect sixteen fluorescence bands in the 298–735 nm spectral range under two excitations, at 285 and 370 nm. The comparison of these data with those from fluorescence excitation emission matrices supported the ability to identify additional fluorescing species besides aromatic amino acids and coenzymes. The detection of vegetable structure components, such as lignin, or of secondary metabolites, such as phenol and terpene derivatives, have encouraged the further development of the “Spectral Intensity Bioaerosol Sensor” system to improve the real time monitoring of bio-aerosol quality [152] (Figure 16).
The main fluorophores described in this section are summarized in Table 4.
4. Fungi
Fungi both pathogenic and saprophytic, may fluoresce when excited by UV-blue light, or by equivalent energy through multiphoton excitation. Fungi contain common fluorophores including NAD(P)H, flavin derivatives and flavoproteins, lipofuscins, carotenoids and ergosterol. On the other hand, the pigment melanin, may affect the autofluorescence signal as an inner absorbing filter.
Upon excitation, the various fungal fluorophores fluoresce at different wavelengths along the overall spectrum, making them to be distinguishable by label-free imaging microscopy. Consequent applications have been proposed for taxonomic studies, to monitor the production of metabolites in bioreactors, to check the quality of edible mushrooms or for the diagnosis of fungal infection in biomedicine or in agriculture products [154].
Autofluorescence images allow to distinguish the morphology of septa, walls and spores. Images acquired in three RGB channels by a laser scanning microscope under UV excitation have been also demonstrated to distinguish between pathogen fungal species of interest in the medical practice, as well as showing their morphology [155] (Figure 17).
Arthrobotrys ferox is a terrestrial Antarctic fungus which produces aerial hyphae and highly fluorescent spores. The spores are dispersed in the environment for reproduction with a consequent exposure to hazardous UV radiation, which is likely affecting their fluorescence. This effect has been, thus, investigated as a potential indicator of UV radiation changes in the Antarctic areas [156] (Figure 18).
Hyperspectral analysis of autofluorescence recorded under 488 nm excitation allowed also to differentiate three Candida species, depending on the changes in the contribution from the signal around 550 nm, ascribed to flavins, and around 600–650 nm, from an unidentified fluorophore. The easy and rapid fluorescence analysis of cultures of suspect biological material in human serum was thus proposed as an easy and rapid support to more traditional diagnostic procedure to improve the early detection of these hazardous pathogens, contributing also to reduce the related healthcare costs [157].
On the other hand, the analysis of peeled and unpeeled caps of Agaricus bisporus, commonly known as Portobello Mushroom or Champignon, by collecting spectrally separated fluorescence images at microscopy under two-photon-excitation has proved to assess the freshness of this commercially valuable edible mushroom, suggesting also the possible translation of the technique to the monitoring of fungal biomass growing in bioreactors [158].
Ergosterol is a typical sterol component of cell membrane in fungi, regarded also as a hormone-like compound involved in the regulation of proliferation of fungal cells, such as in Saccharomyces cerevisie, commonly known as of Baker’s Yeast [159]. Ergosterol is important both as a diet component precursors of vitamin D, or as a target of antifungal actions in fungal infestation. Interestingly, excitation in the short 360–370 nm region has been verified to detect ergosterol by excitation emission matrices (400–600 nm spectral interval) in the extract of the fungal biomass produced from the dried mycelium of the Schizophyllum commune. Similar procedures have opened also valuable perspective for the autofluorescence-based assessment of the fungal biomass in solid or semisolid fermentation processes, for example to monitor the consumption of nutrients, CO2 generation in the production of compounds of industrial and commercial interest. Only a simple extraction procedure is required, making particularly easy and fast to assay filamentous fungi from solid or semisolid mass, with a technique potentially extendable to the analysis of fungal food contamination [160].
A particular study has regarded Trichoderma atroviride, a filamentous fungus deserving increasing attention as a beneficial mycoparasitic agent to be used against phytopathogens, with the aim to reduce pesticides and improve environmental benefits. In this case, the fungus autofluorescence is an undesirable factor hindering the in-situ studies aimed to better understand its action mechanisms to improve its beneficial use. Therefore, an advanced microscope technique such as the single molecule detection has been proposed to investigate in situ specifically labelled proteins, such as Sfp2-a tetraspanin membrane of the Sur7 family proteins, and better understand their roles in the growth of hyphae and the stabilization of cell walls [161].
The autofluorescence of fungi may be also increased by fixation with aldehydes, helping the in situ detection of infections by pathogenic fungi in plants, as proved for example in a pine needle [7]. Similarly, in clinics a periocular cutaneous lesion initially histologically misdiagnosed as squamous cell carcinoma was reported to be identified as blastomycosis only following fluorescence microscopy of tissue sections stained with hematoxylin and eosin, ineffective to evidence the microorganism [162].
Saccharomyces cerevisiae is the most used and studied microorganism of the kingdom of fungi. Beyond the countless uses continuing the most ancient practices based on fermentation in the production of food and beverages and its nutritional value for the vitamin content, research has relied on S. Cerevisiae as a suitable and versatile central model of higher eukaryotes. Engineering of the microorganism has resulted in its application in bioreactors to produce insulin, as well as in investigation of biochemical and metabolic mechanisms essential for a widespread improvement of knowledge in biomedicine.
S. Cerevisiae has been and continues to be a suitable model to advance knowledge on the structure and functions of membranes and cell organelles, signaling mechanisms, cell dysfunctions, mechanism of cell death, virus cell interactions affecting cell life and related antiviral drug screening, biogenesis of mitochondria and bioenergetics [163,164,165]. Precisely as to bioenergetics, it is to underline the importance of yeast in pioneering studies and in the development of sophisticated technology to investigate autofluorescence as biomarker of energy metabolism, given the essential metabolic roles played by its coenzymes NADH and flavins, respectively fluorescing in the reduced and oxidized state [17,166].
The first report on NADH autofluorescence in the yeast by Duysens and Kroneberg [167], was followed by the huge number of works by Britton Chance, including also flavoproteins as the additional autofluorescence biomarker of the functionality of the respiratory chain in isolated mitochondria, performed on yeast as well as on mammalian cells [168,169]. These observations started the gathering research and development of technology and applications based on the autofluorescence of NAD(P)H and flavins as diagnostic biomarker of the functionality of energy metabolism under physiological normal, altered and pathological conditions of cells and tissues in biomedicine [17,170,171,172,173].
A particular report regarded the fluctuations of NADH fluorescence detected in the yeast S. calsbergensis, initiated by glucose under anaerobic condition [174]. Subsequent observations on respiratory oscillations [175] and on the remarkable similarities between yeast and cardiomyocytes as to the oscillatory organization of metabolism and redox state promoted yeast as a convenient and suitable eukariotic model to investigate the dynamic networks regulating cell metabolism [176]. In this view, NADH and flavin autofluorescence contributed to assess the evolutive conservation of the systems ensuring the flow of energy in living cells, and to characterize phenomena, such as the respiratory synchronization involving the entire cell population in a yeast cell culture. This finding supported the definition of homeo-dynamism rather than homeostasis for the maintenance of that disequilibrium of the complex network of metabolic functions ensuring the organism life [165,176]. The main fluorophores described in this section are summarized in Table 5.
5. Autofluorescence in Animals
5.1. Arthropods
Autofluorescence can occur in different animals of some Orders in the phylum of Arthropod [21]. The phenomenon is known since a long time in insects. The initial report by Cockayne on the fluorescence of pigments in Lepidoptera [178] has been followed by the description of green or red emitting rhabdomeres in the eye of the housefly Musca domestica [179] and of butterfly fluorescing scales [180]. In insects, attention has been pointed in particular on butterflies and moths, of the Order of Lepidopteran, and to beetles, of the Order of Hymenoptera, for their particular ability in affecting light events.
Butterflies have always deserved great attention because of their greatly variable and beautiful colors. In butterflies, fluorescence is essentially ascribed to pteridine pigments, excited in the 320–325 nm range and fluorescing in the blue region as in Morpho sulkowskyi and Papilio xuthus [181], and to papiliochrome, containing beta-alanyl dopamine derivative, as in Papilio xuthus or Parides species [182,183]. The beautiful colors and iridescence of butterfly wings, anyway, depend on the combination of multiple factors, including the presence of other pigments acting as light filters, light reflection, scattering and diffraction, accounted by the ultrastructure of the wing scales [184,185] (Figure 19).
In fact, scales are characterized by parallel ridges with an organized series of micro-ribs working as a grating, as assessed in Papilionidae butterflies such as those belonging to Parides genus and Troides magellanus, and in subjects form the genus Morpho [184,185,186,187].
Biological implications may regard butterfly life and evolution as to camouflage, inter-intra-specific recognition and mating, and have been exploited for taxonomical purposes [183,184,188,189].
For their effect on light, the ultrastructure of scales has been compared with photonic nanostructures. Their changes, e.g., in thickness and length, as well as changes in the presence of pigments may tune the resulting color [184] (Figure 20).
Similarly, other different kinds of biological structures show nano periodicity organization, comparable to optically active photonic-crystal-like structures [190] (Figure 21).
The beetle Hoplia coerulea is commonly recognized to change the elytra color from bleu to green when wet. The changes in the observed color depend on the structural organization of the cuticle in elytra and thorax, which consists in a periodical stack of porous layers similar to a photonic cell, making the filling of the pores with media of different refractive index, e.g., air, water or ethanol, to affect reflection of incident light as well as fluorescence [191,192]. This latter, in turn, rises from a fluorophore not yet chemically identified, although being indicated by one photon and two photon excitation investigation as a fluorescing species with several states of excitation and emission [193]. The sensitivity of the color of Hoplia coerulea scales to water inspired also the microporosity of its natural structure as a model for a vapor sensing device [191] (Figure 22).
The different autofluorescence emission colors of materials composing the cuticle of insects may accompany different biomechanical properties. Reddish autofluorescence rises from sclerotized cuticle, yellow-green and brownish colors from more elastic parts, and bluish fluorescence from resilin. Resilin has deserved great attention because it is a structural rubberlike protein, named also “arthropod elastin” [194], and its bluish autofluorescence it suitable for the in situ three-dimensional investigations on the structural organization of the arthropod exoskeleton [195]. In the Odonata order, which includes dragonflies and damselflies, mixed autofluorescence color analysis by confocal scanning microscopy has been applied to characterize the parts composing the cuticle in the mouth in larvae of damselflies. Imaging has evidenced the prevalence of reddish-yellowish sclerotized material in the parts of mandibles where a high force is applied by the insect to crush preys, while the bluish emitting resilin is mainly present in elastic membranous structures, confirming the autofluorescence potential for the in situ study of functional organization of complex structures [196]. Even more interestingly, resilin autofluorescence in Odonata has been also exploited to study the biomechanical role of this protein in the mechanism of flight defined as “direct”, for the direct connection between musculature and wings by means of cap tendons ensuring unique skills of fly movement [197,198]. The bluish autofluorescence of resilin has also allowed its differentiation from the green and red emission respectively from sclerotized and chitinous cuticle, besides confirming its presence in the pterothorax cap tendons. This finding is fully consistent with the role of resilin in supporting and protecting muscles from mechanical shock, by absorbing and bringing them back energy [198]. Autofluorescence detection of resilin and chitin depending on their respective brilliant light blue and yellowish-reddish emission colors has also been proved to discriminate antennal gustatory sensilla in leaf beetles, opening interesting investigation perspectives on the sensing of non-volatile metabolites in herbivorous insect in decoding plant biochemical composition [199].
Lastly, it can be reminded that in bees few reports describe only the autofluorescence of accumulating lipofuscin-like pigment, higher in old than in young worker subject and associated with production of pentane and hexane in the breakdown of hydroperoxides from membrane lipid peroxidation [200]. The main fluorophores described in this section are summarized in Table 6.
5.2. Fishes
Autofluorescence is a transverse phenomenon which may occur also in higher animals from several taxa. In fishes, excitation in the 450–500 nm interval can give rise to green and red autofluorescence [202] (Figure 23).
Fluorescence may occur in fishes belonging to different species, in part still unidentified because of a cryptic living behavior. In fishes populating coral reef areas biofluorescence has been recommended as a valuable tool in the search and surveillance of otherwise poorly detectable rare species [203]. It has been also reported that many of the fluorescing fishes, including sharks and rays, possess a good vision and the presence of intraocular yellow filters, likely facilitating their ability to detect this fluorescence at wavelengths longer than the blue or dark in aquatic environment. These properties have been proposed to favor a visual communication for a specie specific recognition in particular for mating, while facilitating a camouflage in the vicinity of green and red algae and corals protecting fishes from predators [202,204].
As to corals, the molecular phylogenetic of genes encoding for their fluorescent proteins have been deeply investigated as to the lineage diversification and the ability to reduce oxidative stress or to attract symbiotic algae [205]. Besides the pure spectral properties of fluorescent fishes, biomolecules and mechanisms responsible for the fluorescence emission in fishes need to be further elucidated [206]. In fact, few studies have up to now reported about this matter, as for some species of cryptic eels, for which a fatty acid binding protein has been described to give rise to a bright yellow light emission upon binding with bilirubin acting as the fluorophore. The selective evolution of these fatty acid binding proteins has been justified as an acquired advantage in communication and antioxidant protection [207,208,209]. A particular mechanism has been also proposed to control the red fluorescence emission from the eyes of the cryptic fish Tripterygion delaisi, ascribed to red emitting guanine crystals detected in iridophores and regulated by the aggregation or dispersion of melanosomes in melanophores, under a nervous control [210] (Figure 24).
A subsequent investigation in Tripterygion delaisi on the red fluorescence has further supported its role in creating visual contrast and signaling functions in combination with reflection, adapting to the various natural living conditions and in particular to the deep-water environment [211]. On the other hand, a greenish biofluorescence is exhibited also by some shark species. Two kinds of shark, in particular the swell shark (Cephaloscyllium ventriosum) and the chain catshark (Scyliorhinus rotifer), have been studied with the aim to characterize the fluorophore responsible for their greenish emission. The spectrofluorometric characterization of metabolites extracted from the skin of these green fluorescing sharks has indicated a bromo-tryptophan-kynurenine derivative produced by the bromo-kynurenine metabolism as the green fluorophore. Besides the most common participation in signaling, the identification of these compounds has also driven to suggest an antibacterial role [212] (Figure 25).
A separated but not least topic is the fluorescence of fish as seafood for human alimentary purposes for the development and application of spectroscopic techniques, including fluorescence and hyperspectral imaging, to monitor the freshness and check the fresh or frozen-thawed origin of food [213]. The main fluorophores described in this section are summarized in Table 7.
5.3. Reptiles and Amphibians
Some reptiles and amphibians may exhibit different fluorescence colors, depending on mechanisms up to now mostly uncovered. Chameleons of the genus Calumna may exhibit a brilliant blue fluorescence from the tubercles of their head under UVC irradiation. The fluorescence has been verified to rise from tubercles, consisting in bone protruding from the skull and covered by a very thin skin, and to play a role in intraspecies recognition against the dark environment beyond the epidermal colors [214] (Figure 26).
A blue and green fluorescence has been also reported for the gecko Pachydactylus rangei. The high efficiency of this fluorescence, along with its association with iridophores localized around the eyes and along the flanks have directed to propose it as a favoring factor in the intraspecies signaling in these nocturnal animals under the moonlight in the desertic environment [215]. Interesting observations have been also reported on the small toxic anurans of the Atlantic Brazilian Forest, which show yellow to red colors and may exhibit bluish fluorescence. An UV illumination, around 365 nm, has demonstrated a bluish fluorescence rising from Brachycephalus ephippium and B. pitanga, but not in Ischnocnema parva, from areas corresponding to dermal ossification. This localization has been confirmed by fluorescence spectral analysis and imaging of tissue sections, although it is still difficult to define the biomolecular nature of the fluorophore as well as the effective biological reason of the phenomenon [216] (Figure 27).
On the other hand, in Hypsiboas punctatus, a frog living in South America characterized by a high content in biliverdine in tissues and lymph, the brilliant fluorescence excited at 400 nm has been ascribed to a derivative of dedihydroisoquinolinone, named hyloins. This biomolecule present in the glands and dermis besides lymph has shown a wide spectrum of fluorescence emission partially filtered by skin chromatophores, making it to result as a blue band with a variable green shoulder ([217] (Figure 28)).
In general, the findings up to now reported on reptiles and amphibians contribute to strengthen the common concept on the seemingly separate evolution of animal fluorescence properties, driven by the importance of favoring intraspecific signaling and communication. The spread of fluorescence in different representatives of amphibian taxa is also a helpful tool for their detection and classification, besides evolutionary studies on their ecology and vision ability [218].
The main fluorophores described in this section are summarized in Table 8.
5.4. Birds
In birds, attention has been devoted to parrots and their colored feathers, starting from an early report by Otto Völker in 1937 [219].
Differently from carotenoids as the main coloring agents in other birds, yellow feather color in parrots is ascribed to the presence of psittacofulvins, polyenic compounds differing from carotenoids for the absence of methyl groups, and for their non-alimentary origin since they are proposed to be synthesized at the follicular site during feather growing [220,221,222,223].
Psittacofulvins have been also suggested to account for both the yellow color and fluorescence of feathers as a single chromophore, while magenta and red colors should depend on changes in pigment molecular conformation, intramolecular organization and environment occurring during the feather growth, as supported by Raman spectroscopy data [224,225,226].
The yellow fluorescence of feathers observable under UV excitation in cheeks and head of the native Australian budgerigars Melopsittacus undulatus was proved to play a role in the sexual choice of this monogamous budgerigars, while being uninfluential on the social life [227].
Figure 29 shows an example of gene dependence of the yellow fluorescing crown in Melopsittacus undulatus [223].
Plumage of some birds, many of them crepuscular and nocturnal, may exhibit a pinky-red fluorescence under UV excitation, which has been ascribed to porphyrin derivatives.
Is this the particular case of Caprimulgus ruficollis, commonly known as red-necked nightjar, red fluorescence has been found to prevalently localize in the rachis of the wing feathers, with the suggested necessity of a further work to understand its possible role in the bird ecology and functional visual evolution (ref. [228] and references therein) (Figure 30).
The main fluorophores described in this section are summarized in Table 9.
5.5. Mammalians
Only few mammalian animals are characterized by fluorescence emission from their external surface upon light irradiation. Some ancient reports are recalled by Pine et al. [229], on the changes in color and fluorescence of the fur of wild animals after killing, when introducing its work on the various colors and fluorescence of hair of museal specimens of didelphid marsupials [229]. After that a renewed attention to the phenomenon has indicated that, in general, it seems to apply greatly to some animals with active life under poor light conditions in the crepuscular and nocturnal phases of the day, transversally representing marsupial and placental mammals in Eastern, European, American and African countries [230].
In the nocturnal Pedetes surdaster and P. capensis, two springhare species belonging to the Pedetidae rodent family, an orange-red fluorescence has been detected from their fur under UV irradiation. The reddish fluorescence was proved to rise from the cuticle of the hairs, and was ascribed to porphyrins on the basis of fluorescence spectra recorded directly from the ventral and dorsal sides of the animals, besides the HPLC biochemical analysis of fur extract [230] (Figure 31).
Porphyrin derivatives have been also confirmed by spectral analysis as the fluorophore responsible for red fluorescence detected in Erinaceus europaeus or European hedgehog, in terms of a reddish emission excited by a 365–395 nm irradiation and rising from the less colored sections of their proximal spines. Porphyrins have been ascribed to the abundant presence of microbiome on the spines, and suggested to play no particular roles on the hedgehog life biological function [231]. In this respect, it is worth to recall the detection of red fluorescence in the skin of experimental mice, ascribed to the pheophorbide and/or pheophytin, ascribed to porphyrin-based compounds derived from chlorophyll contained in mouse chow [232]. On the other hand, an investigation on UV induced visible fluorescence observable in individuals of flying squirrels of the Glaucomys order of North American indicated its preferential relationship with the adaptation to living in nocturnal–crepuscular environment along with the frequent presence of snow, suggesting possible communication, even antipredator, functions. This proposal was provided on the basis of the preferential detection of pink fluorescence only in so defined individuals and not in others with different living behavior, and independently from factors as habitat and season making to rule out a possible contamination from food, such as lichens [233].
Lastly, museal subjects of Ornithorhynchus anatinus, from Tasmania and Australian New South Wales, have been demonstrated to fluorescence with a peak at 500 nm, as a claimed first description of fluorescence in a monotreme mammal [234]. The main fluorophores described in this section are summarized in Table 10.
6. Bioluminescence
Beyond autofluorescence, attention is here devoted also to bioluminescence. Differently from fluorescence, emission of light in bioluminescence relies on biochemical reactions providing the energy to excite a fluorophore able to relax with the emission of light, rather than on irradiation with suitable excitation light. The reaction commonly involves a redox enzymatic system and a suitable fluorescing substrate, named respectively luciferase and luciferin essentially for their functional role in the light emission process, rather than for the actual chemical structure. The biochemistry of luciferase and luciferin has been characterized in some taxonomic groups, showing differences in the various types of bioluminescent systems in living organisms, affecting also the color of the emitted light [235,236,237].
Bacteria are reported to be the most numerous and abundant representatives of bioluminescent living beings. Luminescent bacteria are categorized essentially in three families, Enterobacteriaceae, Shewanellaceae and Vibrionaceae, and are unceasingly deserving attention to improve the knowledge on bioluminescence mechanisms, besides environmental and taxonomical studies. A great part of luminescent bacteria lives in marine waters, as compared with fresh waters and land.
Bacterial bioluminescence depends commonly on the peroxidation of a reduced flavine derivative, leading to the formation of a flavin-4a-hydroxide in the excited state able to emit light at around 490 nm when returning to the ground state, ready for a new cycle [236].
Few exceptions regard a strain of Vibrio fischeri, where the emission at 484 nm ascribed to the common complex of luciferase flavin-luciferine can be accompanied by a yellow emission, ascribed to the presence of a yellow fluorescing protein. In fact, this has been proved to be able to activate the reduced flavin substrate resulting in a remarkable enhanced emission at 534 nm [238]. More generally, it is to remind how the evolution of luciferase enzymes is studied to better clarify the biodiversity distribution and functions of genes encoding for subunits participating to flavin based light emission, such as the luxA and luxB genes, leading to valuable outcomes in bacterial taxonomic studies [239].
Dinoflagellates are important plankton components and some of their representatives may account for a marine luminescence occurring almost around the world and involving so large areas, called milky sea, even observable from the space [235,240]. In these organisms, bioluminescence is sensed by mechanical stimuli which account for the light rising from waves braking on shoreline or from wakes of ships, and have also inspired the development of biotechnological strategies, such as polymersomes nanoreactors activable by shear stress to control biocatalytic reactions [241,242]. On the other hand, Dinoflagellates are a preferred model to investigate the still greatly unrevealed biological meaning of bioluminescence of these microorganisms, for example with attention to elucidate both evolution and ecological effect of non-luminescent or toxic populations [243,244,245].
Bioluminescence involves very different organisms, most of which living in oceans, and its impact on their life is still greatly uncovered. Interestingly, in aquatic organisms prevails the emission of blue light, which is best transmitted in water as compared with other visible spectral regions, in a likely agreement with an accomplishment of the functions of particular animals living in the dark deep sea [235].
A typical example is given by sharks living in the deep sea, namely Etmopterus molleri, Etmopterus spinax and Etmopterus spendidus. These sharks have many small photophores prevalently on the ventral side of the body, giving rise to a blue-green light, independently from the presence of bacteria. The mechanism underlying light emission should thus involves biochemical reactions still unidentified to act as the likely couple luciferin/luciferase, while it has been assessed its regulation by hormonal control [246] (Figure 32).
In aquatic organisms the many advantages ascribed to bioluminescence are counterillumination and defense, attraction of prey and favoring mating, obviously mostly questionable for bacteria. For these latter the most proposed advantage seems to come from symbiosis, in terms of an offered protected living environment by the host, which benefits from the above recalled advantages [235,236,247]. A typical example is given by the association between a fish of the coral reef, Siphamia tubifer, and the bacterium Photobacterium mandapamensis, which colonizes the organ light of the fish helping it in food seeking in the night [248].
A detailed study on the interaction between the squid Euprymna scolopes and the bacterium Vibrio fischeri has also contributed to clarify the mechanisms underlying host colonization, as an advancement of population studies in symbiosis biology [249].
Beyond organism living in water [235], the numerous and mostly known examples of bioluminescence in terrestrial living beings are represented in the superfamily Elateroidea, from the order of Coleoptera. These include glow-worms fire beetles, fireflies, which have attracted interest to the evolution of their bioluminescence accompanied by changes in morphology and neoteny, stimulating also fossil-based research [250].
The interest in evolution of bioluminescent organisms also entails glowing fungi. Luciferase is reported to originate in Agaricales, and it is currently detectable in Armillaria and Mycene species. 3-hydroxyhispidin, the hydroxylated hispidin, is the luciferine [251]. The high expression of bioluminescence in fruiting bodies is still not associated to a precise function, apart a suggested relationship with the remodeling of the wall.
Studies on the expression of luciferase clusters in Mycene fungi have contributed to understand the importance of the genome plasticity for the maintenance or loss of bioluminescence during evolution, in the perspective of additional studies on the mechanisms of bioluminescence and its possible functional role in the ecology of fungi [251]. In this respect, it is however to recall that bioluminescence in some fungi has been suggested as a possible incidental result of metabolism by-products, rather than a factor favoring advantages in selection. In fact, bioluminescence in Omphalotus nidiformis was proved by different in-field trapping methods not to be attractive for insects dispersing spores, thus with no advantage for dissemination [252] (Figure 33).
Currently, valuable applications of bioluminescence in biomedicine take advantage of the luciferin luciferase complex to assay the cell and tissue chemical energy content in terms of ATP [253]. Of note, the biochemical estimation of ATP levels in solutions and homogenates from biological substrates has also evolved to in situ fluorescence imaging, motivating interest and advances in the synthesis of luciferin derivatives able to emit light of different colors, improving the potential of luciferine-luciferase based investigations [254,255].
Bioluminescence has also played an intriguing role in the discovery of intrinsic fluorescing proteins in the jellyfish Aequorea victoria, starting the unceasing development of successful applications in biomedical diagnosis and research. In fact, the purification and early characterization of the green fluorescing protein (GFP) from Aequorea victoria have led to the demonstration that GFP is excited by the blue bioluminescence from aequorin in the presence of Ca++, likely following the mechanism of non-radiative Forster energy transfer [256]. After that, the possibility to take advantage of mutations resulting in fluorescent proteins of different colors, and the cloning of their cDNA to obtain their specific expression in heterologous cells have opened almost infinite perspectives.
Fluorescent proteins are used as intracellular gene reporters, biomarkers of protein expression or of dynamic signaling events and trackers of targeted cells, as in tumor invasion or cell transplantation even in deep tissues as brain or lung, in in vivo experimental animal [257,258,259,260,261,262]. The main fluorophores described in this section are summarized in Table 11.
7. Normal and Altered Cell and Tissues
Autofluorescence detectable from the various living beings is mostly studied for its possible association with ecological, sensing and functional issues, relevant for survival and evolution as well as for the preservation of the environment, or for the production of food and supplies to meet human needs. Conversely, autofluorescence relatable to functional alterations or pathological conditions of cells, tissues and organs is relevant for the development of diagnostic applications in biomedicine. This transversal issue has been already faced along this text, as to the in situ, real time detection of fungal or bacterial infective agents taking advantage of their autofluorescence properties.
In this section attention is paid prevalently to the biomolecules acting as endogenous fluorophores and to their possible pathophysiological meaning, rather than on the almost countless clinical optically based diagnostic applications described in dedicated papers and reviews [264,265,266,267,268,269,270,271,272,273].
Alterations in animal tissue autofluorescence described by the first historical observations were even then focused on the relationship between diseased conditions and changes in specific fluorophores. In fact, the increase in red fluorescing porphyrins was associated with porphyria or growing of experimental tumors [274,275,276], and the increase in yellowing fluorescing ceroids was observed by fluorescence microscopy in the liver tissue from experimental animal models of cirrhosis induced by diet alteration [277].
Endogenous porphyrins along with their various derivatives or precursors administered as exogenous compounds, and the subsequent generations of photodynamically active biomolecules have been extensively investigated to develop PDD and PDT applications [278,279,280,281,282,283]. On the other hand, the first identification of ceroids followed by the detection of other endogenous fluorophores such as vitamin A, riboflavin, thiamin and structural proteins started the application of autofluorescence microscopy and of the progressively more sophisticated technologies for diagnostic purposes, concurrently with a continuous progress on the knowledge on the metabolic and diagnostic meaning of these compounds [3,284,285,286,287]. As above recalled in the “Fungi” Section 4, systematic studies on cell metabolism were early initiated by the report on the autofluorescence of NADH in the yeast [167]. Soon after, Britton Chance and coworkers continued the investigations on grasshopper spermatids, ascites tumor cells and normal mammalian cells, including also oxidized flavins, as the fluorescing redox counterpart of NADH in mitochondrial respiration. These studies inspired a huge amount of work, resulting in two major topics: (i) cell respiration, energy metabolism and responses to external stimuli; (ii) steady-state metabolism and changes in disease cells [168,169,177,288,289,290]. NADH and NADPH are prevalently involved in the respective metabolic energy production in mitochondria, or in cytoplasmic reductive biosynthesis and antioxidant defense [17] (Figure 34).
The pool of reduced NAD(P)H in the cell is maintained by complex equilibria. The emission spectra of the two fluorophores cannot be discriminated, while they undergo a blue shift and an amplitude increase upon binding to enzymes [17,291,292].
In any case, the major contribution to the cell fluorescence given by from NADH bound to the complex 1 in the mitochondrial respiratory chain makes mitochondrial fluorescence the major responsible of NAD(P)H signal in cells [17] (Figure 35).
Flavins as well as NAD(P)H are essential coenzymes of key enzymes in redox metabolism and energy production. Contrarily to NAD(P)H flavins fluoresce in the oxidized state, contribute to the autofluorescence of various organisms including bacteria and fungi as recalled in the respective sections, and generally account for the cytoplasmic autofluorescence in mammalian cells. The “free” flavin mononucleotide (FMN) and flavin-adenin dinucleotide (FAD) give rise to comparable fluorescence spectra, showing inly a decrease in amplitude [293]. Fluorescence of FAD when bound to flavoproteins as the prosthetic group is greatly dependent on the kind of protein. In flavoproteins engaged in energy metabolism, a-lipoamide dehydrogenase (FP5) and electron-transfer flavoprotein (FP3) have been found to greatly explain flavin emission signal in isolated mitochondria, over a minor part ascribed to less defined dithionite reducible flavoproteins [289]. In fact, FP5 is a multi-enzyme complex acting as dehydrogenase at the electron entry from NADH to complex 1 in the respiratory chain, while FP3 is the entry point of electrons from the oxidation of fatty acids and of some amino acids enter the respiratory chain.
Complex and interlaced pathways involving also transhydrogenases provide to maintain the redox metabolic equilibria amid reduced and oxidized forms of NAD(P)H and flavins in cytoplasm and mitochondria. Despite this complexity, the autofluorescence properties of the two coenzymes, allowing their separate detection, has allowed for assessing a simplified parameter representative of the equilibrium between the two fluorophores, in terms of an optical redox ratio [294]. This parameter, consisting in the calculation of the ratio between the signal of oxidized flavin by the same signal added by the NAD(P)H one, has thus inspired the application of the “Ratiometric redox fluorometry” to various energy metabolism studies on cells and organs under different functional conditions and neoplastic transformation [295,296]. Examples may regard also the monitoring of stem cell differentiation, commonly entailing a shift from anaerobic to aerobic metabolism with the increase in the presence of mitochondria and their changes from the small and round shape to larger and longer organelles, and a rising in lipofuscins as accumulating products of material undigested or from autophagic and oxidizing processes [285,297,298,299,300,301,302,303,304,305].
Changes in NADH autofluorescence are also reflecting the response of the respiratory chain to exposure to metabolic substrates or poisons, or to changes in oxygen availability, with implications also for the set-up of strategies in the monitoring of organ functionality during the transplantation phases [47,295,306,307,308,309,310]. An improvement in fluorescence studies of cytoplasmic metabolic functions is also promised by technological advances in imaging microscopy based on fluorescence lifetime detection, allowing to exploit the differences in lifetime between NADH and NADPH in living cells to study separately the metabolic engagement of the two derivatives, mainly as to energy production and antioxidant defense [173,291]. The time dependent separation can thus allow to distinguish the two fluorophores with overlapping spectra. In fact, lifetime imaging allows to collect distinctly the signals from different fluorophores depending on the differences in their typical deexcitation kinetics following excitation by a laser pulse.
Besides fluorescence lifetime detection, more generally advances in fluorescence analysis are offered for example by using multiphoton excitation and data processing procedures, allowing to detect separately specific additional fluorophores according to their spectral position or their time decay, improving their in situ and real time topological localization. Applications vary from basic research to the facilitation of histopathological diagnosis, intraoperative imaging and surgeon guidance [285,311,312,313,314,315,316,317,318,319,320,321].
A stimulating advancement based on lifetime imaging has been reported on the application of NADH and flavin fluorescence to assess the response to drug treatment of organoids derived from human neuroendocrine tumors of the gastroenteropancreatic tract, as a valuable support for the development of pharmacological therapies [322].
As to the role of additional fluorophores, it is to recall that the weak fluorescence of melanin detected by dermatofluoroscopy, based on two-photon excitation non-linear spectroscopy, has been shown to discriminate melanocytes from melanoma cells. This finding has been suggested as a promising valuable support for the in situ diagnosis of skin malignancy with additional perspectives for manyfold application in melanin research in technology and biological science [323].
Advances are provided also by the using of the phasor approach, a procedure to process fluorescence images by plotting separately clusters of pixels with similar fluorescence parameter values. Various types of collagens characterized by differences in autofluorescence lifetime or intensity, the latter relatable to second harmonic generation signals resulting from collagen birefringence properties, have been discriminated following the phasor approach, proved to distinguish between type I and type III collagen in biological samples [321].
Also, the phasor approach allowed to detect fluorescing species with long-lifetime decay in lipid droplets in fatty liver, reported to be in agreement with findings from fat tissue or cells submitted to oxidative stress, in the perspective to develop automation procedures of biopsy histopathological analysis to facilitate the prescreening and diagnosis of liver steatosis and fibrosis [324].
The reports on collagen follow ancient works addressing to the great importance of the highly fluorescing collagen in the submucosa of multilayered epithelia in the set-up of strategies aiming to facilitate the in situ detection of neoplasia in hollow organs. In fact, the growing of neoplasia causes a thickening of mucosa and a disappearance of submucosa, resulting in a lowering the signal rising at the tissue surface which can be detected via endoscopy, as currently performed in the clinics by means of commercial devices [266,325,326,327,328,329]. Notably, a direct relationship has been also reported between autofluorescence imaging data, histology and alterations in genes related to cancer cell proliferation [330].
An increase in photo-oxidized products of organic compounds, comparable to lipofuscins, has been suggested to account for a rising in fluorescing species with excitation and emission shifted towards the red spectral region in cells submitted to UV irradiation [331]. These findings may contribute to explain the fluorescence signal rising from parathyroid, proposed as a supportive tool to detect and preserve these glands in thyroid surgery within the currently proposed different optical strategies [332] (Figure 36).
Fluorescing biomolecules can be also detected in body fluids. Endogenous porphyrins in the blood, for example, have been proposed as fluorescing biomarker of malaria, kidney failure or of the presence of cancer in both experimental models and clinics [12,333,334,335,336,337,338,339,340,341,342].
Besides porphyrins, vitamin A, arachidonic, oleic and linoleic fatty acids exhibit a sufficient fluorescence quantum yield to make them distinguishable from each other in the serum by spectrofluorometry.
Vitamin A and specific free fluorescing fatty acids in serum have been, thus, proposed as promising biomarkers of liver metabolic alterations, in steatosis and consequent hepatic and systemic oxidative stress. These insights derive from the central role of liver in providing for the storage, mobilization and systemic homeostasis of these biomolecules, and the consequent biological effects. These may depend on the balance between the possible antioxidant or toxic effects of vitamin A, and on the involvement of arachidonic and other fatty acid derivatives, namely the eicosanoids prostanoids, lipoxins, leukotrienes and the n-HETE series of hydroxyeicosatetraenoic, in sensing the regulation of protective or damaging, anti- or pro-inflammatory, pathways following hazardous stimuli such as oxidative stress [47,343].
Bilirubin, already recalled in the above “Bioluminescence” section as the fluorophore responsible for the yellow bioluminescence of cryptic eels, can be also a fluorescing biomarker in blood and bile [344]. In fact, bilirubin behaves as a bichromophore because of its molecular structure composed by two asymmetrical dipyrroles covalently linked by a methylene group [345]. This feature is responsible for exciton energy transfer events inside the chromophore, in turn affected by the molecule concentration, excitation wavelength and microenvironment, which can remarkably influence bilirubin absorption, fluorescence and quantum yield [346,347,348]. As a consequence, the changes occurring in bilirubin fluorescence depending on its biological medium can be exploited as a marker of liver functionality in the maintenance of systemic metabolism [349]. Notably, the function of bilirubin as hormone has been also supported by reports taking advantage of the rising of bilirubin fluorescence upon binding to the nuclear peroxisome proliferator-activated receptor-α, one of the receptors involved in the regulatory of the transcription of genes controlling adiposity, opening interesting perspectives on its regulation roles in metabolic disorders [350]. The main fluorophores described in this section are summarized in Table 12.
8. Conclusions
The fluorescence and light related phenomena rising from many biochemical substrates and living beings are since a long-time deserving attention and stimulating efforts to improve the knowledge on underlying chemico-biophysical mechanisms and biological meaning, concurrently with the interlaced development of increasingly sophisticated technology for their detection and interpretation. This review provides notes from forcedly selected reports in the huge number of works dealing with autofluorescence and bioluminescence, aiming anyway to cover various and multifaceted issues to promote interest and awareness on their application fields and related implications, from environment and ecosystems for human health.
Funding
This research received no external funding.
Acknowledgments
I am particularly grateful to Giovanni Bottiroli, with whom I started my passionated studies on autofluorescence in biomedicine. Grateful thanks also to all our colleagues participating to our work, making possible investigations on different topics of this widespread field.
Conflicts of Interest
The author declares no conflict of interest.
References
- Acuña, A.U.; Amat-Guerri, F. Early History of Solution Fluorescence: The Lignum nephriticum of Nicolás Monardes. In Fluorescence of Supermolecules, Polymers, and Nanosystems; Berberan-Santos, M.N., Ed.; Springer: Berlin/Heidelberg, Germany, 2007; pp. 3–20. [Google Scholar]
- Stokes, G.G. On the Change of Refrangibility of Light. Philos. Trans. R. Soc. Lond. 1852, 142, 463–562. [Google Scholar] [CrossRef]
- Kasten, F.H. Cell Structure and Function by Microspectrofluorometry; Elsevier: New York, NY, USA, 1989; pp. 3–50. ISBN 9780124177604. [Google Scholar]
- Klein, G.; Linser, H. Fluoreszenzanalytische Untersuchungen an Pflanzen. Osterr. Bot. Z. 1930, 79, 125–163. [Google Scholar] [CrossRef]
- Larcher, W. Schnellmethode Zur Unterscheidung Lebender von Toten Zellen Mit Hilfe Der Eigenfluoreszenz Pflanzlicher Zellsäfte. Mikroskopic 1953, 8, 299–304. [Google Scholar]
- Oppenheimer, H.R.; Jacoby, B. Usefulness of Autofluorescence Tests as Criterion of Life in Plant Tissues. Protoplasma 1961, 53, 220–226. [Google Scholar] [CrossRef]
- Donaldson, L. Autofluorescence in Plants. Molecules 2020, 25, 2393. [Google Scholar] [CrossRef]
- Frederich, N.; Nysten, B.; Muls, B.; Hofkens, J.; Habib Jiwan, J.L.; Jonas, A.M. Nano-Patterned Layers of a Grafted Coumarinic Chromophore. Photochem. Photobiol. Sci. 2008, 7, 460–466. [Google Scholar] [CrossRef] [PubMed]
- Miller, J.N. Standards in Fluorescence Spectrometry: Ultraviolet Spectrometry Group; Chapman and Hall: London, UK, 1981; ISBN 9400959028. [Google Scholar]
- Lichtenthaler, H.K.; Buschmann, C. Chlorophylls and Carotenoids: Measurement and Characterization by UV-VIS Spectroscopy. Curr. Protoc. Food Anal. Chem. 2001, 1, F4.3.1–F4.3.8. [Google Scholar] [CrossRef]
- Ni, Z.; Lu, Q.; Huo, H.; Zhang, H. Estimation of Chlorophyll Fluorescence at Different Scales: A Review. Sensors 2019, 19, 3000. [Google Scholar] [CrossRef] [Green Version]
- Croce, A.C.; Santamaria, G.; de Simone, U.; Lucchini, F.; Freitas, I.; Bottiroli, G. Naturally-Occurring Porphyrins in a Spontaneous-Tumour Bearing Mouse Model. Photochem. Photobiol. Sci. 2011, 10, 1189–1195. [Google Scholar] [CrossRef]
- Lee, T.C.; Shih, T.H.; Huang, M.Y.; Lin, K.H.; Huang, W.D.; Yang, C.M. Eliminating Interference by Anthocyanins When Determining the Porphyrin Ratio of Red Plant Leaves. J. Photochem. Photobiol. B Biol. 2018, 187, 106–112. [Google Scholar] [CrossRef]
- Lightner, D.A. The Porphyrins; Academic Press: Cambridge, MA, USA, 1979; Volume 6, ISBN 9788578110796. [Google Scholar]
- Fălămas, A.; Porav, S.A.; Tosa, V. Investigations of the Energy Transfer in the Phycobilisome Antenna of Arthrospira Platensis Using Femtosecond Spectroscopy. Appl. Sci. 2020, 10, 4045. [Google Scholar] [CrossRef]
- Biswas, A.; Boutaghou, M.N.; Alvey, R.M.; Kronfel, C.M.; Cole, R.B.; Bryant, D.A.; Schluchter, W.M. Characterization of the Activities of the CpeY, CpeZ, and CpeS Bilin Lyases in Phycoerythrin Biosynthesis in Fremyella Diplosiphon Strain UTEX 481. J. Biol. Chem. 2011, 286, 35509–35521. [Google Scholar] [CrossRef] [PubMed] [Green Version]
- Croce, A.C.; Bottiroli, G. Autofluorescence Spectroscopy and Imaging: A Tool for Biomedical Research and Diagnosis. Eur. J. Histochem. 2014, 58, 320–337. [Google Scholar] [CrossRef] [Green Version]
- Tanaka, R.; Tanaka, A. Chlorophyll Cycle Regulates the Construction and Destruction of the Light-Harvesting Complexes. Biochim. Biophys. Acta Bioenerg. 2011, 1807, 968–976. [Google Scholar] [CrossRef] [PubMed] [Green Version]
- Zarco-Tejada, P.J.; Miller, J.R.; Mohammed, G.H.; Noland, T.L.; Sampson, P.H. Vegetation Stress Detection through Chlorophyll a + b Estimation and Fluorescence Effects on Hyperspectral Imagery. J. Environ. Qual. 2002, 31, 1433–1441. [Google Scholar] [CrossRef]
- Kalaji, H.M.; Jajoo, A.; Oukarroum, A.; Brestic, M.; Zivcak, M.; Samborska, I.A.; Cetner, M.D.; Lukasik, I.; Goltsev, V.; Ladle, R.J. Chlorophyll a Fluorescence as a Tool to Monitor Physiological Status of Plants under Abiotic Stress Conditions. Acta Physiol. Plant. 2016, 38, 102. [Google Scholar] [CrossRef] [Green Version]
- Lagorio, M.G.; Cordon, G.B.; Iriel, A. Reviewing the Relevance of Fluorescence in Biological Systems. Photochem. Photobiol. Sci. 2015, 14, 1538–1559. [Google Scholar] [CrossRef] [Green Version]
- Park, J.H.; Tran, L.H.; Jung, S. Perturbations in the Photosynthetic Pigment Status Result in Photooxidation-Induced Crosstalk between Carotenoid and Porphyrin Biosynthetic Pathways. Front. Plant Sci. 2017, 8. [Google Scholar] [CrossRef] [Green Version]
- Gillbro, T.; Cogdell, R.J. Carotenoid Fluorescence. Chem. Phys. Lett. 1989, 158, 312–316. [Google Scholar] [CrossRef]
- Chen, C.; Gong, N.; Li, Z.; Sun, C.; Men, Z. Concentration Effect on Quenching of Chlorophyll a Fluorescence by All-Trans-β-Carotene in Photosynthesis. Molecules 2017, 22, 1585. [Google Scholar] [CrossRef] [Green Version]
- Pérez-Bueno, M.L.; Pineda, M.; Barón, M. Phenotyping Plant Responses to Biotic Stress by Chlorophyll Fluorescence Imaging. Front. Plant Sci. 2019, 10. [Google Scholar] [CrossRef]
- Gitelson, A.; Solovchenko, A. Non-Invasive Quantification of Foliar Pigments: Possibilities and Limitations of Reflectance- and Absorbance-Based Approaches. J. Photochem. Photobiol. B Biol. 2018, 178, 537–544. [Google Scholar] [CrossRef] [PubMed]
- Ospina Calvo, B.; Lagorio, M.G. Quantitative Effects of Pigmentation on the Re-Absorption of Chlorophyll a Fluorescence and Energy Partitioning in Leaves. Photochem. Photobiol. 2019, 95, 1360–1368. [Google Scholar] [CrossRef]
- Shin, Y.K.; Bhandari, S.R.; Jo, J.S.; Song, J.W.; Cho, M.C.; Yang, E.Y.; Lee, J.G. Response to Salt Stress in Lettuce: Changes in Chlorophyll Fluorescence Parameters, Phytochemical Contents, and Antioxidant Activities. Agronomy 2020, 10, 1627. [Google Scholar] [CrossRef]
- Leiger, K.; Linnanto, J.M.; Freiberg, A. Establishment of the Qy Absorption Spectrum of Chlorophyll a Extending to Near-Infrared. Molecules 2020, 25, 3796. [Google Scholar] [CrossRef]
- Vass, I.; Turcsányi, E.; Touloupakis, E.; Ghanotakis, D.; Petrouleas, V. The Mechanism of UV-A Radiation-Induced Inhibition of Photosystem II Electron Transport Studied by EPR and Chlorophyll Fluorescence. Biochemistry 2002, 41, 10200–10208. [Google Scholar] [CrossRef]
- Kodama, Y.; Fujishima, M. Differences in Infectivity between Endosymbiotic Chlorella Variabilis Cultivated Outside Host Paramecium Bursaria for 50 Years and Those Immediately Isolated from Host Cells after One Year of Reendosymbiosis. Biol. Open 2016, 5, 55–61. [Google Scholar] [CrossRef] [Green Version]
- Belyaeva, O.B.; Litvin, F.F. Spectral Dependence of Chlorophyll Biosynthesis Pathways in Plant Leaves. Biochemistry 2015, 80, 1716–1722. [Google Scholar] [CrossRef]
- Jia, M.; Li, D.; Colombo, R.; Wang, Y.; Wang, X.; Cheng, T.; Zhu, Y.; Yao, X.; Xu, C.; Ouer, G.; et al. Quantifying Chlorophyll Fluorescence Parameters from Hyperspectral Reflectance at the Leaf Scale under Various Nitrogen Treatment Regimes in Winter Wheat. Remote. Sens. 2019, 11, 2838. [Google Scholar] [CrossRef] [Green Version]
- Belyaeva, O.B.; Litvin, F.F. Pathways of Formation of Pigment Forms at the Terminal Photobiochemical Stage of Chlorophyll Biosynthesis. Biochemistry 2009, 74, 1535–1544. [Google Scholar] [CrossRef]
- Kim, M.S.; McMurtrey, J.E.; Mulchi, C.L.; Daughtry, C.S.T.; Chappelle, E.W.; Chen, Y.-R. Steady-State Multispectral Fluorescence Imaging System for Plant Leaves. Appl. Opt. 2001, 40, 157. [Google Scholar] [CrossRef]
- Jacquemoud, S.; Baret, F. PROSPECT: A Model of Leaf Optical Properties Spectra. Remote. Sens. Environ. 1990, 34, 75–91. [Google Scholar] [CrossRef]
- Zubler, A.V.; Yoon, J.Y. Proximal Methods for Plant Stress Detection Using Optical Sensors and Machine Learning. Biosensors 2020, 10, 193. [Google Scholar] [CrossRef]
- Ko, S.S.; Jhong, C.M.; Shih, M.C. Blue Light Acclimation Reduces the Photoinhibition of Phalaenopsis Aphrodite (Moth Orchid). Int. J. Mol. Sci. 2020, 21, 6167. [Google Scholar] [CrossRef] [PubMed]
- Sonobe, R.; Yamashita, H.; Mihara, H.; Morita, A.; Ikka, T. Estimation of Leaf Chlorophyll a, b and Carotenoid Contents and Their Ratios Using Hyperspectral Reflectance. Remote. Sens. 2020, 12, 3265. [Google Scholar] [CrossRef]
- Agati, G.; Traversi, M.L.; Cerovic, Z.G. Chlorophyll Fluorescence Imaging for the Noninvasive Assessment of Anthocyanins in Whole Grape (Vitis Vinifera L.) Bunches. Photochem. Photobiol. 2008, 84, 1431–1434. [Google Scholar] [CrossRef] [PubMed]
- Montero, R.; Pérez-Bueno, M.L.; Barón, M.; Florez-Sarasa, I.; Tohge, T.; Fernie, A.R.; Ouad, H.E.; Flexas, J.; Bota, J. Alterations in Primary and Secondary Metabolism in Vitis Vinifera ‘Malvasía de Banyalbufar’ upon Infection with Grapevine Leafroll-Associated Virus 3. Physiol. Plant. 2016, 157, 442–452. [Google Scholar] [CrossRef] [PubMed]
- Kaniszewski, S.; Kowalski, A.; Dysko, J.; Agati, G. Application of a Combined Transmittance/Fluorescence Leaf Clip Sensor for the Nondestructive Determination of Nitrogen Status in White Cabbage Plants. Sensors 2021, 21, 482. [Google Scholar] [CrossRef]
- Janik-Zabrotowicz, E.; Arczewska, M.; Prochniewicz, P.; Swietlicka, I.; Terpilowski, K. Stability of Chlorophyll a Monomer Incorporated into Cremophor EL Nano-Micelles under Dark and Moderate Light Conditions. Molecules 2020, 25, 5059. [Google Scholar] [CrossRef]
- De Carvalho, A.G.A.; Olmo-García, L.; Gaspar, B.R.A.; Carrasco-Pancorbo, A.; Castelo-Branco, V.N.; Torres, A.G. Evaluating Quality Parameters, the Metabolic Profile, and Other Typical Features of Selected Commercial Extra Virgin Olive Oils from Brazil. Molecules 2020, 25, 4193. [Google Scholar] [CrossRef]
- Wang, H.; Wan, X. Effect of Chlorophyll Fluorescence Quenching on Quantitative Analysis of Adulteration in Extra Virgin Olive Oil. Spectrochim. Acta Part A Mol. Biomol. Spectrosc. 2021, 248. [Google Scholar] [CrossRef] [PubMed]
- Ali, H.; Saleem, M.; Anser, M.R.; Khan, S.; Ullah, R.; Bilal, M. Validation of Fluorescence Spectroscopy to Detect Adulteration of Edible Oil in Extra Virgin Olive Oil (EVOO) by Applying Chemometrics. Appl. Spectrosc. 2018, 72, 1371–1379. [Google Scholar] [CrossRef]
- Bottiroli, G.; Croce, A.C. Optical Biopsy: A Promising Approach for Real-Time Liver Steatosis Grading. Liver Int. 2009, 29. [Google Scholar] [CrossRef] [PubMed]
- Takahashi, T. Routine Management of Microalgae Using Autofluorescence from Chlorophyll. Molecules 2019, 24, 4441. [Google Scholar] [CrossRef] [PubMed] [Green Version]
- Salmi, P.; Eskelinen, M.A.; Leppänen, M.T.; Pölönen, I. Rapid Quantification of Microalgae Growth with Hyperspectral Camera and Vegetation Indices. Plants 2021, 10, 341. [Google Scholar] [CrossRef] [PubMed]
- Eseberri, I.; Gómez-Zorita, S.; Trepiana, J.; González-Arceo, M.; Aguirre, L.; Milton-Laskibar, I.; González, M.; Fernández-Quintela, A.; Portillo, M.P. Anti-Obesity Effects of Microalgae. Int. J. Mol. Sci. 2020, 21, 41. [Google Scholar] [CrossRef] [Green Version]
- Lee, M.K.; Lee, B.; Kim, C.Y. Natural Extracts That Stimulate Adipocyte Browning and Their Underlying Mechanisms. Antioxidants 2021, 10, 308. [Google Scholar] [CrossRef]
- Cho, J.A.; Baek, S.Y.; Cheong, S.H.; Kim, M.R. Spirulina Enhances Bone Modeling in Growing Male Rats by Regulating Growth-Related Hormones. Nutrients 2020, 12, 1187. [Google Scholar] [CrossRef]
- Seo, Y.J.; Kim, K.J.; Choi, J.; Koh, E.J.; Lee, B.Y. Spirulina Maxima Extract Reduces Obesity through Suppression of Adipogenesis and Activation of Browning in 3T3-L1 Cells and High-Fat Diet-Induced Obese Mice. Nutrients 2018, 10, 712. [Google Scholar] [CrossRef] [PubMed] [Green Version]
- Marzorati, S.; Schievano, A.; Idà, A.; Verotta, L. Carotenoids, Chlorophylls and Phycocyanin from Spirulina: Supercritical CO2 and Water Extraction Methods for Added Value Products Cascade. Green Chem. 2020, 22, 187–196. [Google Scholar] [CrossRef]
- Ramos-Romero, S.; Torrella, J.R.; Pagès, T.; Viscor, G.; Torres, J.L. Edible Microalgae and Their Bioactive Compounds in the Prevention and Treatment of Metabolic Alterations. Nutrients 2021, 13, 563. [Google Scholar] [CrossRef] [PubMed]
- Papalia, T.; Sidari, R.; Panuccio, M.R. Impact of Different Storage Methods on Bioactive Compounds in Arthrospira Platensis Biomass. Molecules 2019, 24, 2810. [Google Scholar] [CrossRef] [PubMed] [Green Version]
- Sonani, R.R. Recent Advances in Production, Purification and Applications of Phycobiliproteins. World J. Biol. Chem. 2016, 7, 100. [Google Scholar] [CrossRef] [PubMed]
- Eisenberg, I.; Caycedo-Soler, F.; Harris, D.; Yochelis, S.; Huelga, S.F.; Plenio, M.B.; Adir, N.; Keren, N.; Paltiel, Y. Regulating the Energy Flow in a Cyanobacterial Light-Harvesting Antenna Complex. J. Phys. Chem. B 2017, 121, 1240–1247. [Google Scholar] [CrossRef] [PubMed] [Green Version]
- Khalifa, S.A.M.; Shedid, E.S.; Saied, E.M.; Jassbi, A.R.; Jamebozorgi, F.H.; Rateb, M.E.; Du, M.; Abdel-Daim, M.M.; Kai, G.Y.; Al-Hammady, M.A.M.; et al. Cyanobacteria—From the Oceans to the Potential Biotechnological and Biomedical Applications. Mar. Drugs 2021, 19, 241. [Google Scholar] [CrossRef] [PubMed]
- Zhou, T.; Wang, J.; Zheng, H.; Wu, X.; Wang, Y.; Liu, M.; Xiang, S.; Cao, L.; Ruan, R.; Liu, Y. Characterization of Additional Zinc Ions on the Growth, Biochemical Composition and Photosynthetic Performance from Spirulina Platensis. Bioresour. Technol. 2018, 269, 285–291. [Google Scholar] [CrossRef] [PubMed]
- Celis-Plá, P.S.M.; Rodríguez-Rojas, F.; Méndez, L.; Moenne, F.; Muñoz, P.T.; Lobos, M.G.; Díaz, P.; Sánchez-Lizaso, J.L.; Brown, M.T.; Moenne, A.; et al. MAPK Pathway under Chronic Copper Excess in Green Macroalgae (Chlorophyta): Influence on Metal Exclusion/Extrusion Mechanisms and Photosynthesis. Int. J. Mol. Sci. 2019, 20, 4547. [Google Scholar] [CrossRef] [Green Version]
- Marcek Chorvatova, A.; Uherek, M.; Mateasik, A.; Chorvat, D. Time-Resolved Endogenous Chlorophyll Fluorescence Sensitivity to PH: Study on Chlorella Sp. Algae. Methods Appl. Fluoresc. 2020, 8. [Google Scholar] [CrossRef] [PubMed]
- Chen, B.; Dong, J.; Li, B.; Xue, C.; Tetteh, P.A.; Li, D.; Gao, K.; Deng, X. Using a Freshwater Green Alga Chlorella Pyrenoidosa to Evaluate the Biotoxicity of Ionic Liquids with Different Cations and Anions. Ecotoxicol. Environ. Saf. 2020, 198. [Google Scholar] [CrossRef]
- Ma, J.; Jin, S.; Li, J.; He, Y.; Shang, W. Spatio-Temporal Variations and Driving Forces of Harmful Algal Blooms in Chaohu Lake: A Multi-Source Remote Sensing Approach. Remote Sens. 2021, 13, 427. [Google Scholar] [CrossRef]
- Song, Y.; Wang, J.; Wang, L. Satellite Solar-Induced Chlorophyll Fluorescence Reveals Heat Stress Impacts on Wheat Yield in India. Remote Sens. 2020, 12, 3277. [Google Scholar] [CrossRef]
- Li, J.; Pei, Y.; Zhao, S.; Xiao, R.; Sang, X.; Zhang, C. A Review of Remote Sensing for Environmental Monitoring in China. Remote Sens. 2020, 12, 1130. [Google Scholar] [CrossRef] [Green Version]
- Rodríguez-Rojas, F.; Celis-Plá, P.S.M.; Méndez, L.; Moenne, F.; Muñoz, P.T.; Lobos, M.G.; Díaz, P.; Sánchez-Lizaso, J.L.; Brown, M.T.; Moenne, A.; et al. MAPK Pathway under Chronic Copper Excess in Green Macroalgae (Chlorophyta): Involvement in the Regulation of Detoxification Mechanisms. Int. J. Mol. Sci. 2019, 20, 4546. [Google Scholar] [CrossRef] [Green Version]
- Lattanzio, V. Phenolic compounds: Introduction. In Natural Products: Phytochemistry, Botany and Metabolism of Alkaloids, Phenolics and Terpenes; Springer: Berlin/Heidelberg, Germany, 2013; pp. 1543–1580. ISBN 9783642221446. [Google Scholar]
- Weston, L.A.; Mathesius, U. Flavonoids: Their Structure, Biosynthesis and Role in the Rhizosphere, Including Allelopathy. J. Chem. Ecol. 2013, 39, 283–297. [Google Scholar] [CrossRef]
- Cosme, P.; Rodríguez, A.B.; Espino, J.; Garrido, M. Plant Phenolics: Bioavailability as a Key Determinant of Their Potential Health-Promoting Applications. Antioxidants 2020, 9, 1263. [Google Scholar] [CrossRef]
- Mutha, R.E.; Tatiya, A.U.; Surana, S.J. Flavonoids as Natural Phenolic Compounds and Their Role in Therapeutics: An Overview. Future J. Pharm. Sci. 2021, 7. [Google Scholar] [CrossRef]
- Bravo, L. Polyphenols: Chemistry, Dietary Sources, Metabolism, and Nutritional Significance. Nutr. Rev. 1998, 56, 317–333. [Google Scholar] [CrossRef]
- Tanaka, Y.; Sasaki, N.; Ohmiya, A. Biosynthesis of Plant Pigments: Anthocyanins, Betalains and Carotenoids. Plant J. 2008, 54, 733–749. [Google Scholar] [CrossRef] [PubMed]
- Berland, H.; Albert, N.W.; Stavland, A.; Jordheim, M.; McGhie, T.K.; Zhou, Y.; Zhang, H.; Deroles, S.C.; Schwinn, K.E.; Jordan, B.R.; et al. Auronidins Are a Previously Unreported Class of Flavonoid Pigments that Challenges when Anthocyanin Biosynthesis Evolved in Plants. Proc. Natl. Acad. Sci. USA 2019, 116, 20232–20239. [Google Scholar] [CrossRef] [Green Version]
- Stavenga, D.G.; Leertouwer, H.L.; Dudek, B.; van der Kooi, C.J. Coloration of Flowers by Flavonoids and Consequences of PH Dependent Absorption. Front. Plant Sci. 2021, 11, 2148. [Google Scholar] [CrossRef] [PubMed]
- Noda, N.; Yoshioka, S.; Kishimoto, S.; Nakayama, M.; Douzono, M.; Tanaka, Y.; Aida, R. Generation of Blue Chrysanthemums by Anthocyanin B-Ring Hydroxylation and Glucosylation and Its Coloration Mechanism. Sci. Adv. 2017, 3, e1602785. [Google Scholar] [CrossRef] [Green Version]
- Noda, N. Recent Advances in the Research and Development of Blue Flowers. Breed. Sci. 2018, 68, 79–87. [Google Scholar] [CrossRef] [Green Version]
- Katsumoto, Y.; Fukuchi-Mizutani, M.; Fukui, Y.; Brugliera, F.; Holton, T.A.; Karan, M.; Nakamura, N.; Yonekura-Sakakibara, K.; Togami, J.; Pigeaire, A.; et al. Engineering of the Rose Flavonoid Biosynthetic Pathway Successfully Generated Blue-Hued Flowers Accumulating Delphinidin. Plant Cell Physiol. 2007, 48, 1589–1600. [Google Scholar] [CrossRef]
- Tanaka, Y.; Brugliera, F. Flower Colour and Cytochromes P450. Philos. Trans. R. Soc. B Biol. Sci. 2013, 368. [Google Scholar] [CrossRef] [PubMed] [Green Version]
- Mackon, E.; Ma, Y.; Jeazet Dongho Epse Mackon, G.C.; Li, Q.; Zhou, Q.; Liu, P. Subcellular Localization and Vesicular Structures of Anthocyanin Pigmentation by Fluorescence Imaging of Black Rice (Oryza Sativa L.) Stigma Protoplast. Plants 2021, 10, 685. [Google Scholar] [CrossRef] [PubMed]
- Gomez, C.; Conejero, G.; Torregrosa, L.; Cheynier, V.; Terrier, N.; Ageorges, A. In Vivo Grapevine Anthocyanin Transport Involves Vesicle-Mediated Trafficking and the Contribution of AnthoMATE Transporters and GST. Plant J. 2011, 67, 960–970. [Google Scholar] [CrossRef] [PubMed]
- Mbarki, S.; Sytar, O.; Zivcak, M.; Abdelly, C.; Cerda, A.; Brestic, M. Anthocyanins of Coloured Wheat Genotypes in Specific Response to Salstress. Molecules 2018, 23, 1518. [Google Scholar] [CrossRef] [Green Version]
- Wiltshire, E.J.; Eady, C.C.; Collings, D.A. Induction of Anthocyanin in the Inner Epidermis of Red Onion Leaves by Environmental Stimuli and Transient Expression of Transcription Factors. Plant Cell Rep. 2017, 36, 987–1000. [Google Scholar] [CrossRef]
- Agati, G.; Brunetti, C.; Di Ferdinando, M.; Ferrini, F.; Pollastri, S.; Tattini, M. Functional Roles of Flavonoids in Photoprotection: New Evidence, Lessons from the Past. Plant Physiol. Biochem. 2013, 72, 35–45. [Google Scholar] [CrossRef]
- Roshchina, V.; Shvirst, N.E.; Kuchin, A. The Autofluorescence Response of Flower Cells from Saintpaulia Ionantha as the Biosensor Reaction to Ozone. Comput. Biol. Bioinform. 2017, 4, 60–66. [Google Scholar] [CrossRef]
- Cisterna, B.; Boschi, F.; Croce, A.C.; Podda, R.; Zanzoni, S.; Degl’Innocenti, D.; Bernardi, P.; Costanzo, M.; Marzola, P.; Covi, V.; et al. Ozone Treatment of Grapes during Withering for Amarone Wine: A Multimodal Imaging and Spectroscopic Analysis. Microsc. Microanal. 2018, 24, 564–573. [Google Scholar] [CrossRef]
- Wu, X.; Gu, L.; Prior, R.L.; McKay, S. Characterization of Anthocyanins and Proanthocyanidins in Some Cultivars of Ribes, Aronia, and Sambucus and Their Antioxidant Capacity. J. Agric. Food Chem. 2004, 52, 7846–7856. [Google Scholar] [CrossRef]
- Khoo, H.E.; Azlan, A.; Tang, S.T.; Lim, S.M. Anthocyanidins and Anthocyanins: Colored Pigments as Food, Pharmaceutical Ingredients, and the Potential Health Benefits. Food Nutr. Res. 2017, 61. [Google Scholar] [CrossRef] [Green Version]
- Muleke, E.M.; Fan, L.; Wang, Y.; Xu, L.; Zhu, X.; Zhang, W.; Cao, Y.; Karanja, B.K.; Liu, L. Coordinated Regulation of Anthocyanin Biosynthesis Genes Confers Varied Phenotypic and Spatial-Temporal Anthocyanin Accumulation in Radish (Raphanus sativus L.). Front. Plant Sci. 2017, 8, 1243. [Google Scholar] [CrossRef] [Green Version]
- Moruzzi, M.; Klöting, N.; Blüher, M.; Martinelli, I.; Tayebati, S.K.; Gabrielli, M.G.; Roy, P.; Micioni Di Bonaventura, M.V.; Cifani, C.; Lupidi, G.; et al. Tart Cherry Juice and Seeds Affect Pro-Inflammatory Markers in Visceral Adipose Tissue of High-Fat Diet Obese Rats. Molecules 2021, 26, 1403. [Google Scholar] [CrossRef]
- Blando, F.; Marchello, S.; Maiorano, G.; Durante, M.; Signore, A.; Laus, M.N.; Soccio, M.; Mita, G. Bioactive Compounds and Antioxidant Capacity in Anthocyanin-Rich Carrots: A Comparison between the Black Carrot and the Apulian Landrace “Polignano” Carrot. Plants 2021, 10, 564. [Google Scholar] [CrossRef]
- Liang, Z.; Liang, H.; Guo, Y.; Yang, D. Cyanidin 3-o-galactoside: A Natural Compound with Multiple Health Benefits. Int. J. Mol. Sci. 2021, 22, 2261. [Google Scholar] [CrossRef] [PubMed]
- Vidot, K.; Devaux, M.F.; Alvarado, C.; Guyot, S.; Jamme, F.; Gaillard, C.; Siret, R.; Lahaye, M. Phenolic Distribution in Apple Epidermal and Outer Cortex Tissue by Multispectral Deep-UV Autofluorescence Cryo-Imaging. Plant Sci. 2019, 283, 51–59. [Google Scholar] [CrossRef] [PubMed]
- Scalisi, A.; Pelliccia, D.; O’Connell, M.G. Maturity Prediction in Yellow Peach (Prunus Persica L.) Cultivars Using a Fluorescence Spectrometer. Sensors 2020, 20, 6555. [Google Scholar] [CrossRef]
- Agati, G.; Matteini, P.; Oliveira, J.; De Freitas, V.; Mateus, N. Fluorescence Approach for Measuring Anthocyanins and Derived Pigments in Red Wine. J. Agric. Food Chem. 2013, 61, 10156–10162. [Google Scholar] [CrossRef] [PubMed]
- Tuccio, L.; Cavigli, L.; Rossi, F.; Dichala, O.; Katsogiannos, F.; Kalfas, I.; Agati, G. Fluorescence-Sensor Mapping for the in Vineyard Non-Destructive Assessment of Crimson Seedless Table Grape Quality. Sensors 2020, 20, 983. [Google Scholar] [CrossRef] [PubMed] [Green Version]
- Sytar, O.; Zivcak, M.; Neugart, S.; Brestic, M. Assessment of Hyperspectral Indicators Related to the Content of Phenolic Compounds and Multispectral Fluorescence Records in Chicory Leaves Exposed to Various Light Environments. Plant Physiol. Biochem. 2020, 154, 429–438. [Google Scholar] [CrossRef]
- Zivcak, M.; Brückova, K.; Sytar, O.; Brestic, M.; Olsovska, K.; Allakhverdiev, S.I. Lettuce Flavonoids Screening and Phenotyping by Chlorophyll Fluorescence Excitation Ratio. Planta 2017, 245, 1215–1229. [Google Scholar] [CrossRef] [PubMed]
- Ren, S.; Monica Giusti, M. Monitoring the Interaction between Thermally Induced Whey Protein and Anthocyanin by Fluorescence Quenching Spectroscopy. Foods 2021, 10, 310. [Google Scholar] [CrossRef]
- Grigore-Gurgu, L.; Crăciunescu, O.; Aprodu, I.; Bolea, C.A.; Iosăgeanu, A.; Petre, B.A.; Bahrim, G.E.; Oancea, A.; Stănciuc, N. Tailoring the Health-Promoting Potential of Protein Hydrolysate Derived from Fish Wastes and Flavonoids from Yellow Onion Skins: From Binding Mechanisms to Microencapsulated Functional Ingredients. Biomolecules 2020, 10, 1416. [Google Scholar] [CrossRef] [PubMed]
- Cortez, R.; Luna-Vital, D.A.; Margulis, D.; Gonzalez de Mejia, E. Natural Pigments: Stabilization Methods of Anthocyanins for Food Applications. Compr. Rev. Food Sci. Food Saf. 2017, 16, 180–198. [Google Scholar] [CrossRef]
- Vergara, C.; Pino, M.T.; Zamora, O.; Parada, J.; Pérez, R.; Uribe, M.; Kalazich, J. Microencapsulation of Anthocyanin Extracted from Purple Flesh Cultivated Potatoes by Spray Drying and Its Effects on in Vitro Gastrointestinal Digestion. Molecules 2020, 25, 722. [Google Scholar] [CrossRef] [Green Version]
- Miguel, M.G. Betalains in Some Species of the Amaranthaceae Family: A Review. Antioxidants 2018, 7, 53. [Google Scholar] [CrossRef] [Green Version]
- Nirmal, N.P.; Mereddy, R.; Maqsood, S. Recent Developments in Emerging Technologies for Beetroot Pigment Extraction and Its Food Applications. Food Chem. 2021, 356. [Google Scholar] [CrossRef]
- Guerrero-Rubio, M.A.; Escribano, J.; García-Carmona, F.; Gandía-Herrero, F. Light Emission in Betalains: From Fluorescent Flowers to Biotechnological Applications. Trends Plant Sci. 2020, 25, 159–175. [Google Scholar] [CrossRef] [PubMed] [Green Version]
- Gandía-Herrero, F.; García-Carmona, F.; Escribano, J. Botany: Floral Fluorescence Effect. Nature 2005, 437, 334. [Google Scholar] [CrossRef]
- Harris, N.N.; Javellana, J.; Davies, K.M.; Lewis, D.H.; Jameson, P.E.; Deroles, S.C.; Calcott, K.E.; Gould, K.S.; Schwinn, K.E. Betalain Production Is Possible in Anthocyanin-Producing Plant Species given the Presence of DOPA-Dioxygenase and L-DOPA. BMC Plant Biol. 2012, 12. [Google Scholar] [CrossRef] [Green Version]
- Polturak, G.; Grossman, N.; Vela-Corcia, D.; Dong, Y.; Nudel, A.; Pliner, M.; Levy, M.; Rogachev, I.; Aharoni, A. Engineered Gray Mold Resistance, Antioxidant Capacity, and Pigmentation in Betalain-Producing Crops and Ornamentals. Proc. Natl. Acad. Sci. USA 2017, 114, 9062–9067. [Google Scholar] [CrossRef] [PubMed] [Green Version]
- Monago-Maraña, O.; Durán-Merás, I.; Galeano-Díaz, T.; Muñoz De La Peña, A. Fluorescence Properties of Flavonoid Compounds. Quantification in Paprika Samples Using Spectrofluorimetry Coupled to Second Order Chemometric Tools. Food Chem. 2016, 196, 1058–1065. [Google Scholar] [CrossRef]
- Ruoff, K.; Karoui, R.; Dufour, E.; Luginbbuhl, W.; Bosset, J.O.; Bogdanov, S.; Amado, R. Authentication of the Botanical Origin of Honey by Front-Face Fluorescence Spectroscopy: A Preliminary Study. J. Agric. Food Chem. 2005, 53, 1343–1347. [Google Scholar] [CrossRef] [PubMed]
- Barbieri, D.; Gabriele, M.; Summa, M.; Colosimo, R.; Leonardi, D.; Domenici, V.; Pucci, L. Antioxidant, Nutraceutical Properties, and Fluorescence Spectral Profiles of Bee Pollen Samples from Different Botanical Origins. Antioxidants 2020, 9, 1001. [Google Scholar] [CrossRef] [PubMed]
- Mori, S.; Fukui, H.; Oishi, M.; Sakuma, M.; Kawakami, M.; Tsukioka, J.; Goto, K.; Hirai, N. Biocommunication between Plants and Pollinating Insects through Fluorescence of Pollen and Anthers. J. Chem. Ecol. 2018, 44, 591–600. [Google Scholar] [CrossRef] [Green Version]
- Kurup, R.; Johnson, A.J.; Sankar, S.; Hussain, A.A.; Kumar, C.S.; Sabulal, B. Fluorescent Prey Traps in Carnivorous Plants. Plant Biol. 2013, 15, 611–615. [Google Scholar] [CrossRef]
- Bark, K.M.; Yeom, J.E.; Yang, J.I.; Yang, I.J.; Park, C.H.; Park, H.R. Spectroscopic Studies on the Oxidation of Catechin in Aqueous Solution. Bull. Korean Chem. Soc. 2011, 32, 3443–3447. [Google Scholar] [CrossRef] [Green Version]
- Park, J.E.; Kim, T.E.; Shin, K.H. Quantitative Analysis of Four Catechins from Green Tea Extract in Human Plasma Using Ultra-Performance Liquid Chromatography-Tandem Mass Spectrometry for Pharmacokinetic Studies. Molecules 2018, 23, 984. [Google Scholar] [CrossRef] [PubMed] [Green Version]
- Casale, M.; Pasquini, B.; Hooshyari, M.; Orlandini, S.; Mustorgi, E.; Malegori, C.; Turrini, F.; Ortiz, M.C.; Sarabia, L.A.; Furlanetto, S. Combining Excitation-Emission Matrix Fluorescence Spectroscopy, Parallel Factor Analysis, Cyclodextrin-Modified Micellar Electrokinetic Chromatography and Partial Least Squares Class-Modelling for Green Tea Characterization. J. Pharm. Biomed. Anal. 2018, 159, 311–317. [Google Scholar] [CrossRef]
- Du, C.; Ma, C.; Gu, J.; Li, L.; Zhu, C.; Chen, L.; Wang, T.; Chen, G. Rapid Determination of Catechin Content in Black Tea by Fluorescence Spectroscopy. J. Spectrosc. 2020, 2020. [Google Scholar] [CrossRef]
- Karamac, M.; Koleva, L.; Kancheva, V.D.; Amarowicz, R. The Structure-Antioxidant Activity Relationship of Ferulates. Molecules 2017, 22, 527. [Google Scholar] [CrossRef] [Green Version]
- Donaldson, L.; Williams, N. Imaging and Spectroscopy of Natural Fluorophores in Pine Needles. Plants 2018, 7, 10. [Google Scholar] [CrossRef] [PubMed] [Green Version]
- Atta, B.M.; Saleem, M.; Ali, H.; Bilal, M.; Fayyaz, M. Application of Fluorescence Spectroscopy in Wheat Crop: Early Disease Detection and Associated Molecular Changes. J. Fluoresc. 2020, 30, 801–810. [Google Scholar] [CrossRef]
- Bowers, A.G. Phytophotodermatitis. Am. J. Contact Dermat. 1999, 10, 89–93. [Google Scholar] [CrossRef]
- Pereira, T.M.; Franco, D.P.; Vitorio, F.; Kummerle, A.E. Coumarin Compounds in Medicinal Chemistry: Some Important Examples from the Last Years. Curr. Top. Med. Chem. 2018, 18, 124–148. [Google Scholar] [CrossRef]
- Wozniak, L.; Połaska, M.; Marszalek, K.; Skapska, S. Photosensitizing Furocoumarins: Content in Plant Matrices and Kinetics of Supercritical Carbon Dioxide Extraction. Molecules 2020, 25, 3805. [Google Scholar] [CrossRef] [PubMed]
- Donaldson, L.; Radotić, K.; Kalauzi, A.; Djikanović, D.; Jeremić, M. Quantification of Compression Wood Severity in Tracheids of Pinus Radiata Using Confocal Fluorescence Imaging and Spectral Deconvolution. J. Struct. Biol. 2010, 169, 106–115. [Google Scholar] [CrossRef] [PubMed]
- Malachowska, E.; Dubowik, M.; Boruszewski, P.; Lojewska, J.; Przybysz, P. Influence of Lignin Content in Cellulose Pulp on Paper Durability. Sci. Rep. 2020, 10. [Google Scholar] [CrossRef]
- Tribot, A.; Amer, G.; Abdou Alio, M.; de Baynast, H.; Delattre, C.; Pons, A.; Mathias, J.D.; Callois, J.M.; Vial, C.; Michaud, P.; et al. Wood-Lignin: Supply, Extraction Processes and Use as Bio-Based Material. Eur. Polym. J. 2019, 112, 228–240. [Google Scholar] [CrossRef]
- Auxenfans, T.; Terryn, C.; Paës, G. Seeing Biomass Recalcitrance through Fluorescence. Sci. Rep. 2017, 7. [Google Scholar] [CrossRef] [Green Version]
- Giusti, M.M.; Wrolstad, R.E. Characterization and Measurement of Anthocyanins by UV-Visible Spectroscopy. Curr. Protoc. Food Anal. Chem. 2001, F1.2.1–F1.2.13. [Google Scholar] [CrossRef]
- Donovalová, J.; Cigáň, M.; Stankovičová, H.; Gašpar, J.; Danko, M.; Gáplovský, A.; Hrdlovič, P. Spectral Properties of Substituted Coumarins in Solution and Polymer Matrices. Molecules 2012, 17, 3259–3276. [Google Scholar] [CrossRef]
- Gandía-Herrero, F.; Escribano, J.; García-Carmona, F. Betaxanthins as Pigments Responsible for Visible Fluorescence in Flowers. Planta 2005, 222, 586–593. [Google Scholar] [CrossRef] [PubMed]
- Gandía-Herrero, F.; García-Carmona, F.; Escribano, J. A Novel Method Using High-Performance Liquid Chromatography with Fluorescence Detection for the Determination of Betaxanthins. J. Chromatogr. A 2005, 1078, 83–89. [Google Scholar] [CrossRef] [PubMed]
- Rainsford, K.D.; Parke, A.L.; Clifford-Rashotte, M.; Kean, W.F. Therapy and Pharmacological Properties of Hydroxychloroquine and Chloroquine in Treatment of Systemic Lupus Erythematosus, Rheumatoid Arthritis and Related Diseases. Inflammopharmacology 2015, 23, 231–269. [Google Scholar] [CrossRef]
- Achan, J.; Talisuna, A.O.; Erhart, A.; Yeka, A.; Tibenderana, J.K.; Baliraine, F.N.; Rosenthal, P.J.; D’Alessandro, U. Quinine, an Old Anti-Malarial Drug in a Modern World: Role in the Treatment of Malaria. Malar. J. 2011, 10, 1–12. [Google Scholar] [CrossRef] [PubMed] [Green Version]
- Liles, N.W.; Page, E.E.; Liles, A.L.; Vesely, S.K.; Raskob, G.E.; George, J.N. Diversity and Severity of Adverse Reactions to Quinine: A Systematic Review. Am. J. Hematol. 2016, 91, 461–466. [Google Scholar] [CrossRef] [PubMed] [Green Version]
- Croce, A.C.; Bottiroli, G.; Supino, R.; Favini, E.; Zuco, V.; Zunino, F. Subcellular Localization of the Camptothecin Analogues, Topotecan and Gimatecan. Biochem. Pharmacol. 2004, 67, 1035–1045. [Google Scholar] [CrossRef]
- Guamán Ortiz, L.M.; Croce, A.L.; Aredia, F.; Sapienza, S.; Fiorillo, G.; Syeda, T.M.; Buzzetti, F.; Lombardi, P.; Scovassi, A.I. Effect of New Berberine Derivatives on Colon Cancer Cells. Acta Biochim. Biophys. Sin. 2015, 47, 824–833. [Google Scholar] [CrossRef] [Green Version]
- Muniyandi, K.; George, B.; Parimelazhagan, T.; Abrahamse, H. Role of Photoactive Phytocompounds in Photodynamic Therapy of Cancer. Molecules 2020, 25, 4102. [Google Scholar] [CrossRef]
- Raizman, R.; Little, W.; Smith, A.C. Rapid Diagnosis of Pseudomonas aeruginosa in Wounds with Point-Of-Care Fluorescence Imaing. Diagnostics 2021, 11, 280. [Google Scholar] [CrossRef]
- Hurley, C.M.; McClusky, P.; Sugrue, R.M.; Clover, J.A.; Kelly, J.E. Efficacy of a Bacterial Fluorescence Imaging Device in an Outpatient Wound Care Clinic: A Pilot Study. J. Wound Care 2019, 28, 438–443. [Google Scholar] [CrossRef]
- Stiehl, J.B. Bacterial Autofluorescence Digital Imaging Guides Treatment in Stage 4 Pelvic Pressure Injuries: A Preliminary Case Series. Diagnostics 2021, 11, 839. [Google Scholar] [CrossRef]
- Baird, F.J.; Wadsworth, M.P.; Hill, J.E. Evaluation and Optimization of Multiple Fluorophore Analysis of a Pseudomonas Aeruginosa Biofilm. J. Microbiol. Methods 2012, 90, 192–196. [Google Scholar] [CrossRef] [Green Version]
- Lee, W.L.S.; Shalita, A.R.; Poh-Fitzpatrick, M.B. Comparative Studies of Porphyrin Production in Propionibacterium Acnes and Propionibacterium Granulosum. J. Bacteriol. 1978, 133, 811–815. [Google Scholar] [CrossRef] [Green Version]
- König, K.; Meyer, H.; Schneckenburger, H.; Rück, A. The Study of Endogenous Porphyrins in Human Skin and Their Potential for Photodynamic Therapy by Laser Induced Fluorescence Spectroscopy. Lasers Med Sci. 1993, 8, 127–132. [Google Scholar] [CrossRef]
- Ashkenazi, H.; Malik, Z.; Harth, Y.; Nitzan, Y. Eradication of Propionibacterium Acnes by Its Endogenic Porphyrins after Illumination with High Intensity Blue Light. FEMS Immunol. Med Microbiol. 2003, 35, 17–24. [Google Scholar] [CrossRef] [Green Version]
- Lennon, A.M.; Buchalla, W.; Brune, L.; Zimmermann, O.; Gross, U.; Attin, T. The Ability of Selected Oral Microorganisms to Emit Red Fluorescence. Caries 2005, 40, 2–5. [Google Scholar] [CrossRef]
- König, K.; Flemming, G.; Hibst, R. Laser-Induced Autofluorescence Spectroscopy of Dental Caries. Cell. Mol. Biol. 1998, 44, 1293–1300. [Google Scholar] [PubMed]
- Kang, S.M.; de Josselin de Jong, E.; Higham, S.M.; Hope, C.K.; Kim, B. Il Fluorescence Fingerprints of Oral Bacteria. J. Biophotonics 2020, 13. [Google Scholar] [CrossRef]
- Dartnell, L.R.; Roberts, T.A.; Moore, G.; Ward, J.M.; Muller, J.-P. Fluorescence Characterization of Clinically-Important Bacteria. PLoS ONE 2013, 8, e75270. [Google Scholar] [CrossRef] [Green Version]
- Ammor, M.S. Recent Advances in the Use of Intrinsic Fluorescence for Bacterial Identification and Characterization. J. Fluoresc. 2007, 17, 455–459. [Google Scholar] [CrossRef] [PubMed]
- Sohn, M.; Himmelsbach, D.S.; Barton, F.E.; Fedorka-Cray, P.J. Fluorescence Spectroscopy for Rapid Detection and Classification of Bacterial Pathogens. Appl. Spectrosc. 2009, 63, 1251–1255. [Google Scholar] [CrossRef]
- Li, W.H.; Sheng, G.P.; Liu, X.W.; Yu, H.Q. Characterizing the Extracellular and Intracellular Fluorescent Products of Activated Sludge in a Sequencing Batch Reactor. Water Res. 2008, 42, 3173–3181. [Google Scholar] [CrossRef]
- Tian, J.H.; Yan, C.; Nasir, Z.A.; Alcega, S.G.; Tyrrel, S.; Coulon, F. Real Time Detection and Characterisation of Bioaerosol Emissions from Wastewater Treatment Plants. Sci. Total. Environ. 2020, 721. [Google Scholar] [CrossRef]
- Chen, W.J.; Kuo, T.Y.; Hsieh, F.C.; Chen, P.Y.; Wang, C.S.; Shih, Y.L.; Lai, Y.M.; Liu, J.R.; Yang, Y.L.; Shih, M.C. Involvement of Type VI Secretion System in Secretion of Iron Chelator Pyoverdine in Pseudomonas taiwanensis. Sci. Rep. 2016, 6. [Google Scholar] [CrossRef] [Green Version]
- Knaus, H.; Blab, G.A.; Jerre van Veluw, G.; Gerritsen, H.C.; Wösten, H.A.B. Label-Free Fluorescence Microscopy in Fungi. Fungal Biol. Rev. 2013, 27, 60–66. [Google Scholar] [CrossRef]
- Lin, S.J.; Tan, H.Y.; Kuo, C.J.; Wu, R.J.; Wang, S.H.; Chen, W.L.; Jee, S.H.; Dong, C.Y. Multiphoton Autofluorescence Spectral Analysis for Fungus Imaging and Identification. Appl. Phys. Lett. 2009, 95, 43703. [Google Scholar] [CrossRef]
- Arcangeli, C.; Yu, W.; Cannistraro, S.; Gratton, E. Two-Photon Autofluorescence Microscopy and Spectroscopy of Antarctic Fungus: New Approach for Studying Effects of UV-B Irradiation. Biopolym. Biospectrosc. Sect. 2000, 57, 218–225. [Google Scholar] [CrossRef] [Green Version]
- Graus, M.S.; Neumann, A.K.; Timlin, J.A. Hyperspectral Fluorescence Microscopy Detects Autofluorescent Factors That Can Be Exploited as a Diagnostic Method for Candida Species Differentiation. J. Biomed. Opt. 2017, 22, 016002. [Google Scholar] [CrossRef] [Green Version]
- Knaus, H.; Blab, G.A.; Agronskaia, A.V.; van den Heuvel, D.J.; Gerritsen, H.C.; Wösten, H.A.B. Monitoring the Metabolic State of Fungal Hyphae and the Presence of Melanin by Nonlinear Spectral Imaging. Appl. Environ. Microbiol. 2013, 79, 6345–6350. [Google Scholar] [CrossRef] [PubMed] [Green Version]
- Jordá, T.; Puig, S. Regulation of Ergosterol Biosynthesis in Saccharomyces cerevisiae. Genes 2020, 11, 795. [Google Scholar] [CrossRef]
- Mansoldo, F.R.P.; Firpo, R.; da Cardoso, V.S.; Queiroz, G.N.; Cedrola, S.M.L.; de Godoy, M.G.; Vermelho, A.B. New Method for Rapid Identification and Quantification of Fungal Biomass Using Ergosterol Autofluorescence. Talanta 2020, 219, 121238. [Google Scholar] [CrossRef]
- Reismann, A.W.A.F.; Atanasova, L.; Zeilinger, S.; Schütz, G.J. Single-Molecule Localization Microscopy to Study Protein Organization in the Filamentous Fungus Trichoderma atroviride. Molecules 2020, 25, 3199. [Google Scholar] [CrossRef]
- Margo, C.E.; Bombardier, T. The Diagnostic Value of Fungal Autofluorescence. Surv. Ophthalmol. 1985, 29, 374–376. [Google Scholar] [CrossRef]
- Chua, S.C.J.H.; Tan, H.Q.; Engelberg, D.; Lim, L.H.K. Alternative Experimental Models for Studying Influenza Proteins, Host-Virus Interactions and Anti-Influenza Drugs. Pharmaceuticals 2019, 12, 147. [Google Scholar] [CrossRef]
- Zhao, R.Y. Yeast for Virus Research. Microb. Cell 2017, 4, 311–330. [Google Scholar] [CrossRef] [Green Version]
- Lloyd, D.; Murray, D.B.; Aon, M.A.; Cortassa, S.; Roussel, M.R.; Beckmann, M.; Poole, R.K. Temporal Metabolic Partitioning of the Yeast and Protist Cellular Networks: The Cell Is a Global Scale-Invariant (Fractal or Self-Similar) Multioscillator. J. Biomed. Opt. 2018, 24, 1. [Google Scholar] [CrossRef]
- Maltas, J.; Amer, L.; Long, Z.; Palo, D.; Oliva, A.; Folz, J.; Urayama, P. Autofluorescence from NADH Conformations Associated with Different Metabolic Pathways Monitored Using Nanosecond-Gated Spectroscopy and Spectral Phasor Analysis. Anal. Chem. 2015. [Google Scholar] [CrossRef]
- Duysens, L.N.M.; Kronenberg, G.H.M. The Fluorescence Spectrum of the Complex of Reduced Phosphopyridine Nucleotide and Alcohol Dehydrogenase from Yeast. Biochim. Biophys. Acta 1957, 26, 437–438. [Google Scholar] [CrossRef]
- Chance, B.; Thorell, B. Localization and Kinetics of Reduced Pyridine Nucleotide in Living Cells by Microfluorometry. J. Biol. Chem. 1959, 234, 3044–3050. [Google Scholar] [CrossRef]
- Chance, B.; Ernster, L.; Garland, P.B.; Lee, C.P.; Light, P.A.; Ohnishi, T.; Ragan, C.I.; Wong, D. Flavoproteins of the Mitochondrial Respiratory Chain. Proc. Natl. Acad. of Sci. USA 1967, 57, 1498–1505. [Google Scholar] [CrossRef] [Green Version]
- Mayevsky, A.; Rogatsky, G.G. Mitochondrial Function In Vivo Evaluated by NADH Fluorescence: From Animal Models to Human Studies. Am. J. Physiol. Cell Physiol. 2007, 292. [Google Scholar] [CrossRef]
- Mayevsky, A.; Barbiro-Michaely, E. Shedding Light on Mitochondrial Function by Real Time Monitoring of NADH Fluorescence: II: Human Studies. J. Clin. Monit. Comput. 2013, 27, 125–145. [Google Scholar] [CrossRef]
- Mayevsky, A.; Walden, R.; Pewzner, E.; Deutsch, A.; Heldenberg, E.; Lavee, J.; Tager, S.; Kachel, E.; Raanani, E.; Preisman, S.; et al. Mitochondrial Function and Tissue Vitality: Bench-to-Bedside Real-Time Optical Monitoring System. J. Biomed. Opt. 2011, 16, 067004. [Google Scholar] [CrossRef] [Green Version]
- Blacker, T.S.; Duchen, M.R. Investigating Mitochondrial Redox State Using NADH and NADPH Autofluorescence. Free Radic. Biol. Med. 2016, 100, 53–65. [Google Scholar] [CrossRef] [Green Version]
- Chance, B.; Estabrook, R.W.; Ghosh, A. Damped Sinusoidal Oscillatons of Cytoplasmic Reduced Pyridine. Proc. Natl. Acad. Sci. USA 1964, 51, 1244–1251. [Google Scholar] [CrossRef] [Green Version]
- Mochan, E.; Pye, E.K. Respiratory Oscillations in Adapting Yeast Cultures. Nat. New Biol. 1973, 242, 177–179. [Google Scholar] [CrossRef] [PubMed]
- Lloyd, D.; Cortassa, S.; O’Rourke, B.; Aon, M.A. What Yeast and Cardiomyocytes Share: Ultradian Oscillatory Redox Mechanisms of Cellular Coherence and Survival. Integr. Biol. 2012, 4, 65–74. [Google Scholar] [CrossRef]
- Chance, B.; Thorell, B. Fluorescence Measurements of Mitochondrial Pyridine Nucleotide in Aerobiosis and Anaerobiosis. Nature 1959, 184, 931–934. [Google Scholar] [CrossRef]
- Cockayne, E.A.I. The Distribution of Fluorescent Pigments in Lepidoptera. Trans. R. Entomol. Soc. Lond. 1924, 72, 1–19. [Google Scholar] [CrossRef]
- Franceschini, N.; Kirschfeld, K.; Minke, B. Fluorescence of Photoreceptor Cells Observed in Vivo. Science 1981, 213, 1264–1267. [Google Scholar] [CrossRef] [PubMed]
- Rost, F.W.D.; Hales, D.F. Fluorescent Markings in Some Australian Butterflies. Aust. Entomol. Mag. 1988, 15, 91–94. [Google Scholar]
- Kumazawa, K.; Tabata, H. A Three-Dimensional Fluorescence Analysis of the Wings of Male Morpho Sulkowskyi and Papilio Xuthus Butterflies. Zool. Sci. 2001, 18, 1073–1079. [Google Scholar] [CrossRef]
- Umebachi, Y. Yellow Pigments in the Wings of Papilio Xuthus (Papilionid Butterfly). Acta Vitaminol. Enzymol. 1975, 29, 219–222. [Google Scholar] [PubMed]
- Wilts, B.D.; Trzeciak, T.M.; Vukusic, P.; Stavenga, D.G. Papiliochrome II Pigment Reduces the Angle Dependency of Structural Wing Colouration in Nireus Group Papilionids. J. Exp. Biol. 2012, 215, 796–805. [Google Scholar] [CrossRef] [Green Version]
- Wilts, B.D.; Ijbema, N.; Stavenga, D.G. Pigmentary and Photonic Coloration Mechanisms Reveal Taxonomic Relationships of the Cattlehearts (Lepidoptera: Papilionidae: Parides). BMC Evol. Biol. 2014, 14. [Google Scholar] [CrossRef] [PubMed] [Green Version]
- Vigneron, J.P.; Kertész, K.; Vértesy, Z.; Rassart, M.; Lousse, V.; Bálint, Z.; Biró, L.P. Correlated Diffraction and Fluorescence in the Backscattering Iridescence of the Male Butterfly Troides Magellanus (Papilionidae). Phys. Rev. E 2008, 78, 021903. [Google Scholar] [CrossRef] [Green Version]
- De Vidal, B.C. Butterfly Scale Form Birefringence Related to Photonics. Micron 2011, 42, 801–807. [Google Scholar] [CrossRef]
- Zobl, S.; Wilts, B.D.; Salvenmoser, W.; Pölt, P.; Gebeshuber, I.C.; Schwerte, T. Orientation-Dependent Reflection of Structurally Coloured Butterflies. Biomimetics 2020, 5, 5. [Google Scholar] [CrossRef] [PubMed] [Green Version]
- Thayer, R.C.; Allen, F.I.; Patel, N.H. Structural Color in Junonia Butterflies Evolves by Tuning Scale Lamina Thickness. eLife 2020, 9. [Google Scholar] [CrossRef] [PubMed]
- Wilts, B.D.; Matsushita, A.; Arikawa, K.; Stavenga, D.G. Spectrally Tuned Structural and Pigmentary Coloration of Birdwing Butterfly Wing Scales. J. R. Soc. Interface 2015, 12. [Google Scholar] [CrossRef] [Green Version]
- Chen, X.; Guo, Q.; Chen, W.; Xie, W.; Wang, Y.; Wang, M.; You, T.; Pan, G. Biomimetic Design of Photonic Materials for Biomedical Applications. Acta Biomater. 2021, 121, 143–179. [Google Scholar] [CrossRef]
- Mouchet, S.R.; Tabarrant, T.; Lucas, S.; Su, B.-L.; Vukusic, P.; Deparis, O. Vapor Sensing with a Natural Photonic Cell. Opt. Express 2016, 24, 12267. [Google Scholar] [CrossRef]
- Mouchet, S.R.; van Hooijdonk, E.; Welch, V.L.; Louette, P.; Colomer, J.F.; Su, B.L.; Deparis, O. Liquid-Induced Colour Change in a Beetle: The Concept of a Photonic Cell. Sci. Rep. 2016, 6, 19322. [Google Scholar] [CrossRef] [PubMed] [Green Version]
- Mouchet, S.R.; Verstraete, C.; Mara, D.; Van Cleuvenbergen, S.; Finlayson, E.D.; Van Deun, R.; Deparis, O.; Verbiest, T.; Maes, B.; Vukusic, P.; et al. Nonlinear Optical Spectroscopy and Two-Photon Excited Fluorescence Spectroscopy Reveal the Excited States of Fluorophores Embedded in a Beetle’s Elytra. Interface Focus 2019, 9. [Google Scholar] [CrossRef] [PubMed] [Green Version]
- Andersen, S.O.; Weis-Fogh, T. Resilin. A Rubberlike Protein in Arthropod Cuticle. Adv. Insect Physiol. 1964, 2, 1–65. [Google Scholar] [CrossRef]
- Michels, J.; Gorb, S.N. Detailed Three-Dimensional Visualization of Resilin in the Exoskeleton of Arthropods Using Confocal Laser Scanning Microscopy. J. Microsc. 2012, 245, 1–16. [Google Scholar] [CrossRef]
- Büsse, S.; Gorb, S.N. Material Composition of the Mouthpart Cuticle in a Damselfly Larva (Insecta: Odonata) and Its Biomechanical Significance. R. Soc. Open Sci. 2018, 5. [Google Scholar] [CrossRef] [Green Version]
- Bäumler, F.; Gorb, S.N.; Büsse, S. Comparative Morphology of the Thorax Musculature of Adult Anisoptera (Insecta: Odonata): Functional Aspects of the Flight Apparatus. Arthropod Struct. Dev. 2018, 47, 430–441. [Google Scholar] [CrossRef] [PubMed]
- Bäumler, F.; Büsse, S. Resilin in the Flight Apparatus of Odonata (Insecta)-Cap Tendons and Their Biomechanical Importance for Flight. Biol. Lett. 2019, 15. [Google Scholar] [CrossRef] [PubMed] [Green Version]
- Pentzold, S.; Marion-Poll, F.; Grabe, V.; Burse, A. Autofluorescence-Based Identification and Functional Validation of Antennal Gustatory Sensilla in a Specialist Leaf Beetle. Front. Physiol. 2019, 10. [Google Scholar] [CrossRef]
- Young, R.G.; Tappel, A.L. Fluorescent Pigment and Pentane Production by Lipid Peroxidation in Honey Bees, Apis Mellifera. Exp. Gerontol. 1978, 13, 457–459. [Google Scholar] [CrossRef]
- Chio, K.S.; Reiss, U.; Fletcher, B.; Tappel, A.L. Peroxidation of Subcellular Organelles: Formation of Lipofuscinlike Fluorescent Pigments. Science 1969, 166, 1535–1536. [Google Scholar] [CrossRef]
- Sparks, J.S.; Schelly, R.C.; Smith, W.L.; Davis, M.P.; Tchernov, D.; Pieribone, V.A.; Gruber, D.F. The Covert World of Fish Biofluorescence: A Phylogenetically Widespread and Phenotypically Variable Phenomenon. PLoS ONE 2014, 9. [Google Scholar] [CrossRef] [PubMed] [Green Version]
- De Brauwer, M.; Hobbs, J.P.A.; Ambo-Rappe, R.; Jompa, J.; Harvey, E.S.; McIlwain, J.L. Biofluorescence as a Survey Tool for Cryptic Marine Species. Conserv. Biol. 2018, 32, 706–715. [Google Scholar] [CrossRef]
- Meadows, M.G.; Anthes, N.; Dangelmayer, S.; Alwany, M.A.; Gerlach, T.; Schulte, G.; Sprenger, D.; Theobald, J.; Michiels, N.K. Red Fluorescence Increases with Depth in Reef Fishes, Supporting a Visual Function, Not UV Protection. Proc. R. Soc. B Biol. Sci. 2014, 281. [Google Scholar] [CrossRef]
- Kashimoto, R.; Hisata, K.; Shinzato, C.; Satoh, N.; Shoguchi, E. Expansion and Diversification of Fluorescent Protein Genes in Fifteen Acropora Species during the Evolution of Acroporid Corals. Genes 2021, 12, 397. [Google Scholar] [CrossRef]
- Macel, M.L.; Ristoratore, F.; Locascio, A.; Spagnuolo, A.; Sordino, P.; D’Aniello, S. Sea as a Color Palette: The Ecology and Evolution of Fluorescence. Zool. Lett. 2020, 6. [Google Scholar] [CrossRef]
- Kumagai, A.; Ando, R.; Miyatake, H.; Greimel, P.; Kobayashi, T.; Hirabayashi, Y.; Shimogori, T.; Miyawaki, A. XA Bilirubin-Inducible Fluorescent Protein from Eel Muscle. Cell 2013, 153, 1602–1611. [Google Scholar] [CrossRef] [Green Version]
- Krivoshik, S.R.; Guarnaccia, A.M.; Fried, D.B.; Gruber, D.F.; Gaffney, J.P. Disrupting Fluorescence by Mutagenesis in a Green Fluorescent Fatty Acid Binding Protein from a Marine Eel. Protein J. 2020, 39, 145–151. [Google Scholar] [CrossRef]
- Gruber, D.F.; Gaffney, J.P.; Mehr, S.; Desalle, R.; Sparks, J.S.; Platisa, J.; Pieribone, V.A. Adaptive Evolution of Eel Fluorescent Proteins from Fatty Acid Binding Proteins Produces Bright Fluorescence in the Marine Environment. PLoS ONE 2015, 10. [Google Scholar] [CrossRef]
- Wucherer, M.F.; Michiels, N.K. Regulation of Red Fluorescent Light Emission in a Cryptic Marine Fish. Front. Zool. 2014, 11. [Google Scholar] [CrossRef] [PubMed]
- Harant, U.K.; Santon, M.; Bitton, P.P.; Wehrberger, F.; Griessler, T.; Meadows, M.G.; Champ, C.M.; Michiels, N.K. Do the Fluorescent Red Eyes of the Marine Fish Tripterygion Delaisi Stand out? In Situ and in Vivo Measurements at Two Depths. Ecol. Evol. 2018, 8, 4685–4694. [Google Scholar] [CrossRef] [PubMed] [Green Version]
- Park, H.B.; Lam, Y.C.; Gaffney, J.P.; Weaver, J.C.; Krivoshik, S.R.; Hamchand, R.; Pieribone, V.; Gruber, D.F.; Crawford, J.M. Bright Green Biofluorescence in Sharks Derives from Bromo-Kynurenine Metabolism. iScience 2019, 19, 1291–1336. [Google Scholar] [CrossRef] [PubMed] [Green Version]
- Hassoun, A.; Shumilina, E.; Di Donato, F.; Foschi, M.; Simal-Gandara, J.; Biancolillo, A. Emerging Techniques for Differentiation of Fresh and Frozen-Thawed Seafoods: Highlighting the Potential of Spectroscopic Techniques. Molecules 2020, 25, 4472. [Google Scholar] [CrossRef] [PubMed]
- Protzel, D.; Hes, M.; Scherz, M.D.; Schwager, M.; Padje, A.V.T.; Glaw, F. Widespread Bone-Based Fluorescence in Chameleons. Sci. Rep. 2018, 8. [Google Scholar] [CrossRef] [Green Version]
- Prötzel, D.; Hes, M.; Schwager, M.; Glaw, F.; Scherz, M.D. Neon-Green Fluorescence in the Desert Gecko Pachydactylus Rangei Caused by Iridophores. Sci. Rep. 2021, 11. [Google Scholar] [CrossRef]
- Goutte, S.; Mason, M.J.; Antoniazzi, M.M.; Jared, C.; Merle, D.; Cazes, L.; Toledo, L.F.; el-Hafci, H.; Pallu, S.; Portier, H.; et al. Intense Bone Fluorescence Reveals Hidden Patterns in Pumpkin Toadlets. Sci. Rep. 2019, 9. [Google Scholar] [CrossRef]
- Taboada, C.; Brunetti, A.E.; Pedron, F.N.; Neto, F.C.; Estrin, D.A.; Bari, S.E.; Chemese, L.B.; Lopes, N.P.; Lagorio, M.G.; Faivovich, J. Naturally Occurring Fluorescence in Frogs. Proc. Natl. Acad. Sci. USA 2017, 114, 3672–3677. [Google Scholar] [CrossRef] [Green Version]
- Lamb, J.Y.; Davis, M.P. Salamanders and Other Amphibians Are Aglow with Biofluorescence. Sci. Rep. 2020, 10. [Google Scholar] [CrossRef]
- Völker, O. Ueber Fluoreszierende, Gelbe Federpigmente Bei Papageien, Eine Neue Klasse von Federfarbstoffen. J. für Ornithol. 1937, 85, 136–146. [Google Scholar] [CrossRef]
- Stradi, R.; Pini, E.; Celentano, G. The Chemical Structure of the Pigments in Ara Macao Plumage. Comp. Biochem. Physiol. B Biochem. Mol. Biol. 2001, 130, 57–63. [Google Scholar] [CrossRef]
- McGraw, K.J.; Nogare, M.C. Carotenoid Pigments and the Selectivity of Psittacofulvin-Based Coloration Systems in Parrots. Comp. Biochem. Physiol. B Biochem. Mol. Biol. 2004, 138, 229–233. [Google Scholar] [CrossRef] [PubMed]
- Thomas, D.B.; McGraw, K.J.; Butler, M.W.; Carrano, M.T.; Madden, O.; James, H.F. Ancient Origins and Multiple Appearances of Carotenoid-Pigmented Feathers in Birds. Proc. R. Soc. B Biol. Sci. 2014, 281. [Google Scholar] [CrossRef] [Green Version]
- Cooke, T.F.; Fischer, C.R.; Wu, P.; Jiang, T.X.; Xie, K.T.; Kuo, J.; Doctorov, E.; Zehnder, A.; Khosla, C.; Chuong, C.M.; et al. Genetic Mapping and Biochemical Basis of Yellow Feather Pigmentation in Budgerigars. Cell 2017, 171, 427–439. [Google Scholar] [CrossRef] [PubMed] [Green Version]
- Veronelli, M.; Zerbi, G.; Stradi, R. In Situ Resonance Raman Spectra of Carotenoids in Bird’s Feathers. J. Raman Spectrosc. 1995, 26, 683–692. [Google Scholar] [CrossRef]
- Barnsley, J.E.; Tay, E.J.; Gordon, K.C.; Thomas, D.B. Frequency Dispersion Reveals Chromophore Diversity and Colour-Tuning Mechanism in Parrot Feathers. R. Soc. Open Sci. 2018, 5. [Google Scholar] [CrossRef] [Green Version]
- Marshall, J.; Johnsen, S. Fluorescence as a Means of Colour Signal Enhancement. Philos. Trans. R. Soc. B Biol. Sci. 2017, 372. [Google Scholar] [CrossRef] [Green Version]
- Arnold, K.E.; Owens, I.P.F.; Marshall, N.J. Fluorescent Signaling in Parrots. Science 2002, 295, 92. [Google Scholar] [CrossRef]
- Camacho, C.; Negro, J.J.; Redondo, I.; Palacios, S.; Sáez-Gómez, P. Correlates of Individual Variation in the Porphyrin-Based Fluorescence of Red-Necked Nightjars (Caprimulgus Ruficollis). Sci. Rep. 2019, 9, 19115. [Google Scholar] [CrossRef]
- Pine, R.H.; Rice, J.E.; Bucher, J.E.; Tank, D.H.; Greenhall, A.M. Labile Pigments and Fluorescent Pelage in Didelphid Marsupials. Mammalia 1985, 49, 249–256. [Google Scholar] [CrossRef]
- Olson, E.R.; Carlson, M.R.; Ramanujam, V.M.S.; Sears, L.; Anthony, S.E.; Anich, P.S.; Ramon, L.; Hulstrand, A.; Jurewicz, M.; Gunnelson, A.S.; et al. Vivid Biofluorescence Discovered in the Nocturnal Springhare (Pedetidae). Sci. Rep. 2021, 11. [Google Scholar] [CrossRef] [PubMed]
- Hamchand, R.; Lafountain, A.M.; Büchel, R.; Maas, K.R.; Hird, S.M.; Warren, M.; Frank, H.A.; Brückner, C. Red Fluorescence of European Hedgehog (Erinaceus Europaeus) Spines Results from Free-Base Porphyrins of Potential Microbial Origin. J. Chem. Ecol. 2021. [Google Scholar] [CrossRef] [PubMed]
- Weagle, G.; Paterson, P.E.; Kennedy, J.; Pottier, R. The Nature of the Chromophore Responsible for Naturally Occurring Fluorescence in Mouse Skin. J. Photochem. Photobiol. B Biol. 1988, 2, 313–320. [Google Scholar] [CrossRef]
- Kohler, A.M.; Olson, E.R.; Martin, J.G.; Anich, P.S. Ultraviolet Fluorescence Discovered in New World Flying Squirrels (Glaucomys). J. Mammal. 2019, 100, 21–30. [Google Scholar] [CrossRef]
- Anich, P.S.; Anthony, S.; Carlson, M.; Gunnelson, A.; Kohler, A.M.; Martin, J.G.; Olson, E.R. Biofluorescence in the Platypus (Ornithorhynchus Anatinus). Mammalia 2021, 85, 179–181. [Google Scholar] [CrossRef]
- Widder, E.A. Bioluminescence in the Ocean: Origins of Biological, Chemical, and Ecological Diversity. Science 2010, 328, 704–708. [Google Scholar] [CrossRef] [Green Version]
- Brodl, E.; Winkler, A.; Macheroux, P. Molecular Mechanisms of Bacterial Bioluminescence. Comput. Struct. Biotechnol. J. 2018, 16, 551–564. [Google Scholar] [CrossRef]
- Oba, Y.; Stevani, C.V.; Oliveira, A.G.; Tsarkova, A.S.; Chepurnykh, T.; Yampolsky, I. Selected Least Studied but Not Forgotten Bioluminescent Systems. Photochem. Photobiol. 2017, 93, 405–415. [Google Scholar] [CrossRef] [Green Version]
- Daubner, S.C.; Astorga, A.M.; Leisman, G.B.; Baldwin, T.O. Yellow Light Emission of Vibrio Fischeri Strain Y-1: Purification and Characterization of the Energy-Accepting Yellow Fluorescent Protein. Proc. Natl. Acad. Sci. USA 1987, 84, 8912–8916. [Google Scholar] [CrossRef] [Green Version]
- Vannier, T.; Hingamp, P.; Turrel, F.; Tanet, L.; Lescot, M.; Timsit, Y. Diversity and Evolution of Bacterial Bioluminescence Genes in the Global Ocean. NAR Genom. Bioinform. 2020, 2. [Google Scholar] [CrossRef] [Green Version]
- Miller, S.D.; Haddock, S.H.D.; Elvidge, C.D.; Lee, T.F. Detection of a Bioluminescent Milky Sea from Space. Proc. Natl. Acad. Sci. USA 2005, 102, 14181–14184. [Google Scholar] [CrossRef] [Green Version]
- Valiadi, M.; Iglesias-Rodriguez, D. Understanding Bioluminescence in Dinoflagellates—How Far Have We Come? Microorganisms 2013, 1, 3–25. [Google Scholar] [CrossRef] [PubMed] [Green Version]
- Rifaie-Graham, O.; Galensowske, N.F.B.; Dean, C.; Pollard, J.; Balog, S.; Gouveia, M.G.; Chami, M.; Vian, A.; Amstad, E.; Lattuada, M.; et al. Shear Stress-Responsive Polymersome Nanoreactors Inspired by the Marine Bioluminescence of Dinoflagellates. Angew. Chem. 2021, 133, 917–922. [Google Scholar] [CrossRef]
- Valiadi, M.; de Rond, T.; Amorim, A.; Gittins, J.R.; Gubili, C.; Moore, B.S.; Iglesias-Rodriguez, M.D.; Latz, M.I. Molecular and Biochemical Basis for the Loss of Bioluminescence in the Dinoflagellate Noctiluca Scintillans along the West Coast of the U.S.A. Limnol. Oceanogr. 2019, 64, 2709–2724. [Google Scholar] [CrossRef] [PubMed]
- Cusick, K.D.; Widder, E.A. Bioluminescence and Toxicity as Driving Factors in Harmful Algal Blooms: Ecological Functions and Genetic Variability. Harmful Algae 2020, 98. [Google Scholar] [CrossRef]
- Cusick, K.D.; Widder, E.A. Intensity Differences in Bioluminescent Dinoflagellates Impact Foraging Efficiency in a Nocturnal Predator. Bull. Mar. Sci. 2014, 90, 797–811. [Google Scholar] [CrossRef]
- Duchatelet, L.; Delroisse, J.; Flammang, P.; Mahillon, J.; Mallefet, J. Etmopterus Spinax, the Velvet Belly Lanternshark, Does Not Use Bacterial Luminescence. Acta Histochem. 2019, 121, 516–521. [Google Scholar] [CrossRef]
- Dunlap, P.V. Bioluminescence, Microbial. In Encyclopedia of Microbiology; Elsevier Inc.: Amsterdam, The Netherlands, 2009; pp. 45–61. ISBN 9780123739445. [Google Scholar]
- Gould, A.L.; Dunlap, P.V. Shedding Light on Specificity: Population Genomic Structure of a Symbiosis Between a Coral Reef Fish and Luminous Bacterium. Front. Microbiol. 2019, 10. [Google Scholar] [CrossRef] [Green Version]
- Bongrand, C.; Ruby, E.G. The Impact of Vibrio fischeri Strain Variation on Host Colonization. Curr. Opin. Microbiol. 2019, 50, 15–19. [Google Scholar] [CrossRef]
- Li, Y.D.; Kundrata, R.; Tihelka, E.; Liu, Z.; Huang, D.; Cai, C. Cretophengodidae, a New Cretaceous Beetle Family, Sheds Light on the Evolution of Bioluminescence. Proc. R. Soc. B Biol. Sci. 2021, 288, 20202730. [Google Scholar] [CrossRef] [PubMed]
- Ke, H.M.; Lee, H.H.; Chan-Yi, I.L.; Liu, Y.C.; Lu, M.R.; Hsieh, J.W.A.; Chang, C.C.; Wu, P.H.; Lu, M.J.; Li, J.Y.; et al. Mycena Genomes Resolve the Evolution of Fungal Bioluminescence. Proc. Natl. Acad. Sci. USA 2020, 117, 31267–31277. [Google Scholar] [CrossRef] [PubMed]
- Weinstein, P.; Delean, S.; Wood, T.; Austin, A.D. Bioluminescence in the Ghost Fungus Omphalotus nidiformis Does Not Attract Potential Spore Dispersing Insects. IMA Fungus 2016, 7, 229–234. [Google Scholar] [CrossRef] [Green Version]
- Morciano, G.; Sarti, A.C.; Marchi, S.; Missiroli, S.; Falzoni, S.; Raffaghello, L.; Pistoia, V.; Giorgi, C.; di Virgilio, F.; Pinton, P. Use of Luciferase Probes to Measure ATP in Living Cells and Animals. Nat. Protoc. 2017, 12, 1542–1562. [Google Scholar] [CrossRef] [PubMed]
- Marques, S.M.; Esteves Da Silva, J.C.G. Firefly Bioluminescence: A Mechanistic Approach of Luciferase Catalyzed Reactions. IUBMB Life 2009, 61, 6–17. [Google Scholar] [CrossRef] [PubMed]
- Hirano, T. Molecular Origin of Color Variation in Firefly (Beetle) Bioluminescence: A Chemical Basis for Biological Imaging. Curr. Top. Med. Chem. 2016, 16, 2638–2647. [Google Scholar] [CrossRef] [PubMed]
- Morise, H.; Shimomura, O.; Johnson, F.H.; Winant, J. Intermolecular Energy Transfer in the Bioluminescent System of Aequorea. Biochemistry 1974, 13, 2656–2662. [Google Scholar] [CrossRef]
- Chalfie, M. Green Fluorescent Protein. Photochem. Photobiol. 1995, 62, 651–656. [Google Scholar] [CrossRef]
- Chalfie, M.; Tu, Y.; Euskirchen, G.; Ward, W.W.; Prasher, D.C. Green Fluorescent Protein as a Marker for Gene Expression. Science 1994, 263, 802–805. [Google Scholar] [CrossRef] [PubMed] [Green Version]
- Zaccolo, M.; Pozzan, T. Imaging Signal Transduction in Living Cells with GFP-Based Probes. IUBMB Life 2000, 49, 375–379. [Google Scholar] [CrossRef] [PubMed]
- Suetsugu, A.; Katz, M.; Fleming, J.; Truty, M.; Thomas, R.; Moriwaki, H.; Bouvet, M.; Saji, S.; Hoffman, R.M. Multi-Color Palette of Fluorescent Proteins for Imaging the Tumor Microenvironment of Orthotopic Tumorgraft Mouse Models of Clinical Pancreatic Cancer Specimens. J. Cell. Biochem. 2012, 113, 2290–2295. [Google Scholar] [CrossRef] [PubMed] [Green Version]
- Zambito, G.; Hall, M.P.; Wood, M.G.; Gaspar, N.; Ridwan, Y.; Stellari, F.F.; Shi, C.; Kirkland, T.A.; Encell, L.P.; Lowik, C.; et al. Red-Shifted Click Beetle Luciferase Mutant Expands the Multicolor Bioluminescent Palette for Deep Tissue Imaging. iScience 2021, 24. [Google Scholar] [CrossRef] [PubMed]
- Zambito, G.; Gaspar, N.; Ridwan, Y.; Hall, M.P.; Shi, C.; Kirkland, T.A.; Encell, L.P.; Lowik, C.; Mezzanotte, L. Evaluating Brightness and Spectral Properties of Click Beetle and Firefly Luciferases Using Luciferin Analogues: Identification of Preferred Pairings of Luciferase and Substrate for In Vivo Bioluminescence Imaging. Mol. Imaging Biol. 2020, 22, 1523–1531. [Google Scholar] [CrossRef] [PubMed]
- Dunlap, P. Biochemistry and Genetics of Bacterial Bioluminescence. Adv. Biochem. Eng. Biotechnol. 2014, 144, 37–64. [Google Scholar] [CrossRef]
- Wizenty, J.; Schumann, T.; Theil, D.; Stockmann, M.; Pratschke, J.; Tacke, F.; Aigner, F.; Wuensch, T. Recent Advances and the Potential for Clinical Use of Autofluorescence Detection of Extra-Ophthalmic Tissues. Molecules 2020, 25, 2095. [Google Scholar] [CrossRef]
- Schmitz-Valckenberg, S.; Pfau, M.; Fleckenstein, M.; Staurenghi, G.; Sparrow, J.R.; Bindewald-Wittich, A.; Spaide, R.F.; Wolf, S.; Sadda, S.R.; Holz, F.G. Fundus Autofluorescence Imaging. Prog. Retin. Eye Res. 2021, 81. [Google Scholar] [CrossRef] [PubMed]
- Langhout, G.C.; Spliethoff, J.W.; Schmitz, S.J.; Aalbers, A.G.J.; van Velthuysen, M.L.F.; Hendriks, B.H.W.; Ruers, T.J.M.; Kuhlmann, K.F.D. Differentiation of Healthy and Malignant Tissue in Colon Cancer Patients Using Optical Spectroscopy: A Tool for Image-Guided Surgery. Lasers Surg. Med. 2015, 47, 559–565. [Google Scholar] [CrossRef]
- Lauwerends, L.J.; Galema, H.A.; Hardillo, J.A.U.; Sewnaik, A.; Monserez, D.; van Driel, P.B.A.A.; Verhoef, C.; Baatenburg de Jong, R.J.; Hilling, D.E.; Keereweer, S. Current Intraoperative Imaging Techniques to Improve Surgical Resection of Laryngeal Cancer: A Systematic Review. Cancers 2021, 13, 1895. [Google Scholar] [CrossRef] [PubMed]
- Glover, B.; Teare, J.; Patel, N. A Review of New and Emerging Techniques for Optical Diagnosis of Colonic Polyps. J. Clin. Gastroenterol. 2019, 53, 495–506. [Google Scholar] [CrossRef]
- Osman, H.; Georges, J.; Elsahy, D.; Hattab, E.M.; Yocom, S.; Cohen-Gadol, A.A. In Vivo Microscopy in Neurosurgical Oncology. World Neurosurg. 2018, 115, 110–127. [Google Scholar] [CrossRef] [PubMed] [Green Version]
- Ortega, S.; Halicek, M.; Fabelo, H.; Callico, G.M.; Fei, B. Hyperspectral and Multispectral Imaging in Digital and Computational Pathology: A Systematic Review [Invited]. Biomed. Opt. Express 2020, 11, 3195. [Google Scholar] [CrossRef]
- Takayanagi, Y.; Yamanaka, M.; Fujihara, J.; Matsuoka, Y.; Gohto, Y.; Obana, A.; Tanito, M. Evaluation of Relevance between Advanced Glycation End Products and Diabetic Retinopathy Stages Using Skin Autofluorescence. Antioxidants 2020, 9, 1100. [Google Scholar] [CrossRef]
- Wang, M.; Long, F.; Tang, F.; Jing, Y.; Wang, X.; Yao, L.; Ma, J.; Fei, Y.; Chen, L.; Wang, G.; et al. Autofluorescence Imaging and Spectroscopy of Human Lung Cancer. Appl. Sci. 2017, 7, 32. [Google Scholar] [CrossRef]
- Sun, S.; Yang, Y.; Chen, M.; Wang, L.; Pan, H.; Zhang, X.; Wagnieres, G.; Mohammad, Y.; Barreiro, E.; Pirozzolo, G.; et al. Comparison of Autofluorescence and White-Light Bronchoscopies Performed with the Evis Lucera Spectrum for the Detection of Bronchial Cancers: A Meta-Analysis. Transl. Lung Cancer Res. 2020, 9, 23–32. [Google Scholar] [CrossRef] [PubMed]
- Borst, M.K.H. Untersuchungen Über Porphyrie, mit Besonderer Berücksichtigung der Porphyria Congenita; Hirzel: Leipzig, Germany, 1929. [Google Scholar]
- Dhéré, C. La Fluorescence En Biochimie; La Presse Universitaire de France: Paris, France, 1937. [Google Scholar] [CrossRef]
- Policard, A. Etude Sur Les Aspects Offerts Par Des Tumeurs Experimentales Examinees a La Lumiere de Wood. Comptes Rendus Des Séances Société Biol. 1924, 91, 1423–1424. [Google Scholar]
- Popper, H.; Gyorgy, P.; Goldblatt, H. Fluorescent Material (Ceroid) in Experimental Nutritional Cirrhosis. Arch. Path. 1944, 37, 161–168. [Google Scholar]
- Spikes, J.D. Photodynamic Action: From Paramecium to Photochemotherapy*. Photochem. Photobiol. 1997, 65, S142–S147. [Google Scholar] [CrossRef]
- Spikes, J.D. Porphyrins and Related Compounds as Photodynamic Sensitizers. Ann. N. Y. Acad. Sci. 1975, 244, 496–508. [Google Scholar] [CrossRef] [PubMed]
- Tsolekile, N.; Nelana, S.; Oluwafemi, O.S. Porphyrin as Diagnostic and Therapeutic Agent. Molecules 2019, 24, 2669. [Google Scholar] [CrossRef] [PubMed] [Green Version]
- Agostinis, P.; Berg, K.; Cengel, K.A.; Foster, T.H.; Girotti, A.W.; Gollnick, S.O.; Hahn, S.M.; Hamblin, M.R.; Juzeniene, A.; Kessel, D.; et al. Photodynamic Therapy of Cancer: An Update. CA Cancer J. Clin. 2011, 61, 250–281. [Google Scholar] [CrossRef]
- Lee, C.N.; Hsu, R.; Chen, H.; Wong, T.W. Daylight Photodynamic Therapy: An Update. Molecules 2020, 25, 5195. [Google Scholar] [CrossRef]
- Dougherty, T.J.; Gomer, C.J.; Henderson, B.W.; Jori, G.; Kessel, D.; Korbelik, M.; Moan, J.; Peng, Q. Photodynamic Therapy. J. Natl. Cancer Inst. 1998, 90, 889–905. [Google Scholar] [CrossRef] [Green Version]
- Popper, H. Distribution of Vitamin A in Tissue as Visualized by Fluorescence Microscopy. Physiol. Rev. 1944, 24, 205–224. [Google Scholar] [CrossRef]
- Georgakoudi, I.; Quinn, K.P. Optical Imaging Using Endogenous Contrast to Assess Metabolic State. Annu. Rev. Biomed. Eng. 2012, 14, 351–367. [Google Scholar] [CrossRef] [PubMed]
- Rost, B.F.W.D. Fluorescence Microscopy, Volume II by F.W.D. Rost Cambridge University Press, Cambridge and New York (1995) ISBN 0-521-41088-6; 457 Pages; $175.00. Scanning 2006, 18, 593. [Google Scholar] [CrossRef]
- Hamperl, H. Die Fluoreszenzmikroskopie Menschlicher Gewebe Itle. Virchows Arch. Pathol. Anat. Physiol. 1934, 292, 1–51. [Google Scholar] [CrossRef]
- Chance, B.; Legallais, V. Differential Microfluorimeter for the Localization of Reduced Pyridine Nucleotide in Living Cells. Rev. Sci. Instrum. 1959, 30, 732. [Google Scholar] [CrossRef]
- Kunz, W.S. Spectral Properties of Fluorescent Flavoproteins of Isolated Rat Liver Mitochondria. FEBS Lett. 1986, 195, 92–96. [Google Scholar] [CrossRef] [Green Version]
- Kosowski, H.; Schild, L.; Kunz, D.; Halangk, W. Energy Metabolism in Rat Pancreatic Acinar Cells during Anoxia and Reoxygenation. Biochim. Biophys. Acta 1998, 1367, 118–126. [Google Scholar] [CrossRef] [Green Version]
- Blacker, T.S.; Mann, Z.F.; Gale, J.E.; Ziegler, M.; Bain, A.J.; Szabadkai, G.; Duchen, M.R. Separating NADH and NADPH Fluorescence in Live Cells and Tissues Using FLIM. Nat. Commun. 2014, 5. [Google Scholar] [CrossRef] [PubMed] [Green Version]
- Salmon, J.M.; Kohen, E.; Viallet, P.; Hirschberg, J.G.; Wouters, A.W.; Kohen, C.; Thorell, B. Microspectrofluorometric Approach to the Study of Free/Bound NAD(P)H Ratio as Metabolic Indicator in Various Cell Types. Photochem. Photobiol. 1982, 36, 585–593. [Google Scholar] [CrossRef]
- Wolfbeiss, O. The Fluorescence of Organic Natural Products. In Molecular Fluorescence Spectroscopy. Methods and Applications; Schulman, S.G., Ed.; John Wiley & Sons: New York, NY, USA, 1985; pp. 167–360. [Google Scholar]
- Chance, B.; Schoener, B.; Oshino, R.; Itshak, F.; Nakase, Y. Oxidation-Reduction Ratio Studies of Mitochondria in Freeze-Trapped Samples. NADH and Flavoprotein Fluorescence Signals. J. Biol. Chem. 1979, 254, 4764–4771. [Google Scholar] [CrossRef]
- Sato, B.; Tanaka, A.; Mori, S.; Yanabu, N.; Kitai, T.; Tokuka, A.; Inomoto, T.; Iwata, S.; Yamaoka, Y.; Chance, B. Quantitative Analysis of Redox Gradient within the Rat Liver Acini by Fluorescence Images: Effects of Glucagon Perfusion. Biochim. Biophys. Acta 1995, 1268, 20–26. [Google Scholar] [CrossRef] [Green Version]
- Heaster, T.M.; Walsh, A.J.; Zhao, Y.; Hiebert, S.W.; Skala, M.C. Autofluorescence Imaging Identifies Tumor Cell-Cycle Status on a Single-Cell Level. J. Biophotonics 2018, 11. [Google Scholar] [CrossRef] [PubMed]
- Santin, G.; Paulis, M.; Vezzoni, P.; Pacchiana, G.; Bottiroli, G.; Croce, A.C. Autofluorescence Properties of Murine Embryonic Stem Cells during Spontaneous Differentiation Phases. Lasers Surg. Med. 2013, 45, 597–607. [Google Scholar] [CrossRef] [PubMed]
- Rice, W.L.; Kaplan, D.L.; Georgakoudi, I. Two-Photon Microscopy for Non-Invasive, Quantitative Monitoring of Stem Cell Differentiation. PLoS ONE 2010, 5, e10075. [Google Scholar] [CrossRef] [PubMed] [Green Version]
- Quinn, K.P.; Sridharan, G.V.; Hayden, R.S.; Kaplan, D.L.; Lee, K.; Georgakoudi, I. Quantitative Metabolic Imaging Using Endogenous Fluorescence to Detect Stem Cell Differentiation. Sci. Rep. 2013, 3, 3432. [Google Scholar] [CrossRef] [Green Version]
- Uchugonova, A.; König, K. Two-Photon Autofluorescence and Second-Harmonic Imaging of Adult Stem Cells. J. Biomed. Opt. 2008, 13, 054068. [Google Scholar] [CrossRef]
- Wright, B.K.; Andrews, L.M.; Markham, J.; Jones, M.R.; Stringari, C.; Digman, M.A.; Gratton, E. NADH Distribution in Live Progenitor Stem Cells by Phasor-Fluorescence Lifetime Image Microscopy. Biophys. J. 2012, 103, L7–L9. [Google Scholar] [CrossRef] [Green Version]
- Guo, H.-W.; Yu, J.-S.; Hsu, S.-H.; Wei, Y.-H.; Lee, O.K.; Dong, C.-Y.; Wang, H.-W. Correlation of NADH Fluorescence Lifetime and Oxidative Phosphorylation Metabolism in the Osteogenic Differentiation of Human Mesenchymal Stem Cell. J. Biomed. Opt. 2015, 20, 017004. [Google Scholar] [CrossRef] [Green Version]
- Stringari, C.; Cinquin, A.; Cinquin, O.; Digman, M.A.; Donovan, P.J.; Gratton, E. Phasor Approach to Fluorescence Lifetime Microscopy Distinguishes Different Metabolic States of Germ Cells in a Live Tissue. Proc. Natl. Acad. Sci. USA 2011, 108, 13582–13587. [Google Scholar] [CrossRef] [Green Version]
- Croce, A.C.; Spano, A.; Locatelli, D.; Barni, S.; Sciola, L.; Bottiroli, G. Dependence of Fibroblast Autofluorescence Properties on Normal and Transformed Conditions. Role of the Metabolic Activity. Photochem. Photobiol. 1999, 69, 364–374. [Google Scholar] [CrossRef]
- König, J.; Ott, C.; Hugo, M.; Jung, T.; Bulteau, A.L.; Grune, T.; Höhn, A. Mitochondrial Contribution to Lipofuscin Formation. Redox Biol. 2017, 11, 673–681. [Google Scholar] [CrossRef] [PubMed]
- Croce, A.C.; Ferrigno, A.; Vairetti, M.; Bertone, R.; Freitas, I.; Bottiroli, G. Autofluorescence Spectroscopy of Rat Liver during Experimental Transplantation Procedure. An Approach for Hepatic Metabolism Assessment. Photochem. Photobiol. Sci. 2005, 4, 583–590. [Google Scholar] [CrossRef] [PubMed]
- Croce, A.C.; de Simone, U.; Vairetti, M.; Ferrigno, A.; Bottiroli, G. Autofluorescence Properties of Rat Liver under Hypermetabolic Conditions. Photochem. Photobiol. Sci. 2007, 6, 1202–1209. [Google Scholar] [CrossRef]
- Tirapelli, L.F.; Trazzi, B.F.M.; Bagnato, V.S.; Tirapelli, D.P.C.; Kurachi, C.; da Costa, M.M.; Tucci, S.; Cologna, A.J.; Martins, A.C.P. Histopathology and Laser Autofluorescence of Ischemic Kidneys of Rats. Lasers Med Sci. 2009, 24, 397–404. [Google Scholar] [CrossRef] [PubMed]
- Moreno, A.; Kuzmiak-Glancy, S.; Jaimes, R.; Kay, M.W. Enzyme-Dependent Fluorescence Recovery of NADH after Photobleaching to Assess Dehydrogenase Activity of Isolated Perfused Hearts. Sci. Rep. 2017, 7. [Google Scholar] [CrossRef]
- Chorvat, D.; Chorvatova, A. Spectrally Resolved Time-Correlated Single Photon Counting: A Novel Approach for Characterization of Endogenous Fluorescence in Isolated Cardiac Myocytes. Eur. Biophys. J. 2006, 36, 73–83. [Google Scholar] [CrossRef] [PubMed]
- Marcu, L.; Hartl, B.A. Fluorescence Lifetime Spectroscopy and Imaging in Neurosurgery. IEEE J. Sel. Top. Quantum Electron. 2012, 18, 1465–1477. [Google Scholar] [CrossRef]
- Fatakdawala, H.; Griffiths, L.G.; Humphrey, S.; Marcu, L. Time-Resolved Fluorescence Spectroscopy and Ultrasound Backscatter Microscopy for Nondestructive Evaluation of Vascular Grafts. J. Biomed. Opt. 2014, 19, 080503. [Google Scholar] [CrossRef] [Green Version]
- Marsden, M.; Weaver, S.S.; Marcu, L.; Campbell, M.J. Intraoperative Mapping of Parathyroid Glands Using Fluorescence Lifetime Imaging. J. Surg. Res. 2021, 265, 42–48. [Google Scholar] [CrossRef]
- Knorr, F.; Yankelevich, D.R.; Liu, J.; Wachsmann-Hogiu, S.; Marcu, L. Two-Photon Excited Fluorescence Lifetime Measurements through a Double-Clad Photonic Crystal Fiber for Tissue Micro-Endoscopy. J. Biophotonics 2012, 5, 14–19. [Google Scholar] [CrossRef]
- Alfonso-Garcia, A.; Bec, J.; Weyers, B.; Marsden, M.; Zhou, X.; Li, C.; Marcu, L. Mesoscopic Fluorescence Lifetime Imaging: Fundamental Principles, Clinical Applications and Future Directions. J. Biophotonics 2021. [Google Scholar] [CrossRef] [PubMed]
- Marsden, M.; Fukazawa, T.; Deng, Y.-C.; Weyers, B.W.; Bec, J.; Gregory Farwell, D.; Marcu, L. FLImBrush: Dynamic Visualization of Intraoperative Free-Hand Fiber-Based Fluorescence Lifetime Imaging. Biomed. Opt. Express 2020, 11, 5166. [Google Scholar] [CrossRef] [PubMed]
- Thorling, C.A.; Crawford, D.; Burczynski, F.J.; Liu, X.; Liau, I.; Roberts, M.S. Multiphoton Microscopy in Defining Liver Function. J. Biomed. Opt. 2014, 19, 90901. [Google Scholar] [CrossRef] [PubMed] [Green Version]
- Wang, H.; Liang, X.; Gravot, G.; Thorling, C.A.; Crawford, D.H.G.; Xu, Z.P.; Liu, X.; Roberts, M.S. Visualizing Liver Anatomy, Physiology and Pharmacology Using Multiphoton Microscopy. J. Biophotonics 2017, 10, 46–60. [Google Scholar] [CrossRef]
- Gratton, E.; Breusegem, S.; Sutin, J.; Ruan, Q.; Barry, N. Fluorescence Lifetime Imaging for the Two-Photon Microscope: Time-Domain and Frequency-Domain Methods. J. Biomed. Opt. 2003, 8, 381–390. [Google Scholar] [CrossRef]
- Digman, M.A.; Caiolfa, V.R.; Zamai, M.; Gratton, E. The Phasor Approach to Fluorescence Lifetime Imaging Analysis. Biophys. J. 2008, 94, L14–L16. [Google Scholar] [CrossRef] [Green Version]
- Ranjit, S.; Dvornikov, A.; Stakic, M.; Hong, S.H.; Levi, M.; Evans, R.M.; Gratton, E. Imaging Fibrosis and Separating Collagens Using Second Harmonic Generation and Phasor Approach to Fluorescence Lifetime Imaging. Sci. Rep. 2015, 5. [Google Scholar] [CrossRef] [Green Version]
- Gillette, A.A.; Babiarz, C.P.; VanDommelen, A.R.; Pasch, C.A.; Clipson, L.; Matkowskyj, K.A.; Deming, D.A.; Skala, M.C. Autofluorescence Imaging of Treatment Response in Neuroendocrine Tumor Organoids. Cancers 2021, 13, 1873. [Google Scholar] [CrossRef]
- Leupold, D.; Pfeifer, L.; Hofmann, M.; Forschner, A.; Wessler, G.; Haenssle, H. From Melanocytes to Melanoma Cells: Characterization of the Malignant Transformation by Four Distinctly Different Melanin Fluorescence Spectra (Review). Int. J. Mol. Sci. 2021, 22, 5265. [Google Scholar] [CrossRef]
- Ranjit, S.; Dvornikov, A.; Dobrinskikh, E.; Wang, X.; Luo, Y.; Levi, M.; Gratton, E. Measuring the Effect of a Western Diet on Liver Tissue Architecture by FLIM Autofluorescence and Harmonic Generation Microscopy. Biomed. Opt. Express 2017, 8, 3143. [Google Scholar] [CrossRef] [Green Version]
- Bottiroli, G.; Croce, A.C.; Locatelli, D.; Marchesini, R.; Pignoli, E.; Tomatis, S.; Cuzzoni, C.; DiPalma, S.; Dalfante, M.; Spinellu, P. Natural Fluorescence of Normal and Neoplastic Human Colon: A Comprehensive “Ex Vivo” Study. Lasers Surg. Med. 1995, 16, 48–60. [Google Scholar] [CrossRef] [PubMed]
- Marchesini, R.; Pignoli, E.; Tomatis, S.; Fumagalli, S.; Sichirollo, A.E.; Dipalma, S.; Dalfante, M.; Spinelli, P.; Croce, A.C.; Bottiroli, G. Ex-Vivo Optical-Properties of Human Colon Tissue. Lasers Surg. Med. 1994, 15, 351–357. [Google Scholar] [CrossRef]
- Krupka, M.; Bartusik-Aebisher, D.; Strzelczyk, N.; Latos, M.; Sieroń, A.; Cieślar, G.; Aebisher, D.; Czarnecka, M.; Kawczyk-Krupka, A.; Latos, W. The Role of Autofluorescence, Photodynamic Diagnosis and Photodynamic Therapy in Malignant Tumors of the Duodenum. Photodiagnosis Photodyn. Ther. 2020, 32. [Google Scholar] [CrossRef] [PubMed]
- Moriichi, K.; Fujiya, M.; Okumura, T. The Efficacy of Autofluorescence Imaging in the Diagnosis of Colorectal Diseases. Clin. J. Gastroenterol. 2016, 9, 175–183. [Google Scholar] [CrossRef] [PubMed] [Green Version]
- Korneva, Y.S.; Dorosevich, A.E.; Maryakhina, V.S. Fluorescent Diagnostics of Epithelial Neoplasms of Different Colon Parts. Lasers Surg. Med. 2017. [Google Scholar] [CrossRef] [PubMed]
- Moriichi, K.; Fujiya, M.; Kobayashi, Y.; Murakami, Y.; Iwama, T.; Kunogi, T.; Sasaki, T.; Ijiri, M.; Takahashi, K.; Tanaka, K.; et al. Autofluorescence Imaging Reflects the Nuclear Enlargement of Tumor Cells as Well as the Cell Proliferation Ability and Aberrant Status of the P53, Ki-67, and P16 Genes in Colon Neoplasms. Molecules 2019, 24, 1106. [Google Scholar] [CrossRef] [Green Version]
- Semenov, A.N.; Yakimov, B.P.; Rubekina, A.A.; Gorin, D.A.; Drachev, V.P.; Zarubin, M.P.; Velikanov, A.N.; Lademann, J.; Fadeev, V.V.; Priezzhev, A.V.; et al. The Oxidation-Induced Autofluorescence Hypothesis: Red Edge Excitation and Implications for Metabolic Imaging. Molecules 2020, 25, 1863. [Google Scholar] [CrossRef] [PubMed] [Green Version]
- Ladurner, R.; Lerchenberger, M.; al Arabi, N.; Gallwas, J.K.S.; Stepp, H.; Hallfeldt, K.K.J. Parathyroid Autofluorescence—How Does It Affect Parathyroid and Thyroid Surgery? A 5 Year Experience. Molecules 2019, 24, 2560. [Google Scholar] [CrossRef] [PubMed] [Green Version]
- Lualdi, M.; Cavalleri, A.; Battaglia, L.; Colombo, A.; Garrone, G.; Morelli, D.; Pignoli, E.; Sottotetti, E.; Leo, E. Early Detection of Colorectal Adenocarcinoma: A Clinical Decision Support Tool Based on Plasma Porphyrin Accumulation and Risk Factors. BMC Cancer 2018, 18. [Google Scholar] [CrossRef] [PubMed] [Green Version]
- Courrol, L.C.; de Oliveira Silva, F.R.; Coutinho, E.L.; Piccoli, M.F.; Mansano, R.D.; Vieira, N.D., Jr.; Schor, N.; Bellini, M.H. Study of Blood Porphyrin Spectral Profile for Diagnosis of Tumor Progression. J. Fluoresc. 2007, 17, 289–292. [Google Scholar] [CrossRef] [PubMed]
- Tristão, V.R.; de Carvalho, F.F.; Gomes, C.Z.; Miranda, A.R.; Vequi-Suplicy, C.C.; Lamy, M.T.; Schor, N.; Bellini, M.H. Study of Blood Porphyrin Spectral Profile for Diagnosis of Chronic Renal Failure. J. Fluoresc. 2010, 20, 665–669. [Google Scholar] [CrossRef]
- Alsalhi, M.; Masilamani, V.; Trinka, V.; Elangovan, M.; Kochupillai, V.; Shah, N. Detection of Cancer by Optical Analysis of Body Fluids—A Single Blind Study. Technol. Cancer Res. Treat. 2011, 10, 145–152. [Google Scholar] [CrossRef]
- Atif, M.; AlSalhi, M.S.; Devanesan, S.; Masilamani, V.; Farhat, K.; Rabah, D. A Study for the Detection of Kidney Cancer Using Fluorescence Emission Spectra and Synchronous Fluorescence Excitation Spectra of Blood and Urine. Photodiagnosis Photodyn. Ther. 2018, 23, 40–44. [Google Scholar] [CrossRef]
- AlSalhi, M.; al Mehmadi, A.M.; Abdo, A.A.; Prasad, S.; Masilamani, V. Diagnosis of Liver Cancer and Cirrhosis by the Fluorescence Spectra of Blood and Urine. Technol. Cancer Res. Treat. 2012, 11, 345–351. [Google Scholar] [CrossRef]
- Al-Salhi, M.; Masilamani, V.; Vijmasi, T.; Al-Nachawati, H.; VijayaRaghavan, A.P. Lung Cancer Detection by Native Fluorescence Spectra of Body Fluids—A Preliminary Study. J. Fluoresc. 2011, 21, 637–645. [Google Scholar] [CrossRef]
- Masilamani, V.; Vijmasi, T.; al Salhi, M.; Govindaraj, K.; Vijaya-Raghavan, A.P.; Antonisamy, B. Cancer Detection by Native Fluorescence of Urine. J. Biomed. Opt. 2010, 15, 057003. [Google Scholar] [CrossRef]
- Kalaivani, R.; Masilamani, V.; AlSalhi, M.S.; Devanesan, S.; Ramamurthy, P.; Palled, S.R.; Ganesh, K.M. Cervical Cancer Detection by Time-Resolved Spectra of Blood Components. J. Biomed. Opt. 2014, 19, 057011. [Google Scholar] [CrossRef] [PubMed] [Green Version]
- Masilamani, V.; Devanesan, S.; Ravikumar, M.; Perinbam, K.; Al Salhi, M.S.A.; Prasad, S.; Palled, S.; Ganesh, K.M.A.; Alsaeed, A.H. Fluorescence Spectral Diagnosis of Malaria: A Preliminary Study. Diagn. Pathol. 2014, 9, 182. [Google Scholar] [CrossRef] [PubMed] [Green Version]
- Croce, A.; Bottiroli, G.; di Pasqua, L.; Berardo, C.; Siciliano, V.; Rizzo, V.; Vairetti, M.; Ferrigno, A. Serum and Hepatic Autofluorescence as a Real-Time Diagnostic Tool for Early Cholestasis Assessment. Int. J. Mol. Sci. 2018, 19, 2634. [Google Scholar] [CrossRef] [PubMed] [Green Version]
- Croce, A.C.; Ferrigno, A.; Santin, G.; Vairetti, M.; Bottiroli, G. Bilirubin: An Autofluorescence Bile Biomarker for Liver Functionality Monitoring. J. Biophotonics 2014, 7, 810–817. [Google Scholar] [CrossRef]
- Plavskii, V.Y.; Mostovnikov, V.A.; Mostovnikova, G.R.; Tret’yakova, A.I. Spectral Fluorescence and Polarization Characteristics of Z,Z-Bilirubin IXα. J. Appl. Spectrosc. 2007, 74, 120–132. [Google Scholar] [CrossRef]
- Mazzoni, M.; Agati, G.; Troup, G.J.; Pratesi, R. Analysis of Wavelength-Dependent Photoisomerization Quantum Yields in Bilirubins by Fitting Two Exciton Absorption Bands. J. Opt. A Pure Appl. Opt. 2003, 5, S374. [Google Scholar] [CrossRef]
- Granucci, G.; Mazzoni, M.; Persico, M.; Toniolo, A. A Computational Study of the Excited States of Bilirubin IX. Phys. Chem. Chem. Phys. 2005, 7, 2594–2598. [Google Scholar] [CrossRef]
- Vreman, H.J.; Kourula, S.; Jašprová, J.; Ludvíková, L.; Klán, P.; Muchová, L.; Vítek, L.; Cline, B.K.; Wong, R.J.; Stevenson, D.K. The Effect of Light Wavelength on in Vitro Bilirubin Photodegradation and Photoisomer Production. Pediatric Res. 2019, 85, 865–873. [Google Scholar] [CrossRef]
- Croce, A.C.; Ferrigno, A.; Berardo, C.; Bottiroli, G.; Vairetti, M.; di Pasqua, L.G. Spectrofluorometric Analysis of Autofluorescing Components of Crude Serum from a Rat Liver Model of Ischemia and Reperfusion. Molecules 2020, 25, 1327. [Google Scholar] [CrossRef] [Green Version]
- Gordon, D.M.; Hong, S.H.; Kipp, Z.A.; Hinds, T.D. Identification of Binding Regions of Bilirubin in the Ligand-Binding Pocket of the Peroxisome Proliferator-Activated Receptor-A (PPARalpha). Molecules 2021, 26, 2975. [Google Scholar] [CrossRef] [PubMed]
- Monici, M.; Agati, G.; Fusi, F.; Pratesi, R.; Paglierani, M.; Santini, V.; Bernabei, P.A. Dependence of Leukemic Cell Autofluorescence Patterns on the Degree of Differentiation. Photochem. Photobiol. Sci. 2003, 2, 981–987. [Google Scholar] [CrossRef] [PubMed]
- Croce, A.C.; De Simone, U.; Vairetti, M.; Ferrigno, A.; Boncompagni, E.; Freitas, I.; Bottiroli, G. Liver Autofluorescence Properties in Animal Model under Altered Nutritional Conditions. Photochem. Photobiol. Sci. 2008, 7, 1046–1053. [Google Scholar] [CrossRef] [PubMed]
- Tsin, A.T.C.; Pedrozo-Fernandez, H.A.; Gallas, J.M.; Chambers, J.P. The Fluorescence Quantum Yield of Vitamin A2. Life Sci. 1988, 43, 1379–1384. [Google Scholar] [CrossRef]
- Crespi, F.; Croce, A.C.; Fiorani, S.; Masala, B.; Heidbreder, C.; Bottiroli, G. Autofluorescence Spectrofluorometry of Central Nervous System (CNS) Neuromediators. Lasers Surg. Med. 2004, 34, 39–47. [Google Scholar] [CrossRef] [PubMed]
- Marcu, L. Characterization of Type I, II, III, IV, and V Collagens by Time-Resolved Laser-Induced Fluorescence Spectroscopy. In Proceedings of the SPIE BiOS 2000 The International Symposium on Biomedical Optics 2000, San Jose, CA, USA, 22 January 2000; pp. 93–101. [Google Scholar] [CrossRef]
- Thornhill, D.P. Separation of a Series of Chromophores and Fluorophores Present in Elastin. Biochem. J. 1975, 147, 215–219. [Google Scholar] [CrossRef] [PubMed] [Green Version]
- Schweizer, J.; Bowden, P.E.; Coulombe, P.A.; Langbein, L.; Lane, E.B.; Magin, T.M.; Maltais, L.; Omary, M.B.; Parry, D.A.D.; Rogers, M.A.; et al. New Consensus Nomenclature for Mammalian Keratins. J. Cell Biol. 2006, 174, 169–174. [Google Scholar] [CrossRef] [Green Version]
- Zatloukal, K.; Stumptner, C.; Fuchsbichler, A.; Fickert, P.; Lackner, C.; Trauner, M.; Denk, H. The Keratin Cytoskeleton in Liver Diseases. J. Pathol. 2004, 204, 367–376. [Google Scholar] [CrossRef]
- Wu, Y.; Qu, J.Y. Autofluorescence Spectroscopy of Epithelial Tissues. J. Biomed. Opt. 2006, 11, 054023. [Google Scholar] [CrossRef]
- Croce, A.C.; Bottiroli, G. Autofluorescence Spectroscopy for Monitoring Metabolism in Animal Cells and Tissues. In Methods in Molecular Biology; Springer: Clifton, NJ, USA, 2017; Volume 1560, pp. 15–43. [Google Scholar] [CrossRef]
- Croce, A.C.; Bottiroli, G. New Light in Flavin Autofluorescence. Eur. J. Histochem. 2015, 59, 2576. [Google Scholar] [CrossRef] [Green Version]
Figure 1.
Key historical points in autofluorescence reports, studies and applications.

Figure 2.
Vegetable autofluorescing compounds and emission spectral position [7].
Figure 2.
Vegetable autofluorescing compounds and emission spectral position [7].

Figure 3.
Absorption spectra of chlorophyll a and chlorophyll b, after 40 min of extraction from leaves, and elution from a TLC plate (organic solvent: diethyl ether). Reprinted with permission from [10].
Figure 3.
Absorption spectra of chlorophyll a and chlorophyll b, after 40 min of extraction from leaves, and elution from a TLC plate (organic solvent: diethyl ether). Reprinted with permission from [10].

Figure 4.
Images of Paramecium bursaria bearing Chlorella variabilis collected at microscope in bright field by differential interference contrast (A), and at fluorescence. The symbiotic alga provides the Paramecium with products of photosynthesis, mainly sugars, and oxygen, reciprocated by CO2 and nitrogen. Chlorophyll in the alga makes easy its identification and localization, as the greenish color or brilliant red fluorescence (B). Paramecium: macronucleus (Ma), cytopharynx (Cy) [31].

Figure 5.
False color images from soybean leaves on the effects on fluorescence by treatments with herbicide DCMU (left) or ozone (right). On the left, leaf immersion in DCMU for 6 h (a), or partial DCMU application on the abaxial side results in a fluorescence decrease (b). On the right, ozone exposure results in an increased emission, particularly at the longer wavelengths. Control (CF) and ozone (O3) treated leaves. Excitation: 360 nm, emission wavelengths, resulting image ratios and color scale of intensity are indicated in the figures. Reprinted/adapted with permission from [35] © The Optical Society.

Figure 6.
Grape images collected at 740 nm, under excitation at 650 nm (A) and 550 nm (B), and RGB image resulting from recombination of monochrome images (470, 546 and 680 nm bands) collected under white light (C), bar = 1 cm. Image resulting as the logarithm of the ratio between the two (A) and (B) images (D). Image (D) represented in pseudo-colors (E), and image from a different grape brunch (F), processed as (E). (E,F) arrows indicate concentration of anthocyanin from methanolic extracts of the berry skin (nmol cm−2, as surface-based units). (D–F) intensity scales on the right. (G,H) Distribution of pixels vs. logarithm of the chlorophyll (ChlF) fluorescence excitation ratio intensity for bunches respectively in (E) and (F). Reprinted/adapted with permission from [40] © The Optical Society.

Figure 7.
Optical analysis of grapevine leaves to analyze the impact of the infection by the virus GLRaV-3. On the left, impact on photosynthesis is shown in terms of quantum efficiency of photosystem II (maximum efficiency, FV/FM; actual efficiency or quantum yield, ΦPSII, and non-photochemical quenching, NPQ). On the right impact on secondary metabolites, as from fluorescence image recorded or processed as indicate in the figure. Reprinted with permission from [41].

Figure 8.
Basic chemical structures of flavonoids derivatives. Derivatives responsible for taste of vegetable mostly belong to flavanones. Derivatives responsible for colors belong to flavonols, mainly pale yellow, and anthocyanins, prevalently blue and red [70].
Figure 8.
Basic chemical structures of flavonoids derivatives. Derivatives responsible for taste of vegetable mostly belong to flavanones. Derivatives responsible for colors belong to flavonols, mainly pale yellow, and anthocyanins, prevalently blue and red [70].

Figure 9.
Bright-field and fluorescence images of hairy roots (a) and epidermis pigmented cells (b) of grapevine plant. Production and accumulation of anthocyanins in vacuoles is appreciable for their own red color (c), and for red autofluorescence (d). Vacuole’s classification: smaller, group 1 and larger, group II, respectively, <1 μm and >1 μm diameter. Bars: 0.5 mm (a); 10 μm (b–d). vc, vascular cylinder; ep, epidermis; V, vacuole. Reprinted and modified with permission from [81].

Figure 10.
Betalain fluorescence. The yellow inflorescences of Celosia argentea (A) shows also a greenish fluorescence when excited with a blue light (B) even better appreciable in a particular magnification of one of its part. Bar = 500 μm (C). The pigment purified appears as comparable color and fluorescence (D). The general chemical structure of betaxanthins (E) and 3-D spectral characterization of the betaxanthin/dopaxanthin solution (F). Reprinted with permission from [105].

Figure 11.
Flowers from Nicotiana tabacum plants engineered to produce betalains: pX11, pX12 and pX13 represent the combinations of genes influencing the bio-metabolic fluxes in the biosynthesis of betalains, influencing the production of red betacyanins or of yellow betaxanthins (A). As a result, tobacco flowers show a scale of color associated with an increase in fluorescence reflecting the improved presence of betaxanthins (B). The LC-MS analysis and mass ion chromatograms of petals from pX11, pX12 and pX13 flowers confirm the presence of proline-, tyramine, glutamine-betaxanthins and betanins (C). Flowers of Petunia × hybrida, cultivar Mitchell, as wild type or after engineering with pX11 vector (D). Reprinted with permission, and adapted, from [108].

Figure 12.
Schematic representation of various Biotechnological Applications based on betalains: improved detection of the pigments separated by analytical techniques, such as HPLC (A); Plasmodium falciparum staining in erythrocytes to improve its detection (B); visibility of digestive tract in animal models (C); linking to specific activities of enzymes in microbiology-biotechnology (D); tagging of proteins to improve their detection (E); intrinsic biomarker of its own production bioreactors (F); general biosensor following engineerization of betalamic acid production (G); betaxanthin fluorescence as self-biomarker to confirm the successful genetic transformation to express dioxygenases producing betalamic acid (H). (ref. [105] and references therein, figure created by Authors using BioRender (https://biorender.com).

Figure 13.
Fluorescence recorded under 366 nm excitation from the border of pitchers of different carnivorous plants: Nepenthes ventricose (A), N. gracilis (B), Sarracenia purpurea (C), S. oreophila (D), N. khasiana (E,F) and near-dead N. khasiana pitcher (G). N. ventricosa with unopened pitcher (top) and opened pitcher (bottom) with digestive fluid (H). Reprinted with permission from [113].

Figure 14.
Autofluorescence pattern reflect the histological structures in a chlorotic pine needle. Image recorded under sequential sessions of measurements, in the blue (400–500 nm), green (500–570 nm) and red (650–750 nm) spectral emissions, under the respective excitations at 355 nm, 488 nm and 633 nm. Scale bar = 200 μm (a). Autofluorescence images of a healthy needle recorded sequentially under 355 nm excitation in blue (420–460 nm), and green 495–550 nm) spectral regions (b), and in the 400–800 nm, improving to detection selectively the green fluorescing ferulate in the phloem (c). Scale bars = 100 μm [119].

Figure 15.
White light (a,c) and autofluorescence images (405 nm excitation, (b,d)) recorded from a venous leg ulcer before and after debridement. The green fluorescence has been ascribed to pyoverdine, the fluorophore produced by the infective Pseudomonas aeruginosa, in particular under hostile environment such as wound debridement and use of antimicrobials. Fluorescence imaging is suitable for the point of care diagnosis and consequent treatment of the infection [138].

Figure 16.
Representative summary of an effective application of autofluorescence for the real time monitoring of bioreactor performance in the treatment of wastewater, and environment impact. Bioaerosol (on the left) and wastewater (on the right) are collected from the bioreactor to be analyzed respectively by Spectral Intensity Bioaerosol Sensor (SIBS, on the left), and Fluoromax-Plus spectrofluorometer (on the right). Fluorescence information on air quality (bioaerosol) is provided by SIBS as spectral data resolved in 16 channels under dual excitation (285 nm; 370 nm), and on wastewater by Fluoromax-Plus, as a fluorescence em/ex matrix from stored liquid samples. Image partly modified from the Graphical Abstract in [152].

Figure 17.
Images of fungi recorded under multiphoton excitation (780 nm). Spore and sporal septa are easily recognizable in Micosporum canis (a), as well as septae in hyphae of Aspergillus flavus (b). can be clearly delineated in the multiphoton image. Reproduced with permission from AIP Publishing from 043703-2 Lin et al. Appl. Phys. Lett. 95, 043703; 2009. doi:10.1063/1.3189084 [155].

Figure 18.
Autofluorescence imaging of Arthrobotrys ferox colony (A) and spores (B), recorded in the 400–600 nm spectral range. The cell wall of spores exhibits higher fluorescence than hyphae. Scale bar = 12.5 mm; fluorescence intensity indicated by the color scale. Reprinted with permission from [156].

Figure 19.
Hindwing of a male Troides magellanus. Sequence, left to right, of images showing the surface of yellow scales with parallel ridges on a basal slab; the ridges observed laterally with their micro-ribs, organized with an average angle of 61° with regard to the ridge crest and the arrow pointing towards the pedicel of the scale; a cross section of the array of the ridges on the scale upper part, at transmission electron microscope, showing each ridge as a support with triangular cross section and side protrusions making micro-ribs to appear as one-dimensional grating. Reprinted and modified with permission from [185].

Figure 20.
Parides species show differently wing scales, as to structure and color (resulting in different reflectance spectra. Each line shows: butterfly species and related reflectance spectra of wing areas of different colors, micrograph and scanning electron microscopy image of scale: Parides quadratus, yellow and black (A–D); P. erithalion zeuxis, olive and small yellow and red spots (E–H); P. aeneas bolivar, green and burgundy spots (I–L); P. childrenae oedippus, green-colored and red (M–P). Bars: 1 cm 1st column; 100 μm 3rd column; 1 μm 4th column of pictures [184].

Figure 21.
Representative graphical summary of typical nanostructures detectable in living beings, comparable to photonic crystals: multilayers (A), Bragg stacks (B), nanorod periodic arrays (C). Reprinted and modified with permission from [190].
Figure 21.
Representative graphical summary of typical nanostructures detectable in living beings, comparable to photonic crystals: multilayers (A), Bragg stacks (B), nanorod periodic arrays (C). Reprinted and modified with permission from [190].

Figure 22.
Representative graphical summary of a male H. coerulea beetle (a), with the scales which cover the elytra (b), the photonic structure in a 100 nm thick envelope, consisting in a periodic structure composed by layered and microporous cuticular material (mostly chitin) (c,d). Representation of the photonic structure of the scale as a “Photonic cell”, with different permeability to water and ethanol due to the physicochemical properties of the envelope (e). Reprinted with permission, and partially modified, from [191].

Figure 23.
Collection of various fishes from the seaside and their autofluorescence patterns: Cephaloscyllium ventriosum (swell shark, (A)); Urobatis jamaicensis (ray, (B)); Soleichthys heterorhinos (sole, (C)); Cociella hutchinsi (flathead, (D)); Synodus dermatogenys (lizardfish, (E)); Antennarius maculatus (frogfish, (F)); Scorpaenopsis diabolus (false stonefish, (G)); Kaupichthys brachychirus (false moray eel, (H)); Kaupichthys nuchalis (false moray eel (I)); Corythoichthys haematopterus (pipefish, (J)); Gillellus uranidea (sand stargazer, (K)); Eviota sp. (Gobi, (L)); Eviota atriventris (Gobi, (M)); Acanthurus coeruleus, larval (surgeonfish, (N)); Scolopsis bilineata (threadfin bream, (O)) [202].

Figure 24.
Upper line: iris of Trypterygion delaisi observed under normal, natural conditions (A), and in laboratory conditions by using a blue light illumination and a red filter, allowing to observed the changes in iris distribution of the red fluorescence (B,C). Lower line: Phase contrast (A), and fluorescence (B) of crystals obtained from the fish iris (the layer of iridophores contains packer quinidine crystal). Not all crystals fluorescence in red light [210].

Figure 25.
Representative image summary of green fluorescence typical of some sharks, the chemical synthetic pathways and the structure of the fluorophore are shown, along with the overall visual appearance of the Swell shark, and the topological accumulating sites of the fluorophore in the skin denticle structures of Chain shark. Reprinted with permission, Graphical Abstract in [212].

Figure 26.
Representative summary on fluorescing sites and their topological localization in chameleons (Chameleon globifer, (A); C. globifer, (B); C. crypticum, (C); C. guibei, (D)). The sequence of images taken from the head at different steps of processing (form alive to the skull) and under different illumination conditions allow to ascribe fluorescing sites to the skull tubercles (A,D). Fluorescence excitation-emission matrix (B), and details of fluorescing tubercle detectable in intact skin (C) [214].

Figure 27.
Representative summary of different species of pumpkin toadlets: Ethanol preserved Brachycephalus pitanga (a–d), Brachycephalus ephippium (e–h), Ischnocnema parva ((i–l), live in (i,j)). Images recorded under different light illumination conditions (first three columns from the left, respectively, representing images collected under illumination with natural light; UV-365 nm, UV-365 nm and 472 nm centered filter for observation), or following reconstruction from computerized micro-tomography to observe the skeletal structure (4th column). Ischnocnema parva does not exhibit detectable signal under observation with the 472 nm filter (k) [216].

Figure 28.
Representative image and graphical summary on the characterization of fluorescence from H. punctatus. Fluorescence observed directly from the skin under 400 nm excitation; schematic representation of tissue layers with the content in fluorophore and related spectral characterization (A), histology of dorsal cutaneous tissue from H. punctatus and Scinax nasicus, showing fluorescence rising from epidermis (e), dermis (d) and glands (gl) in the former, and only from the dermis pteridine layer (pl) in the latter (B). In H. punctatus the non-fluorescing chromatophores (ch) filter the blue region of the fluorescence rising from dermis and glands. As a result, emission spectra show a green shoulder (C). Bars: 50 μm (B); 150 μm and 20 μm ((C), upper and lower pictures). Reprinted with permission [217].

Figure 29.
A wild type (WT) and a recessive blue phenotype, lacking for yellow pigmentation observed under white or UV-A light illumination allows to appreciate that the yellow feathers on the crown of the WT exhibit a well appreciable yellow fluorescence (arrowhead). Reprinted with permission from [223].

Figure 30.
Images from Caprimulgus ruficollis (red-necked nightjar) on the detection of endogenous porphyrin red fluorescence under UV-395 nm-light excitation. Device used to collect the red fluorescence (a); flying red-necked nightjar illuminated by white light and showing typical white areas on tail and wings and no appreciable red color (b); Wing under-side illuminated by UV light, allowing to appreciate the reddish fluorescence along the rachis (c). Photographs by Carlos Camacho, reprinted from [228].

Figure 31.
Springhare from East Africa (Pedetes surdaster, specimen Field Museum of Natural History-FMNH-n. 73067, Chicago, Il, USA, originating from the Central Province of Kenia, 1952), observed on the dorsal (left) and ventral sides (right) under visible light or under 395 nm UV light. UV excitation allows to detect a reddish fluorescence on both dorsal and ventral surface areas. On the right, spectroscopic analysis from different specimens of P. surdaster (Field Museum of Natural History. Chicago, Il, USA). On the basis of the spectral shapes fluorescence is ascribed to porphyrins and to another unassigned fluorophore. Reprinted as a combination of Figure 1 and Figure 2 published in [230].

Figure 32.
Comparison between overall feature (a) and hormone control mechanisms of bioluminescence in sharks belonging to the families of Etmopteridae (Etmopterus spinax, on the left; E. molleri in the middle) and Dalatiidae (Squalolius aliae, on the right) (b). To note, the different effects of prolactine (PRL) and c-aminobutyric acid (GABA); respectively negative and positive common effects of amelanocyte-stimulating hormone (a-MSH) and melatonin (Mt); almost uninfluential effects of nitric oxide (NO). Reprinted with permission from [246].

Figure 33.
Pictures from the australian Omphalotus nidiformis, commonly called ghost fungus, taken under natural illumination in the daylight (A), and following a long exposure in the dark to collect its own light (B). Form a woodland with prevailing Eucalyptus fasciculosa trees as the study site in the Kangaroo Island (C). Insect sticky trap (D). (Pictures (A,C,D), by the Author PW, (B) recognizing the courtesy of Australian Museum/Ray Kearney) [252].

Figure 34.
Simplified representation of the main redox based metabolic activities based on the coenzymes NAD(H), NADP(H) and flavins. Modified from [17].
Figure 34.
Simplified representation of the main redox based metabolic activities based on the coenzymes NAD(H), NADP(H) and flavins. Modified from [17].

Figure 35.
Autofluorescence distribution patterns recorded from cultured, living pig cells. The signal recorded from the cytoplasm around dark nuclei is greatly due to mitochondrial NADH, allowing to appreciate a mitochondrial typical distribution in mature cells (b), as compared with the most diffuse fluorescence pattern in immature stem cells (a), where these organelles are typically lesser, smaller and round shaped (a). Brighter particles are significant of the presence of lipofuscins (c,d). Excitation 366 nm, emission 420–600 nm band. Bar: 20 πm [17].

Figure 36.
Images from normal parathyroid glands, collected under white light (A,C,E) and under near NIR excitation (690–790 nm), which allows to easily detect the glands according to their autofluorescence visualized as a blue light (B,D,F) [332].
Figure 36.
Images from normal parathyroid glands, collected under white light (A,C,E) and under near NIR excitation (690–790 nm), which allows to easily detect the glands according to their autofluorescence visualized as a blue light (B,D,F) [332].


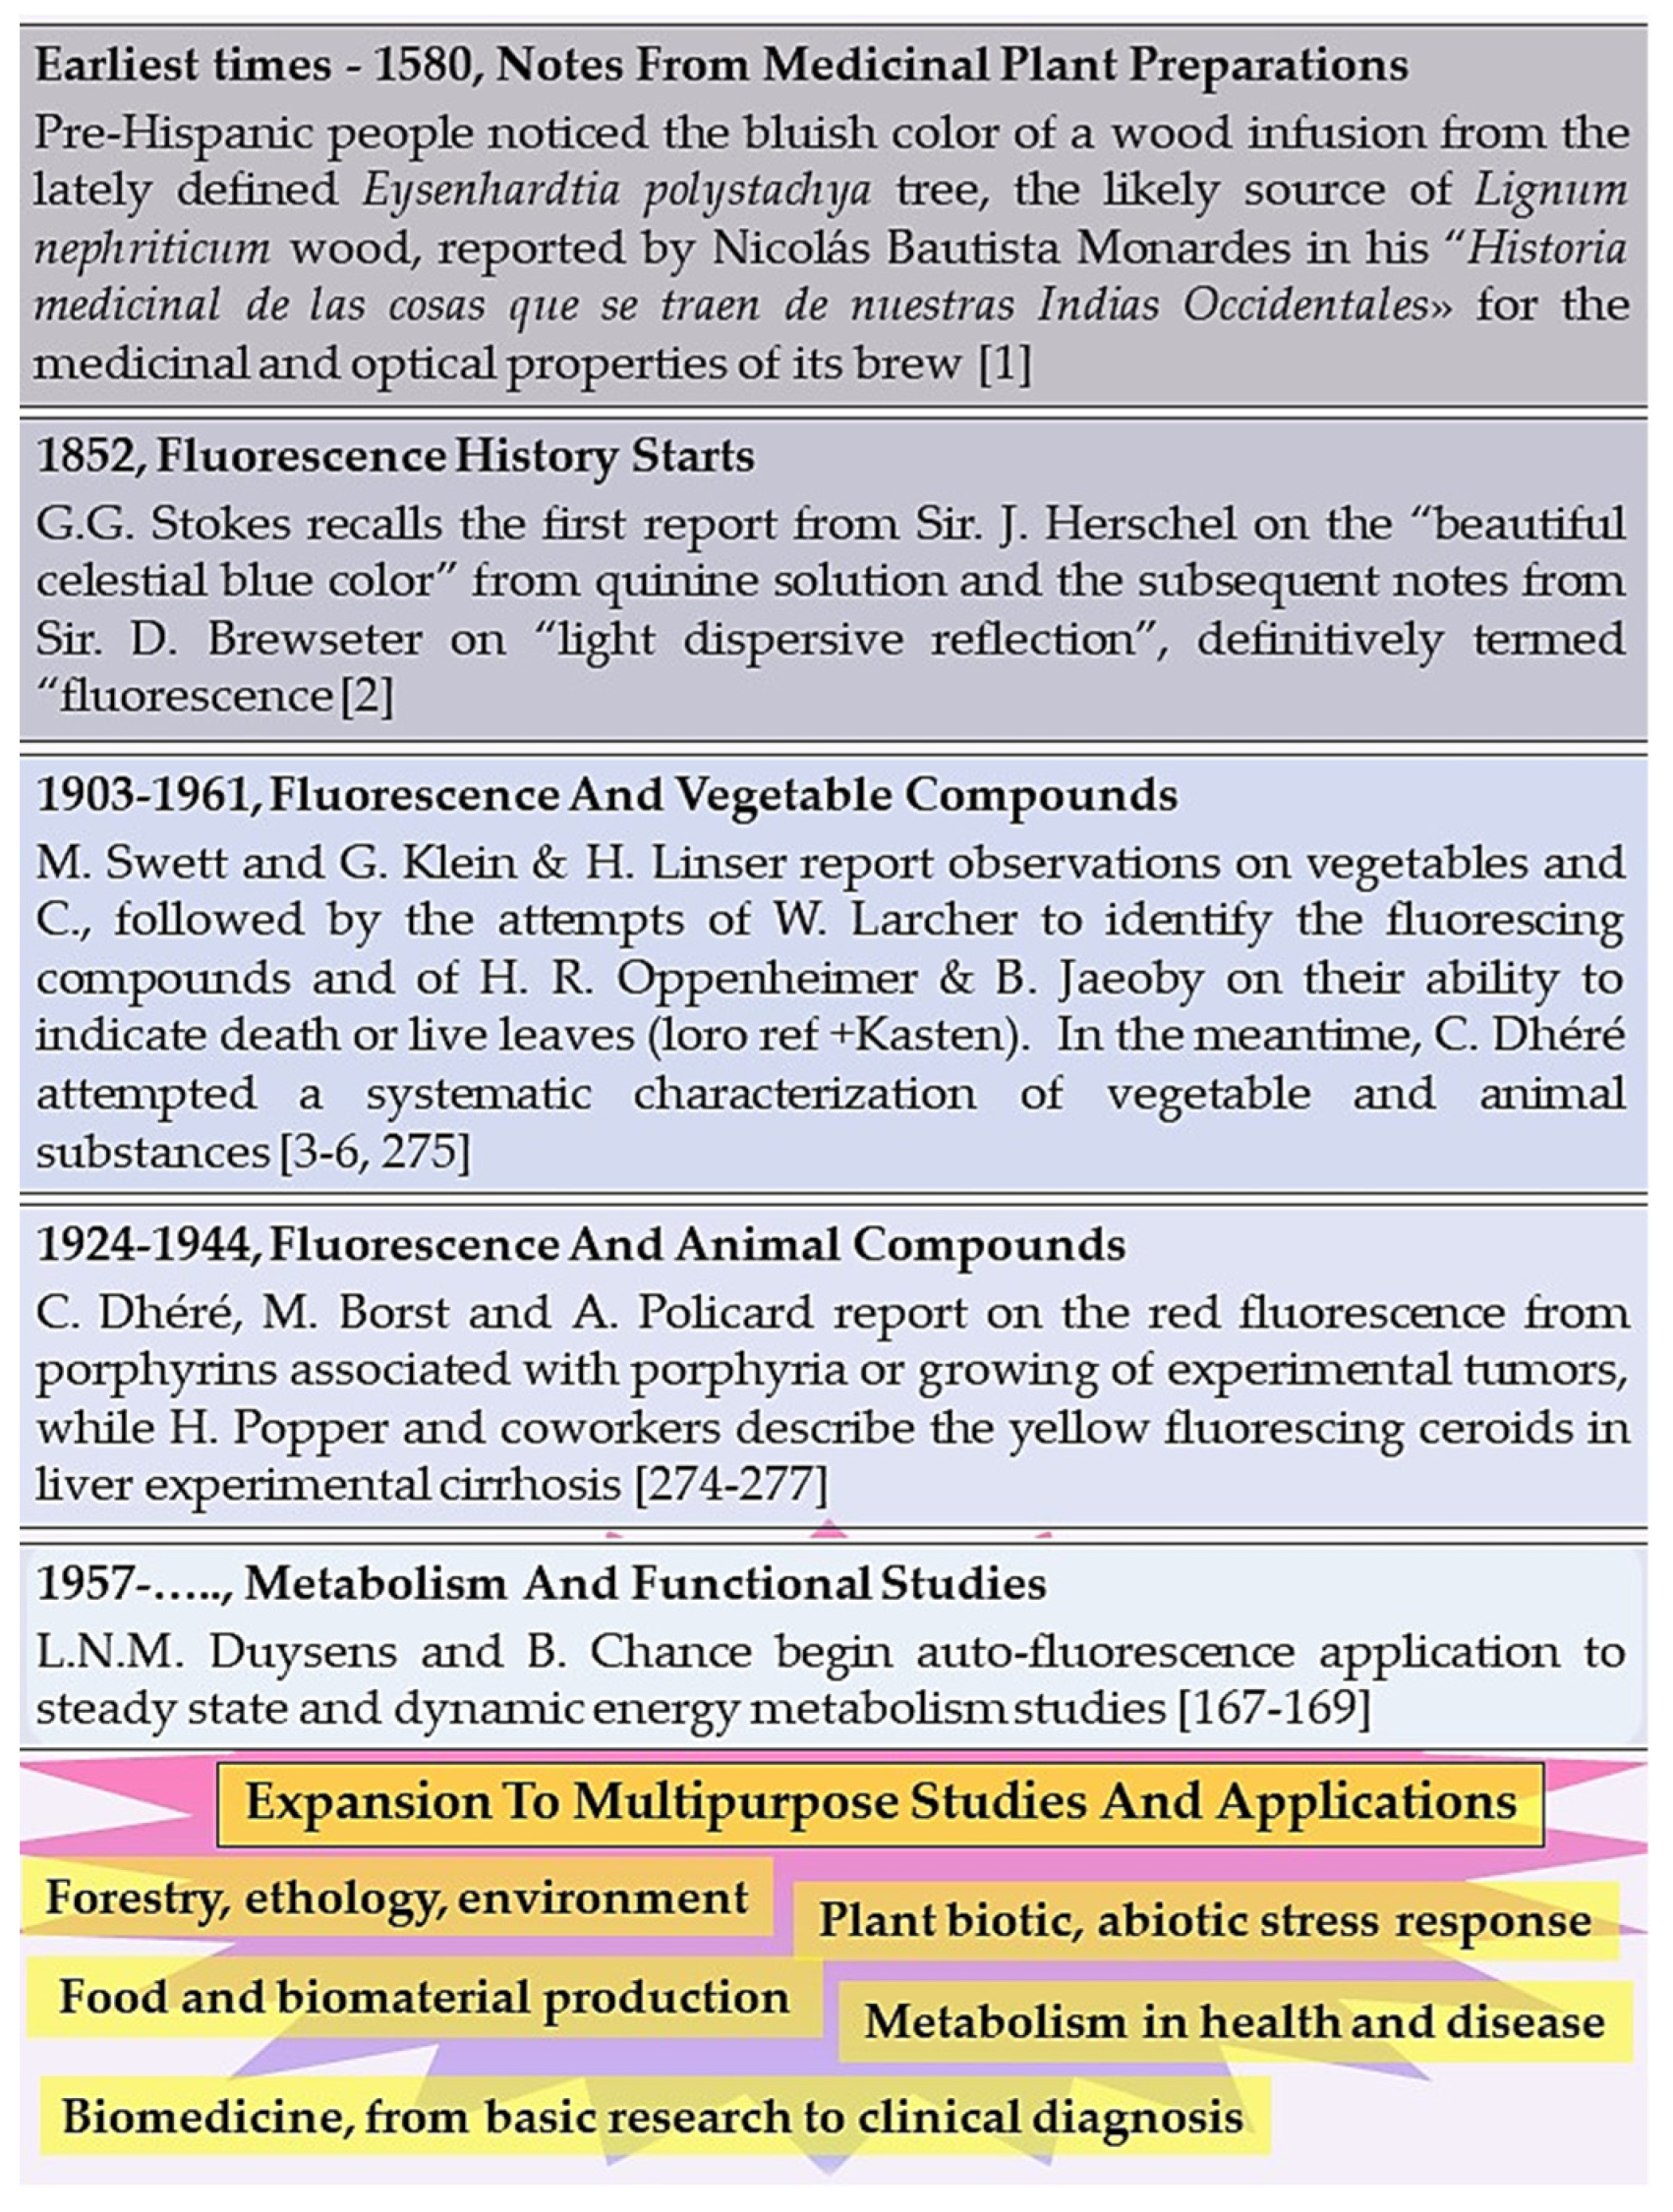
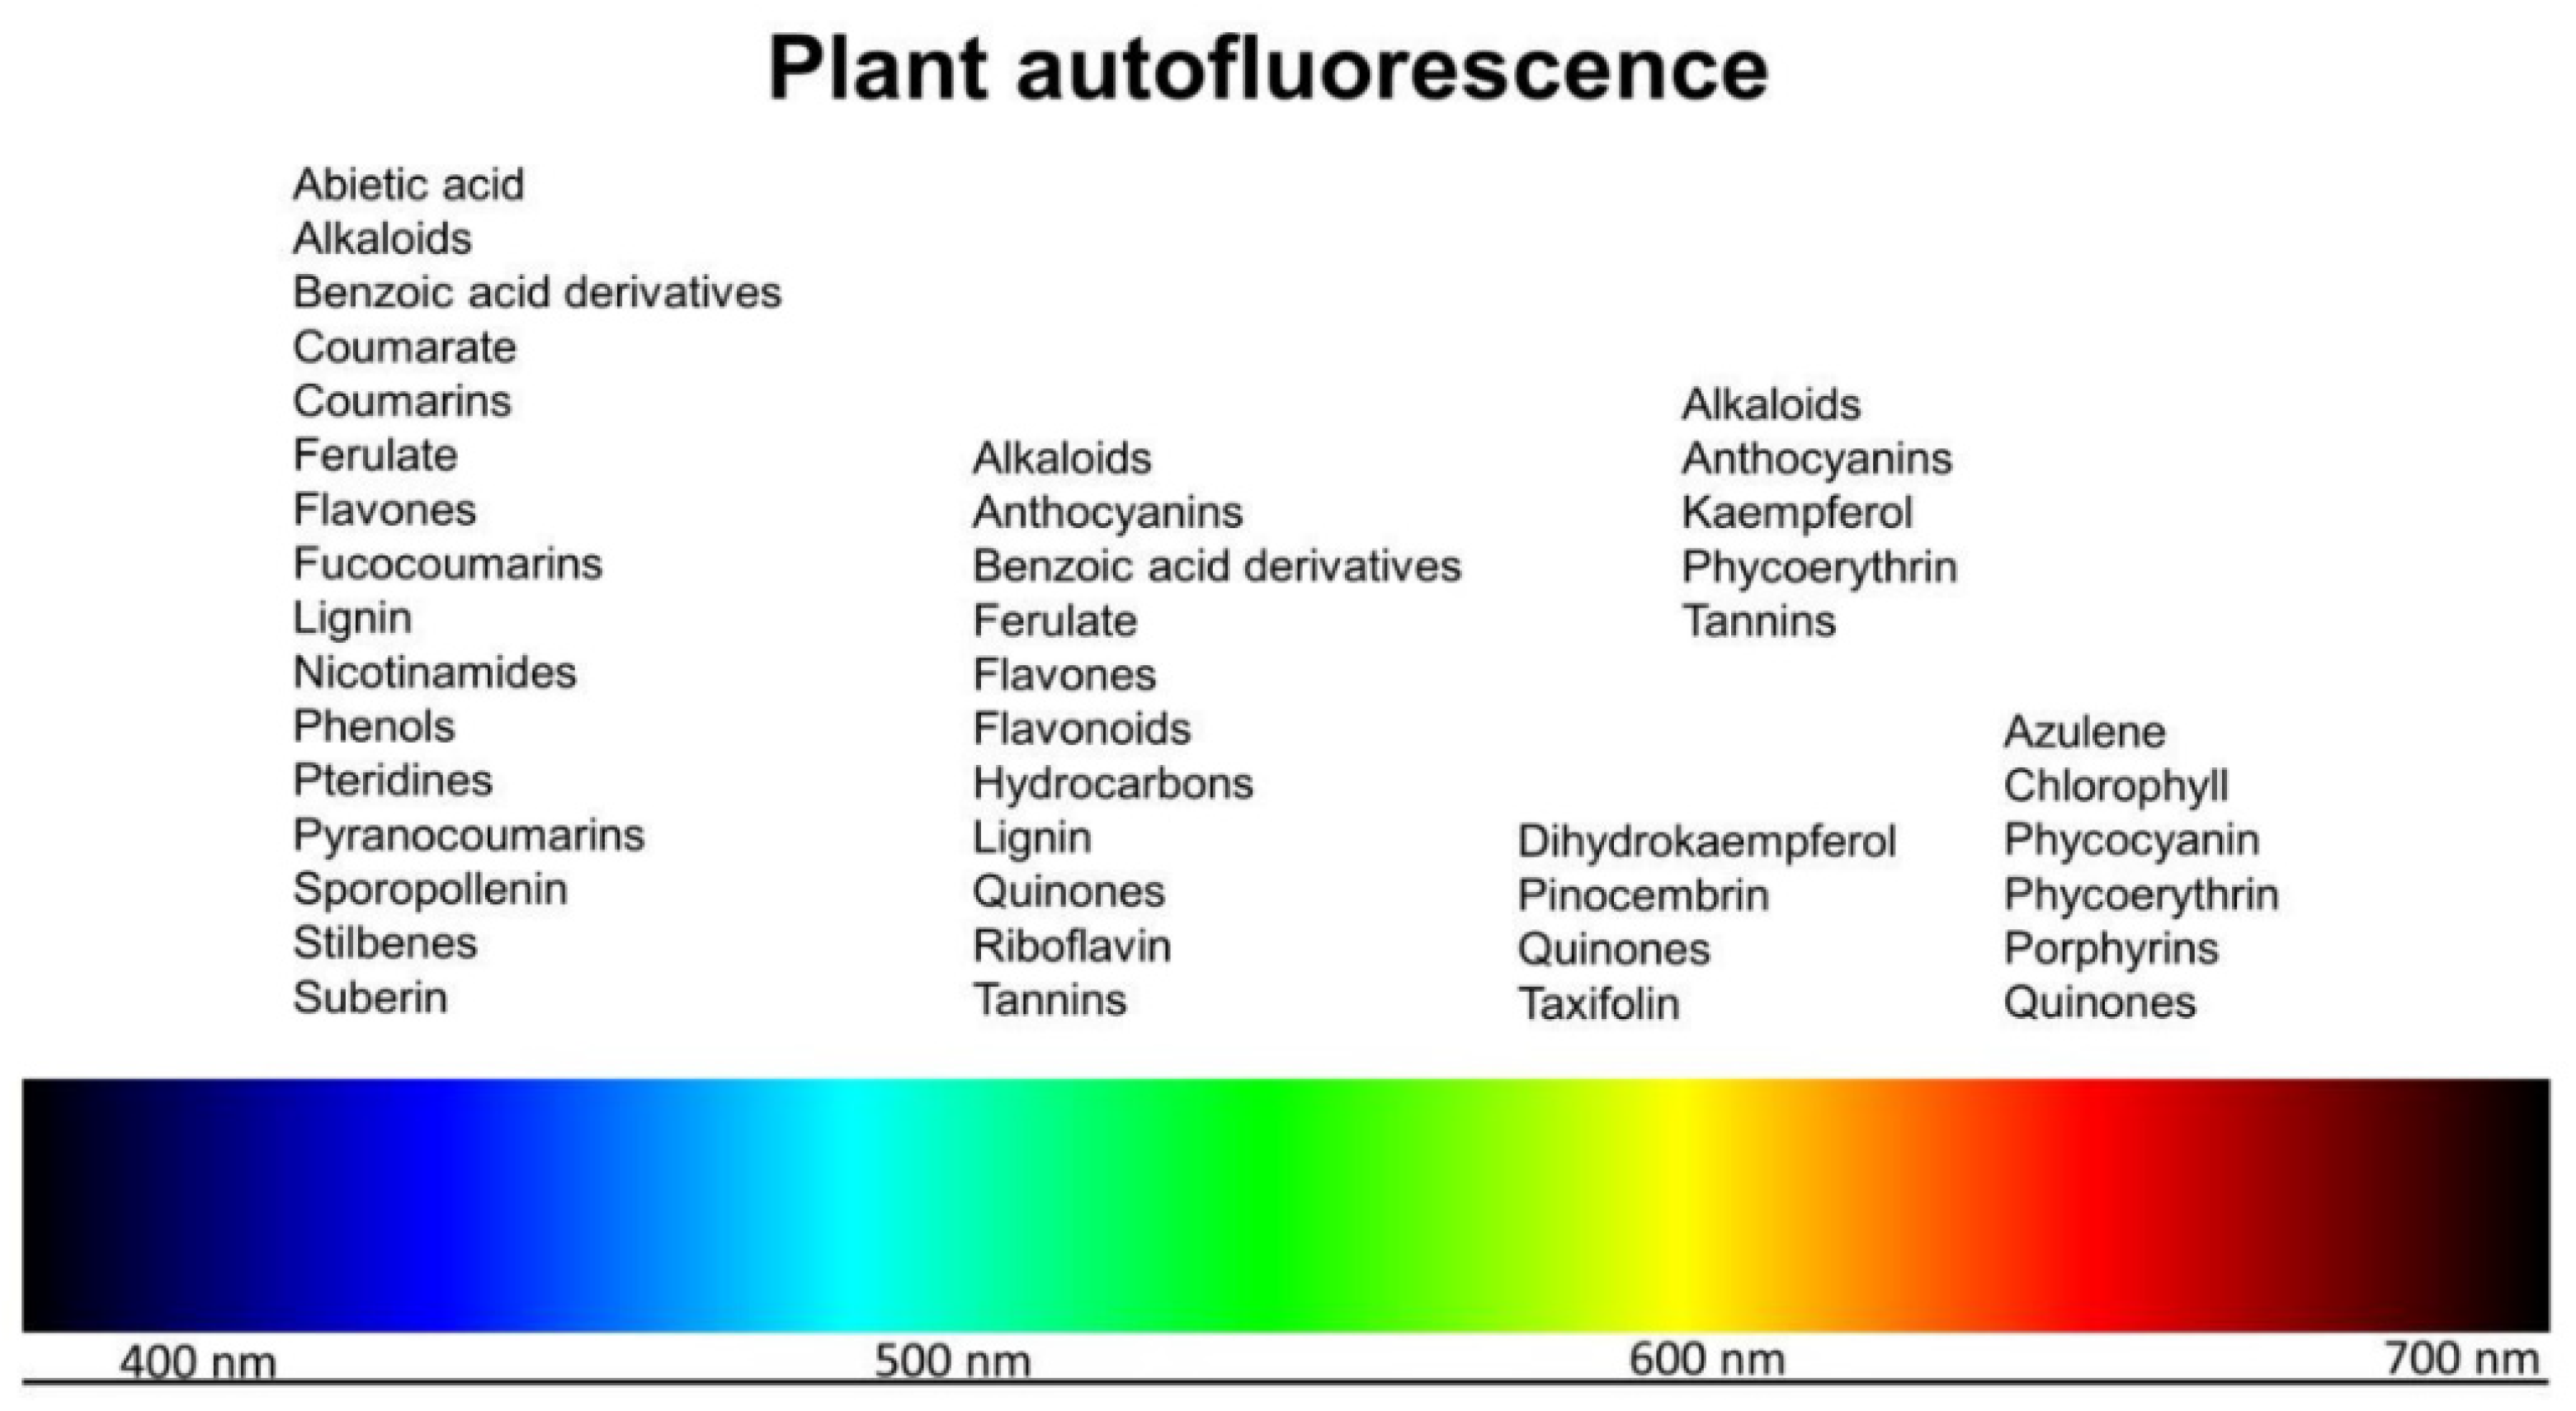
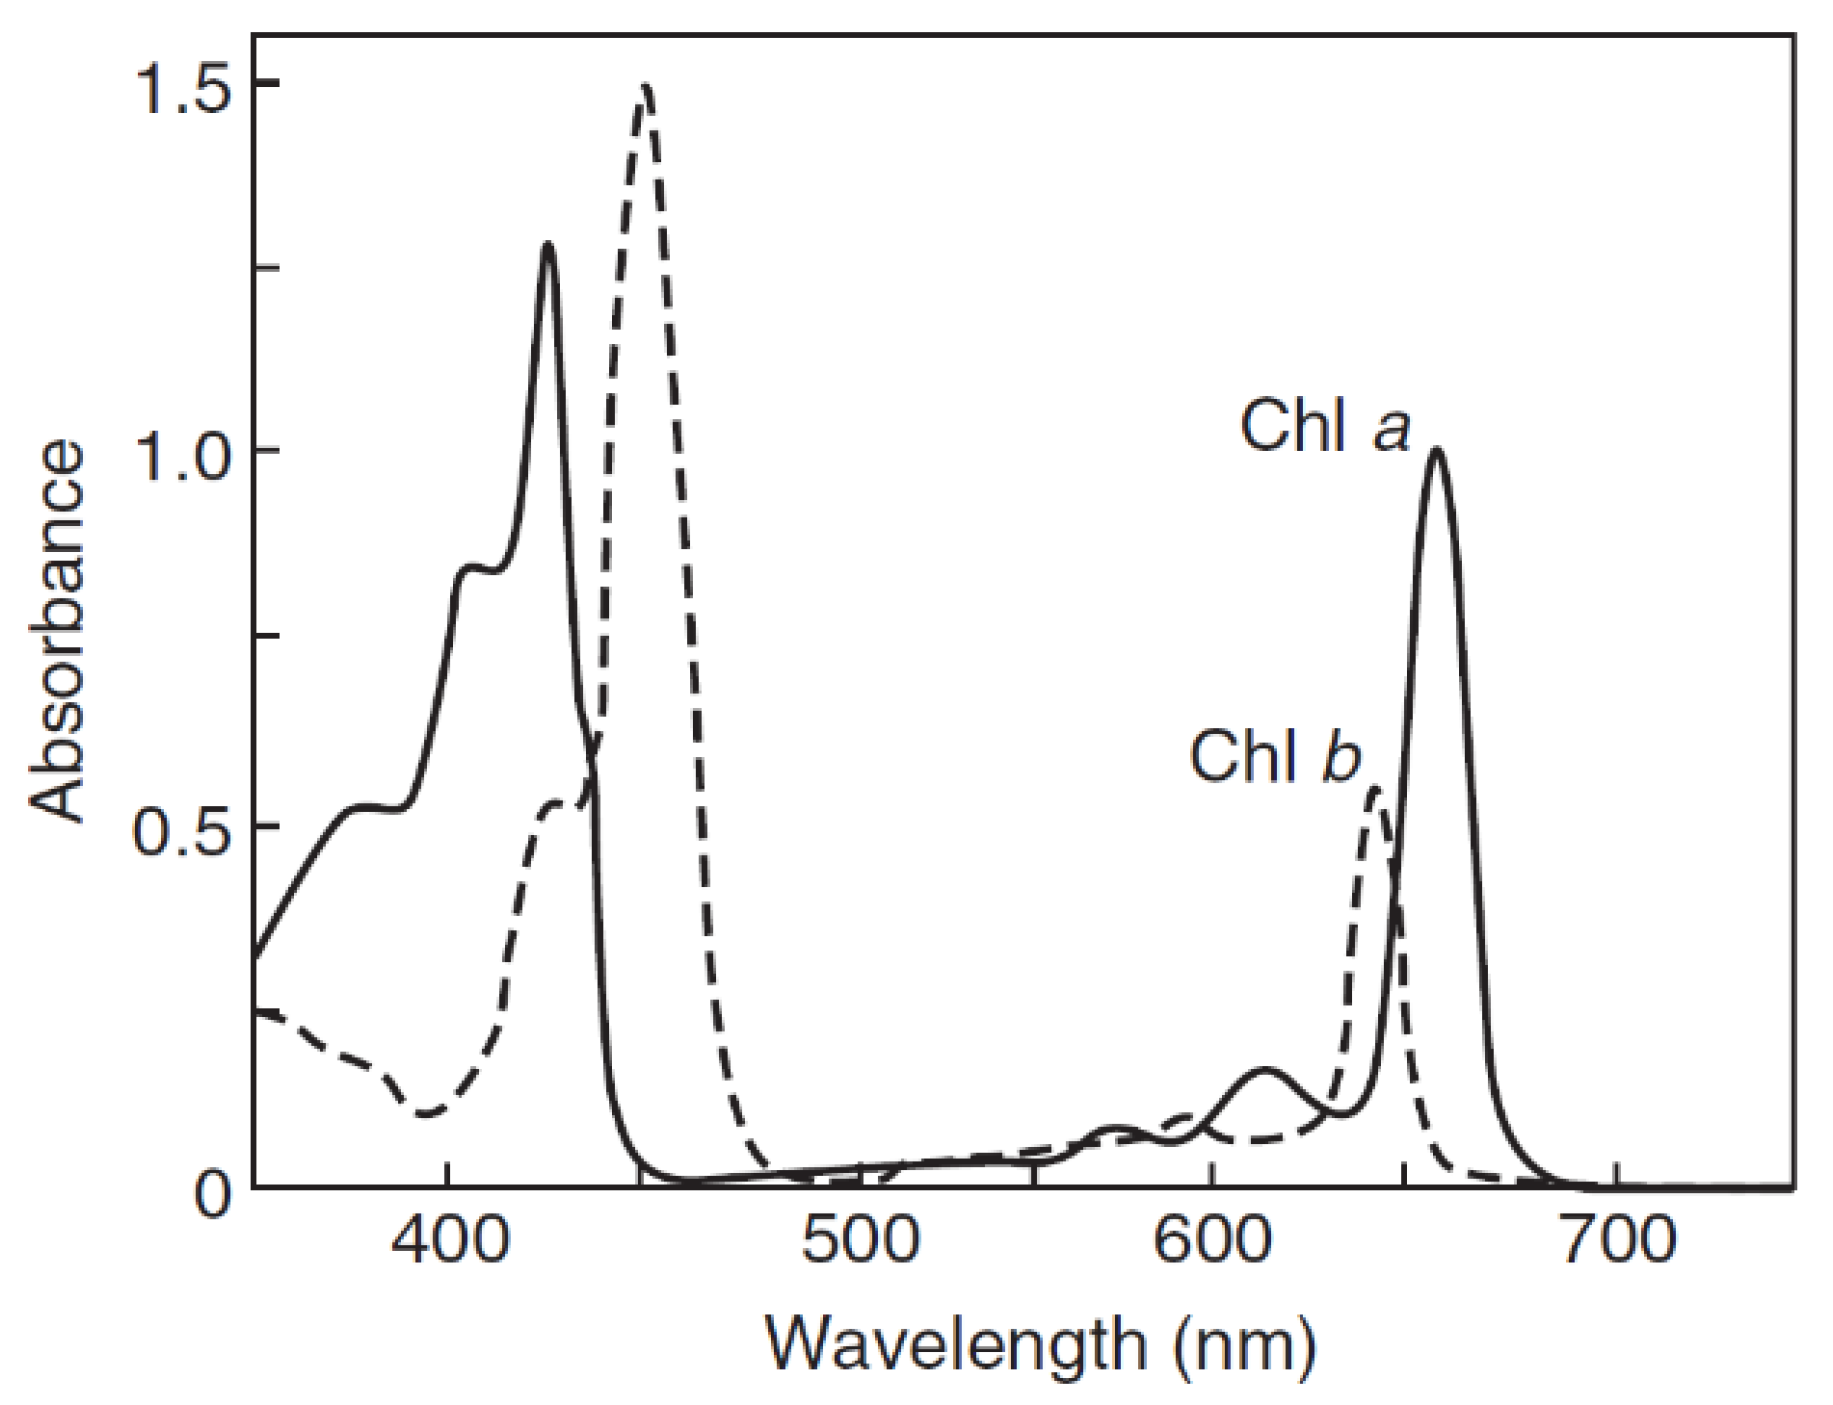
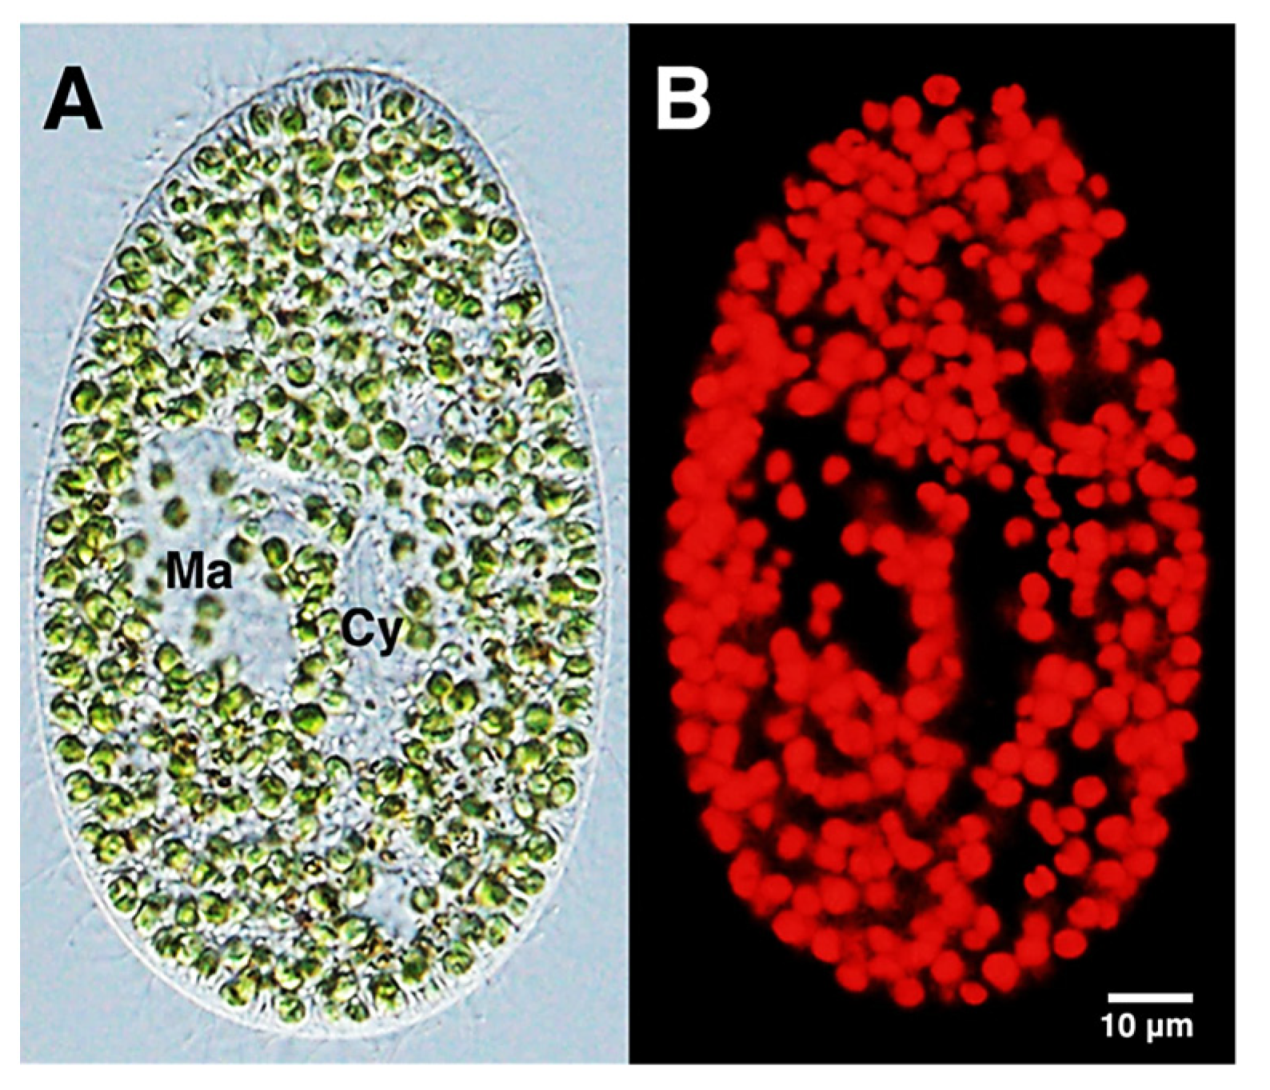
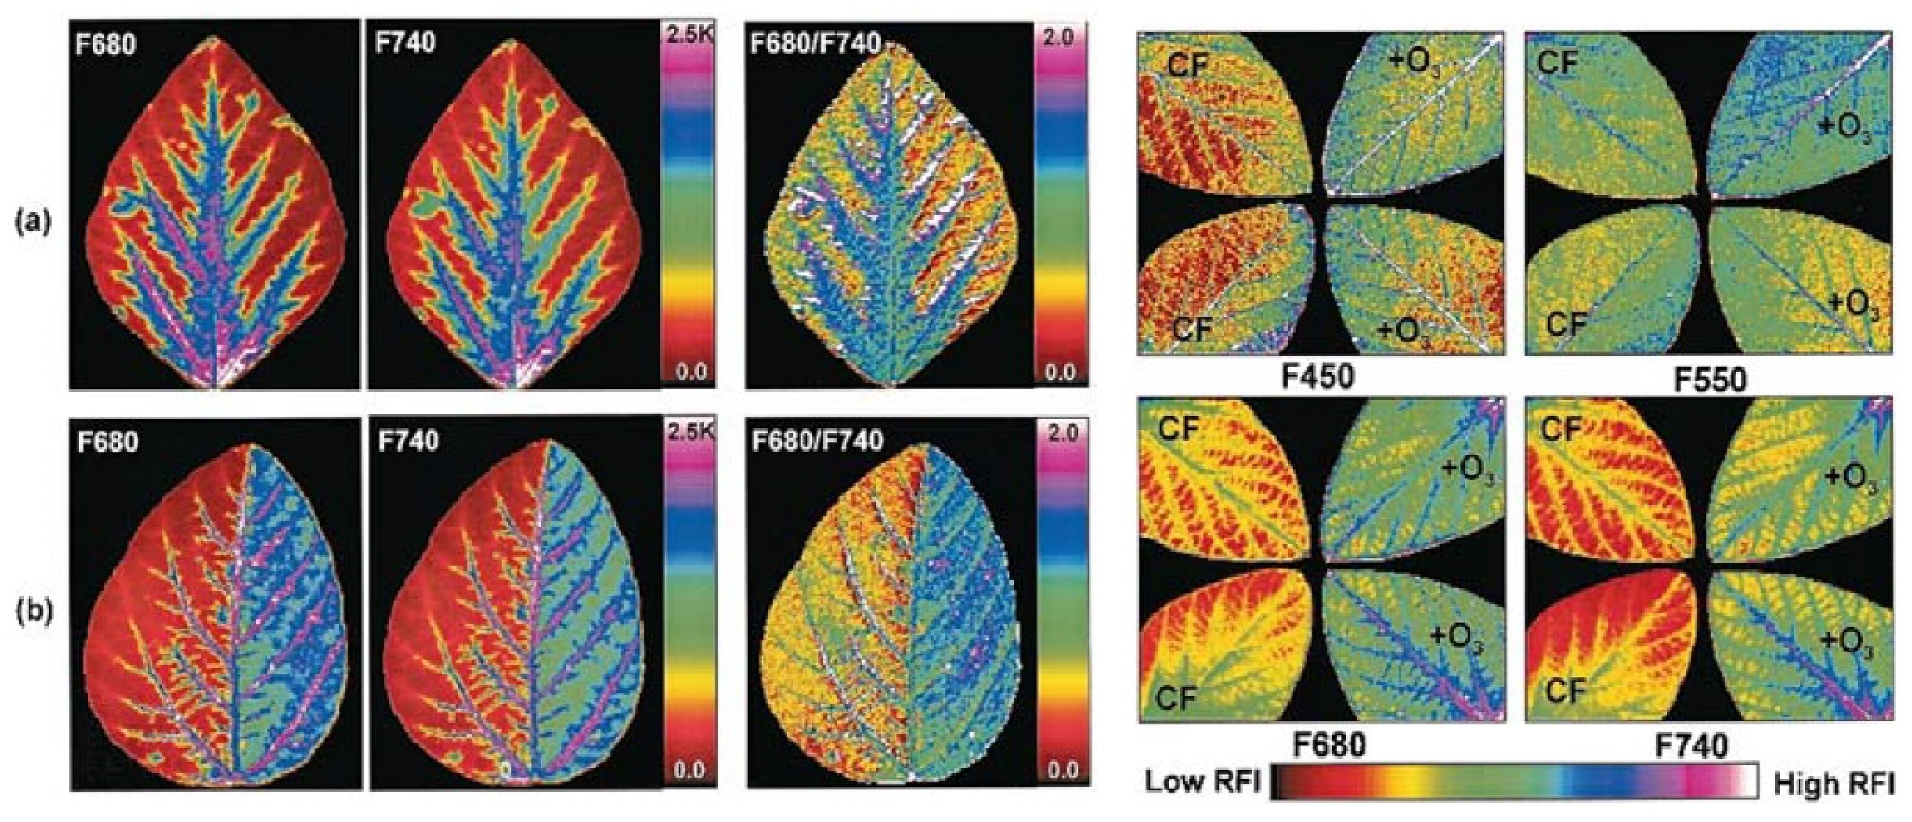
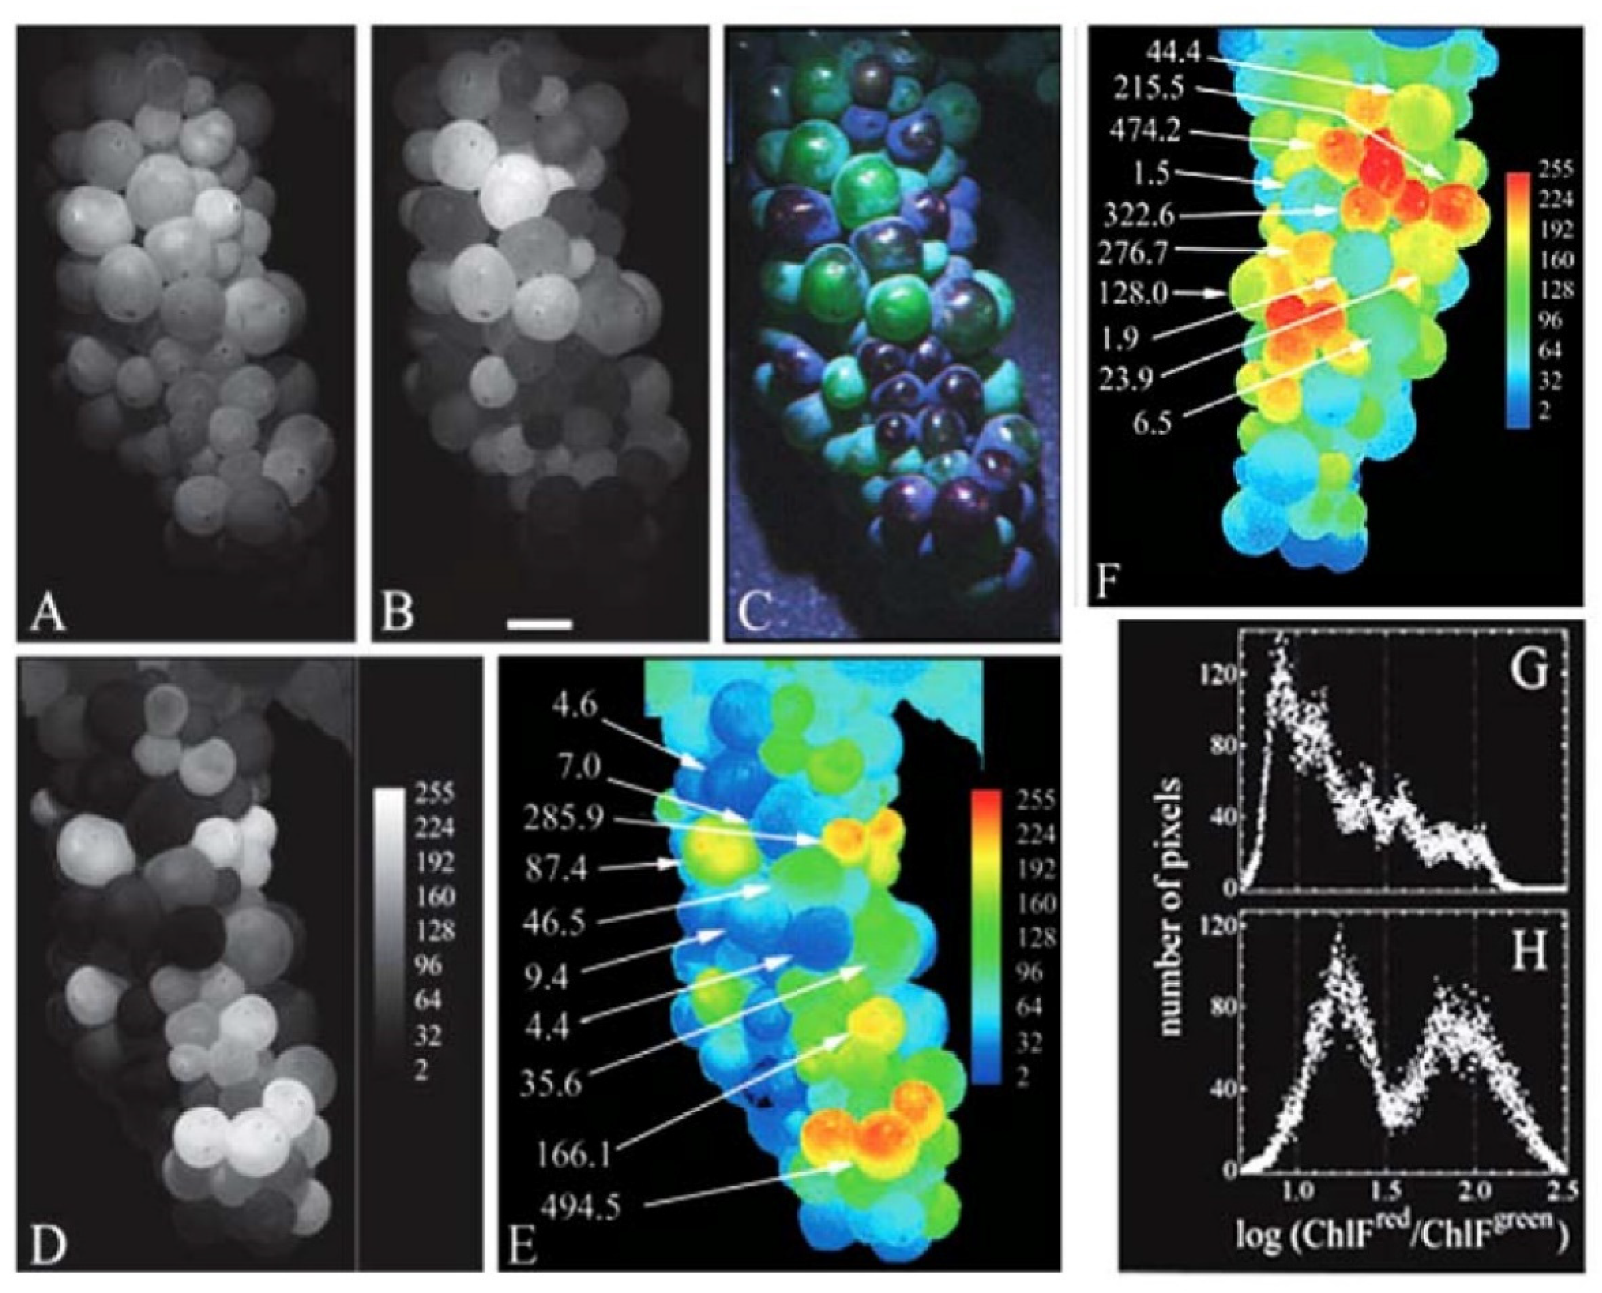
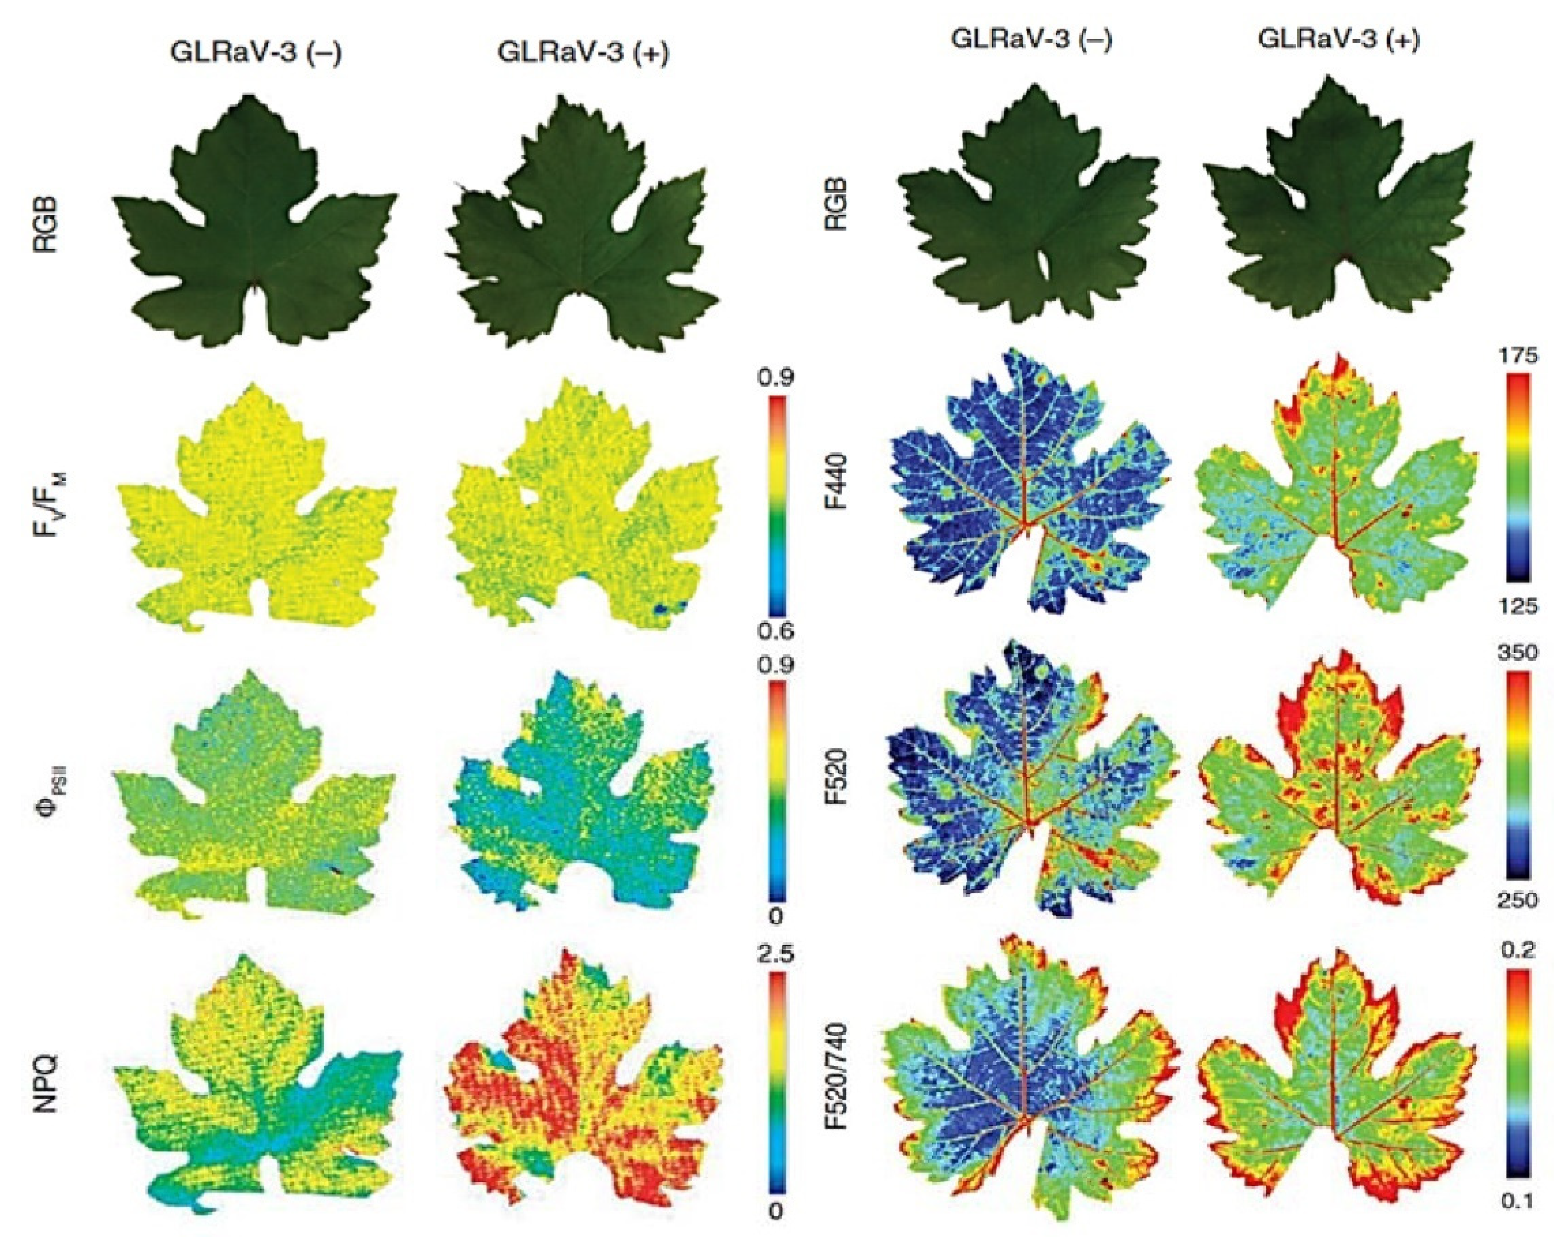
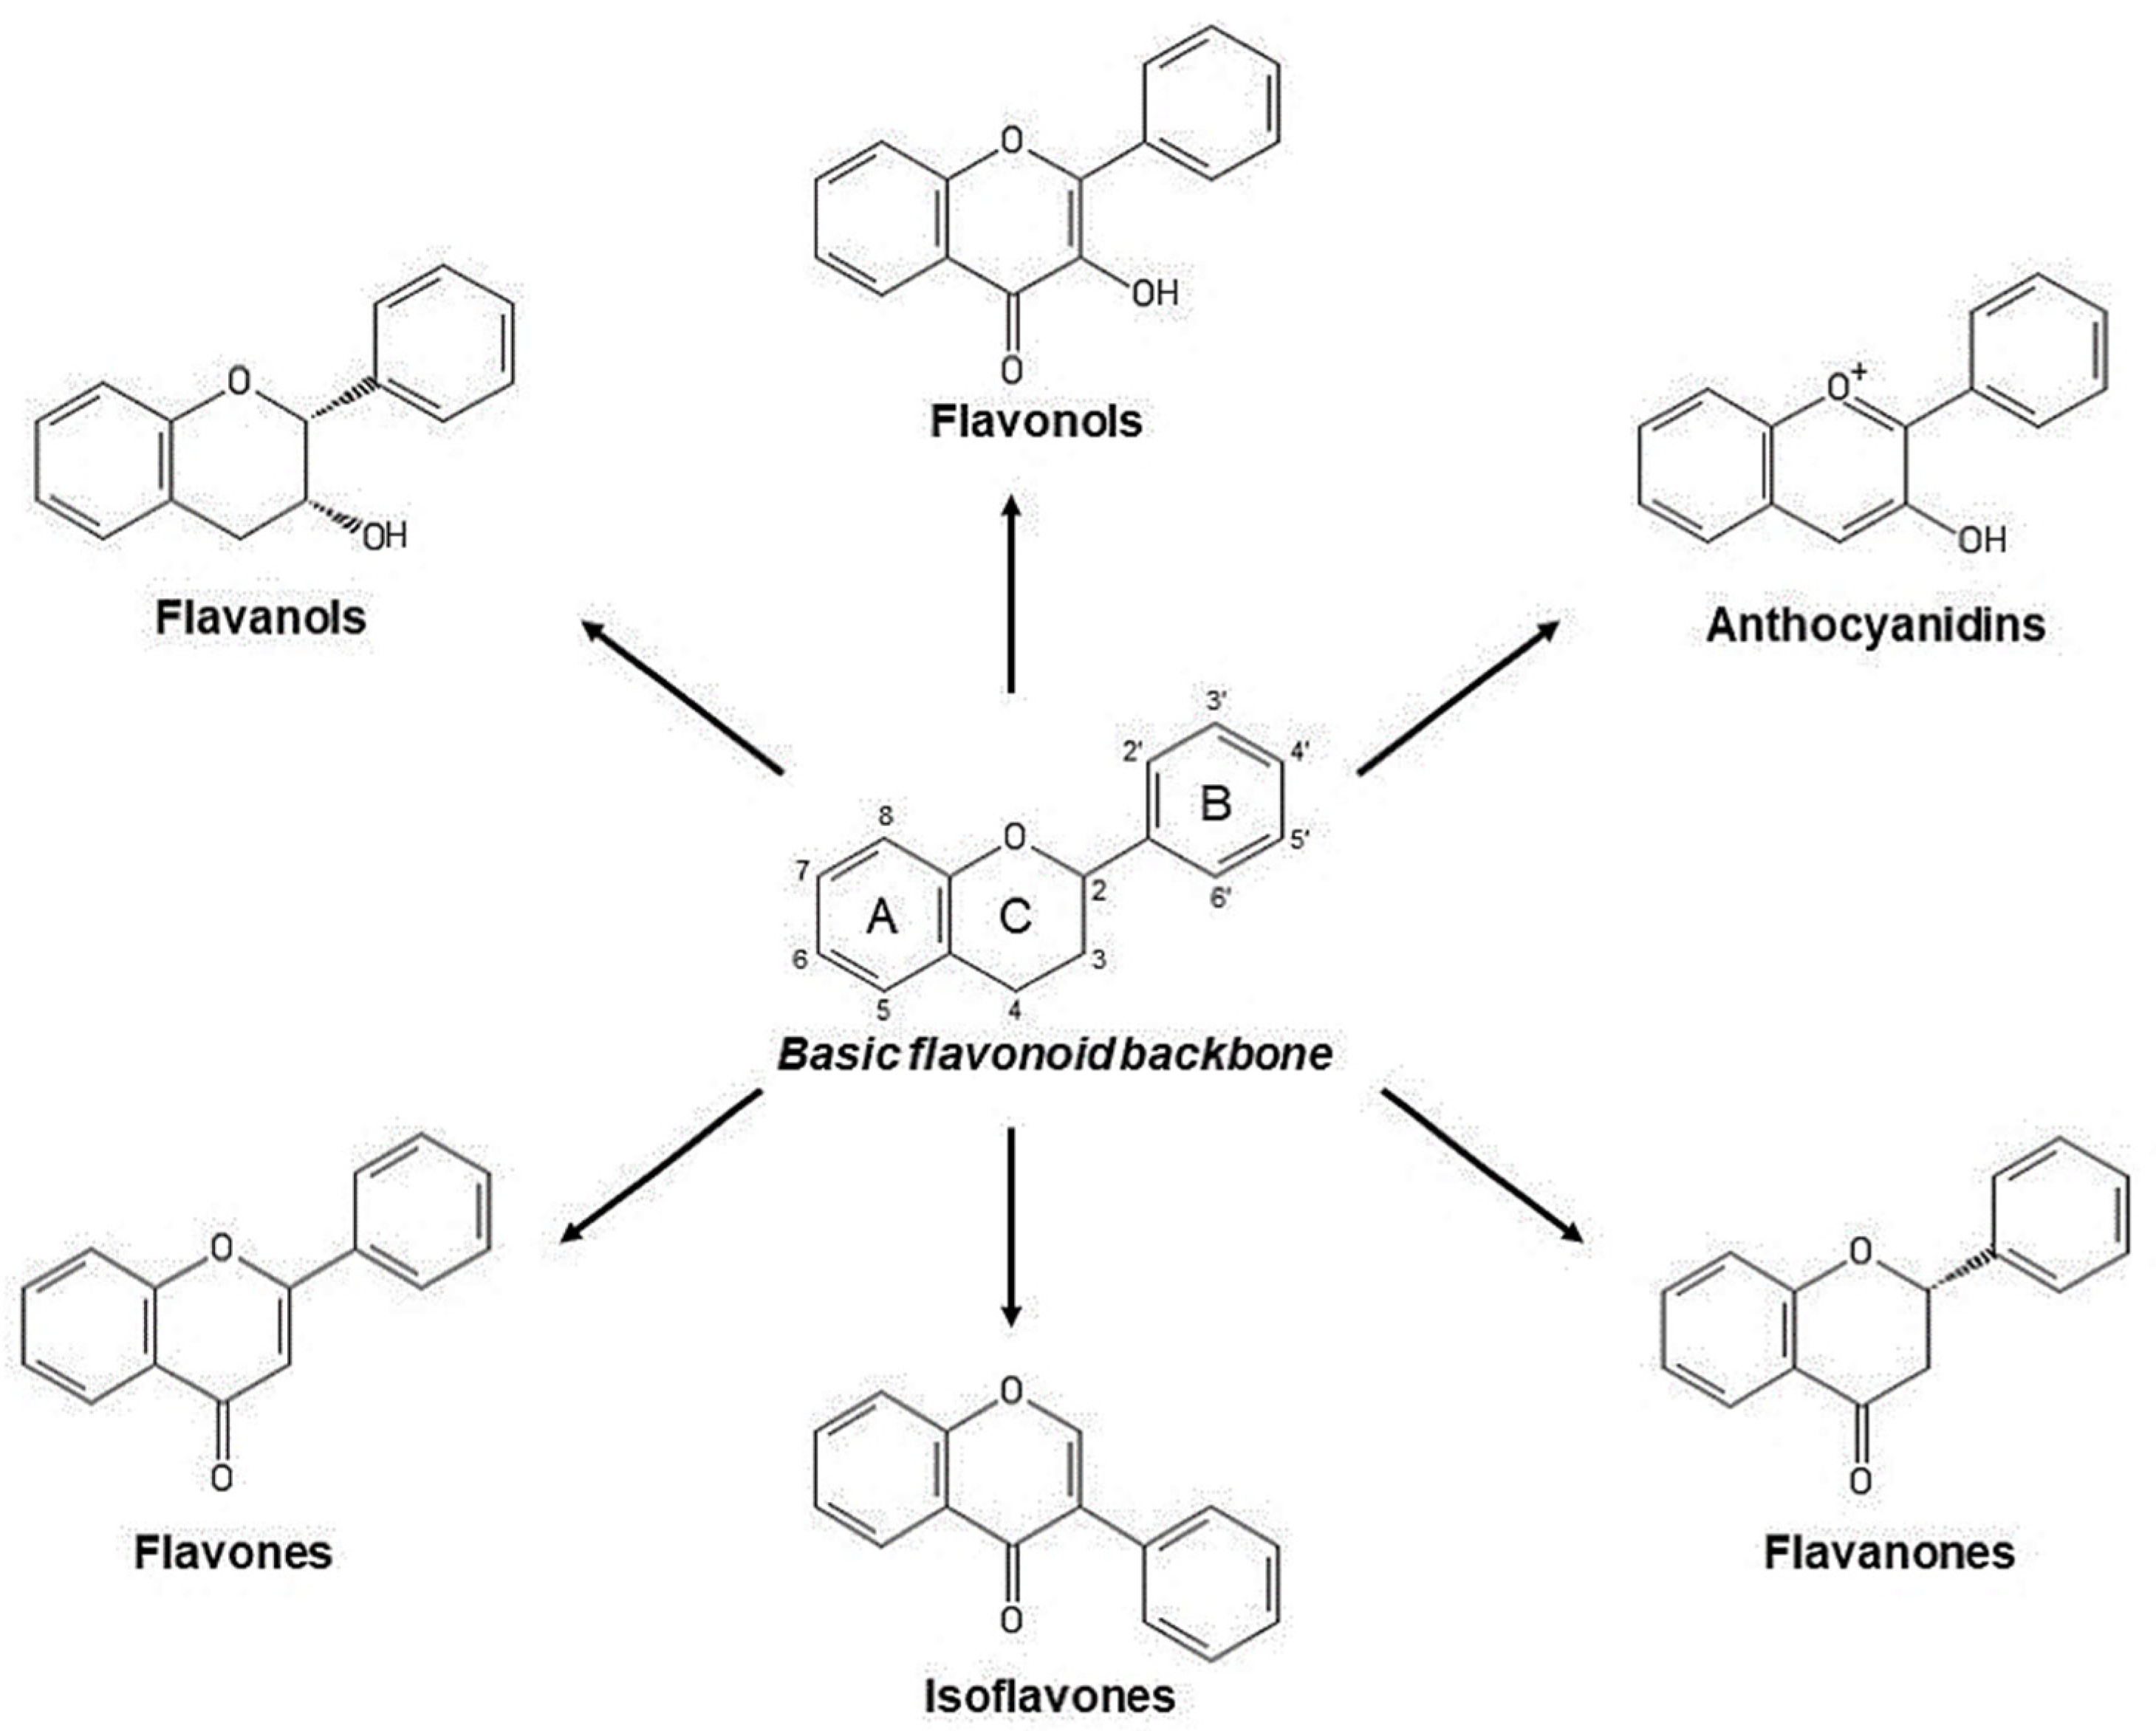
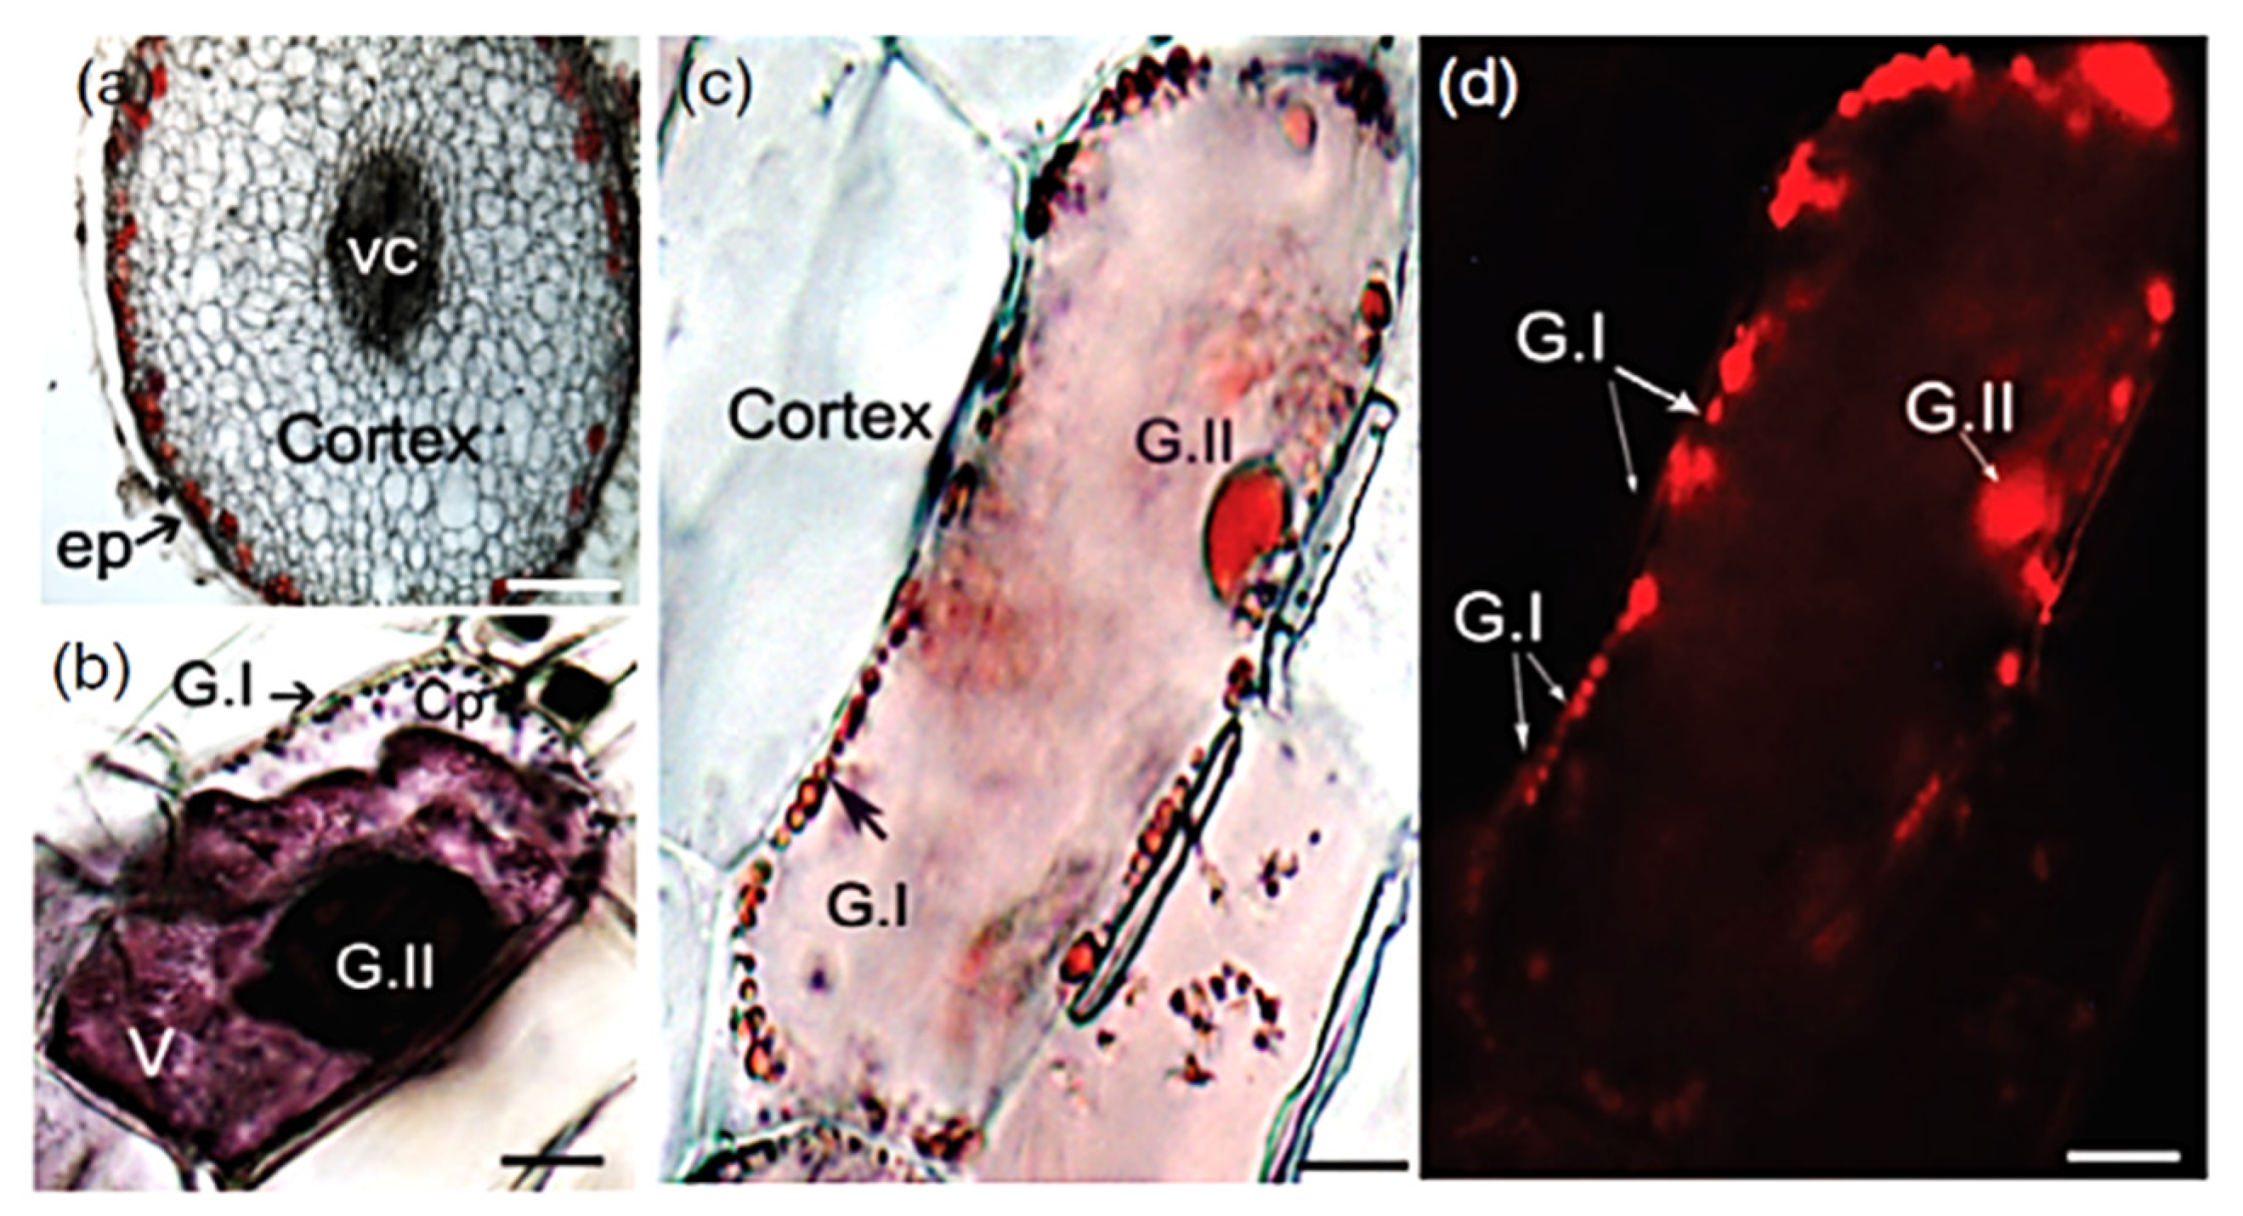
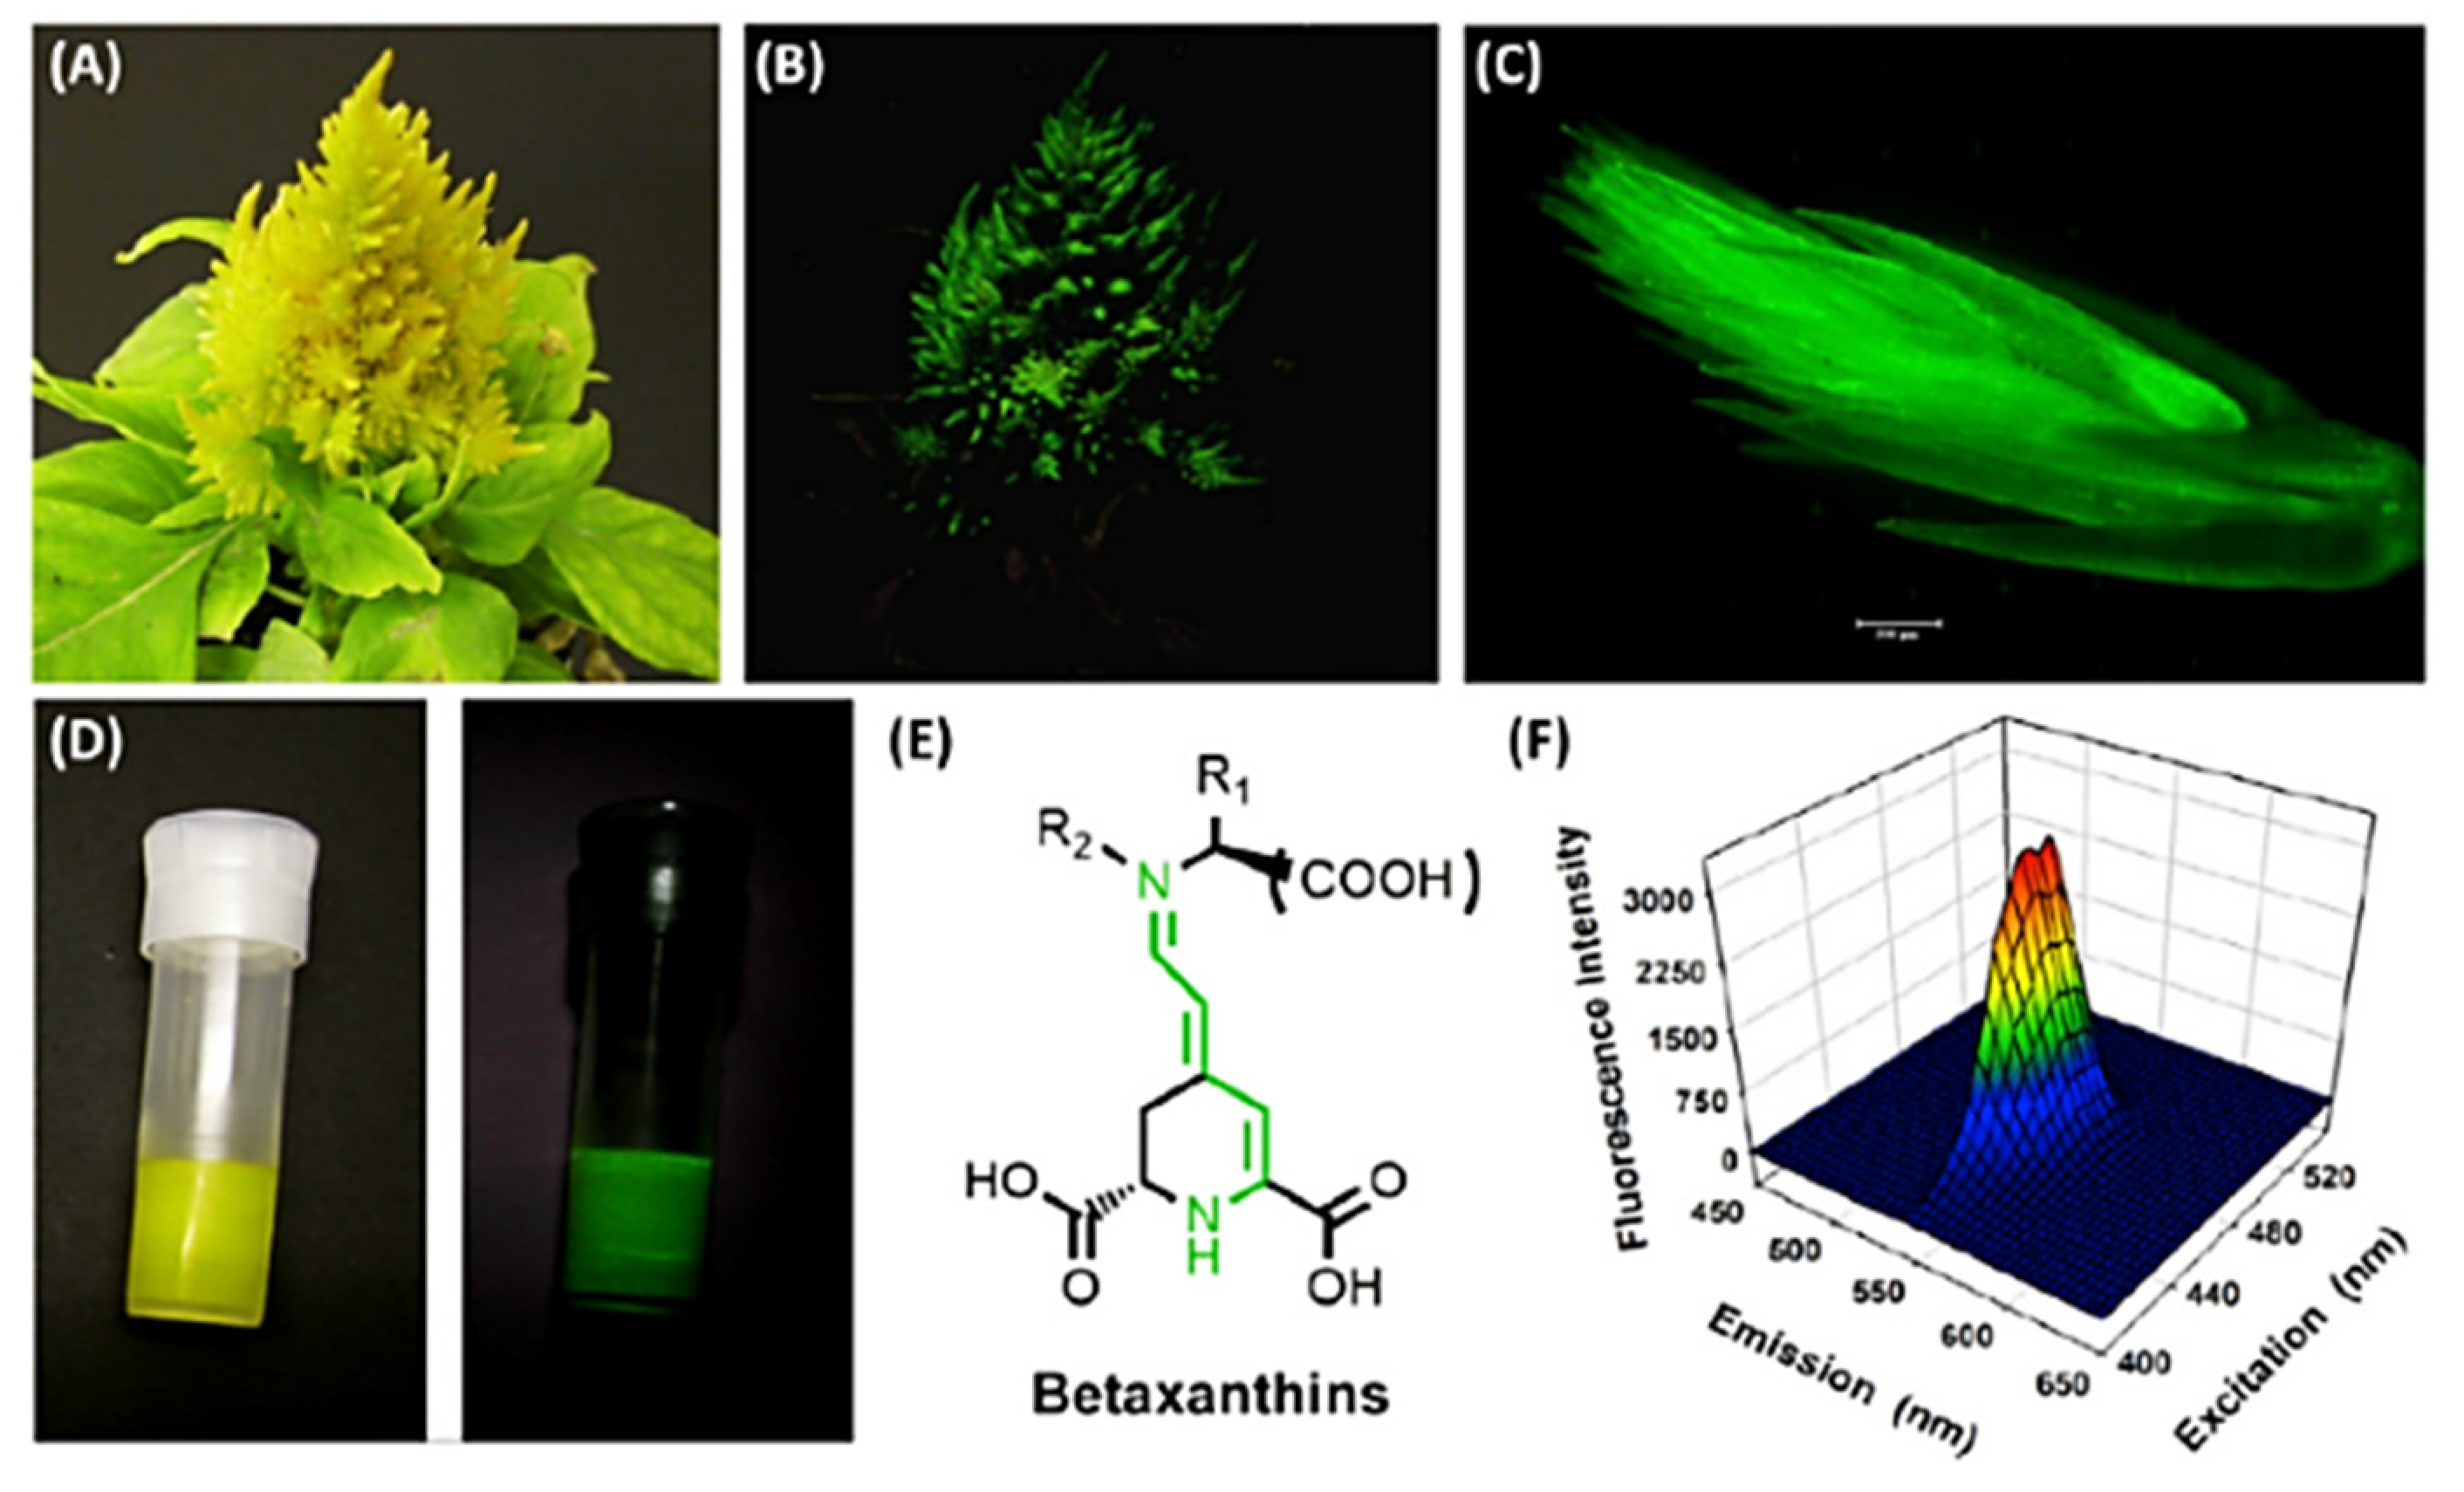
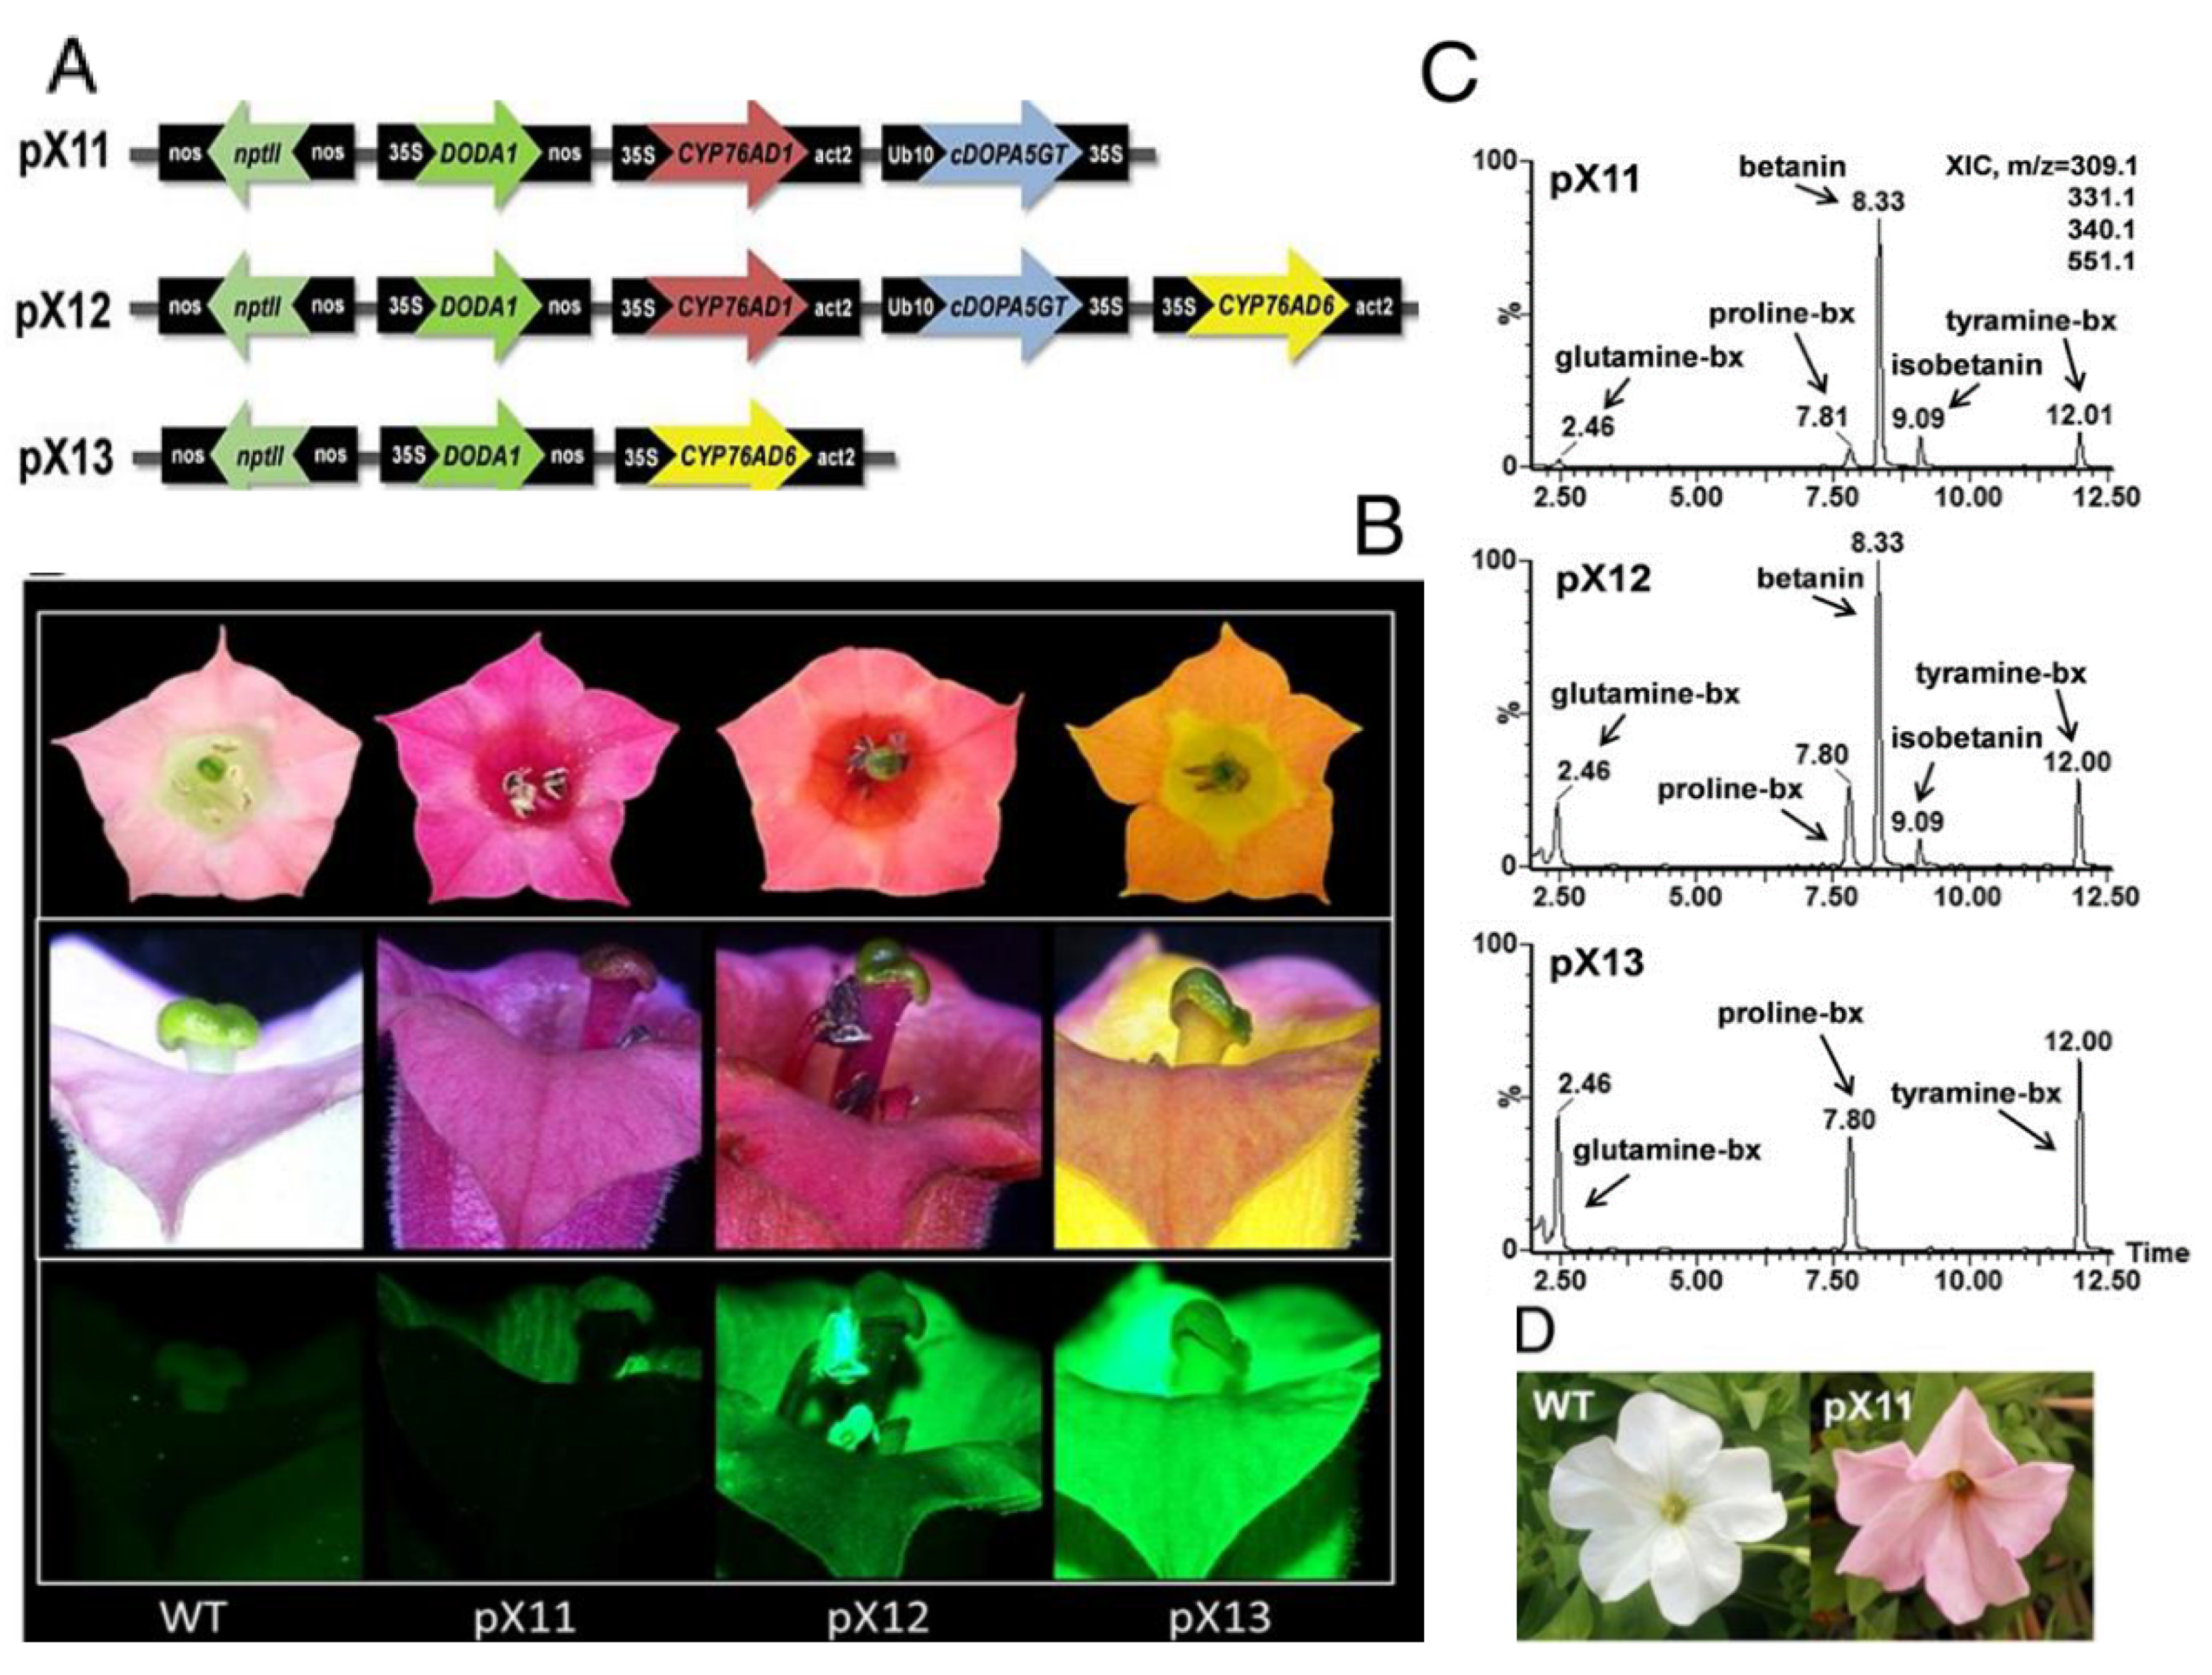
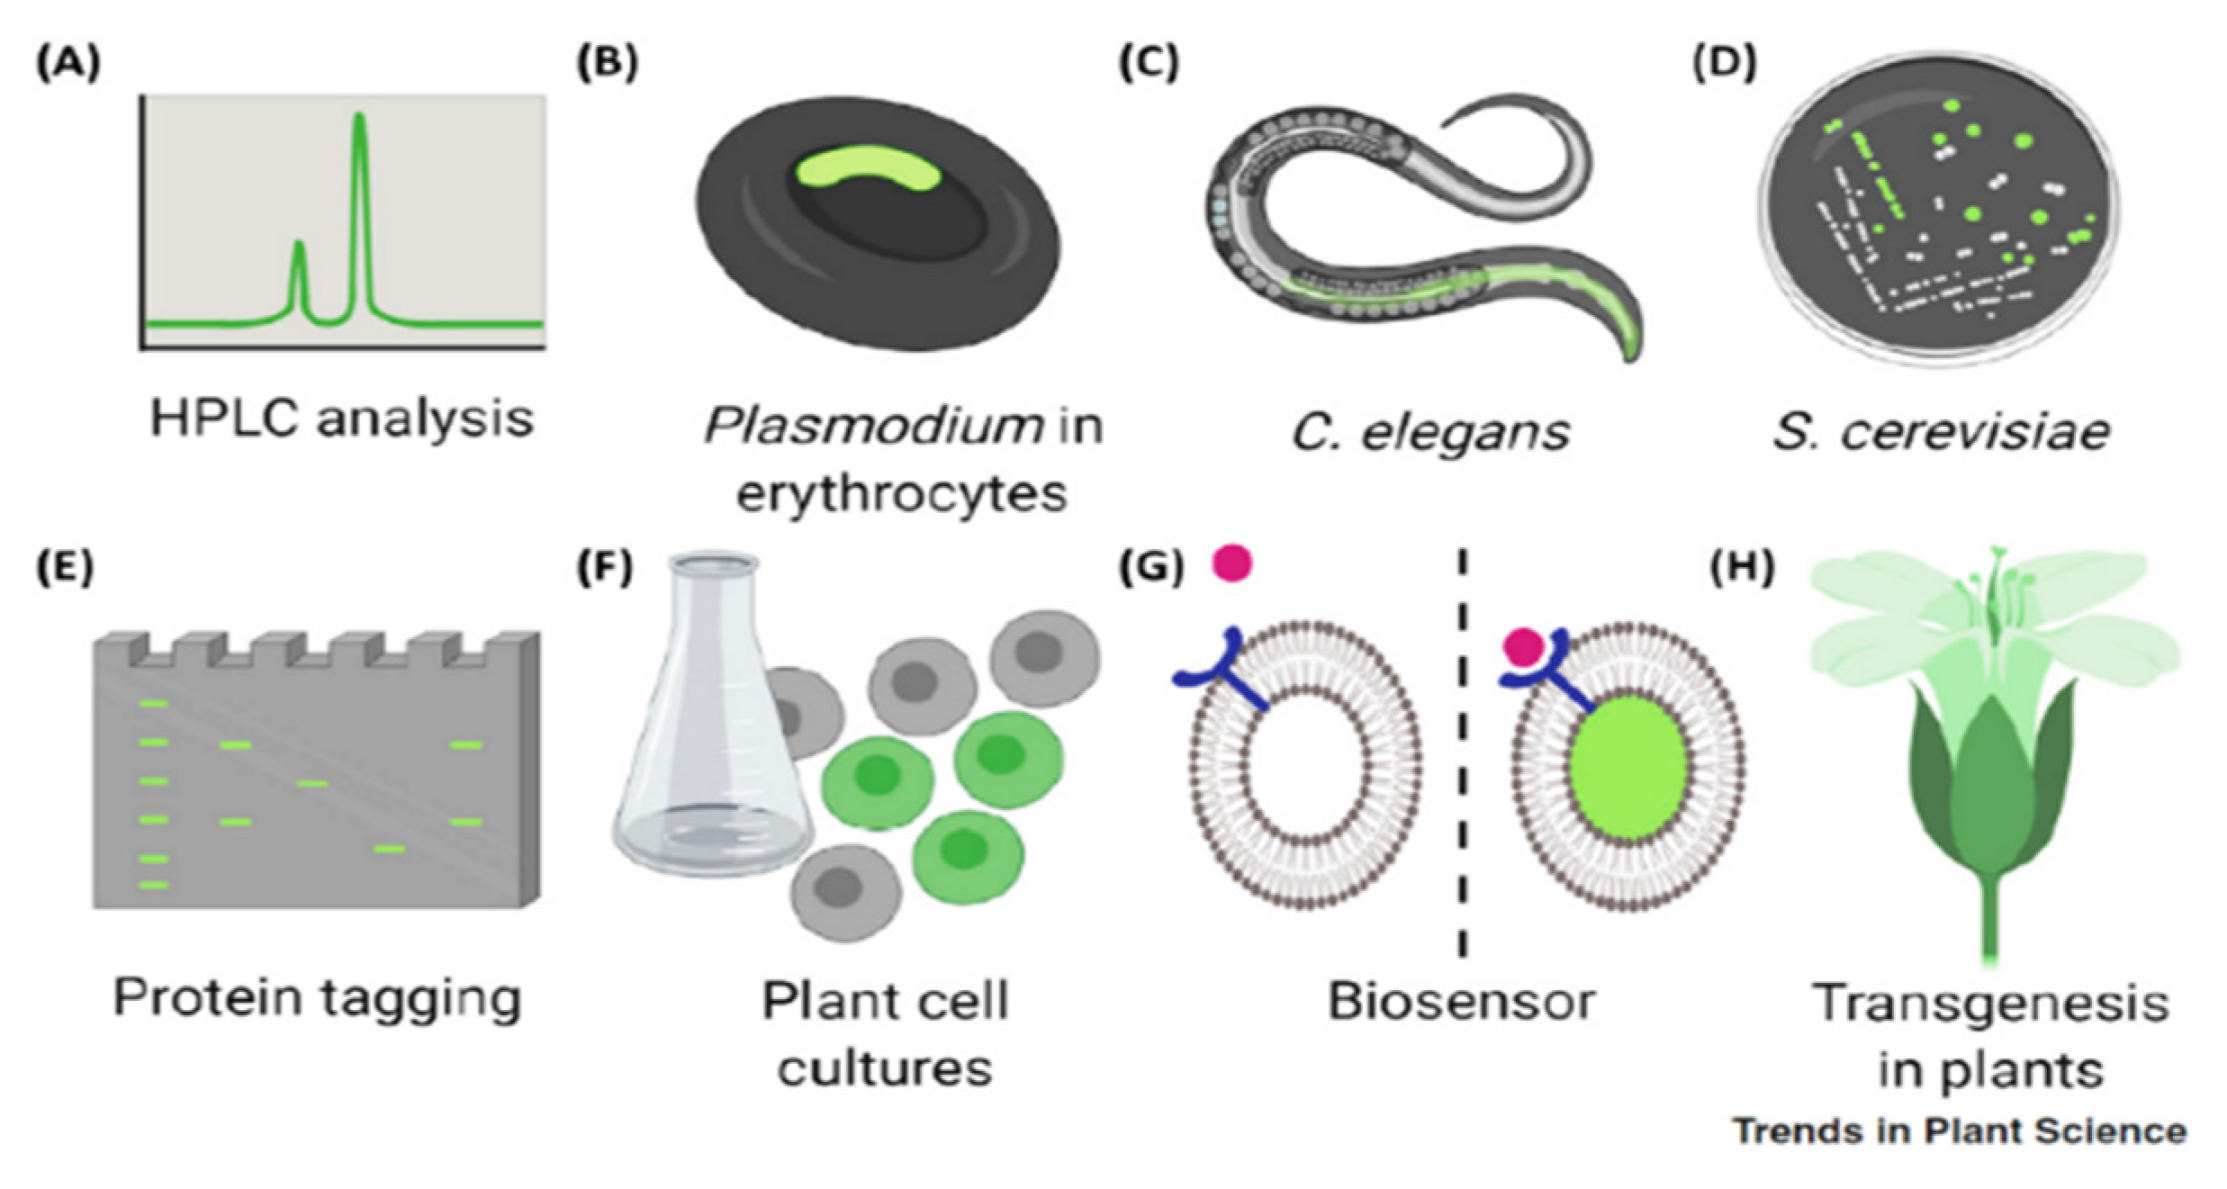
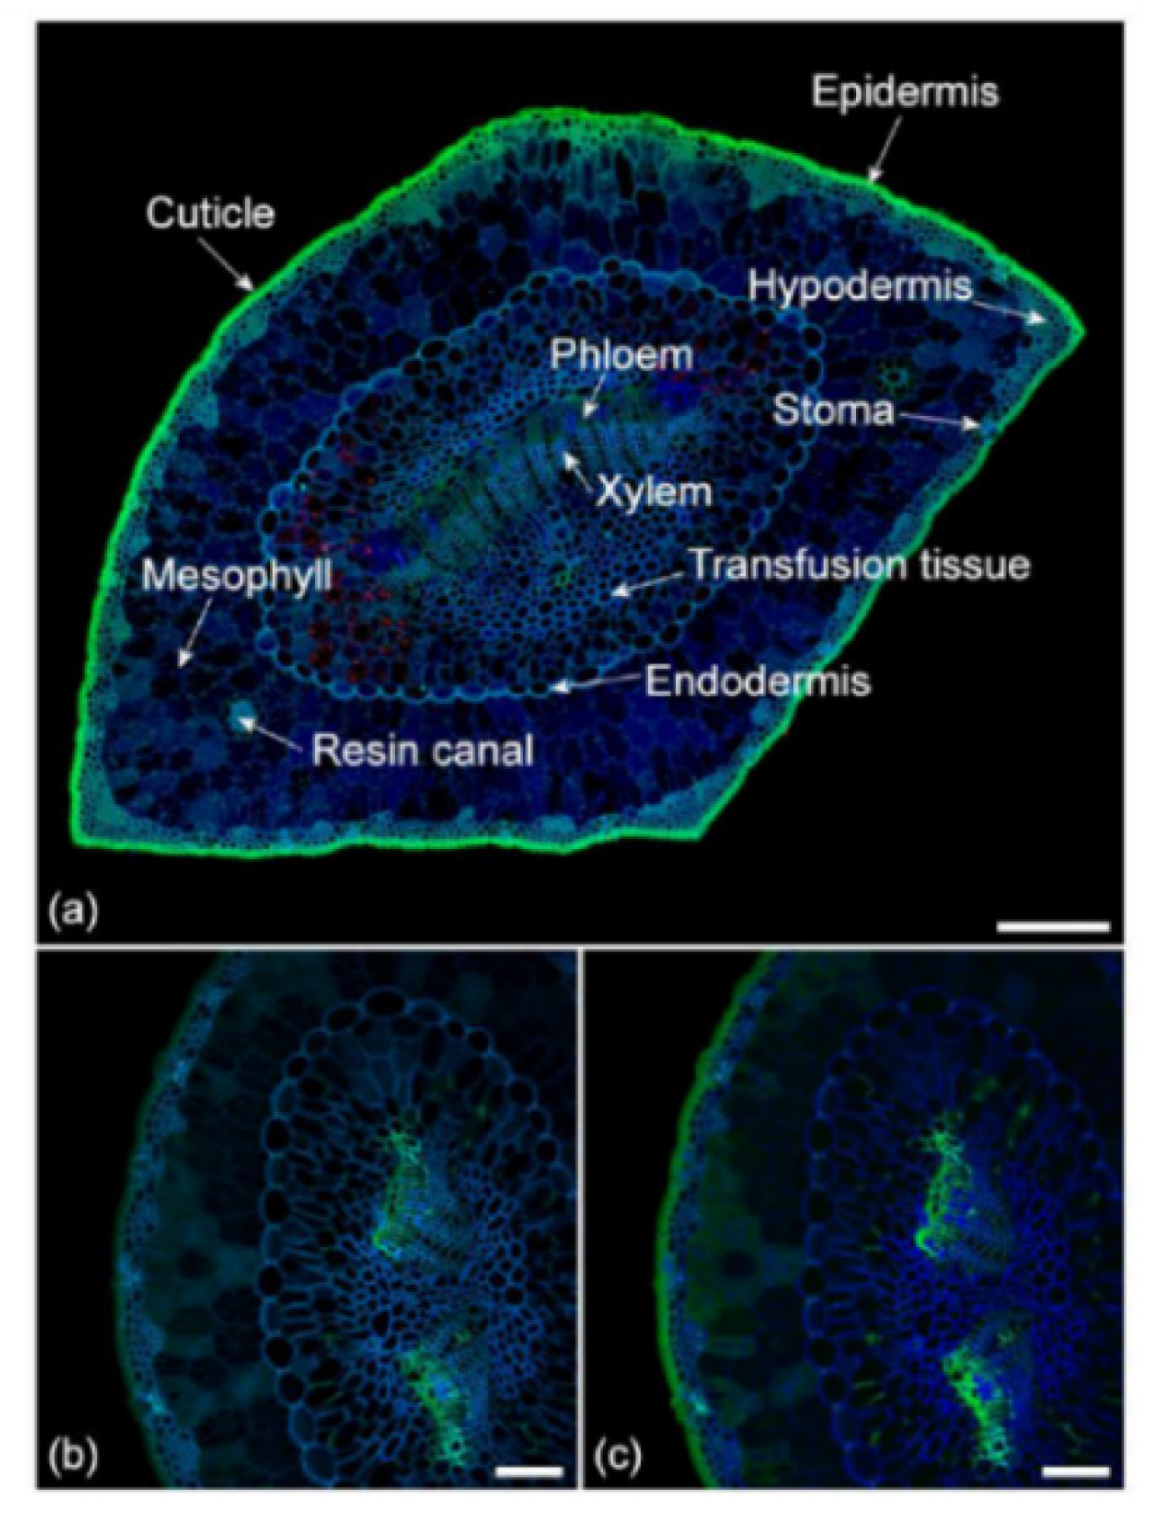
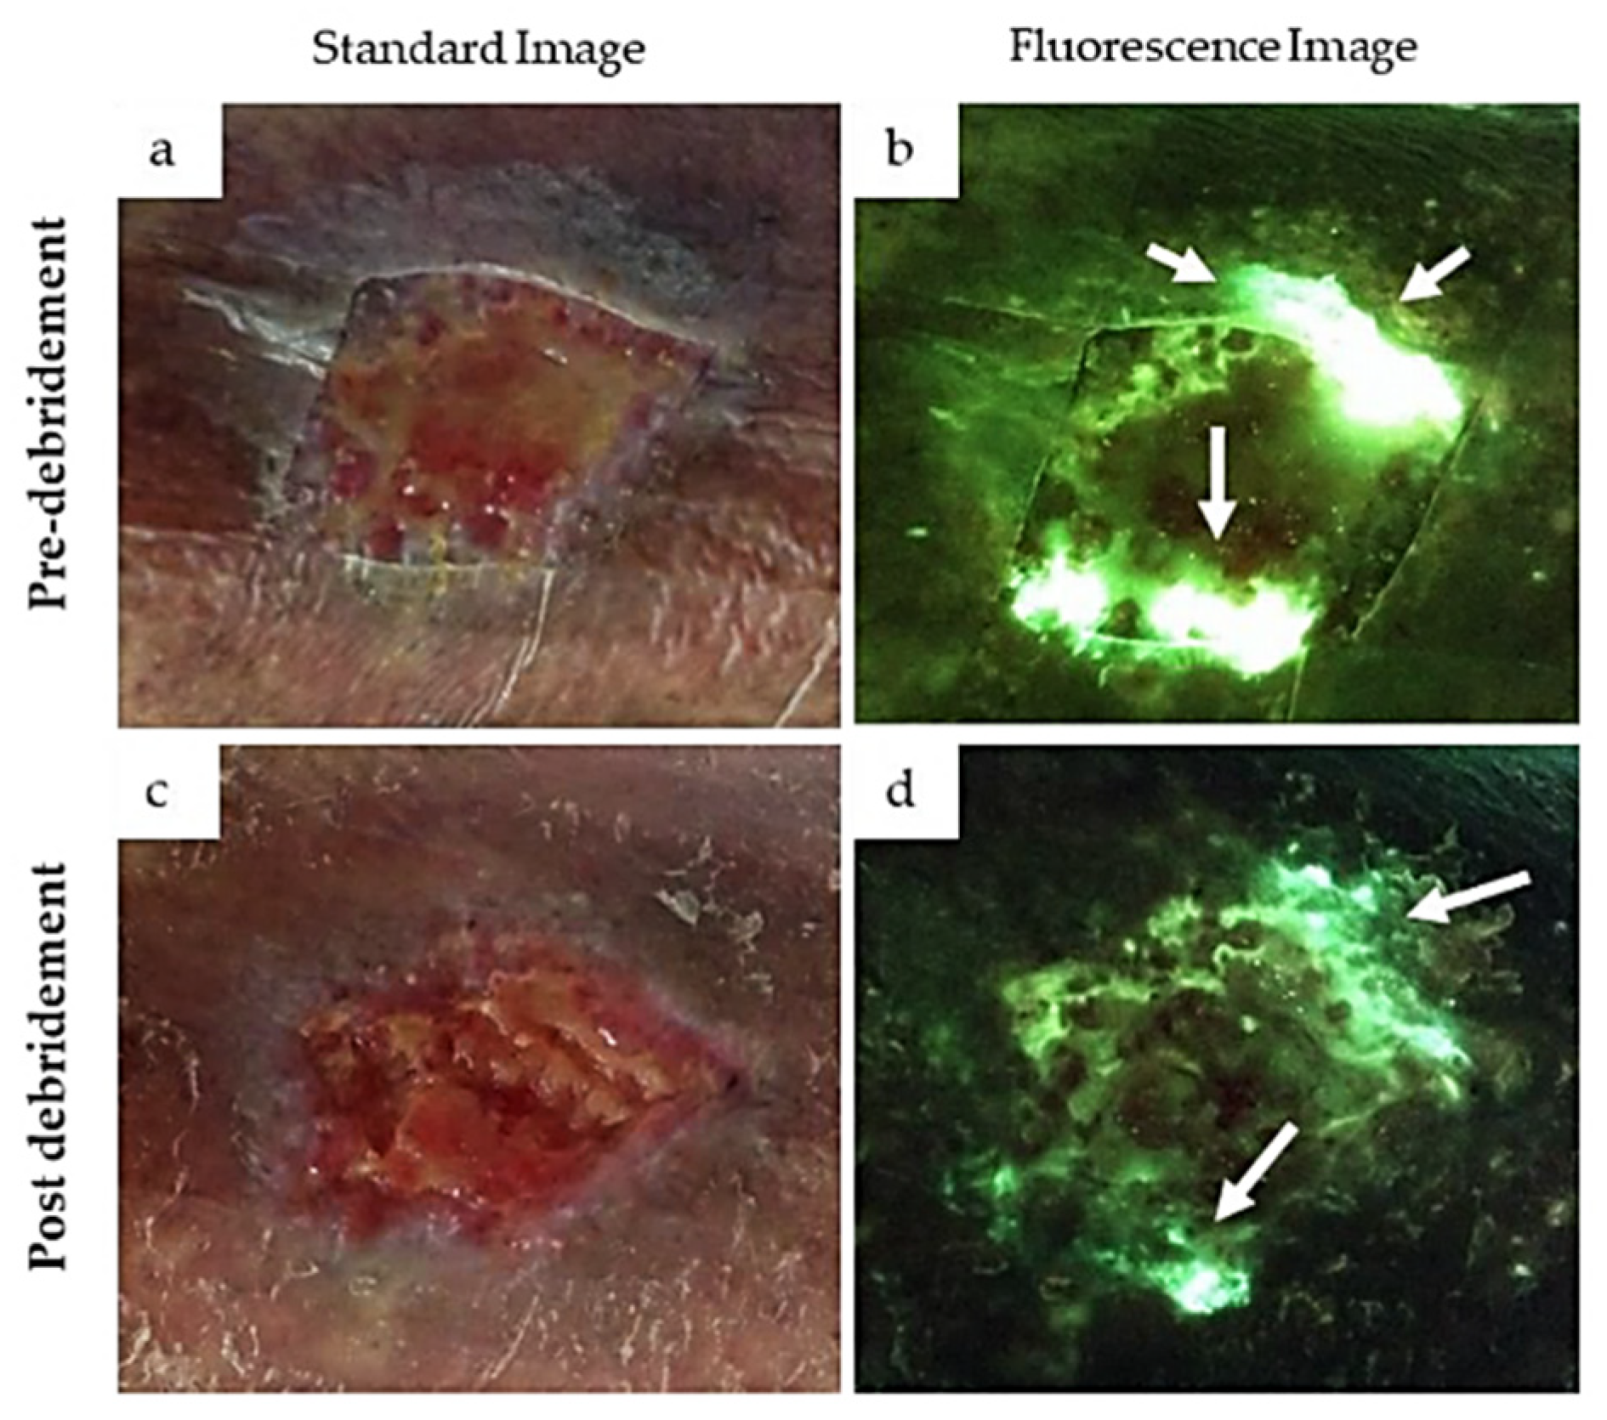
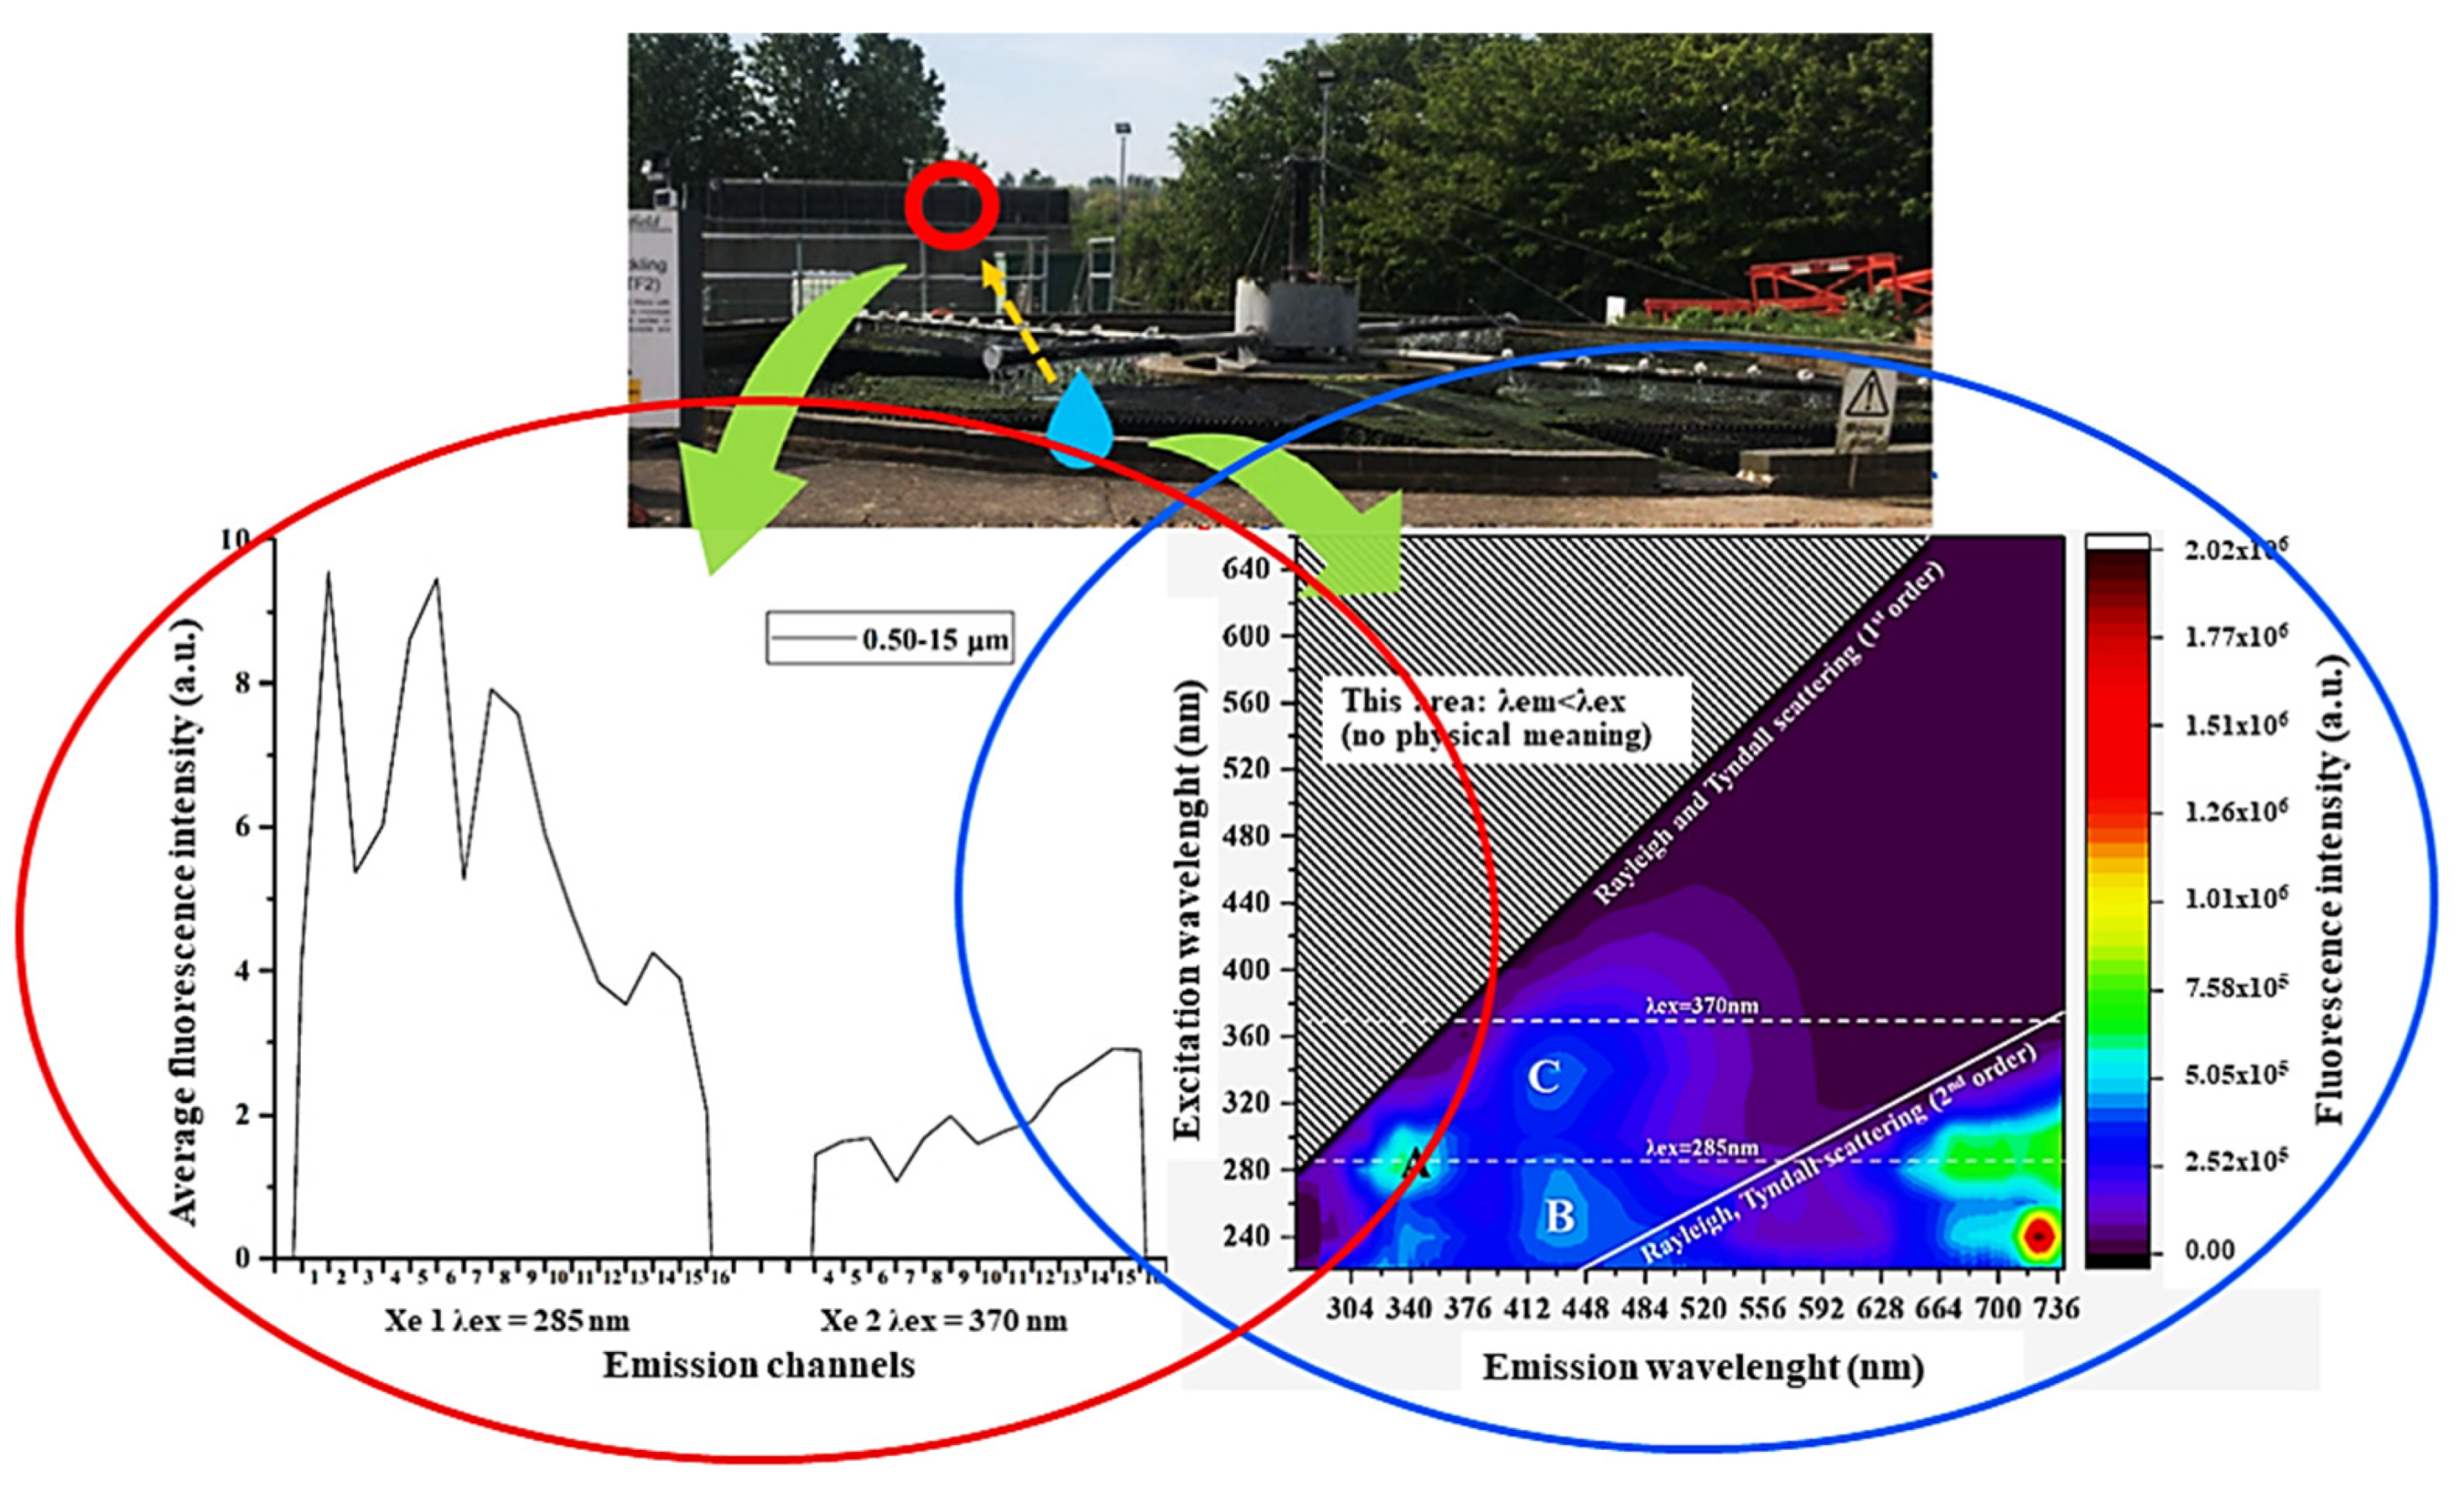
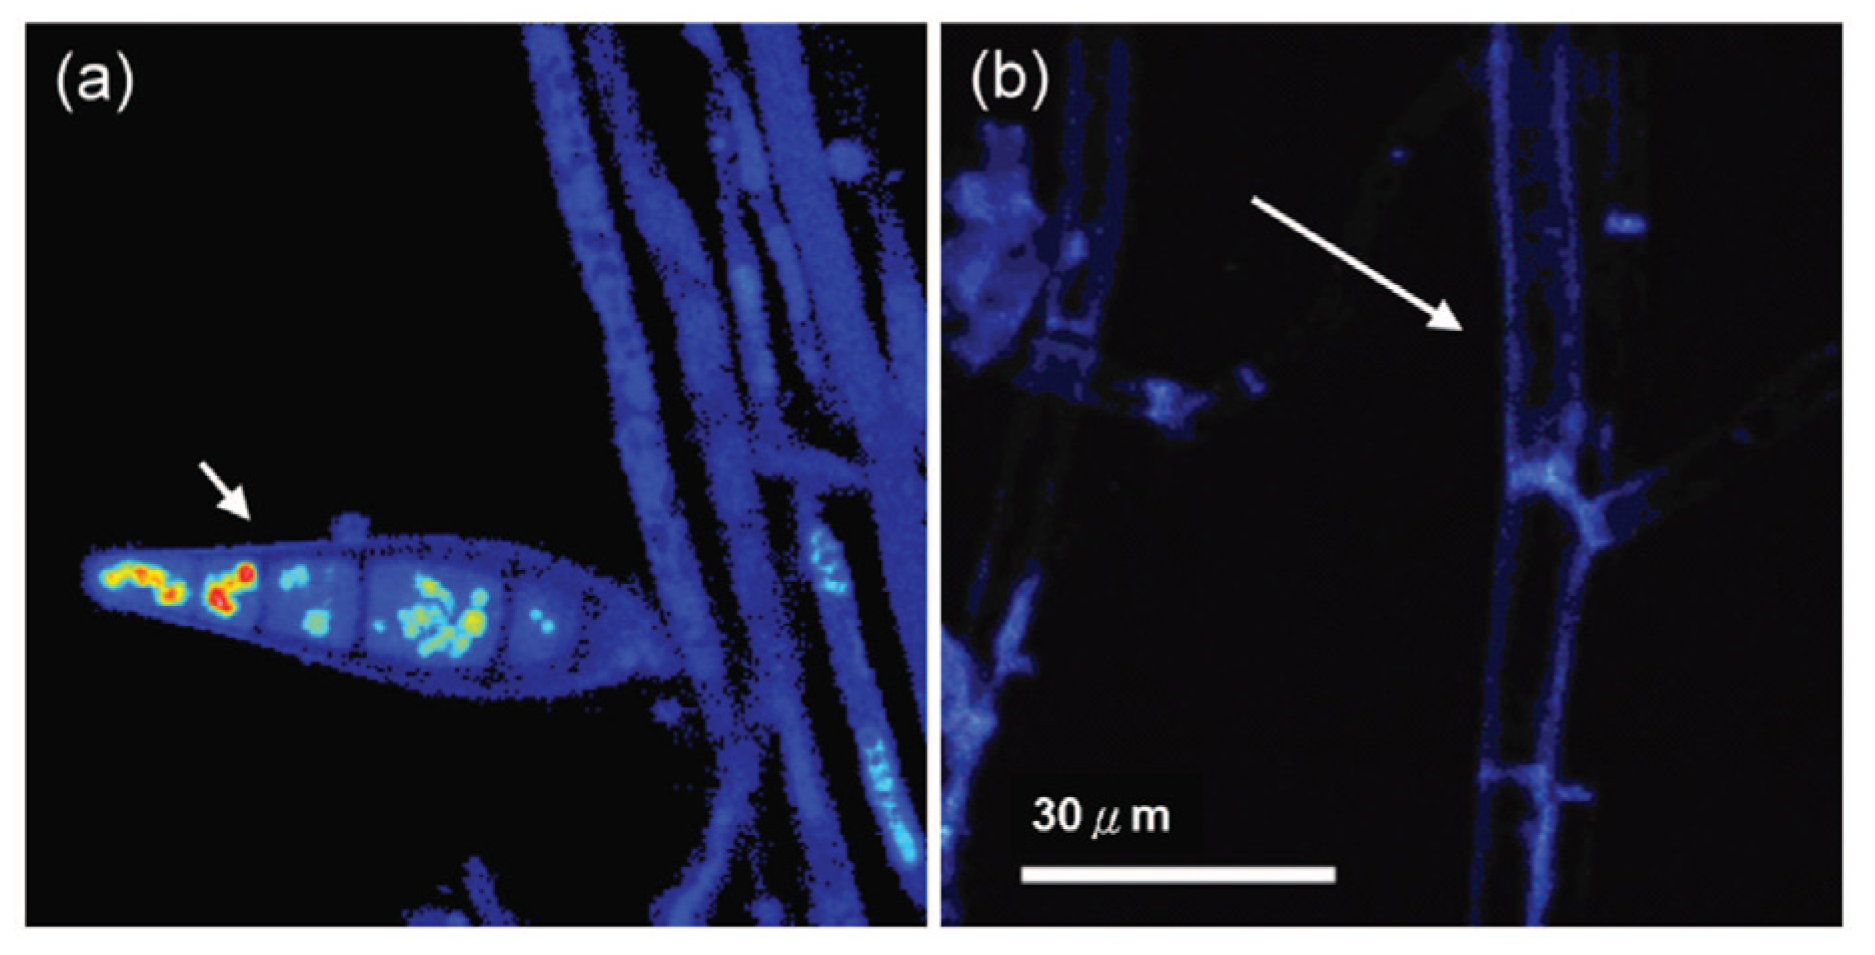
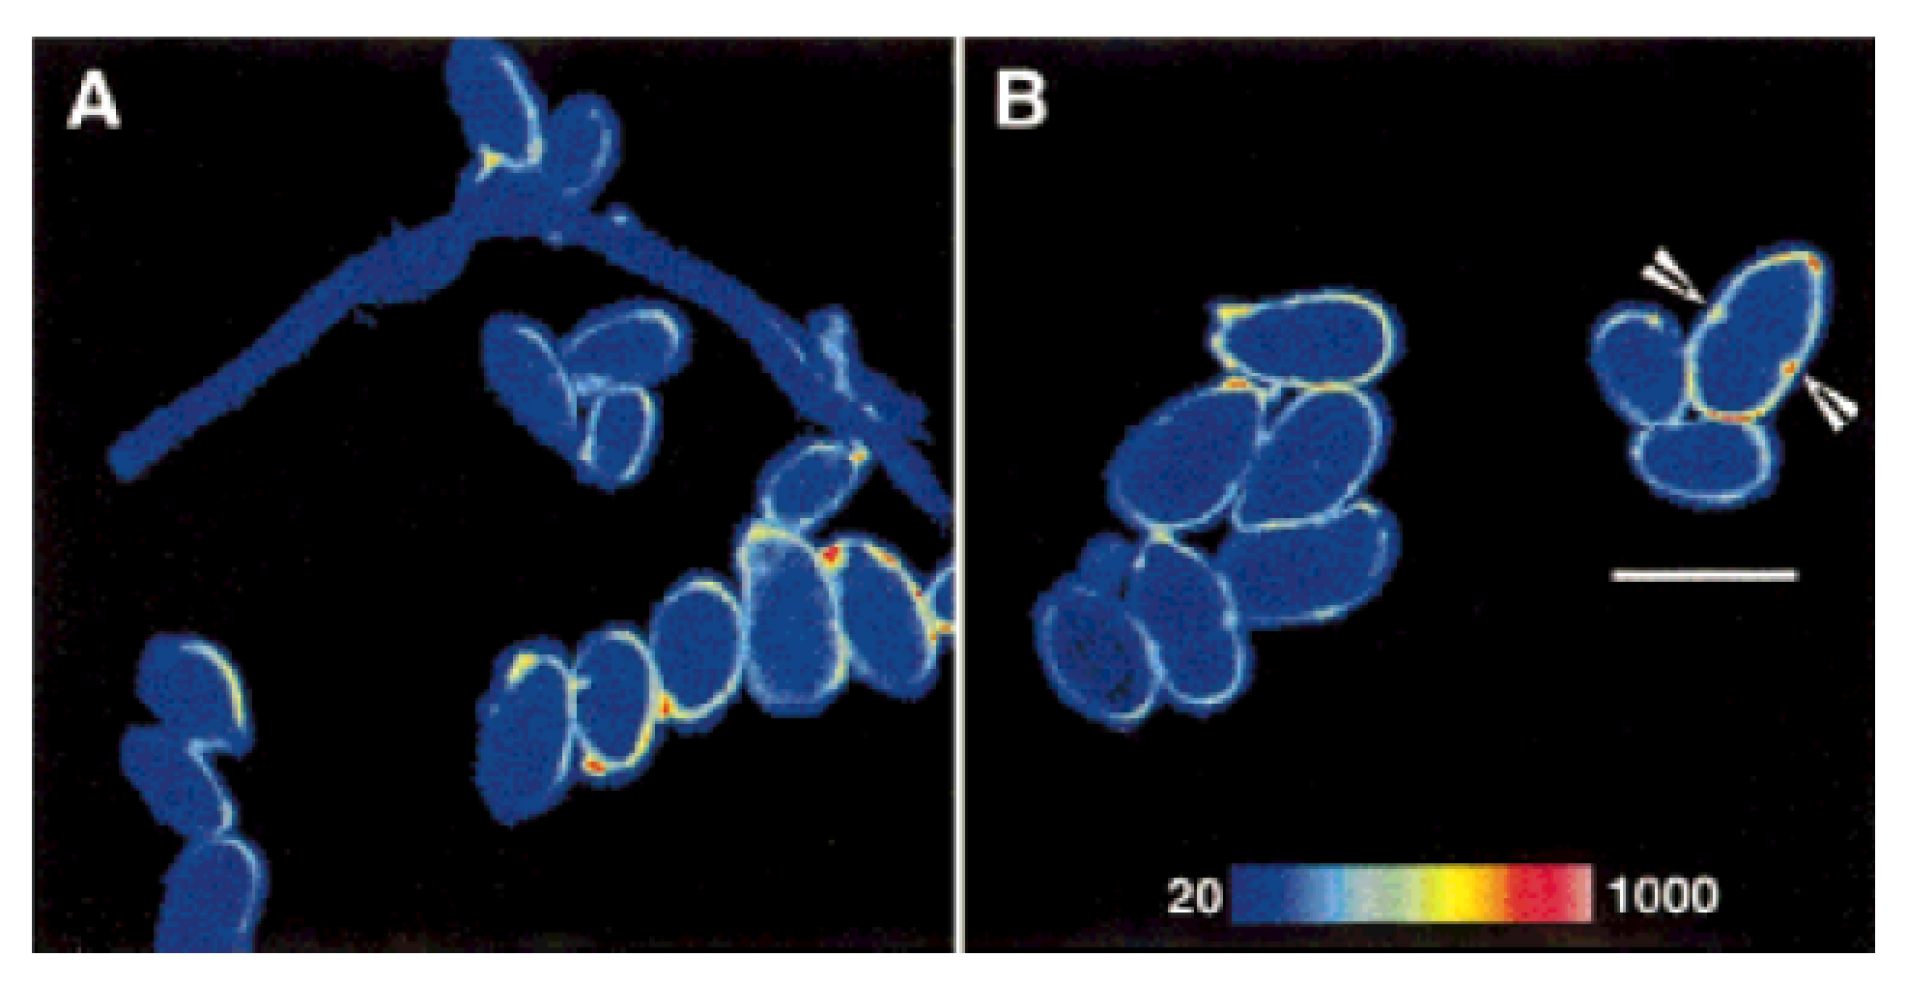
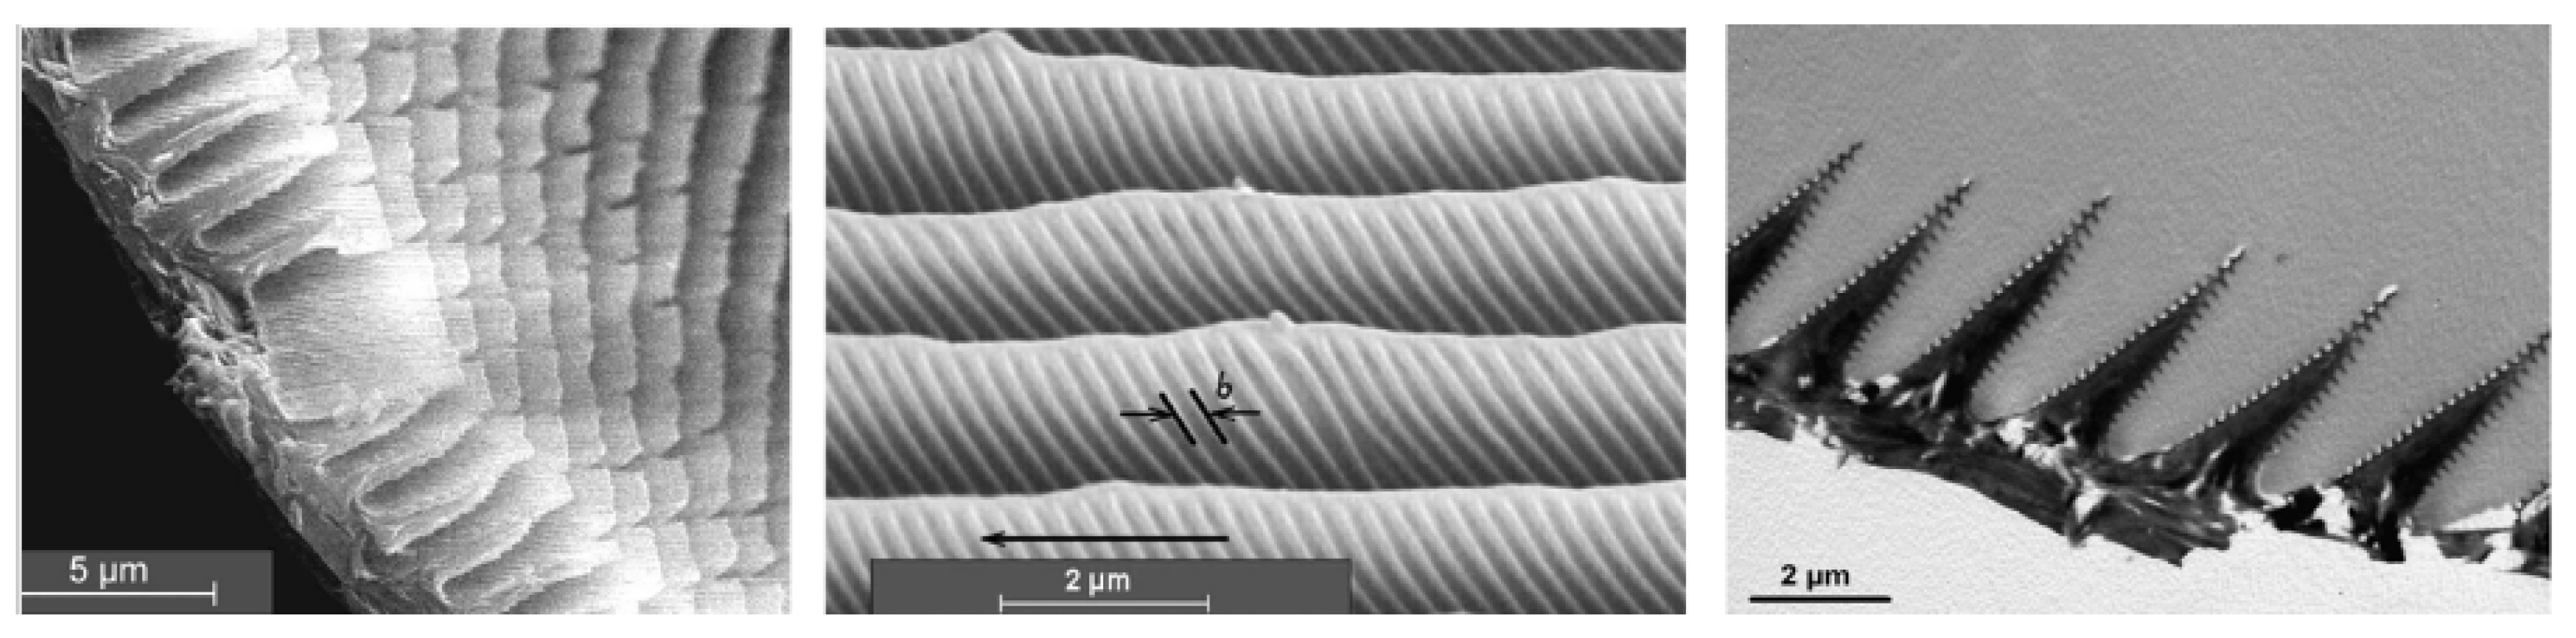
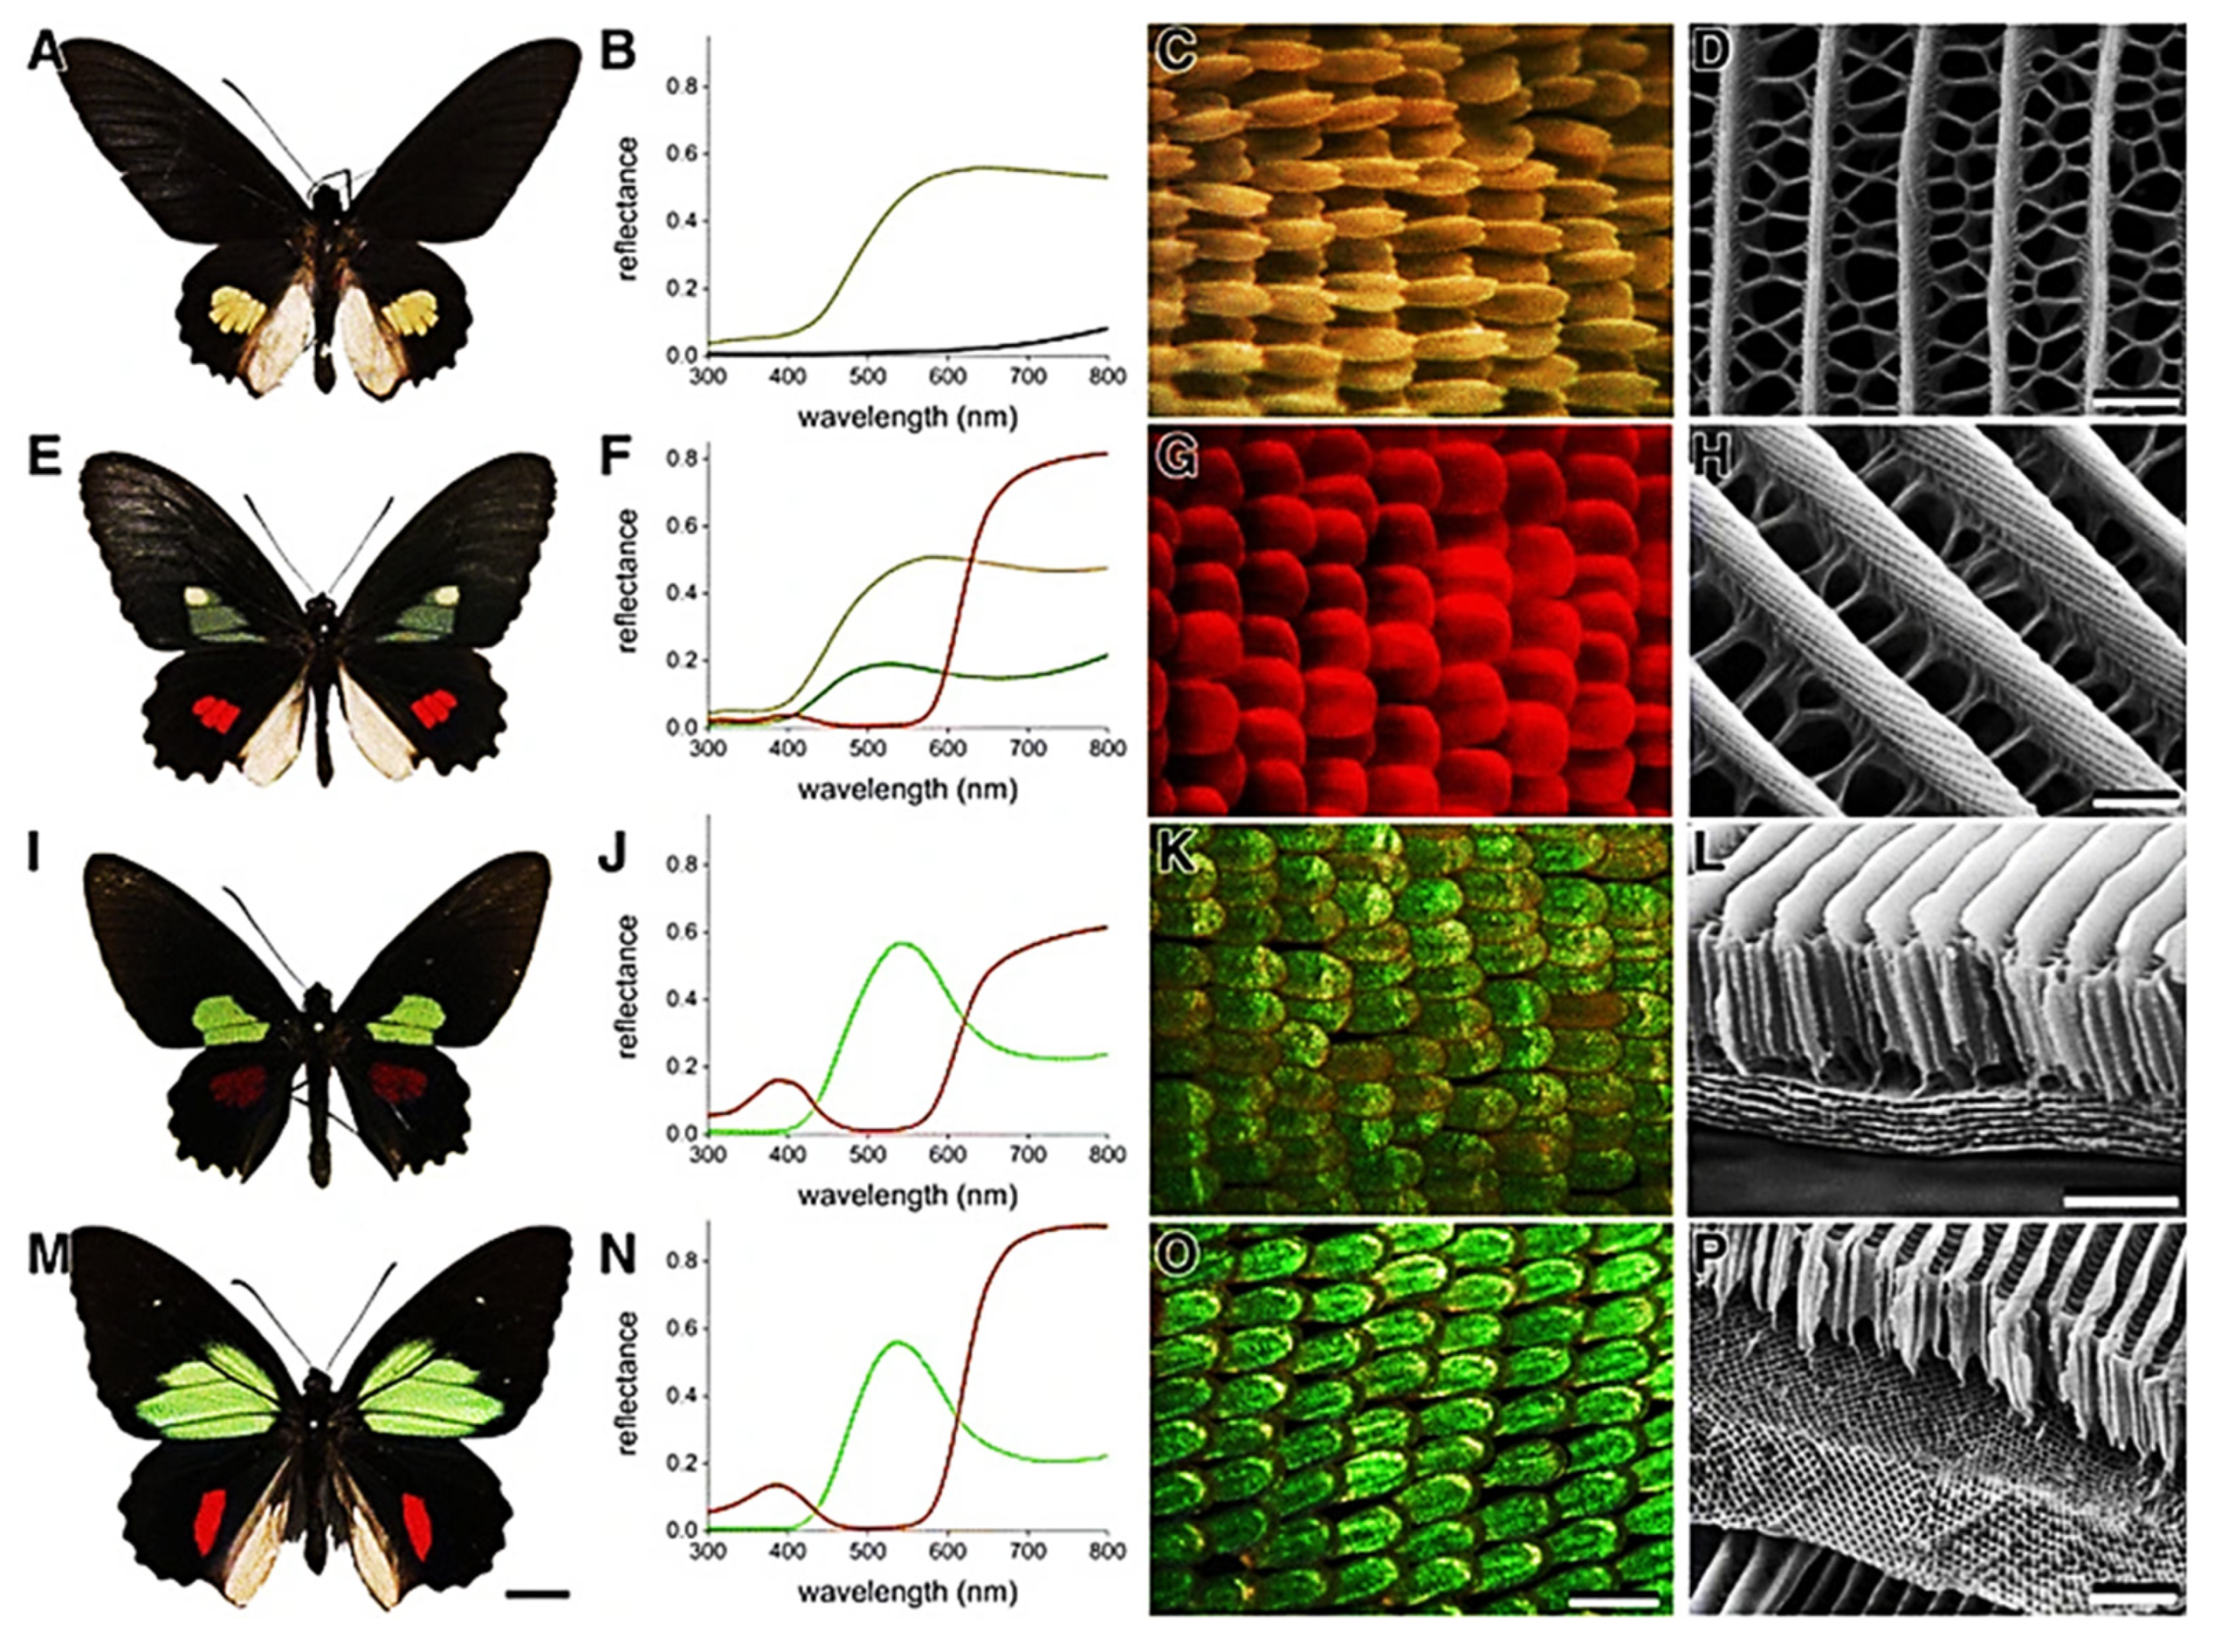
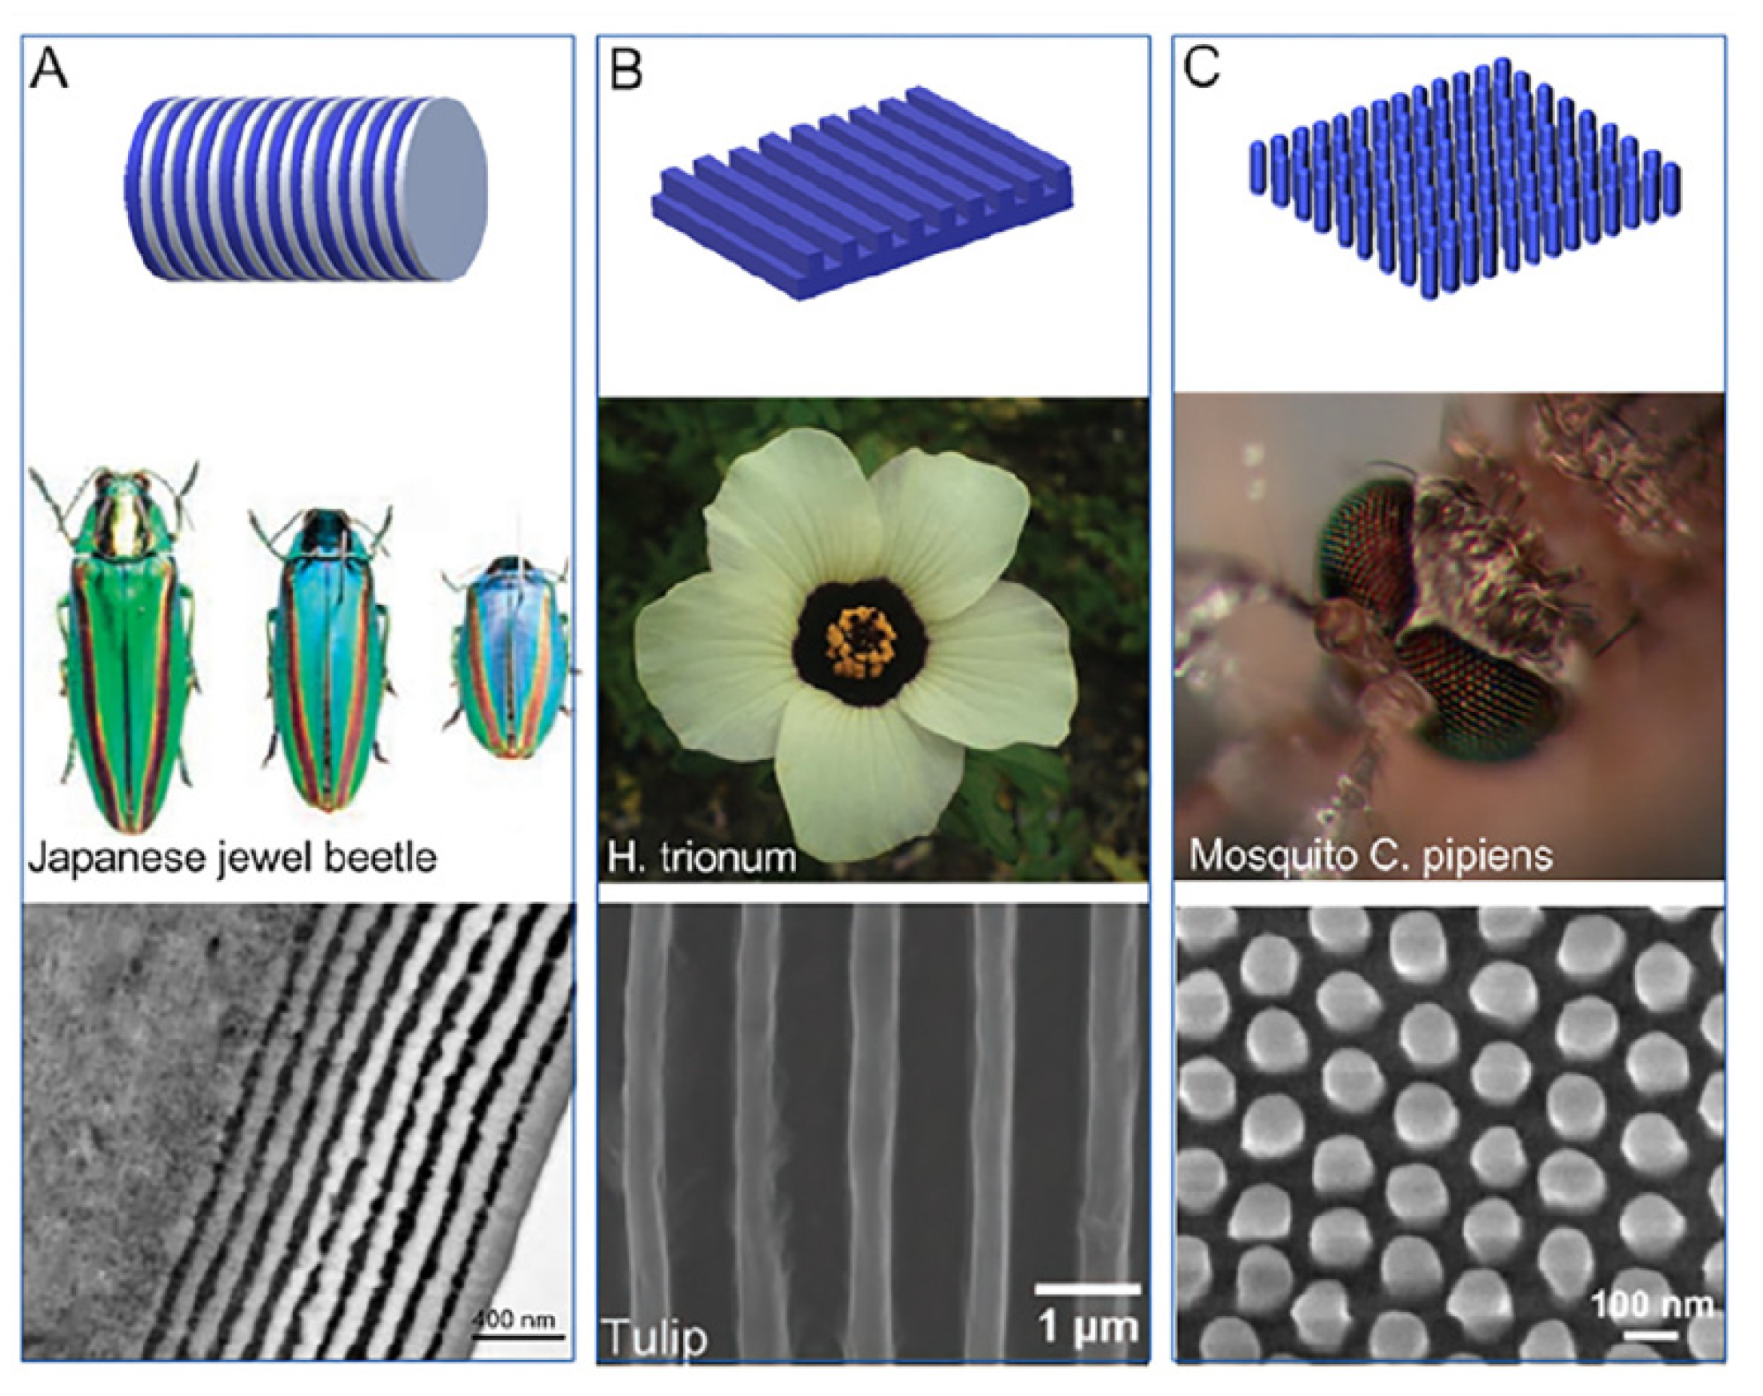
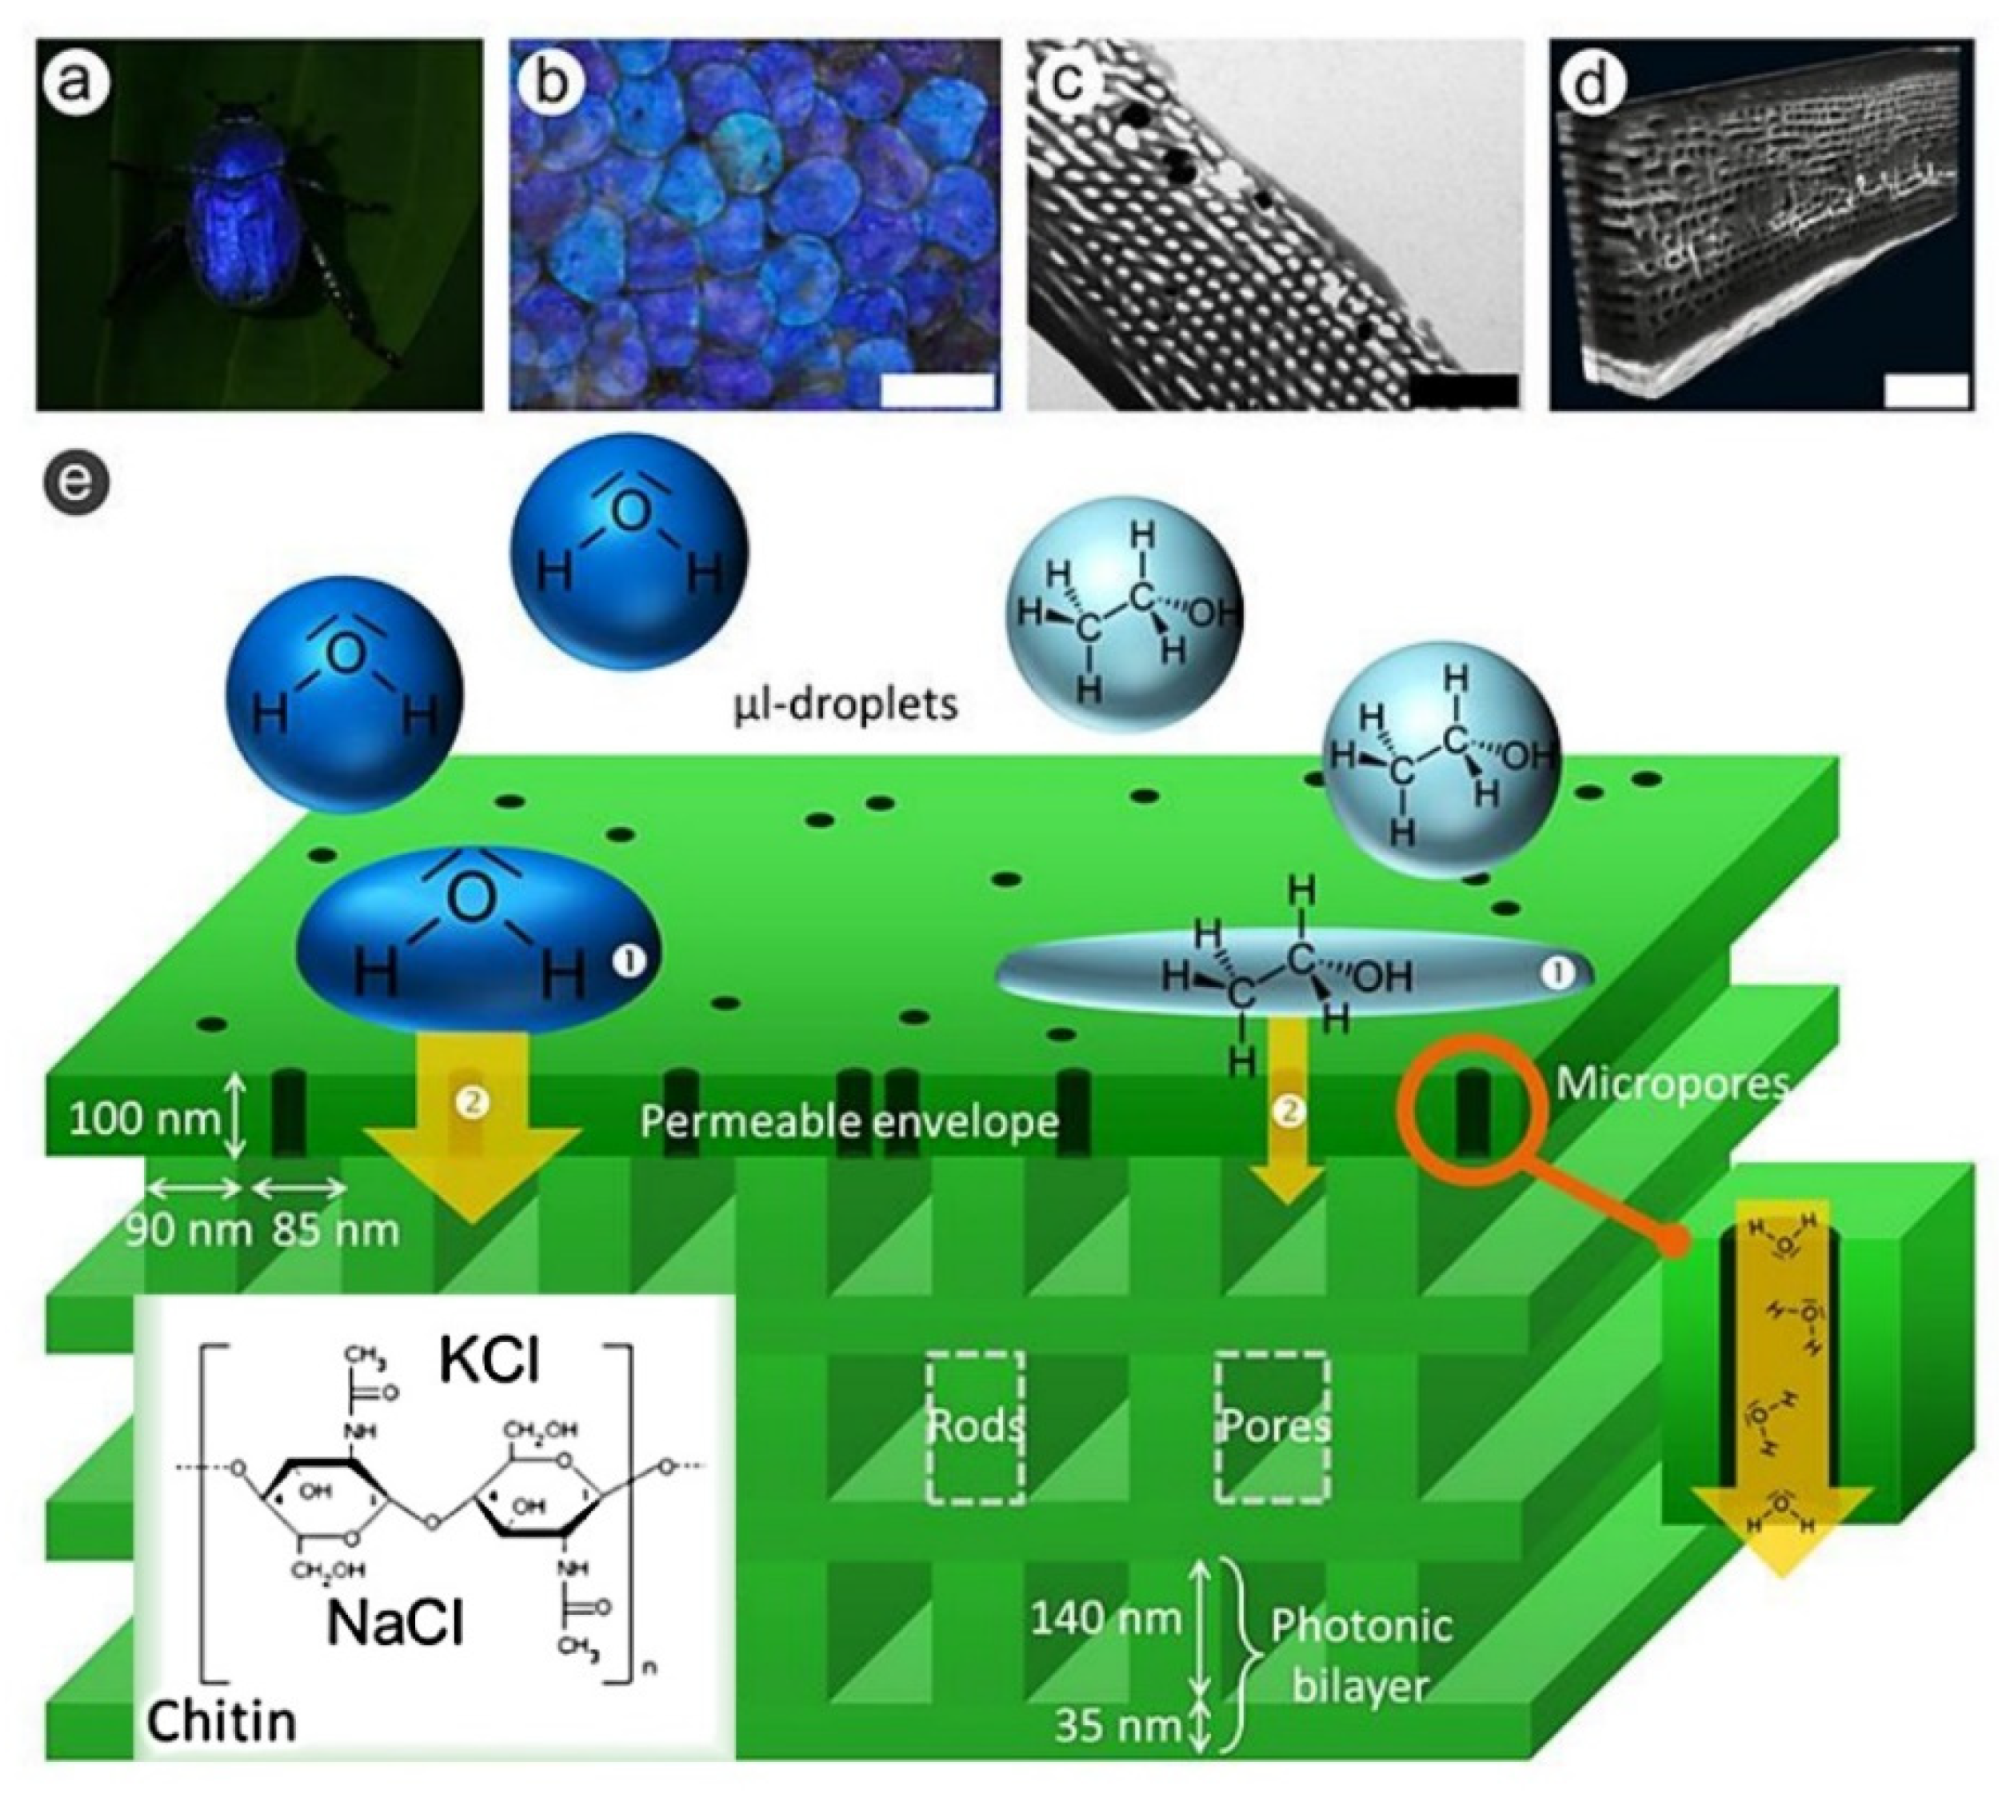
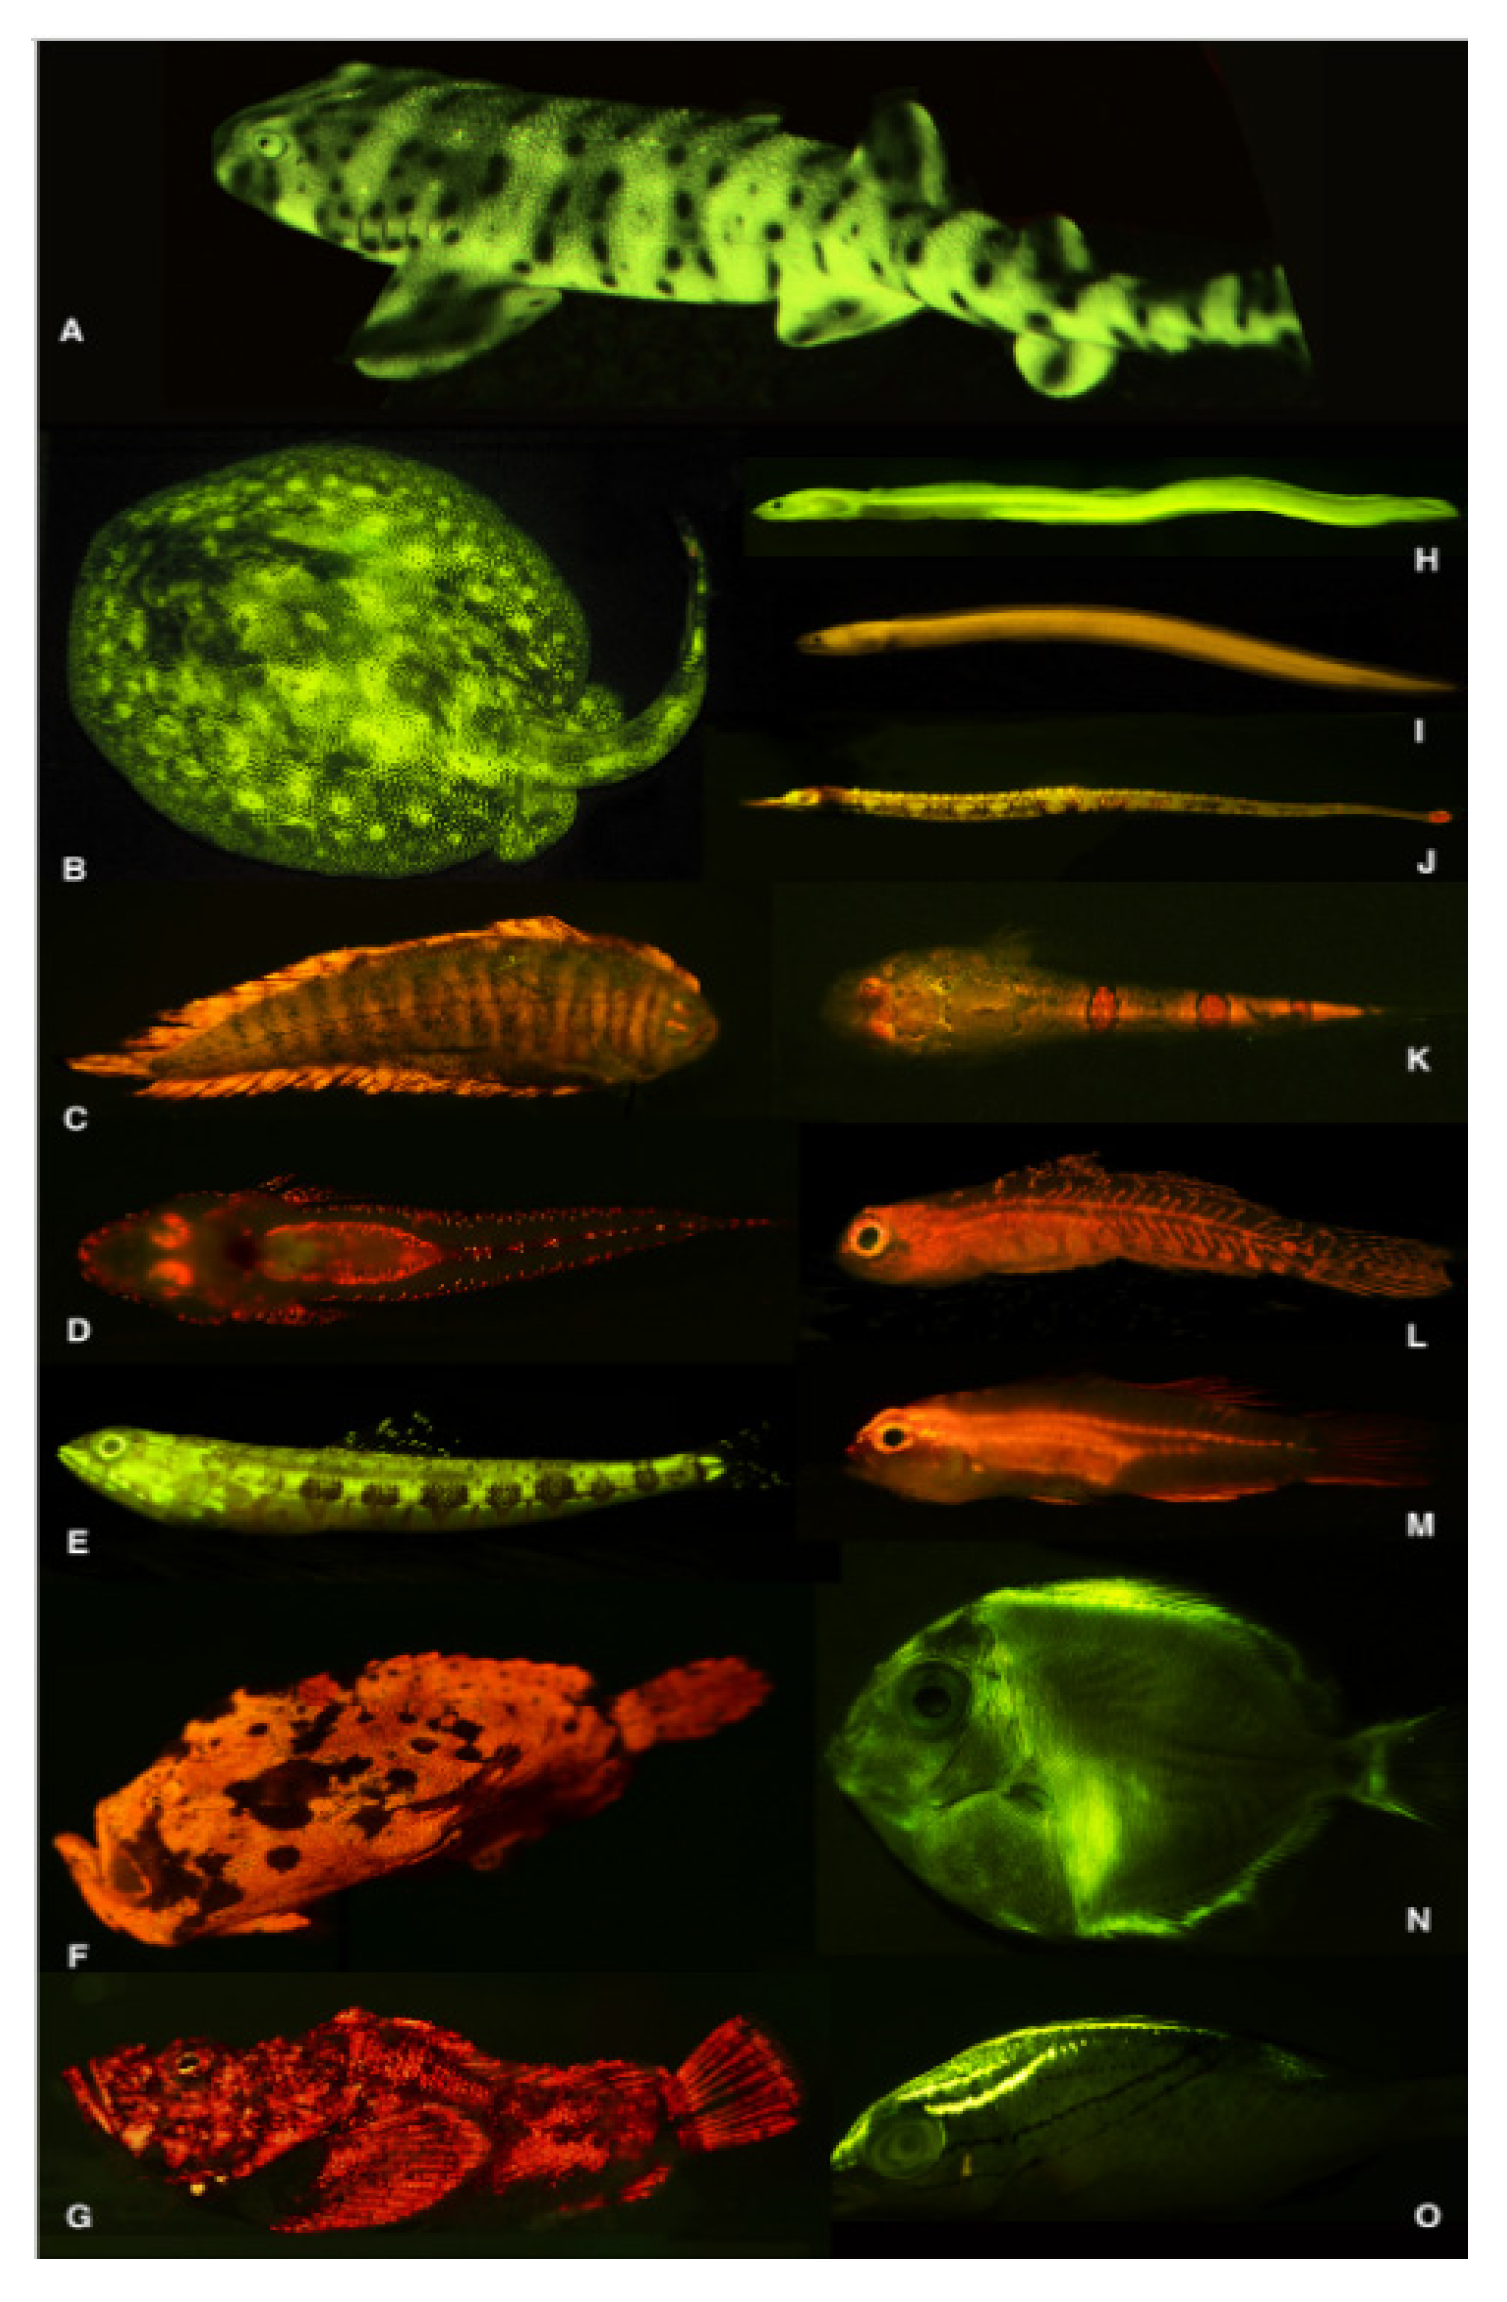
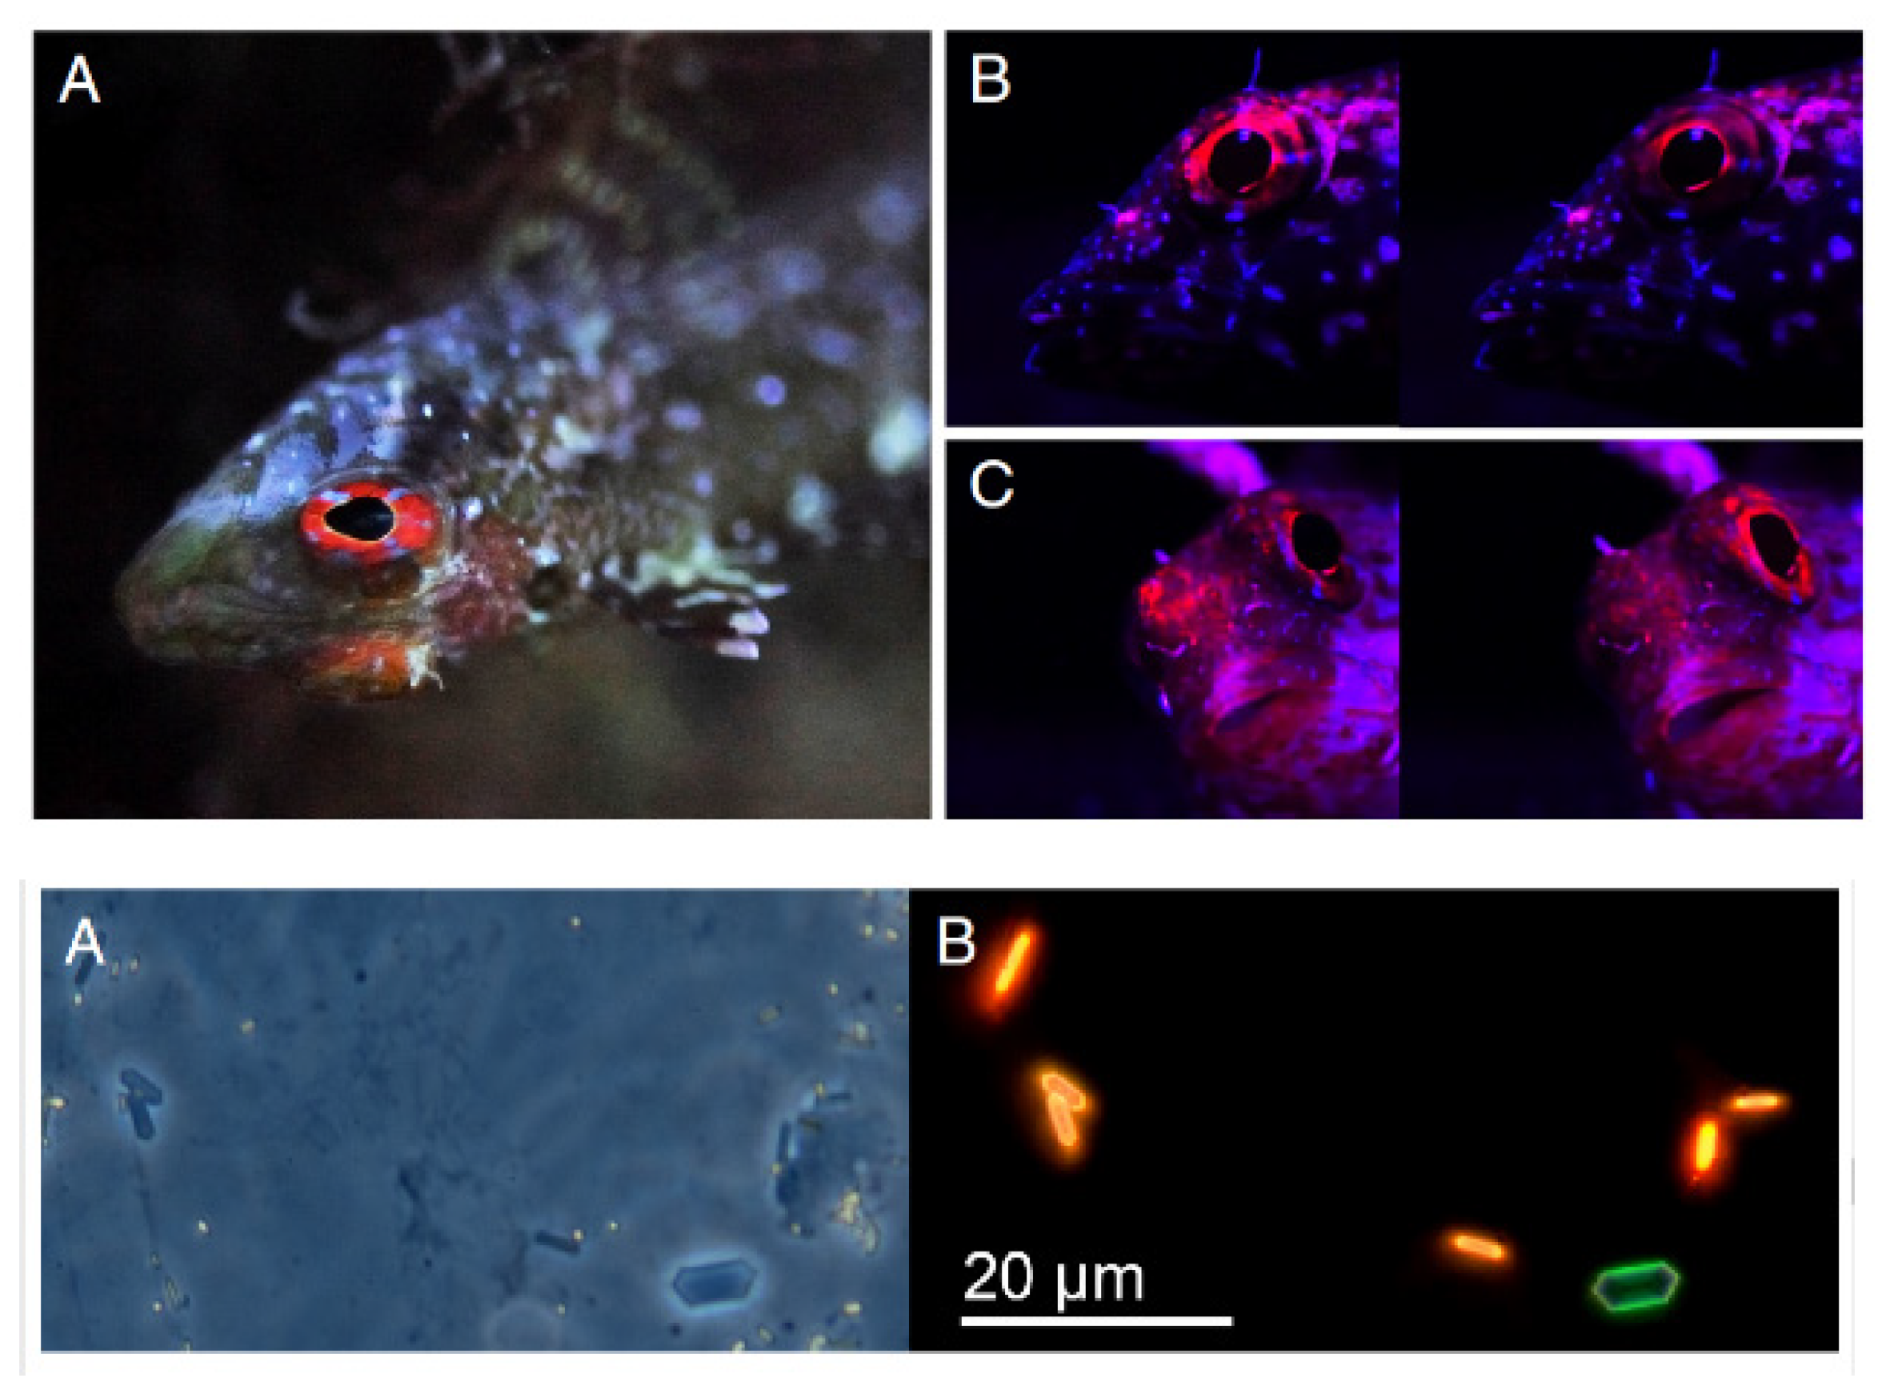
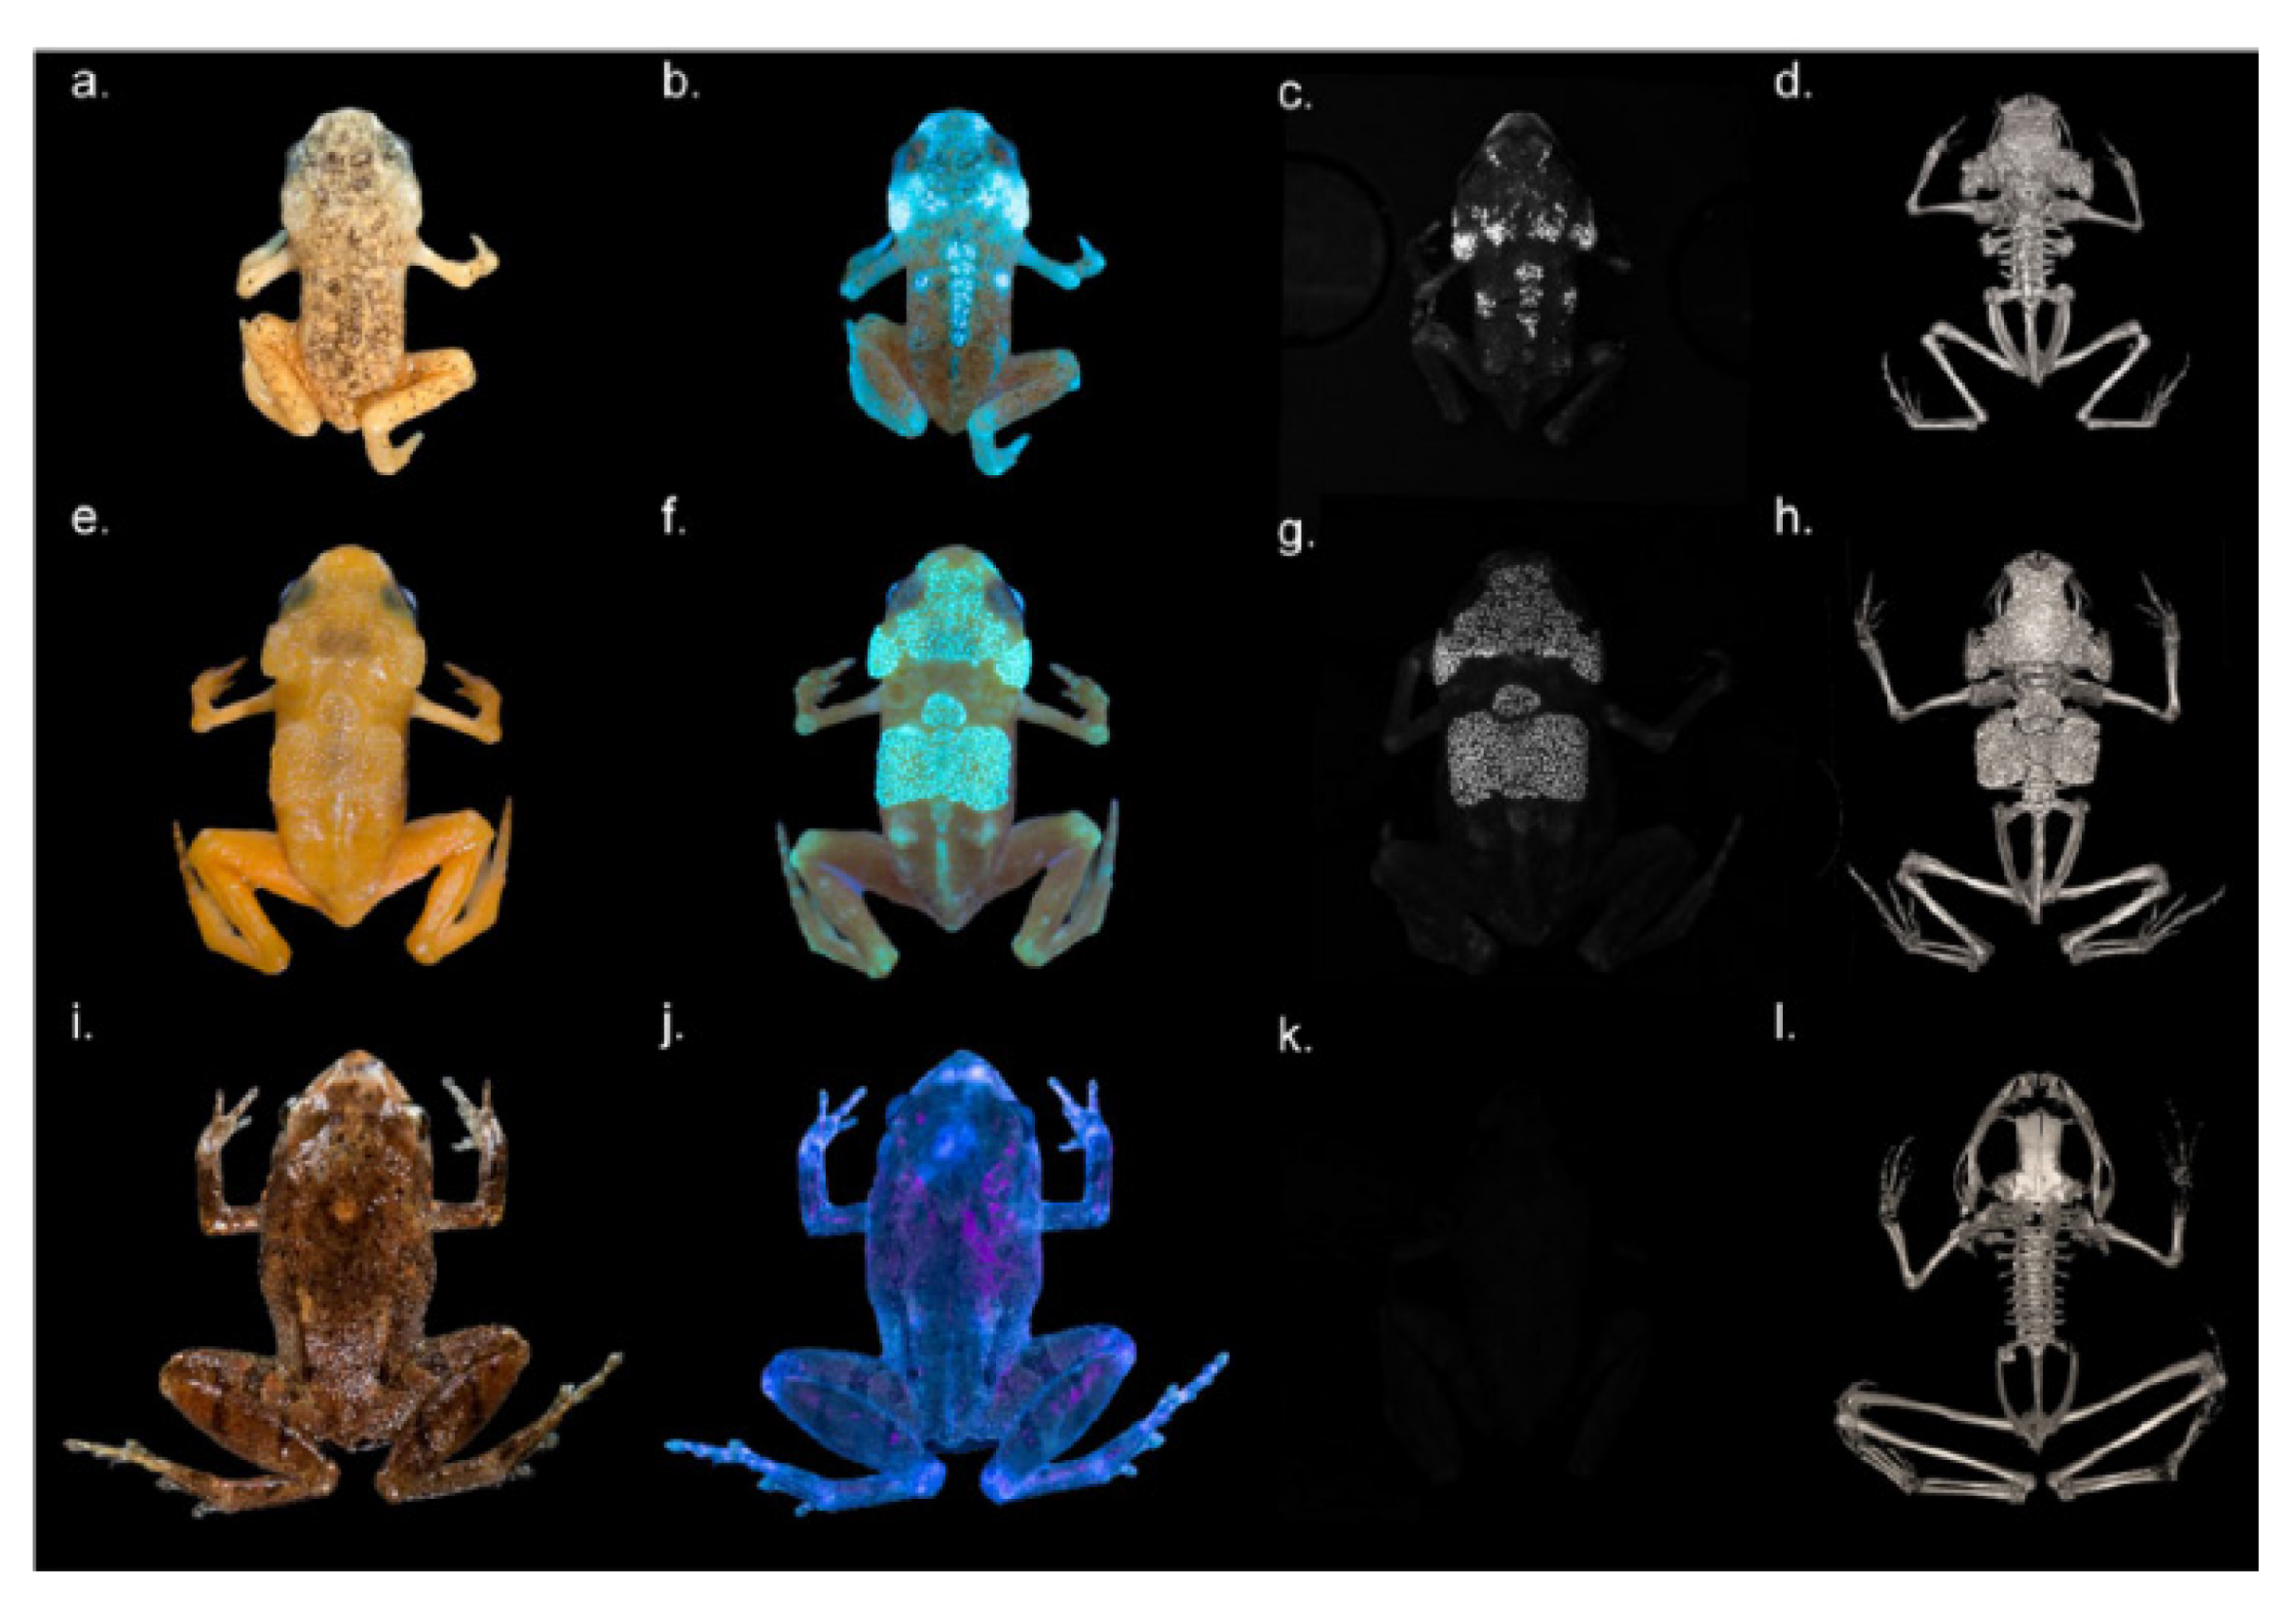
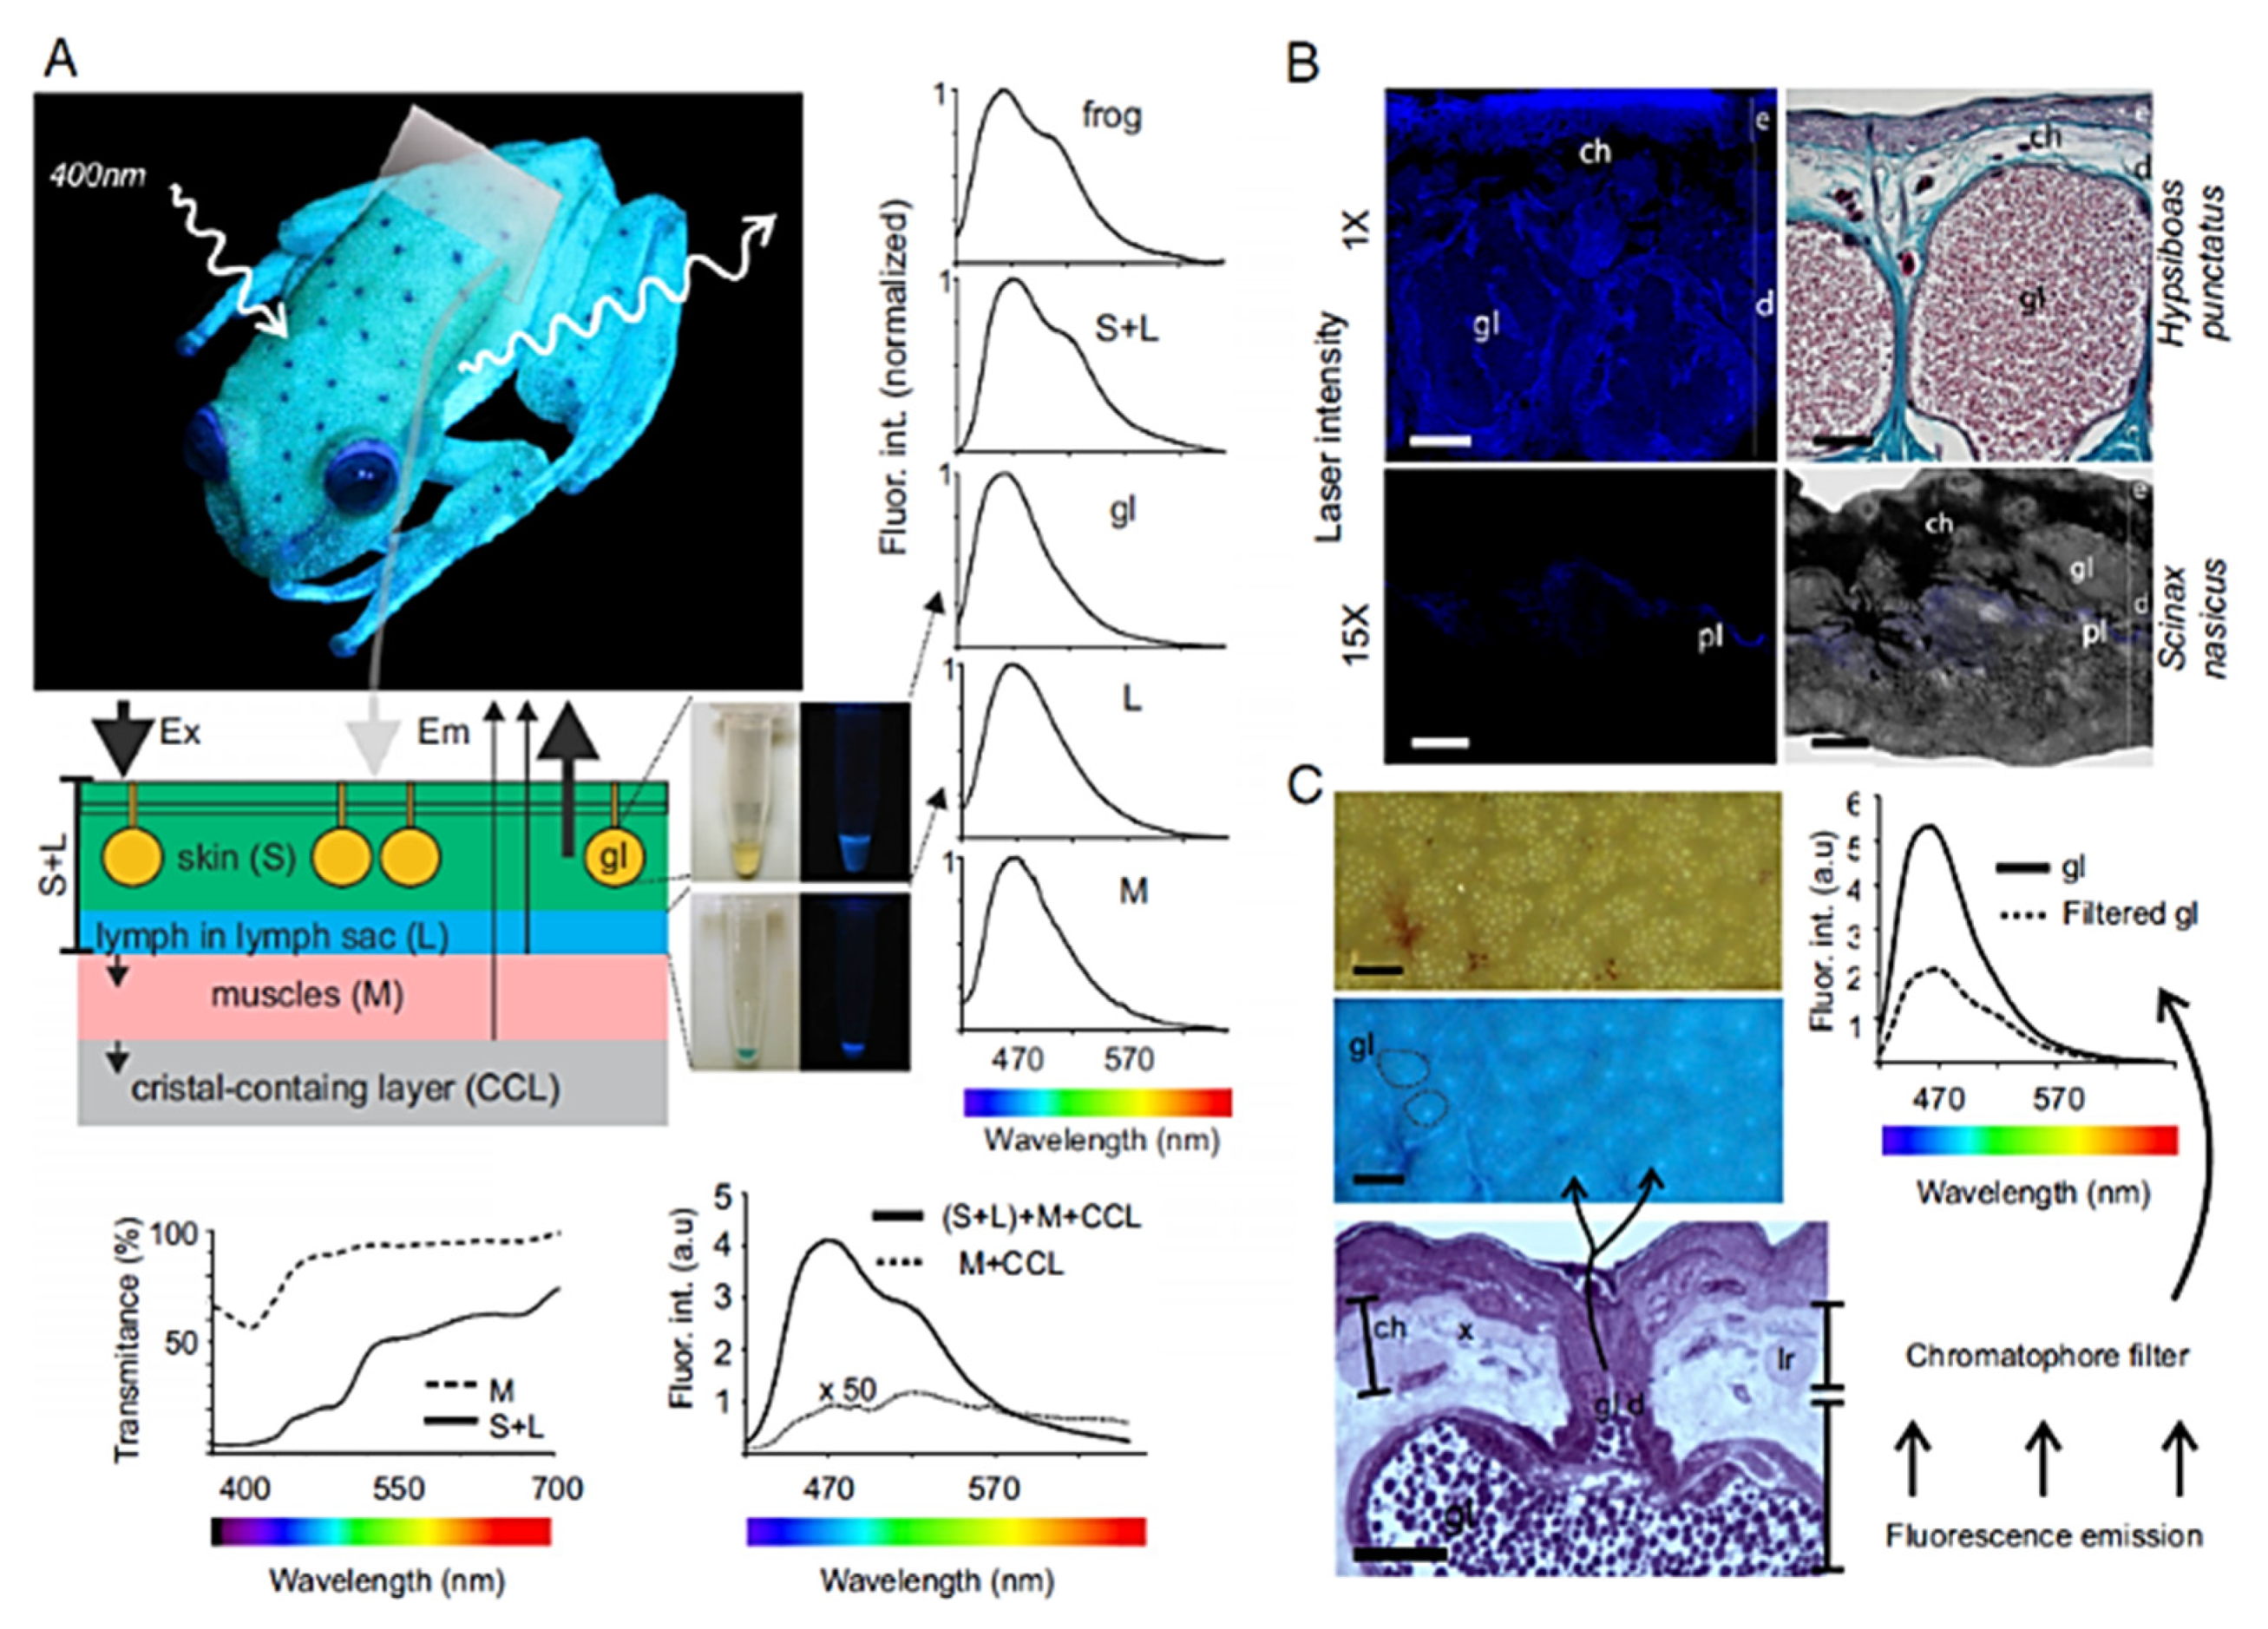
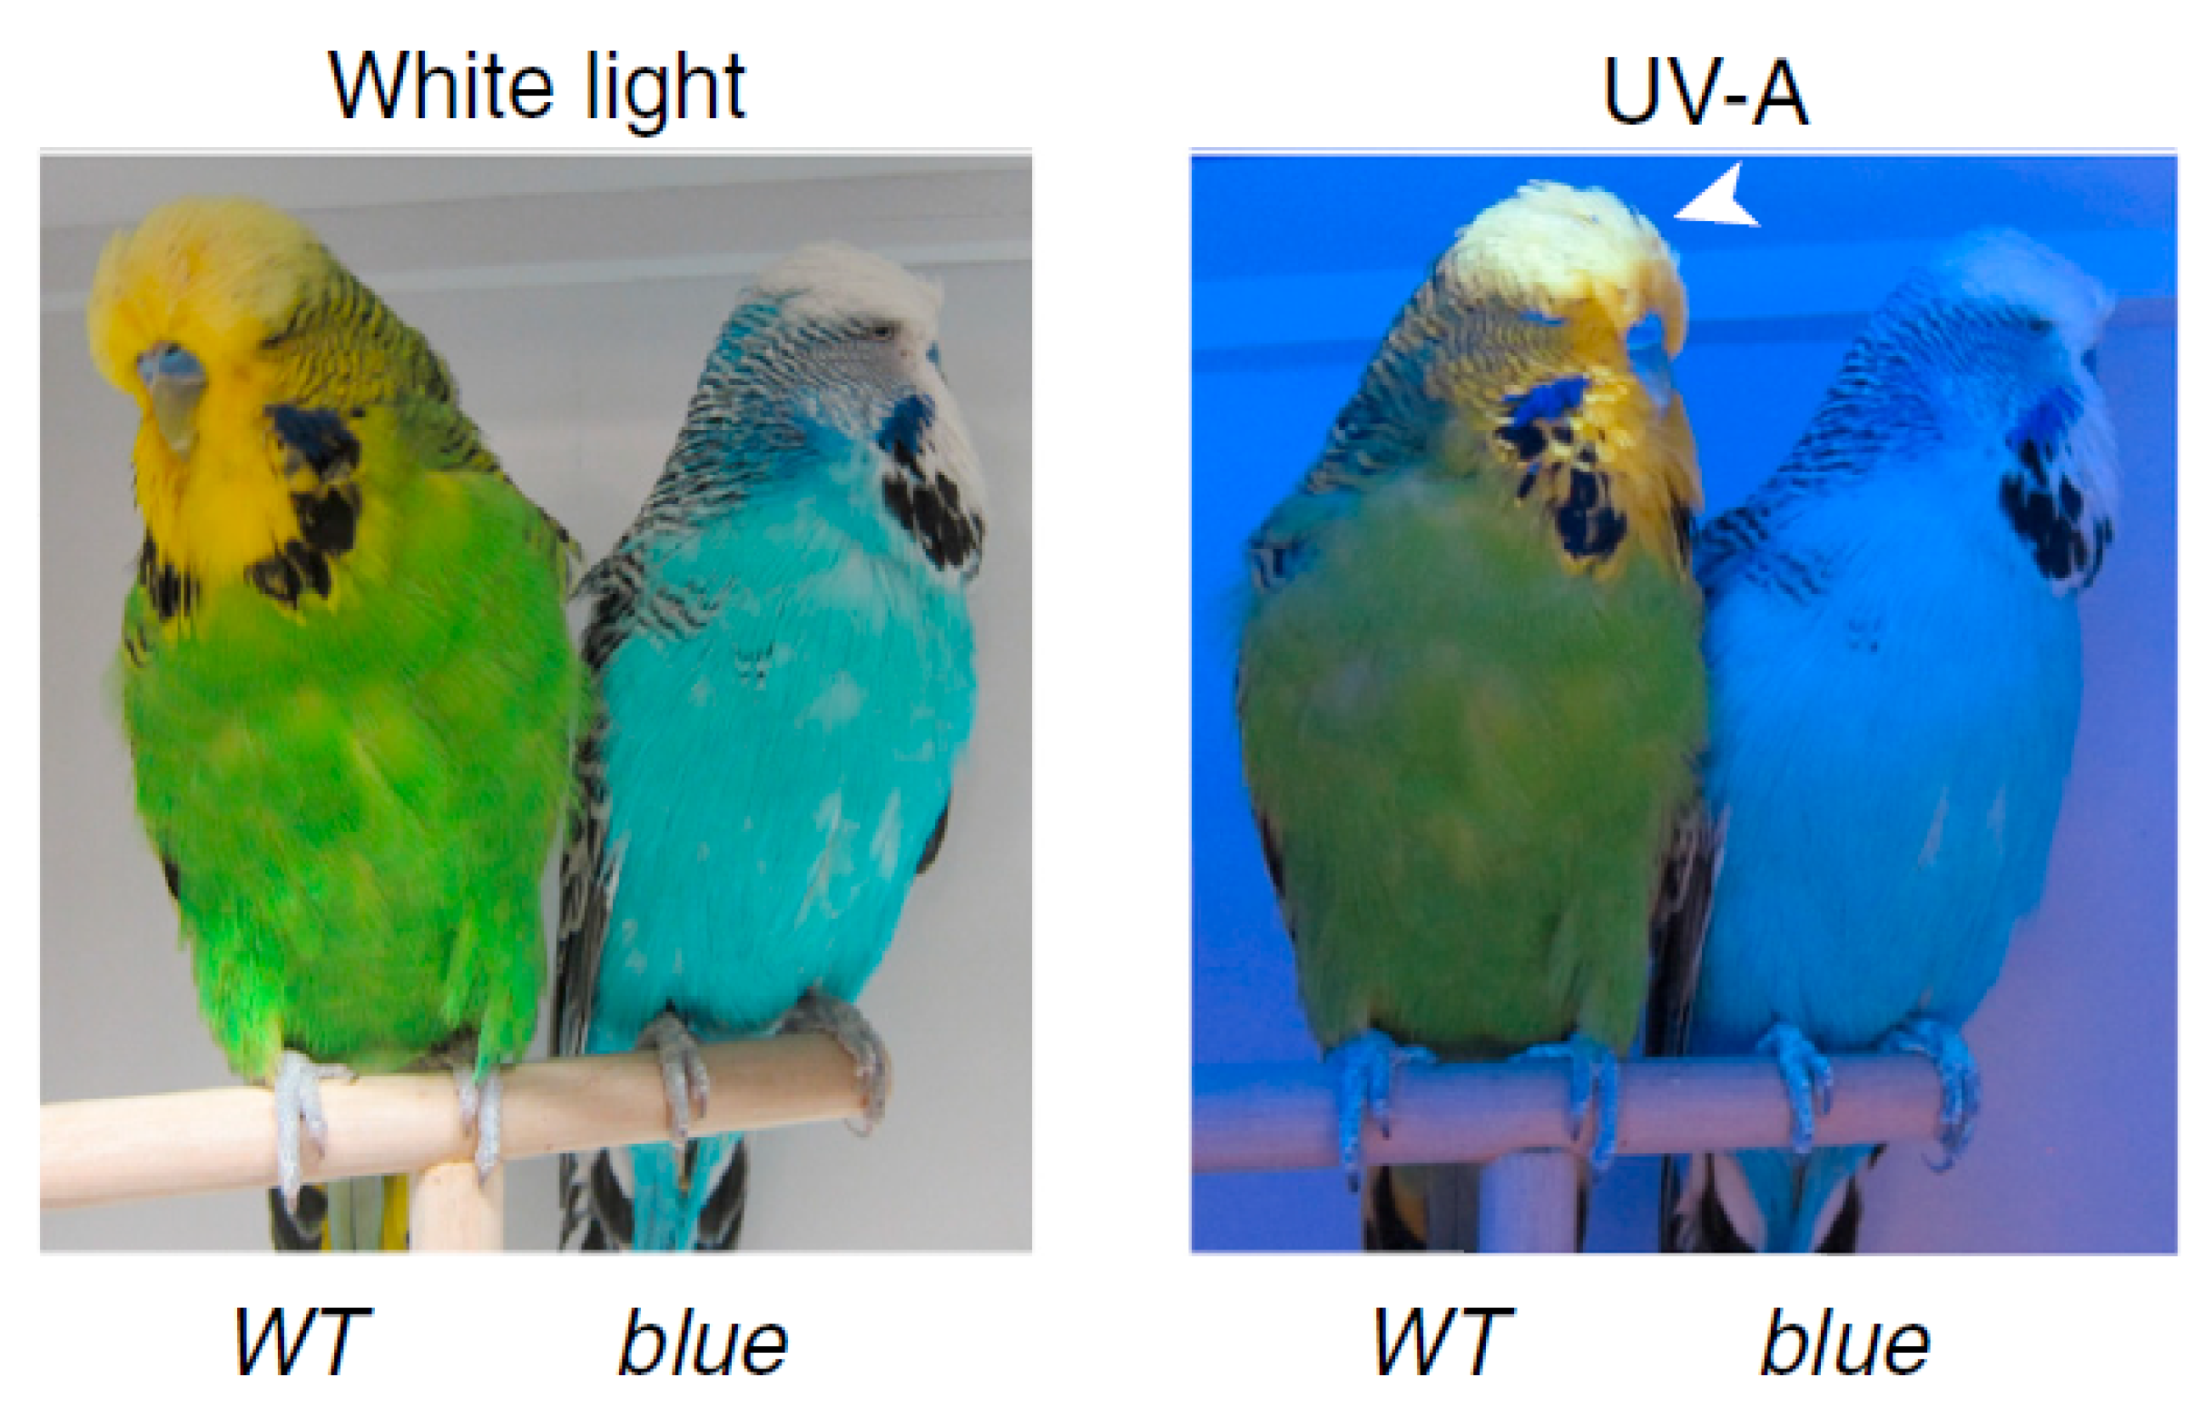
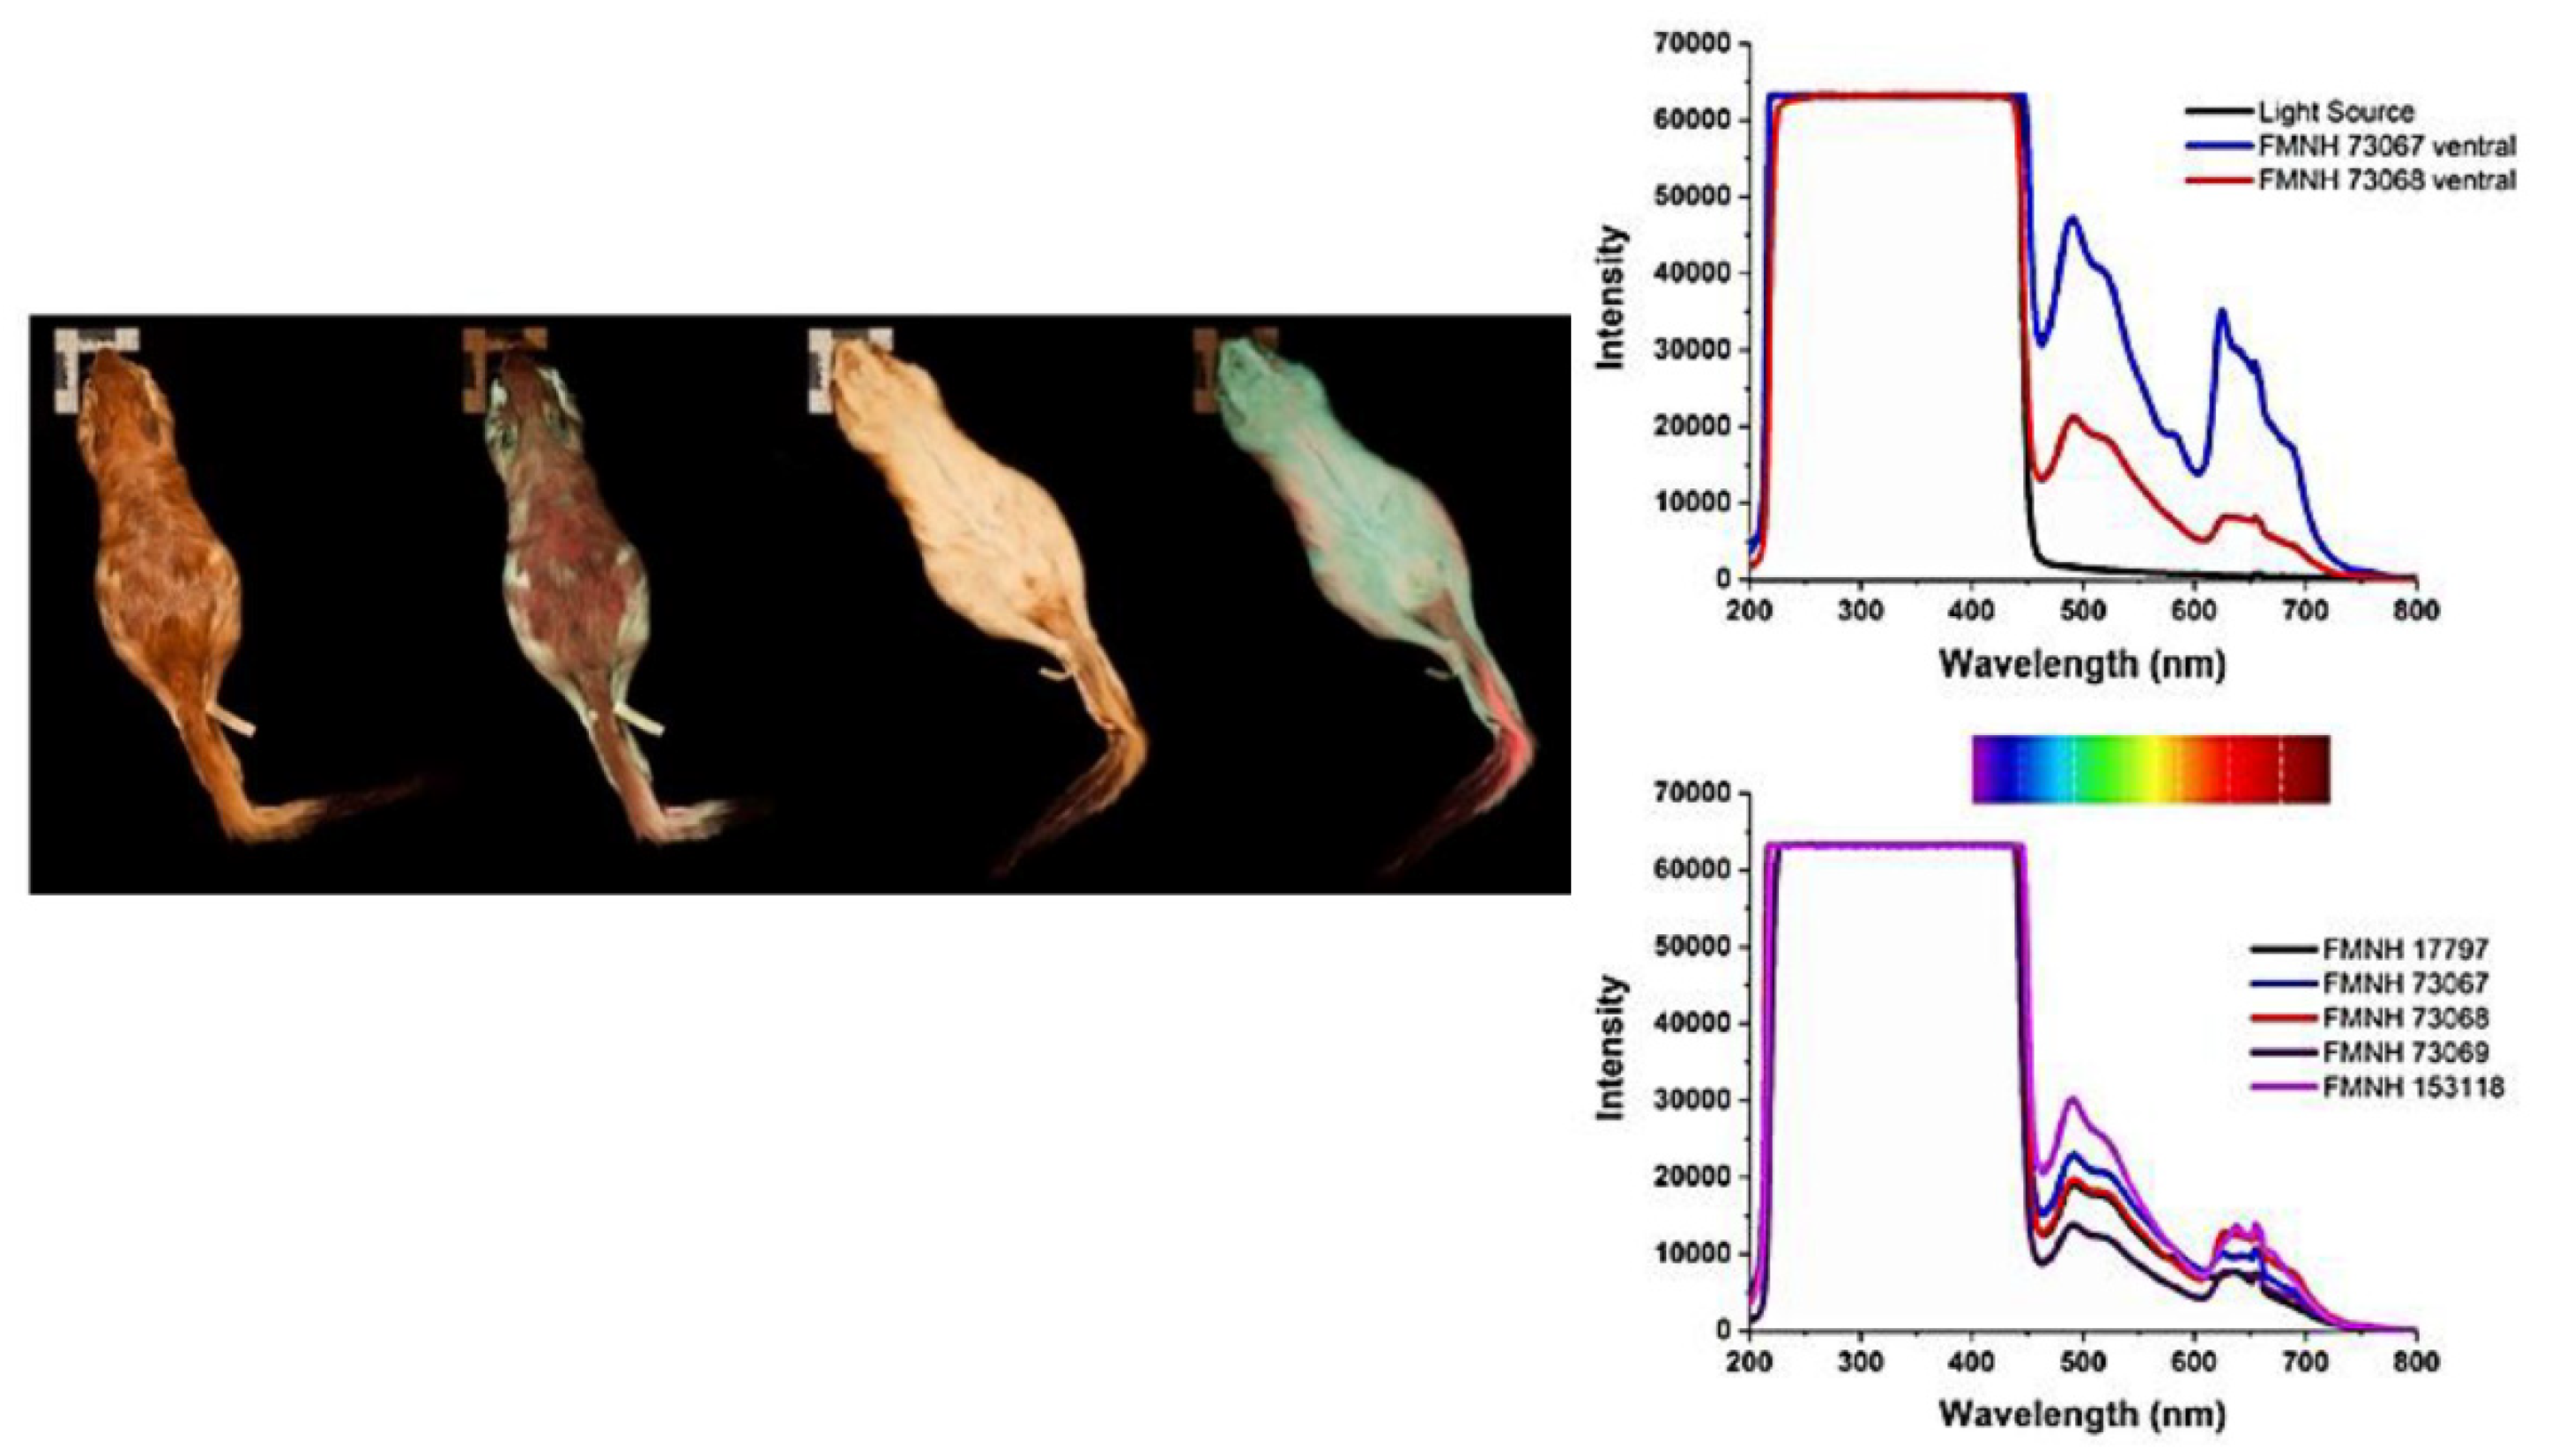
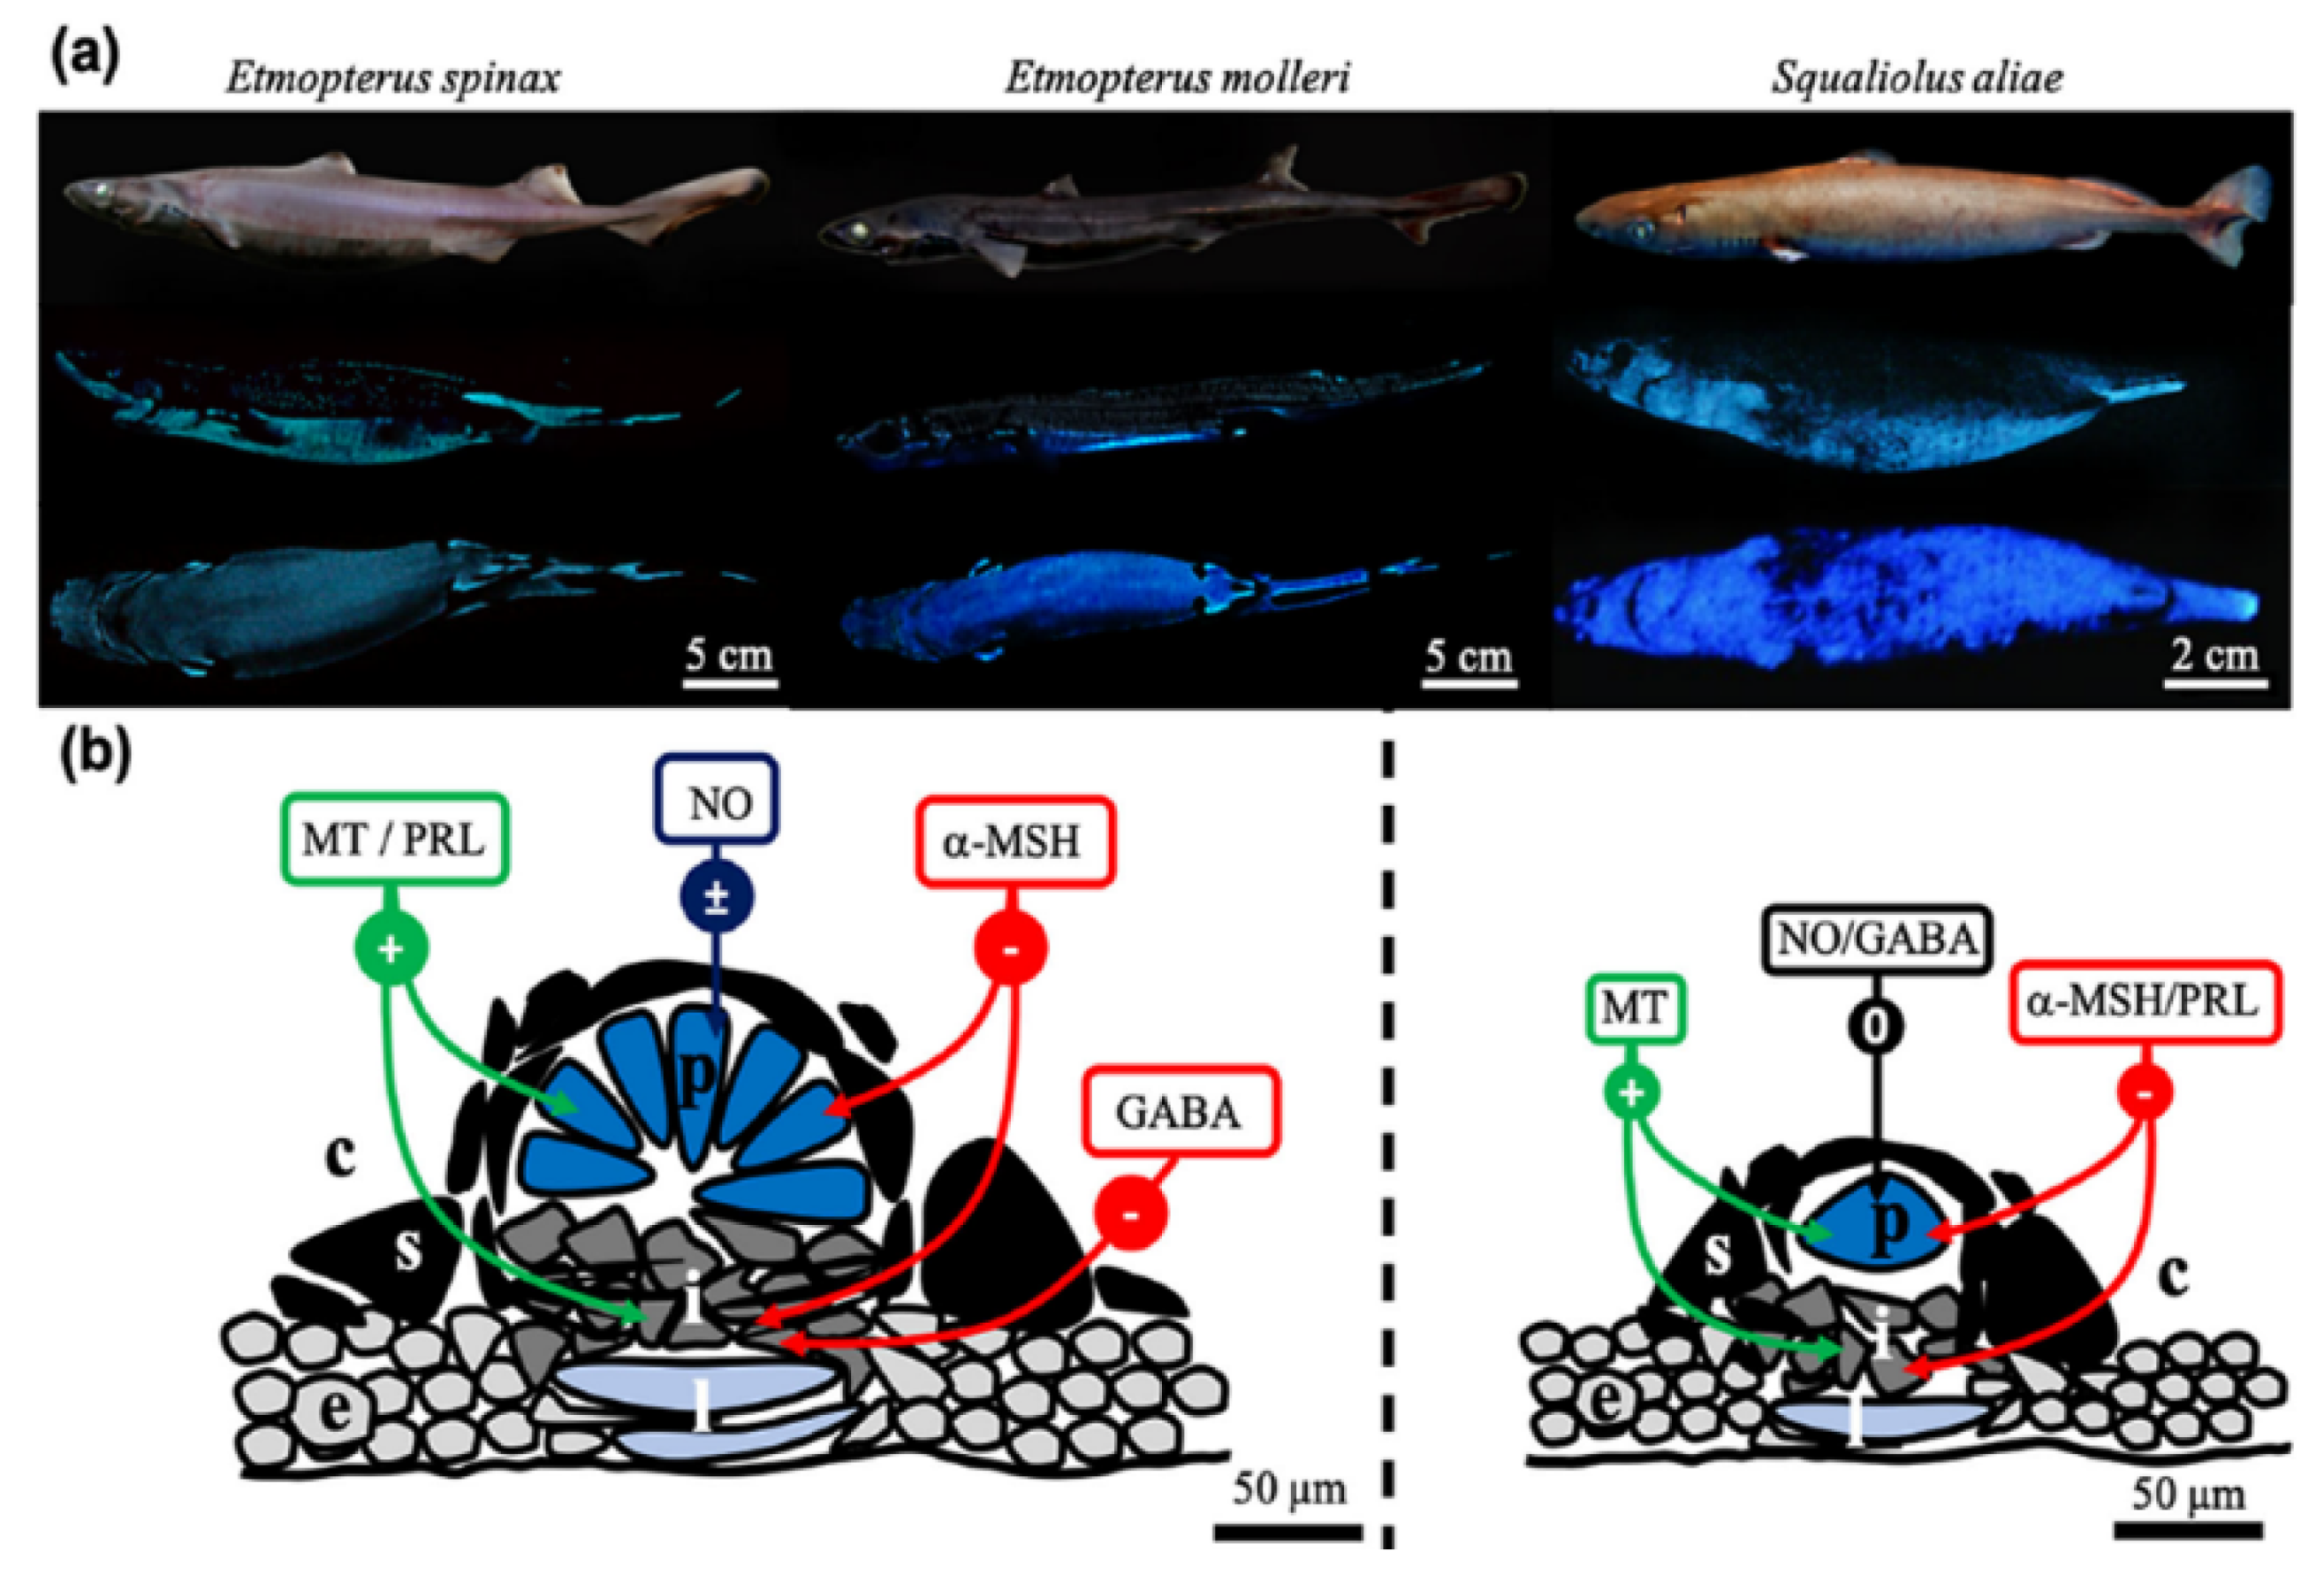
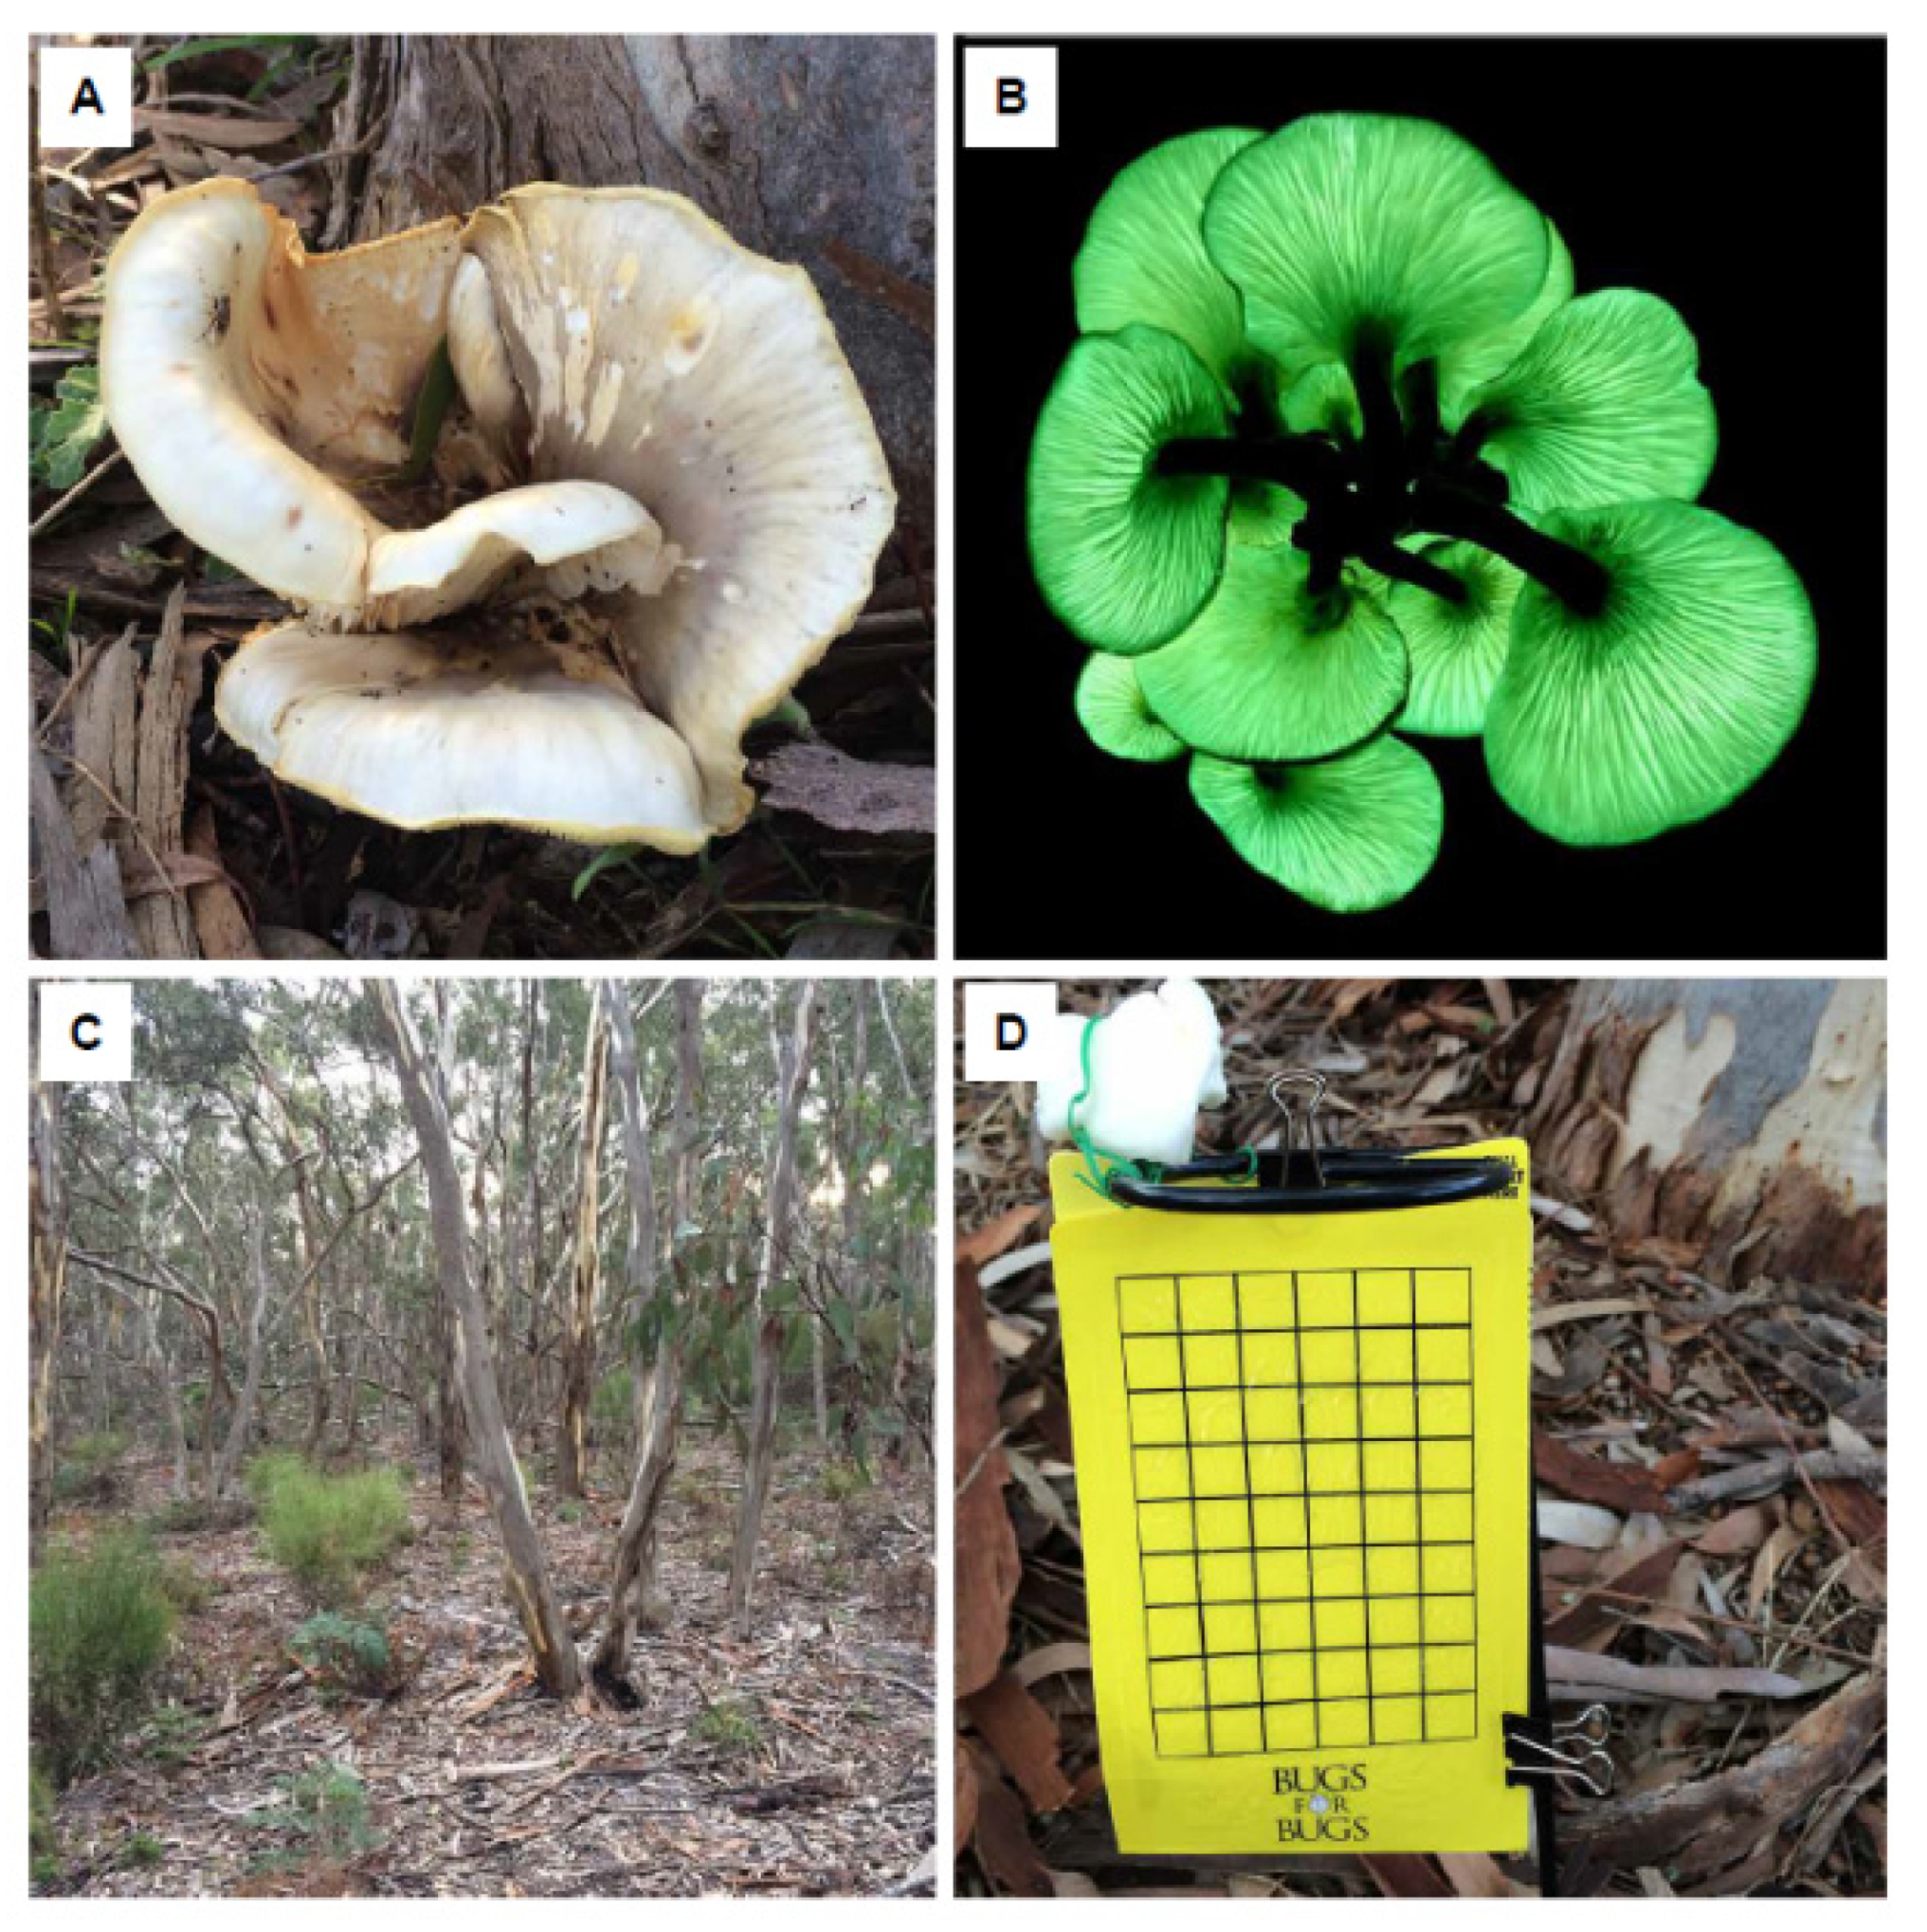
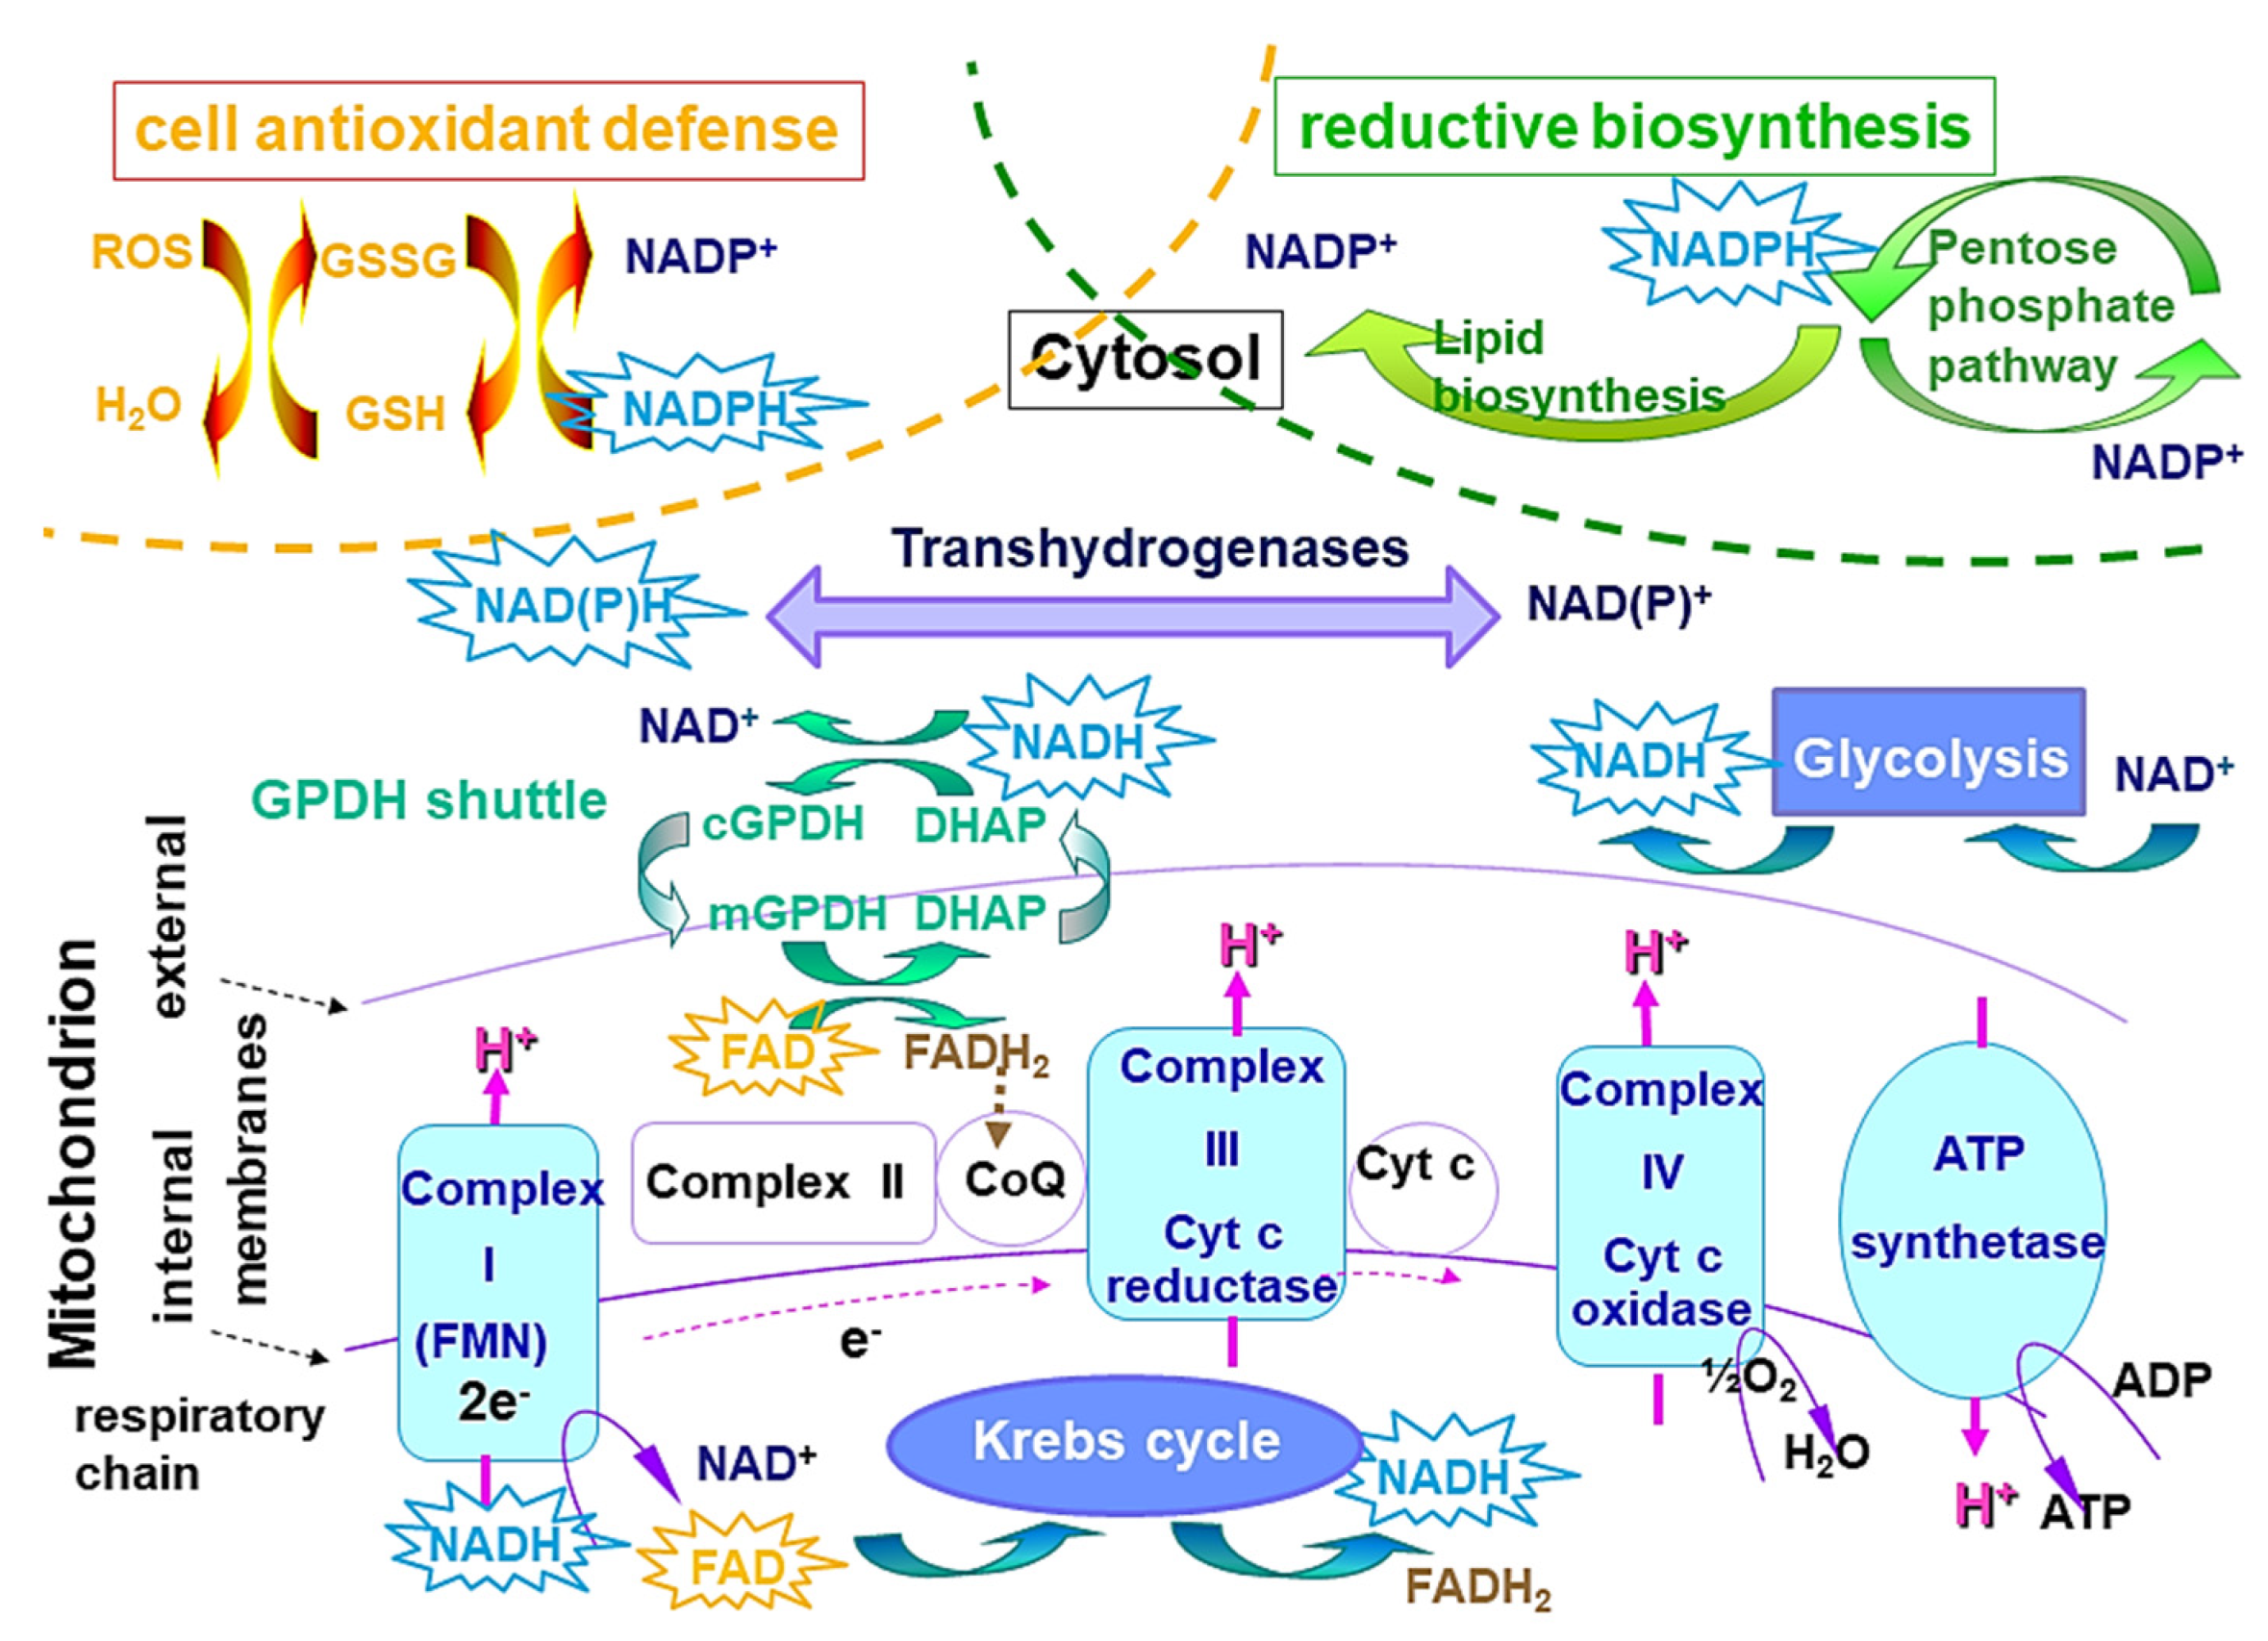
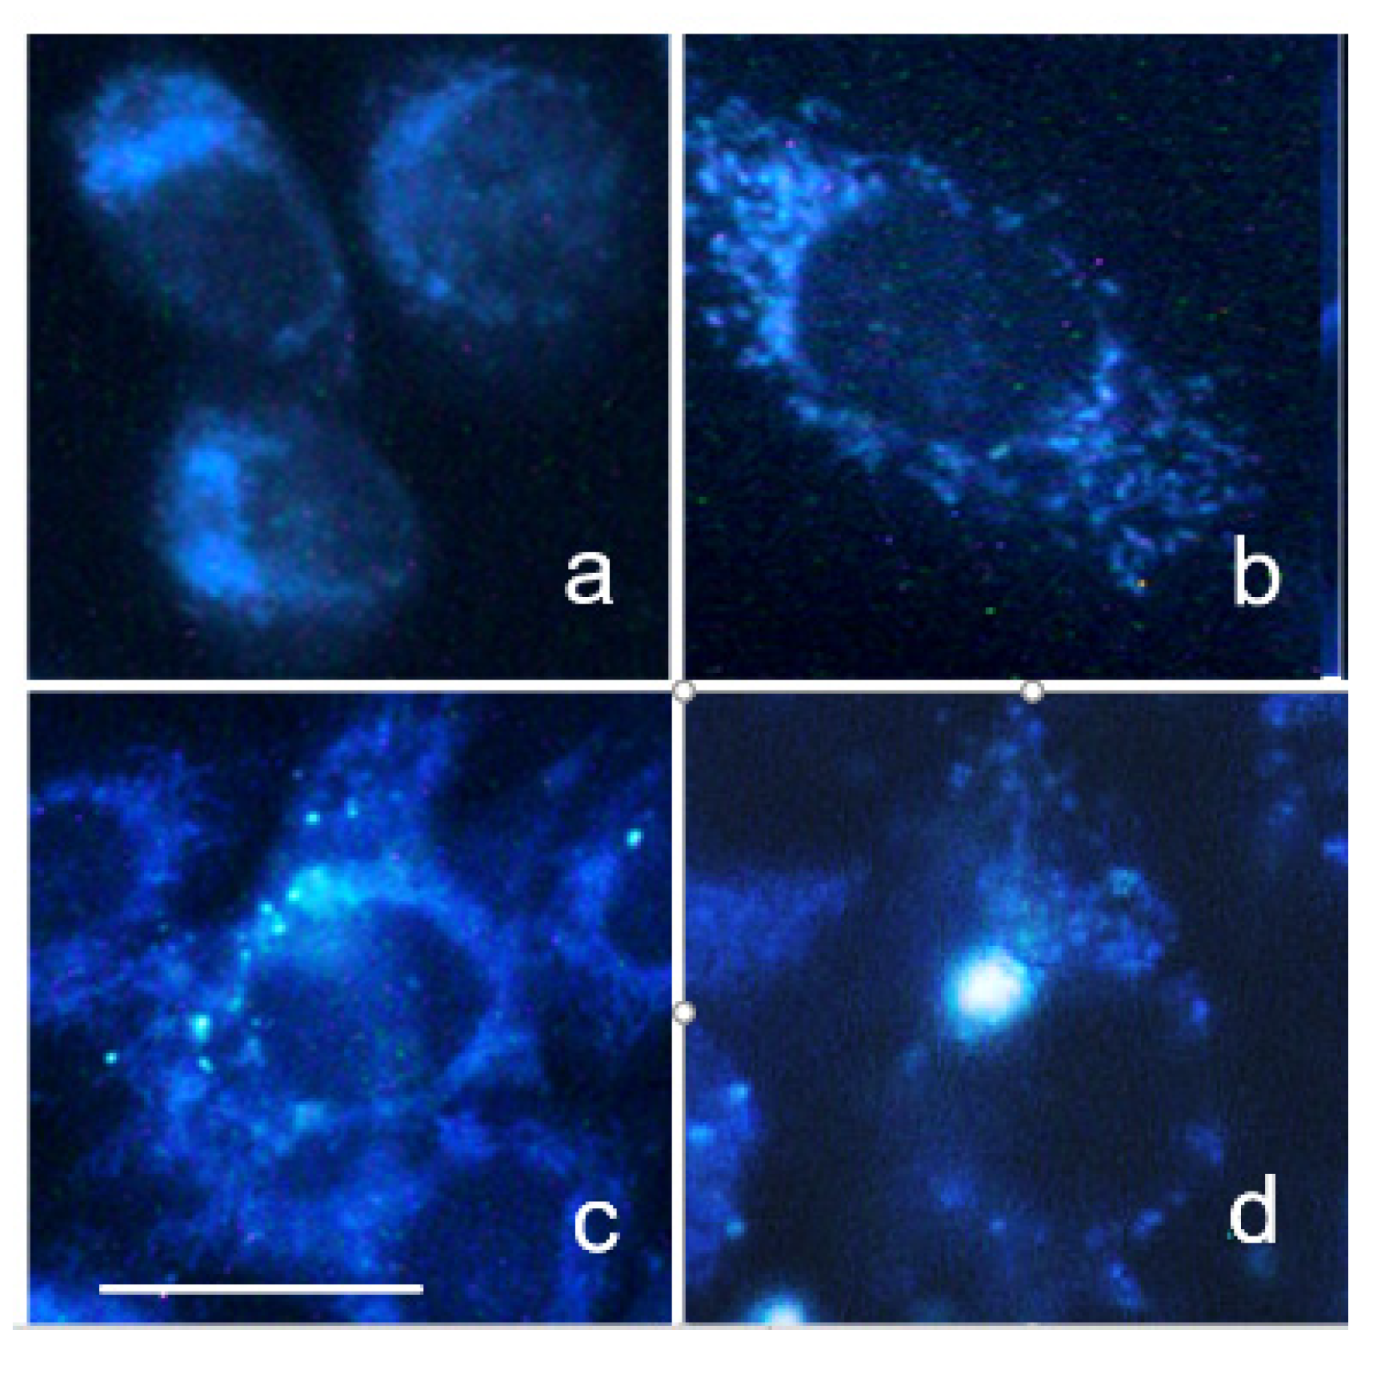
Table 1.
Indicative excitation emission wavelength ranges for the mostly fluorescing products reported in Figure 2 *.
Table 1.
Indicative excitation emission wavelength ranges for the mostly fluorescing products reported in Figure 2 *.
| Fluorophores | Absorption/Excitation (nm) | Emission (nm) | References |
|---|---|---|---|
| Coumarins | 400–450 nm | 450–480 nm | [8] |
| Quinine | 300–400 nm | 400–600 nm | [9] |
| Ferulate | 355 nm | 450–650 nm | [7] |
| Lignin | 355 nm/488 nm | 400–600 nm/500–700 nm | |
| Suberin | 355 nm | 400–600 nm | |
| Flavonoids | 355 nm/488 nm | 400–600 nm/500–700 nm | |
| Kaempherol | 355 nm | 500 nm–800 nm | |
| Dihydrokampherol2 | 355 nm | 500–700 nm | |
| Tannins2 | 488 nm | 490–700 nm | |
| Stilbenes | UV | 400 nm/490 nm–700 nm | |
| Anthocyanins | 310–410 nm 860 nm multiphoton | 360–530 nm 680 nm | |
| Chlorophyll | 350–475 nm/625–690 nm | 640–850 nm | [10,11] |
| Porphyrins | 405 nm | 600–630 nm/670–750 m | [12,13,14] |
| Phycocyanine | 550–670 nm | 650–700 nm | [15] |
| Phycoerythrin | 500–590 nm | 550–650 nm | [16] |
| Riboflavin/flavins | 360/445 nm | 480/540 nm | [17] |
| Nicotinamides | 330–380 nm | 440/480 nm, free/bound | [17] |
* Wavelength positions may vary depending on measurement conditions.
Table 2.
Pigments and fluorophores involved in light harvesting and photosynthesis *.
| Fluorophores | Absorption/ Excitation (nm) | Emission (nm) | Main Functions | References |
|---|---|---|---|---|
| Chlorophylls | 350–475 nm/ 625–690 nm | 640–850 nm | Light harvesting | [10,11] |
| 400–450 nm/ 650–690 nm | 640–850 nm | Spontaneous fluorescence: energy dispersion Induced fluorescence, biomarker of: alga in endosymbiotic studies; of functionality photosystem II; abiotic stress in higher plants | [19] [11,25,26,27,28,31,34,37] | |
| Chlorophyll a | 400–450 nm/ 650–690 nm | 640–850 nm | ||
| Abiotic stress in algae | [62,67] | |||
| Photophysical biomarker to indirectly estimate flavonoids in fruit ripening; biotic stress | [40,41] | |||
| Carotenoid | 400–520 nm | 520–640 nm | Participation to light harvesting; regulation of energy flow in photosynthesis; excessive energy dissipation | [10,22,23] |
| Abiotic stress in higher plants | [39] | |||
| Phycocyanin Allo-phycocyanin | 550–670 nm | 650–700 nm | Light harvesting, efficient energy conversion, photoprotection in cyanobacteria | [58] |
| Food and pharmaceutic additives | [15,50,51,54,55,56,57,58,59] | |||
| Models to improve photovoltaic applications | [15] |
* Other optical parameters besides absorption/fluorescence may have been used in some applications; excitation/emission ranges may vary depending on measurement conditions.
Table 3.
Pigments and fluorophores not involved in photosynthesis *.
| Fluorophores | Absorption/ Excitation (nm) | Emission (nm) | Main Functions | References |
|---|---|---|---|---|
| Phenolic compounds | ||||
| 400–520 nm, >550 nm | 600–700 nm/700–800 nm | Fruit phenolic maturity | [93,94,96,128] | |
| Monitoring of own metabolism, trafficking and cell vacuole sequestration | [80,83] | |||
| Anthocyanins | Abiotic/biotic resistance, biomarker of oxidative stress | [85,93] | ||
| Estimated indirectly from chlorophyll AF as biomarkers in fruit ripening; biotic stress; nutritional advance of herbal food | [40,41,97] | |||
| P-Coumaric, Caffeic, Ferulic Acids | 366 nm. | 430–480 nm | Attract and guide insect preys to the pitcher trap in some carnivorous plants | [113] |
| Catechin | 280/450 nm | 300–340, 400–490 nm/ 550–600 nm | Tea quality and origin | [114,117] |
| Ferulate | 355 nm | 450–650 nm | Diagnosis of plant disorders | [119] |
| Coumarins | 400–500 nm | 500–600 nm | Photosensitizers. Chemical derivatives: pharmacology (e.g., anticoagulants); laser and labelling dyes. Spectral properties vary depending on substituents | [121,122,129] |
| Lignin | 355/488 nm | 400–600 nm/500–700 nm | Wood quality, lignocellulosic biomass processing | [124,127] |
| Porphyrins | 405 nm | 600–630 nm/670–750 m | Intermediates in chlorophylls biosynthesis; biomarkers of leaf photooxidation | [6,55] |
| Quercetin Kaempherol, | 440 nm | 520–600 nm | Spice components, e.g., paprika between flavonoids with a role in auxin transport, gravitropism, and phototropism | [109] |
| 355 nm | 500–800 nm | [7,109] | ||
| Betalains | ||||
| Betaxanthins | 430–500 nm | 500–600 nm | Flower industry; studies on flowers vs. pollinator signaling; biomarker in protein tagging, diagnosis, betalamic production | [105,108,130,131] |
| Betacyanins | 480–540 nm | --- | ||
| Alkaloids | ||||
| Quinine | 300–400 nm | 400–600 nm | Traditional medicine; fluorescence reference standard; pharmacology; soft drinks | [9,132,133,134] |
| Campothecin | 300–400 nm | 450–600 nm | Anticancer drug development | [135] |
| Berberine | 420 nm | 500–600 nm | Traditional medicine, anticancer drug development | [136] |
* Other optical parameters besides absorption/fluorescence may have been used in some applications; excitation/emission ranges may vary depending on measurement conditions.
Table 4.
Fluorophores in bacteria *.
| Fluorophores | Absorption/ Excitation (nm) | Emission (nm) | Main Functions | References |
|---|---|---|---|---|
| Porphyrins | 405 nm | 600–630 nm/670–750 m | Intermediates/catabolites in heme biosynthesis; Biomarkers of bacteria/photodynamic treatment of acne | [143,144,147] |
| Pyoverdine | 360–410 nm 450–480 nm | 450–480 nm | Biomarkers of Pseudomonas aureaginosa infection | [138,141,153] |
| Riboflavin/ flavins | 360/445 nm | 480/540 nm | Intra/extracellular product biomarkers of performance in biowaste processing | [17] |
| Nicotinamides | 330–380 nm | 440/480 nm, free/bound | [17,151] |
* Excitation/emission ranges may vary depending on measurement conditions.
Table 5.
Fluorophores in fungi *.
| Fluorophores | Absorption/ Excitation (nm) | Emission (nm) | Main Functions | References |
|---|---|---|---|---|
| Ergosterol | 360–370 nm | 400–600 nm | Diet, precursors of vitamin D; marker of fungal infestation. | [160]. |
| Flavins | 360/445 nm | 480/540 nm | Markers of fungal infestation, energy metabolism | [157,169] |
| NADH | 330–380 nm | 440/480 nm, free/bound | [167,168,177] |
* Excitation/emission ranges may vary depending on measurement conditions.
Table 6.
Pigments and fluorophores in Animals–Arthropods *.
| Fluorophores | Absorption/ Excitation (nm) | Emission (nm) | Main Functions | References |
|---|---|---|---|---|
| Pteridines | 320–325 nm | 425–450 nm | Butterfly classifying tool | [181] |
| Papiliochrome II | ~400 nm | ~470 nm | ||
| Resiline | 320–380 nm | 420–470 nm | Functional morphology and biomechanism in insects | [195] |
| Other exoskeleton components (e.g., chitin) | 450–490 nm/530–560 nm | >510 nm/ 570–640 nm | ||
| Lipofuscin-like lipopigment | Near UV, 400–500 nm | >460 nm | Membrane lipid peroxidation in Apis Mellifera | [200,201] |
* Excitation/emission ranges may vary depending on measurement conditions.
Table 7.
Pigments and fluorophores in animals–fishes *.
| Fluorophores | Absorption/ Excitation (nm) | Emission (nm) | Main Functions | References |
|---|---|---|---|---|
| Bilirubin-fatty acid a fatty acid binding protein complex | 450–500 nm | 500–580 nm | Advantage in communication and antioxidant protection in cryptic eels | [207,208,209] |
| Guanine crystals | 450–600 nm | 600–700 nm | Visual contrast and signaling functions in cryptid fishes | [210] |
| Bromo-tryptophan-kynurenine derivative | 300–350 nm/380–420 nm | 430–550 nm | Antibacterial role in some shark species | [212] |
* Excitation/emission ranges may vary depending on measurement conditions.
Table 8.
Pigments and fluorophores in animals–reptiles and amphibians *.
| Fluorophores | Absorption/ Excitation (nm) | Emission (nm) | Main Functions | References |
|---|---|---|---|---|
| Hyloin (dedihydroisoquinolinone) | 400 nm | 420–570 nm | Visual perception in terrestrial environments in Hypsiboas punctatus, a South America frog | [217] |
| Likely a fluorescent-iridophore-specific protein. | 330–390 nm/400–500 nm | 400–500 nm/500–600 nm | Night communication and signaling, proposed in desert gecko Pachydactylus rangei | [215] |
| Undefined, from skull bone tubercles | 353 nm | 360–500 nm | Communication and signaling, proposed in Chameleons | [214] |
| Undefined, from bone | 365 nm | 400–600 nm | Alternate communication vs. loss of high-frequency hearing, proposed in South America pumpkin toadlets | [216] |
* Excitation/emission ranges may vary depending on measurement conditions.
Table 9.
Pigments and fluorophores in animals–birds *.
| Fluorophores | Absorption /Excitation (nm) | Emission (nm) | Main Functions | References |
|---|---|---|---|---|
| Psittacofulvins | 300–400 nm | 450–600 nm | Typical in parrots, proved to drive sexual choice, but un-influent on the social life of the Australian budgerigars Melopsittacus undulatus | [226,227] |
| Porphyrins | 405 nm | 600–630 nm/670–750 m | Typical in crepuscular and nocturnal birds, e.g., Caprimulgus ruficollis, still undefined | [228] |
* Excitation/emission ranges may vary depending on measurement conditions.
Table 10.
Fluorophores in animals–mammalians *.
| Fluorophore | Absorption/ Excitation (nm) | Emission (nm) | Main Functions | References |
|---|---|---|---|---|
| Porphyrins in furs in: Didelphid marsupials; Pedetidae family rodents, likely endogenous from hair cuticle; Erinaceus europaeus, exogenous from spine microbiome; North American Glaucomys flying squirrels, from the diet | 405 nm | 600–630 nm/670–750 m | Undefined/crepuscular signaling functions | [229,230,231,233] |
* Excitation/emission ranges may vary depending on measurement conditions.
Table 11.
Bioluminescence.
| Fluorescing System: Luciferase Enzyme-luminescent Luciferine | Energy Source/Absorption | Emission (nm) | Main Functions | References |
|---|---|---|---|---|
| Luciferase-flavine based luciferin | biochemical reactions by redox enzymatic system | ~490 nm | Poorly defined biological meaning, apart reciprocal advantage from symbiosis with fishes; taxonomic and luminescence mechanisms studies. Sensing by biomechanical stimuli in Dinoflagellates, a model for artificial shear stress activatable polymersomes nanoreactors | [235,236,239,241,242,243,245,248,263] |
| Luciferase-flavine based luciferine/yellow fluorescing protein | ~490/~534 nm | Vibrio fischeri, taxonomic, luminescence mechanism studies; association with the squid Euprymna scolopes: host interaction mechanisms studies | [238,249] | |
| Not better-defined luciferin/luciferase couple | ~470 nm | Regulation mechanism by hormonal control in deep sea shark studies | [246] | |
| Luciferase-3-hydroxyhispidin based luciferin | Genome plasticity in evolution, mechanism and possible functional roles of bioluminescence in the ecology of fungi (Agaricales, Armillaria and Mycene species). | [251,252] | ||
| Non enzymatic, calcium dependent photoprotein (aequorin)/energy transfer to natural GFP | Absorption: 200 nm/400 nm/480 nm | 470 nm (aequorin)/509 (GFP) | Expansive production of fluorescing proteins for multipurpose labelling in biomedicine (FP palette generation) | [257,258,259,260,261,262] |
Table 12.
Fluorophores in normal and altered cell and tissues *.
| Fluorophores | Absorption/ Excitation (nm) | Emission (nm) | Main Functions | References |
|---|---|---|---|---|
| NAD(P)H | 330–380 nm | 440/480 nm, free/bound | Energy/redox metabolism, reductive biosynthesis; phlogosis; carcinogenesis | [17,292,351] |
| Flavins | 360/445 nm | 480/540 nm | Energy/redox metabolism; phlogosis; carcinogenesis | [17,289] |
| Vitamin A | near UV/366 nm | <460 nm | Regulation of systemic body metabolism, cell proliferation-differentiation, immunity, development, reproduction; vision | [349,352,353] |
| Fluorescing Free Fatty acids | 330–350 nm | 470–480 nm | Signaling in metabolic syndrome/liver steatosis | [349] |
| Bilirubin | 366–450 nm | 540–600 nm | Heme/iron catabolism, liver functionality | [344] |
| Porphyrins | 405 nm | 600–630 nm/670–750 m | Heme/iron metabolism/PDD/PDT | [12,278,279,280,281,282,283] |
| 5-hydroxytriptamine (5-HT) | near UV/366 nm | <400 nm | Uptake disorder at synapsis | [354] |
| Collagen | 280–325nm) | 400–410 nm | Connective tissue/fibrosis | [17,355] |
| Elastin | 300–400 nm | 400–500 nm | Connective tissue | [356] |
| Cytokeratins | 355 nm/405 nm | 350–500 nm/450–600 nm | Intermediate filaments in epithelia, tumor markers | [357,358,359] |
| Lipofuscin-like lipopigment | Near UV, 400–500 nm | >460 nm | Oxidative stress | [360,361] |
* Excitation/emission ranges may vary depending on measurement conditions.
Publisher’s Note: MDPI stays neutral with regard to jurisdictional claims in published maps and institutional affiliations. |
© 2021 by the author. Licensee MDPI, Basel, Switzerland. This article is an open access article distributed under the terms and conditions of the Creative Commons Attribution (CC BY) license (https://creativecommons.org/licenses/by/4.0/).
Share and Cite
MDPI and ACS Style
Croce, A.C. Light and Autofluorescence, Multitasking Features in Living Organisms. Photochem 2021, 1, 67-124. https://0-doi-org.brum.beds.ac.uk/10.3390/photochem1020007
AMA Style
Croce AC. Light and Autofluorescence, Multitasking Features in Living Organisms. Photochem. 2021; 1(2):67-124. https://0-doi-org.brum.beds.ac.uk/10.3390/photochem1020007
Chicago/Turabian StyleCroce, Anna C. 2021. "Light and Autofluorescence, Multitasking Features in Living Organisms" Photochem 1, no. 2: 67-124. https://0-doi-org.brum.beds.ac.uk/10.3390/photochem1020007