
Thermodynamic Assessment of the AF–CrF3 (A = Li, Na, K) and CrF2–CrF3 Systems


1
Radiation Science & Technology Department, Faculty of Applied Sciences, Delft University of Technology, Mekelweg 15, 2629 JB Delft, The Netherlands
2
Joint Research Centre, European Commission, P.O. Box 2340, D-76125 Karlsruhe, Germany
*
Author to whom correspondence should be addressed.
Thermo 2021, 1(2), 205-219; https://0-doi-org.brum.beds.ac.uk/10.3390/thermo1020014
Submission received: 17 June 2021
/
Revised: 5 August 2021
/
Accepted: 10 August 2021
/
Published: 18 August 2021
(This article belongs to the Special Issue Thermodynamics and Nuclear Materials)
Abstract
:Understanding the corrosion mechanisms and the effect of corrosion products on the basic properties of the salt (e.g., melting point, heat capacity) is fundamental for the safety assessment and durability of molten salt reactor technology. This work focused on the thermodynamic assessment of the CrF2−CrF3 system and the binary systems of chromium trifluoride CrF3 with alkali fluorides (LiF, NaF, KF) using the CALPHAD (computer coupling of phase diagrams and thermochemistry) method. In this work, the modified quasi-chemical model in the quadruplet approximation was used to develop new thermodynamic modelling assessments of the binary solutions, which are highly relevant in assessing the corrosion process in molten salt reactors. The agreement between these assessments and the phase equilibrium data available in the literature is generally good. The excess properties (mixing enthalpies, entropies and Gibbs energies) calculated in this work are consistent with the expected behaviour of decreasing enthalpy and Gibbs energy of mixing with the increasing ionic radius of the alkali cations.
1. Introduction
The molten salt reactor (MSR) was selected as one of the six reactor designs retained by the Generation IV International Forum (GIF) for the next generation of nuclear reactors [1], which aims to replace the current fleet of light water reactors in the coming decades. Fluoride salts containing alkali fluorides are considered a promising heat transfer medium and coolant in the primary and secondary loops of MSR systems. A major concern for the operation of these reactors is the degradation of structural materials caused by the corrosive properties of fluoride salt at high temperatures. The understanding of corrosion phenomena is fundamental for the safety of the MSR and commercial exploitation in the near future. An example of a typical fuel salt composition is 7LiF−ThF4−UF4−(UF3), proposed for the European Molten Salt Fast Reactor (MSFR) design [2], or 7LiF−NaF−(KF)−AnF4−AnF3 (An = actinide) considered for the MSR-burner [3]. The so-called FLiNaK salt (LiF–NaF–KF mixture) is, moreover, a potential choice for secondary coolant systems of the MSFR designs [3].
Ni-based alloys, which have shown the best resistance to fluoride salts, with alloying elements such as Fe, Cr and Mo, are currently the reference. Chromium is the least stable element in this alloy, leading to the dissolution of CrxFy fluorides inside the fluoride salt matrix and the formation of discrete voids in the Ni-based alloy which could affect the general integrity of the structure of the reactor. Depending on fluorine potential and temperature, the formed chromium fluoride species will be stable as divalent or trivalent species. The current reference structural alloy for MSRs fuelled with a fluoride fuel salt is Hastelloy-N, which has the following composition: Ni(70.6 wt%), Mo(16.8 wt%), Cr(7.01 wt%), Fe(4.16 wt%), Mn(0.52 wt%), Al(0.15 wt%), Ti(0.002 wt%), Si(0.36 wt%) and C(0.055 wt%) [4]. This material has demonstrated its promising performance during the Molten Salt Reactor Experiment (MSRE) of the Oak Ridge National Laboratory (ORNL) in the 1950s [5]. The presence of a 7 wt% fraction of chromium appears as a good proportion to provide the required mechanical strength for the core components, while not being overly exposed to salt corrosion. The redox potential of the fuel salt, controlled by the UF4/UF3 ratio, determines the rate of corrosion of the structural material. During the fission process, free fluorine is formed, which reacts with UF3; hence, increasing the UF4/UF3 ratio and redox potential of the salt which results in an increase in the corrosion rate of the structural material. This leads to oxidation reactions such as Cr(alloy) + 2UF4(salt) = CrF2(salt) + 2UF3(salt) [6]. Olson et al. conducted a comparative study with different Ni-based alloys including Hastelloy with different contents of chromium [7,8]. The authors studied the corrosion rate at a high temperature (1123 K) of FLiNaK salt (LiF–NaF–KF: 46.50–11.5–42 mol%) with an immersion device and confirmed the correlation between the Cr content and corrosion resistance of the Ni-based alloy. Except for the quasi-pure nickel metal, Hastelloy-N proved its superior resistance to corrosion. A high proportion of Cr (≃20 wt%) led to the high Cr depletion of the structural material, and the degradation was particularly enhanced in the presence of Cr3+ cations in solution [4].
Understanding the effect of the corrosion products on the basic properties of the salt (e.g., melting point, heat capacity) is fundamental for the safety assessment and durability of MSR technology. This work thus focused on a thermodynamic modelling assessment of the CrF2–CrF3 system and the binary systems of chromium trifluoride CrF3 with alkali fluorides (LiF, NaF, KF), based on data previously reported in the literature on these systems.
2. Literature Review
2.1. Structural Data
The binary and ternary compounds that are stable in the systems under investigation in this work are CrF2, CrF3, Cr2F5, Li3CrF6, NaCrF4, Na3CrF6, Na5Cr3F14, KCrF4, K2CrF5, K2Cr5F17 and K3CrF6. The most relevant reported structural properties on the latter phases are listed in Table 1.
Most chromium fluoride solid compounds have been reported as green crystal powder [15,21,22] or sometimes as black powder [23]. Most of the intermediate compounds in the LiF−CrF3, NaF−CrF3 and KF−CrF3 systems, first described as early as 1969 by de Kozak [15,21], have been confirmed by more recent structural studies (referenced in Table 1). However, some doubts remain regarding the structural determinations of Na5Cr3F14, K2Cr5F17 and K3CrF6. Na5Cr3F14 is known to have three crystalline forms: -monoclinic, -tetragonal and -orthorhombic [15], but the reported differential calorimetry experiments have not allowed to clearly identify the phase transition temperatures between the different crystalline forms [24]. De Kozak found in 1971, by X-ray diffraction, that K2Cr5F17 has an orthorhombic structure (space group Pmmm) [19]. However, this study did not report the atomic positions, so the data for this compound are incomplete. De Kozak [15] postulated different crystalline phases for K3CrF6 with transitions: . Only the γ-cubic phase has been formally identified by X-ray diffraction at 523 K [19].
2.2. Thermodynamic Data
The thermodynamic data available on the aforementioned binary and ternary compounds
are rather limited in the literature. Hansen [25] performed adiabatic calorimetry measurements between 15 and 300 K on CrF3 and derived the standard entropy at 298.15 K as (93.88 ± 0.15) J·K−1·mol−1 and the heat capacity at 298.15 K as (78.75 ± 0.01) J·K−1·mol−1. In this work, data provided by the IVTAN tables [26] and SGPS–SGTE pure substances database [27] have been used for the thermodynamic functions for CrF3. The
fusion temperature has been experimentally measured at (1698 ± 20) K for CrF3 and (1167 ± 2) K for CrF2 by Sturm [23] in 1962, and is still considered an appropriate reference. No other data have been found for the thermodynamic properties for CrF2. In this work, the IVTAN/SGPS–SGTE databases were also used for the thermodynamic functions (Table 2).
Thermodynamic data have barely been explored for the intermediate compounds in the AF−CrF3 systems. De Kozak [15] reported the temperature of fusion of Li3CrF6 to be Tfus = 1125 K. For NaCrF4, Yin derived the enthalpy of formation from the binary species
NaF and CrF3 at 0 K as −39.990 kJ·mol−1 based on first principles calculations. The mixing enthalpy was calculated to be −36.498 kJ/mol for the liquid phase at the (NaF:CrF3) = (1:1) composition at 1500 K [28]. The same method was applied to estimate the formation
enthalpies from NaF and CrF3 at 0 K of Na3CrF6 and Na5Cr3F14 as −96 kJ·mol−1 and −197 kJ·mol−1, respectively [29]. Yin reported a formation enthalpy from KF and CrF3 at 0 K of −64.912 kJ·mol−1 for the KCrF4 intermediate compound and a mixing enthalpy of −51.633 kJ·mol−1 at 1500 K for the liquid of this composition [29]. For K2CrF5, K2Cr5F17 and K3CrF6, no thermodynamic data are available to this date in the open literature.

Table 2.
Thermodynamic data for end-members and intermediate compounds were used in this work for the thermodynamic assessment. Standard enthalpy of formation (298.15 K), standard entropy (298.15 K), and heat capacity coefficient of pure compounds (T/K)/(J·K−1·mol−1) = a + b·T + c·T2 + d·T−2 + e·T3. Optimized data are presented in bold.
| Compound | (298.15 K) | (298.15 K) | (T/K)/(J·K−1·mol−1) = a + b·T + c·T2 + d·T−2 + e·T3 | T(K) | Ref. | ||||
|---|---|---|---|---|---|---|---|---|---|
| (kJ·mol−1) | (J·K−1·mol−1) | a | b | c | d | e | |||
| LiF(Cr) | −616.931 | 35.66 | 43.30898 | 0.016312168 | 5.0470398 × 10⁻⁷ | −569123.6 | 298.15−2500 | [30] | |
| LiF(l) | −598.654 | 42.96 | 64.183 | - | - | - | - | 298.15–6000 | [30] |
| NaF(Cr) | −576.650 | 51.21 | 47.630 | 0.01479 | - | −464300 | - | 298.15–2500 | [30] |
| NaF(l) | −557.730 | 52.75 | 72.989 | - | - | - | - | 298.15–6000 | [30] |
| KF(Cr) | −568.606 | 66.55 | 68.757414 | −0.057756882 | 7.5404856 × 10⁻⁵ | −766718.34 | −2.3885627 × 10⁻⁸ | 298.15−2000 | [30] |
| KF(l) | −554.374 | 67.77 | 71.965 | - | - | - | - | 298.15–6000 | [30] |
| CrF2(Cr) | −781.8 | 86.87 | 76.68345 | 0.0105410 | −1.386756 × 10⁻⁹ | −1338373 | - | 298.15–1167 | [26,27] |
| CrF2(l) | −764.692 | 86.308 | 100 | - | - | - | - | 1167–4000 | [25,26,27] |
| CrF3(Cr) | −1160.0 | 93.88 | 75.86301 | 0.0404446 | −4.20805 × 10⁻⁶ | −782870 | - | 298.15–1100 | [25,26,27] |
| CrF3(Cr) | - | - | 226.552 | −0.0870137 | 2.020701 × 10⁻⁵ | −49199760 | - | 1100–1698 | [26,27] |
| CrF3(l) | −1125.281 | 83.0567 | 130 | - | - | - | - | 1698–2500 | [26,27] |
| Cr2F5(Cr) | −1950.8 | 181.0 | 152.54646 | 0.05098565 | −4.20944 × 10⁻⁶ | −2121243 | - | 298.15–6000 | [26], this work |
| Li3CrF6(Cr) | −3070.0 | 210.6 | 205.78995 | 0.089381104 | −2.69393806 × 10⁻⁶ | −2490240.8 | - | 298.15–1100 | [26], this work |
| Li3CrF6(Cr) | - | - | 356.47894 | −0.038077196 | 2.172112194 × 10⁻⁵ | −50907130.8 | - | 1100−3000 | [26], this work |
| NaCrF4(Cr) | −1777.5 | 156.2 | 123.49301 | 0.0552346 | −4.20805 × 10⁻⁶ | −1247170 | - | 298.15–3000 | [26], this work |
| α—Na3CrF6(Cr) | −2935.9 | 314.5 | 218.75301 | 0.0848146 | −4.20805 × 10⁻⁶ | −2175770 | - | 298.15–913 | [26], this work |
| β—Na3CrF6(Cr) | −2925.4 | 326.3 | 218.75301 | 0.0848146 | −4.20805 × 10⁻⁶ | −2175770 | - | 913–3000 | [26], this work |
| Na5Cr3F14(Cr) | −6545.65 | 584.2 | 465.739030 | 0.1952838 | −1.262415 × 10⁻⁵ | −4670110 | - | 298.15–3000 | [26], this work |
| α—KCrF4(Cr) | −1772.8 | 181.9 | 144.620424 | −0.017312282 | 7.1196806 × 10⁻⁵ | −1549588.34 | −2.3885627 × 10⁻⁸ | 298.15–1066 | [26], this work |
| β—KCrF4(Cr) | −1768.8 | 185.9 | 144.620424 | −0.017312282 | 7.1196806 × 10⁻⁵ | −1549588.34 | −2.3885627 × 10⁻⁸ | 1066–3000 | [26], this work |
| K2CrF5(Cr) | −2378.6 | 251.0 | 213.377838 | −0.075069164 | 1.4660166 × 10⁻⁴ | −2316306.68 | −4.7771254 × 10⁻⁸ | 298.15–3000 | [26], this work |
| K2Cr5F17(Cr) | −7067.5 | 632.8 | 516.829878 | 0.086709236 | 1.2976946 × 10⁻⁴ | −5447786.68 | −4.7771254 × 10⁻⁸ | 298.15–3000 | [26], this work |
| α—K3CrF6(Cr) | −2941.2 | 338.5 | 282.135252 | −0.132826046 | 2.2200652 × 10⁻⁴ | −3083025.02 | −7.1656881 × 10⁻⁸ | 298.15−499 | [26], this work |
| β—K3CrF6(Cr) | −2925.0 | 371.3 | 282.135252 | −0.132826046 | 2.2200652 × 10⁻⁴ | −3083025.02 | −7.1656881 × 10⁻⁸ | 499–3000 | [26], this work |
2.3. Phase Diagram Data
2.3.1. CrF2−CrF3 System
Only one study was reported in 1962 on the phase equilibria of the CrF2−CrF3 system by Sturm [23] based on quenching experiments. Two invariant equilibria were observed in the system: an eutectic point at X(CrF3) = 0.14 with a temperature of (1104 ± 5) K and a peritectic equilibrium at X(CrF3) = 0.29 and T = (1270 ± 5) K. A single intermediate compound was identified in the region between X(CrF3) = 0.40 and X(CrF3) = 0.45, corresponding to the mixed valence state compound Cr2F5 with an extended region of stability [16,31]. Sturm [23] suggested the composition of the solution phase “Cr(II,III) fluoride” to be between 0.42 and 0.46, so slightly below the ideal 0.50 composition, but did not explore the stability in the temperature range below 1023 K. Tressaud et al. [31] and Lacorre et al. [16] reported crystallographic data for the Cr2F5 compound. Its melting point was determined to be (1270 ± 5) K [23]. Two solid solutions were finally identified, from X(CrF3) = 0 to X(CrF3) = 0.01 and from X(CrF3) = 0.90 to X(CrF3) = 1, respectively. No thermodynamic model has been developed for this system to this date. A sketch of the phase diagram was drawn by Sturm in accordance with the experimental data collected in their work [23].
2.3.2. AF−CrF3 (A = Li, Na, K) Binary Systems
The first study of the phase equilibria in the LiF−CrF3, NaF−CrF3 and KF−CrF3 binary systems was performed by de Kozak in 1969 [15,21]. Based on the rather complete experimental dataset obtained by differential thermal analysis (DTA) measurements, sketches of the phase diagrams were established [15]. Thermodynamic modelling assessments of these systems based on these data have been performed by Yin et al. [28,29], using an associate model to describe the liquid phase. In this work, a re-assessment using the modified quasi-chemical formalism is proposed, compatible with the thermodynamic database developed for nuclear salt systems by the JRC [3].
3. Thermodynamic Modelling
In this study, thermodynamic models were built using the CALPHAD (Calculation of Phase Diagrams) method [32,33] and the FactSage software [34].
3.1. Gibbs Energies of Pure Compounds
The Gibbs energies of pure compounds is expressed by
where is the standard enthalpy of formation and is the standard entropy of the pure compound at a standard pressure and reference temperature of 298.15 K. is the heat capacity expressed by
In this work, in the absence of thermodynamic data in the literature for intermediate chromium salt compounds, the Neumann–Kopp estimation technique was used [35] based on the heat capacities of the end-member compounds AF (A = Li, Na, K) and CrF3. The thermodynamic functions for solid alkali fluorides (LiF, NaF, KF) were taken from the JRC database [3] and for the chromium fluorides from the IVTAN tables/SGTE database [26,27] as CrF2, CrF3 and Cr2F5 were not yet included in the JRC databank of relevant molten salt materials for nuclear applications (Table 2).
3.2. Solid Solutions
Three solid solutions are presented in this work for the CrF2−CrF3 system which were modelled based on the data collected by Sturm [23]. A regular solution model using a polynomial description of the Kohler–Toop interpolation was used to describe the solid solution around the Cr2F5 composition, with CrF2 and Cr2F5 as the end-member compositions. A two-sublattice polynomial model was used to describe the two solid solutions around the end-member compositions quasi-CrF2 and quasi-CrF3, respectively. In this case, the considered cationic species on the first sublattice are Cr2+ and Cr3+, and the anionic species on the second sublattice is F−, meaning the end-member compositions correspond to the CrF2 and CrF3 stoichiometry, respectively. The Gibbs energy function of the solid solution is described by the equation:
where and are the molar Gibbs energies of the pure end-members, and are their site molar fraction, R is the universal gas constant and is the excess Gibbs energy. The excess Gibbs energy can be expressed by
where is an interaction coefficient which can depend on temperature T as described by the equation:
and where and are the equivalent site fractions of the end-member species for the regular solution, defined by
is the coordination number of the A (and B, respectively) species in the end-member. Here, is set as equal to 1 (default value), meaning that the equivalent site fractions are equal to the molar site fractions.
For the two-sublattice polynomial model, the equivalent site fractions and are described as charge equivalent site fractions:
The optimized excess energy parameters, obtained by manual iteration, are given by the following equations:
3.3. Liquid Solution
To describe the liquid solution, the modified quasi-chemical model in the quadruplet approximation was used [36,37]. This quadruplet is defined by two anions and two cations symmetrically dispatched around an axis. Two interactions are considered, the first nearest neighbour (FNN) interaction, which describes the interaction cation–anion; and the second nearest neighbour (SNN) interaction, which describes the interactions between the two closest ions in the same sublattice. This model is particularly well adapted for the description of ionic liquids as it allows one to choose the composition of maximum short-range ordering in a binary system by varying the ratio between the cation–cation coordination numbers and . Short-range ordering is defined by the quadruplet approximation and includes the SNN interactions between each cation and each anion. In a simple representation, where A and B are two cations and F is the anion (fluorine anion, F− in this work), the following reaction is obtained:
where is the parameter of the Gibbs energy change associated with the SNN exchange reaction described as
where and are possibly affected by temperature, but independently of composition, they are optimized to obtain the best possible fit with the experimental data of a given system. The dependence on composition is given by the term defined as
where , and represent the different cation–cation pair fractions. To maintain electro-neutrality in the system, the anion–anion coordination should be determined. The following equation is applied after the selection of cation–cation coordination numbers:
with representing the charges of the different ions and is the anion–anion coordination number, directly dependent of the choice of the cation–cation coordination numbers and . These choices are based on the optimization of the systems in order to obtain the maximum short-range ordering and highest excess Gibbs energy at a composition usually close to the lowest eutectic in the phase diagram.. The coordination numbers selected in this work are listed in Table 3.
The optimized excess Gibbs energy of the liquid solutions for the LiF−CrF3, NaF−CrF3 and KF−CrF3 systems are given by the following equations:
4. Results and Discussion
4.1. CrF2–CrF3
The calculated phase diagram for the CrF2−CrF3 system is shown in Figure 1 where it is compared to the experimental data of Sturm [23]. The general agreement between the calculated and experimental data is good. The CrF2-rich solid solution extends up to X(CrF3) = 0.054. The range of stability of the Cr2F5 solid solution extends from X(CrF3) = 0.382 to X(CrF3) = 0.5. Finally, the CrF3-rich solid solution is stable down to X(CrF3) = 0.88. The calculated invariant equilibria are listed in Table 4 and compared to the data provided by Sturm [23].
4.2. AF–CrF3 (A = Li, Na, K)
The calculated phase diagrams for the LiF−CrF3, NaF−CrF3 and KF−CrF3 systems are shown in Figure 2, Figure 3 and Figure 4, respectively.
4.2.1. LiF−CrF3
The LiF−CrF3 system shows, according to the data of de Kozak, two eutectic equilibria: the first at a composition of X(CrF3) = 0.15 and a temperature of 1003 K; and the second at a composition of X(CrF3) = 0.35 and a temperature of 1059 K [15]. The calculated phase diagram (Figure 2) shows good agreement, with a first eutectic point calculated at X(CrF3) = 0.136 and at a temperature of 1008 K, and a second at X(CrF3) = 0.363 with a temperature of 1062 K (Table 5). The last invariant equilibrium represents congruent melting, at a temperature of 1129 K at the stoichiometric composition (Li6CrF3) or X(CrF3) = 0.25. The calculated equilibrium is lower in temperature (1111 K), which is still considered a reasonable deviation considering the agreement with the other liquidus points around this composition.
4.2.2. NaF−CrF3
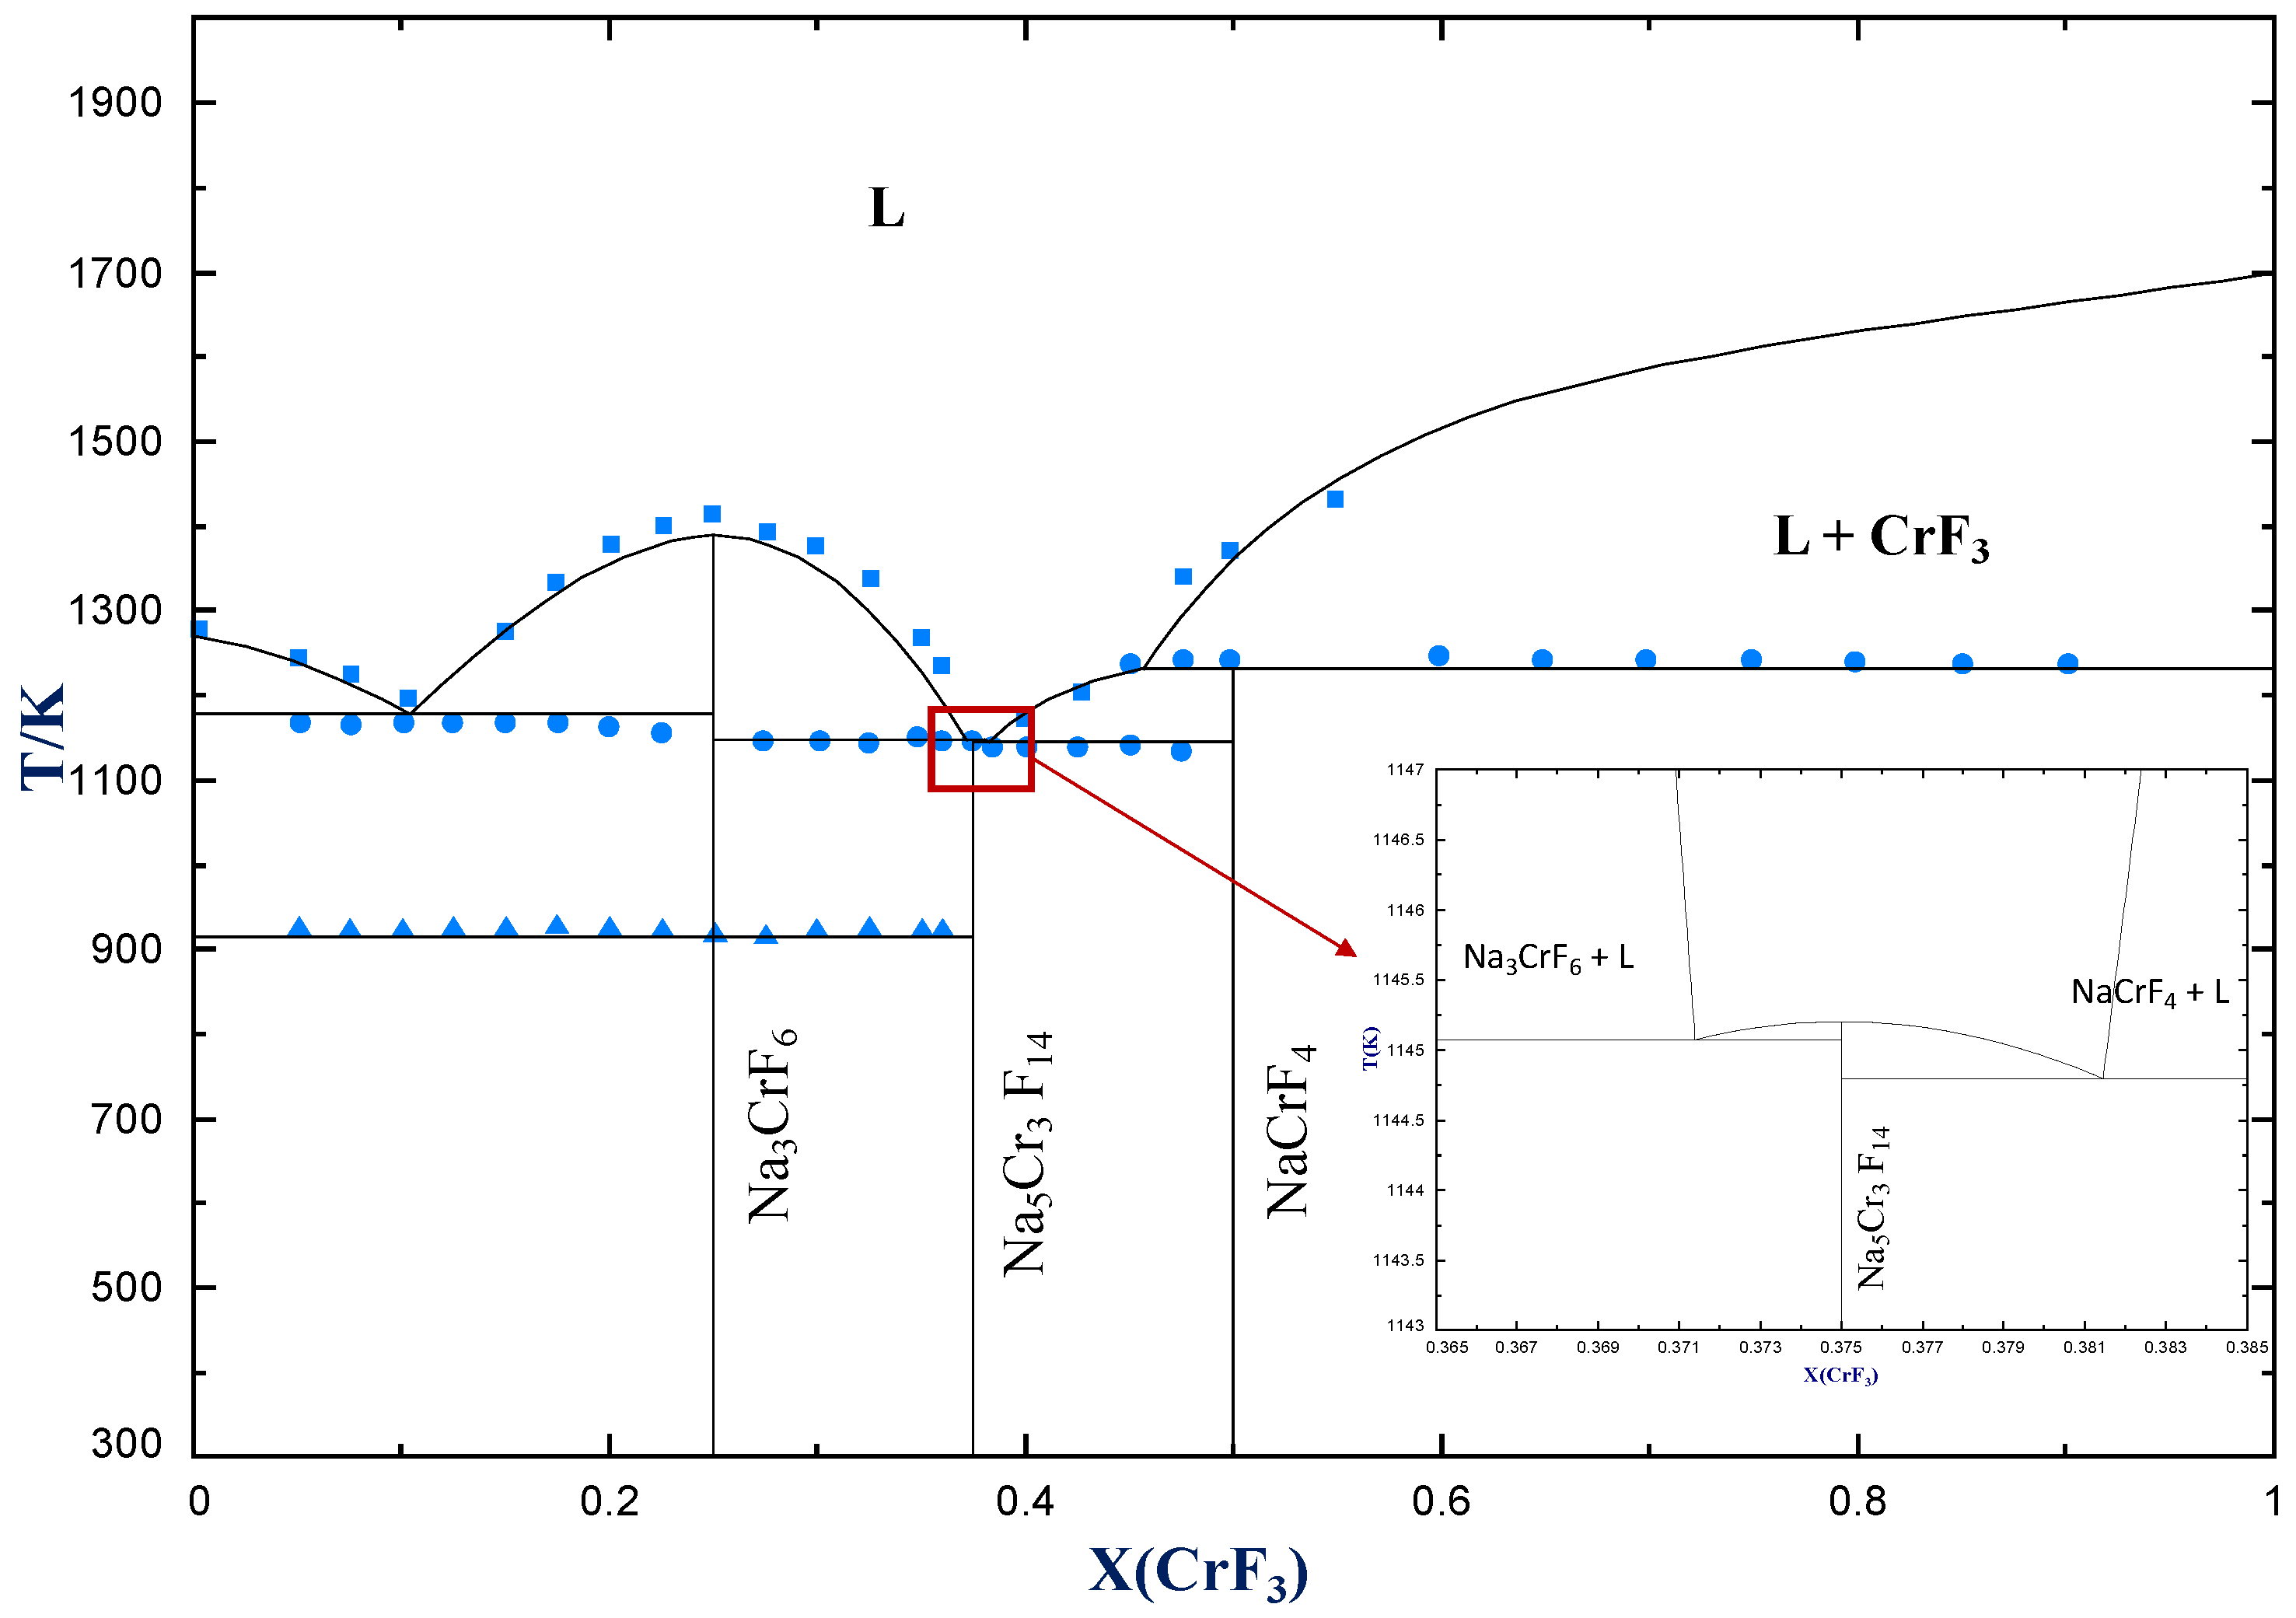
Experimentally, an eutectic equilibrium was identified at a composition of X(CrF3) = 0.125 and a temperature of 1166 K [15]. The calculated phase diagram shows an eutectic point at X(CrF3) = 0.106 and a temperature of 1175 K (Table 6). A gap is observed for the composition of this eutectic and the temperature in this model. This difference is within the uncertainties of the experimental work as is evident from the different values for the melting temperature of pure NaF (1278 K according to de Kozak and 1266 K in this work based on the most recent data). Congruent melting has been measured at a temperature of 1413 K for the Na3CrF6 stoichiometric compound [15]. In this study, the optimized temperature is lower (1385 K), which results from the fact that the model was designed in order to obtain the best balance between the different invariant points presented subsequently. An eutectic equilibrium is computed at X(CrF3) = 0.371 and a temperature of 1145 K, in good agreement with de Kozak’s value at X(CrF3) = 0.375 and 1145 K. An experimental validation, however, needs to be performed for a better understanding of this area. In fact, de Kozak proposed a peritectic equilibrium at X(CrF3) = 0.375 and a close eutectic point at X(CrF3) = 0.384. In the assessment proposed by Yin et al. [29], two eutectic points were calculated at X(CrF3) = 0.367 (1142 K) and X(CrF3) = 0.383 (1141 K), respectively. In this model, comparable equilibria were calculated: the compositions and temperatures are described in Table 3 and show a good agreement with the values by Yin [29]. A peritectic point is identified at the stoichiometric composition NaCrF4 and at a temperature of 1232 K [15].
4.2.3. KF−CrF3
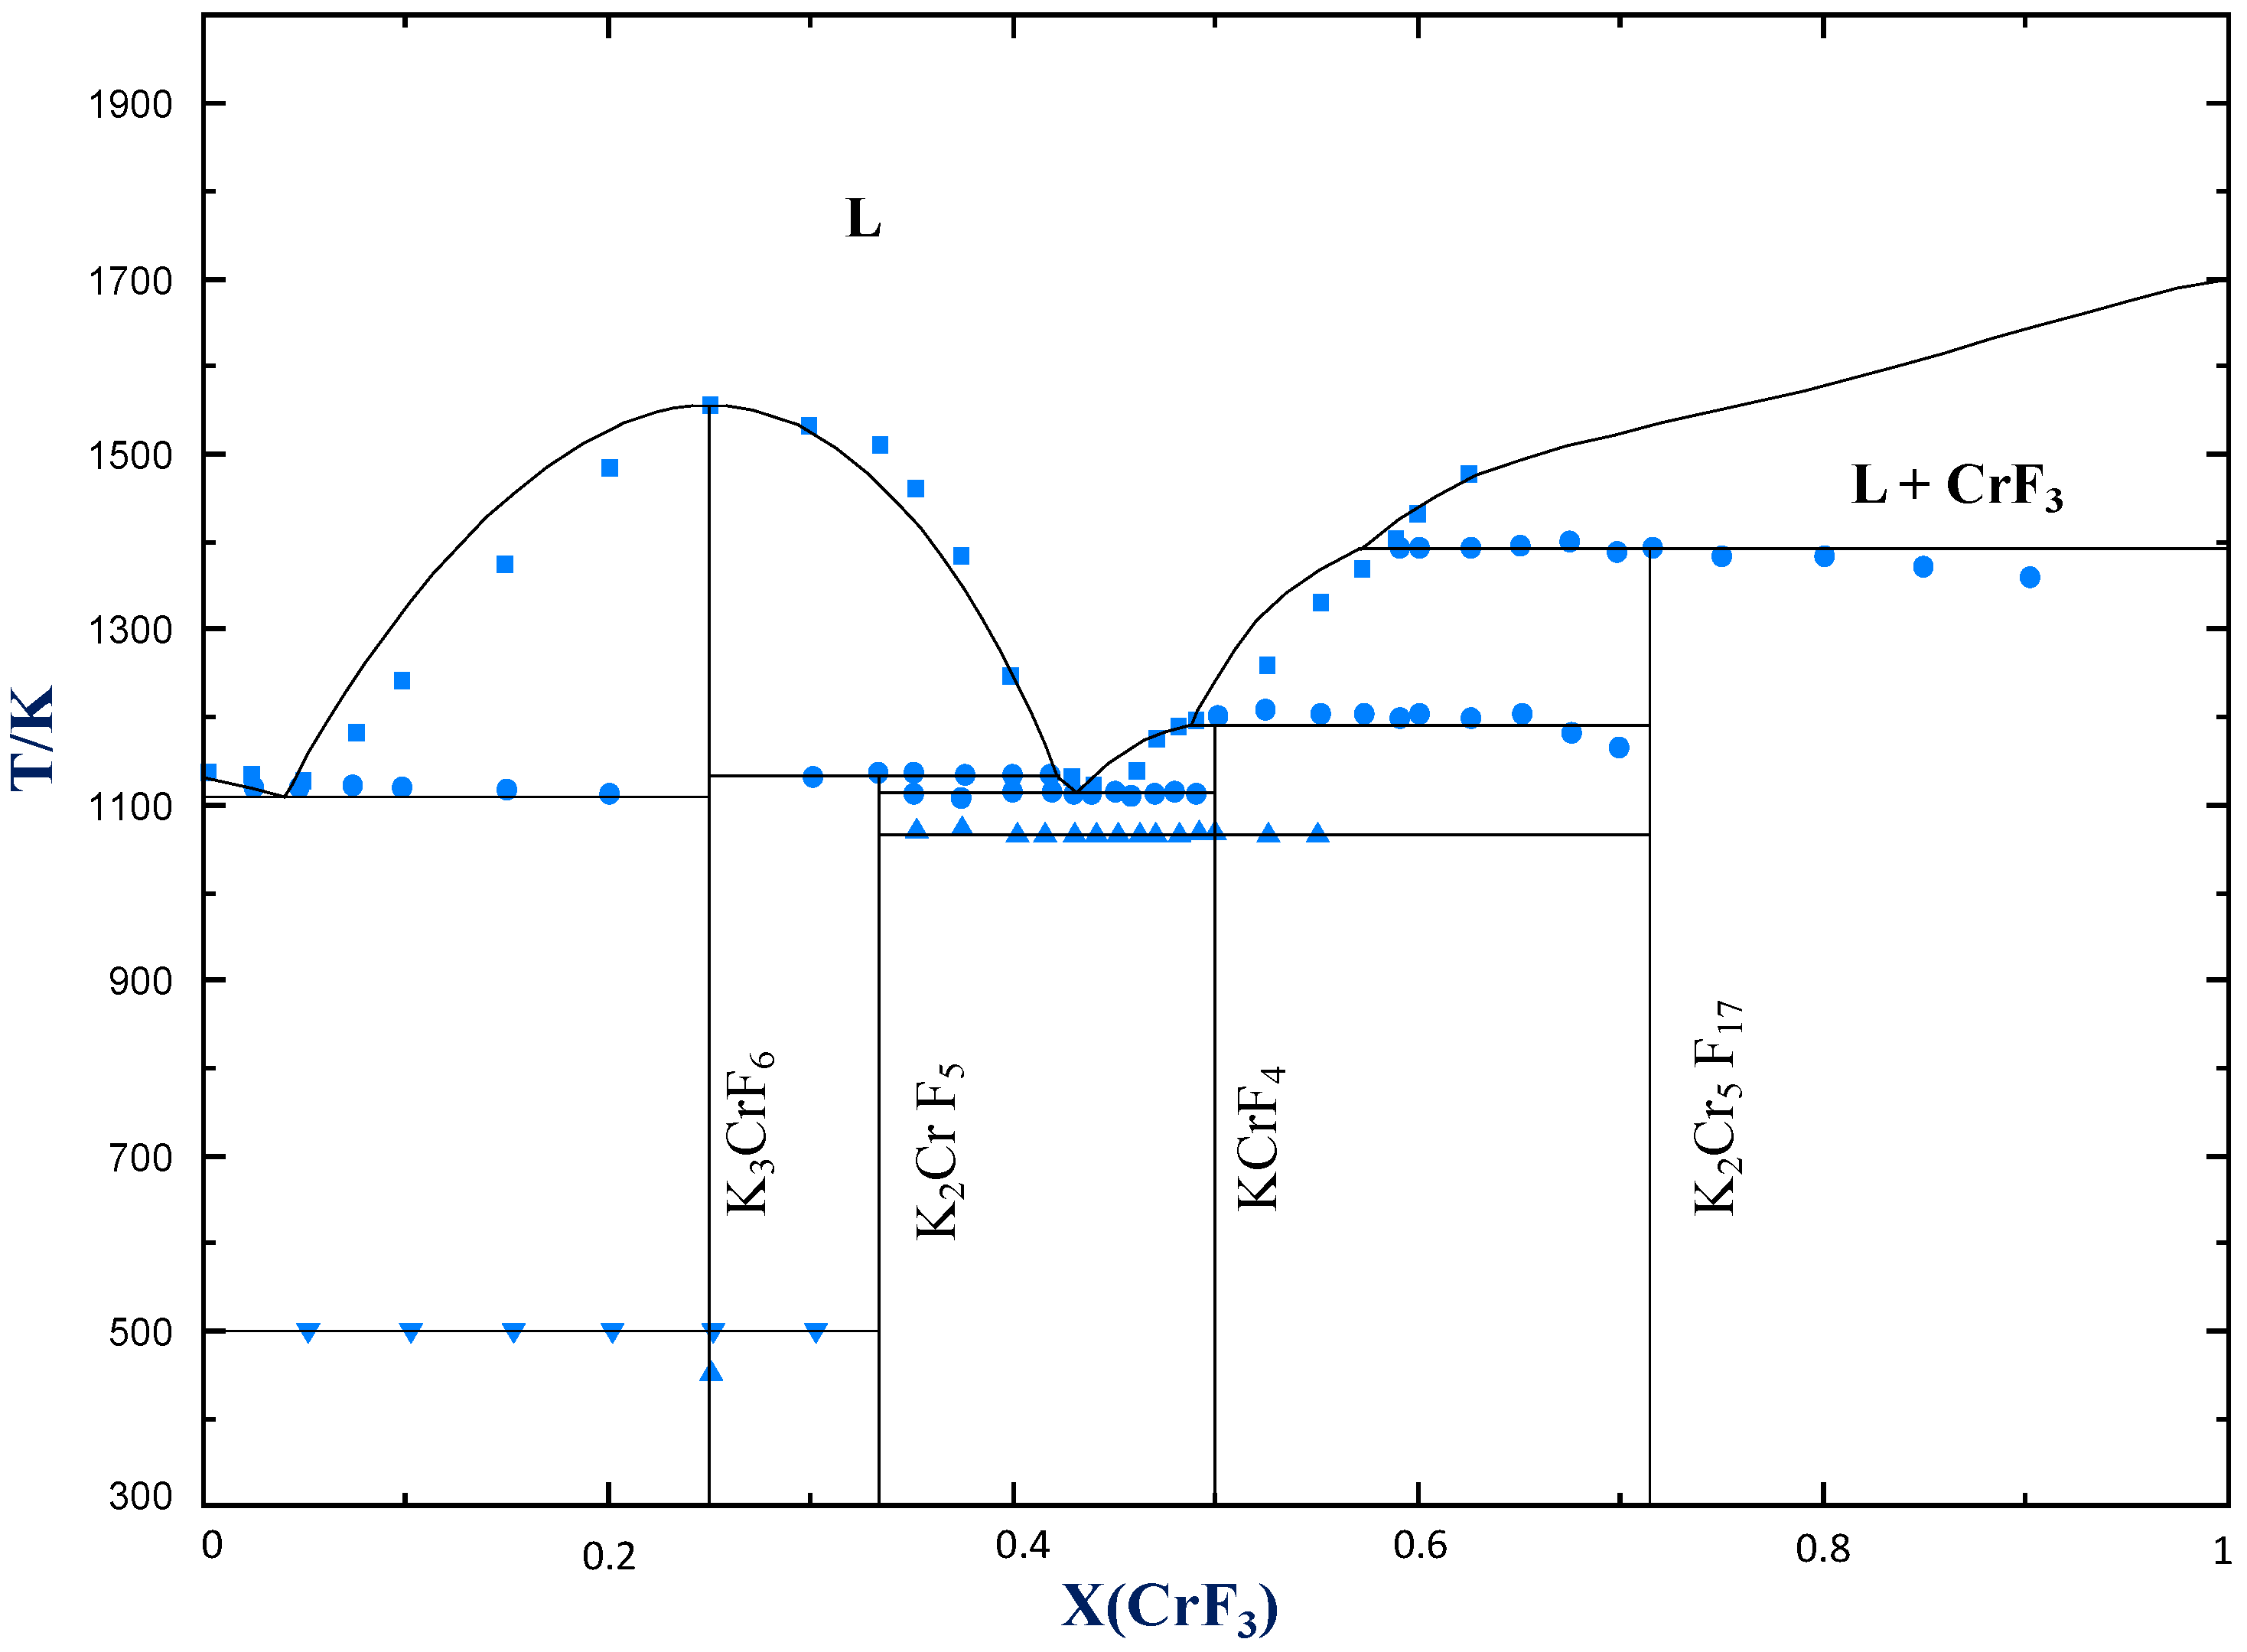
For the KF−CrF3 system, the situation is similar to the two previous cases. A first eutectic equilibrium is computed at a composition of X(CrF3) = 0.041 and a temperature of 1108 K, which is in good agreement with the experimental value of X(CrF3) = 0.048 (1115 K) [15] (Table 7). A congruent melting point is calculated at 1553 K for the K3CrF6 intermediate compound, which is in very good agreement with the data of de Kozak (1553 K). A peritectic transition is identified at X(CrF3) = 0.333 and a temperature of 1130 K, with a good agreement with the experimental data, i.e., X(CrF3) = 0.333 (1133 K). The second eutectic is modelled at a composition of X(CrF3) = 0.432 and a temperature of 1112 K, with a relatively close agreement with the experimental data (X(CrF3) = 0.45 (1112 K)). Then, a peritectic equilibrium is calculated at X(CrF3) = 0.50 (1191 K) and another peritectic transition at X(CrF3) = 0.714 (1390 K), in good agreement with the data provided by de Kozak, X(CrF3) = 0.50 (1200 K) and X(CrF3) = 0.714 (1390 K), respectively.
4.3. Excess Properties
The mixing enthalpy of the liquid solution is a very useful quantity to assess the reliability and consistency of the models developed for complex systems such as AF−CrF3. The expectation is that the mixing enthalpy becomes more negative when the ionic radius of the alkali fluoride increases along the LiF, NaF and KF series [38]. Unfortunately, no experimental data were reported for these system to compare with the calculated results obtained in this work. The only comparison available for these systems is that optimized by Yin et al. [28,29] using their associate model. Their calculated data for the mixing enthalpy were slightly higher at 1500 K than the results provided in this work, but confirm the same trend along the series of alkali ions.
Mixing enthalpies calculated in this work show minima around the compositions X(CrF3) = 0.25 for LiF−CrF3 and X(CrF3) = 0.40 for NaF−CrF3 at respective energy values (LiF−CrF3) = −14.9 kJ · mol−1 and (NaF−CrF3) = −27.5 kJ · mol−1 (Figure 5a). The minimum is reached around the stoichiometric composition X(CrF3) = 0.50 for the KF−CrF3 system and an energy value of (KF−CrF3) = −35.4 kJ · mol−1. The location of the extrema (corresponding to maximum short-range ordering in the liquid solution) is directly related to the choice of cation–cation coordination numbers. The mixing entropy of the LiF−CrF3 system shows a regular profile, while that calculated in the NaF and KF-based systems both show an inflection around the X(CrF3) = 0.30–0.35 and 0.50–0.55 compositions, respectively (Figure 5b). This evolution indicates a stronger short-range ordering that is favoured in certain concentration regions. The same observation was made for the LiF−ThF4 system by Capelli et al. [39] and related to the local structure properties of the melt.
Following a similar interpretation, a high concentration of free F− ions is expected in the NaF (and KF, respectively-rich regions), and a high concentration of bridged F− ions is expected in the CrF3−rich region. The bridging of F− ions and the formation of clusters/chains of Cr cations leads to the ordering of the system, and thus to a decrease in entropy. Such a network formation has been observed in several fluoride systems such as AF−ThF4 and AF−UF4 [39,40]. Considering the three-dimensional polyhedral form of the CrF3 compound, comparable to ThF4 and UF4, it is likely to occur in these liquids as well.
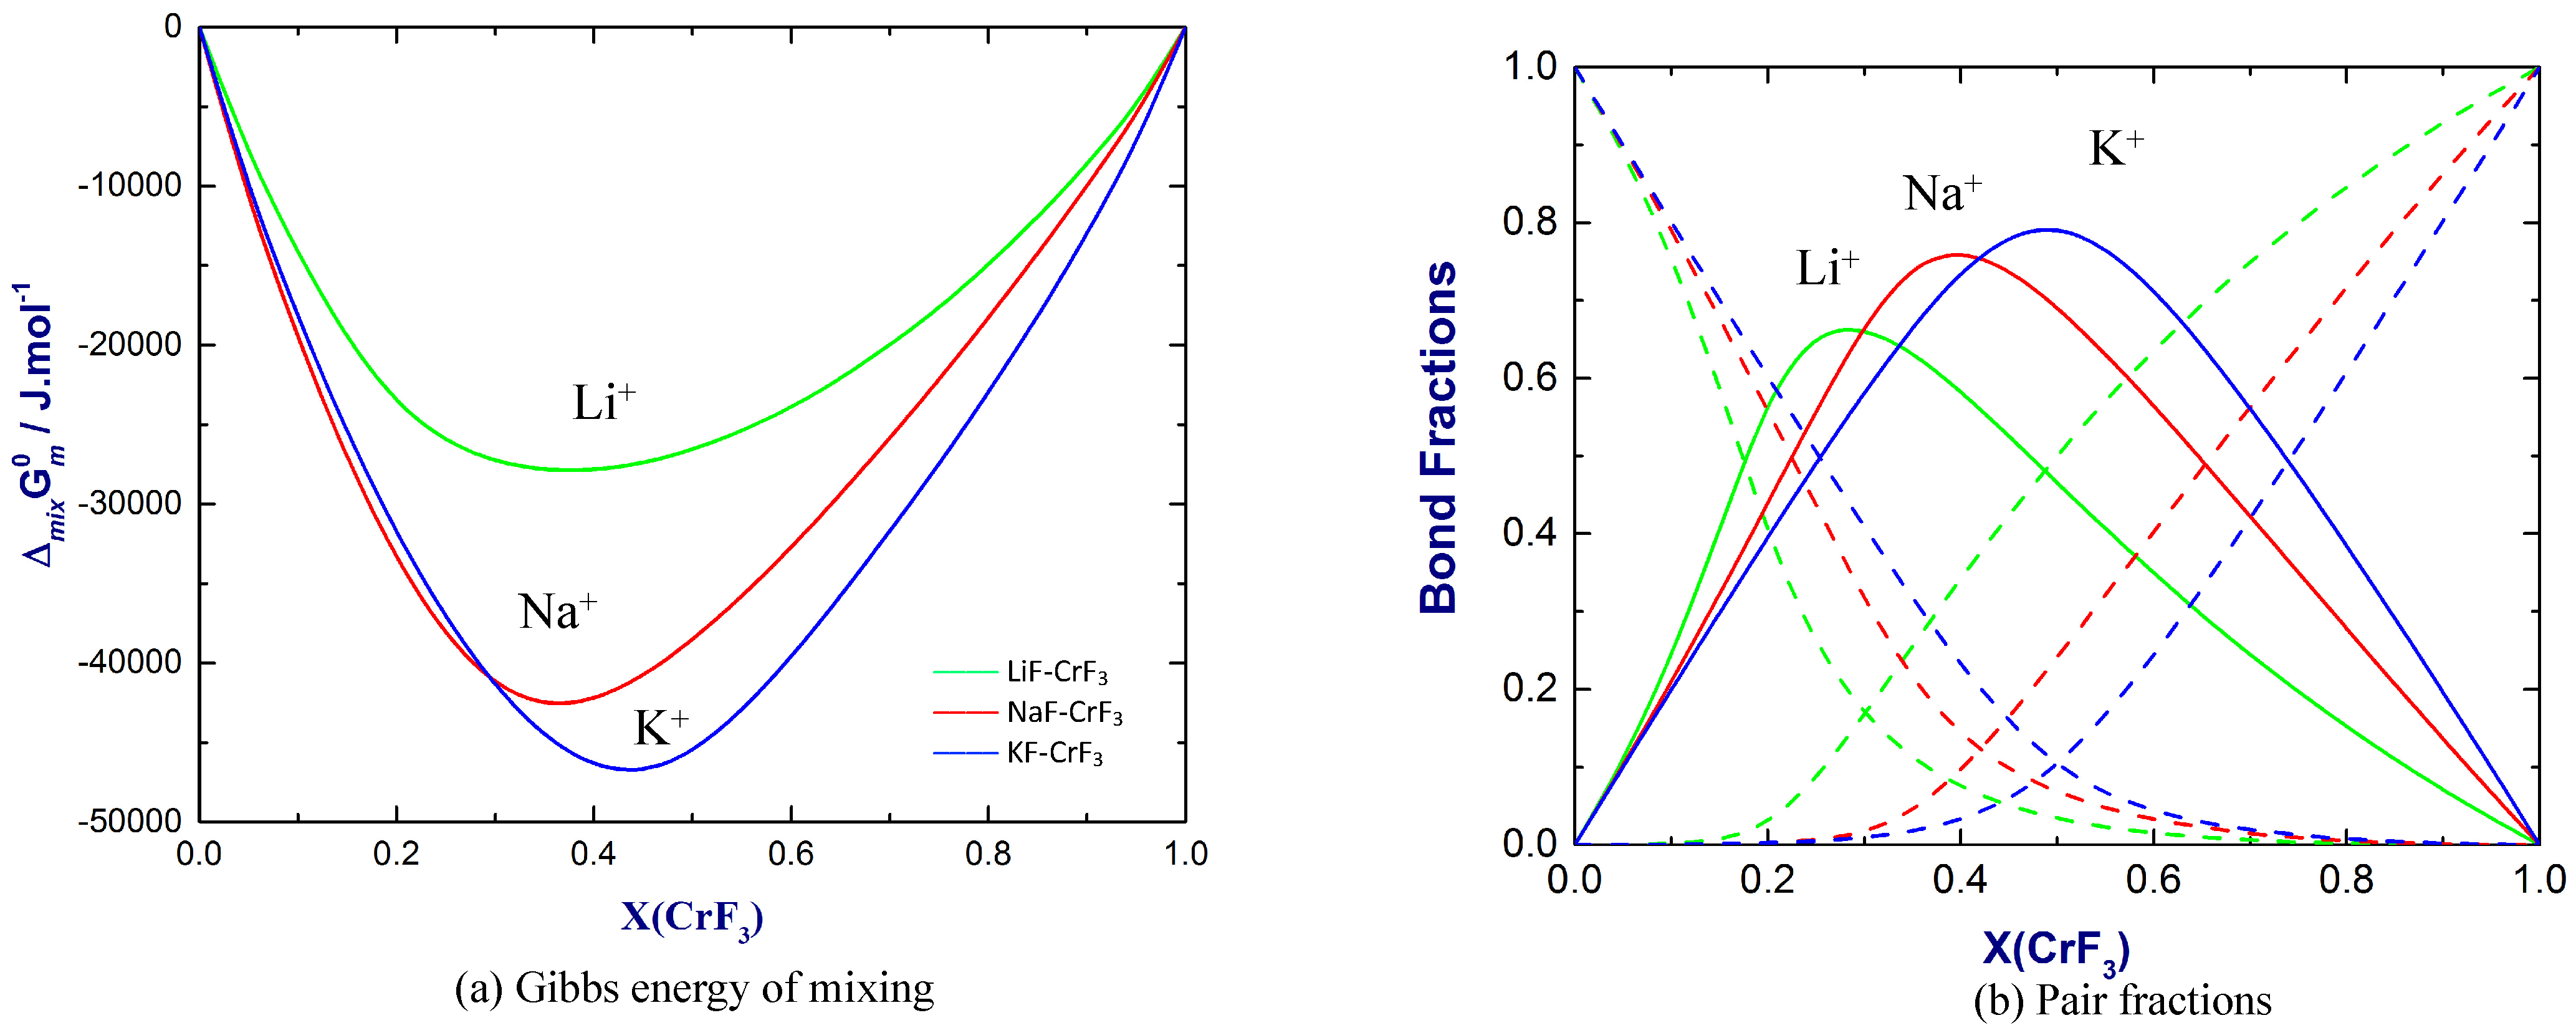
Finally, Figure 6a,b show the calculated Gibbs energies of mixing and pair fractions, respectively, using the optimized models. The respective locations of the A–Cr–F–F pair fractions maxima (X(CrF3) = 0.25, 0.40 and 0.5 for the LiF, NaF and KF systems), are again directly correlated to the choice of the coordination numbers. The maxima, moreover, show a round shape with the corresponding fractions varying between 0.6 and 0.8, indicating a moderately basic system, as was also the case for the AF−NiF2 systems [41]. A strongly basic system with quasi-perfect second-nearest neighbour ordering leads to a SNN fraction close to one at the composition of maximum SRO, and to a sharp minimum in the calculated Gibbs energy of mixing [41].
5. Conclusions
In this work, new thermodynamic assessments of the AF−CrF3 (A = Li, Na, K) phase diagrams were presented using the CALPHAD method in combination with the modified quasi-chemical model in the quadruplet approximation. The models were based on the only experimental data reported in the literature by de Kozak [15] and show good agreement. Based on the same method, the CrF2−CrF3 binary system was modelled based on the experimental data of Sturm [23]. Knowledge of the phase diagrams of all four systems helps improving the understanding of the role of products (CrF2,CrF3), which can be formed as a result of the corrosion of the Hastelloy used as structural material in molten salt reactors, on the properties of the liquid fuel salt. The AF−CrF3 systems are characterized by strongly negative Gibbs energies of mixing, decreasing from Li to K, and the calculated bond fractions suggest a moderately basic behaviour.
Author Contributions
Conceptualization, T.D. and A.L.S.; Funding acquisition, A.L.S.; Investigation, T.D.; Methodology, T.D.; Project administration, A.L.S.; Supervision, R.J.M.K. and A.L.S.; Validation, R.J.M.K. and A.L.S.; Writing—original draft, T.D.; Writing—review & editing, R.J.M.K. and A.L.S. All authors have read and agreed to the published version of the manuscript.
Funding
This research was funded by Nuclear Research and Consultancy Group (NRG, Petten, The Netherlands).
Data Availability Statement
The data presented in this study are available on request from the corresponding author.
Acknowledgments
T. Dumaire gratefully acknowledges financial support from the Nuclear Research and Consultancy Group (NRG, Petten, The Netherlands) and would like to thank Jaén Ocádiz-Flores for helpful discussions on the modelling methods.
Conflicts of Interest
The authors declare no conflict of interest.
References
- Kelly, J.E. Generation IV International Forum: A decade of progress through international cooperation. Prog. Nucl. Energy 2014, 77, 240–246. [Google Scholar] [CrossRef]
- Tosolin, A.; Souček, P.; Beneš, O.; Vigier, J.-F.; Luzzi, L.; Konings, R.J.M. Synthesis of plutonium trifluoride by hydro-fluorination and novel thermodynamic data for the PuF3–LiF system. J. Nucl. Mater. 2018, 508, 319–328. [Google Scholar] [CrossRef]
- Beneš, O.; Konings, R.J.M. Comprehensive Nuclear Materials; Konings, R.J.M., Ed.; Elsevier: Oxford, UK, 2012; Chapter 3.13; pp. 359–389. [Google Scholar]
- Liu, J.; Huang, H.; Liu, R.; Zhu, Z.; Lei, Q.; Liu, A.; Li, Y. Corrosion of Cr in Molten Salts with different Fluoroacidity in the presence of CrF3. Corros. Sci. 2020, 169, 108636. [Google Scholar] [CrossRef]
- Bettis, E.S.; Cottrell, W.B.; Mann, E.R.; Meem, J.L.; Whitman, G.D. The Aircraft Reactor Experiment—Operation. Nucl. Sci. Eng. 1957, 2, 841–853. [Google Scholar] [CrossRef]
- Delpech, S.; Cabet, C.; Slim, C.; Picard, G.S. Molten Fluorides for Nuclear Applications. Mater. Today 2010, 13, 34–41. [Google Scholar] [CrossRef]
- Olson, L.C.; Ambrosek, J.W.; Sridharan, K.; Anderson, M.H.; Allen, T.R. Materials Corrosion in Molten LiF–NaF–KF salt. J. Fluor. Chem. 2009, 130, 67–73. [Google Scholar] [CrossRef]
- Sabharwall, P.; Ebner, M.; Sohal, M.; Sharpe, P.; Anderson, M.H.; Allen, T.R. Molten Salts for High Temperature Reactors: University of Wisconsin Molten Salt Corrosion and Flow Loop Experiments—Issues Identified and Path Forward; (Idaho National Laboratory (INL/EXT-10-18090)); Idaho National Laboratory: Idaho Falls, ID, USA, 2010. [Google Scholar]
- Tyagi, A.K.; Köhler, J. Preparation, Magnetic Properties and Structure of β-Li3CrF6. Mater. Res. Bull. 2000, 35, 135–141. [Google Scholar] [CrossRef]
- Massa, W.; Rüdorff, W. α-Li3MeF6 and β-Li3MeF6 compounds. Z. Naturforsch. B 1971, 26, 1216–1218. [Google Scholar] [CrossRef]
- Knoke, G. Kristallstrukturbestimmungen an den Verbindungen NaCrF4, CsCrF4 und Cs4Cr5F19 Sowie Weitere Untersuchungen an Ternären Chrom(III)fluoriden. Doctoral Dissertation, Marburg, Germany, 1977. [Google Scholar]
- García-Fernández, P.; Moreno, M.; Aramburu, J.A. Electrostatic Control of Orbital Ordering in Noncubic Crystals. J. Phys. Chem. C 2014, 118, 7554–7561. [Google Scholar] [CrossRef]
- Brunton, G. The Crystal structure of Na3CrF6. Mater. Res. Bull. 1969, 4, 621–626. [Google Scholar] [CrossRef]
- Le Bail, A.; Mercier, A.-M. Distorted chiolite crystal structures of α-Na5M3F14 (M = Cr, Fe, Ga) studied by X-ray powder diffraction. Powd. Diff. 2003, 18, 128–134. [Google Scholar] [CrossRef]
- De Kozak, A. Les systèmes CrF3–MF(M = Li, Na ou K). C. R. Acad. Sci. Paris 1969, C, 416–418. [Google Scholar]
- Lacorre, P.; Leblanc, M.; Pannetier, J.; Ferey, G. Ordered magnetic frustration: XV. Re-examination of the magnetic structure of α–KCrF4. J. Magn. Magn. Mater. 1991, 94, 337–341. [Google Scholar] [CrossRef]
- Manaka, H.; Etoh, T.; Honda, Y.; Iwashita, N.; Ogata, K.; Terada, N.; Hisamatsu, T.; Ito, M.; Narumi, Y.; Kondo, A.; et al. Effects of Geometrical Spin Frustration on Triangular Spin Tubes Formed in CsCrF4 and α–KCrF4. J. Phys. Soc. Jpn. 2011, 80, 084714. [Google Scholar] [CrossRef]
- Sassoye, C.; de Kozak, A. Crystal Structure and Thermal Behaviour of K2[CrF5·H2O]. Z. Anorg. Allg. Chem. 2006, 632, 445–448. [Google Scholar] [CrossRef]
- de Kozak, A. Thèse de Doctorat ès Sciences, Univ. Paris VI, Paris, France, 1970. Rev. Chim. Min. 1971, 8, 301–337. [Google Scholar]
- Baran, M.; Szymczak, H.; Wardzyński, W.; Wanklyn, B.M. EPR and optical absorption spectra of K2Cr5F17 monocrystals. Phys. Status Solidi B 1978, 90, K59–K61. [Google Scholar] [CrossRef]
- De Kozak, A.; Samouël, M. Le Système ternaire NaF-ZnF2–CrF3. I. Étude radiocristallographique. Triangulation. J. Less Common Met. 1975, 40, 185–193. [Google Scholar] [CrossRef]
- Boo, W.O.J.; Stout, J.W. Heat capacity and entropy of CuF2 and CrF2 from 10 to 300 K. Anomalies associated with magnetic ordering and evaluation of magnetic contributions to the heat capacity. J. Chem. Phys. 1979, 71, 9–16. [Google Scholar] [CrossRef]
- Sturm, B.J. Phase equilibria in the system chromium (II) fluoride-chromium (III) fluoride. Inorg. Chem. 1962, 1, 665–672. [Google Scholar] [CrossRef]
- Miranday, J.P.; Ferey, G.; Jacoboni, C.; Dance, J.M.; Tressaud, A.; De Pape, R. Croissance cristalline, polymorphisme et propriétés magnétiques de Na5Cr3F14. Rev. Chim. Miner. 1975, 12, 187–192. [Google Scholar]
- Hansen, W.N.; Griffel, M. Heat Capacities of CrF3 and CrCl3 from 15 to 300 °K. J. Chem. Phys. 1958, 28, 902–907. [Google Scholar] [CrossRef]
- Iorish, V.S.; Aristova, N.M.; Bergman, G.A.; Gorohov, L.N.; Gusarov, A.V.; Yezhov, Y.S.; Kulikov, A.N.; Osina, E.L.; Shenyavskaya, E.A.; Handamirova, N.E.; et al. Thermodynamic Properties of Substances; Publishing House Nauka: Moscow, Russia, 1978. [Google Scholar]
- Ansara, I.; Sundman, B. The Scientific Group Thermodata Europe (SGTE). In Computer Handling Determination of Data; Elsevier Science Pub. Co.: Amsterdam, The Netherlands, 1987; pp. 154–158. [Google Scholar]
- Yin, H.; Wang, K.; Xie, L.; Han, H.; Wang, W. Thermodynamic Modeling of KF–CrF3 Binary System. Chem. Res. Chin. Univ. 2015, 31, 461–465. [Google Scholar] [CrossRef]
- Yin, H.; Zhang, P.; An, X.; Cheng, J.; Li, X.; Wu, S.; Wu, X.; Liu, W.; Xie, L. Thermodynamic modeling of LiF-NaF-KF-CrF3 system. J. Fluor. Chem. 2018, 209, 6–13. [Google Scholar] [CrossRef]
- Chase, M.W., Jr.; Curnutt, J.L.; Downey, J.R., Jr.; McDonald, R.A.; Syverud, A.N.; Valenzuela, E.A. JANAF Thermochemical Tables. J. Phys. Chem. Ref. Data 1998, 11, 695–940. [Google Scholar] [CrossRef] [Green Version]
- Tressaud, A.; Dance, J.M.; Ravez, J.; Portier, J.; Hagenmuller, P.; Goodenough, J.B. Crystal chemistry and magnetic properties of CrIIBIIIF5 compounds. Mater. Res. Bull. 1973, 8, 1467–1477. [Google Scholar] [CrossRef]
- Kattner, U.R.; Seifert, H.J.; Lukas, H.L. Integrated Computational Materials Engineering, CALPHAD. Calphad 2010, 34, 385–386. [Google Scholar] [CrossRef]
- Chang, Y.A.; Chen, S.; Zhang, F.; Yan, X.; Xie, F.; Schmid-Fetzer, R.; Alan Oates, W. Phase diagram calculation: Past, present and future. Prog. Mater. Sci. 2004, 49, 313–345. [Google Scholar] [CrossRef]
- Bale, C.W.; Chartrand, P.; Degterov, S.A.; Eriksson, G.; Hack, K.; Mahfoud, R.B.; Melançon, J.; Pelton, A.D.; Petersen, S. FactSage thermochemical software and databases. Calphad 2002, 26, 189–228. [Google Scholar] [CrossRef]
- Leitner, J.; Vonka, P.; Sedmidubsky, D.; Svoboda, P. Application of Neumann–Kopp rule for the estimation of heat capacity of mixed oxides. Thermochim. Acta 2010, 497, 7–13. [Google Scholar] [CrossRef]
- Pelton, A.D.; Degterov, S.A.; Eriksson, G.; Robelin, C.; Dessureault, Y. The modified quasichemical model I–binary solutions. Metall. Mater. Trans. B 2000, 31, 651–659. [Google Scholar] [CrossRef]
- Beneš, O.; Beilmann, M.; Konings, R.J.M. Thermodynamic assessment of the LiF–NaF–ThF4–UF4 system. J. Nucl. Mater. 2010, 405, 186–198. [Google Scholar] [CrossRef]
- Hong, K.C.; Kleppa, O.J. Thermochemistry of the Liquid Mixtures of the Alkaline Earth Fluorides with Alkali Fluorides. J. Chem. Thermodyn. 1978, 8, 31–36. [Google Scholar] [CrossRef]
- Capelli, E.; Beneš, O.; Beilmann, M.; Konings, R.J.M. Thermodynamic investigation of the LiF–ThF4 system. J. Chem. Thermodyn. 2013, 58, 110–116. [Google Scholar] [CrossRef]
- Ocadiz-Flores, J.; Gheribi, A.E.; Vlieland, J.; de Haas, D.; Dardenne, K.; Rothe, J.; Konings, R.J.M.; Smith, A.L. Examination of the short-range structure of molten salts: ThF4, UF4, and related alkali actinide fluoride systems. Phys. Chem. Chem. Phys. 2021, 23, 11091–11103. [Google Scholar] [CrossRef]
- Ocadiz-Flores, J.A.; Capelli, E.; Raison, P.E.; Konings, R.J.M.; Smith, A.L. Thermodynamic assessment of the LiF-NiF2, NaF-NiF2 and KF-NiF2 systems. J. Chem. Thermodyn. 2018, 121, 17–26. [Google Scholar] [CrossRef]
Figure 1.
Phase diagram of the CrF2−CrF3 system optimized in this work compared with the experimental data provided by Sturm [23].
Figure 1.
Phase diagram of the CrF2−CrF3 system optimized in this work compared with the experimental data provided by Sturm [23].

Figure 2.
Phase diagram of the LiF−CrF3 system optimized in this work and comparison with the experimental data provided by de Kozak [15]. Blue squares represent liquidus points and blue circles represent solidus points.
Figure 2.
Phase diagram of the LiF−CrF3 system optimized in this work and comparison with the experimental data provided by de Kozak [15]. Blue squares represent liquidus points and blue circles represent solidus points.

Figure 3.
Phase diagram of the NaF−CrF3 system optimized in this work and comparison with the data provided by de Kozak [15]. Blue squares represent liquidus points, blue circles represent solidus points and blue triangles represent phase transition points. The area 0.365 < X(CrF3) < 0.385 is zoomed in upon in the right window.

Figure 4.
Phase diagram of the KF−CrF3 system optimized in this work and comparison with the data provided by de Kozak [15]. Blue squares represent liquidus points, blue circles represent solidus points and blue triangles represent phase transition points.
Figure 4.
Phase diagram of the KF−CrF3 system optimized in this work and comparison with the data provided by de Kozak [15]. Blue squares represent liquidus points, blue circles represent solidus points and blue triangles represent phase transition points.

Figure 5.
(a) Mixing enthalpies and (b) mixing entropies of the LiF−CrF3, NaF−CrF3 and KF−CrF3 systems calculated from the present models at T = 1500 K. Mixing enthalpies represented with dashed lines (a) are the values presented by Yin at T = 1500 K [29].
Figure 5.
(a) Mixing enthalpies and (b) mixing entropies of the LiF−CrF3, NaF−CrF3 and KF−CrF3 systems calculated from the present models at T = 1500 K. Mixing enthalpies represented with dashed lines (a) are the values presented by Yin at T = 1500 K [29].

Figure 6.
(a) Gibbs energies of mixing and (b) bond fractions of the LiF−CrF3, NaF−CrF3 and KF−CrF3 systems calculated from the present thermodynamic models at T = 1500 K. Dashed lines starting at the left y axis: A–A–F–F, solid lines A–Cr–F–F, dashed lines starting at the right y axis: Cr–Cr–F–F pair fractions.

Table 1.
Lattice parameters of the intermediate compounds of the AF−CrF3 (A = Li, K) systems.
| Compound | Symmetry | Space Group | a(Å) | b(Å) | c(Å) | (°) | Ref. |
|---|---|---|---|---|---|---|---|
| α—Li3CrF6 | Monoclinic | C2/c | 14.4058(10) | 8.6006(4) | 10.0122(6) | 94.714(5) | [9,10] |
| β—Li3CrF6 | Orthorhombic | Pna21 | 9.5796(1) | 8.4071(1) | 4.9793(7) | 90 | [9,10] |
| α—NaCrF4 | Monoclinic | P2/c | 7.862(2) | 5.328(2) | 7.406(2) | 101.65(4) | [11] |
| β—NaCrF4 | Tetragonal | P4/mmm * | 15.330(5) | 5.330(5) | 6.279(3) | 90 | [12] |
| Na3CrF6 | Monoclinic | P2/c | 5.46(1) | 5.68(1) | 7.88(1) | 90 | [13] |
| α—Na5Cr3F14 | Monoclinic | P2/c | 10.5096(3) | 7.2253(2) | 7.2713(2) | 90.6753(7) | [14] |
| β—Na5Cr3F14 | Orthorhombic | C222 | 10.49(1) | 10.19(1) | 10.21(1) | 90 | [15] |
| γ—Na5Cr3F14 | Tetragonal | P422 | 7.32(2) | 7.32(2) | 10.24(2) | 90 | [15] |
| KCrF4 | Orthorhombic | Pnma | 15.761(10) | 7.448(5) | 18.361(11) | 90 | [16,17] |
| K2CrF5 | Orthorhombic | Pbcn | 7.334(2) | 12.804(4) | 20.151(5) | 90 | [18] |
| K2Cr5F17 | Orthorhombic | Pmmm * | 12.56(1) | 7.25(1) | 7.36(1) | 90 | [19,20] |
| γ—K3CrF6 | Cubic | 8.66(1) | 8.66(1) | 8.66(1) | 90 | [19] |
* These structural data have not been experimentally confirmed and were based on theoretical calculations.
Table 3.
Cation–cation coordination numbers of the liquid solution.
| A | B | |||
|---|---|---|---|---|
| Li+ | Li+ | 6 | 6 | 3 |
| Na+ | Na+ | 6 | 6 | 3 |
| K+ | K+ | 6 | 6 | 3 |
| Cr2+ | Cr3+ | 6 | 6 | 2.4 |
| Li+ | Cr3+ | 2 | 6 | 2 |
| Na+ | Cr3+ | 4 | 6 | 2.7 |
| K+ | Cr3+ | 6 | 6 | 3 |
Table 4.
Invariant equilibria in the CrF2−CrF3 system.
| Equilibrium | Invariant Reaction | This Study (calc.) | Sturm et al. [23] | ||
|---|---|---|---|---|---|
| X(CrF3) | T/K | X(CrF3) | T/K | ||
| Eutectic | CrF2(cr) + Cr2F5(cr) = L | 0.115 | 1104 | 0.14 * | 1103 ± 5 |
| Peritectic | Cr2F5(ss) = CrF3(cr) + L | 0.28 | 1271 | 0.29 | 1272 ± 5 |
* The composition data were extracted from the sketch of the phase diagram provided by Sturm [23].
Table 5.
Invariant equilibria in the LiF−CrF3 system.
| Equilibrium | Invariant Reaction | This Study (calc.) | De Kozak [15] | Yin et al. (calc.) [29] | |||
|---|---|---|---|---|---|---|---|
| X(CrF3) | T/K | X(CrF3) | T/K | X(CrF3) | T/K | ||
| Eutectic | LiF(cr) + Li3CrF6(cr) = L | 0.136 | 1008 | 0.15 | 1003 | 0.148 | 1003 |
| Congruent melting | Li3CrF6(cr) = L | 0.25 | 1111 | 0.25 | 1129 | 0.25 | 1125 |
| Eutectic | Li3CrF6(cr) + CrF3(cr) = L | 0.363 | 1062 | 0.35 | 1059 | 0.354 | 1058 |
Table 6.
Invariant equilibria in the NaF−CrF3 system.
| Equilibrium | Invariant Reaction | This Study (calc.) | De Kozak [15] | Yin et al. (calc.) [29] | |||
|---|---|---|---|---|---|---|---|
| X(CrF3) | T/K | X(CrF3) | T/K | X(CrF3) | T/K | ||
| Eutectic | NaF(cr) + Na3CrF6(cr) = L | 0.106 | 1175 | 0.123 | 1166 | 0.114 | 1162 |
| Congruent melting | Na3CrF6(cr) = L | 0.25 | 1385 | 0.25 | 1413 | 0.25 | 1416 |
| Eutectic | Na5Cr3F14(cr) + Na3CrF6 = L | 0.371 | 1145 | - | - | 0.367 | 1142 |
| Congruent melting | Na5Cr3F14(cr) = L | 0.375 | 1145 | - | - | 0.375 | 1142 |
| Eutectic | Na5Cr3F14(cr) + NaCrF4 = L | 0.381 | 1144 | - | - | 0.383 | 1141 |
| Peritectic | NaCrF4(cr) = L + CrF3(cr) | 0.5 | 1232 | 0.5 | 1234 | 0.5 | 1239 |
The reactions in italics have been calculated and have not been experimentally confirmed.
Table 7.
Invariant equilibria in the KF−CrF3 system.
| Equilibrium | Invariant Reaction | This Study (calc.) | De Kozak [15] | Yin et al. (calc.) [29] | |||
|---|---|---|---|---|---|---|---|
| X(CrF3) | T/K | X(CrF3) | T/K | X(CrF3) | T/K | ||
| Eutectic | KF(cr) + K3CrF6(cr) = L | 0.041 | 1108 | 0.048 | 1115 | 0.045 | 1113 |
| Congruent melting | K3CrF6(cr) = L | 0.25 | 1553 | 0.25 | 1553 | 0.25 | 1548 |
| Peritectic | K2CrF5(cr) = K3CrF6(cr) + L | 0.333 | 1130 | 0.333 | 1133 | 0.333 | 1135 |
| Eutectic | K2CrF5(cr) + KCrF4(cr) = L | 0.432 | 1112 | 0.45 | 1112 | 0.426 | 1107 |
| Peritectic | KCrF4(cr)= K2Cr5F17(cr) + L | 0.50 | 1191 | 0.50 | 1200 | 0.50 | 1195 |
| Peritectic | K2Cr5F17(cr) = L + CrF3(cr) | 0.714 | 1390 | 0.714 | 1390 | 0.714 | 1388 |
Publisher’s Note: MDPI stays neutral with regard to jurisdictional claims in published maps and institutional affiliations. |
© 2021 by the authors. Licensee MDPI, Basel, Switzerland. This article is an open access article distributed under the terms and conditions of the Creative Commons Attribution (CC BY) license (https://creativecommons.org/licenses/by/4.0/).
Share and Cite
MDPI and ACS Style
Dumaire, T.; Konings, R.J.M.; Smith, A.L. Thermodynamic Assessment of the AF–CrF3 (A = Li, Na, K) and CrF2–CrF3 Systems. Thermo 2021, 1, 205-219. https://0-doi-org.brum.beds.ac.uk/10.3390/thermo1020014
AMA Style
Dumaire T, Konings RJM, Smith AL. Thermodynamic Assessment of the AF–CrF3 (A = Li, Na, K) and CrF2–CrF3 Systems. Thermo. 2021; 1(2):205-219. https://0-doi-org.brum.beds.ac.uk/10.3390/thermo1020014
Chicago/Turabian StyleDumaire, Thomas, Rudy J. M. Konings, and Anna Louise Smith. 2021. "Thermodynamic Assessment of the AF–CrF3 (A = Li, Na, K) and CrF2–CrF3 Systems" Thermo 1, no. 2: 205-219. https://0-doi-org.brum.beds.ac.uk/10.3390/thermo1020014