
BDP1 Expression Correlates with Clinical Outcomes in Activated B-Cell Diffuse Large B-Cell Lymphoma


1
Biology Department, Pennsylvania State Beaver, Pennsylvania State University, Monaca, PA 15061, USA
2
Biology Department, St. John’s University, Queens, NY 11439, USA
*
Author to whom correspondence should be addressed.
BioMedInformatics 2022, 2(1), 169-183; https://0-doi-org.brum.beds.ac.uk/10.3390/biomedinformatics2010011
Submission received: 10 January 2022
/
Revised: 4 February 2022
/
Accepted: 8 February 2022
/
Published: 12 February 2022
(This article belongs to the Special Issue Current Trends and Developments in Bioinformatics and Statistical Research from a Biomedical Aspect)
Abstract
:The RNA polymerase III–specific TFIIIB complex is targeted by oncogenes and tumor suppressors, specifically the TFIIIB subunits BRF1, BRF2, and TBP. Currently, it is unclear if the TFIIIB subunit BDP1 is universally deregulated in human cancers. We performed a meta-analysis of patient data in the Oncomine database to analyze BDP1 alterations in human cancers. Herein, we report a possible role for BDP1 in non-Hodgkin’s lymphoma (NHL) for the first time. To the best of our knowledge, this is the first study to report a statistically significant decrease in BDP1 expression in patients with anaplastic lymphoma kinase–positive (ALK+) anaplastic large-cell lymphoma (ALCL) (p = 1.67 × 10⁻⁶) and Burkitt’s lymphoma (BL) (p = 1.54 × 10⁻¹¹). Analysis of the BDP1 promoter identified putative binding sites for MYC, BCL6, E2F4, and KLF4 transcription factors, which were previously demonstrated to be deregulated in lymphomas. MYC and BDP1 expression were inversely correlated in ALK+ ALCL, suggesting a possible mechanism for the significant and specific decrease in BDP1 expression. In activated B-cell (ABC) diffuse large B-cell lymphoma (DLBCL), decreased BDP1 expression correlated with clinical outcomes, including recurrence at 1 year (p = 0.021) and 3 years (p = 0.005). Mortality at 1 (p = 0.030) and 3 (p = 0.012) years correlated with decreased BDP1 expression in ABC DLBCL. Together, these data suggest that BDP1 alterations may be of clinical significance in specific NHL subtypes and warrant further investigation.
1. Introduction
Lymphoma is characterized by the deregulated growth of lymphocytes, including natural killer, B-, and T-cells. It is anticipated that, in 2021, 8830 individuals will be diagnosed with Hodgkin’s lymphoma (HL), and 81,560 individuals will be diagnosed with non-Hodgkin’s lymphoma (NHL) in the United States (US) [1]. Thus, NHL accounts for approximately 80% of all lymphoma diagnoses in the US. Subtypes of aggressive (fast-growing) NHL include: diffuse large B-cell lymphoma (DLBCL), anaplastic large-cell lymphoma (ALCL), Burkitt’s lymphoma (BL), lymphoblastic lymphoma (LBL), mantle cell lymphoma (MCL), and peripheral T-cell lymphoma (PTCL) [2].
Uncontrolled cell proliferation is a common characteristic of many human cancers, including aggressive forms of lymphoma [2]. The regulation of eukaryotic cell proliferation is controlled by three distinct RNA polymerases (pol) [3], including RNA pol III, which controls transcription of untranslated small RNA molecules involved in processing and translation. Together, these regulate the biosynthetic capacity of a cell. Accurate transcription by RNA pol III requires general and gene-specific transcription factors [3], including the RNA pol III–specific TFIIIB complex (3, 4). To date, two forms of TFIIIB have been well characterized in humans [4,5], with both forms of human TFIIIB requiring BDP1 [4,6]. In humans, multiple BDP1 isoforms have been identified [4]. The identified eukaryotic BDP1 isoforms contain a conserved SANT domain (Swi3, Ada2, N-Cor, and TFIIIB) involved in chromatin remodeling and transcription regulation [3,4]. The isolated BDP1 isoforms vary in the length of c-terminal extensions characterized by a 55-residue repetitive motif [3,4,5,6,7].
TFIIIB activity, via the TBP, BRF1, and BRF2 subunit(s), is targeted both directly and indirectly by various oncogenes and tumor suppressors [7,8]. For example, the oncogenes MAP kinase ERK and MYC [9,10] stimulate TFIIIB activity in vitro. The tumor suppressors p53 [10,11], PTEN [12,13], BRCA1 [14], the retinoblastoma protein (RB) [10], and the Rb family members p107 and p130 [15] inhibit TFIIIB activity. The TFIIIB subunit BRF2 is deregulated in various human cancers and is an oncogene in lung squamous cell carcinoma [8,16,17,18]. To date, alterations in BDP1 have been demonstrated in nonsyndromic hereditary hearing loss [17] and have been shown to promote tumorigenicity in TP53-mutated prostate cancers [18]. Additionally, BDP1 is overexpressed in cells transformed by papovaviruses [19]. However, specific BDP1 alterations in human cancers have not been investigated.
In this study, we queried patient data from the Oncomine microarray database and an integrated data-mining platform to analyze BDP1 alterations in human cancers using publicly available datasets. Herein, we report a possible role for decreased BDP1 expression in lymphoma for the first time. To the best of our knowledge, this is the first study to report a statistically significant decrease in BDP1 expression in patients with anaplastic lymphoma kinase–positive (ALK+) anaplastic large-cell lymphoma (ALCL) (p = 1.67 × 10⁻⁶) and Burkitt’s lymphoma (BL) (p = 1.54 × 10⁻¹¹). An analysis of the BDP1 promoter identified putative binding sites for myelocytomatosis oncogene (MYC), B-cell lymphoma 6 protein (BCL6), E2 factor transcription factor 4 (E2F4), and Krüppel-like factor 4 (KLF4) transcription factors. MYC, BCL-6, E2, and E2F4 are demonstrated to be deregulated in lymphomas. Specifically, MYC and BDP1 expression are inversely correlated in ALK+ ALCL, suggesting a possible mechanism for the significant and specific decrease in BDP1 expression. In activated B-cell (ABC) diffuse large B-cell lymphoma (DLBCL), decreased BDP1 expression correlated with clinical outcomes, including recurrence at 1 year (p = 0.021) and 3 years (p = 0.005). Mortality at 1 (p = 0.030) and 3 (p = 0.012) years correlated with decreased BDP1 expression in ABC DLBCL. Together, these data suggest that BDP1 alterations may be of clinical significance in lymphoma and warrant further investigation.
2. Materials and Methods
2.1. Oncomine Analyses
From September 2019 through December 2021, we performed comprehensive queries of the Oncomine Research Premium Edition platform [20,21]. The Oncomine Research Premium Edition platform is a cancer microarray database and web-based data-mining platform [20] containing 729 datasets (91,866 samples) to determine the frequency of BDP1 alterations in human cancers. The Oncomine Research Premium Edition platform uses statistical tests conducted both as two-sided for differential expression analysis and as one-sided for specific over- and underexpression analysis [20,21]. For the overall study analysis, p-values were corrected for multiple comparisons by the false discovery rate method [20,21]. For BDP1 expression analyses in specific datasets, cutoff values, sample numbers, and p-values are indicated in the figure legends. The Oncomine™ Platform (Thermo Fisher, Ann Arbor, MI, USA) was used for analysis and visualization. The public datasets used are noted in Table 1, with study descriptions and hyperlinks to the available datasets, and are cited in figure legends.
2.2. BDP1 Promoter Analysis
The Eukaryotic Promoter Database [25] (https://epd.epfl.ch//index.php, accessed on 5 January 2022 was queried to identify putative transcription factor binding sites within the BDP1 promoter, specifically targeting transcription factors known to be deregulated in NHL. A threshold p-value of 0.001 was used while querying the Eukaryotic Promoter Database [25].
3. Results
3.1. BDP1 Expression Is Significantly Altered in a Subset of Human Cancers
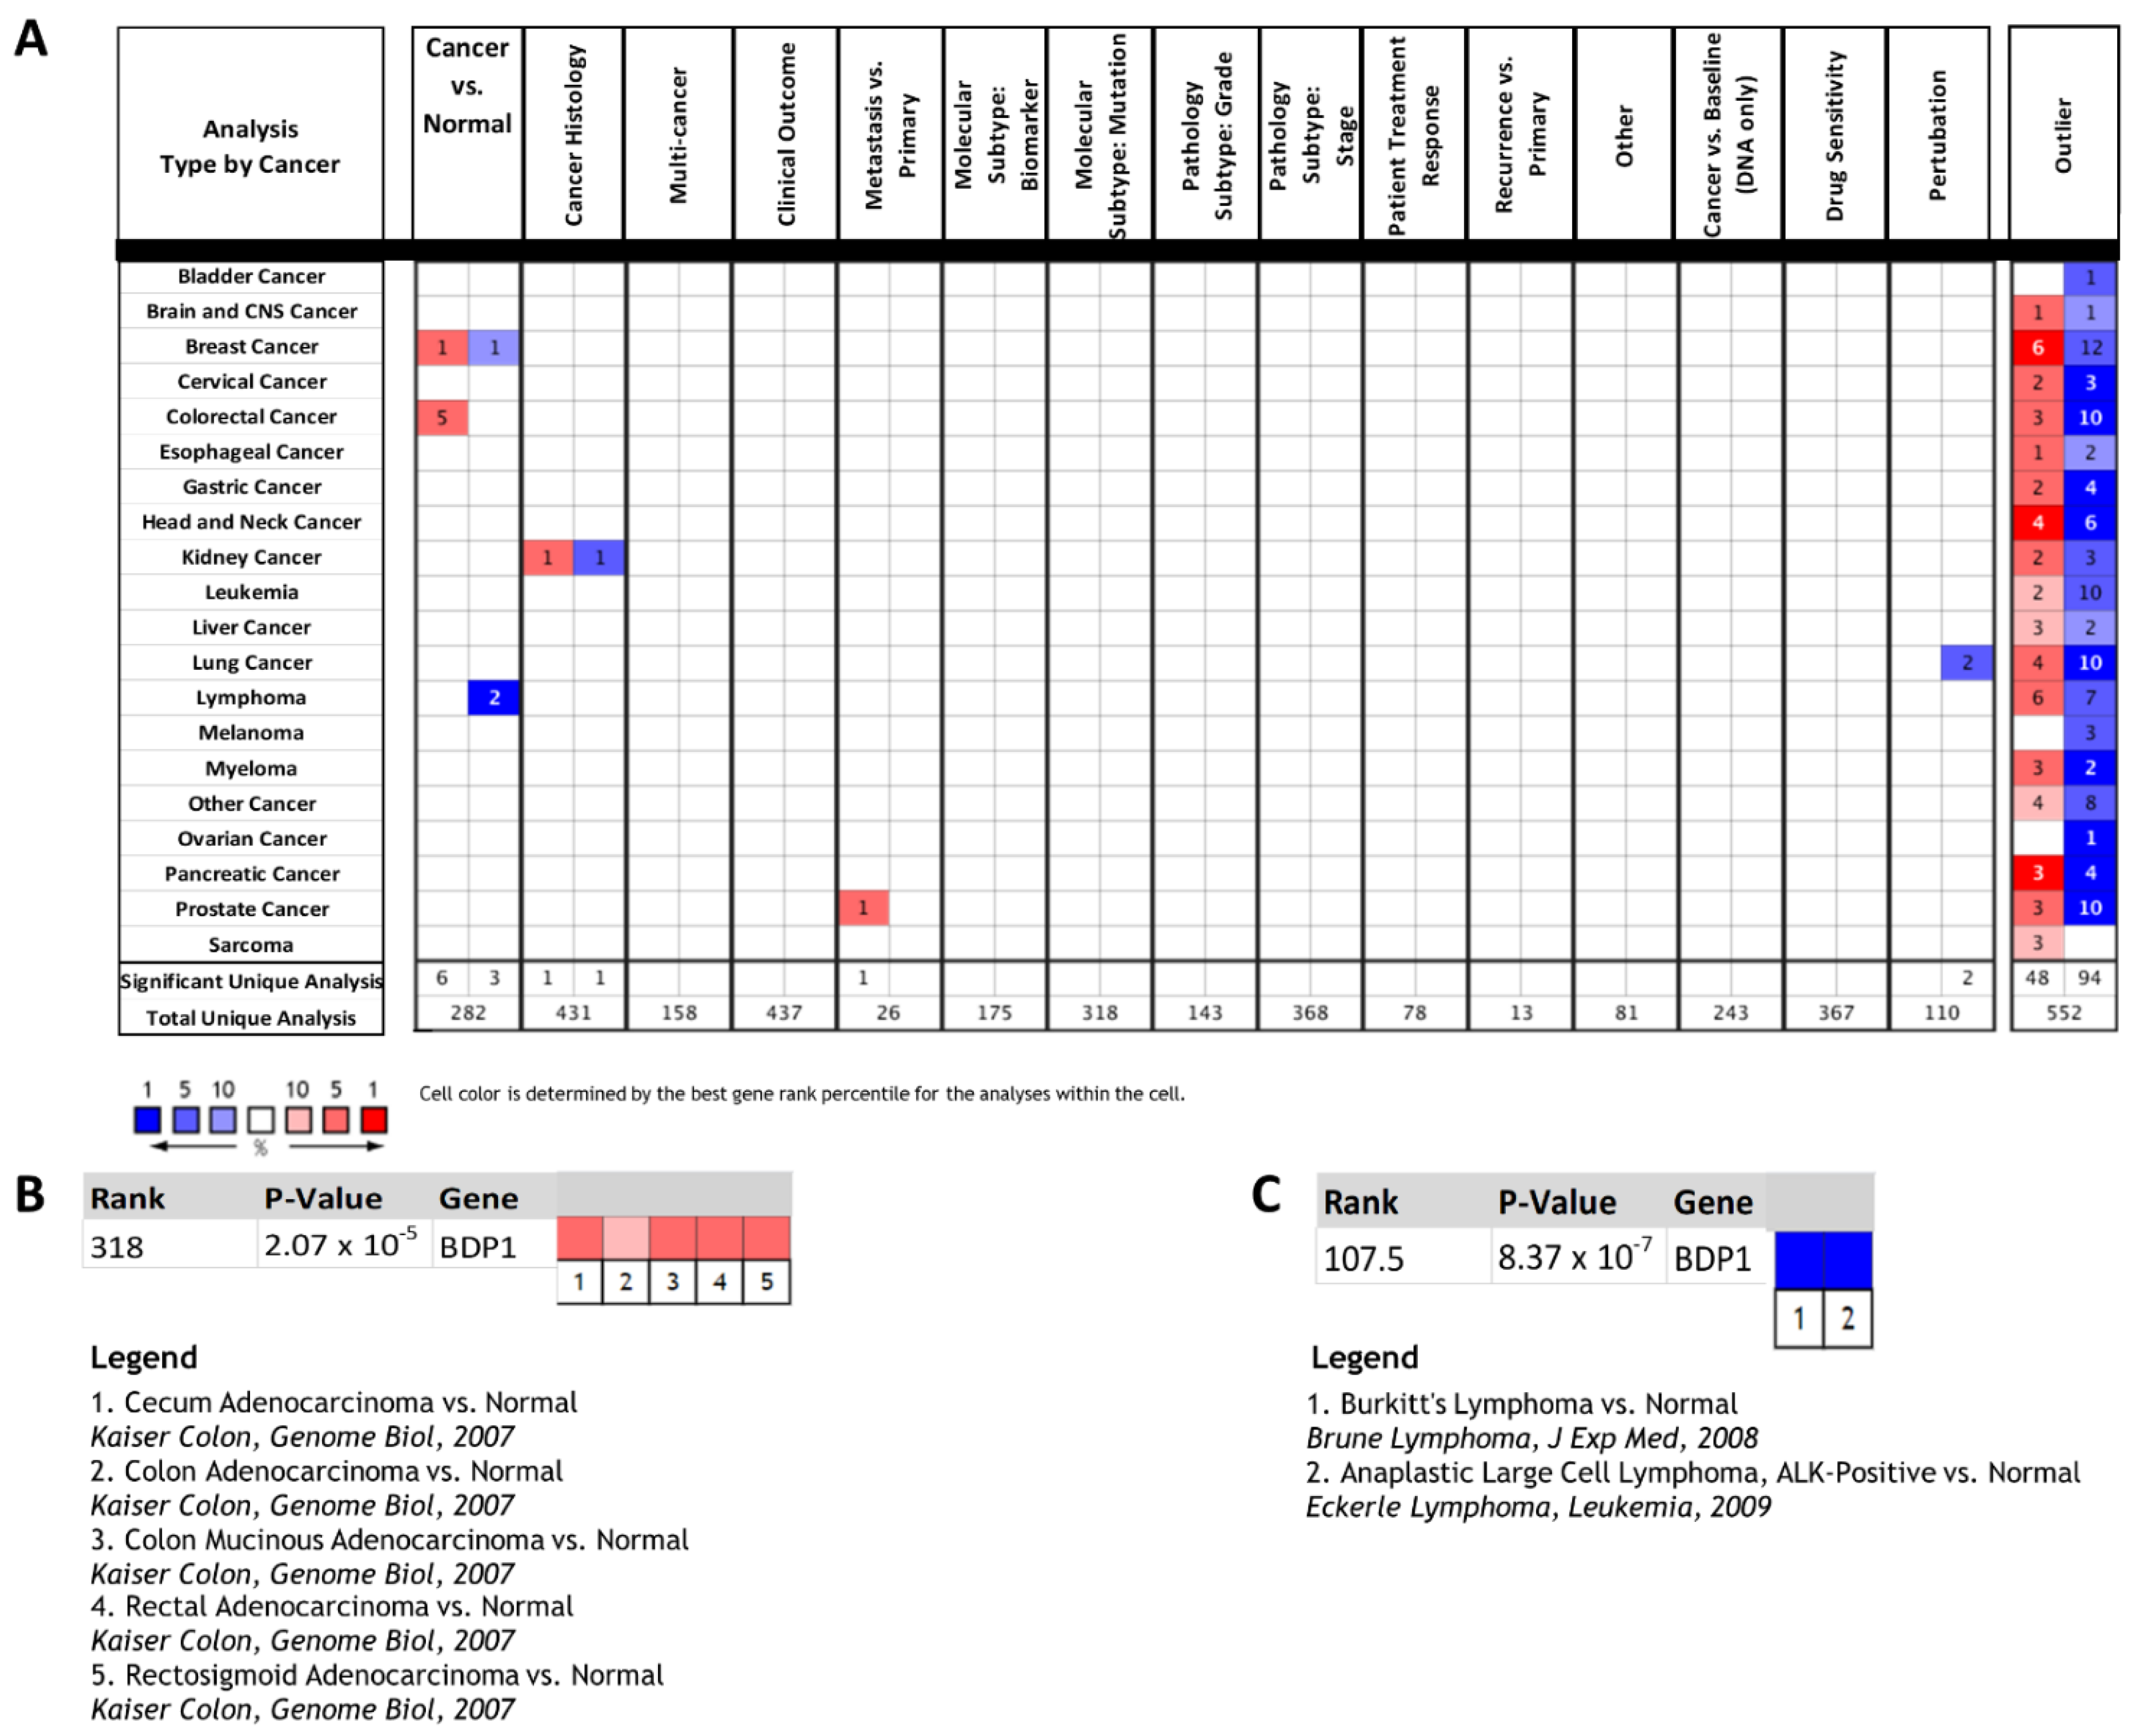
Recently, it was observed that p53-deficient prostate cancer cells display high levels of BDP1 [18], suggesting that deregulation of BDP1 may be of functional significance in human cancers. Deregulation of the human TFIIIB subunits BRF1 [26,27,28,29,30] and BRF2 [7,16,27,31,32,33,34,35,36,37] has been well documented in human cancers. The primary aim of this study was to determine if the TFIIIB subunit BDP1 is specifically altered in human cancers and if the observed alterations correlate with clinical outcomes. Oncomine 4.5 was queried for BDP1 expression in 729 datasets (91,866 samples) based on cancer type, cancer versus normal, and cancer versus cancer, including histology and multicancer analysis and outlier analyses. The disease summary analysis for BDP1 is presented in Figure 1. Red shading of boxes denotes gene overexpression; blue shading represents decreased gene expression. This disease summary was performed using the following criteria: a minimum 2-fold change in BDP1 gene expression, a p-value of 1 × 10⁻⁴, and a gene rank percentile of 10%. BDP1 was overexpressed in breast and colorectal cancer versus normal datasets but underexpressed in breast and lymphoma cancer versus normal datasets (Figure 1A). In cancer versus cancer datasets, BDP1 was over- and underexpressed in kidney cancer (cancer histology dataset) (Figure 1A). In a cancer subtype analysis, BDP1 was overexpressed in castrate-resistant metastatic prostate cancer [38] (n = 122, p = 2.60 × 10⁻¹¹), suggesting that alterations in BDP1 may be of clinical significance, as previously reported [18]. Interestingly, BDP1 expression was decreased in the pathway and drug analysis in lung cancers (Figure 1A). Specifically, BDP1 expression decreased in the HCC 1299 lung cancer cell line transfected with the epidermal growth factor receptor (EGFR) and treated with the EGFR signal transduction inhibitor gefitinib (p = 2.40 × 10⁻⁵) [39]. The disease summary analysis for BDP1 includes an Oncomine outlier analysis reporting the number of unique datasets in which BDP1 had the highest-ranking cancer outlier profile analysis (COPA) score [20]. The outlier analysis demonstrated that BDP1 was both over- and underexpressed across the analyzed cancer datasets.
Interestingly, BDP1 was significantly overexpressed in colorectal cancer (p = 2.07 × 10⁻⁵, 105 patients, median gene rank of 318) across five datasets (10%) (Figure 1B). However, further analysis did not identify any correlation with clinical outcomes (unpublished data). In contrast, BDP1 was significantly underexpressed in lymphoma (p = 8.37 × 10⁻⁷, 131 patients, median gene rank of 107) across two datasets (28.5%) (Figure 1C). To the best of our knowledge, BDP1 alterations in lymphoma have not been investigated previously. Thus, the observed statistically significant BDP1 underexpression in lymphoma datasets (Figure 1A,C) warranted further in-depth analysis.
3.2. BDP1 mRNA Is Significantly and Specifically Underexpressed in Lymphoma
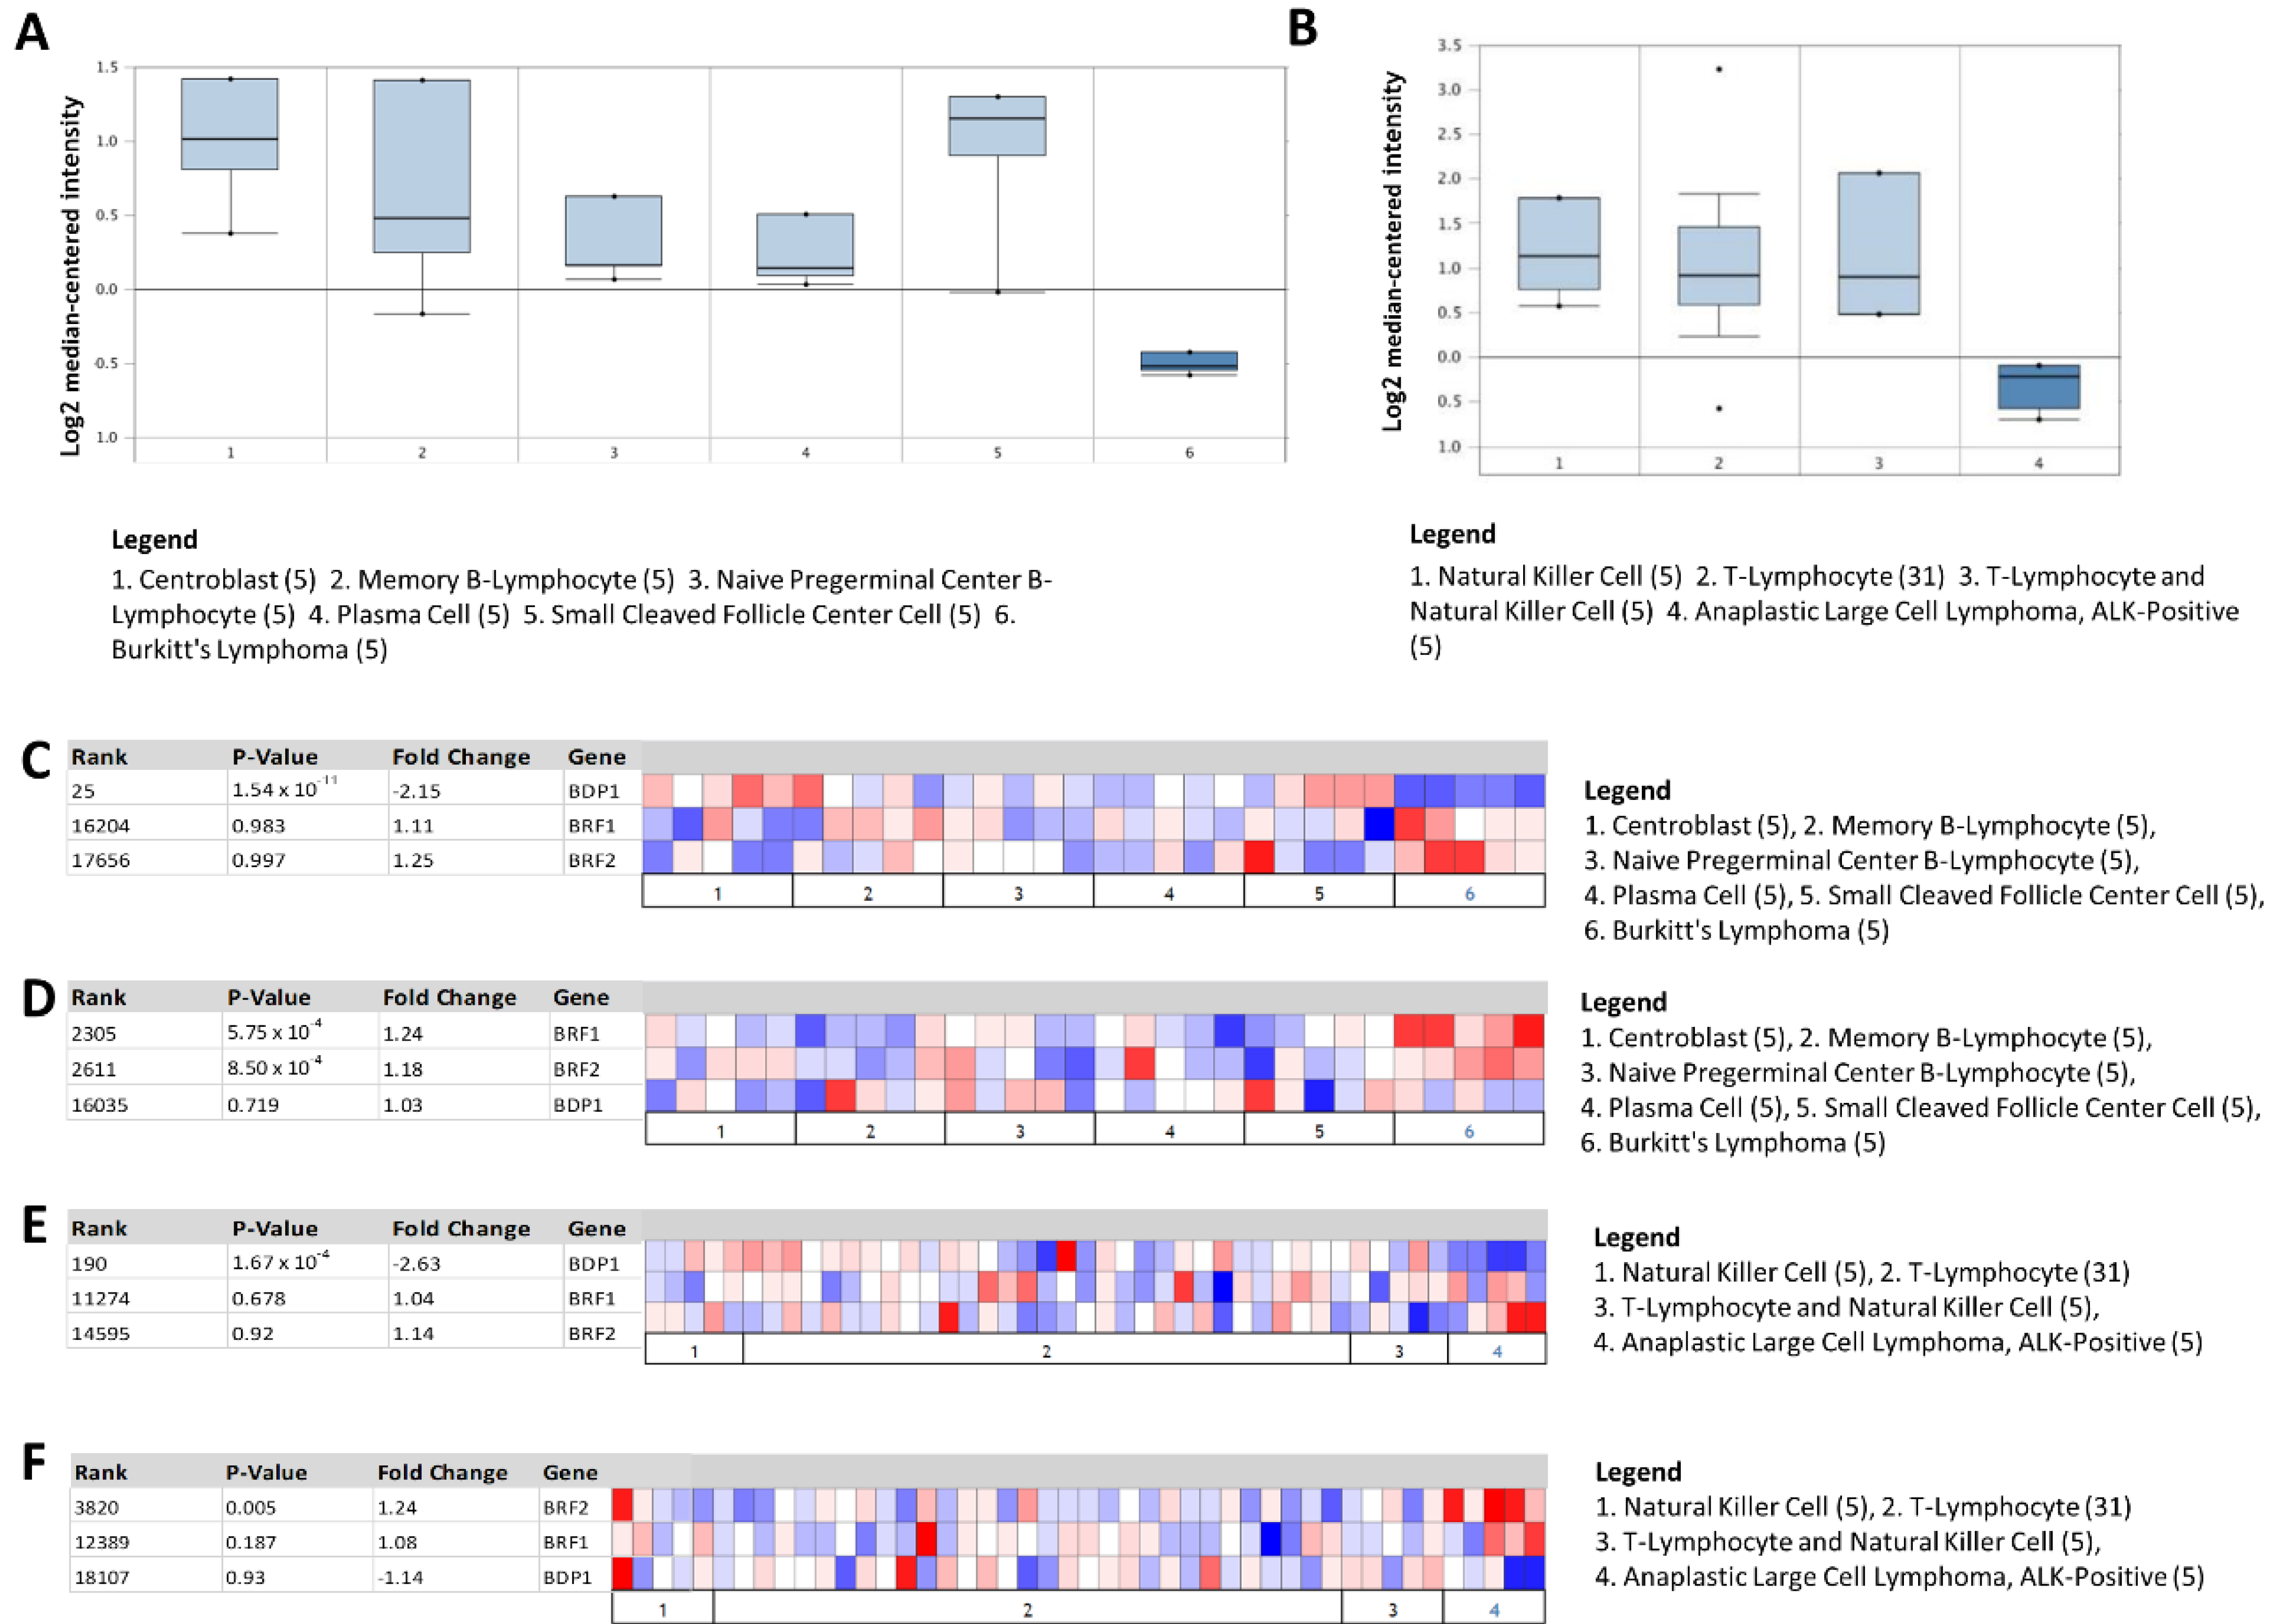
In Figure 2A, we show BDP1 expression in the Brune lymphoma dataset [38]; BDP1 expression was significantly decreased in BL (normal versus cancer; gene rank of 25, p = 1.54 × 10⁻¹¹, fold change of −2.148, n = 67). In Figure 2B, we show BDP1 expression in the Eckerle lymphoma dataset [39]; BDP1 expression was significantly decreased in ALK+ ALCL, an ALCL subtype that responds well to standard chemotherapy treatment (gene rank of 190, p = 1.67 × 10⁻⁶, fold change of −2.635, n = 64) [23].
Subsequently, we determined if the observed statistically significant decrease in BDP1 expression in lymphoma patients was unique to BDP1 or was common to the TFIIIB subunits BRF1 and BRF2. The heat maps depict TFIIIB expression in BL (Figure 2C,D) and ALK+ ALCL (Figure 2E,F). There was no significant decrease in BRF1 or BRF2 expression concurrent with the significant decrease in BDP1 expression (Figure 2C,E). However, BRF1 (p = 5.75 × 10⁻⁴) and BRF2 (p = 8.50 × 10⁻⁴) were significantly and specifically overexpressed exclusively in the Brune lymphoma dataset (Figure 2D) [22]. Only BRF2 (p = 0.005) was overexpressed in the Eckerle lymphoma dataset (Figure 2F) [23].
3.3. Heat Map Identifies BDP1 Expression as Significantly Underexpressed in BL and ALK+ ALCL
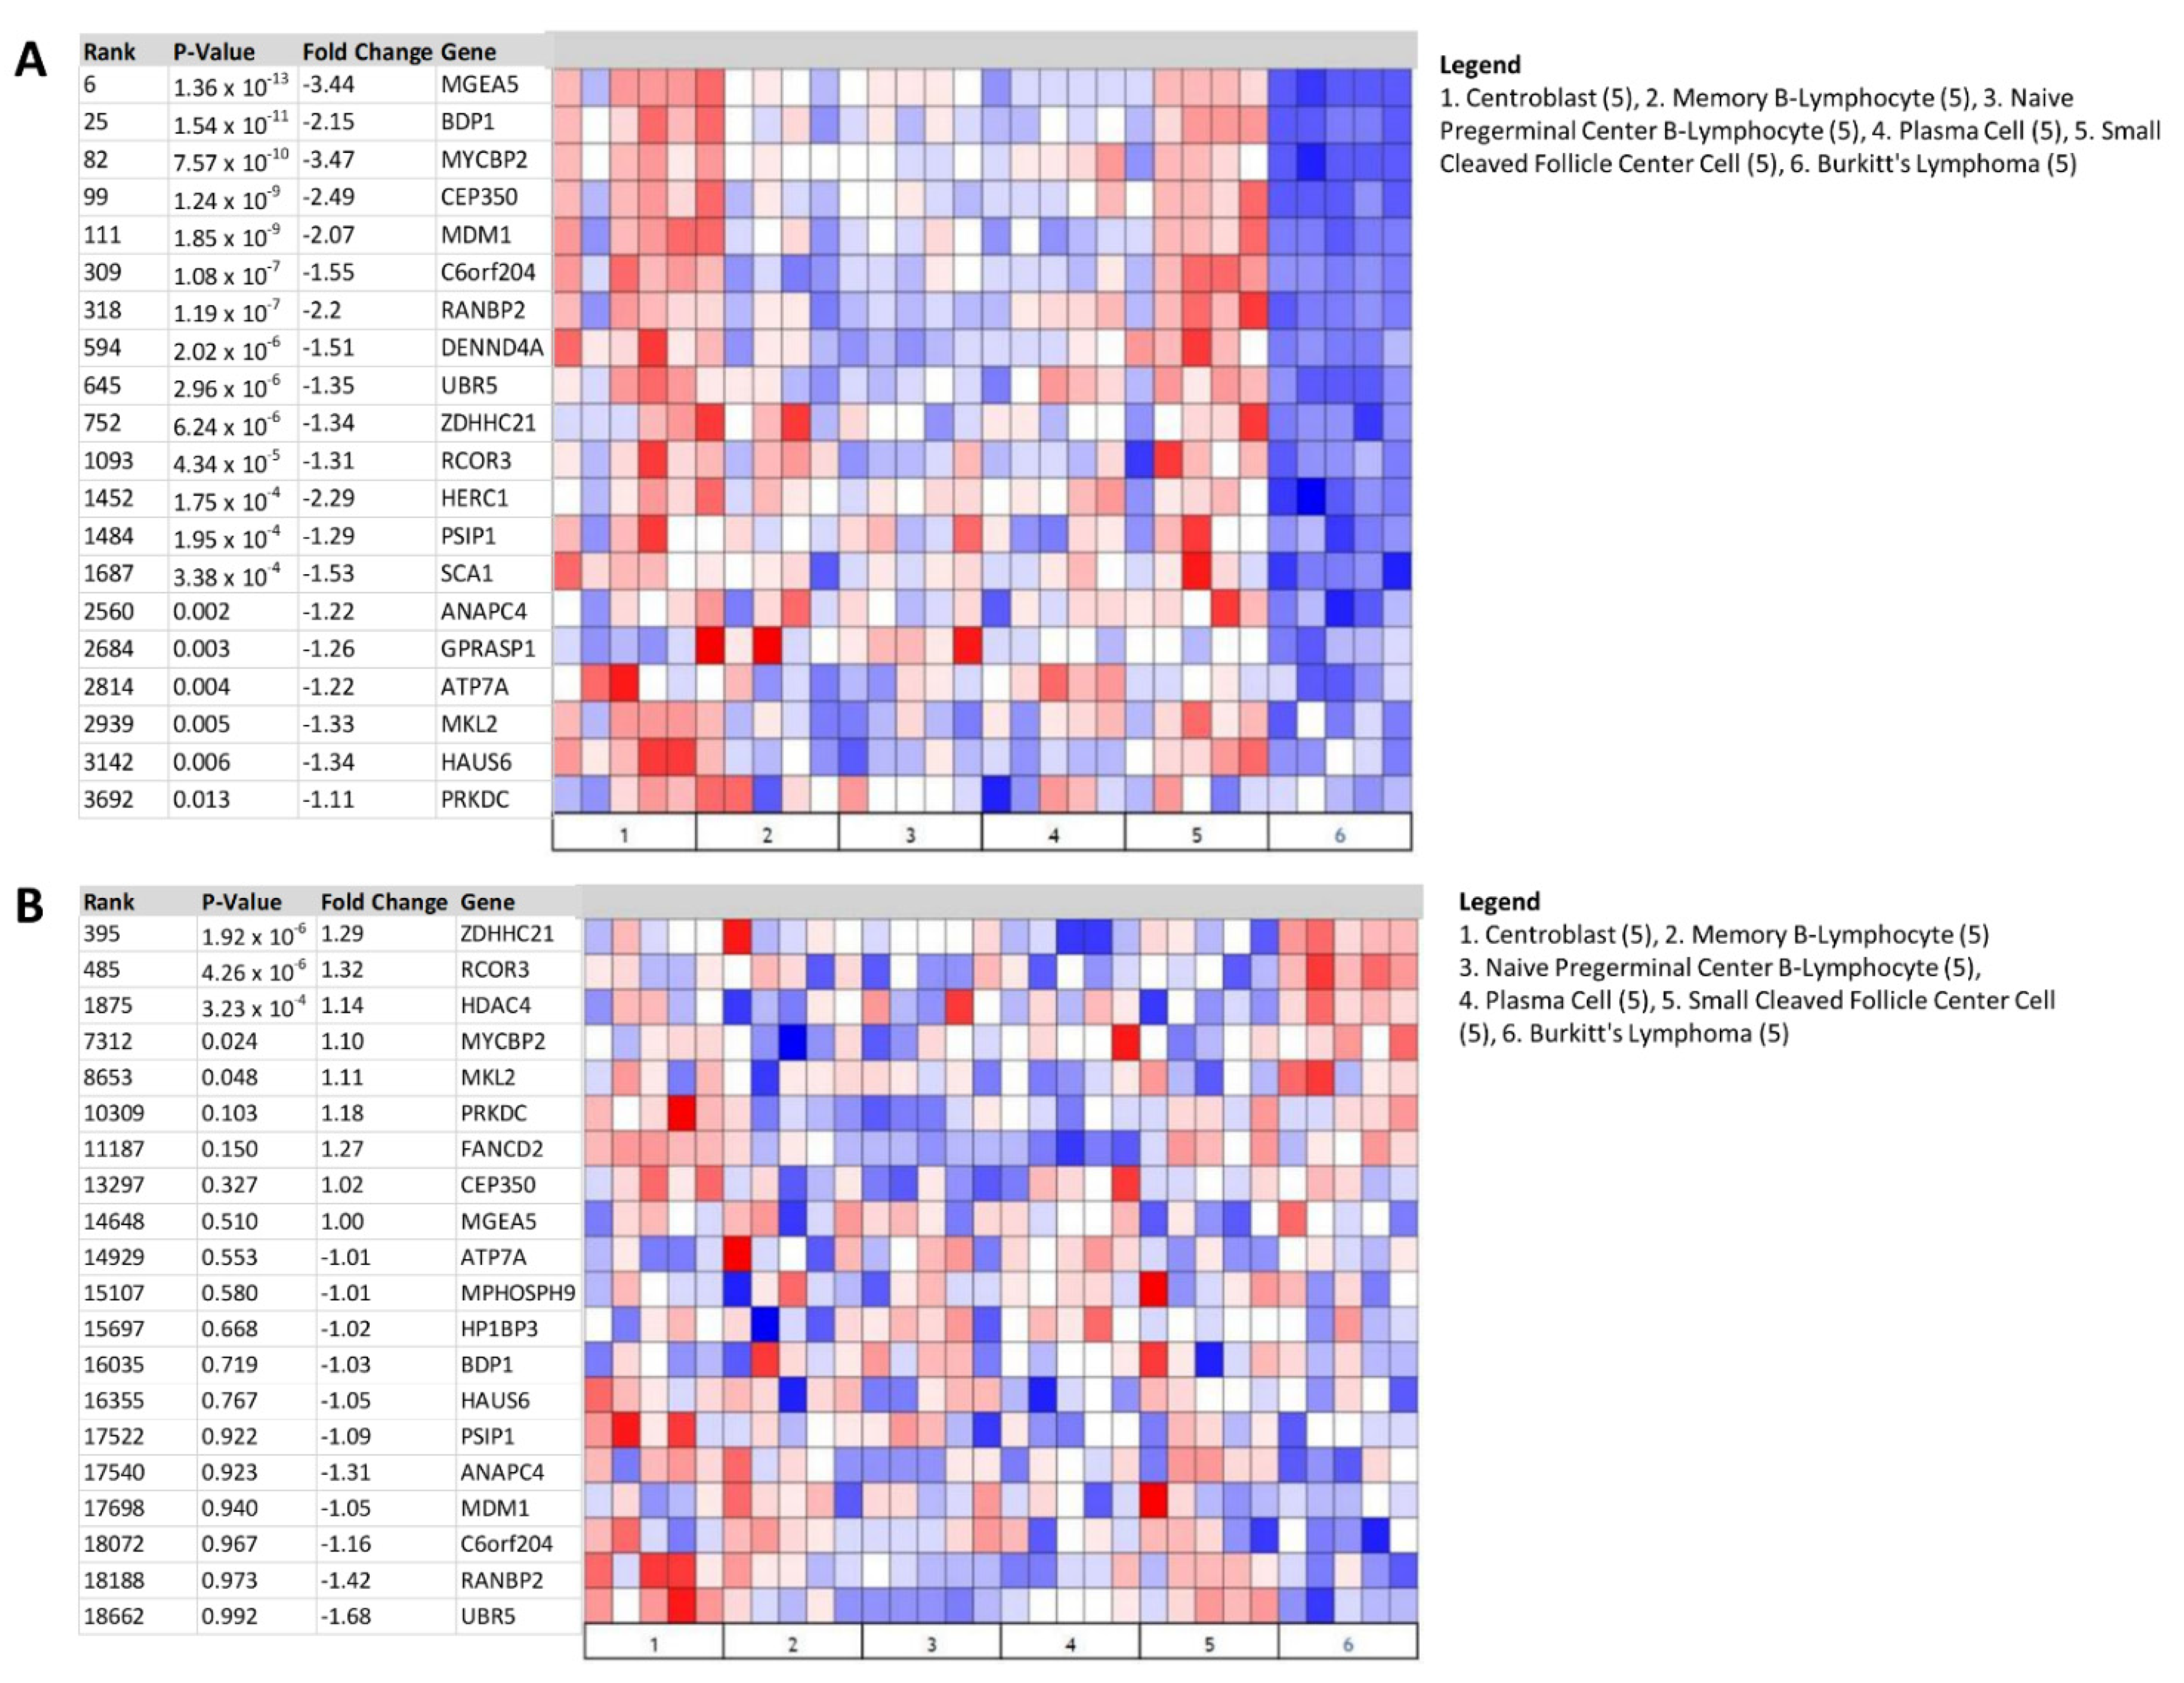
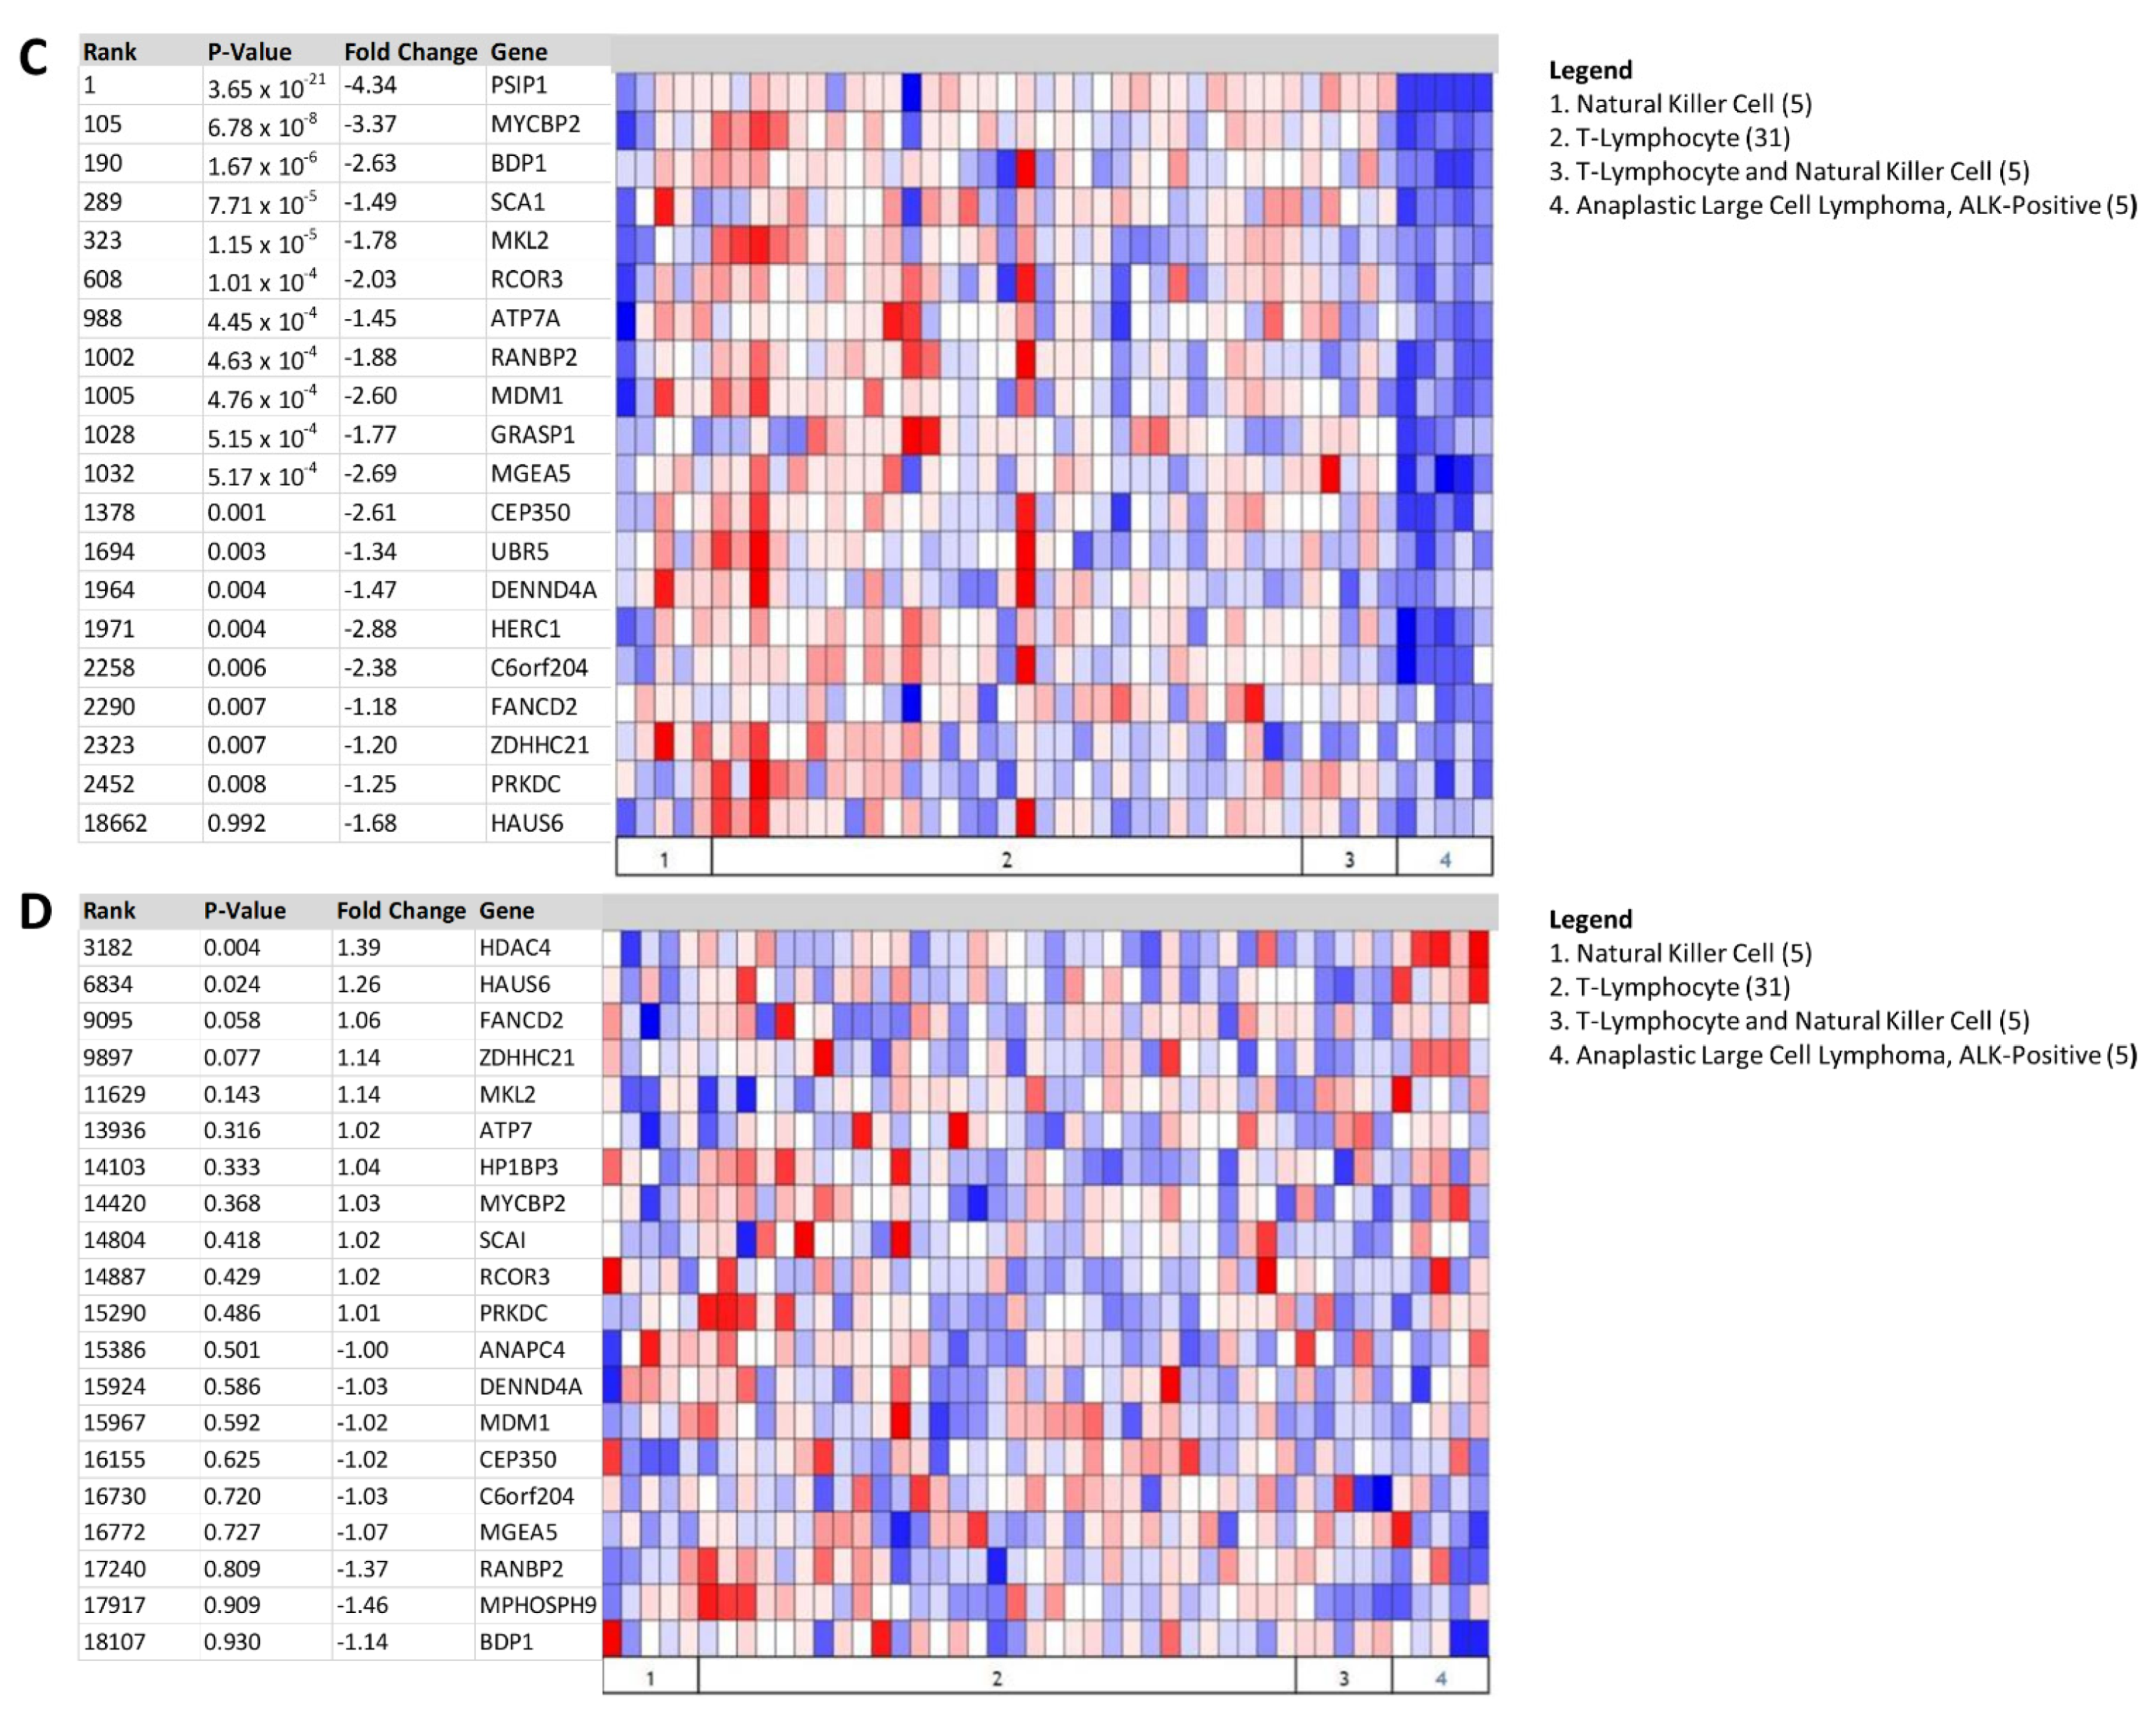
Gene expression profiling identifying molecular heterogeneity in various lymphomas has provided additional genetic information with the potential to develop targeted therapies [40]. As such, we re-examined the Brune [22] and Eckerle [23] lymphoma datasets to identify the top over- and underexpressed genes in BL and ALK+ ALCL to determine the potential significance of BDP1 underexpression in the context of these NHL subtypes (Figure 3). Using the Steidl lymphoma [41] concept cluster (Oncomine cluster-ID n9239), we queried the Brune [22] and Eckerle [23] lymphoma datasets to identify genes with the top median gene rank that were significantly over- and underexpressed. The top genes identified as significantly under- or overexpressed are labeled with median gene rank, p-value, and fold change in gene expression. Analysis of the Brune dataset (Figure 3A,B) identified BDP1 (p = 1.54 × 10⁻¹¹) as significantly underexpressed in BL vs. normal (log2 median-centered intensity), with a median gene rank of 25 and −2.15-fold change (Figure 3A). The significantly overexpressed genes in BL are presented in Figure 3B using the same parameters utilized in Figure 3A. Analysis of the Eckerle dataset (Figure 3C,D) identified BDP1 (p =1.67 × 10⁻⁶) as significantly underexpressed in ALK+ ALCL vs. normal (log2 median-centered intensity), with a median gene rank of 190 and −2.63-fold change (Figure 3C). The identification of significantly overexpressed genes in ALK+ ALCL is presented in Figure 3D using the same criteria as in Figure 3C.
3.4. In Silico Identification of Putative Transcription Factor Binding Sites in the BDP1 Promoter for Transcription Factors Deregulated in NHL
The results in Figure 3 prompted an in silico analysis to determine if the transcription factors with significantly altered expression have the potential to deregulate BDP1 activity and expression. The BDP1 protein contains a highly conserved SANT domain, originally identified in Swi3, Ada2, N-Cor, and TFIIIB (yeast BDP1) [3,4]. The SANT domain has been implicated in DNA binding and chromatin remodeling [42]. Of the transcription factors with significantly altered expression in BL and ALK+ ALCL identified in Figure 3, we identified two transcription factors with the potential to regulate BDP1 activity via the SANT domain (Table 2).
Further analysis of deregulated transcription factors in BL and ALK+ ALCL identified histone deacetylase 4 (HDAC4) as specifically and significantly overexpressed in both BL and ALK+ ALCL (Figure 3). Previously, SANT domain proteins were identified in chromatin remodeling complexes [45]. In addition, corepressor of nuclear receptors (n-CoR) is a SANT domain protein known to interact with and activate histone deacetylase 3 (HDAC3) [46]. In esophageal carcinoma, HDAC4 overexpression has been associated with poor survival and promotes tumor progression [47]. It was recently demonstrated that the miRNA miR-155 targets HDAC4 and indirectly regulates B-cell lymphoma 6 (BCL6) expression, a key event in B-cell leukemia development [48]. A meta-analysis of the diffuse large B-cell lymphoma patient microarray data demonstrated that miR-155 expression inversely correlates with HDAC4 and BCL6 [48]. More experiments are required to determine if BDP1, potentially via the SANT domain, interacts with HDAC4, playing a regulatory role in NHL. In addition, we noted that the REST corepressor 3 (RCOR3) was both significantly over- and underexpressed in both BL and ALK+ ALCL.
There are three REST corepressor family members (1–3), each with two SANT domains [44]. Deletions in RCOR1 are associated with unfavorable survival outcomes in patients with DLBCL [49]. RCOR1 and RCOR2 facilitate nucleosome demethylation during blood cell maturation, whereas RCOR3 inhibits this process [50]. It is unclear if RCOR3 plays a role in NHL.
We could not determine whether the observed significant decrease in BDP1 mRNA expression in BL and ALK+ ALCL is the result of decreased transcription from the BDP1 promoter or decreased BDP1 mRNA stability. Thus, we examined the BDP1 promoter for putative transcription factor binding sites known to play a role in lymphoma. Thus, we performed a query of the Eukaryotic Promoter Database [25] for lymphoma-associated putative transcription factor binding sites in the BDP1 promoter, located −1000 to +100 relative to the transcriptional start site (TSS), using a cutoff p-value of 0.001 [25]. Table 3 summarizes the location of putative binding sites in the BDP1 promoter for lymphoma-associated transcription factors.
In NHL, Krüppel-like factor 4 (KLF4) has been characterized as a tumor suppressor, and overexpression inhibits cell proliferation in BL cell lines [51]. In ALK+ ALCL, KLF4 overexpression is significant (p = 0.002, gene rank 2491) and BDP1 expression is significantly decreased (p = 1.67 × 10⁻⁶, gene rank 190) (Figure 4). Thus, the KLF4 binding sites identified at −734, −593, −553, −459, and −291 may partially explain the significant decrease in BDP1 observed in subtypes of NHL [51].
3.5. Decreased BDP1 Expression Correlates with FOXP1 and BCL6 Expression
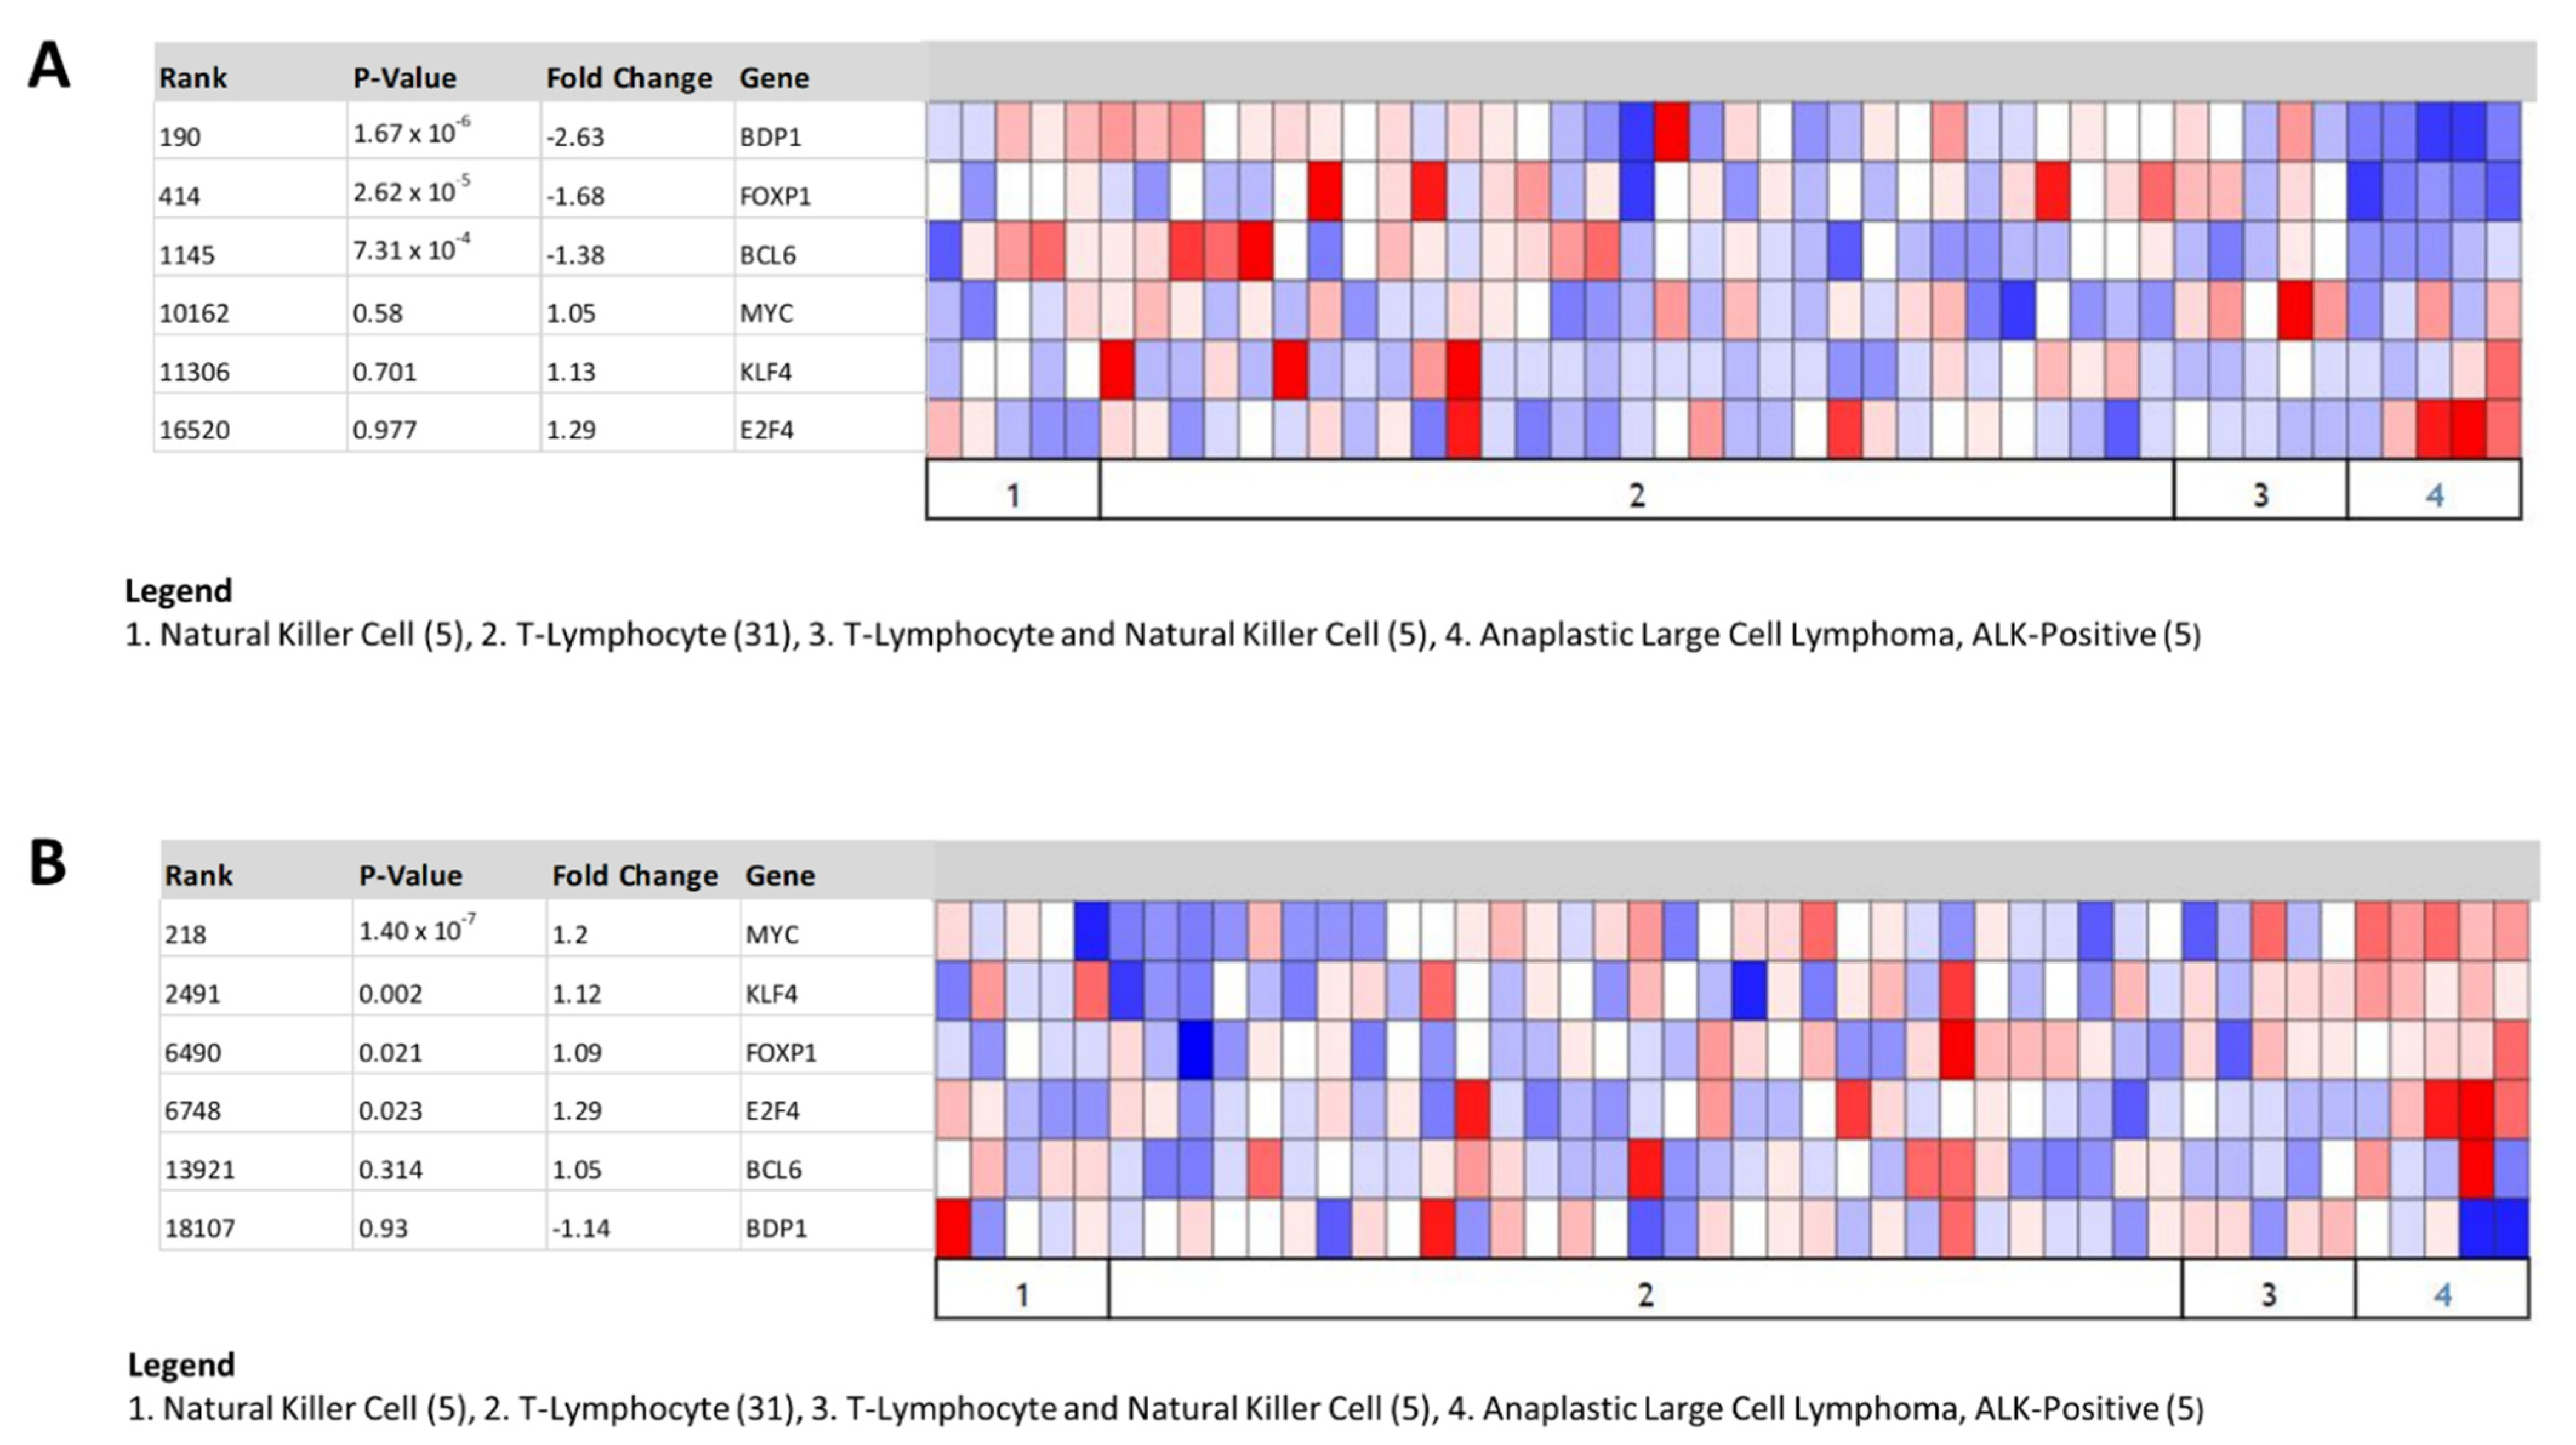
In NHL, MYC amplification is associated with poor prognosis [52]. It is plausible that MYC binding to the BDP1 promoter, located at −582 and −581, may permit the recruitment of MYC-associated proteins to silence BDP1 expression. MYC is significantly overexpressed (p = 1.4 × 10⁻⁷, gene rank 218) and BDP1 expression is significantly decreased (p = 1.67 × 10⁻⁶, gene rank 190) in ALK+ ALCL (Figure 4). BCL6 overexpression has been implicated in lymphoma [53]. We identified BCL6 binding sites in the BDP1 promoter at −985, −936, −384, −362, −287, −276, and −173, relative to the transcription start site (TSS). Overexpression of BCL6 has been implicated in lymphoma [53]. However, both BCL (p = 7.31 × 10⁻⁴, gene rank 1145) and BDP1 (p = 1.67 × 10⁻⁶, gene rank 190) expression are significantly decreased in ALK+ ALCL (Figure 4A) [53]. We did not observe the same correlation in Burkitt’s lymphoma using the Brune dataset (data not shown) [22].
We identified several putative Forkhead box protein P1 (FOXP1) and E2 factor transcription factor 4 (E2F4) binding sites in the BDP1 promoter (Table 3). FOXP1 is overexpressed in a subset of DLBCL patients [54]. In ALK+ ALCL, both FOXP1 (p = 2.62 × 10⁻⁵, gene rank 414) and BDP1 (p = 1.67 × 10⁻⁶, gene rank 190) expression is significantly decreased (Figure 4). Decreased E2F4 protein expression in BL tumor samples has been reported [55]. However, our analysis of E2F4 expression shows that it remains relatively unchanged in ALK+ ALCL (Figure 4). Analyses of these putative binding sites suggest that the MYC binding sites at −582 and −581 in the BDP1 promoter may play a key role in regulating BDP1 mRNA expression in ALK+ ALCL.
3.6. Decreased BDP1 Expression Correlates with Clinical Outcomes in Activated B-Cell Diffuse Large B-Cell Lymphoma
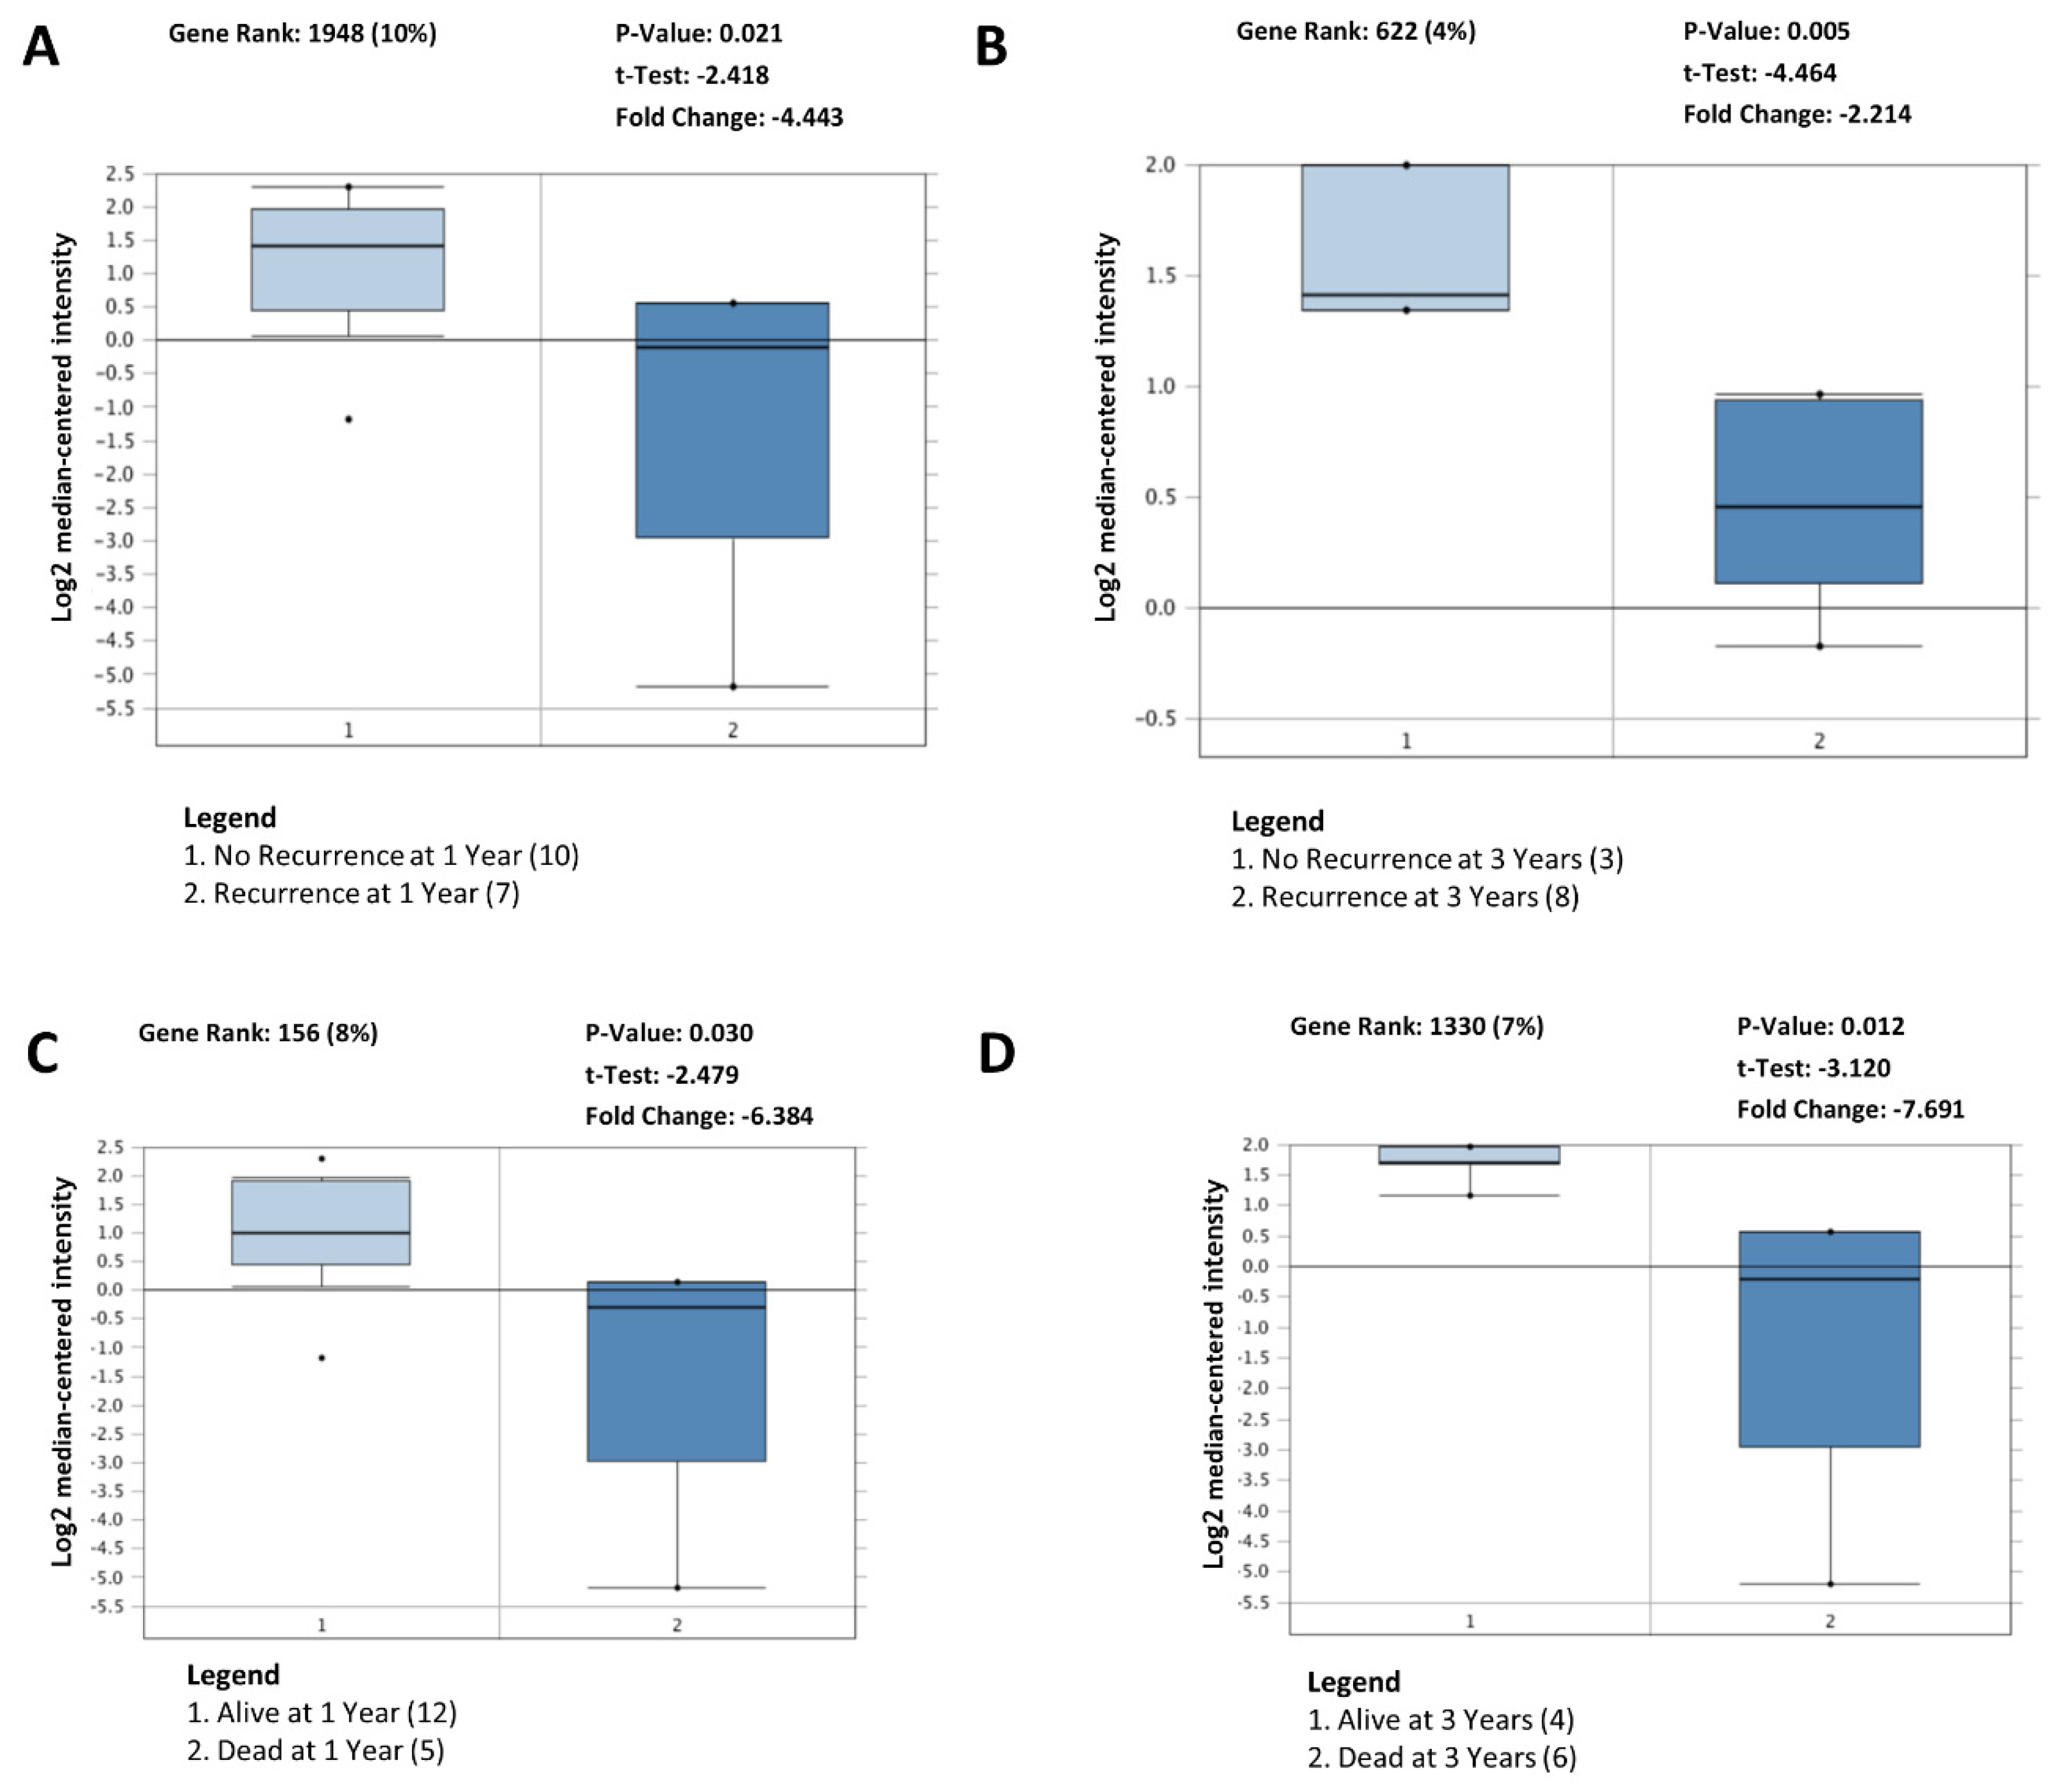
Together, these data suggest a role for BDP1 alterations in NHL patients. To determine if the decreased BDP1 expression in lymphoma subtypes is clinically relevant, we examined whether BDP1 expression changes correlated with clinical outcomes. Clinical outcomes analyses, depicted in Figure 5, were performed using the Shaknovich lymphoma dataset [24] (n = 69). In activated B-cell (ABC) DLBCL [40], decreased BDP1 expression correlated with clinical outcomes, including recurrence at 1 year (p = 0.021) and 3 years (p = 0.005) (Figure 5A,B).
DLBCL patients can be divided into two groups based on expression profiling: ABC DLBCL and germinal center B-cell (GCB) DLBCL subtypes [56]. Patients with ABC DLBCL have poorer clinical outcomes than GCB patients [56]. Consequently, we carried out an analysis to determine if BDP1 expression and mortality were correlated in ABC DLBCL. Mortality at 1 (p = 0.030) and 3 (p = 0.012) years correlated with a decrease in BDP1 expression in ABC DLBCL (Figure 5C,D). Using the Shaknovich lymphoma dataset [24], recurrence (p = 0.614) and mortality (p = 0.858) outcomes in Figure 5 did not correlate with BDP1 expression in patients with GCB DLBCL (data not shown). However, BDP1 underexpression correlated with mortality at 1 (p = 0.023) and 3 (p = 0.009) years in the Lenz DLBCL dataset [56] (data not shown).
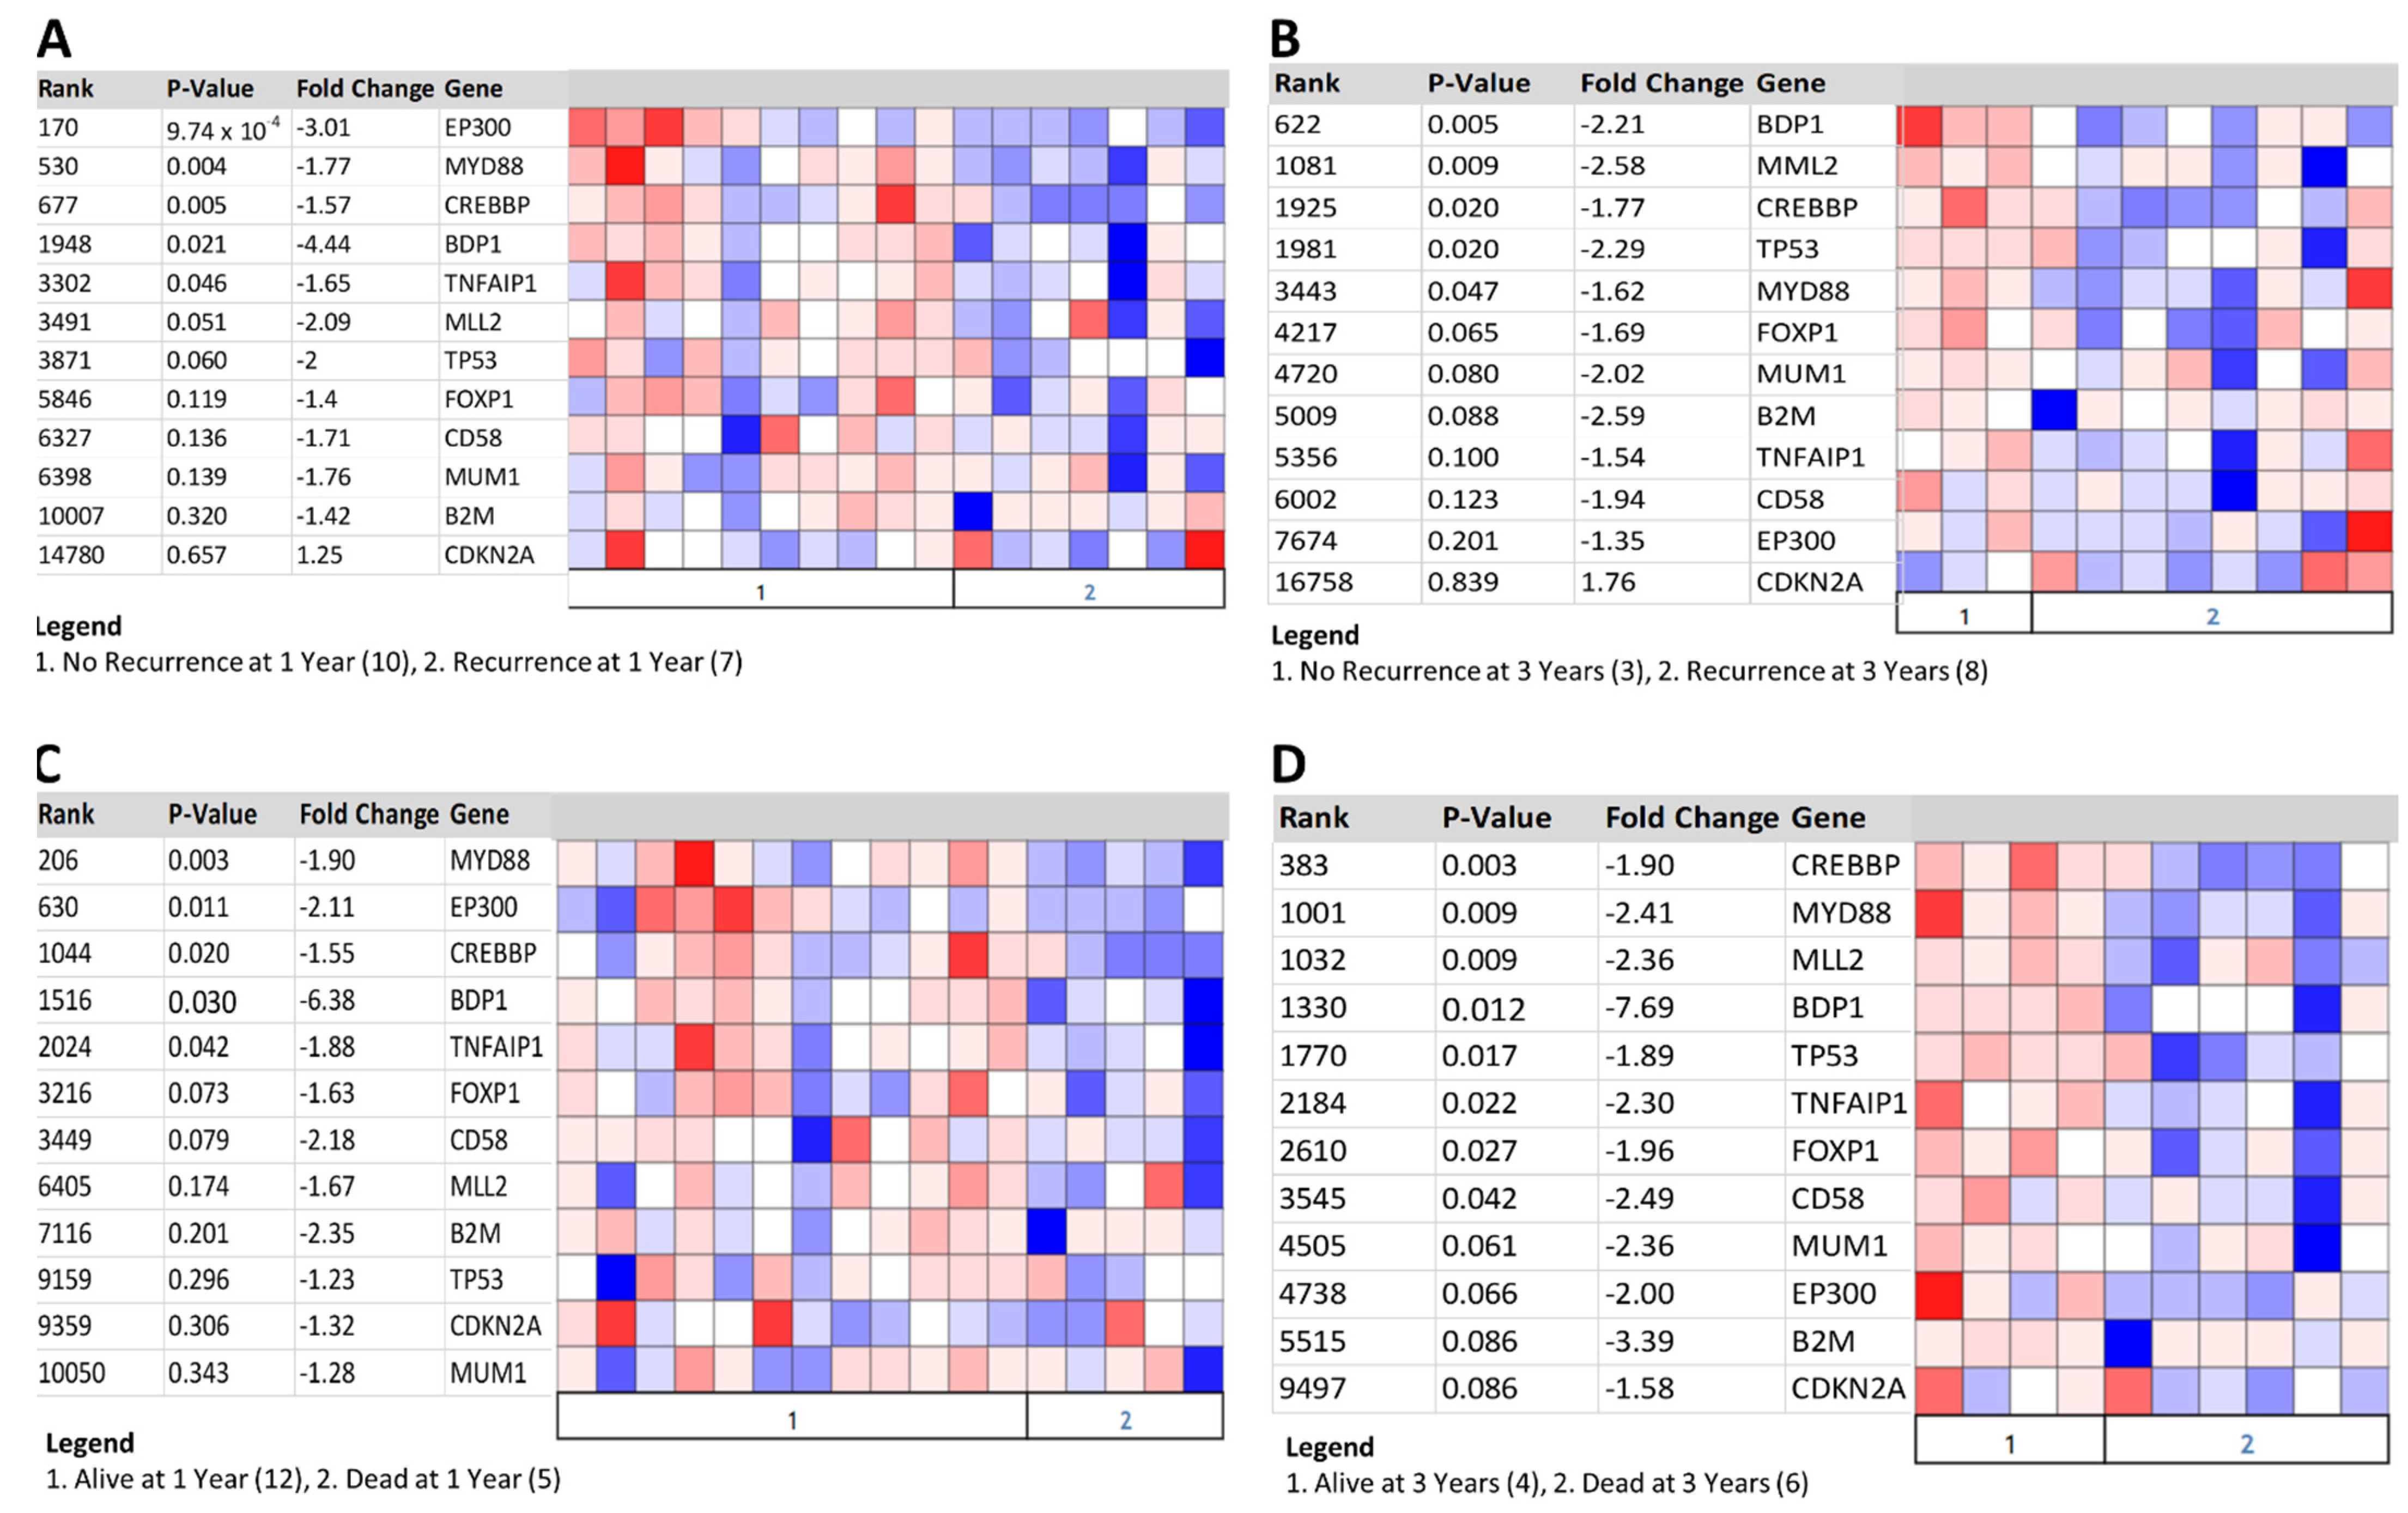
A variety of predictive and diagnostic biomarkers have been defined in ABC DLBCL [57], including the following common loss-of-function ABC DLBCL molecular biomarkers: beta-2-microglobulin (B2M), CD58 molecule (CD58), cyclin-dependent kinase inhibitor 2A (CDKN2A), CREB-binding protein (CREBBP), E1A-binding protein p300 (EP300), myeloid/lymphoid or mixed-lineage leukemia 2 (MLL2), and the myeloid differentiation primary response gene (88) (MYD88) [57]. FOXP1 [57] and the melanoma-associated antigen (mutated) 1 (MUM1) are immunohistochemical biomarkers in ABC DLBCL [57]. We queried the Shaknovich [24] lymphoma dataset in Oncomine to determine if BDP1 and established ABC DLBCL biomarkers correlate with clinical outcomes, and the results are shown in Figure 6. The expression heat maps represent recurrence at one year (Figure 6A) and three years (Figure 6B) and ABC DLBCL patients who died at one year (Figure 6C) and three years (Figure 6D); p-value and fold-change are indicated. BDP1 expression was significantly decreased, as were many of the established ABC DLBCL biomarkers. This significant correlation of BDP1 expression with both clinical outcomes and identified biomarkers in lymphoma suggests that more extensive analyses are warranted to determine if decreased BDP1 expression is a global feature of DLBCL or specific to DLBCL subtypes.
4. Discussion
To the best of our knowledge, this is the first study to identify BDP1 alterations in NHL. In this study, we performed a meta-analysis of cancer patient data from the Oncomine web-based data-mining platform to analyze BDP1 alterations in human cancers. Interestingly, there is a statistically significant decrease in BDP1 expression in patients with ALK+ ALCL (p = 1.67 × 10⁻⁶) and BL (p = 1.54 × 10⁻¹¹). To potentially identify mechanisms that drive the decrease in BDP1 mRNA expression, we analyzed the BDP1 promoter for transcription factor binding sites with relevance in NHL. Analysis of the BDP1 promoter identified putative binding sites for MYC, BCL6, E2F4, and KLF4 transcription factors, which were previously demonstrated to be deregulated in lymphomas. MYC and BDP1 expression are inversely correlated in ALK+ ALCL, suggesting a possible mechanism for the significant and specific decrease in BDP1 expression. In ABC DLBCL, decreased BDP1 expression correlated with clinical outcomes, including recurrence at 1 year (p = 0.021) and 3 years (p = 0.005). Mortality at 1 (p = 0.030) and 3 (p = 0.012) years correlated with decreased BDP1 expression in ABC DLBCL. Lastly, BDP1 underexpression correlates with previously identified biomarkers in ABC DLBCL patient clinical data. DCBCL is the most common lymphoma diagnosed in adults, with ABC DCBCL having a poor prognosis [58].
All microarray dataset analyses have limitations and should be interpreted with caution. In this study, we examined BDP1 alterations in NHL and clinical outcomes. We exclusively used publicly available microarray datasets from the NCBI Gene Expression Omnibus repository containing clinical outcome data identified using the Oncomine Research Platform in Figure 1. We believe that larger studies of NHL patients using RNA-seq analysis would provide an unbiased approach to analyzing all transcripts in a genome.
Additional clinical studies are required to determine if the observed correlation between BDP1 expression and clinical outcomes is specific to ABC DCBCL, potentially identifying BDP1 as a predictive biomarker in ABC DCBCL, or a general observation in NHL. Together, the data presented suggest that BDP1, a unique factor in the RNA pol III machinery, may be a novel target for therapeutic intervention for patients with NHL and warrants further investigation in the clinic.
Author Contributions
L.S. conceived the study, performed data analysis, prepared figures, and prepared the manuscript. S.C.-P. performed data analysis and revised the manuscript. All authors have read and agreed to the published version of the manuscript.
Funding
This research received no external funding.
Institutional Review Board Statement
Not applicable.
Informed Consent Statement
Not applicable.
Data Availability Statement
The present study used publicly available datasets archived in NCBI Gene Expression Omnibus. Hyperlinks to datasets are provided in the Methods section with study descriptions. Data analysis was performed using Oncomine Research Edition, retired on 17 January 2022.
Acknowledgments
The authors thank St. John’s University for funding this research.
Conflicts of Interest
The authors declare no conflict of interest.
References
- Siegel, R.L.; Miller, K.D.; Fuchs, H.E.; Jemal, A. Cancer Statistics, 2021. CA Cancer J. Clin. 2021, 71, 7–33. [Google Scholar] [CrossRef] [PubMed]
- Jaffe, E.S. Diagnosis and classification of lymphoma: Impact of technical advances. Semin. Hematol. 2019, 56, 30–36. [Google Scholar] [CrossRef] [PubMed]
- Schramm, L.; Hernandez, N. Recruitment of RNA polymerase III to its target promoters. Genes Dev. 2002, 16, 2593–2620. [Google Scholar] [CrossRef] [PubMed] [Green Version]
- Schramm, L.; Pendergrast, P.S.; Sun, Y.; Hernandez, N. Different human TFIIIB activities direct RNA polymerase III transcription from TATA-containing and TATA-less promoters. Genes Dev. 2000, 14, 2650–2663. [Google Scholar] [CrossRef] [PubMed] [Green Version]
- Teichmann, M.; Wang, Z.; Roeder, R.G. A stable complex of a novel transcription factor IIB- related factor, human TFIIIB50, and associated proteins mediate selective transcription by RNA polymerase III of genes with upstream promoter elements. Proc. Natl. Acad. Sci. USA 2000, 97, 14200–14205. [Google Scholar] [CrossRef] [PubMed] [Green Version]
- Kelter, A.R.; Herchenbach, J.; Wirth, B. The transcription factor-like nuclear regulator (TFNR) contains a novel 55-amino-acid motif repeated nine times and maps closely to SMN1. Genomics 2000, 70, 315–326. [Google Scholar] [CrossRef]
- Gouge, J.; Guthertz, N.; Kramm, K.; Dergai, O.; Abascal-Palacios, G.; Satia, K.; Cousin, P.; Hernandez, N.; Grohmann, D.; Vannini, A. Molecular mechanisms of Bdp1 in TFIIIB assembly and RNA polymerase III transcription initiation. Nat. Commun. 2017, 8, 130. [Google Scholar] [CrossRef] [Green Version]
- White, R.J. RNA polymerase III transcription and cancer. Oncogene 2004, 23, 3208–3216. [Google Scholar] [CrossRef] [Green Version]
- Athineos, D.; Marshall, L.; White, R.J. Regulation of TFIIIB during F9 cell differentiation. BMC Mol. Biol. 2010, 11, 21. [Google Scholar] [CrossRef] [Green Version]
- Felton-Edkins, Z.A.; Kenneth, N.S.; Brown, T.R.; Daly, N.L.; Gomez-Roman, N.; Grandori, C.; Eisenman, R.N.; White, R.J. Direct regulation of RNA polymerase III transcription by RB, p53 and c-Myc. Cell Cycle 2003, 2, 181–184. [Google Scholar] [CrossRef] [Green Version]
- Cairns, C.A.; White, R.J. p53 is a general repressor of RNA polymerase III transcription. EMBO J. 1998, 17, 3112–3123. [Google Scholar] [CrossRef] [PubMed] [Green Version]
- Cabarcas, S.; Watabe, K.; Schramm, L. Inhibition of U6 snRNA Transcription by PTEN. Online J. Biol. Sci. 2010, 10, 114–125. [Google Scholar] [CrossRef] [PubMed] [Green Version]
- Woiwode, A.; Johnson, S.A.; Zhong, S.; Zhang, C.; Roeder, R.G.; Teichmann, M.; Johnson, D.L. PTEN represses RNA polymerase III-dependent transcription by targeting the TFIIIB complex. Mol. Cell Biol 2008, 28, 4204–4214. [Google Scholar] [CrossRef] [PubMed] [Green Version]
- Veras, I.; Rosen, E.M.; Schramm, L. Inhibition of RNA polymerase III transcription by BRCA1. J. Mol. Biol. 2009, 387, 523–531. [Google Scholar] [CrossRef] [PubMed]
- Sutcliffe, J.E.; Cairns, C.A.; McLees, A.; Allison, S.J.; Tosh, K.; White, R.J. RNA polymerase III transcription factor IIIB is a target for repression by pocket proteins p107 and p130. Mol. Cell Biol. 1999, 19, 4255–4261. [Google Scholar] [CrossRef] [PubMed] [Green Version]
- Lockwood, W.W.; Chari, R.; Coe, B.P.; Thu, K.L.; Garnis, C.; Malloff, C.A.; Campbell, J.; Williams, A.C.; Hwang, D.; Zhu, C.Q.; et al. Integrative genomic analyses identify BRF2 as a novel lineage-specific oncogene in lung squamous cell carcinoma. PLoS Med. 2010, 7, e1000315. [Google Scholar] [CrossRef] [Green Version]
- Girotto, G.; Abdulhadi, K.; Buniello, A.; Vozzi, D.; Licastro, D.; d'Eustacchio, A.; Vuckovic, D.; Alkowari, M.K.; Steel, K.P.; Badii, R.; et al. Linkage study and exome sequencing identify a BDP1 mutation associated with hereditary hearing loss. PLoS ONE 2013, 8, e80323. [Google Scholar] [CrossRef]
- Zhao, D.; Lu, X.; Wang, G.; Lan, Z.; Liao, W.; Li, J.; Liang, X.; Chen, J.R.; Shah, S.; Shang, X.; et al. Synthetic essentiality of chromatin remodelling factor CHD1 in PTEN-deficient cancer. Nature 2017, 542, 484–488. [Google Scholar] [CrossRef] [Green Version]
- Felton-Edkins, Z.A.; White, R.J. Multiple mechanisms contribute to the activation of RNA polymerase III transcription in cells transformed by papovaviruses. J. Biol. Chem. 2002, 277, 48182–48191. [Google Scholar] [CrossRef] [Green Version]
- Rhodes, D.R.; Yu, J.; Shanker, K.; Deshpande, N.; Varambally, R.; Ghosh, D.; Barrette, T.; Pandey, A.; Chinnaiyan, A.M. Oncomine: A cancer microarray database and integrated data-mining platform. Neoplasia 2004, 6, 1–6. [Google Scholar] [CrossRef] [Green Version]
- Rhodes, D.R.; Kalyana-Sundaram, S.; Mahavisno, V.; Varambally, R.; Yu, J.; Briggs, B.B.; Barrette, T.R.; Anstet, M.J.; Kincead-Beal, C.; Kulkarni, P.; et al. Oncomine 3.0: Genes, pathways, and networks in a collection of 18,000 cancer gene expression profiles. Neoplasia 2007, 9, 166–180. [Google Scholar] [CrossRef] [PubMed] [Green Version]
- Brune, V.; Tiacci, E.; Pfeil, I.; Döring, C.; Eckerle, S.; van Noesel, C.J.; Klapper, W.; Falini, B.; von Heydebreck, A.; Metzler, D.; et al. Origin and pathogenesis of nodular lymphocyte-predominant Hodgkin lymphoma as revealed by global gene expression analysis. J. Exp. Med. 2008, 205, 2251–2268. [Google Scholar] [CrossRef] [PubMed]
- Eckerle, S.; Brune, V.; Döring, C.; Tiacci, E.; Bohle, V.; Sundström, C.; Kodet, R.; Paulli, M.; Falini, B.; Klapper, W.; et al. Gene expression profiling of isolated tumour cells from anaplastic large cell lymphomas: Insights into its cellular origin, pathogenesis and relation to Hodgkin lymphoma. Leukemia 2009, 23, 2129–2138. [Google Scholar] [CrossRef] [PubMed] [Green Version]
- Shaknovich, R.; Geng, H.; Johnson, N.A.; Tsikitas, L.; Cerchietti, L.; Greally, J.M.; Gascoyne, R.D.; Elemento, O.; Melnick, A. DNA methylation signatures define molecular subtypes of diffuse large B-cell lymphoma. Blood 2010, 116, e81–e89. [Google Scholar] [CrossRef] [PubMed] [Green Version]
- Dreos, R.; Ambrosini, G.; Groux, R.; Cavin Périer, R.; Bucher, P. The eukaryotic promoter database in its 30th year: Focus on non-vertebrate organisms. Nucleic Acids Res. 2017, 45, D51–D55. [Google Scholar] [CrossRef] [PubMed] [Green Version]
- Bellido, F.; Sowada, N.; Mur, P.; Lázaro, C.; Pons, T.; Valdés-Mas, R.; Pineda, M.; Aiza, G.; Iglesias, S.; Soto, J.L.; et al. Association Between Germline Mutations in BRF1, a Subunit of the RNA Polymerase III Transcription Complex, and Hereditary Colorectal Cancer. Gastroenterology 2018, 154, 181–194. [Google Scholar] [CrossRef] [PubMed] [Green Version]
- Cabarcas, S.; Jacob, J.; Veras, I.; Schramm, L. Differential expression of the TFIIIB subunits Brf1 and Brf2 in cancer cells. BMC Mol. Biol. 2008, 9, 74. [Google Scholar] [CrossRef] [Green Version]
- Fang, Z.; Yi, Y.; Shi, G.; Li, S.; Chen, S.; Lin, Y.; Li, Z.; He, Z.; Li, W.; Zhong, S. Role of Brf1 interaction with ERα, and significance of its overexpression, in human breast cancer. Mol. Oncol. 2017, 11, 1752–1767. [Google Scholar] [CrossRef] [Green Version]
- Huang, C.; Zhang, Y.; Zhong, S. Alcohol Intake and Abnormal Expression of Brf1 in Breast Cancer. Oxid. Med. Cell Longev. 2019, 2019, 4818106. [Google Scholar] [CrossRef]
- Lei, J.; Chen, S.; Zhong, S. Abnormal expression of TFIIIB subunits and RNA Pol III genes is associated with hepatocellular carcinoma. Liver Res. 2017, 1, 112–120. [Google Scholar] [CrossRef] [PubMed]
- Cabarcas-Petroski, S.; Meneses, P.I.; Schramm, L. A meta-analysis of BRF2 as a prognostic biomarker in invasive breast carcinoma. BMC Cancer 2020, 20, 1093. [Google Scholar] [CrossRef] [PubMed]
- Koo, J.; Cabarcas-Petroski, S.; Petrie, J.L.; Diette, N.; White, R.J.; Schramm, L. Induction of proto-oncogene BRF2 in breast cancer cells by the dietary soybean isoflavone daidzein. BMC Cancer 2015, 15, 905. [Google Scholar] [CrossRef] [PubMed] [Green Version]
- Lu, M.; Tian, H.; Yue, W.; Li, L.; Li, S.; Qi, L.; Hu, W.; Gao, C.; Si, L. Overexpression of TFIIB-related factor 2 is significantly correlated with tumor angiogenesis and poor survival in patients with esophageal squamous cell cancer. Med. Oncol 2013, 30, 553. [Google Scholar] [CrossRef] [PubMed]
- Lu, M.; Tian, H.; Yue, W.; Li, L.; Li, S.; Qi, L.; Hu, W.; Gao, C.; Si, L. TFIIB-related factor 2 over expression is a prognosis marker for early-stage non-small cell lung cancer correlated with tumor angiogenesis. PLoS ONE 2014, 9, e88032. [Google Scholar] [CrossRef]
- Melchor, L.; Garcia, M.J.; Honrado, E.; Pole, J.C.; Alvarez, S.; Edwards, P.A.; Caldas, C.; Brenton, J.D.; Benítez, J. Genomic analysis of the 8p11-12 amplicon in familial breast cancer. Int. J. Cancer 2007, 120, 714–717. [Google Scholar] [CrossRef]
- Tian, Y.; Lu, M.; Yue, W.; Li, L.; Li, S.; Gao, C.; Si, L.; Qi, L.; Hu, W.; Tian, H. TFIIB-related factor 2 is associated with poor prognosis of nonsmall cell lung cancer patients through promoting tumor epithelial-mesenchymal transition. Biomed. Res. Int. 2014, 2014, 530786. [Google Scholar] [CrossRef]
- Tian, Y.; Wang, C.; Lu, M. BRF2 as a promising indicator for radical lymph-node dissection surgery in patients with cN0 squamous cell carcinoma of the middle thoracic esophagus. Surg. Today 2019, 49, 158–169. [Google Scholar] [CrossRef]
- Grasso, C.S.; Wu, Y.M.; Robinson, D.R.; Cao, X.; Dhanasekaran, S.M.; Khan, A.P.; Quist, M.J.; Jing, X.; Lonigro, R.J.; Brenner, J.C.; et al. The mutational landscape of lethal castration-resistant prostate cancer. Nature 2012, 487, 239–243. [Google Scholar] [CrossRef] [Green Version]
- Nagashima, T.; Ushikoshi-Nakayama, R.; Suenaga, A.; Ide, K.; Yumoto, N.; Naruo, Y.; Takahashi, K.; Saeki, Y.; Taiji, M.; Tanaka, H.; et al. Mutation of epidermal growth factor receptor is associated with MIG6 expression. FEBS J. 2009, 276, 5239–5251. [Google Scholar] [CrossRef]
- Liu, Y.; Barta, S.K. Diffuse large B-cell lymphoma: 2019 update on diagnosis, risk stratification, and treatment. Am. J. Hematol. 2019, 94, 604–616. [Google Scholar] [CrossRef] [Green Version]
- Steidl, C.; Lee, T.; Shah, S.P.; Farinha, P.; Han, G.; Nayar, T.; Delaney, A.; Jones, S.J.; Iqbal, J.; Weisenburger, D.D.; et al. Tumor-associated macrophages and survival in classic Hodgkin’s lymphoma. N. Engl. J. Med. 2010, 362, 875–885. [Google Scholar] [CrossRef] [PubMed] [Green Version]
- Meier, K.; Brehm, A. Chromatin regulation: How complex does it get? Epigenetics 2014, 9, 1485–1495. [Google Scholar] [CrossRef] [PubMed] [Green Version]
- Gloghini, A.; Buglio, D.; Khaskhely, N.M.; Georgakis, G.; Orlowski, R.Z.; Neelapu, S.S.; Carbone, A.; Younes, A. Expression of histone deacetylases in lymphoma: Implication for the development of selective inhibitors. Br. J. Haematol. 2009, 147, 515–525. [Google Scholar] [CrossRef] [Green Version]
- Van Bergen, M.G.J.M.; van der Reijden, B.A. Targeting the GFI1/1B-CoREST Complex in Acute Myeloid Leukemia. Front. Oncol. 2019, 9, 1027. [Google Scholar] [CrossRef] [PubMed]
- Mo, X.; Kowenz-Leutz, E.; Laumonnier, Y.; Xu, H.; Leutz, A. Histone H3 tail positioning and acetylation by the c-Myb but not the v-Myb DNA-binding SANT domain. Genes Dev. 2005, 19, 2447–2457. [Google Scholar] [CrossRef] [PubMed] [Green Version]
- Zhang, J.; Kalkum, M.; Chait, B.T.; Roeder, R.G. The N-CoR-HDAC3 nuclear receptor corepressor complex inhibits the JNK pathway through the integral subunit GPS2. Mol. Cell 2002, 9, 611–623. [Google Scholar] [CrossRef]
- Zeng, L.S.; Yang, X.Z.; Wen, Y.F.; Mail, S.J.; Wang, M.H.; Zhang, M.Y.; Zheng, X.F.; Wang, H.Y. Overexpressed HDAC4 is associated with poor survival and promotes tumor progression in esophageal carcinoma. Aging 2016, 8, 1236–1249. [Google Scholar] [CrossRef] [Green Version]
- Sandhu, S.K.; Volinia, S.; Costinean, S.; Galasso, M.; Neinast, R.; Santhanam, R.; Parthun, M.R.; Perrotti, D.; Marcucci, G.; Garzon, R.; et al. miR-155 targets histone deacetylase 4 (HDAC4) and impairs transcriptional activity of B-cell lymphoma 6 (BCL6) in the Eμ-miR-155 transgenic mouse model. Proc. Natl. Acad. Sci. USA 2012, 109, 20047–20052. [Google Scholar] [CrossRef] [Green Version]
- Chan, F.C.; Telenius, A.; Healy, S.; Ben-Neriah, S.; Mottok, A.; Lim, R.; Drake, M.; Hu, S.; Ding, J.; Ha, G.; et al. An RCOR1 loss-associated gene expression signature identifies a prognostically significant DLBCL subgroup. Blood 2015, 125, 959–966. [Google Scholar] [CrossRef] [Green Version]
- Upadhyay, G.; Chowdhury, A.H.; Vaidyanathan, B.; Kim, D.; Saleque, S. Antagonistic actions of Rcor proteins regulate LSD1 activity and cellular differentiation. Proc. Natl. Acad. Sci. USA 2014, 111, 8071–8076. [Google Scholar] [CrossRef] [Green Version]
- Guan, H.; Xie, L.; Leithäuser, F.; Flossbach, L.; Möller, P.; Wirth, T.; Ushmorov, A. KLF4 is a tumor suppressor in B-cell non-Hodgkin lymphoma and in classic Hodgkin lymphoma. Blood 2010, 116, 1469–1478. [Google Scholar] [CrossRef] [PubMed]
- Mossafa, H.; Damotte, D.; Jenabian, A.; Delarue, R.; Vincenneau, A.; Amouroux, I.; Jeandel, R.; Khoury, E.; Martelli, J.M.; Samson, T.; et al. Non-Hodgkin’s lymphomas with Burkitt-like cells are associated with c-Myc amplification and poor prognosis. Leuk. Lymphoma 2006, 47, 1885–1893. [Google Scholar] [CrossRef] [PubMed]
- Wagner, S.D.; Ahearne, M.; Ko Ferrigno, P. The role of BCL6 in lymphomas and routes to therapy. Br. J. Haematol 2011, 152, 3–12. [Google Scholar] [CrossRef] [PubMed]
- Wlodarska, I.; Veyt, E.; De Paepe, P.; Vandenberghe, P.; Nooijen, P.; Theate, I.; Michaux, L.; Sagaert, X.; Marynen, P.; Hagemeijer, A.; et al. FOXP1, a gene highly expressed in a subset of diffuse large B-cell lymphoma, is recurrently targeted by genomic aberrations. Leukemia 2005, 19, 1299–1305. [Google Scholar] [CrossRef] [Green Version]
- Molina-Privado, I.; Jiménez, P.R.; Montes-Moreno, S.; Chiodo, Y.; Rodríguez-Martínez, M.; Sánchez-Verde, L.; Iglesias, T.; Piris, M.A.; Campanero, M.R. E2F4 plays a key role in Burkitt lymphoma tumorigenesis. Leukemia 2012, 26, 2277–2285. [Google Scholar] [CrossRef] [Green Version]
- Lenz, G.; Wright, G.; Dave, S.S.; Xiao, W.; Powell, J.; Zhao, H.; Xu, W.; Tan, B.; Goldschmidt, N.; Iqbal, J.; et al. Stromal gene signatures in large-B-cell lymphomas. N. Engl. J. Med. 2008, 359, 2313–2323. [Google Scholar] [CrossRef] [Green Version]
- Sun, R.; Medeiros, L.J.; Young, K.H. Diagnostic and predictive biomarkers for lymphoma diagnosis and treatment in the era of precision medicine. Mod. Pathol. 2016, 29, 1118–1142. [Google Scholar] [CrossRef] [Green Version]
- Lenz, G. Insights into the Molecular Pathogenesis of Activated B-Cell-like Diffuse Large B-Cell Lymphoma and Its Therapeutic Implications. Cancers 2015, 7, 811–822. [Google Scholar] [CrossRef]
Figure 1.
BDP1 expression is significantly altered in a subset of human cancers. (A) Oncomine 4.5 database disease summary for BDP1. Oncomine 4.5 was queried for BDP1 expression in 729 datasets (91,866 samples) based on cancer type, cancer versus normal, and cancer versus cancer, including histology and multicancer analysis types and outlier analyses. Red shading of boxes denotes gene overexpression; blue shading represents decreased gene expression. This disease summary was performed using the following criteria: a 2-fold change for gene expression, a p-value of 1 × 10⁻⁴, and a gene rank percentile of 10%. BDP1 was overexpressed in breast and colorectal cancer vs. normal datasets but underexpressed in breast and lymphoma cancer vs. normal datasets. In cancer vs. cancer datasets, BDP1 was over- and underexpressed in kidney cancer (cancer histology dataset). BDP1 was overexpressed in prostate cancer (metastasis vs. primary) in a cancer subtype analysis but decreased in drug and perturbation analysis in lung cancers. The outlier analysis demonstrated that BDP1 was both over- and underexpressed across analyzed cancers. (B) BDP1 was significantly overexpressed in colorectal cancer (p = 2.07 × 10⁻⁵, 105 patients) across 5 datasets (10%). (C) BDP1 was significantly underexpressed in lymphoma (p = 8.37 × 10⁻⁷, 131 patients) across 2 datasets (28.5%). The Oncomine™ Platform (Thermo Fisher, Ann Arbor, MI, USA) was used for analysis and visualization.

Figure 2.
BDP1 mRNA is significantly and specifically underexpressed in lymphoma. (A) BDP1 expression in Brune lymphoma [22] (Burkitt’s lymphoma vs. normal), gene rank of 25 (top 1%), p-value = 1.54 × 10⁻¹¹, fold change of −2.148, n = 67. (B) BDP1 expression in Eckerle lymphoma [23] (anaplastic large-cell lymphoma, ALK-positive vs. normal), gene rank of 190 (top 1%), p-value = 1.67 × 10⁻⁶, fold change of −2.635, n = 64. Heat maps denoting underexpression of the TFIIIB subunit BDP1 (C,E) in the Brune [22] and Eckerle [23] lymphoma datasets are specific. BRF1 and BRF2 were significantly overexpressed exclusively in the Brune dataset (D). Only BRF2 was significantly overexpressed in the Eckerle dataset (F). The Oncomine™ Platform (Thermo Fisher, Ann Arbor, MI, USA) was used for analysis and visualization.

Figure 3.
Heat map identifies BDP1 expression as significantly underexpressed in BL and ALK+ ALCL. Using the Steidl lymphoma [41] concept cluster (Oncomine cluster-ID n9239), we queried the Brune [22] and Eckerle [23] lymphoma datasets to identify genes with the top median gene rank that are significantly over- and underexpressed. (A) BDP1 (p = 1.54 × 10⁻¹¹) was significantly underexpressed in BL vs. normal (log2 median-centered intensity), with a median gene rank of 25 and −2.15-fold change. The top genes identified as significantly underexpressed are labeled with median gene rank, p-value, and fold change in gene expression. (B) Identification of significantly overexpressed genes in BL using the same parameters identified in (A). (C) BDP1 (p = 1.67 × 10⁻⁶) was significantly underexpressed in ALK+ ALCL vs. normal (log2 median-centered intensity), with a median gene rank of 190 and −2.63-fold change. The top genes identified as significantly underexpressed are labeled with median gene rank, p-value, and fold change in gene expression. (D) Identification of significantly overexpressed genes in ALK+ ALCL using the same criteria applied in (C). The Oncomine™ Platform (Thermo Fisher, Ann Arbor, MI, USA) was used for analysis and visualization.


Figure 4.
Coexpression analysis of BDP1, KLF4, MYC, BCL6, FOXP1, and E3F4 in ALK+ ALCL. Under- (A,B) overexpression of BDP1, KLF4, MYC, BCL6, FOXP1, and E3F4 in ALK+ ALCL. The analysis was performed using the Eckerle lymphoma dataset [23]. Gene rank, fold change in expression, and p-values are indicated. The Oncomine™ Platform (Thermo Fisher, Ann Arbor, MI, USA) was used for analysis and visualization.

Figure 5.
BDP1 expression in activated B-cell (ABC) diffuse large B-cell lymphoma (DLBCL) correlates with clinical outcomes. BDP1 expression was significantly altered in ABC DLBCL recurrence at 1 (A) and 3 (B) years. In addition, in ABC DLBCL, BDP1 expression was significantly altered in patients who died in year 1 (C) and year 3 (D). Clinical outcomes analyses were performed using the Shaknovich lymphoma dataset [24], n = 69. The Oncomine™ Platform (Thermo Fisher, Ann Arbor, MI, USA) was used for analysis and visualization.

Figure 6.
Correlation of ABC DLBCL biomarkers and BDP1 expression with clinical outcomes. BDP1 expression and ABC DLBCL biomarker expression were significantly altered in ABC DLBCL recurrence at 1 (A) and 3 (B) years. ABC DLBCL biomarker and BDP1 expression were significantly altered in patients who died in year 1 (C) and year 3 (D). Clinical outcomes analyses were performed using the Shaknovich lymphoma dataset [24], n = 69. The Oncomine Platform (Thermo Fisher, Ann Arbor, MI, USA) was used for analysis and visualization.


Table 1.
Public datasets used in this study. Study descriptions and hyperlinks to datasets are provided.
Table 1.
Public datasets used in this study. Study descriptions and hyperlinks to datasets are provided.
| Dataset (Hyperlink to Public Dataset) | Study Description | Reference |
|---|---|---|
| Brune | Forty-two (42) malignant lymphoma samples, including 11 Hodgkin’s lymphoma, 11 diffuse large B-cell lymphoma, 5 nodular lymphocyte predominant Hodgkin’s lymphoma, 5 follicular lymphomas, 5 Burkitt’s lymphoma, and 4 T-cell/histiocyte-rich large B-cell lymphoma samples, were analyzed. In addition, 25 normal B-cell samples of various types were included in this analysis. | [22] |
| Eckerle | Twenty-three (23) lymphoma samples, including 4 classical Hodgkin’s lymphoma, 7 primary cutaneous anaplastic large-cell lymphoma, and 12 anaplastic large-cell lymphoma samples (including 3 cell lines), were analyzed. | [23] |
| Shaknovich | Forty (40) germinal center B-cell-like diffuse large B-cell lymphoma, 20 activated B-cell-like diffuse large B-cell lymphoma, and 9 diffuse large B-cell lymphoma samples were analyzed. | [24] |
Table 2.
Transcription factors significantly altered in BL and ALK+ ALCL known to interact with the SANT domain of BDP1.
Table 2.
Transcription factors significantly altered in BL and ALK+ ALCL known to interact with the SANT domain of BDP1.
| Transcription Factor | Over- or Underexpressed | Interaction with SANT Domain | References |
|---|---|---|---|
| HDAC4 | Overexpressed | Y | [43] |
| RCOR3 | Overexpressed/Underexpressed | Y | [44] |
Table 3.
Identification of transcription factors deregulated in NHL with putative transcription factor binding sites in the BDP1 promoter.
Table 3.
Identification of transcription factors deregulated in NHL with putative transcription factor binding sites in the BDP1 promoter.
| Transcription Factor | Location in the BDP1 Promoter Relative to TSS | References |
|---|---|---|
| KLF4 | −734, −593, −553, −459, −291, | [51] |
| MYC | −582, −581 | [52] |
| BCL6 | −985, −936, −384, −362, −287, −276, −173 | [53] |
| FOXP1 | −876, −802, −747, −427, −388 | [54] |
| E2F4 | 526, −470, −15, 54, 74 | [55] |
Publisher’s Note: MDPI stays neutral with regard to jurisdictional claims in published maps and institutional affiliations. |
© 2022 by the authors. Licensee MDPI, Basel, Switzerland. This article is an open access article distributed under the terms and conditions of the Creative Commons Attribution (CC BY) license (https://creativecommons.org/licenses/by/4.0/).
Share and Cite
MDPI and ACS Style
Cabarcas-Petroski, S.; Schramm, L. BDP1 Expression Correlates with Clinical Outcomes in Activated B-Cell Diffuse Large B-Cell Lymphoma. BioMedInformatics 2022, 2, 169-183. https://0-doi-org.brum.beds.ac.uk/10.3390/biomedinformatics2010011
AMA Style
Cabarcas-Petroski S, Schramm L. BDP1 Expression Correlates with Clinical Outcomes in Activated B-Cell Diffuse Large B-Cell Lymphoma. BioMedInformatics. 2022; 2(1):169-183. https://0-doi-org.brum.beds.ac.uk/10.3390/biomedinformatics2010011
Chicago/Turabian StyleCabarcas-Petroski, Stephanie, and Laura Schramm. 2022. "BDP1 Expression Correlates with Clinical Outcomes in Activated B-Cell Diffuse Large B-Cell Lymphoma" BioMedInformatics 2, no. 1: 169-183. https://0-doi-org.brum.beds.ac.uk/10.3390/biomedinformatics2010011