Article

The Use of the Random Number Generator and Artificial Intelligence Analysis for Dimensionality Reduction of Follicular Lymphoma Transcriptomic Data

1
Department of Pathology, School of Medicine, Tokai University, 143 Shimokasuya, Isehara 259-1193, Japan
2
Department of Clinical Sciences, College of Medicine, University of Sharjah, Sharjah P.O. Box 27272, United Arab Emirates
3
Division of Surgery and Interventional Science, University College London, Gower Street, London WC1E 6BT, UK
*
Author to whom correspondence should be addressed.
Submission received: 28 March 2022 / Revised: 20 April 2022 / Accepted: 25 April 2022 / Published: 27 April 2022

Abstract

:
Follicular lymphoma (FL) is one of the most frequent subtypes of non-Hodgkin lymphomas. This research predicted the prognosis of 184 untreated follicular lymphoma patients (LLMPP GSE16131 series), using gene expression data and artificial intelligence (AI) neural networks. A new strategy based on the random number generation was used to create 120 different and independent multilayer perceptron (MLP) solutions, and 22,215 gene probes were ranked according to their averaged normalized importance for predicting the overall survival. After dimensionality reduction, the final neural network architecture included (1) newly identified predictor genes related to cell adhesion and migration, cell signaling, and metabolism (EPB41L4B, MOCOS, SPIN2A, BTD, SRGAP3, CTNS, PRB1, L1CAM, and CEP57); (2) the international prognostic index (IPI); and (3) other relevant immuno-oncology, immune microenvironment, and checkpoint markers (CD163, CSF1R, FOXP3, PDCD1, TNFRSF14 (HVEM), and IL10). The performance of this neural network was good, with an area under the curve (AUC) of 0.89. A comparison with other machine learning techniques (C5 tree, logistic regression, Bayesian network, discriminant analysis, KNN algorithms, LSVM, random trees, SVM, tree-AS, XGBoost linear, XGBoost tree, CHAID, Quest, C&R tree, random forest, and neural network) was also made. In conclusion, the overall survival of follicular lymphoma was predicted with a neural network with high accuracy.

1. Introduction

Follicular lymphoma (FL) is a tumor of the immune system that is derived from germinal center B lymphocytes, which include both centrocytes (small cleaved follicular center cells), and centroblasts (large noncleaved cells). Histologically, it is also characterized by a follicular (nodular) growth pattern in most of the cases [1,2]. Centrocytes and centroblasts form the neoplastic follicles, which also include a tumoral immune microenvironment characterized by a variable infiltration of T lymphocytes (CD4+ helper, PD-1 (PDCD1)+follicular T helper cells (TFH cells), FOXP3+regulatory T (Tregs), and CD8+ cytotoxic), follicular dendritic cells, and tumor-associated macrophages (M2-like TAMs) that express CD163, CSF1R, and HVEM (TNFRSF14) [2,3,4,5].
The pathogenesis of FL is still not understood [3,4,5]. The overexpression of the BCL2 oncogene due to translocation t(14;18) is identified in around 85% of the cases, but other factors are involved in the neoplastic transformation, including acquired mutations such as chromatin-modifying enzymes [6,7].
FL is the second most frequent indolent non-Hodgkin lymphoma (NHLs), which is characterized by a survival without treatment of several years. FL accounts for 35% of NHLs, with an estimated frequency of 3.18 cases per 100,000 people, and it affects middle-aged individuals [5,8,9]. The clinical course of FL is variable. While some patients can be left without treatment for five years or more, others who have a more disseminated disease and rapid tumor growth require treatment sooner [2,5,10,11]. At the time of diagnosis, the FL international prognostic index (FLIPI) [12] and the PRIMA prognostic index (PRIMA-PI) [13] are two of the most frequently used measures [5]. Nevertheless, identifying which patients are at higher risk of disease progression and exitus still requires further investigation.
Artificial neural networks (ANNs) are a subset of machine learning that are inspired by the human brain, simulating the neuronal network. The structure of ANNs comprises an input layer, one or more hidden layers, and an output layer. Each node (the artificial neuron) is connected to another and has an associated weight and threshold. There are several types of ANNs. The perceptron is the oldest. This research used feedforward neural networks, or multilayer perceptrons (MLPs) [14].
Because neural networks use random numbers, they create a different model by each execution. If you wanted to replicate a result of a neural network accurately, four conditions should be fulfilled: (1) the same data order, (2) the same variable order, (3) the same procedure setting, and (4) the same initialization value for the random number generator.
The MLP procedure uses random number generation during the random assignment of partitions, random subsampling for initialization of synaptic weights, random subsampling for automatic architecture selection, and the simulated annealing algorithm used in weight initialization and automatic architecture selection [15].
The main aim of the work was to take advantage of the random number generator to obtain multiple (n = 120) different and independent neural network solutions. The MLP procedures correlated the gene expression of follicular lymphoma with the clinicopathological features of the patients. The gene expression included all the genes of the array. Using this approach, after averaging the normalized importance for predicting the overall survival, the most relevant markers were identified.

2. Materials and Methods

Multilayer perceptron analyses were performed as described previously [16,17,18,19,20,21,22,23]. In summary, the multilayer perceptron architecture was composed of an input layer, a hidden layer, and an output layer. The input layer included the whole set of genes of the array (method 1, 22,215 nodes), and used the standardized rescaling method for covariates (i.e., predictors, genes). The hidden layer had 1 layer of nodes and used the hyperbolic tangent activation function. The number of nodes of the hidden layer ranged from 1 to 50, and it was automatically computed to find the best architecture. The output layer had two nodes, one for the overall survival output of the dead and another for the alive, and used the softmax activation function.
The cases were randomly assigned to a training set (70%) and test set (30%). A holdout set was not used. In the final model, the type of training was batch, with a scaled conjugate gradient optimization algorithm. The training options were the following: initial lambda (0.0000005), initial sigma (0.00005), interval center (0), interval offset (±0.5)
The gene expression data of follicular lymphoma corresponded to the publicly available GSE16131 dataset (Affymetrix GPL96/97, HG-U133A/B; Affymetrix Inc., Santa Clara, CA, 95051-0704 USA). This series comprised 184 untreated patients, with diagnostic biopsies from fresh-frozen tumor lymph nodes. This series was last updated on 10 August 2018. The data were analyzed using the microarray suite version 5.0 (MAS 5.0) using the Affymetrix (ThermoFisher, Waltham, WA, USA), default settings and global scaling as the normalization method. The trimmed mean target intensity of each array was arbitrarily set to 500. The data were normalized and log2 transformed. Each node of the input layer corresponded to one gene probe (22,215 probes). For the final integrative analysis, each node corresponded to one gene; the gene probes were collapsed using the maximum expression to obtain one gene expression value of each gene.
The MLP procedure was repeated 120 times (because of the random number generator, 120 different and independent solutions were calculated), and the results were averaged to obtain the final neural network solution. The genes were ranked according to their averaged normalized importance for predicting the overall survival outcome.
Additional statistics included overall survival analysis using Cox regression with the method enter and backward conditional (IBM SPSS Statistics for Windows, Version 26.0. Armonk, NY: IBM Corp).
The clinicopathological characteristics of the series were as follows: age > 60 years (61/182, 33.5%), stage > 2 (129/180, 71.7%), extranodal sites > 1 (24/184, 13%), LDH level ratio > 1 (46/160, 28.7%), IPI score 2–3 (74/160, 46.3%), immune response ratio 2:1 high (≥0.97) (48/184, 26.1%). The cases were mainly BCL2/IGH translocation (14;18) positive (147/164, 89.6%).
The analysis was performed in a desktop workstation equipped with an AMD Ryzen 9 5900X 12-Core Processor (3.70 GHz, 16.0 GB of RAM), and an Nvidia GeForce RTX 3060 Ti GPU.

3. Results

The summary of the procedure and results is shown in Figure 1.
The analysis took advantage of the random number generator to create 120 different and independent MLP neural network solutions. The MLP was characterized by 22,215 input nodes (gene probes) and 2 output nodes (overall survival outcome, dead vs. alive). Each solution ranked the 22,215 gene probes according to their normalized importance for predicting the overall survival. Once the normalized importances for each gene probe were averaged, 1 solution/model remained. Further dimensionality reduction led to 17 gene probes. The explainability of the model relied on Cox regression analyses, Hazar Risks, and correlation with the International Prognostic Index as well as the Immune Response signatures (Explainable Artificial Intelligence (XAI)).

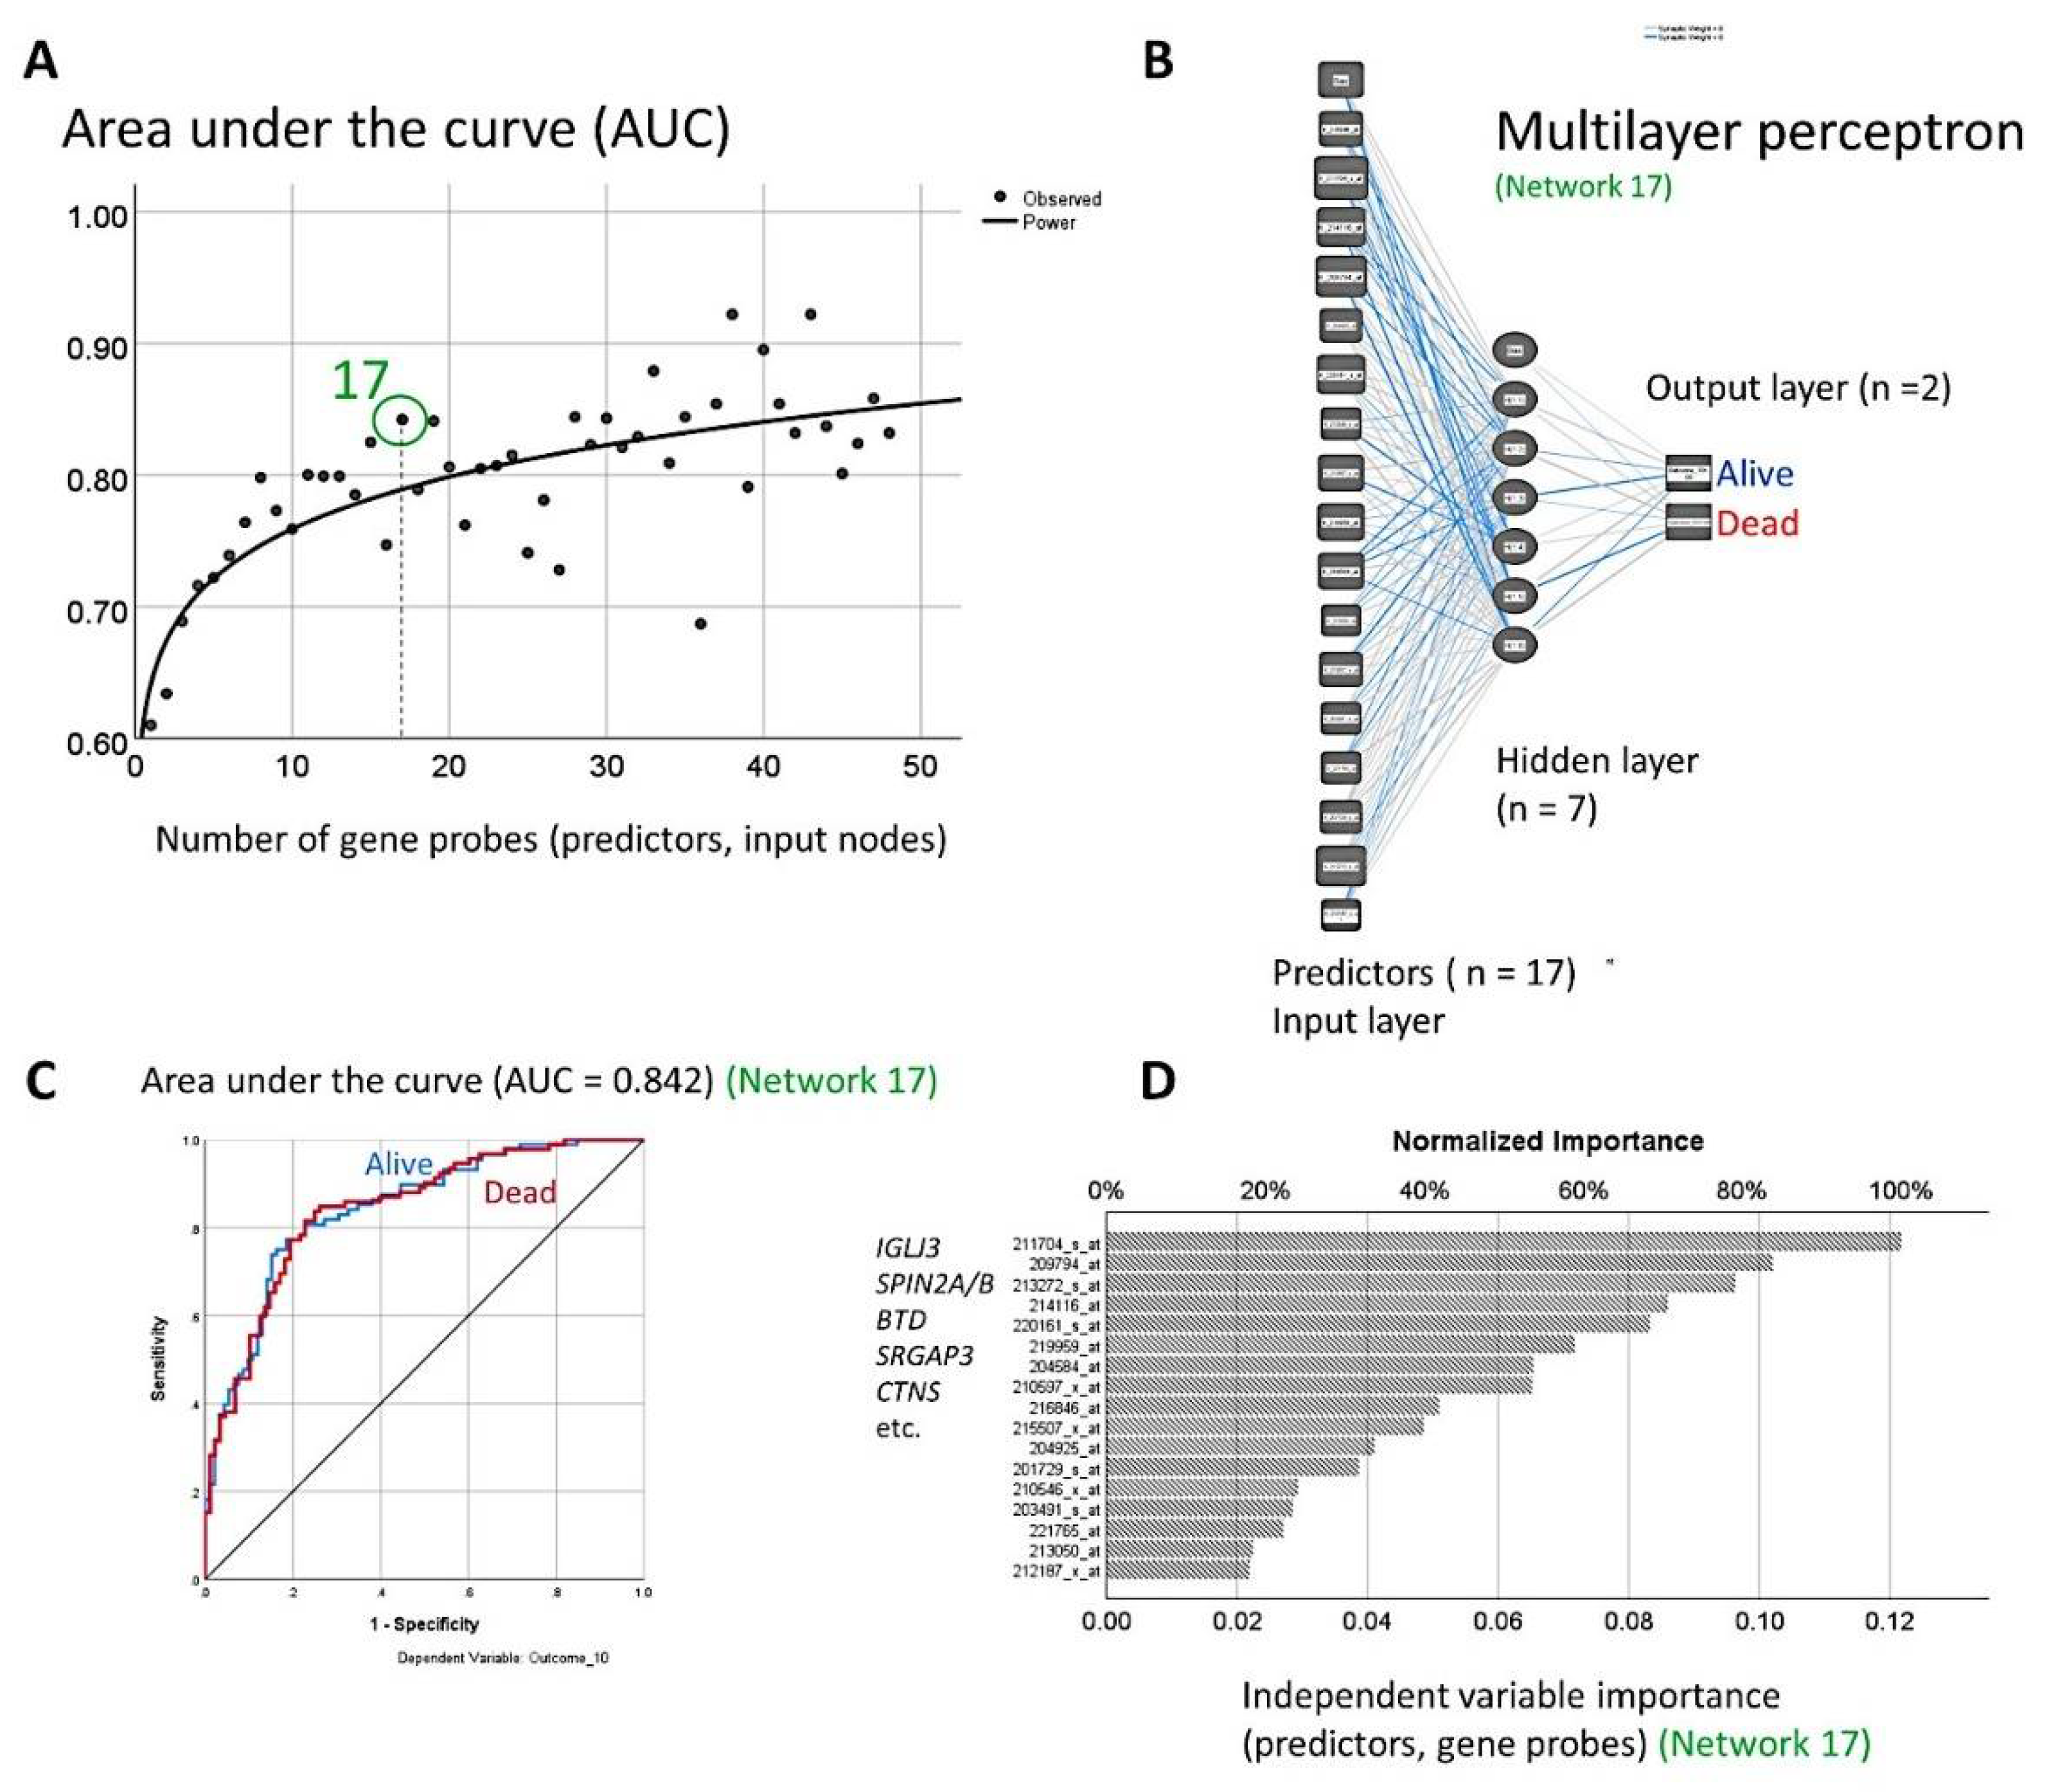
3.1. Generation of 120 Different Predictive Models for Overall Survival Using MLP Neural Networks

Based on the gene expression of 22,215 gene probes, an MLP analysis was repeated 120 times to predict the overall survival outcome (dead vs. alive). The results of each 120 MLPs included the network structure (diagram and synaptic weights), the network performance (model summary, classification results, ROC curve, cumulative gains chart, lift chart, predicted by observed chart, and residual by predicted chart), and the independent variable (i.e., gene probes, predictors) independent variable importance analysis. As a result, the 22,215 probes were ranked according to their normalized importance for predicting the overall survival outcome. In total, 120 ranks were obtained.
Figure 2 shows the variability of the normalized importance for the top 10 most important probes and the bottom 10 less relevant probes based on the normalized importance values.
Normalized importance of the top 10 most important gene probes against the bottom 10 least relevant ones. The MLP analysis was repeated 120 times, and all the gene probes were ranked according to their normalized importance for predicting the overall survival outcome (dead vs. alive). Each MLP analysis created a different valid prognostic model because of the random number generation process. This figure shows how the normalized importance for the top 10 gene probes had higher variability than the top least relevant probes. For instance, for the most relevant probe (211748_x_at, num 1), the normalized importance ranged from 0.25 to 1, with a range of 0.75, median of 0.64, and average of 0.63 ±0.24 STD. For the least relevant probe (204409_s_at, num. 22,215), the normalized importance ranged from 0.045 to 0.27, with a range of 0.22, median of 0.12, and average of 0.12 ±0.05 STD. For each gen probe, the 120 values of the normalized importance were averaged and ranked to create a final prognostic model.
For each probe, the 120 normalized importance values were averaged. Finally, all the 22,215 probes were ranked according to their averaged normalized importance for predicting the overall survival. The top 5 probes more relevant for prediction were 211748_x_at (averaged normalized importance 0.63), 212187_x_at (0.61), 219971_at (0.59), 203788_s_at (0.59), and 203892_at (0.57).
The correlations between the top 10 gene probes were tested using a covariance matrix. The results showed that some gene probes had positive values (e.g., 211748_x_at and 212187_x_at had a covariance of 0.28). Therefore, both variables tend to increase or decrease in tandem. The covariance matrix is shown in Table A1.
Of note, the differential gene expression was also analyzed using the GEO2R software of the NCBI under the standard setup (GPL96). The groups were defined according to the follow-up status: (overall survival) dead vs alive. The significance level cut-off was 0.05, the volcano and MA plot contrasts were alive vs dead, and the adjustment to the p-values used the Benjamini and Hochberg false discovery rate. The results showed significant p values, but the adjusted p values were not significant. The 5th most significant gene probes were 216965_x_at, 220650_s_at, 216542_x_at, 211130_x_at, and 221600_s_at that in the MLP neural network had a rank based on the normalized importance (NI) of 16,193 of 22,215 (0.23 NI), 2,709 (0.32 NI), 7,252 (0.27 NI), 3,641 (0.3 NI), and 11,666 (0.25 NI), respectively. Generally, this method failed to provide useful results for our situation. Therefore, our MLP neural network strategy is a more promising analysis strategy.

3.2. Dimensionality Reduction for Predicting the Overall Survival

The 100 topmost important gene probes were selected from the previous step, and a survival analysis was undertaken for overall survival using Cox regression, with the method backward stepwise (conditional LR). In the last step, num. 53, only 48 gene probes remained in the model. Next, an MLP analysis for overall survival was performed using the 48 gene probes, and the gene probes were ranked according to their normalized importance for predicting the overall survival (the performance of this MLP neural network was good, with an area under the curve of 0.832) (Table A2).
Further dimensionality reduction consisted of searching for the minimal number of gene probes necessary to obtain the highest area under the curve (AUC) using an MLP analysis: the optimal minimum number of genes were using the first 17th gene probes that provided an AUC of 0.842. The 17 genes were the following: IGLJ3, SPIN2A/B, BTD, SRGAP3, CTNS, EPB41L4B, CTAG1A, PRB1, MOCOS, L1CAM, COBL, 215507_x_at, CEP57, UGCG, KIAA0100, TMEM159, and PTGDS (Figure 3).
Based on 48 gene probes previously identified using the MLP neural network and Cox regression analysis, the minimal reasonable (defined as AUC > 0.8) number of gene probes to predict the overall survival was identified with multiple MLPs. With 17 genes (A) an MLP neural network (B) predicted the overall survival outcome (dead vs. alive) with an area under the curve (AUC) of 0.842 (C). The most relevant genes according to the normalized importance for predicting the overall survival were IGLJ3, SPIN2A/B, BTD, SRGAP3, and CTNS (D).

3.3. Correlation with the International Prognostic Index (IPI) and the Immune Response (IR)

The prognostic value for predicting the overall survival of the set of 17 genes was correlated with other known follicular lymphoma prognostic markers, including the International Prognostic Index (IPI) score and the Immune Response (IR). The analysis was performed using Cox regression for overall survival, with the gene expression of the 17 gene probes, IPI, and the IR (method, backward conditional). In the final model (step 14), only IPI, IR, and four gene probes kept the significance: high IPI (Hazard Risk (HR) = 3.3, p < 0.001), IR type 2 (HR = 3.0, p < 0.001), SRGAP3 (HR = 0.47, p = 0.006), PRB1 (HR = 1.47, p < 0.001), L1CAM (HR = 0.7, p = 0.016), and CEP57 (HR = 0.654, p < 0.001).

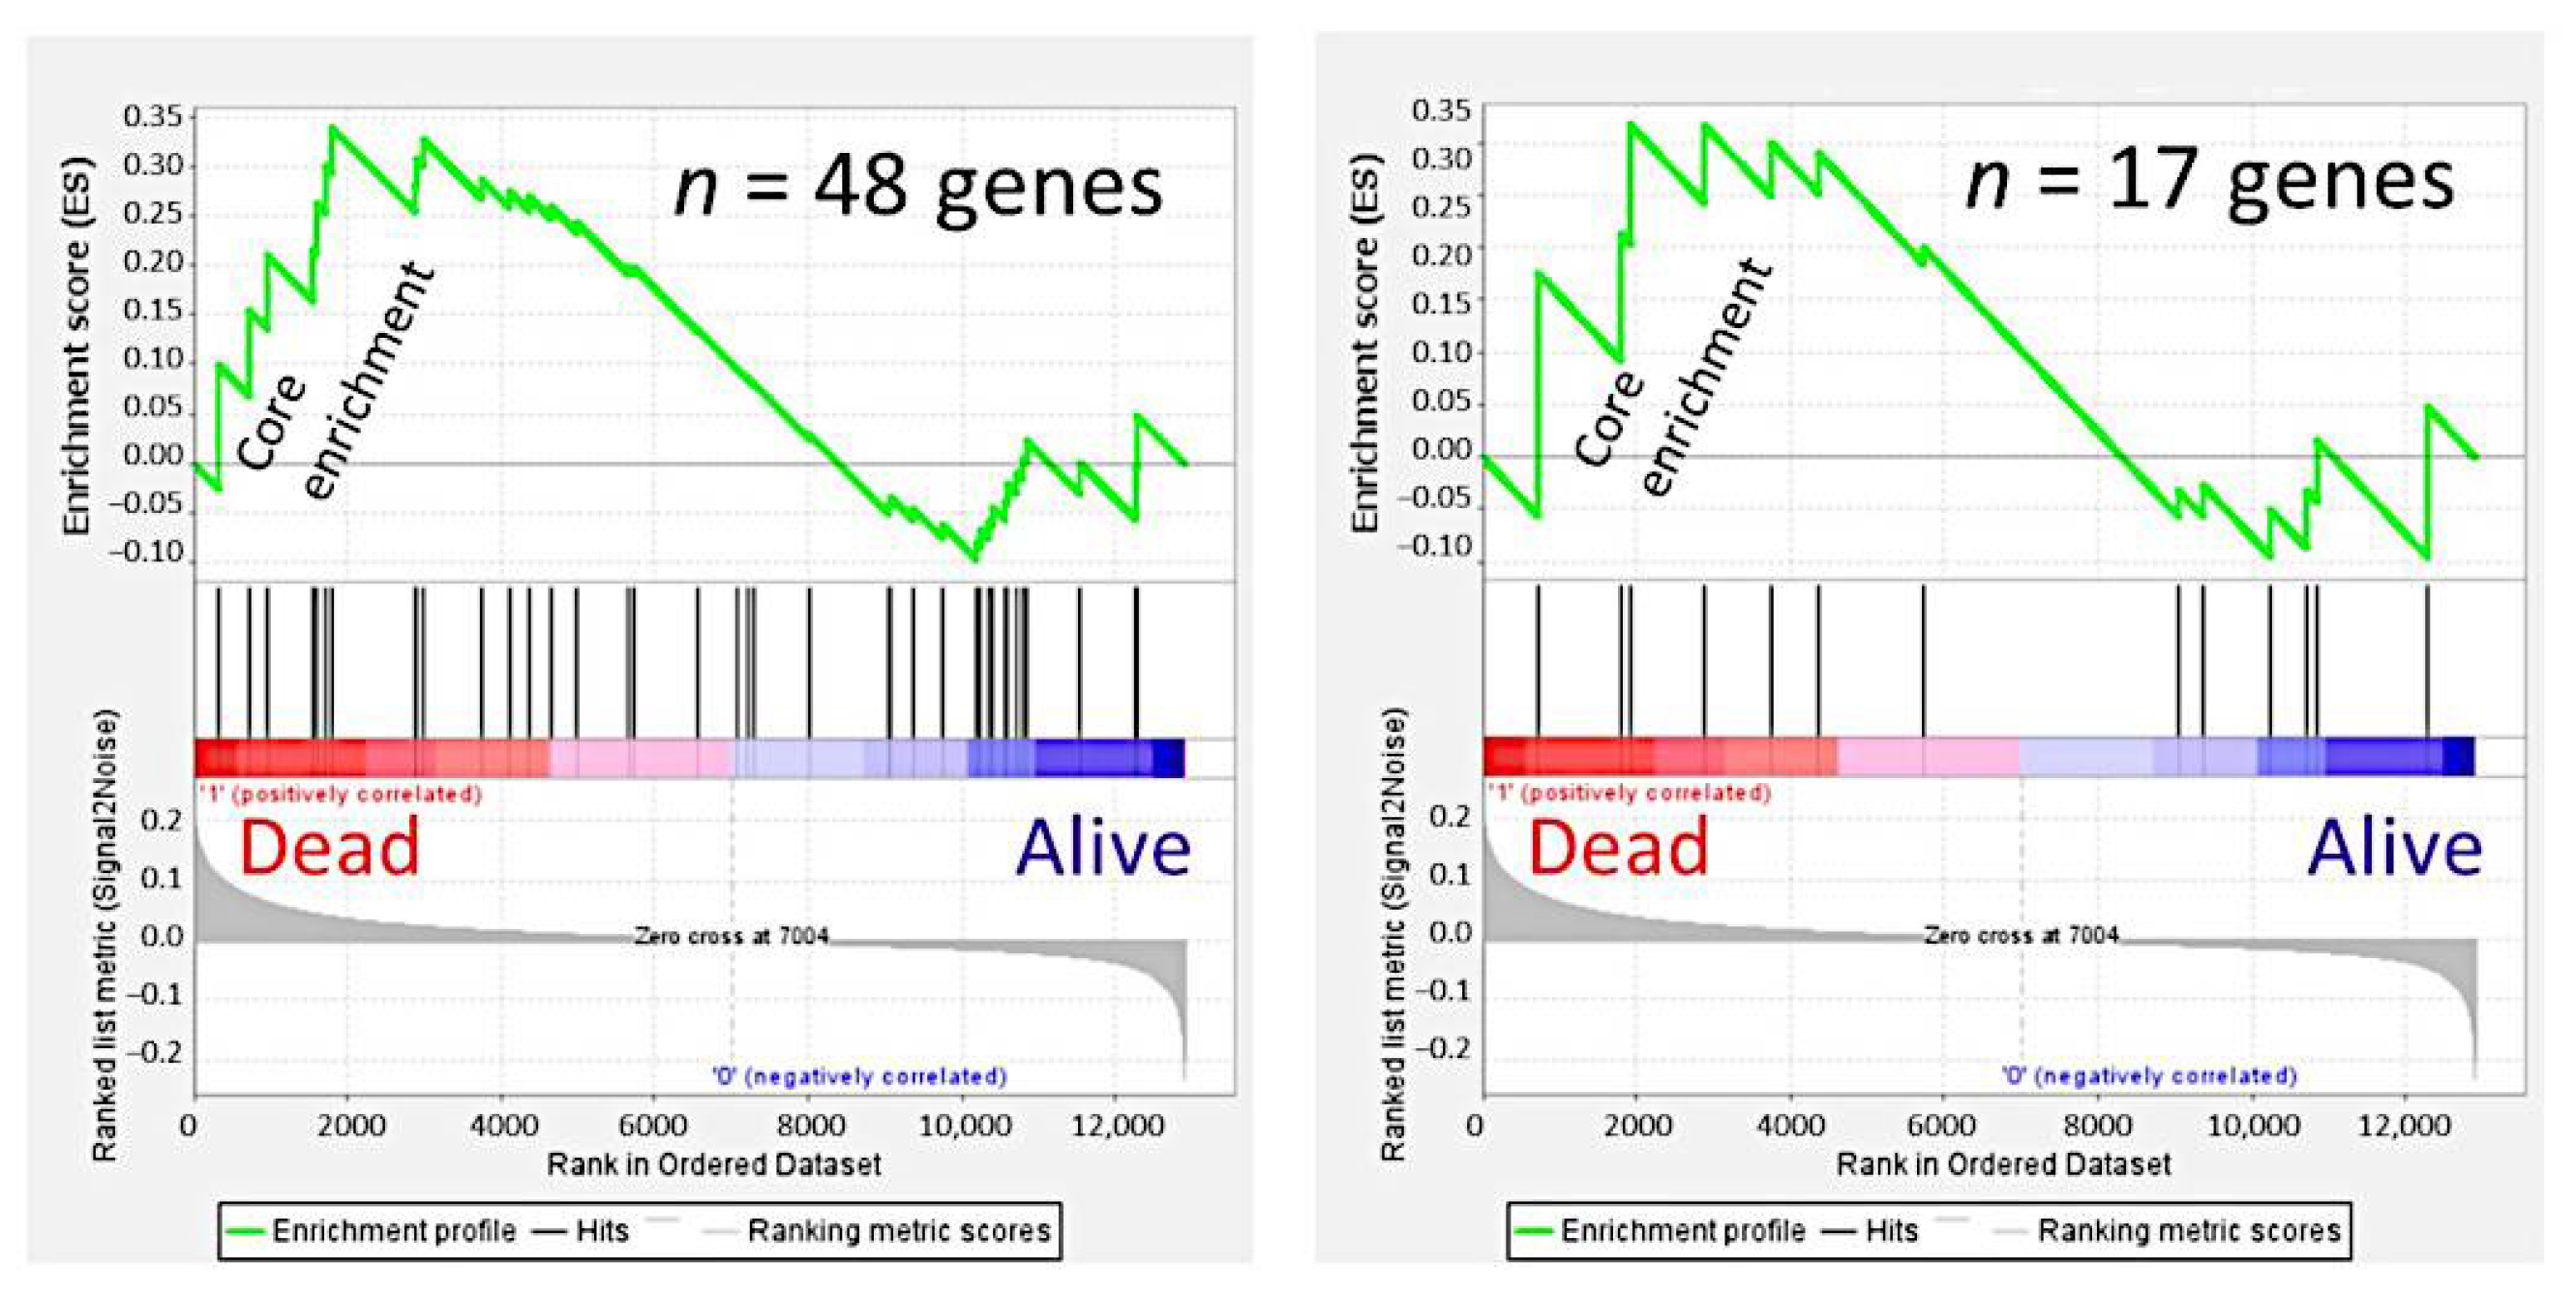
3.4. Gene Set Enrichment Analysis (GSEA)

The prognostic values of the highlighted 48 and 17 gene sets were evaluated using the Gene Set Enrichment Analysis (GSEA) technique, in the same database. In case of genes with multiple probes, the probes were collapsed to the maximum expression values. The GSEA technique showed enrichment toward the dead phenotype of the overall survival (Figure 4).
The GSEA technique was used to confirm the results of the MLP neural network and the Cox regression analysis. The GSEA plots showed enrichment of the part of the genes toward the overall survival outcome of the dead. When using the set of 17 genes, in the core enrichment the EPB41L4B, MOCOS, and SPIN2A genes were found. Of note, the Hazard Risks of these genes were 2.9, 2.0, and 1.9 in the Cox regression analysis (Table A1).

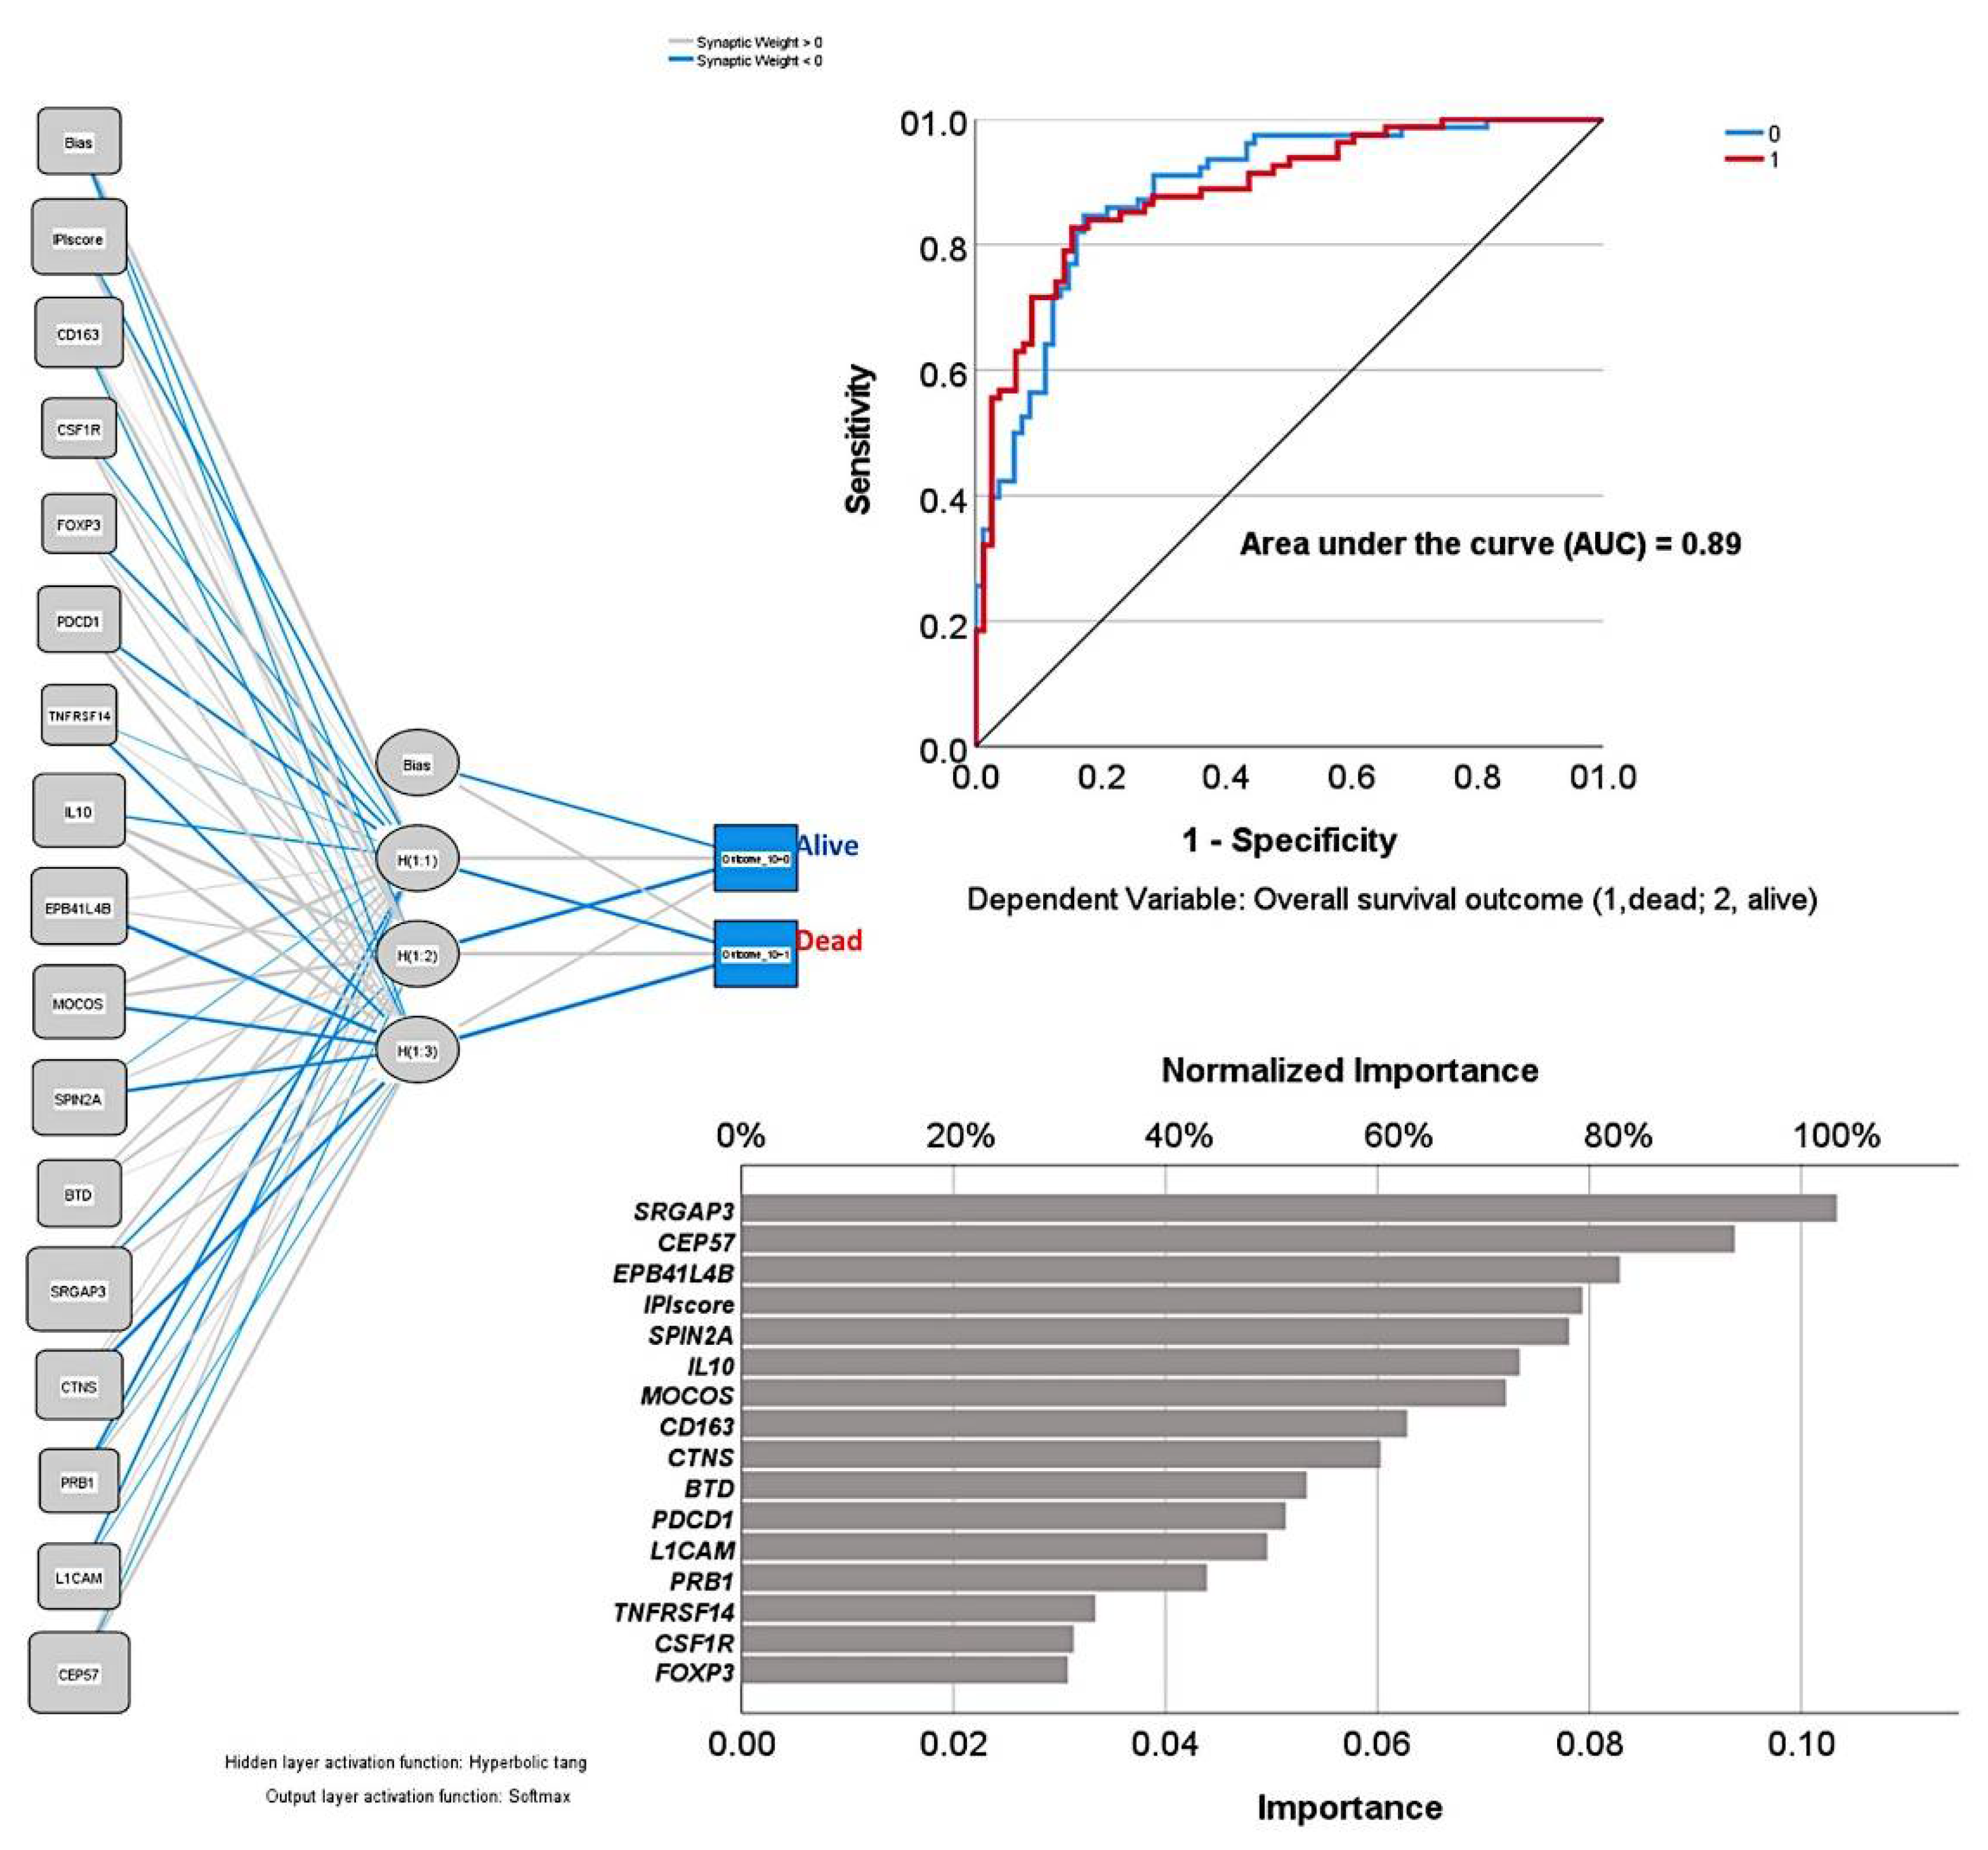
3.5. Final Integrative Analysis

A final integrative analysis was performed using an MLP neural network. The input layer included the previously highlighted predictor genes (EPB41L4B, MOCOS, SPIN2A, BTD, SRGAP3, CTNS, PRB1, L1CAM, and CEP57), the international prognostic index (IPI), and other relevant genes of the immune microenvironment and immune response (CD163, CSF1R, FOXP3, PDCD1, TNFRSF14, and IL10). In this analysis, each gene had a gene expression value which corresponded to the collapsed maximum gene expression in the case of multiple probes for one gene symbol. The performance of this neural network was good, with an area under the curve (AUC) of 0.89. The genes and IPI were ranked according to their normalized importance for predicting the overall survival of the patients (Figure 5). The most relevant were SRGAP3, CEP57, EPB41L4B, the international prognostic index (IPI), and SPIN2A, IL10, MOCOS and CD163 (normalized importance >60%).
A final overall survival model was created using the previously highlighted genes, the international prognostic index (IPI), and relevant genes of the immune response and microenvironment. The performance of this network was good, with an area under the curve (AUC) of 0.89. In the model, the most relevant gene was SRGAP3, which had an importance of 0.103 and a normalized importance of 100%. It was followed by CEP57, with importance of 0.094 and normalized importance of 90.7%.
This final integrative analysis was based on the MLP neural network. Nevertheless, there are other machine learning methods that can also contribute to the modeling of the pathogenesis of follicular lymphoma. Therefore, the overall survival outcome (dead vs alive, target) was predicted using the same 16 variables (inputs) of the analysis of Figure 5. Among all available models, the overall survival prediction was tested using 16 methods including C5 Tree, logistic regression, Bayesian network, discriminant analysis, KNN algorithms, LSVM, random trees, SVM, Tree-AS, XGBoost linear, XGBoost tree, CHAID, Quest, C&R Tree, Random forest, and neural net. Among these, 10 models were successfully used. The models were ranked according to their overall accuracy for predicting the overall survival. The results are shown in Table 1.
The final integrative model of MLP neural network (Figure 5) was compared to other machine learning techniques.

4. Discussion

Follicular lymphoma is one of the most frequent non-Hodgkin lymphomas in Western countries. The pathogenesis of follicular lymphoma is still not fully understood. Currently, it is considered that the malignant transformation of follicular B lymphocytes is a complex, multistep process during which genetic and epigenetic modifications occur [24].
In adults, the development of follicular lymphoma starts with the overexpression of BCL2 due to the translocation with the immunoglobulin promoter/enhancer elements, the t(14;18)(q32;q21) [25]. In follicular lymphoma, other gene translocations are found such as BCL6 and MYC translocations that have prognostic relevance. For instance, the presence of BCL6 translocation and/or copy number gains of BCL6 is associated with a favorable prognosis [25]. Many other genetic lesions are identified in follicular lymphoma: 1p, 6q, 10q, and 17p copy number losses, and 1, 6p, 7, 8, 12q, X copy number gains, and 18q/dup [1,5,24]. Somatic mutations have also been identified, including mutations of KMT2D, CREBBP, EZH2, EP300, HIST1H1E, KMT2C, ARID1A, and SMARCA4 [6,24,25,26,27,28,29,30,31,32,33].
The tumor immune microenvironment, host immune response, and immune checkpoint are also relevant in the pathogenesis of follicular lymphoma. For example, we previously reported that high percentages of FOXP3+regulative T lymphocytes (Tregs) and high Programmed cell death protein 1 (PD-1)+follicular T lymphocytes (TFH cells) were associated with a good overall survival of the follicular lymphoma patients and higher risk of transformation to diffuse large B-cell lymphoma (DLBCL) [3,4]. Conversely, high frequencies of HVEM (TNFRSF14)+cells, mainly including macrophages and follicular lymphoma B centroblasts, but low B- and T-lymphocyte attenuator (BTLA) were associated with a poor overall survival [34]. Another marker related to macrophages [21], the Macrophage colony-stimulating factor 1 receptor (CSF1R) and interleukin-10 (IL10) were also associated with the prognosis of follicular lymphoma [35] and diffuse large B-cell lymphoma [36]. In the final model, the input nodes of the input layer of the MLP neural network included (1) immune microenvironment markers (i.e., CD163, CSF1R, FOXP3, PDCD1, TNFRSF14, and IL10); (2) the most relevant genes identified in the MLP neural network that had used the random number generator for the artificial intelligence analysis and dimensionality reduction (i.e., EPB41L4B, MOCOS, SPIN2A, BTD, SRGAP3, CTNS, PRB1, L1CAM, and CEP57); and (3) the international prognostic index (IPI) as the most relevant clinical variable. As a result, the neural network managed to predict the overall survival of the follicular lymphoma patients with high performance, with an area under the curve of 0.89. Therefore, this research managed to combine previously identified clinical and tumor immune microenvironment markers with newly highlighted genes. The biological functions of these genes are shown in Table 2. Generally, these genes had a function in cell adhesion and migration, cell signaling, and metabolism.
In our analysis setup, each time a neural network was performed produced a different result. To replicate the results exactly, the same procedure set up, the same order of the data, the same variable order, in addition to using the same initialization value for the random number generator, is necessary. In this study, all the parameters were the same except for the random number generator. The MLP procedure uses random number generation during the random assignment of partitions, random subsampling for the initialization of synaptic weights, random subsampling for automatic architecture selection, and the simulated annealing algorithm used in weight initialization and automatic architecture selection [14,15,16,19,22,37,38]. This methodology design is very similar to ensemble learning, such as random forest. As a result, 120 different and independent solutions were calculated to predict the overall survival outcome (dead vs alive). Therefore, 120 neural networks predicted the survival of the patients with different combinations of 22,215 gene probes. Since the dataset was the same for each calculation, the averaged solution may be the “most adequate” to explain the pathogenesis of follicular lymphoma. From an initial number of 22,215 gene probes, the dimensionality reduction strategy highlighted 48 genes. These genes represent the averaged solution of all MLP analyses. Therefore, these genes are expected to play an important role in the pathogenesis of follicular lymphoma. This fact was confirmed in the GSEA analysis and in the final MLP network, as shown in Figure 5. In summary, we took advantage of the random number generator to highlight new pathogenic markers of follicular lymphoma.

5. Conclusions

This research took advantage of the random number generator to create multiple different and independent artificial neural networks that after dimensionality reduction highlighted a small set of prognostic genes. A final model integrated these genes with known immune tumor microenvironment markers and the international prognostic index to create a neural network that predicted the overall survival of follicular lymphoma with high performance.

Author Contributions

Conceptualization, J.C.; methodology, J.C.; validation, R.H.; formal analysis, J.C.; writing—original draft preparation, J.C.; writing—review and editing, J.C.; supervision, N.N.; funding acquisition, J.C.; Investigation, Y.Y.K., M.M., S.H., S.T., H.I., Y.K. and A.I. All authors have read and agreed to the published version of the manuscript.

Funding

This research was funded to Joaquim Carreras by the Ministry of Education, Culture, Sports, Science and Technology (MEXT) and Japan Society for the Promotion of Science (JSPS), grant numbers KAKEN 15K19061 and 18K15100; and Tokai University School of Medicine, research incentive assistant plan, grant number 2021-B04. Rifat Hamoudi was funded by Al-Jalila Foundation (grant number AJF2018090), and University of Sharjah (grant number 1901090258).

Institutional Review Board Statement

The study was conducted according to the guidelines of the Declaration of Helsinki, and approved by the Institutional Review Board and the Ethics Committee of Tokai University, School of Medicine (protocol code IRB14R-080 and IRB20-156).

Informed Consent Statement

Informed consent was obtained from all subjects involved in the study, according to a protocol approved by the National Cancer Institute institutional review board.

Data Availability Statement

The gene expression data (GEO data sets) were obtained from the publicly available database of the NCBI resources webpage, located at https://0-www-ncbi-nlm-nih-gov.brum.beds.ac.uk/gds (last accessed on 25 March 2022).

Acknowledgments

I want to thank all the researchers and colleagues who contributed to the generation of the LLMPP GSE16131.

Conflicts of Interest

The authors declare no conflict of interest.

Appendix A

Table A1. Covariate matrix between the top 10 gene probes.
211748_x_at212187_x_at219971_at203788_s_at203892_at214461_at202540_s_at205272_s_at207436_x_at208791_at
211748_x_at0.3106
212187_x_at0.28170.2752
219971_at0.17350.16740.4121
203788_s_at−0.0123−0.0129−0.01060.2564
203892_at0.02890.02050.03660.03980.2449
214461_at0.03580.0197−0.01930.02130.00140.3596
202540_s_at−0.0227−0.0267−0.0402−0.0227−0.04870.00610.2111
205272_s_at0.01710.01660.0245−0.01390.3841−0.0534−0.11292.0909
207436_x_at−0.0199−0.0204−0.09590.0190−0.02610.01340.1088−0.06260.1878
208791_at0.30400.27440.1746−0.03920.03640.0512−0.01480.0290−0.01630.6622
Table A2. Correlation between the gene expression and the overall survival using Cox regression analysis and MLP neural network.
Num.Gene ProbeGene SymbolBp ValueHazard Risk (HR)95.0% CI for HRMLP
LowerUpperNI
1216846_atIGLJ32.0 2.35 × 10−77.5 3.5 16.1 1.000
2211704_s_atSPIN2A/B0.6 0.0830021.9 0.9 3.8 0.881
3214116_atBTD−1.6 7.6 × 10−80.2 0.1 0.4 0.876
4209794_atSRGAP3−1.1 0.0331090.3 0.1 0.9 0.839
5204925_atCTNS1.7 0.0002635.3 2.2 13.1 0.838
6220161_s_atEPB41L4B1.6 4.7 × 10−95.0 2.9 8.5 0.767
7210546_x_atCTAG1A1.0 3.23 × 10−62.7 1.8 4.0 0.757
8210597_x_atPRB11.0 1.46 × 10−52.7 1.7 4.3 0.701
9219959_atMOCOS0.7 0.0013772.0 1.3 3.0 0.689
10204584_atL1CAM−0.9 0.0006220.4 0.2 0.7 0.661
11213050_atCOBL−1.1 0.0015230.3 0.2 0.7 0.646
12215507_x_at-−0.5 0.0823790.6 0.4 1.1 0.645
13203491_s_atCEP57−0.5 0.0167440.6 0.4 0.9 0.629
14221765_atUGCG−0.4 0.0696690.7 0.5 1.0 0.599
15201729_s_atKIAA01003.1 6.79 × 10−622.4 5.8 86.5 0.547
16213272_s_atTMEM1591.3 0.0031463.8 1.6 9.4 0.525
17212187_x_atPTGDS1.9 0.0002116.7 2.4 18.2 0.521
18220600_atELP60.9 0.0026532.4 1.4 4.3 0.519
19205839_s_atBZRAP1−0.9 0.0155940.4 0.2 0.8 0.503
20204738_s_atKRIT1−1.3 0.0006190.3 0.1 0.6 0.493
21221196_x_atBRCC31.2 0.0019863.3 1.6 7.2 0.470
22215788_atCFAP74−0.7 0.025120.5 0.3 0.9 0.465
23203892_atWFDC21.3 0.0012883.6 1.6 7.7 0.459
24219349_s_atEXOC2−0.8 0.0458310.4 0.2 1.0 0.452
25208791_atCLU1.2 0.0001593.4 1.8 6.5 0.450
26215287_atSTRN0.9 0.0025452.4 1.4 4.2 0.443
27219361_s_atAEN1.6 0.0004054.8 2.0 11.4 0.439
28207436_x_atSORBS1−0.8 0.072320.4 0.2 1.1 0.436
29219815_atGAL3ST4−1.9 2.15 × 10−50.1 0.1 0.4 0.418
30215183_at-−1.3 0.0010.3 0.1 0.6 0.416
31207356_atDEFB4A−1.4 0.0009270.2 0.1 0.6 0.405
32218268_atTBC1D152.2 0.0001318.9 2.9 27.5 0.388
33215867_x_atCA12−1.8 4.6 × 10−50.2 0.1 0.4 0.342
34214876_s_atTUBGCP5−0.9 0.0008160.4 0.2 0.7 0.332
35213539_atCD3D−2.8 5.16 × 10−80.1 0.0 0.2 0.332
36207752_x_atPRB1−0.7 0.0023230.5 0.3 0.8 0.292
37210312_s_atIFT20−1.8 0.0023420.2 0.1 0.5 0.273
3841397_atZNF821−1.2 0.0008520.3 0.1 0.6 0.260
39204547_atRAB40B0.8 0.0195272.2 1.1 4.4 0.252
40214465_atORM11.3 1.14 × 10−53.7 2.1 6.6 0.242
41201131_s_atCDH1−0.7 0.0080310.5 0.3 0.8 0.231
42210039_s_atPRKCQ1.0 0.0890342.7 0.9 8.2 0.224
43207377_atPPP1R2P9−0.8 0.0373920.4 0.2 1.0 0.210
44206994_atCST40.7 0.0061941.9 1.2 3.1 0.200
45214408_s_atRFPL1S0.7 0.0144362.0 1.1 3.5 0.200
46216699_s_atKLK1−0.7 0.0457020.5 0.3 1.0 0.119
47221004_s_atITM2C−0.5 0.0776540.6 0.4 1.1 0.080
48211262_atPCSK6−1.0 0.027040.4 0.1 0.9 0.028
Cox regression analysis for predicting the overall survival. The analysis included as predictors the gene expression of the top 100 gene probes, previously identified as prognostic value in the multiple 120 MLP neural network analyses. A Cox regression, backward stepwise (conditional LR), correlated the gene expression of the 100 gene probes with the overall survival of the patients. As a result, 48 gene probes were identified. Additionally, the 48 gene probes were ranked according to their normalized importance (NI) for predicting the overall survival outcome using a MLP neural network. B, beta; SE, standard error; HR, hazard risk; MLP, multilayer perceptron; NI, normalized importance.

References

  1. Campo, E.; Swerdlow, S.H.; Harris, N.L.; Pileri, S.; Stein, H.; Jaffe, E.S. The 2008 WHO classification of lymphoid neoplasms and beyond: Evolving concepts and practical applications. Blood 2011, 117, 5019–5032. [Google Scholar] [CrossRef] [PubMed] [Green Version]
  2. Swerdlow, S.H.; Campo, E.; Pileri, S.A.; Harris, N.L.; Stein, H.; Siebert, R.; Advani, R.; Ghielmini, M.; Salles, G.A.; Zelenetz, A.D.; et al. The 2016 revision of the World Health Organization classification of lymphoid neoplasms. Blood 2016, 127, 2375–2390. [Google Scholar] [CrossRef] [PubMed] [Green Version]
  3. Carreras, J.; Lopez-Guillermo, A.; Fox, B.C.; Colomo, L.; Martinez, A.; Roncador, G.; Montserrat, E.; Campo, E.; Banham, A.H. High numbers of tumor-infiltrating FOXP3-positive regulatory T cells are associated with improved overall survival in follicular lymphoma. Blood 2006, 108, 2957–2964. [Google Scholar] [CrossRef] [PubMed]
  4. Carreras, J.; Lopez-Guillermo, A.; Roncador, G.; Villamor, N.; Colomo, L.; Martinez, A.; Hamoudi, R.; Howat, W.J.; Montserrat, E.; Campo, E. High numbers of tumor-infiltrating programmed cell death 1-positive regulatory lymphocytes are associated with improved overall survival in follicular lymphoma. J. Clin. Oncol. 2009, 27, 1470–1476. [Google Scholar] [CrossRef]
  5. Freedman, A.S.; Aster, J.C. Clinical Manifestations, Pathologic Features, Diagnosis, and Prognosis of Follicular Lymphoma. Available online: https://www.uptodate.com/contents/search (accessed on 23 February 2022).
  6. Morin, R.D.; Mendez-Lago, M.; Mungall, A.J.; Goya, R.; Mungall, K.L.; Corbett, R.D.; Johnson, N.A.; Severson, T.M.; Chiu, R.; Field, M.; et al. Frequent mutation of histone-modifying genes in non-Hodgkin lymphoma. Nature 2011, 476, 298–303. [Google Scholar] [CrossRef]
  7. Pastore, A.; Jurinovic, V.; Kridel, R.; Hoster, E.; Staiger, A.M.; Szczepanowski, M.; Pott, C.; Kopp, N.; Murakami, M.; Horn, H.; et al. Integration of gene mutations in risk prognostication for patients receiving first-line immunochemotherapy for follicular lymphoma: A retrospective analysis of a prospective clinical trial and validation in a population-based registry. Lancet Oncol. 2015, 16, 1111–1122. [Google Scholar] [CrossRef]
  8. Cossman, J.; Neckers, L.M.; Hsu, S.; Longo, D.; Jaffe, E.S. Low-grade lymphomas. Expression of developmentally regulated B-cell antigens. Am. J. Pathol. 1984, 115, 117–124. [Google Scholar]
  9. Morton, L.M.; Wang, S.S.; Devesa, S.S.; Hartge, P.; Weisenburger, D.D.; Linet, M.S. Lymphoma incidence patterns by WHO subtype in the United States, 1992–2001. Blood 2006, 107, 265–276. [Google Scholar] [CrossRef] [PubMed]
  10. Horning, S.J.; Rosenberg, S.A. The natural history of initially untreated low-grade non-Hodgkin’s lymphomas. N. Engl. J. Med. 1984, 311, 1471–1475. [Google Scholar] [CrossRef]
  11. Casulo, C.; Byrtek, M.; Dawson, K.L.; Zhou, X.; Farber, C.M.; Flowers, C.R.; Hainsworth, J.D.; Maurer, M.J.; Cerhan, J.R.; Link, B.K.; et al. Early Relapse of Follicular Lymphoma After Rituximab Plus Cyclophosphamide, Doxorubicin, Vincristine, and Prednisone Defines Patients at High Risk for Death: An Analysis From the National LymphoCare Study. J. Clin. Oncol. 2015, 33, 2516–2522. [Google Scholar] [CrossRef]
  12. Solal-Celigny, P.; Roy, P.; Colombat, P.; White, J.; Armitage, J.O.; Arranz-Saez, R.; Au, W.Y.; Bellei, M.; Brice, P.; Caballero, D.; et al. Follicular lymphoma international prognostic index. Blood 2004, 104, 1258–1265. [Google Scholar] [CrossRef] [PubMed] [Green Version]
  13. Alig, S.; Jurinovic, V.; Pastore, A.; Haebe, S.; Schmidt, C.; Zoellner, A.K.; Dreyling, M.; Unterhalt, M.; Hoster, E.; Hiddemann, W.; et al. Impact of age on clinical risk scores in follicular lymphoma. Blood Adv. 2019, 3, 1033–1038. [Google Scholar] [CrossRef] [PubMed] [Green Version]
  14. IBM Cloud Education, Neural Networks. 17 August 2020. Available online: https://www.ibm.com/cloud/learn/neural-networks (accessed on 23 February 2022).
  15. IBM Corporation. IBM SPSS Neural Networks 1989–2019; IBM Corporation, North Castle Drive: Armonk, NY, USA, 2019. [Google Scholar]
  16. Carreras, J.; Kikuti, Y.Y.; Miyaoka, M.; Hiraiwa, S.; Tomita, S.; Ikoma, H.; Kondo, Y.; Ito, A.; Nakamura, N.; Hamoudi, R. A Combination of Multilayer Perceptron, Radial Basis Function Artificial Neural Networks and Machine Learning Image Segmentation for the Dimension Reduction and the Prognosis Assessment of Diffuse Large B-Cell Lymphoma. AI 2021, 2, 106–134. [Google Scholar] [CrossRef]
  17. Carreras, J.; Kikuti, Y.Y.; Miyaoka, M.; Hiraiwa, S.; Tomita, S.; Ikoma, H.; Kondo, Y.; Ito, A.; Shiraiwa, S.; Hamoudi, R.; et al. A Single Gene Expression Set Derived from Artificial Intelligence Predicted the Prognosis of Several Lymphoma Subtypes; and High Immunohistochemical Expression of TNFAIP8 Associated with Poor Prognosis in Diffuse Large B-Cell Lymphoma. AI 2020, 1, 342–360. [Google Scholar] [CrossRef]
  18. Carreras, J.; Kikuti, Y.Y.; Roncador, G.; Miyaoka, M.; Hiraiwa, S.; Tomita, S.; Ikoma, H.; Kondo, Y.; Ito, A.; Shiraiwa, S.; et al. High Expression of Caspase-8 Associated with Improved Survival in Diffuse Large B-Cell Lymphoma: Machine Learning and Artificial Neural Networks Analyses. BioMedInformatics 2021, 1, 18–46. [Google Scholar] [CrossRef]
  19. Carreras, J.; Hiraiwa, S.; Kikuti, Y.Y.; Miyaoka, M.; Tomita, S.; Ikoma, H.; Ito, A.; Kondo, Y.; Roncador, G.; Garcia, J.F.; et al. Artificial Neural Networks Predicted the Overall Survival and Molecular Subtypes of Diffuse Large B-Cell Lymphoma Using a Pancancer Immune-Oncology Panel. Cancers 2021, 13, 6384. [Google Scholar] [CrossRef]
  20. Carreras, J.; Nakamura, N.; Hamoudi, R. Artificial Intelligence Analysis of Gene Expression Predicted the Overall Survival of Mantle Cell Lymphoma and a Large Pan-Cancer Series. Healthcare 2022, 10, 155. [Google Scholar] [CrossRef]
  21. Carreras, J.; Kikuti, Y.Y.; Miyaoka, M.; Roncador, G.; Garcia, J.F.; Hiraiwa, S.; Tomita, S.; Ikoma, H.; Kondo, Y.; Ito, A.; et al. Integrative Statistics, Machine Learning and Artificial Intelligence Neural Network Analysis Correlated CSF1R with the Prognosis of Diffuse Large B-Cell Lymphoma. Hemato 2021, 2, 182–206. [Google Scholar] [CrossRef]
  22. Carreras, J.; Hamoudi, R. Artificial Neural Network Analysis of Gene Expression Data Predicted Non-Hodgkin Lymphoma Subtypes with High Accuracy. Mach. Learn. Knowl. Extr. 2021, 3, 720–739. [Google Scholar] [CrossRef]
  23. Carreras, J.; Kikuti, Y.Y.; Miyaoka, M.; Hiraiwa, S.; Tomita, S.; Ikoma, H.; Kondo, Y.; Ito, A.; Nakamura, N.; Hamoudi, R. Artificial Intelligence Analysis of the Gene Expression of Follicular Lymphoma Predicted the Overall Survival and Correlated with the Immune Microenvironment Response Signatures. Mach. Learn. Knowl. Extr. 2020, 2, 647–671. [Google Scholar] [CrossRef]
  24. Brown, J.R.; Freedman, A.S.; Aster, J.C. Pathobiology of Follicular Lymphoma; UpToDate: Waltham, MA, USA, 2021. [Google Scholar]
  25. Ikoma, H.; Miyaoka, M.; Hiraiwa, S.; Yukie Kikuti, Y.; Shiraiwa, S.; Hara, R.; Kojima, M.; Ohmachi, K.; Ando, K.; Carreras, J.; et al. Clinicopathological analysis of follicular lymphoma with BCL2, BCL6, and MYC rearrangements. Pathol. Int. 2022; Online ahead of print. [Google Scholar] [CrossRef]
  26. Bodor, C.; Grossmann, V.; Popov, N.; Okosun, J.; O’Riain, C.; Tan, K.; Marzec, J.; Araf, S.; Wang, J.; Lee, A.M.; et al. EZH2 mutations are frequent and represent an early event in follicular lymphoma. Blood 2013, 122, 3165–3168. [Google Scholar] [CrossRef] [PubMed]
  27. Green, M.R. Chromatin modifying gene mutations in follicular lymphoma. Blood 2018, 131, 595–604. [Google Scholar] [CrossRef] [PubMed]
  28. Green, M.R.; Gentles, A.J.; Nair, R.V.; Irish, J.M.; Kihira, S.; Liu, C.L.; Kela, I.; Hopmans, E.S.; Myklebust, J.H.; Ji, H.; et al. Hierarchy in somatic mutations arising during genomic evolution and progression of follicular lymphoma. Blood 2013, 121, 1604–1611. [Google Scholar] [CrossRef] [PubMed] [Green Version]
  29. Green, M.R.; Kihira, S.; Liu, C.L.; Nair, R.V.; Salari, R.; Gentles, A.J.; Irish, J.; Stehr, H.; Vicente-Duenas, C.; Romero-Camarero, I.; et al. Mutations in early follicular lymphoma progenitors are associated with suppressed antigen presentation. Proc. Natl. Acad. Sci. USA 2015, 112, E1116–E1125. [Google Scholar] [CrossRef] [Green Version]
  30. Kridel, R.; Chan, F.C.; Mottok, A.; Boyle, M.; Farinha, P.; Tan, K.; Meissner, B.; Bashashati, A.; McPherson, A.; Roth, A.; et al. Histological Transformation and Progression in Follicular Lymphoma: A Clonal Evolution Study. PLoS Med. 2016, 13, e1002197. [Google Scholar] [CrossRef]
  31. Okosun, J.; Bodor, C.; Wang, J.; Araf, S.; Yang, C.Y.; Pan, C.; Boller, S.; Cittaro, D.; Bozek, M.; Iqbal, S.; et al. Integrated genomic analysis identifies recurrent mutations and evolution patterns driving the initiation and progression of follicular lymphoma. Nat. Genet. 2014, 46, 176–181. [Google Scholar] [CrossRef]
  32. Pasqualucci, L.; Dominguez-Sola, D.; Chiarenza, A.; Fabbri, G.; Grunn, A.; Trifonov, V.; Kasper, L.H.; Lerach, S.; Tang, H.; Ma, J.; et al. Inactivating mutations of acetyltransferase genes in B-cell lymphoma. Nature 2011, 471, 189–195. [Google Scholar] [CrossRef] [Green Version]
  33. Pasqualucci, L.; Khiabanian, H.; Fangazio, M.; Vasishtha, M.; Messina, M.; Holmes, A.B.; Ouillette, P.; Trifonov, V.; Rossi, D.; Tabbo, F.; et al. Genetics of follicular lymphoma transformation. Cell Rep. 2014, 6, 130–140. [Google Scholar] [CrossRef] [Green Version]
  34. Carreras, J.; Lopez-Guillermo, A.; Kikuti, Y.Y.; Itoh, J.; Masashi, M.; Ikoma, H.; Tomita, S.; Hiraiwa, S.; Hamoudi, R.; Rosenwald, A.; et al. High TNFRSF14 and low BTLA are associated with poor prognosis in Follicular Lymphoma and in Diffuse Large B-cell Lymphoma transformation. J. Clin. Exp. Hematop 2019, 59, 1–16. [Google Scholar] [CrossRef] [Green Version]
  35. Valero, J.G.; Matas-Cespedes, A.; Arenas, F.; Rodriguez, V.; Carreras, J.; Serrat, N.; Guerrero-Hernandez, M.; Yahiaoui, A.; Balague, O.; Martin, S.; et al. The receptor of the colony-stimulating factor-1 (CSF-1R) is a novel prognostic factor and therapeutic target in follicular lymphoma. Leukemia 2021, 35, 2635–2649. [Google Scholar] [CrossRef]
  36. Carreras, J.; Kikuti, Y.Y.; Hiraiwa, S.; Miyaoka, M.; Tomita, S.; Ikoma, H.; Ito, A.; Kondo, Y.; Itoh, J.; Roncador, G.; et al. High PTX3 expression is associated with a poor prognosis in diffuse large B-cell lymphoma. Cancer Sci. 2022, 113, 334–348. [Google Scholar] [CrossRef] [PubMed]
  37. Carreras, J.; Hamoudi, R.; Nakamura, N. Artificial Intelligence Analysis of Gene Expression Data Predicted the Prognosis of Patients with Diffuse Large B-Cell Lymphoma. Tokai J. Exp. Clin. Med. 2020, 45, 37–48. [Google Scholar] [PubMed]
  38. IBM. Troubleshooting. Available online: https://www.ibm.com/support/pages/can-i-make-same-model-neural-networks-spss (accessed on 23 February 2022).
Figure 1. Method and summary of the results.
Biomedinformatics 02 00017 g001
Figure 2. Variability of the normalized importance of gene probes. The top 10 most important probes had higher normalized importance variability (A) than the bottom less relevant probes (B), due to positive correlations between them.
Biomedinformatics 02 00017 g002
Figure 3. Minimal number of genes probes and dimensionality reduction strategy. Based on the 48 gene probes, further dimensionality reduction consisted of searching for the minimal number of gene probes necessary to obtain the highest area under the curve (AUC) using an MLP analysis (A). The optimal minimum number of genes were using the first 17th gene probes (B), which provided an AUC of 0.842 (C). The 17 genes were the following: IGLJ3, SPIN2A/B, BTD, SRGAP3, CTNS, EPB41L4B, CTAG1A, PRB1, MOCOS, L1CAM, COBL, 215507_x_at, CEP57, UGCG, KIAA0100, TMEM159, and PTGDS (D).
Biomedinformatics 02 00017 g003
Figure 4. Validation of the prognostic value using gene set enrichment analysis (GSEA).
Biomedinformatics 02 00017 g004
Figure 5. The final integrative model of the MLP neural network.
Biomedinformatics 02 00017 g005
Table 1. Modeling the overall survival outcome using other machine learning models.
Num.ModelOverall Accuracy (%)No. Fields UsedVariables Used in the Final Model
1XGBoost tree1001616
2Random trees97.21613 (predictor importance: PRB1, CSF1R, IL10, L1CAM, BTD, MOCOS, FOXP3, PDCD1, EPB41L4B, and IPI score; top 10 inputs)
3Random forest86.916Predictor importance: IPI score 1, CEP57, L1CAM, EPB41L4B, TNFRSF14, BTD, SPIN2A, PDCD1, CTNS, SRGAP3, IL10, MOCOS, PRB1, FOXP3, CD163, CSF1R, and IPI score 2
4LSVM74.416Predictor importance: SRGAP3, IPI score, L1CAM, CD163, EPB41L4B, PDCD1, CSF1R, IL10, MOCOS, BTD; top 10 inputs
5Neural network69.4 (79.9% of overall percent correct)16Predictor importance: SRGAP3, IL10, TNFRSF14, EPB41L4B, CD163, SPIN2A, IPI score, CEP57, MOCOS, PDCD1, PRB1, L1CAM, CTNS, FOXP3, CSF1R, BTD
6SVM68.91616
7C&R tree68.96IPI score
8C5 tree67.81IPI score
9XGBoost linear67.81616
10Quest67.86IPI score
11Tree-AS67.21IPI score
12CHAID67.21IPI score
13Logistic regression66.716Equation for dead outcome: −1.8*SRGAP3 + −0.9*CEP57 + 1.0*EPB41L4B + 0.8*SPIN2A + 0.7*IL10 + 0.15*MOCOS + 0.3*CD163 + 0.9*CTNS + 0.1*BTD + −0.01*PDCD1 + −0.4*L1CAM + −0.1*PRB1 + 0.5*TNFRSF14 + −0.4*CSF1R + 0.03*FOXP3 + −1.1*IPI score = 1 + 0.7*IPI score = 2 + −3.8.
14Discriminant analysis66.71516, except IPI score
15KNN algorithm63.41616
16Bayesian network57.41616
Table 2. The biological function of the highlighted genes using the MLP neural network.
GeneProteinFunction
EPB41L4BBand 4.1-like protein 4BPromotes cellular adhesion, migration, and motility
MOCOSMolybdenum cofactor sulfuraseMolybdopterin cofactor metabolic process
SPIN2ASpindlin-2ARegulation of cell cycle progression
BTDBiotinidaseBiotin metabolic process
SRGAP3SLIT-ROBO Rho GTPase-activating protein 3Negative regulation of cell migration
CTNSCystinosinPositive regulation of TORC1 signaling
PRB1Basic salivary proline-rich protein 1Glycoprotein
L1CAMNeural cell adhesion molecule L1Cell adhesion and in the generation of transmembrane signals at tyrosine kinase receptors
CEP57Centrosomal protein CEP57L1Centrosomal protein, which may be required for microtubule attachment to centrosomes.
Information obtained from UniProt.
Publisher’s Note: MDPI stays neutral with regard to jurisdictional claims in published maps and institutional affiliations.

