
Automated Detection of Ear Tragus and C7 Spinous Process in a Single RGB Image—A Novel Effective Approach


Abstract
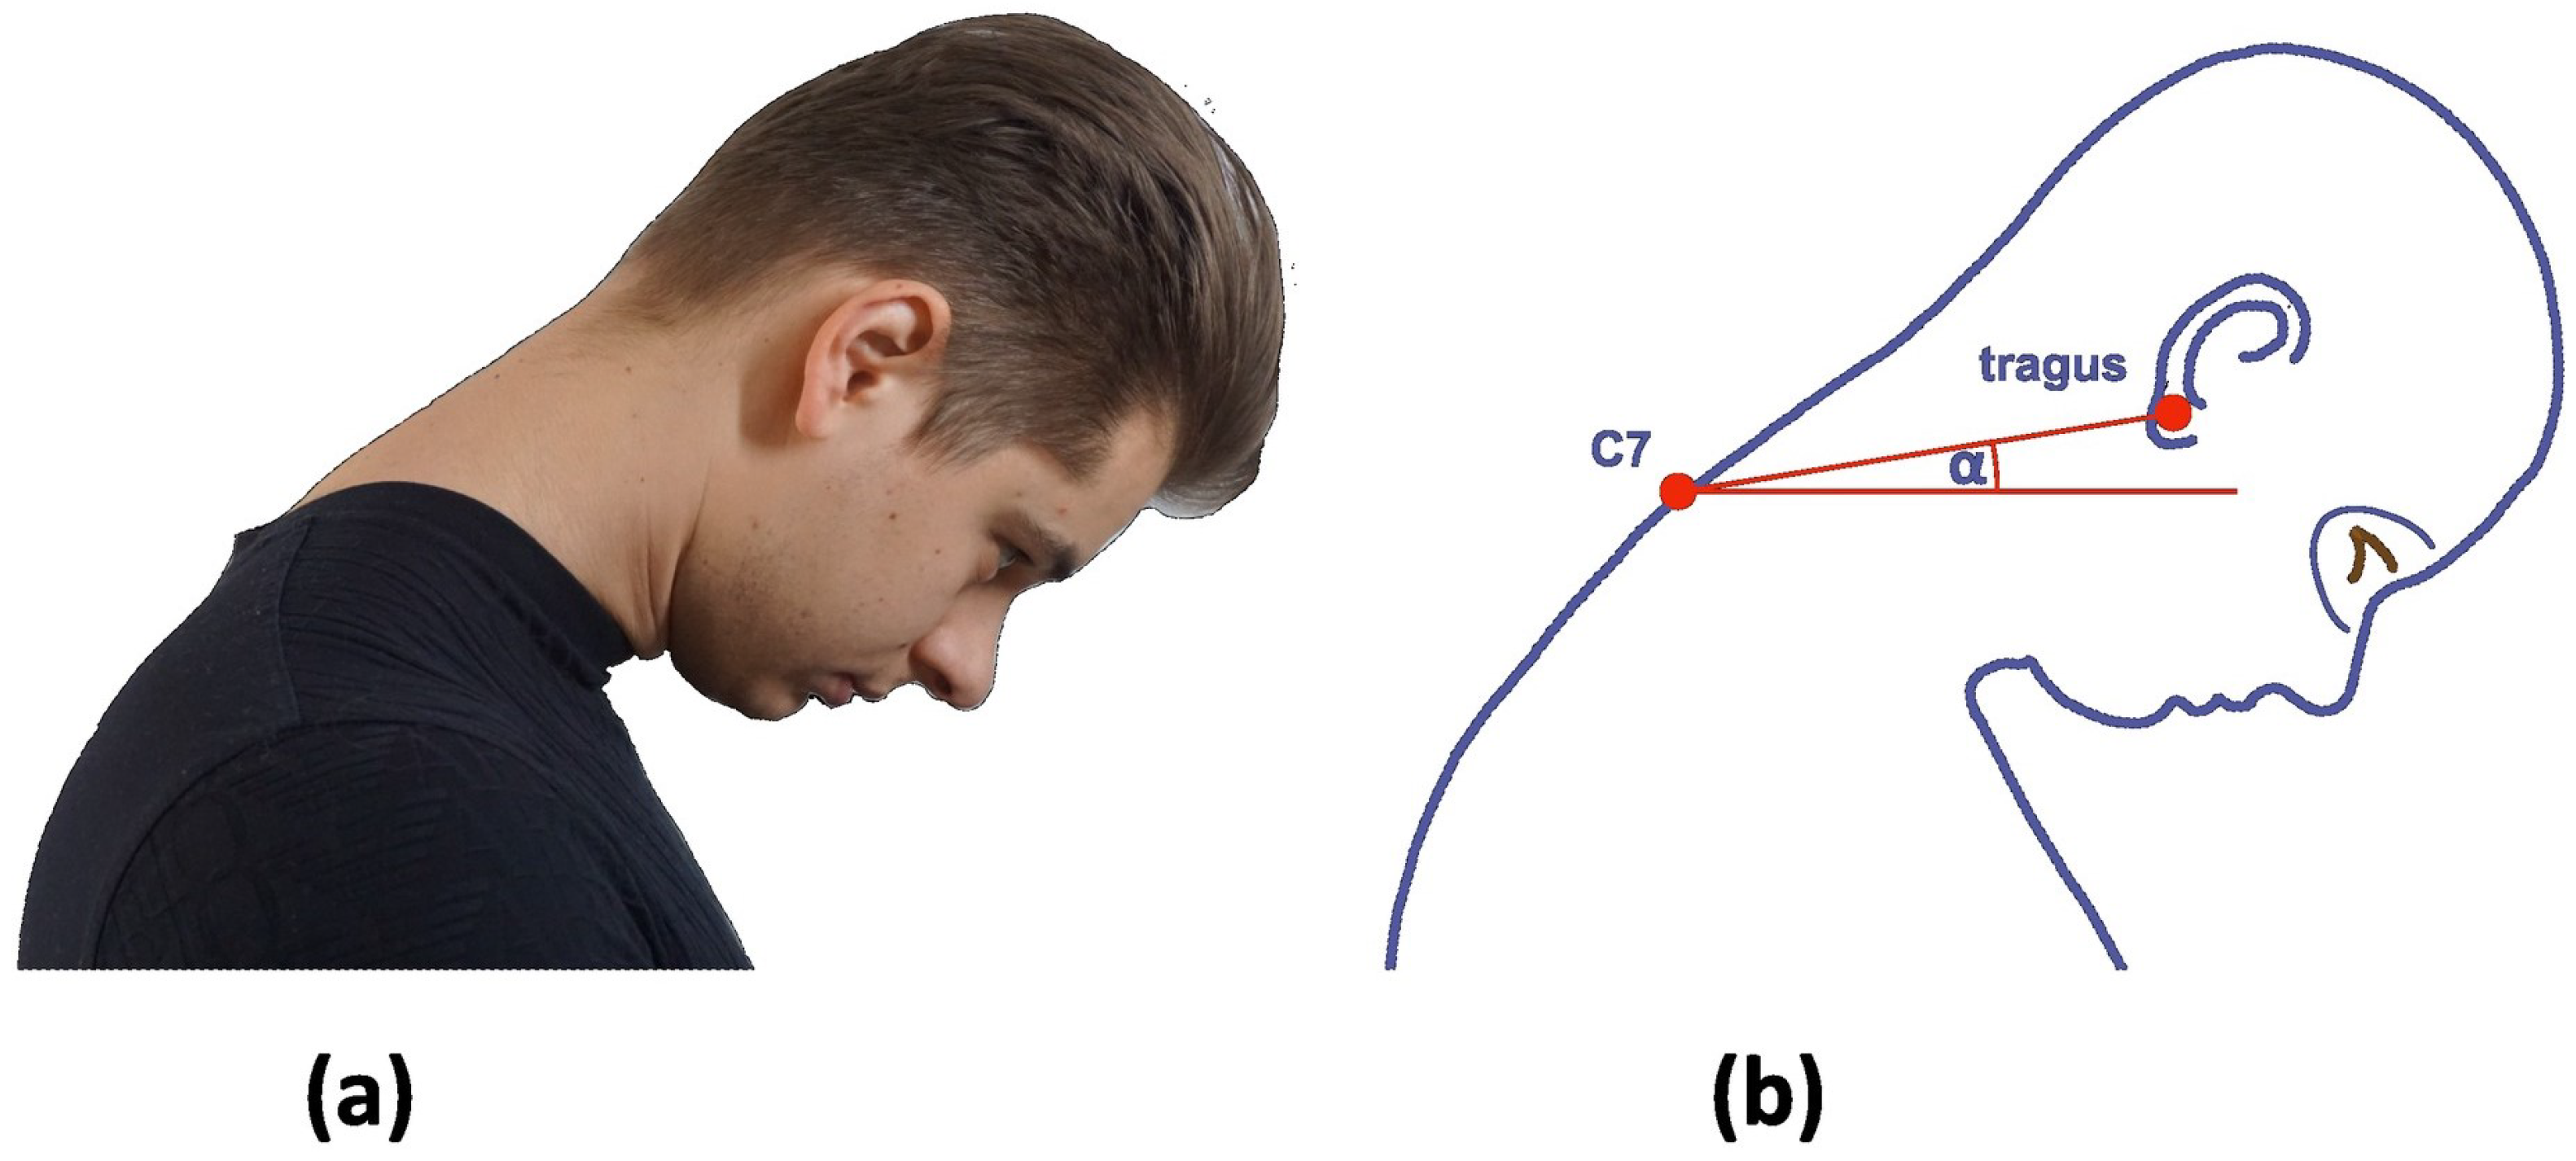
:1. Introduction
2. Materials and Methods
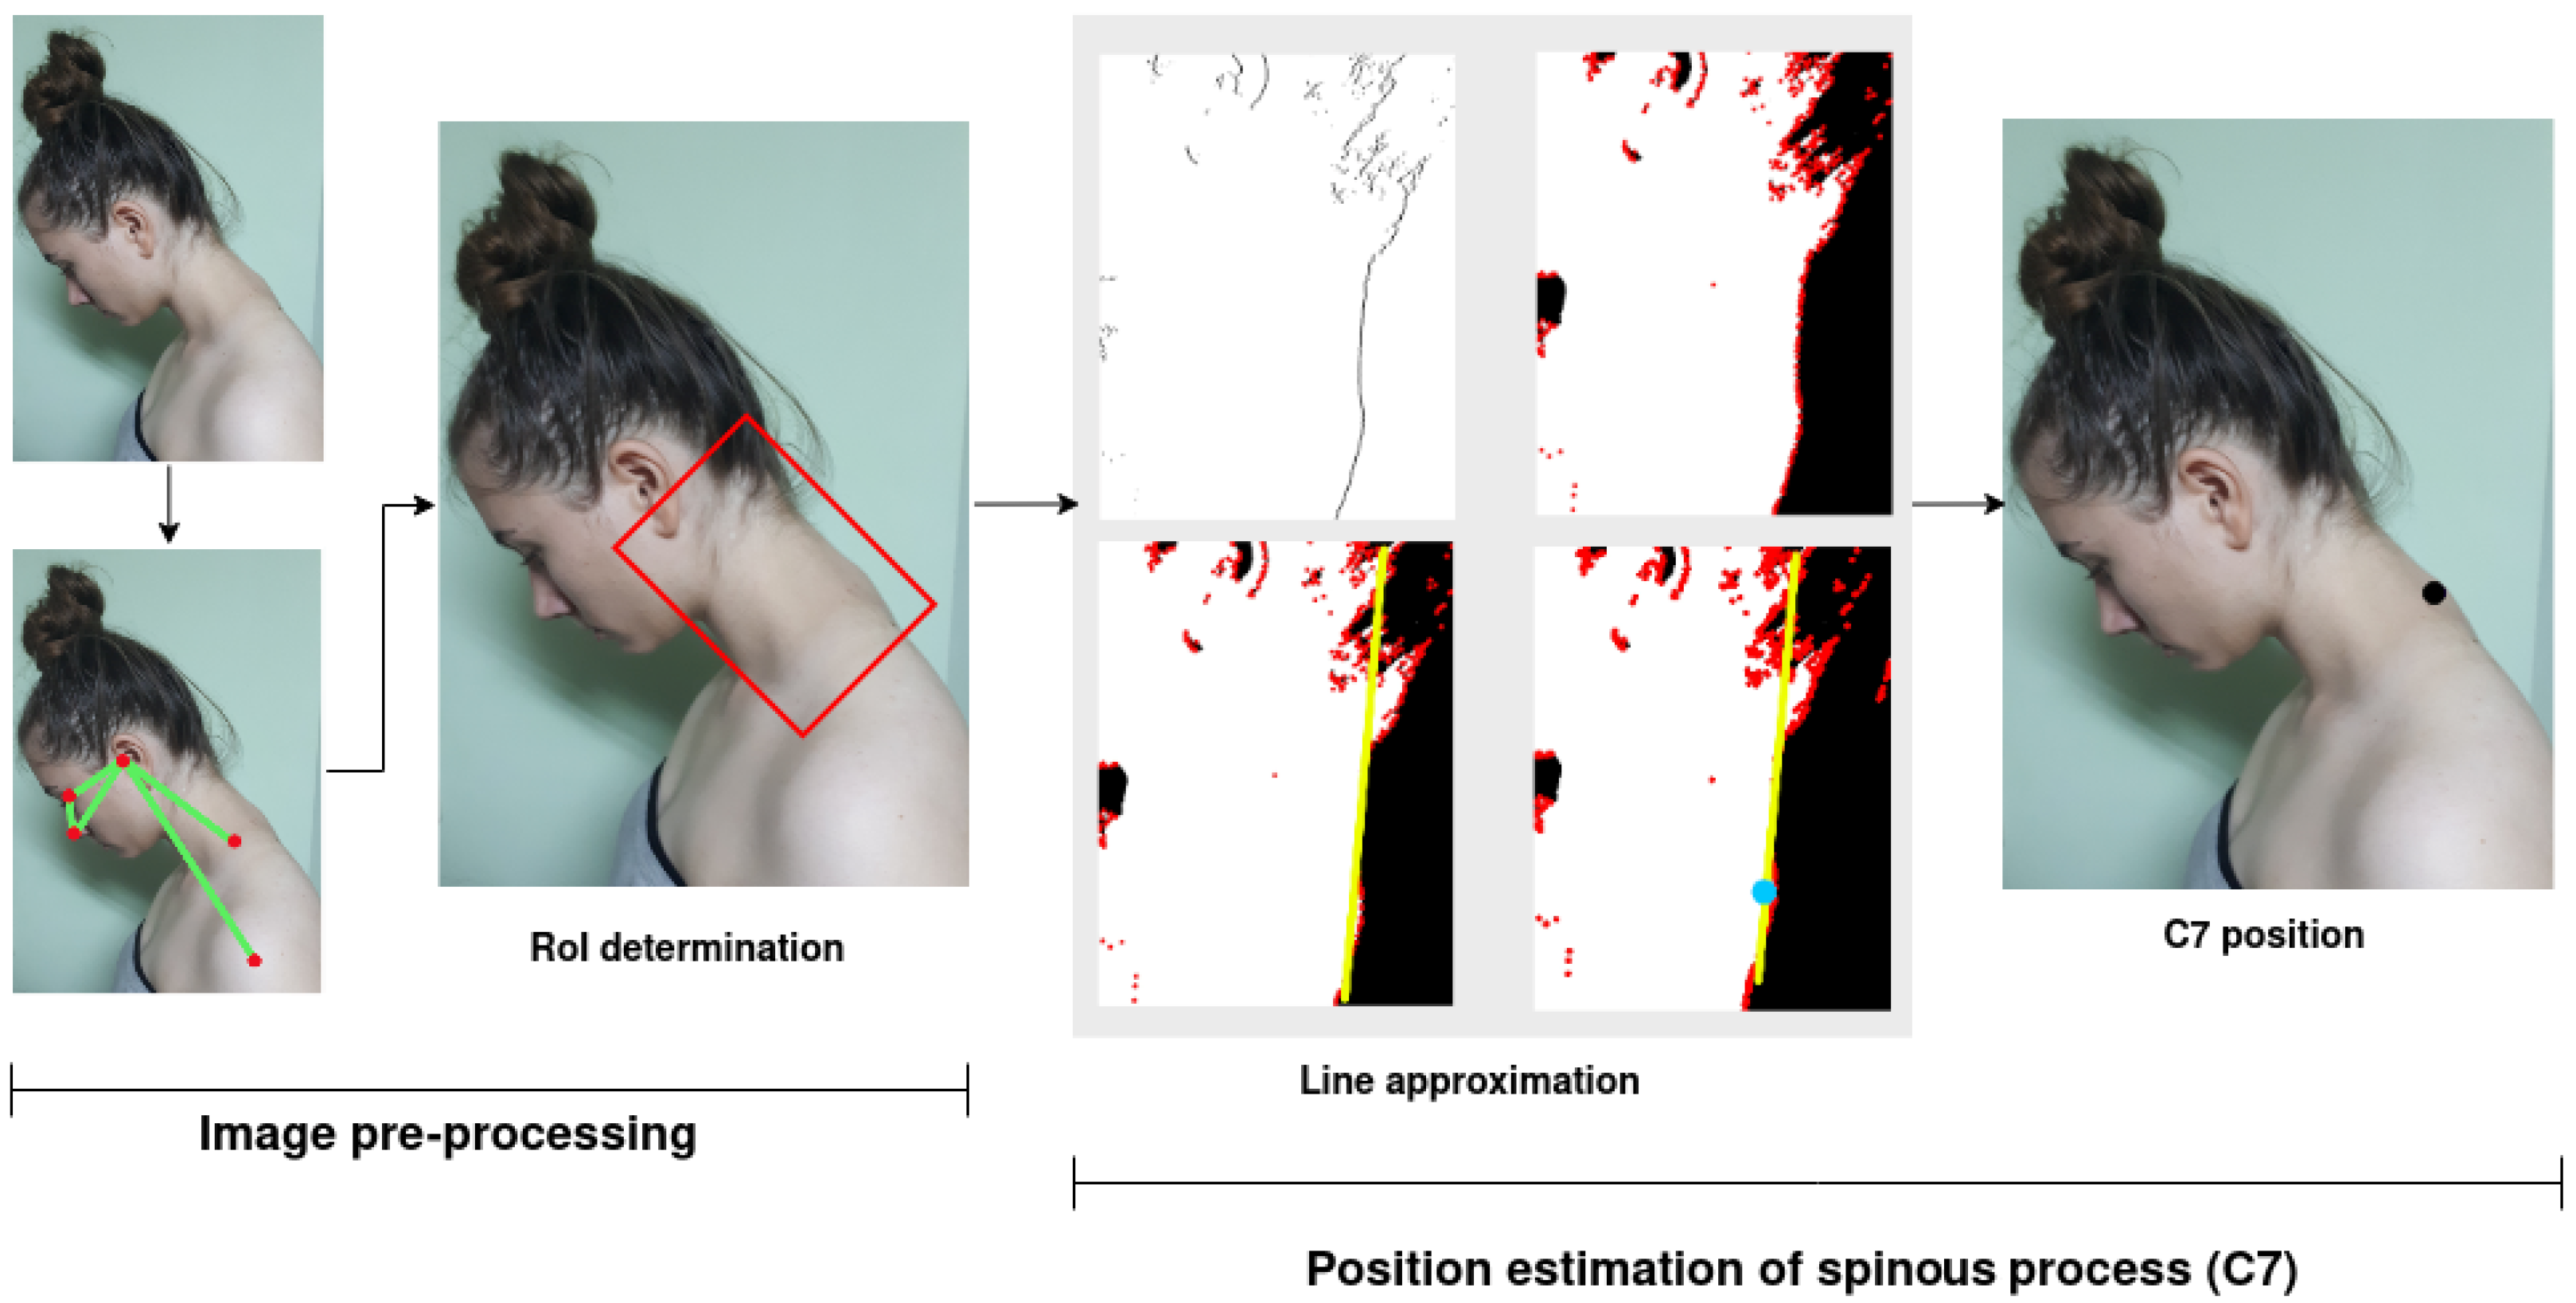
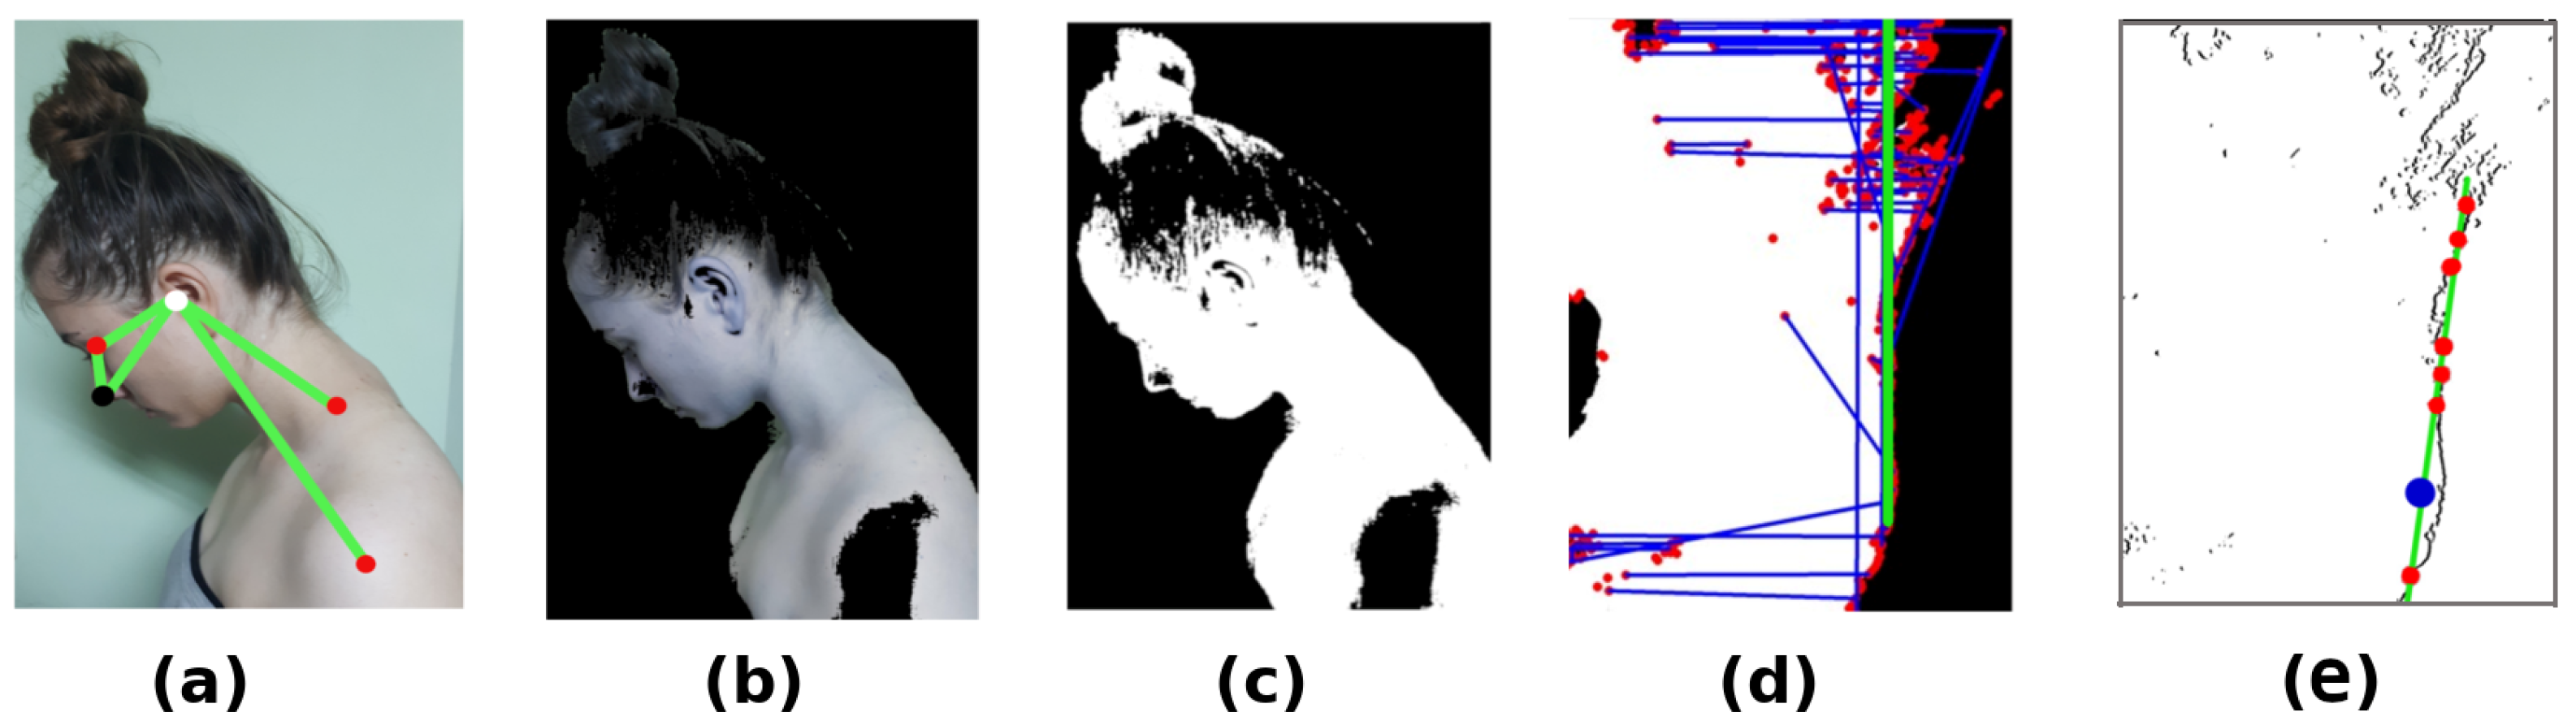
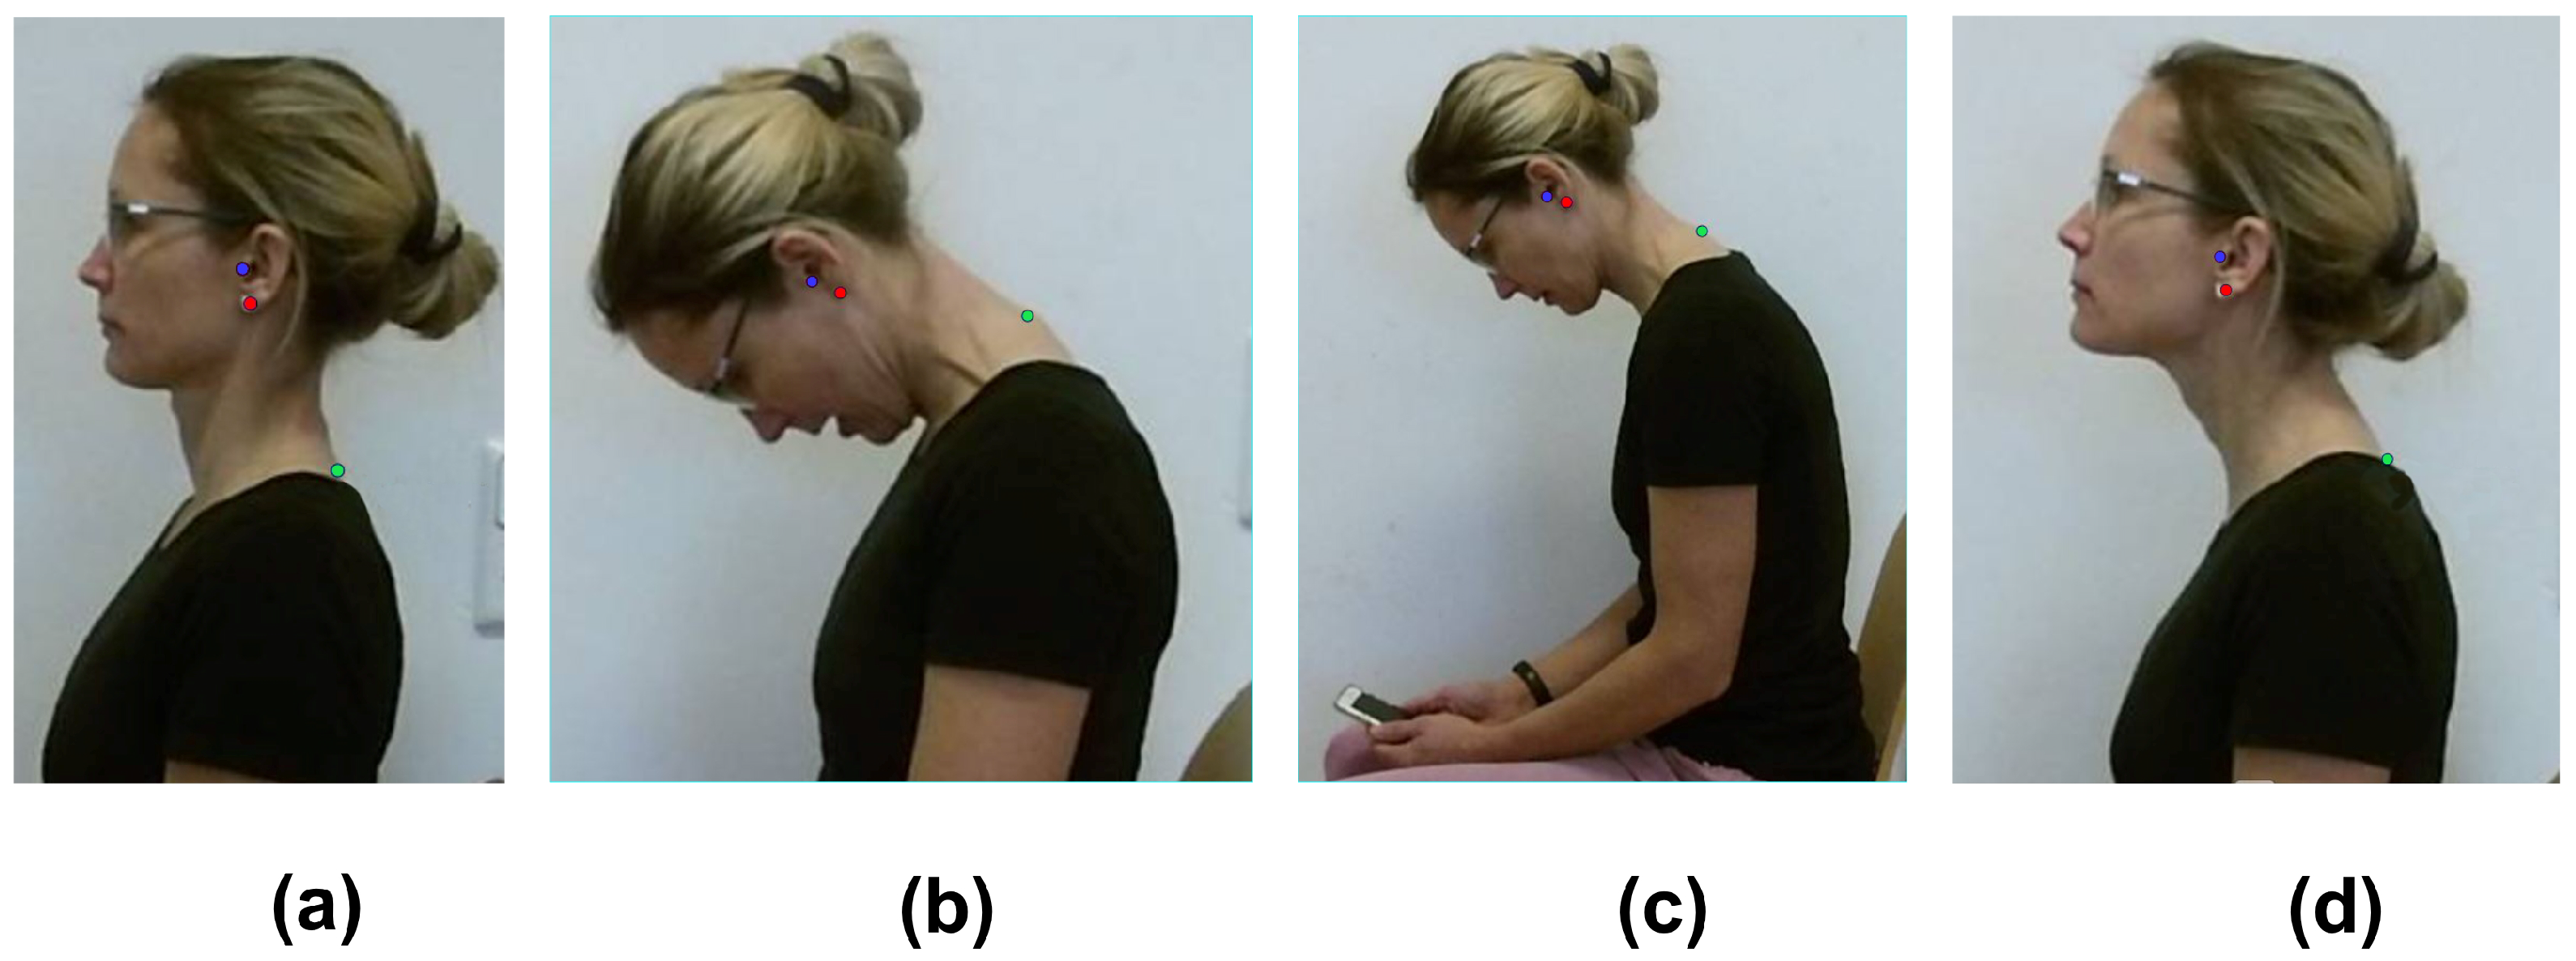
2.1. Determination of Spinous Process
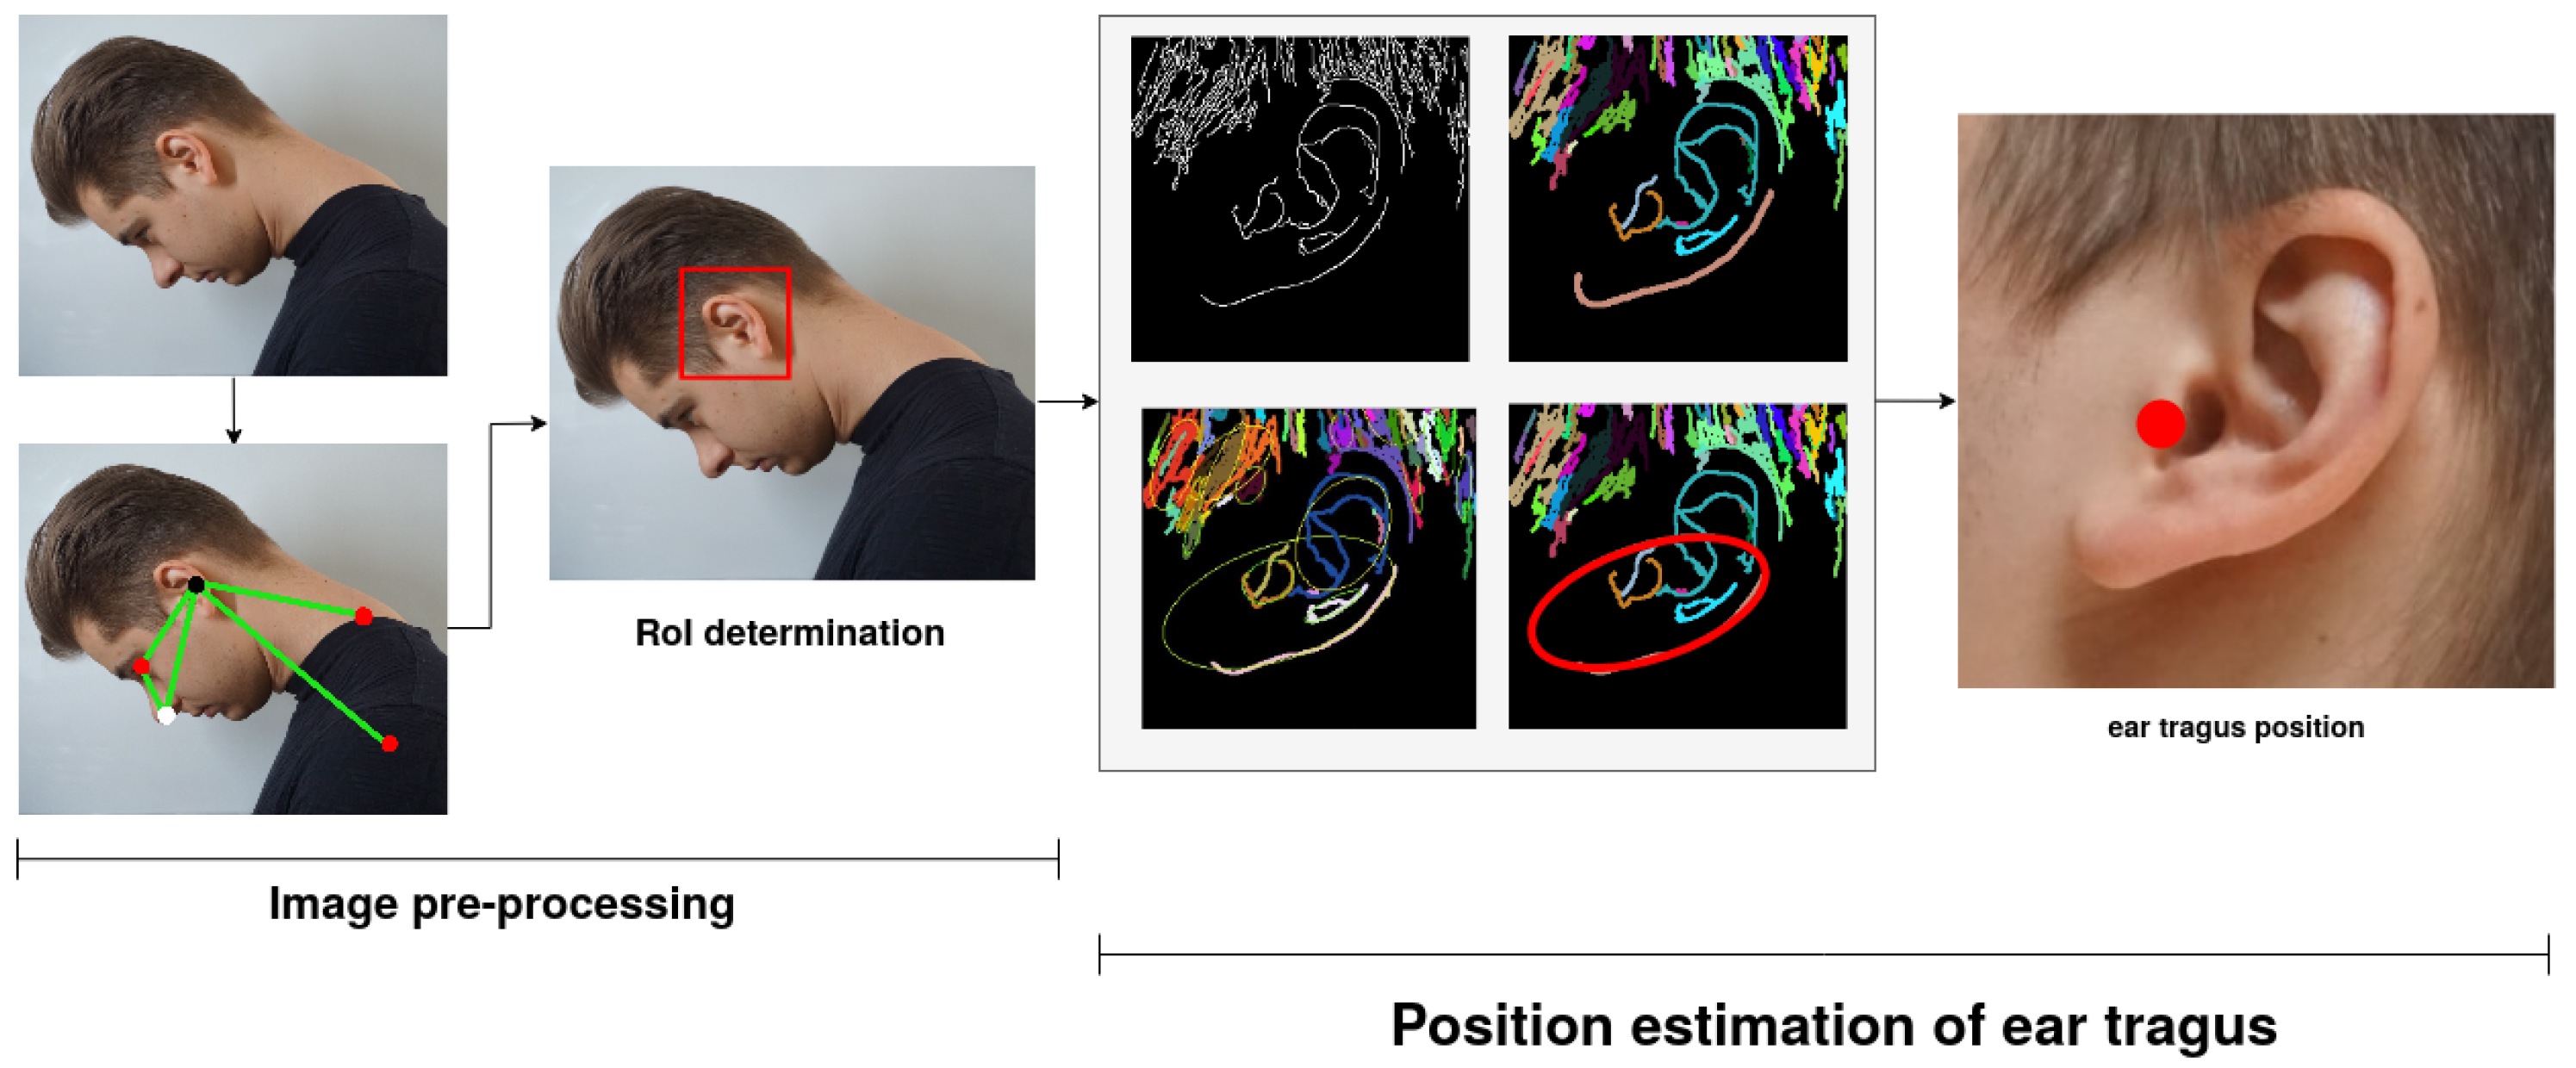
2.2. Estimation of the Ear Tragus
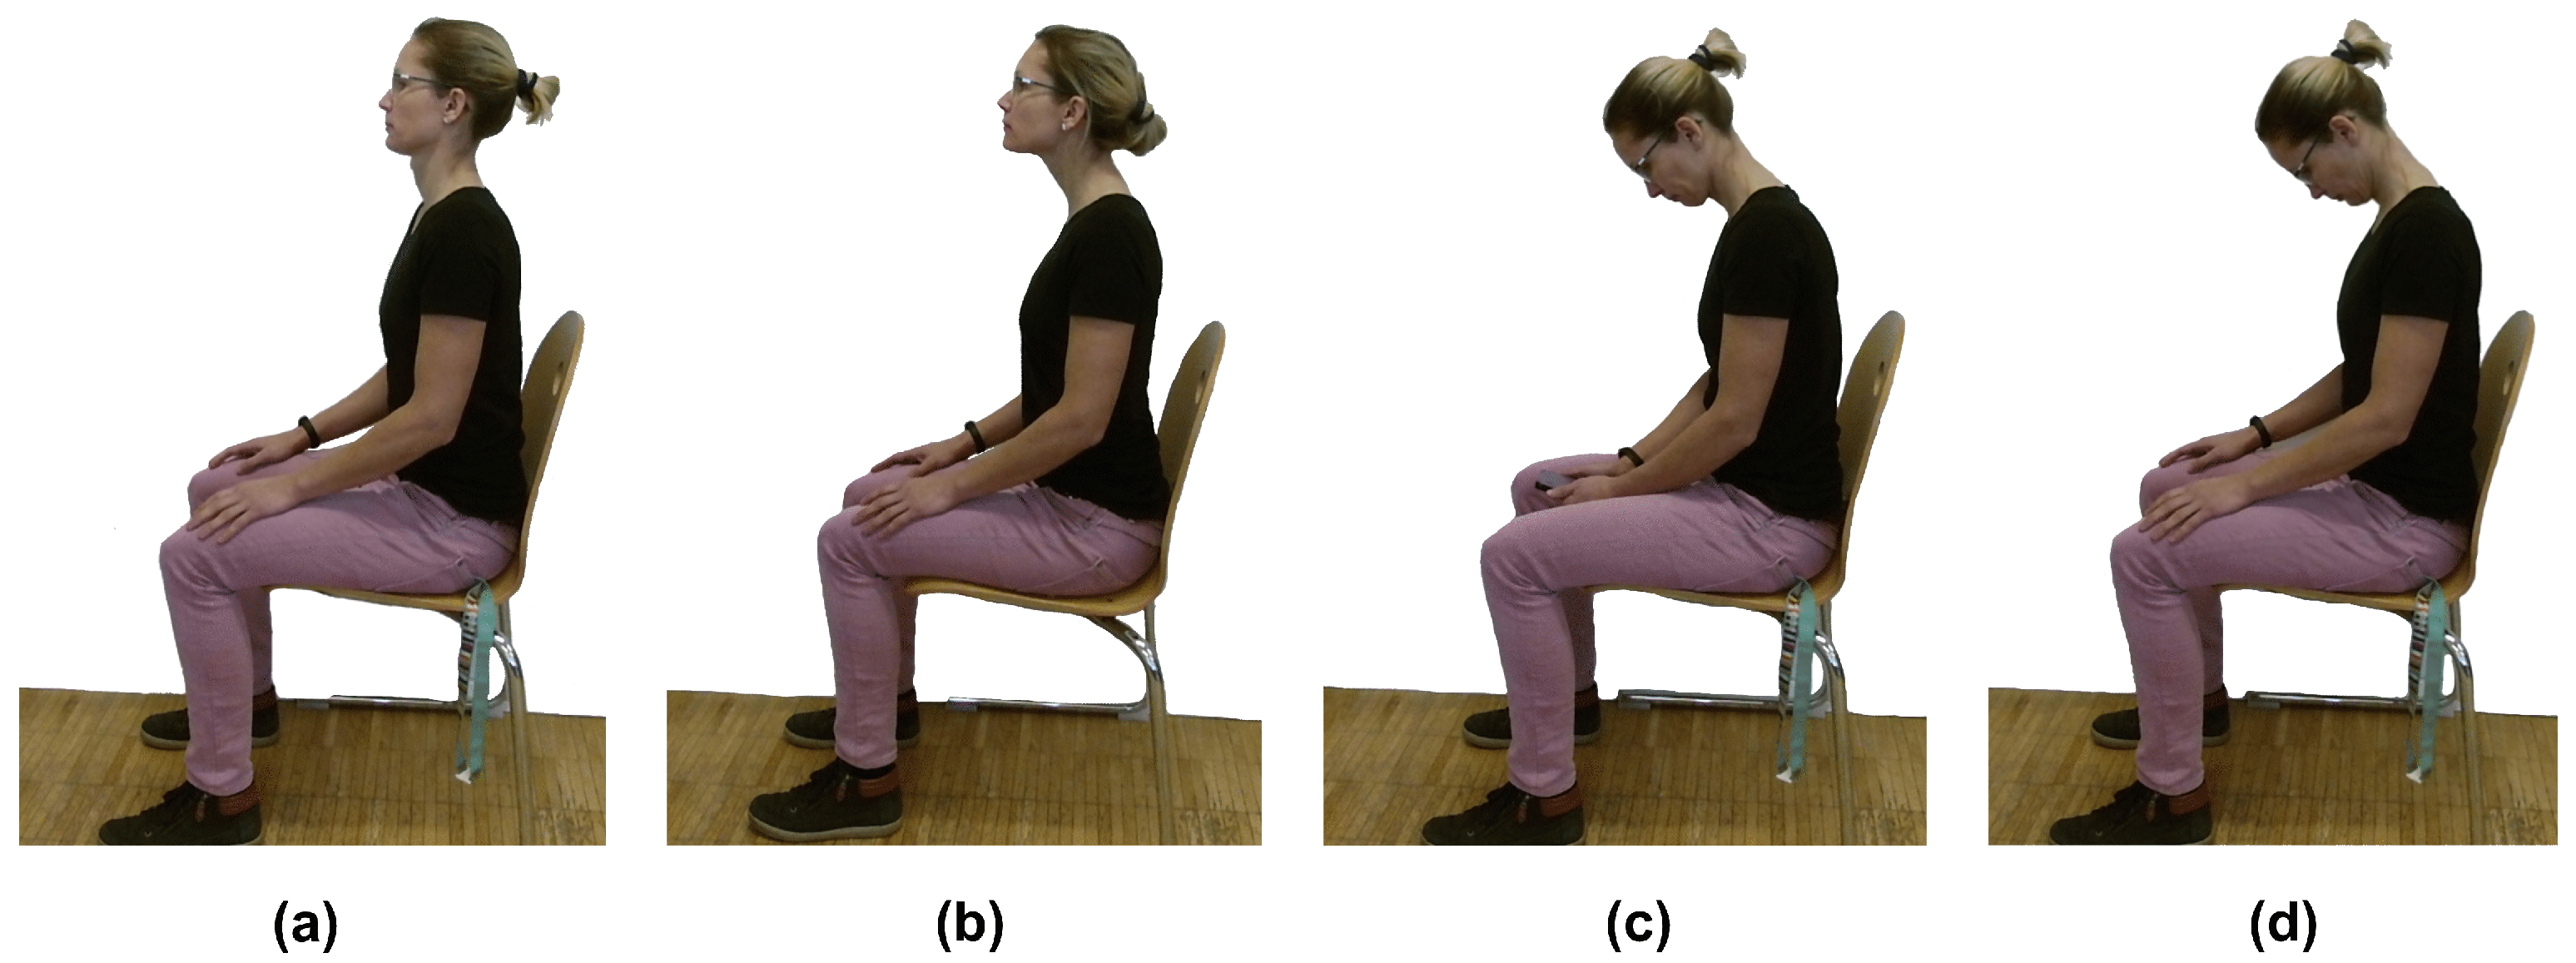
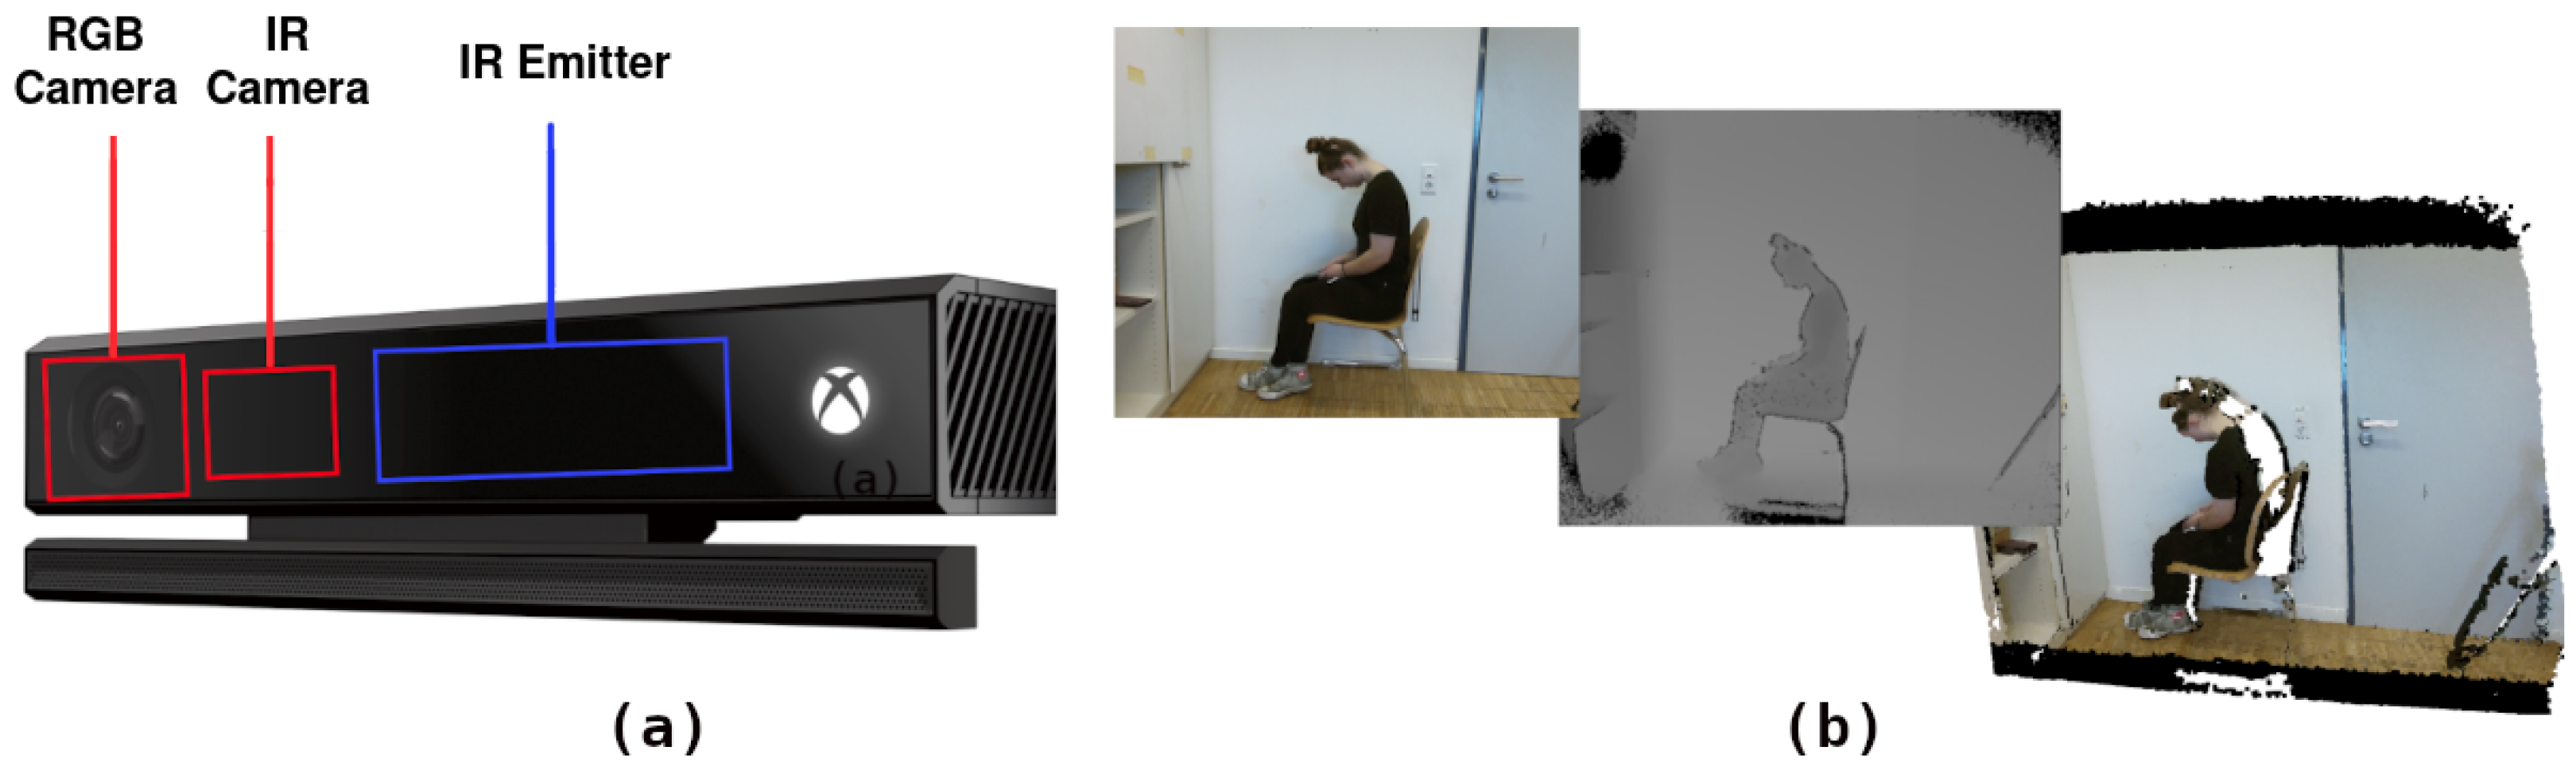
2.3. Data Acquisition
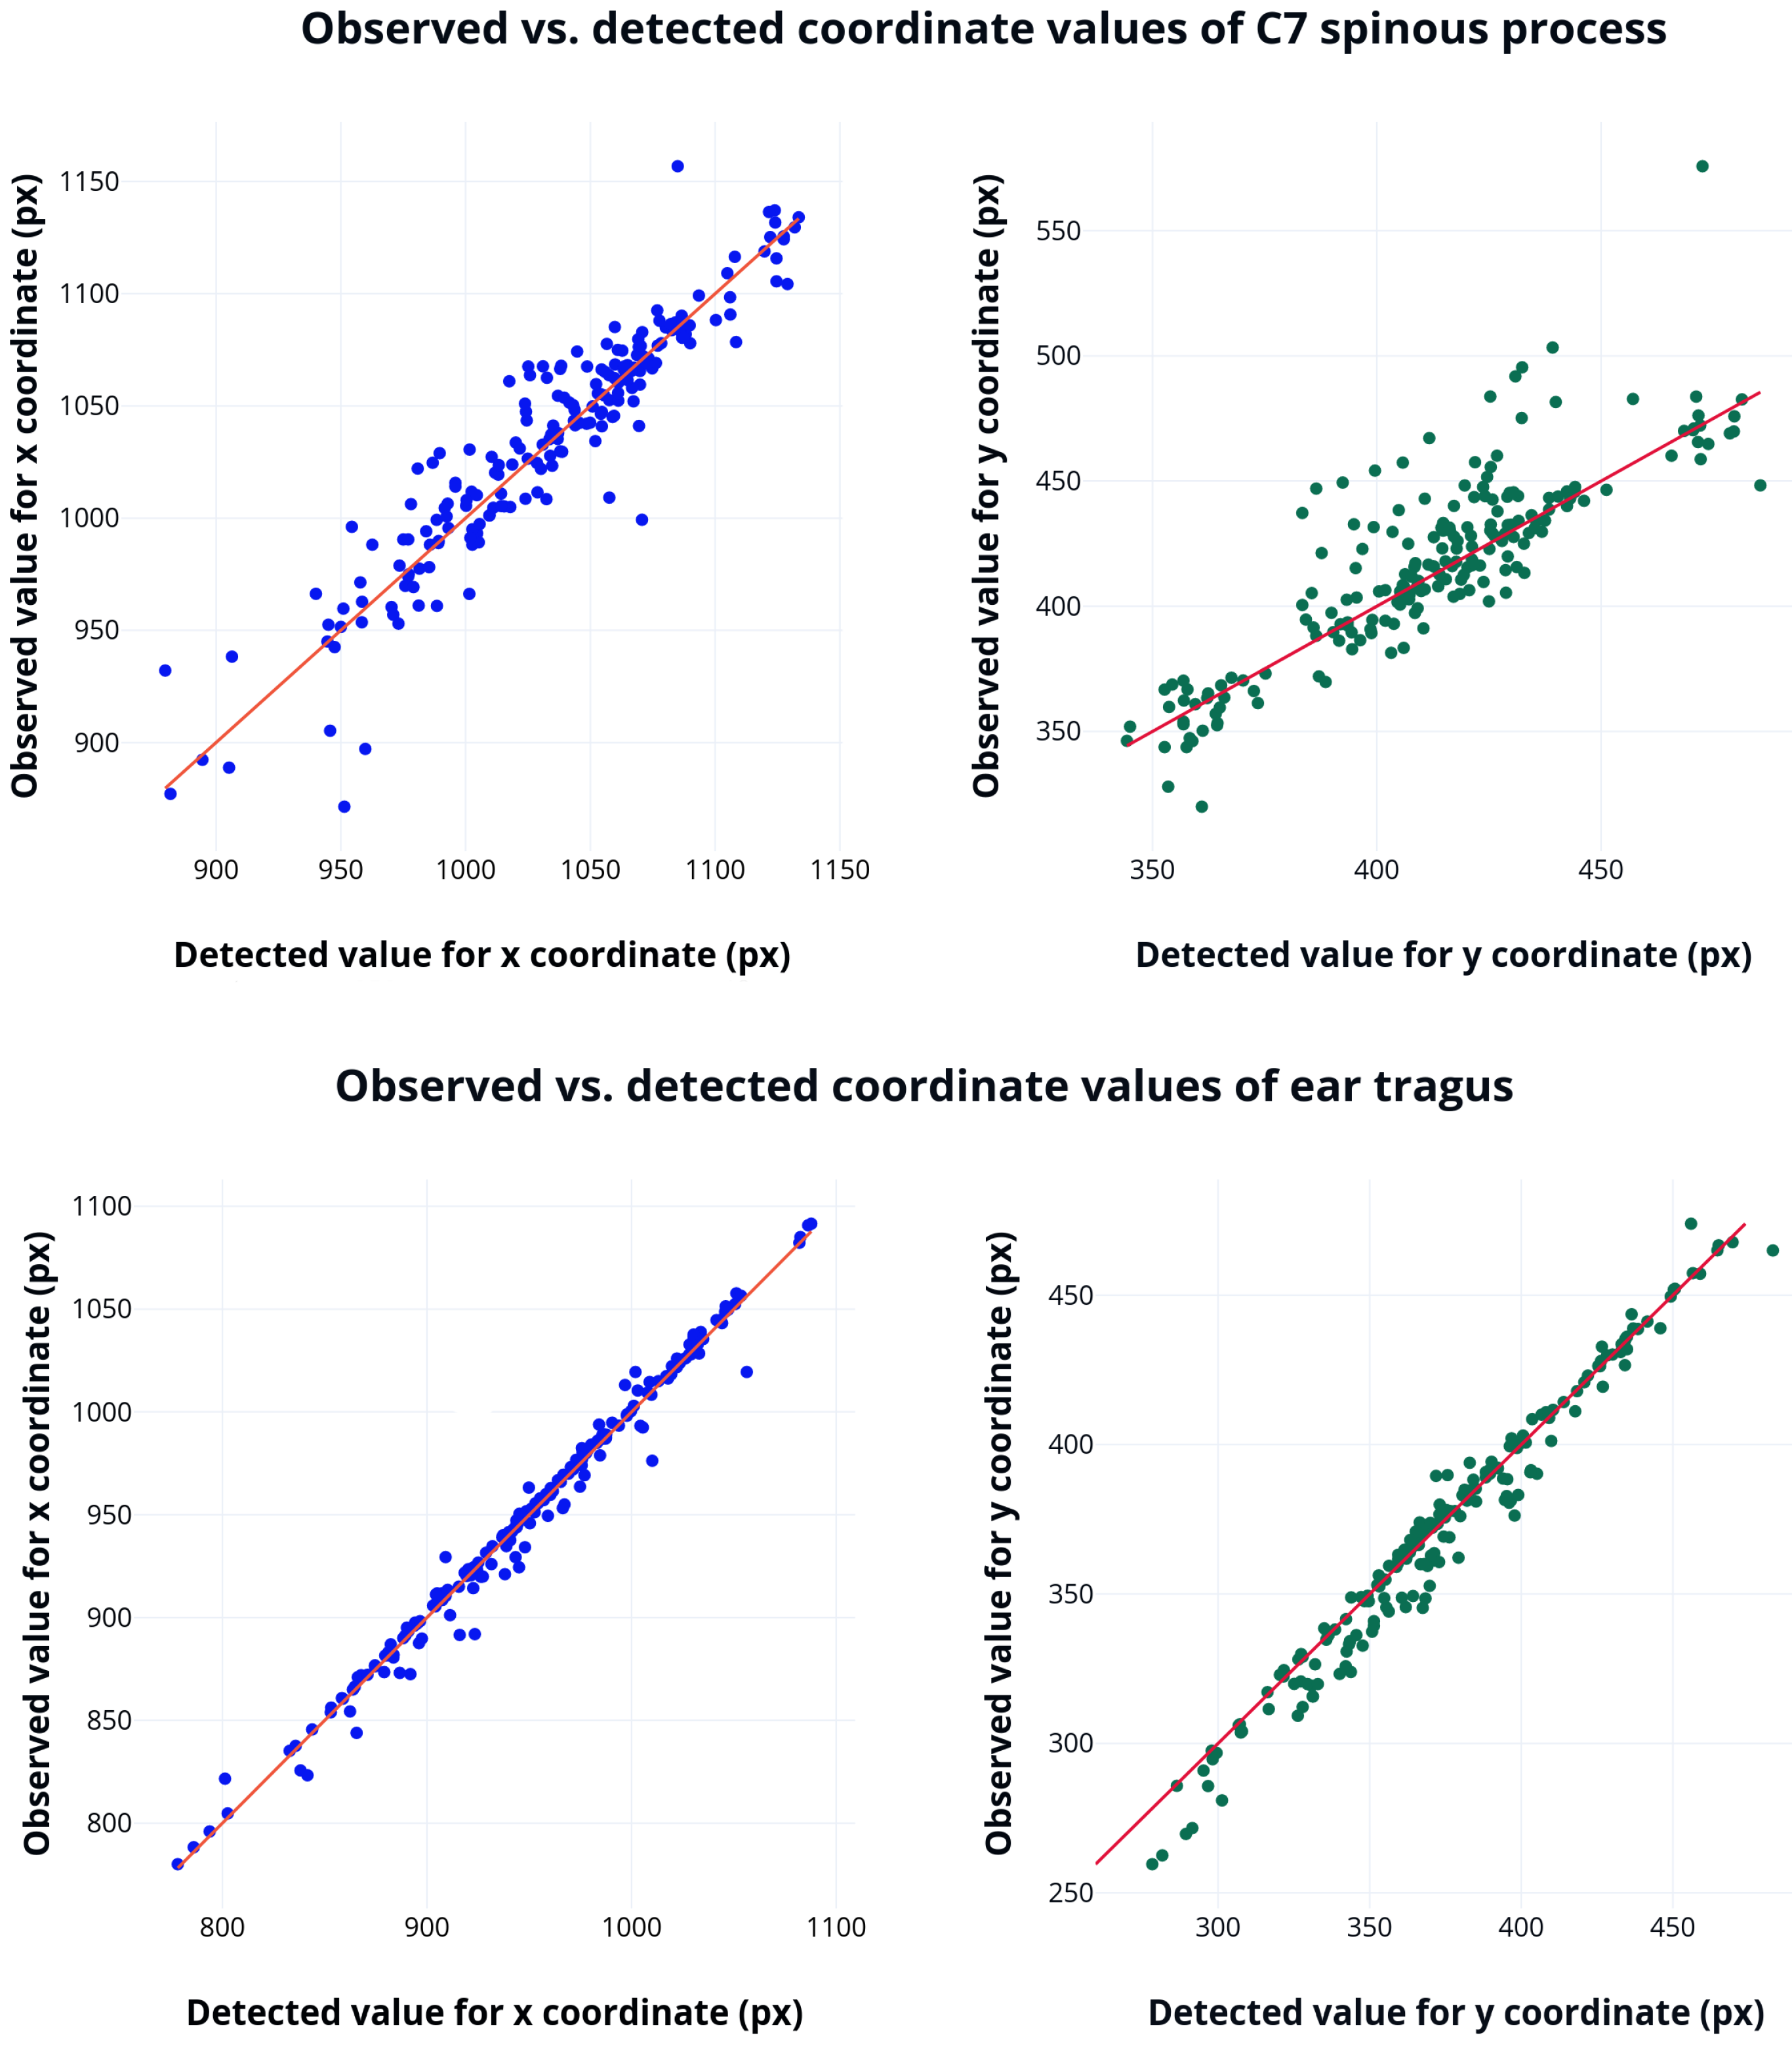
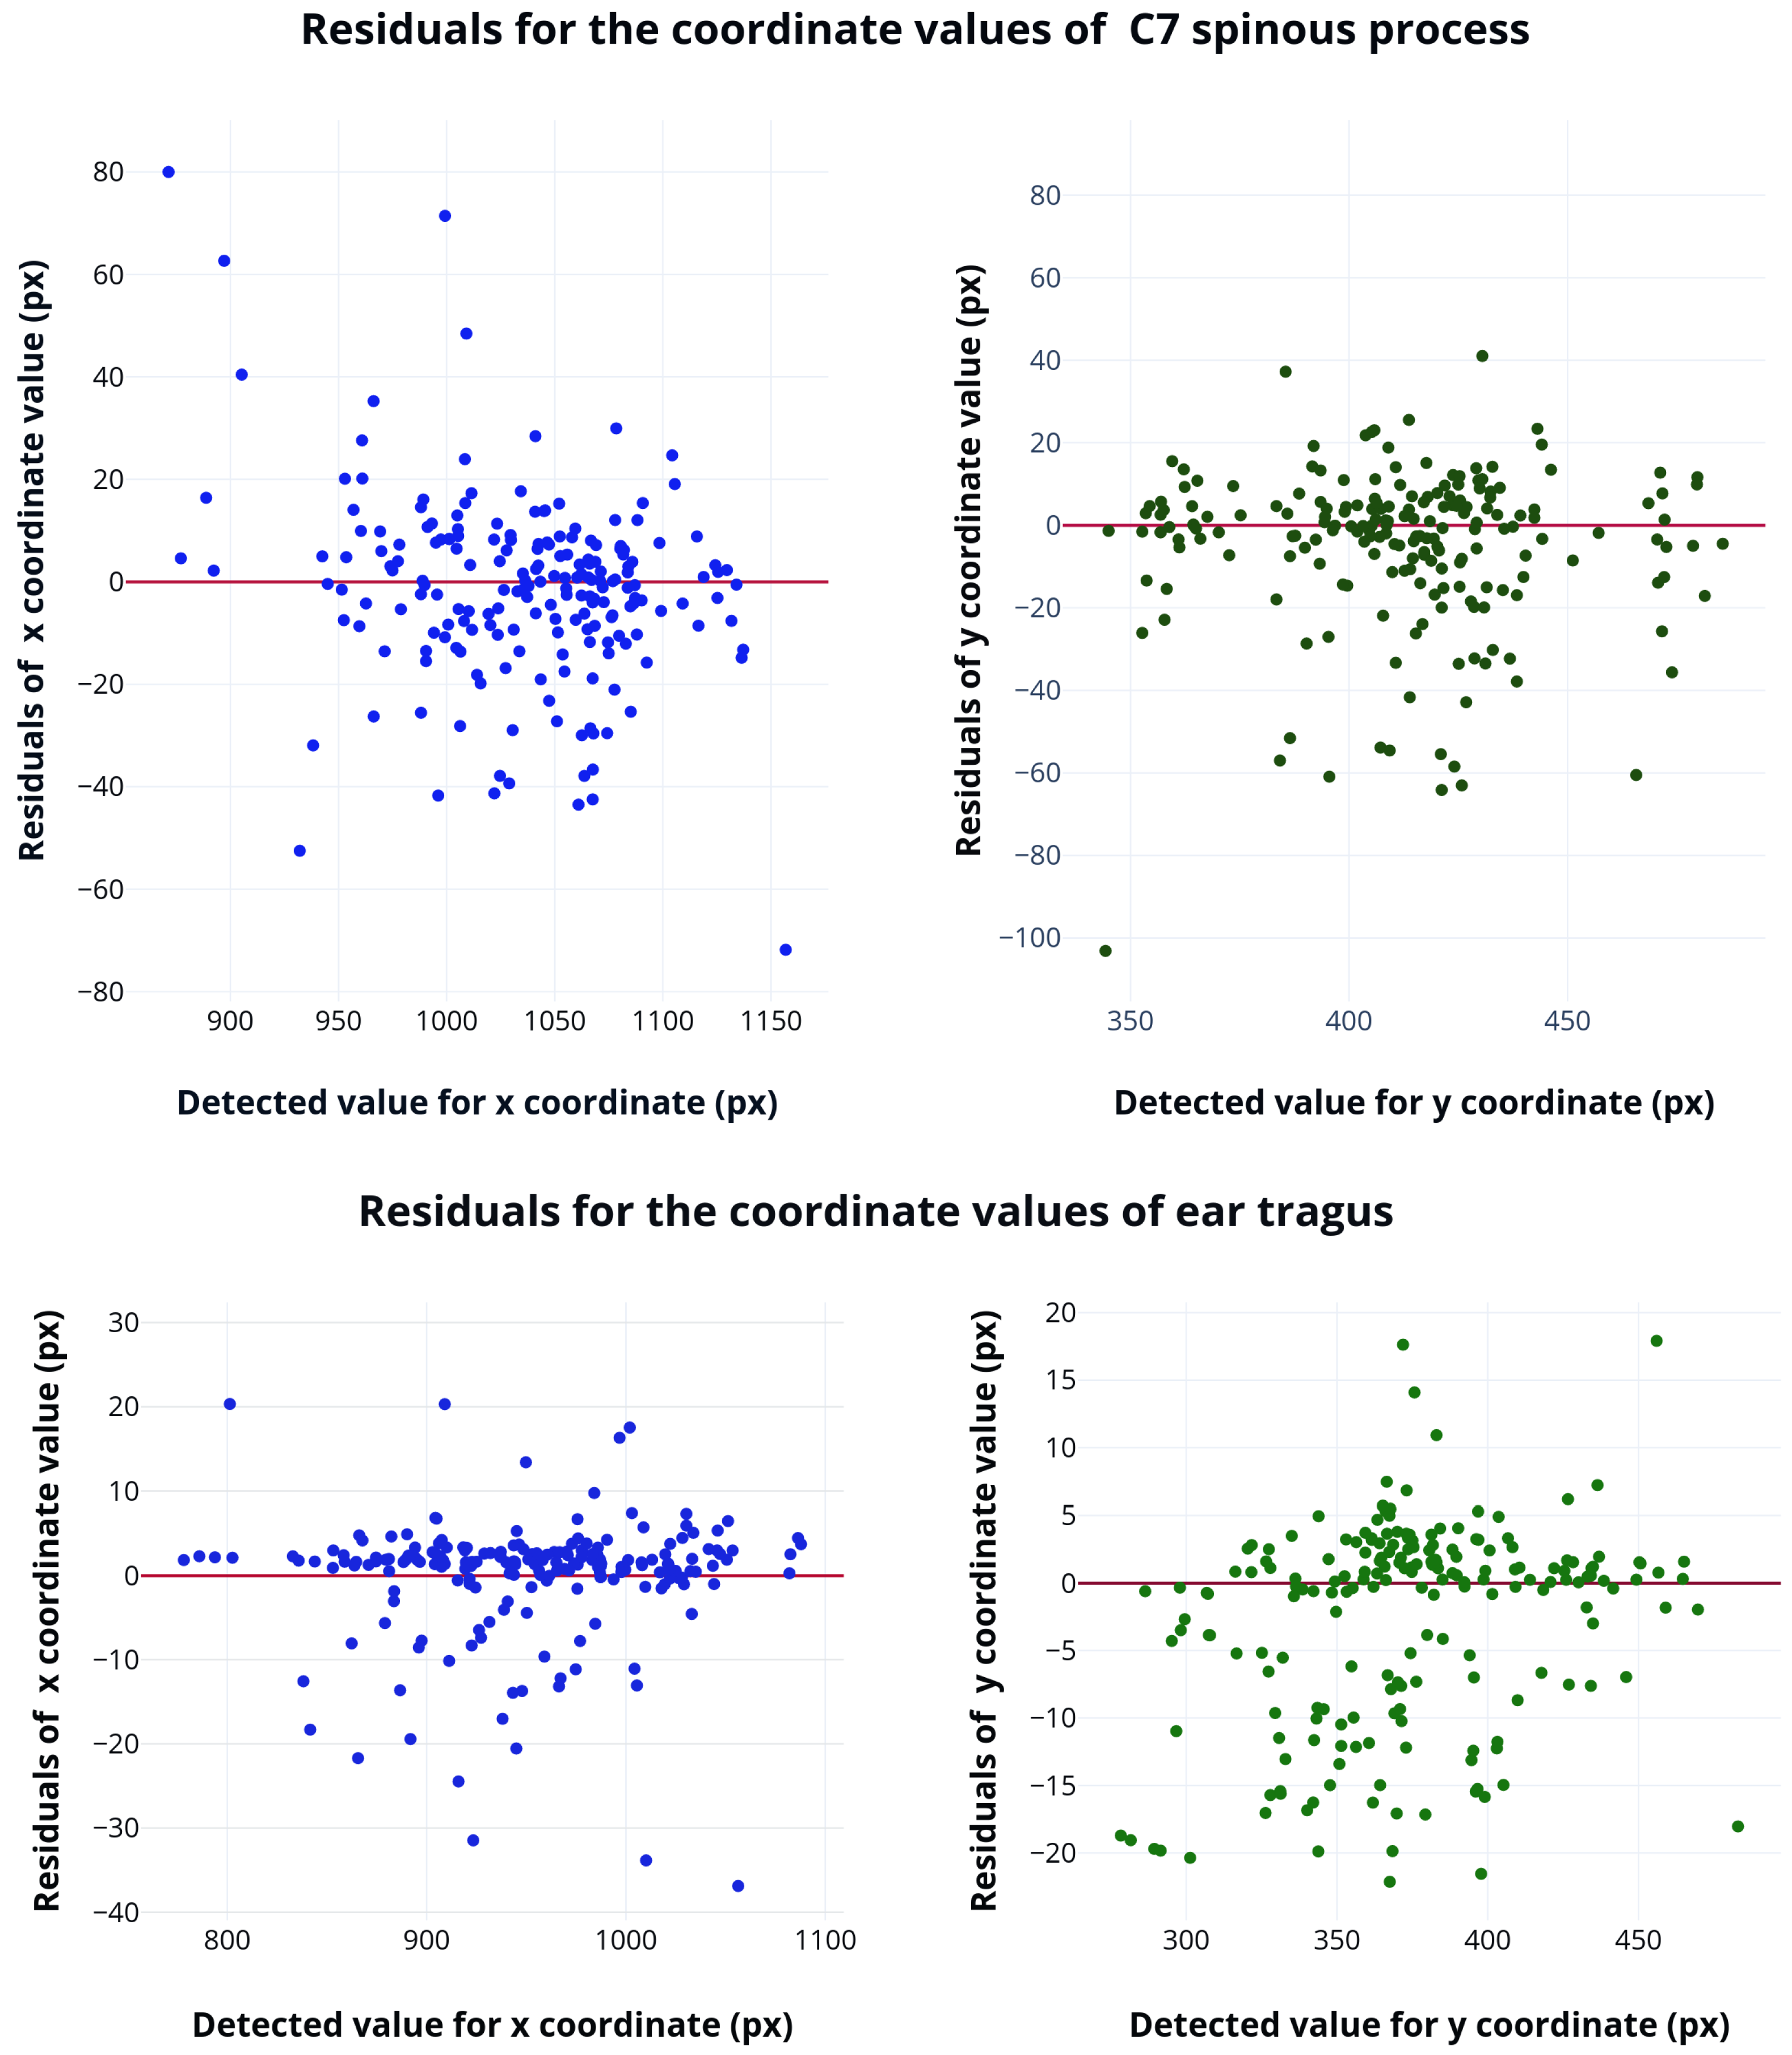
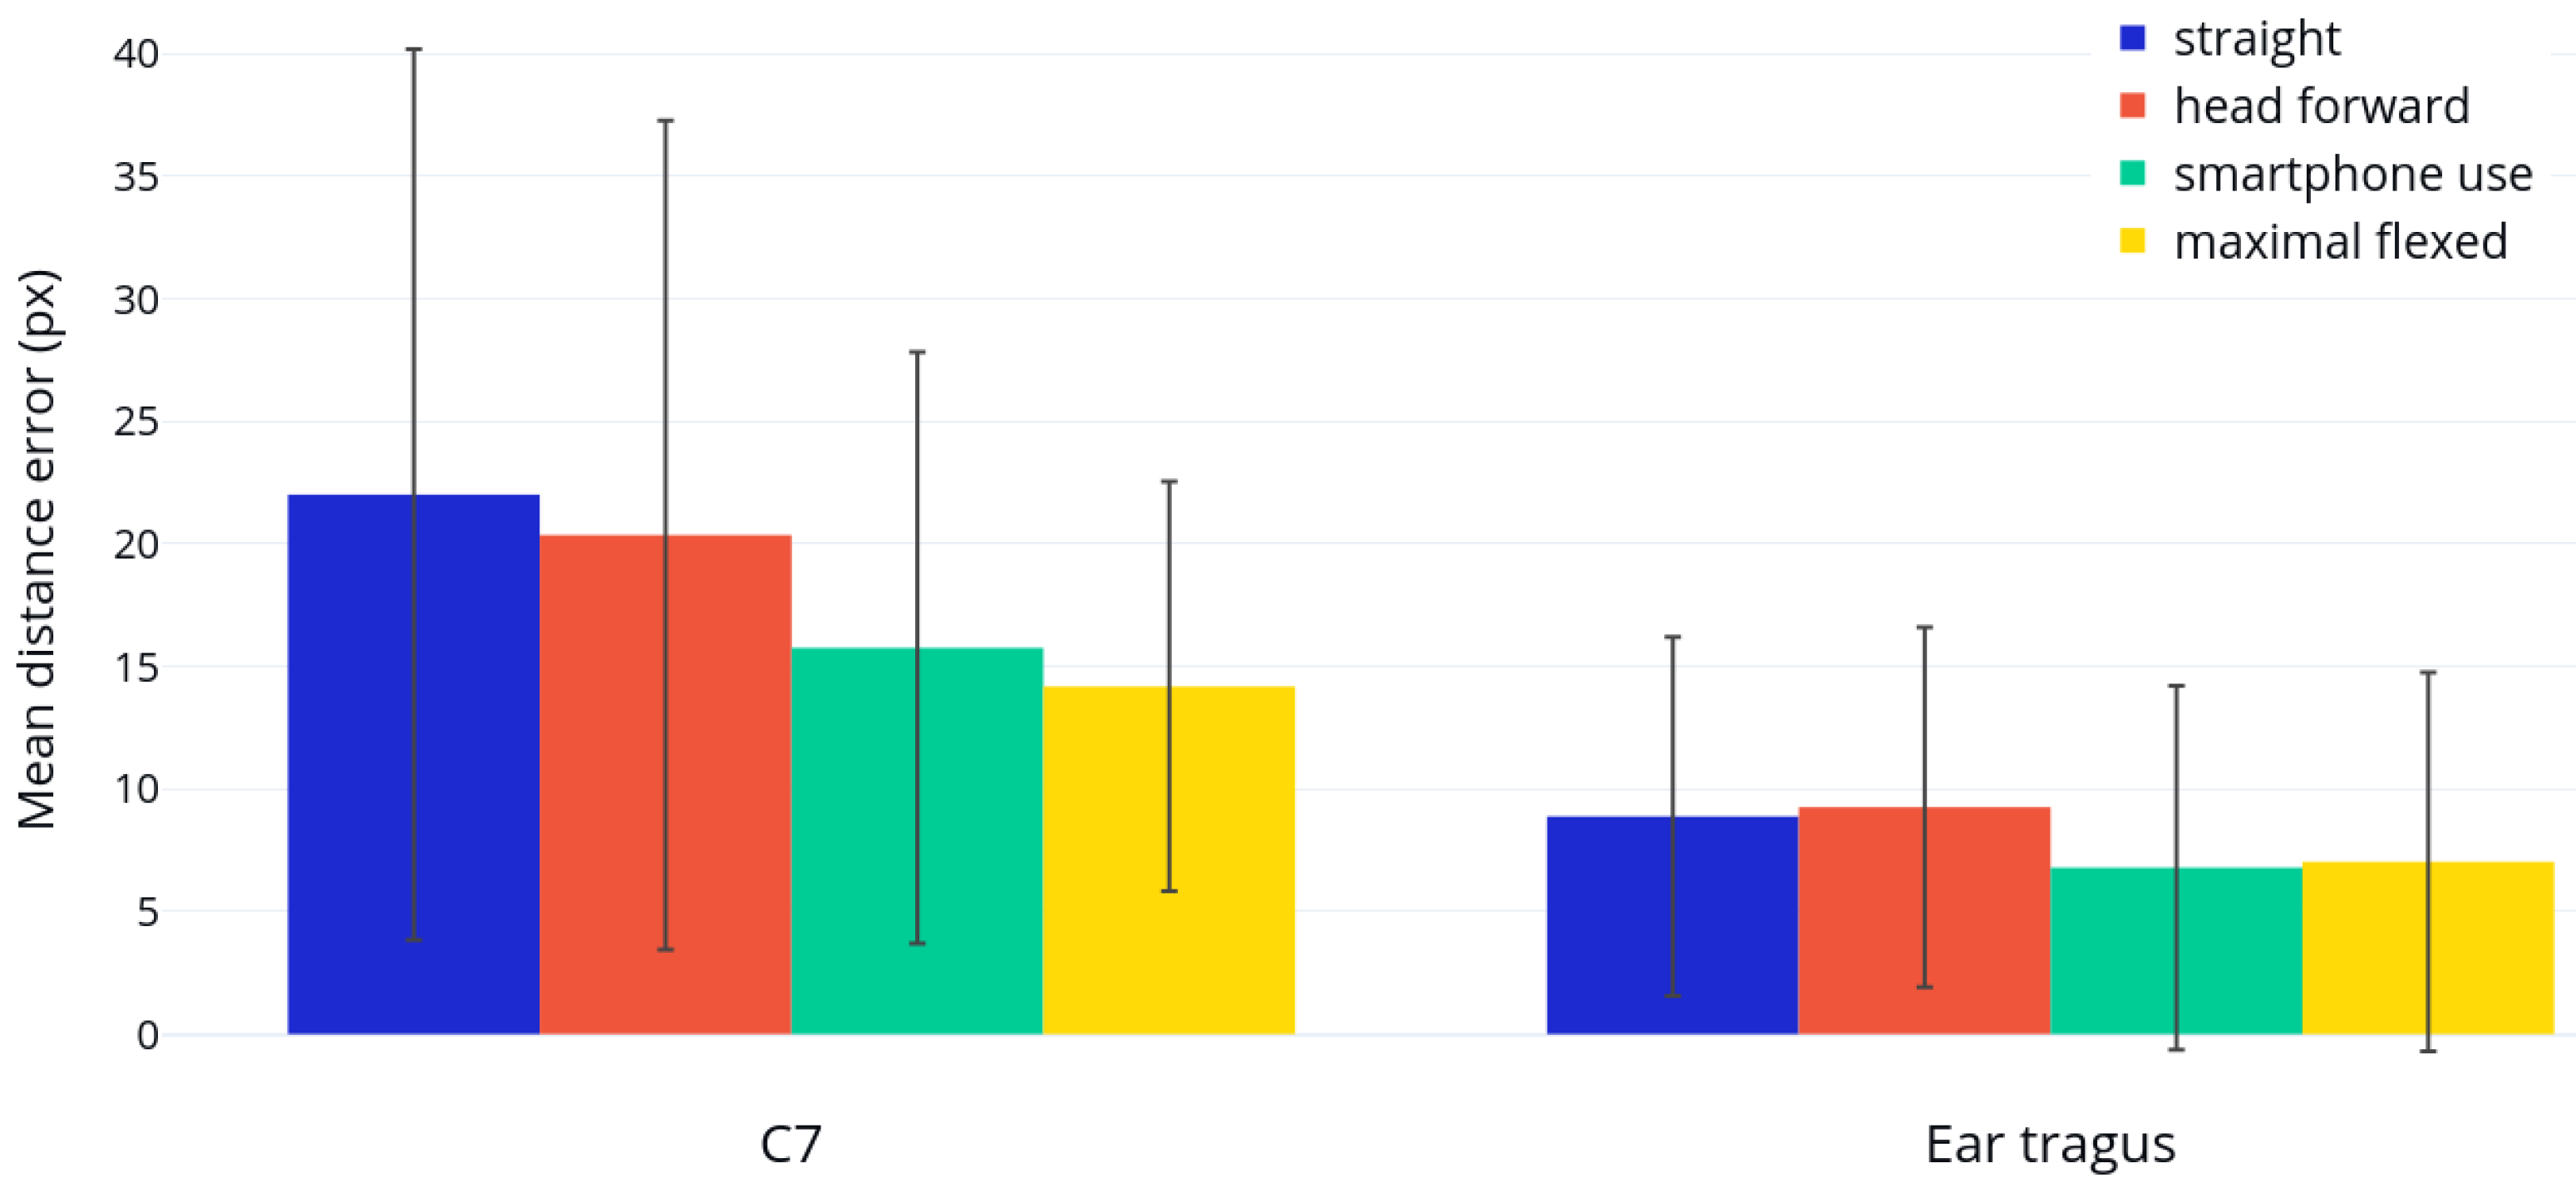
3. Results
4. Discussion
5. Conclusions
Author Contributions
Funding
Institutional Review Board Statement
Informed Consent Statement
Data Availability Statement
Conflicts of Interest
Abbreviations
| CVA | craniovertebral angle |
| FHP | forward head position |
| HTA | head tilt angle |
| RoI | region of interest |
| IRR | inter-rater reliability |
| PRESS | predicted residual error sum of squares |
References
- Abdulla, M.; Smaeel, A. Providing Information through Smart Platforms: An Applied Study on Academic Libraries in Saudi Universities. J. Educ. Soc. Behav. Sci. 2019, 30, 1–24. [Google Scholar] [CrossRef]
- Saksena, R.; Lu, D.; Celik, I. Ericsson Mobility Report. Report, Ericsson. 2021. Available online: https://www.ericsson.com/en/reports-and-papers/mobility-report/reports/november-2021 (accessed on 15 December 2021).
- Number of Smartphone Users from 2016 to 2021. Website. 2021. Available online: https://0-www-statista-com.brum.beds.ac.uk/statistics/330695/number-of-smartphone-users-worldwide/ (accessed on 15 December 2021).
- Vasavada, A.N.; Nevins, D.D.; Monda, S.M.; Hughes, E.; Lin, D.C. Gravitational demand on the neck musculature during tablet computer use. Ergonomics 2015, 58, 990–1004. [Google Scholar] [CrossRef] [PubMed]
- Jacobs, K.; Hudak, S.; McGiffert, J. Computer-Related posture and musculoskeletal discomfort in middle school students. Work 2009, 32, 275–283. [Google Scholar] [CrossRef] [PubMed]
- Siu, D.C.H.; Tse, L.A.; Yu, I.T.S.; Griffiths, S.M. Computer products usage and prevalence of computer related musculoskeletal discomfort among adolescents. Work 2009, 34, 449–454. [Google Scholar] [CrossRef]
- Palmer, K.; Ciccarelli, M.; Falkmer, T.; Parsons, R. Associations between exposure to Information and Communication Technology (ICT) and reported discomfort among adolescents. Work 2014, 48, 165–173. [Google Scholar] [CrossRef] [Green Version]
- Park, J.; Kim, J.; Kim, J.; Kim, K.; Kim, N.; Choi, I.; Lee, S.; Yim, J. The effects of heavy smartphone use on the cervical angle, pain threshold of neck muscles and depression. Adv. Sci. Technol. Lett. 2015, 91, 12–17. [Google Scholar] [CrossRef] [Green Version]
- Shousha, T.; Hamada, H.; Abo-zaid, N.; Abdelsamee, M.; Behiry, M. The effect of smartphone use on neck flexion angle and hand grip power among adolescents: Cross-sectional study. J. Hum. Sport Exerc. 2021, 16, 883–891. [Google Scholar] [CrossRef]
- Shaghayeghfard, B.; Ahmadi, A.; Maroufi, N.; Sarrafzadeh, J. Evaluation of forward head posture in sitting and standing positions. Eur. Spine J. 2016, 25, 3577–3582. [Google Scholar] [CrossRef]
- Kang, J.H.; Park, R.Y.; Lee, S.J.; Kim, J.Y.; Yoon, S.R.; Jung, K.I. The effect of the forward head posture on postural balance in long time computer based worker. Ann. Rehabil. Med. 2012, 36, 98–104. [Google Scholar] [CrossRef] [Green Version]
- Castro, A.; Pacheco, J.; Lourenço, C.; Queirós, S.; Moreira, A.; Rodrigues, N.; Vilaça, J. Evaluation of spinal posture using Microsoft Kinect™: A preliminary case-study with 98 volunteers. Porto Biomed. J. 2017, 2, 18–22. [Google Scholar] [CrossRef] [Green Version]
- Digo, E.; Pierro, G.; Pastorelli, S.; Gastaldi, L. Evaluation of spinal posture during gait with inertial measurement units. Proc. Inst. Mech. Eng. Part H J. Eng. Med. 2020, 234, 1094–1105. [Google Scholar] [CrossRef] [PubMed]
- Ormos, G. Survey of neck posture, mobility and muscle strength among schoolchildren. Man. Med. 2016, 54, 156–162. [Google Scholar] [CrossRef]
- Martinez-Merinero, P.; Nuñez-Nagy, S.; Achalandabaso-Ochoa, A.; Fernandez-Matias, R.; Pecos-Martin, D.; Gallego-Izquierdo, T. Relationship between Forward Head Posture and Tissue Mechanosensitivity: A Cross-Sectional Study. Ann. Rehabil. Med. 2012, 36, 98–104. [Google Scholar] [CrossRef] [Green Version]
- Choi, K.H.; Cho, M.U.; Park, C.W.; Kim, S.Y.; Kim, M.J.; Hong, B.; Kong, Y.K. A Comparison Study of Posture and Fatigue of Neck According to Monitor Types (Moving and Fixed Monitor) by Using Flexion Relaxation Phenomenon (FRP) and Craniovertebral Angle (CVA). Int. J. Environ. Res. Public Health 2020, 17, 6345. [Google Scholar] [CrossRef]
- Lee, S.; Choi, Y.H.; Kim, J. Effects of the cervical flexion angle during smartphone use on muscle fatigue and pain in the cervical erector spinae and upper trapezius in normal adults in their 20s. J. Phys. Ther. Sci. 2017, 29, 921–923. [Google Scholar] [CrossRef] [PubMed] [Green Version]
- Marina Samaan, E.E.; Elnahhas, A.; Hendawy, A. Effect of prolonged smartphone use on cervical spine and hand grip strength in adolescence. Int. J. Multidiscip. Res. Dev. 2018, 5, 49–53. [Google Scholar]
- Castien, R.; Blankenstein, N.; van der Windt, D.; Heymans, M.; Dekker, J. The Working Mechanism of Manual Therapy in Participants With Chronic Tension-Type Headache. J. Orthop. Sport. Phys. Ther. 2013, 43, 693–699. [Google Scholar] [CrossRef] [Green Version]
- Shin, Y.; Kim, W.; Kim, S. Correlations among visual analogue scale, neck disability index, shoulder joint range of motion, and muscle strength in young women with forward head posture. J. Exerc. Rehabil. 2017, 13, 413–417. [Google Scholar] [CrossRef] [Green Version]
- Singla, D.; Veqar, Z. Association Between Forward Head, Rounded Shoulders, and Increased Thoracic Kyphosis: A Review of the Literature. J. Chiropr. Med. 2017, 16, 220–229. [Google Scholar] [CrossRef] [Green Version]
- Werth, A.J.; Babski-Reeves, K. Effects of portable computing devices on posture, muscle activation levels and efficiency. Appl. Ergon. 2014, 45, 1603–1609. [Google Scholar] [CrossRef]
- Kinel, E.; Roncoletta, P.; Pietrangelo, T.; D’Amico, M. 3D Stereophotogrammetric Quantitative Evaluation of Posture and Spine Proprioception in Subacute and Chronic Nonspecific Low Back Pain. J. Clin. Med. 2022, 11, 546. [Google Scholar] [CrossRef] [PubMed]
- Brunton, J.; Brunton, E.; Mhuiri, A.N. Reliability of measuring natural head posture using the craniovertebral angle. In Proceedings of the Irish Ergonomics Society Annual Conference; Irish Ergonomics Society: Limerick, Ireland, 2003; pp. 37–40. [Google Scholar]
- van Niekerk, S.M.; Louw, Q.; Vaughan, C.; Grimmer-Somers, K.; Schreve, K. Photographic measurement of upper-body sitting posture of high school students: A reliability and validity study. BMC Musculoskelet. Disord. 2008, 9, 113. [Google Scholar] [CrossRef] [PubMed] [Green Version]
- Salahzadeh, Z.; Maroufi, N.; Ahmadi, A.; Behtash, H.; Razmjoo, A.; Gohari, M.; Parnianpour, M. Assessment of forward head posture in females: Observational and photogrammetry methods. J. Back Musculoskelet. Rehabil. 2013, 27, 131. [Google Scholar] [CrossRef] [PubMed]
- Weber, P.; Corrêa, E.C.R.; Milanesi, J.M.; Soares, J.C.; Trevisan, M.E. Craniocervical posture: Cephalometric and biophotogrammetric analysis. Braz. J. Oral Sci. 2012, 11, 416–421. [Google Scholar]
- Iunes, D.; Bevilaqua-Grossi, D.; Oliveira, A.; Castro, F.; Salgado, H. Comparative analysis between visual and computerized photogrammetry postural assessment. Braz. J. Phys. Ther. 2009, 13, 308–315. [Google Scholar] [CrossRef] [Green Version]
- Osokin, D. Real-time 2d multi-person pose estimation on cpu: Lightweight openpose. arXiv 2018, arXiv:1811.12004. [Google Scholar]
- Vincent, O.R.; Folorunso, O. A descriptive algorithm for sobel image edge detection. Proc. Informing Sci. Educ. Conf. (InSITE) 2009, 40, 97–107. [Google Scholar]
- Derpanis, K.G. The Harris Corner Detector; York University: Toronto, ON, Canada, 2004; Volume 2. [Google Scholar]
- Canny, J. A computational approach to edge detection. IEEE Trans. Pattern Anal. Mach. Intell. 1986, PAMI-8, 679–698. [Google Scholar] [CrossRef]
- Brancati, R.; Cosenza, C.; Niola, V.; Savino, S. Experimental Measurement of Underactuated Robotic Finger Configurations via RGB-D Sensor. Advances in Service and Industrial Robotics. RAAD 2018. Mech. Mach. Sci. 2019, 67, 533. [Google Scholar] [CrossRef]
- Viera, A.J.; Garrett, J.M. Understanding interobserver agreement: The kappa statistic. Fam. Med. 2005, 37, 360–363. [Google Scholar]
- Krippendorff, K. Content Analysis: An Introduction to Its Methodology, 4th ed.; Sage Publications, International Educational and Professional Publisher: Thousand Oaks, CA, USA; London, UK; New Delhi, India, 2018; pp. 221–285. [Google Scholar]


| C7 Spinous Process | Ear Tragus | |
|---|---|---|
| Detection accuracy (acc) | 80% | 83% |
| Measure | C7 Spinous Process | Ear Tragus |
|---|---|---|
| 68,760.81 | 11,094.77 | |
| 80,683.63 | 13,316.21 | |
| 0.99 | 0.99 | |
| 0.99 | 0.99 |
Publisher’s Note: MDPI stays neutral with regard to jurisdictional claims in published maps and institutional affiliations. |
© 2022 by the authors. Licensee MDPI, Basel, Switzerland. This article is an open access article distributed under the terms and conditions of the Creative Commons Attribution (CC BY) license (https://creativecommons.org/licenses/by/4.0/).
Share and Cite
Kramer, I.; Bauer, S.; Matejcek, A. Automated Detection of Ear Tragus and C7 Spinous Process in a Single RGB Image—A Novel Effective Approach. BioMedInformatics 2022, 2, 318-331. https://0-doi-org.brum.beds.ac.uk/10.3390/biomedinformatics2020020
Kramer I, Bauer S, Matejcek A. Automated Detection of Ear Tragus and C7 Spinous Process in a Single RGB Image—A Novel Effective Approach. BioMedInformatics. 2022; 2(2):318-331. https://0-doi-org.brum.beds.ac.uk/10.3390/biomedinformatics2020020
Chicago/Turabian StyleKramer, Ivanna, Sabine Bauer, and Anne Matejcek. 2022. "Automated Detection of Ear Tragus and C7 Spinous Process in a Single RGB Image—A Novel Effective Approach" BioMedInformatics 2, no. 2: 318-331. https://0-doi-org.brum.beds.ac.uk/10.3390/biomedinformatics2020020