Article

Growing Tomato under Protected Cultivation Conditions: Overall Effects on Productivity, Nutritional Yield, and Pest Incidences

by
Paola Sotelo-Cardona
,
Mei-Ying Lin
and
Ramasamy Srinivasan
*
World Vegetable Center, Tainan 74151, Taiwan
*
Author to whom correspondence should be addressed.
Submission received: 2 August 2021 / Revised: 1 September 2021 / Accepted: 3 September 2021 / Published: 8 September 2021

Abstract

:
Tomato continues to be one of the most important crops worldwide, and protected cultivation is practiced to overcome the biotic and abiotic stresses to which the plant are exposed during growth. In this study we evaluated the effect of colored net houses on the growth, yield and nutritional values, as well as the incidence of common pests under three different light conditions: (1) colored (magenta), (2) conventional (white), and open field conditions. A colored net house led the plants to grow taller with higher lycopene content, but recorded a higher number of whiteflies, compared to the conventional net house and open field conditions. Furthermore, plants under protected structures recorded lower SPAD values, but larger terminal leaflets, lower damage by leaf miners, but more damage caused by spider mites compared to those plants grown under open field conditions. Overall, we found that the use of colored net houses provided a positive effect on tomato production in terms of improvement in morphometric parameters, however, to obtain higher yields under this production system, it is important to reduce the elevated temperature and increase the relative humidity inside the protective structures to be adapted for local growing conditions in Taiwan.

1. Introduction

Tomato (Solanum lycopersicum L.) continues to be a very important crop, being second after potato worldwide [1], and during the last decade, there has been a substantial increase in the cultivated area and production, from 4.4 to 5 million Ha and from 153 to 181 million tons, respectively [2]. At the regional level, Asia accounted for almost 62% of production share, followed by the Americas (13.2%), Europe (12.6%) and Africa (12%). The top five tomato producers are China (mainland) with 62.8 million tons, followed by India (19 million tons), Turkey (12.8 million tons), USA (10.9 million tons), and Egypt (6.8 million tons) [2].
Tomato production has undergone many changes in the way it is being grown in different regions, since different limiting factors including climatic conditions, availability of water and nutrients, and quality and quantity of light must be taken into account to provide appropriate conditions for the optimal growth and development of the crop. Specifically, greenhouse production allows growers to make changes in the light quality or photobiology, which consists of manipulating different wavelengths in order to modify the morphological characteristics of tomato plants based on their specific light requirements [3].
Given the condition of sessile organisms, plants have a complex system for the perception of light that allows them to adjust and optimize their performance and metabolism based on the particular prevalent conditions. As summarized by Arsovski et al. [4], light affects many developmental and physiological processes including germination [5], flowering [6], and direction of growth [7]. Likewise, two distinct functions of light have been described: photosynthesis and photomorphogenesis. In the case of photosynthesis, pigments such as chlorophyll a and b and carotenoids are responsible for the use of visible light or photosynthetically active radiation, absorbing light in two regions of the spectrum, blue (B: 400–500 nm) and red (R: 600–700 nm). In the case of photomorphogenesis, or the processes related to morphological and physiological changes, at least four major classes of photoreceptors are used: the phytochromes in red/far-red wavelengths [8], the cryptochromes responding in blue and UVA [9,10], the phototropins responding in blue (phototropism), and UVB photoreceptors [11]. In terms of practical application of these results, a wide variety of techniques have been used to create specific spectral modifications under protected cultivation structures (i.e., greenhouses, plastic net-houses, and tunnels), which provide protection and colored-differentiated solar radiation that may promote physiological responses that are controlled by light in order to improve commercial production of different vegetable crops [12,13].
Colored shade nets allow a better utilization of the sunlight due to the manipulation of the spectra of radiation reaching the crops, thus promoting physiological responses in plant and fruit development, including leaf area index, chlorophyll and carotenoid contents, tissue structure, fruit ripening, physiological disorders, nutritional quality, etc. [14]. Furthermore, previous studies had shown that red and pearl color shading structures improved tomato fruit quality [15] and carotenoid content [16]. In contrast, high temperatures and high solar radiation may reduce lycopene and β-carotene levels during tomato production, resulting in fruit damage, sunscald and increasing unmarketable fruit yield [17].
In order to get more information about the effect of colored net houses on tomato production for specific climatic conditions in Taiwan, the objective of this study is to assess the effect of colored net houses on plant morphometric parameters and growth, productivity and nutritional yield, as well as to evaluate the incidence of whiteflies, leaf miners, and spider mite, which are the common tomato insect pests under three different light conditions: a colored net house (magenta color pattern), a conventional net house (white), and open field conditions.

2. Materials and Methods

2.1. Location

The study was conducted at the World Vegetable Center (Shanhua, Tainan, Taiwan; 23°08′29″ N, 120°19′15″ E) at a mean elevation of 9 m above the sea level, following a complete randomized block design (CRBD), with four blocks for each protective structures/growing conditions, during spring season 2020 (March-May). Moreover, the three growing conditions were: Colored net house (magenta color pattern, 80% density knitted shade net), conventional white net house (clear color pattern, allowing full sunlight spectrum) and open field conditions. Nets were manufactured by SpectralX, LeBio International Technology Corp., Ltd. (Tainan, Taiwan) (Table 1). Differences in light spectrum for each light condition were recorded with a LM801S Portable Spectrometer (LeBio International Technology Corp., Ltd., Tainan, Taiwan) and analyzed with the LBSpectraH software (LeBio International Technology Corp., Ltd., Tainan, Taiwan) (Figure 1). In addition, climatic conditions (temperature and humidity) were recorded for the different light conditions (Figure 2).

2.2. Treatments and Data Collection

Tomato seeds (Taoyuan-Yasu No. 20 variety, Known-you seed Co., Ltd., Kaohsiung, Taiwan) were planted in seedling trays containing an equal mixture of vermiculite (Perlite and South Sea vermiculite, Taipei city, Taiwan) and peat moss growing media (Known-you seed Co., Ltd., Kaohsiung, Taiwan).
Two weeks later, seedlings were transplanted to the protective structures (i.e., colored/magenta- or conventional/white- poly net houses) or open field conditions. On each of the four blocks per growing condition, the tomato plants were planted on two raised beds (9.2-m long and 1.5-m wide). In addition, two rows of plants were grown per bed and spacing between plants was 0.5 m. A total of 80 plants were evaluated under each block per growing condition. Tomato plants were managed following the customary production practices, including surface irrigation at weekly intervals and manual weeding three times in the season. About 25 kg of compost (Chung Rong Industrial Company, Tainan, Taiwan) was applied to each bed at the beginning of the experiments.
Chlorophyll content of tomato was recorded on a weekly basis from the top third of the plants using a chlorophyll meter (SPAD-502, Konica Minolta Inc., Ramsey, NJ, USA), by measuring the absorbance of the leaves in the red and near-infrared wavelength regions. SPAD values are proportional to chlorophyll content present in the leaf, and high values indicate better chlorophyll accumulation (i.e., healthier plants) [18].
Terminal leaflet area (cm2) from the 8th node was recorded with a LI-3100 Area Meter (LI-COR®, Inc., Lincoln, NE, USA), where samples travel under a fluorescent light and the image is reflected to a scanning camera.
Furthermore, data on yield and nutritional analysis including lycopene, β-carotene, and vitamin C was carried out in all the crops and treatments. At harvest, marketable yields were calculated based on 80 plants per block and four blocks per growing condition. In addition, pooled marketable fruits were collected from each treatment and used for the nutritional analysis. Right after harvested, collected ripe tomato fruits were taken to the nutritional laboratory for further analysis, and samples were processed and stored at −80 °C to avoid degradation in the compounds of interest.

2.3. Nutritional Analysis

2.3.1. Lycopene and β-Carotene

Carotene content was calculated using a high-performance liquid chromatography (HPLC) method [19]. Briefly, 0.1 g of freeze-dried powder was mixed thoroughly with 0.5 mL of distilled water and 4.5 mL of acetone in glass vial, and the mixture was shaken for 30 min. Two mL of the supernatant were pipetted into 10 mL test tube, and then dried using N2 gas at 36 °C for 20 min. 100 µL of tetrahydrofuran (THF) and 1900 µL methanol was added to the dried sample and mixed well. Later, the solution was filtered through a membrane filter (0.22 μm) and 2 mL of the final solution was injected into HPLC vials by using glass syringes enclosed with 0.22 µm pore size, and 13 mm diameter syringe filter. Separation and subsequent carotenoid identification were performed using a HPLC system (Waters 2695, Milford, MA, USA) equipped with an auto-sampler, and a photodiode array detector (Waters 996) to monitor 210–700 nm wavelength. The static phase was a C 30 Column (YMC™ Carotenoid 3.0 μm, 4.6 mm × 150 mm). The running conditions were set at 30 °C using a gradient at 1.3 mL/min from 0% to 1% THF in methanol at 0–15 min, 1–25% THF in methanol at 15–25 min, 25–70% THF in methanol at 25–50 min, and the final 100% THF at 50–60 min. The identification of carotenoid samples was performed by comparing retention time and light absorption spectra (350–700 nm) of known standards. The peak areas were calibrated against known amounts of standards.

2.3.2. Vitamin C

Total ascorbic acid was determined on the basis of coupling 2,4-dinitrophenylhydrazine (DNPH) with the ketonic groups of dehydroascorbic acid through the oxidation of ascorbic acid by 2,6-dichlorophenolindolphenol (DCPIP) to form a yellow-orange color under acidic conditions [20]. Twenty g of tomato frozen slurry was blended with 80 mL of the extraction solution (45 g of metaphosphoric acid and 120 mL of acetic acid were dissolved into 1500 mL of distilled water) in a homogenizer. The blended mixture was centrifuged at 7000 rpm for 10 min. After centrifuging, 0.3 mL of the supernatant was poured into three test tubes containing 1.7 mL of the extraction solution, which represent two replications of the samples and another one was considered as a blank for the sample. About 0.1 mL of 0.2% 2,6-DCPIP sodium solution and 2 mL of 2% thiourea in 5% metaphosphoric acid were added into each test tube. Except the blank tube, 1 mL of 4% 2,4-DNPH in 9 N sulfuric acid was added to the sample tubes and kept in a water bath (37 °C) for 3 h, followed by an ice bath for 10 min, and 5 mL of 85% sulfuric acid was added and the mixtures were kept at room temperature for 30 min. 1 mL of 4% 2,4-DNPH in 9N sulfuric acid was added into the blank tube and cooled in the ice bath, kept at room temperature for 30 min. The absorbance was determined in the spectrophotometer at 520 nm (U-2001, Hitachi, Tokyo, Japan). Commercial L-(+)-ascorbic acid was used for calibration.

2.4. Monitoring of Insect Pests

In addition, the presence of whiteflies, leaf miners, and spider mite was also monitored on a weekly basis during morning hours on the different treatments. In the case of whiteflies, eight randomly selected leaves per block was collected in order to record the combined number of eggs, nymphs, puparium, and adult exuviae (N = 32 leaves/growing condition/week). For leaf miners and spider mites, visual damage was recorded on eight randomly selected plants using a 0–5 scale [21], with level 0 = plants no affected; level 1: number of branches with damage symptom/total branches = 10%; level 2: number of branches with damage symptom/total branches = 20%; level 3: number of branches with damage symptom/total branches = 30%; level 4: number of branches with damage symptom/total branches = 40%; and level 5: number of branches with damage symptom/total branches = 50% (N = 32 plants/growing condition).

2.5. Data Analysis

Morphometric, productivity and nutritional yield data was analyzed using ANOVA with the procedure Proc GLM of SAS version 9.4 (SAS Institute, Cary, NC, USA). When significant, post-hoc Tukey’s HSD test was conducted to identified mean differences (differences were considered significant at α = 0.05). Data on whitefly incidence was log (x + 1) transformed before analysis, and parameters for normal distribution were evaluated using the Proc Univariate, and Shapiro-Wilk test to normality. For leaf miner and spider mite infestation, categorical data for infestation levels was analyzed using the CATMOD procedure in SAS and the analysis of variance was estimated using a Chi-Square test for the treatment parameter. Figures for leaf miner and spider mite infestation were created by using Proc FREQ and Mosaic Plot option in SAS. Data for the results section is based on non-transformed data.

3. Results

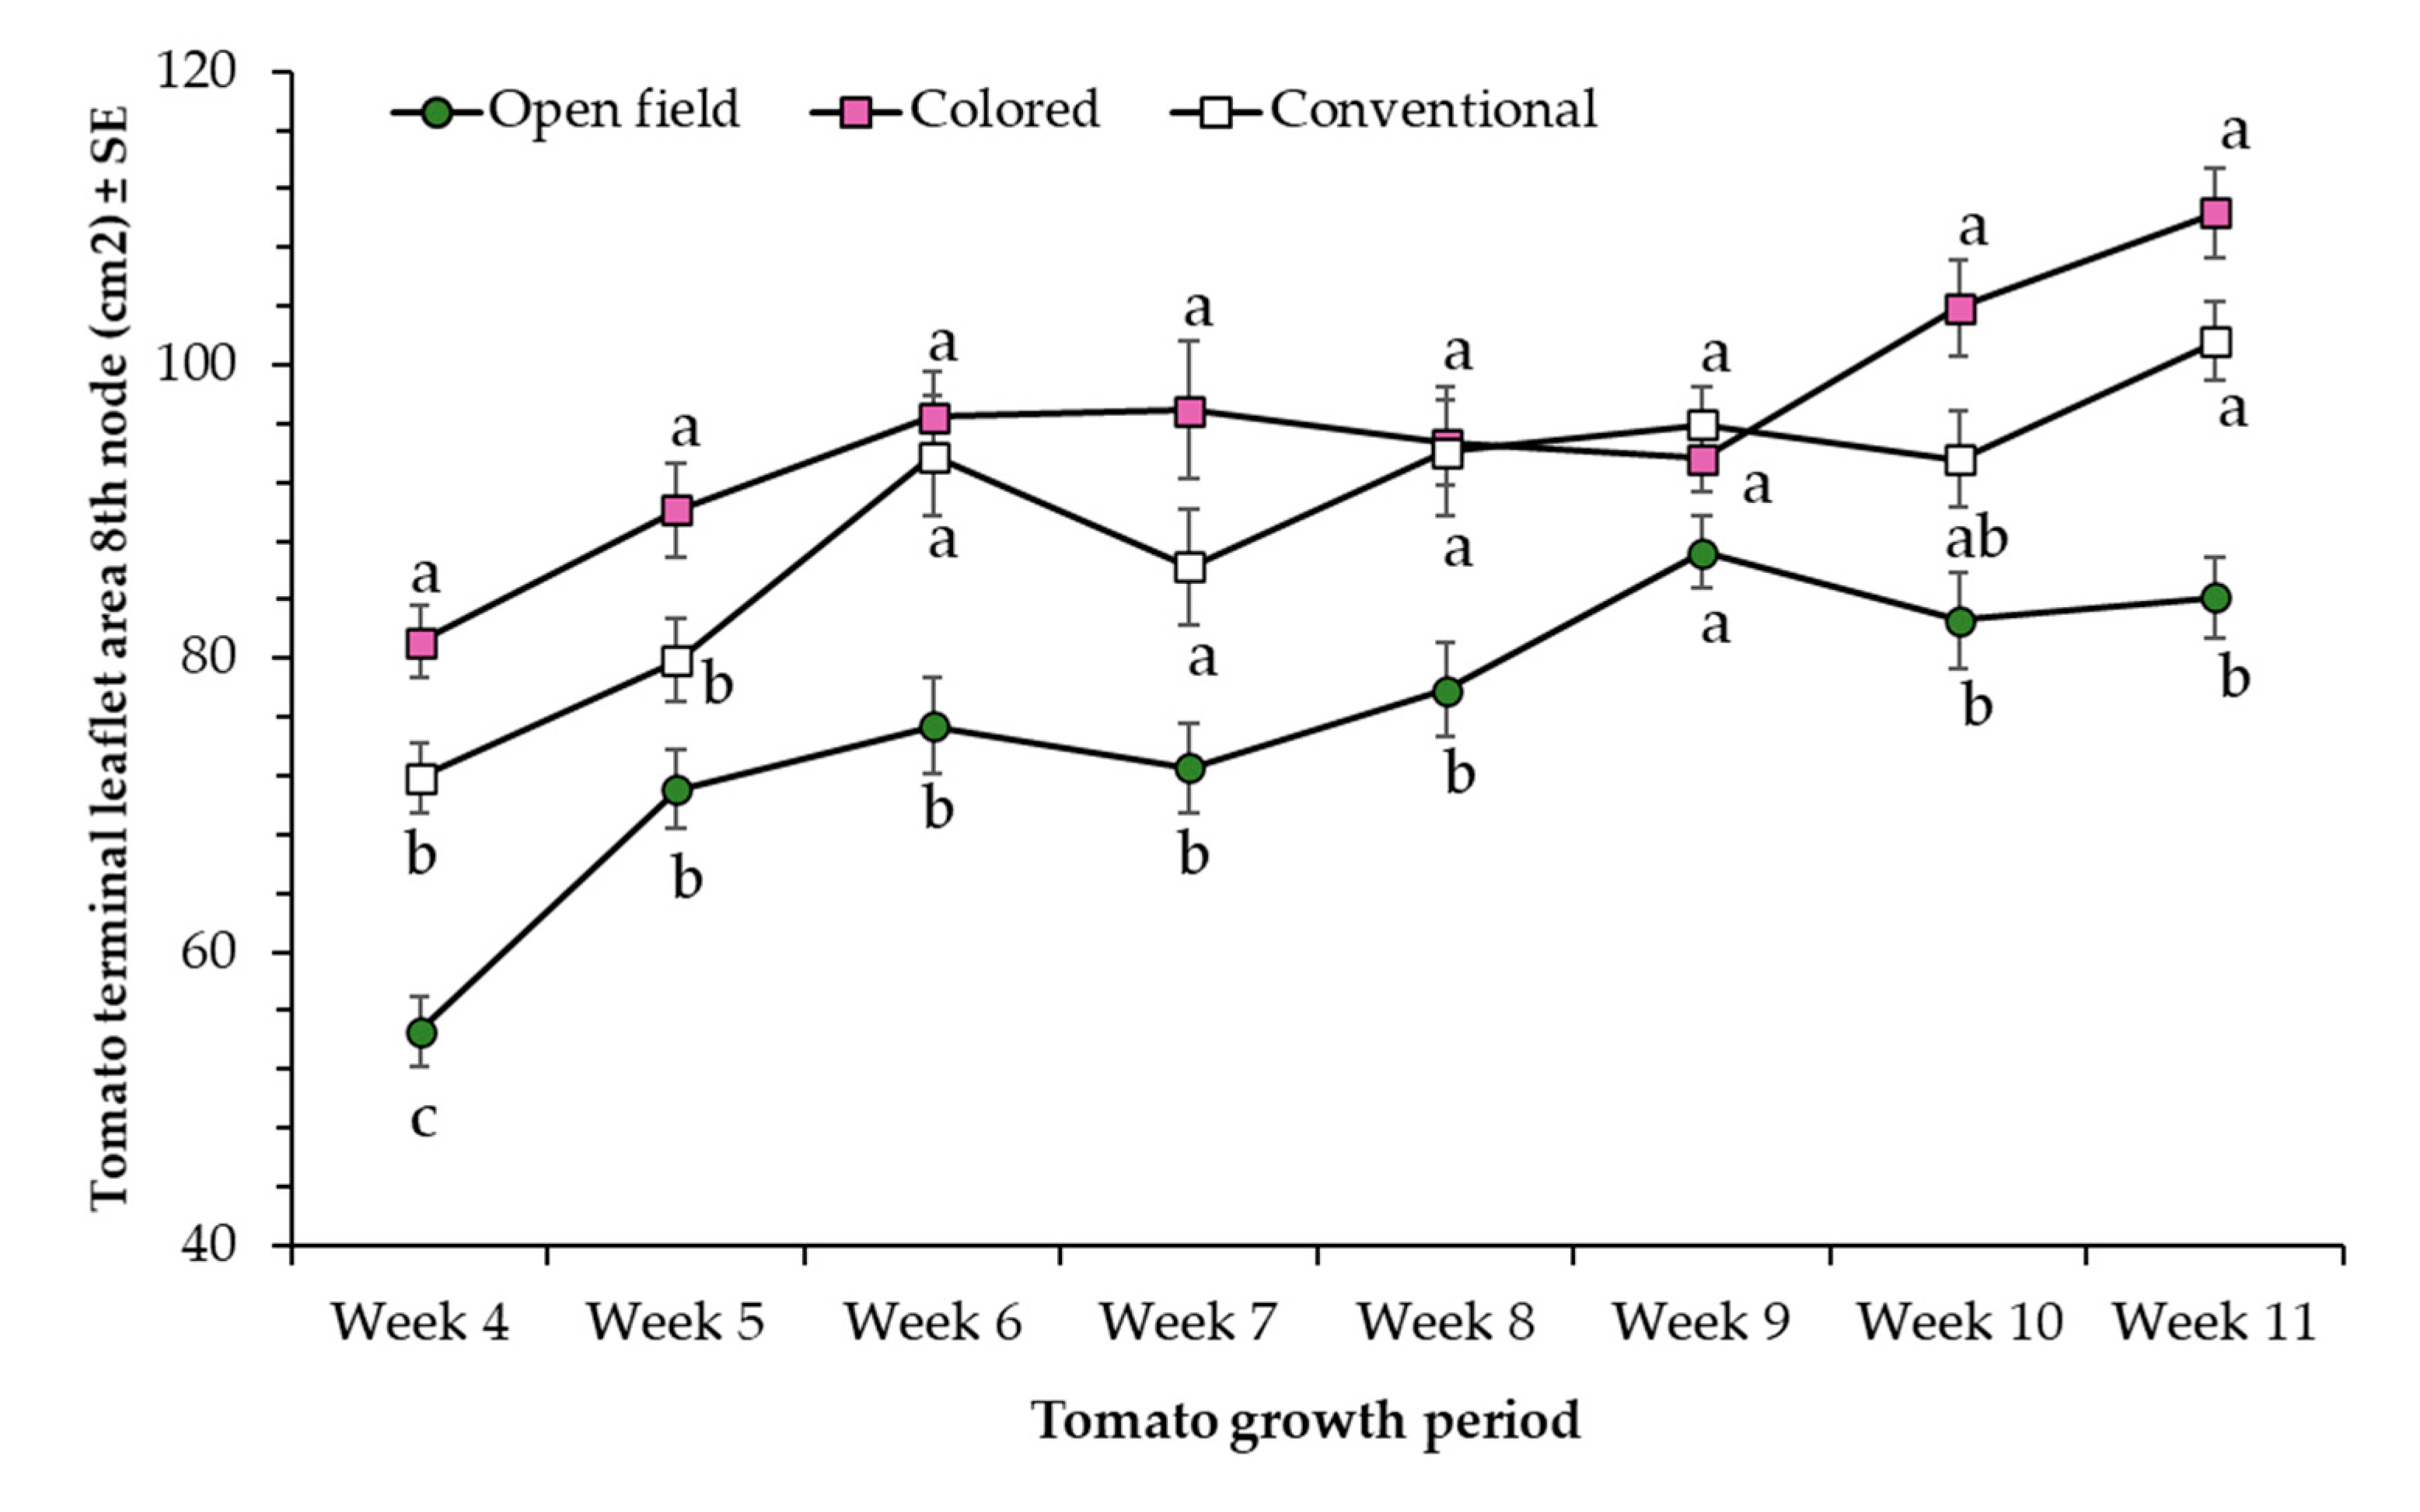
3.1. Morphometric Parameters

In general, open field condition tomato plants showed significantly higher SPAD values compared to plants evaluated under conventional net house (i.e., white) and colored net house (i.e., magenta/pink) conditions (Figure 3). In addition, results showed a significant increase in SPAD values from week 2 to 7, and a stabilization of SPAD readings from week 7 to 10. Likewise, plants transplanted under colored net house were significantly taller than those transplanted under conventional net house, and open field conditions (Figure 4).
More specifically, final height of colored net house tomato plants recorded during week 11 was 7% and 33% higher compared to tomato plants grown under conventional net house and open field conditions, respectively. Regardless of the color of the net house, the terminal leaflet area measured on tomato plants grown on protected net houses was larger compared to plants grown in open field conditions (Figure 5).

3.2. Productivity and Nutritional Yield

In terms of nutritional yield, lycopene content was significantly higher for tomatoes harvested from the colored net house when compared to plants grown under conventional net house and open field conditions. In contrast, no differences were observed for productivity (i.e., yield), ß-carotene and Vitamin C content among the treatments (Table 2).

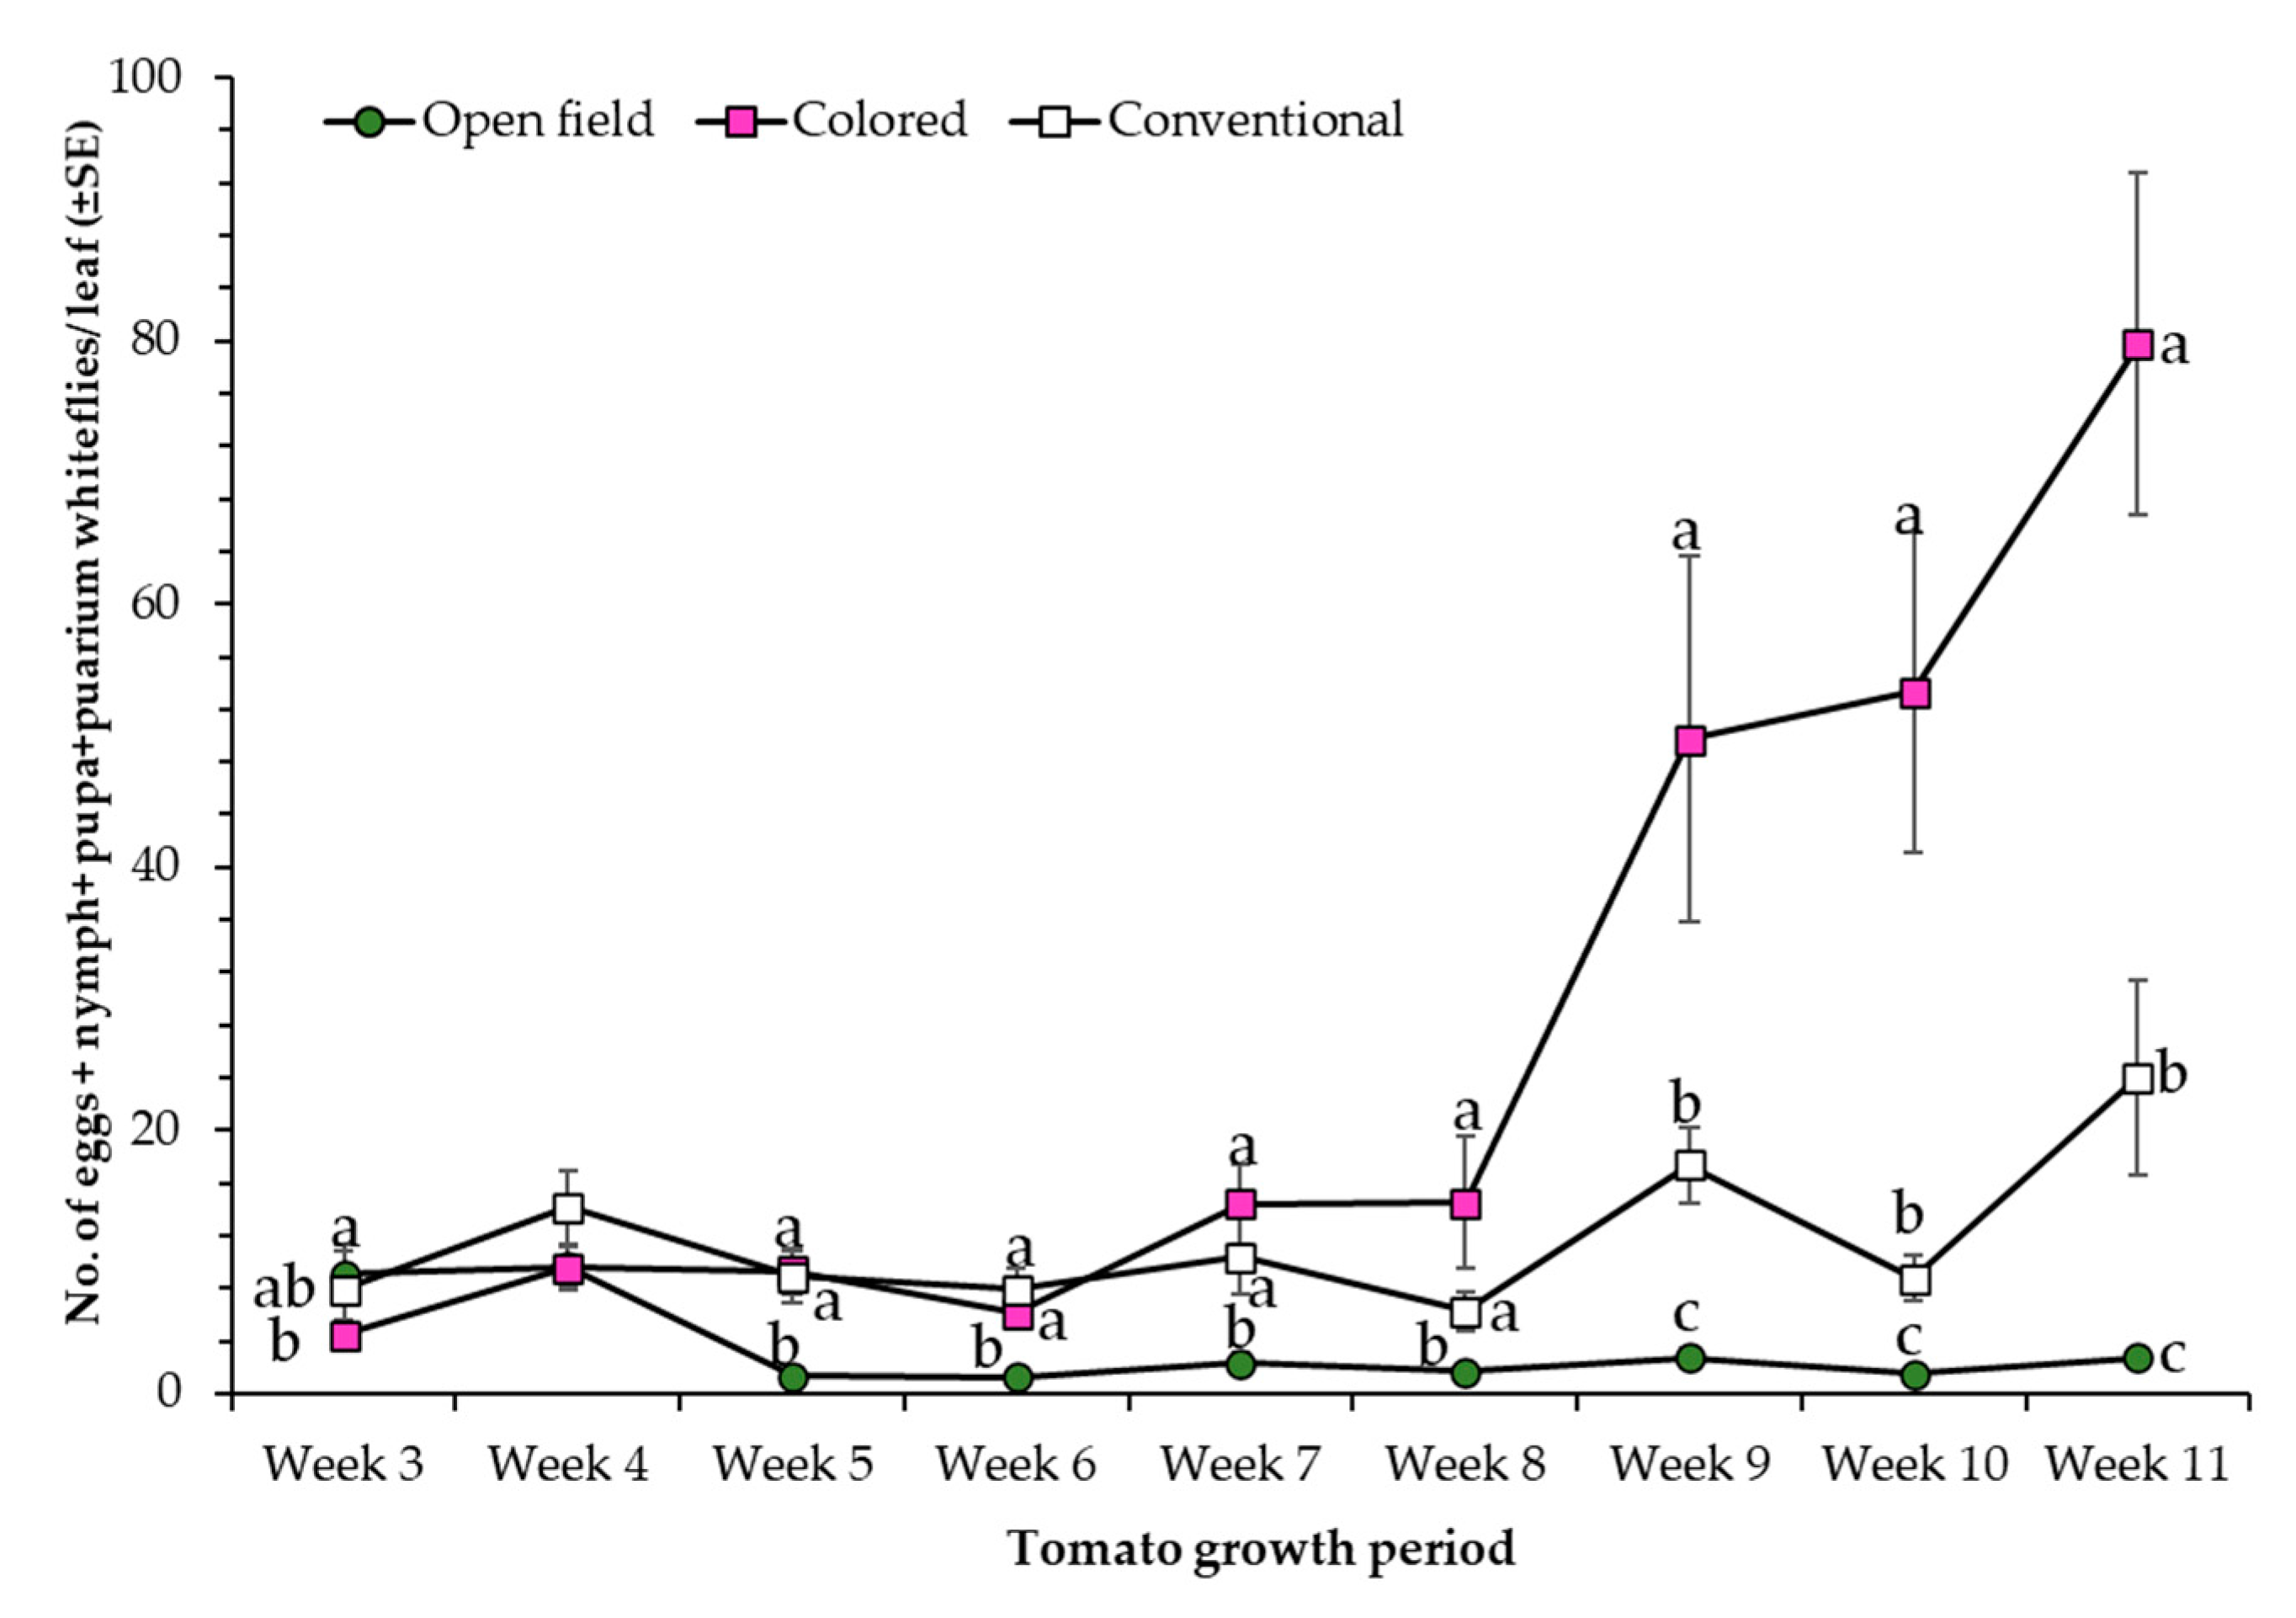
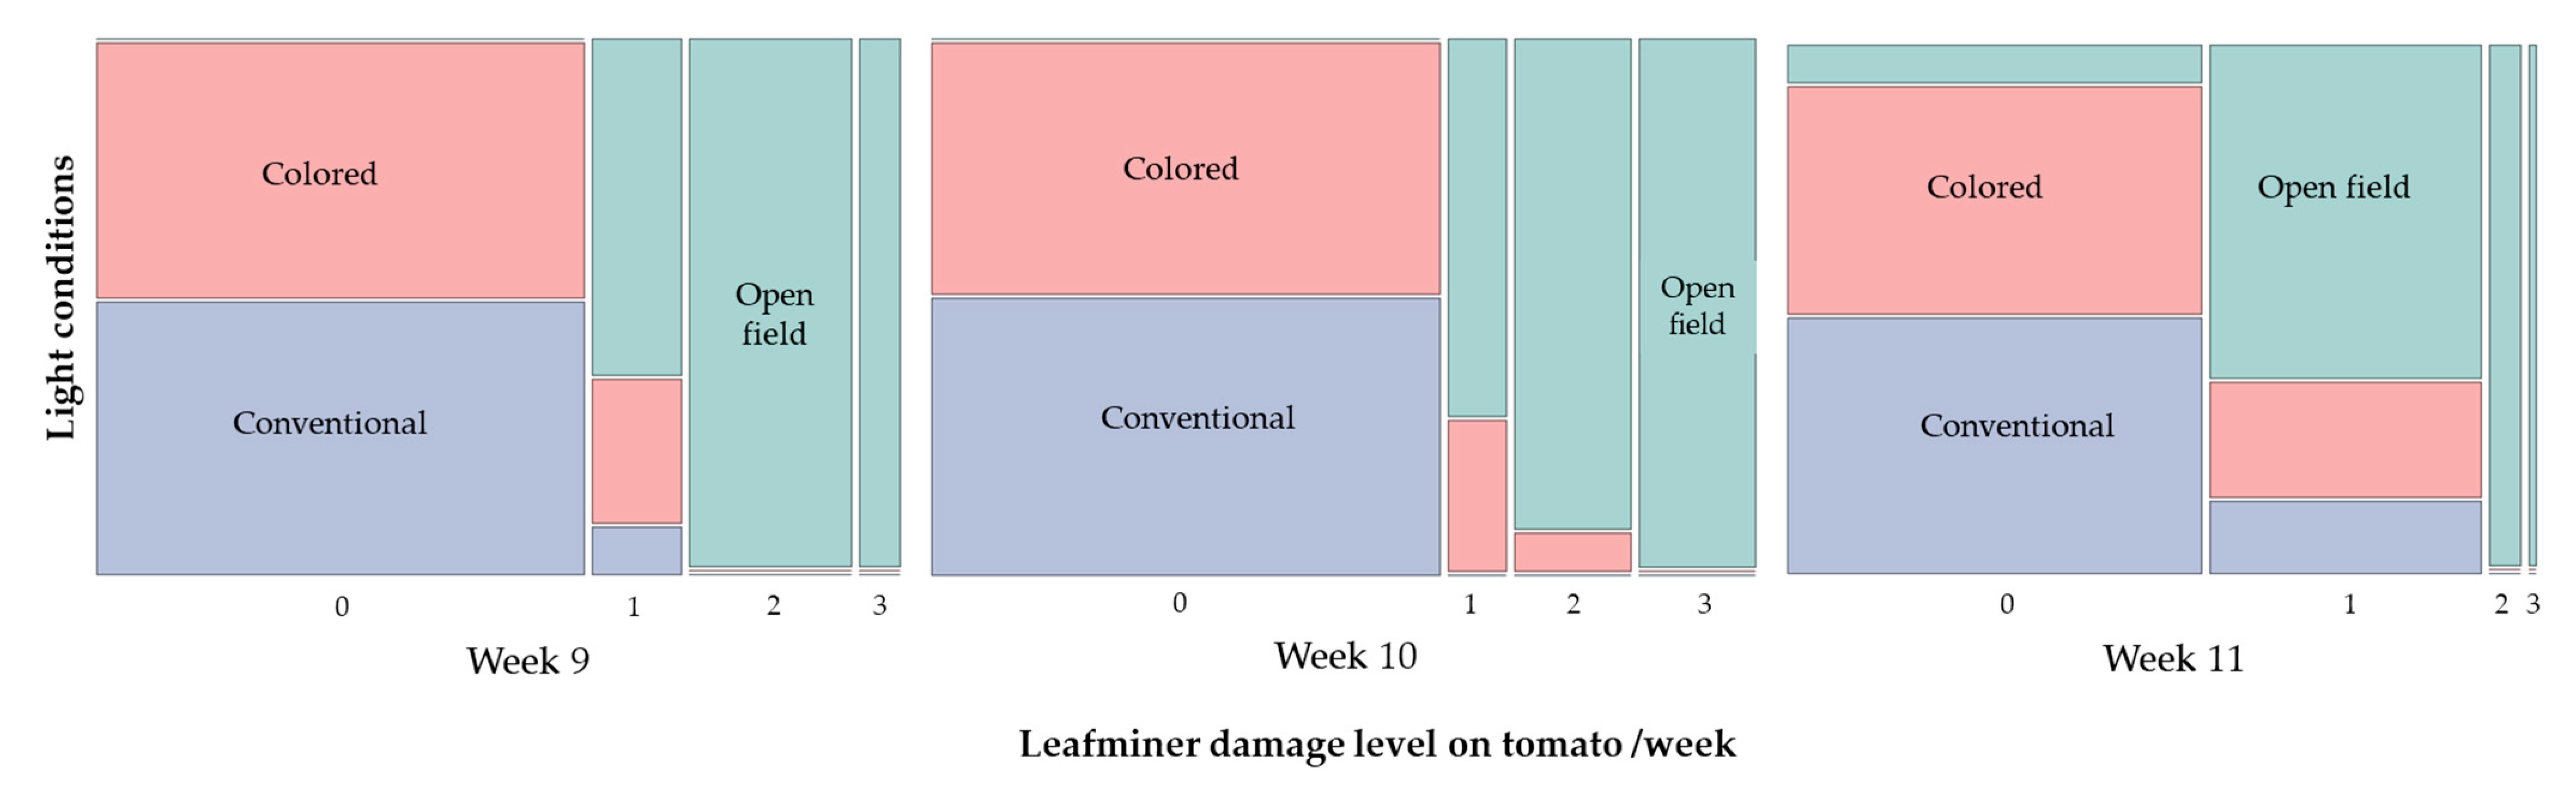
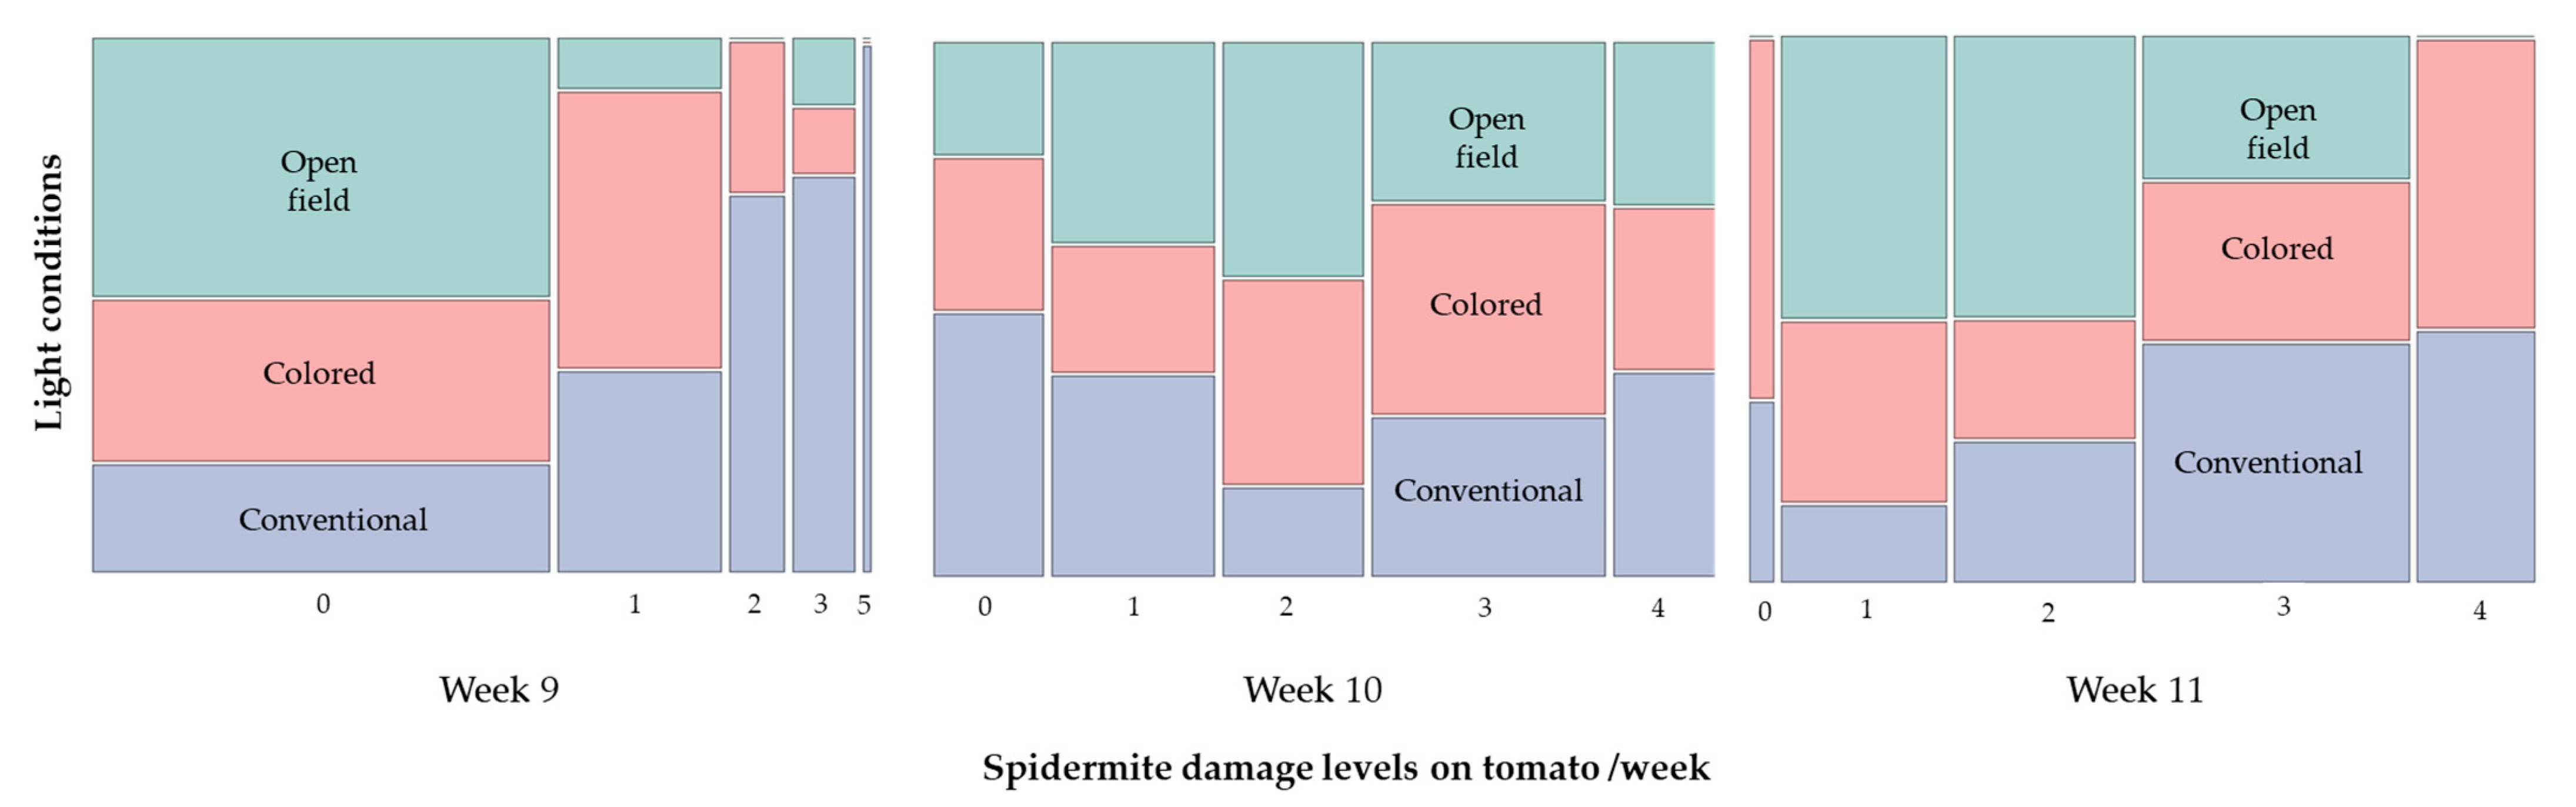
3.3. Monitoring of Insect Pests

A similar number of whiteflies was observed for the protected cultivation treatments from week 4 to week 8 compared to plants evaluated under open field conditions. However, from week 8, an increased number of whiteflies was observed for the colored net house compared to the other two treatments (Figure 6). Moreover, whitefly numbers were 3- and 29-fold higher in colored net house compared to the numbers recorded for the conventional net house and open field conditions, respectively during the last week of evaluation (i.e., week 11).
In terms of leafminer damage, open field condition plants showed higher damage level compared to plants from colored and conventional net houses across the last weeks of evaluations (i.e., weeks 9–11) (week 9: Chi-square = 99.45, p < 0.0001; week 10: Chi-square = 127.08, p < 0.0001; and week 11: Chi-square = 52.41, p < 0.0001) (Figure 7). More specifically, tomato open field condition plants were moderately infested (22% of plants with 10% of damage, and 78% of plants with 20–30% damage), whereas protected structures (i.e., colored and conventional net houses) recorded a damage of 0–1 or less than 10% damage during week 9 (Figure 7). The following week (week 10), similar damage figures were recorded with 84% of tomato plants from open field conditions showing up to 30% damage, whereas 91 and 100% of plants evaluated under colored and conventional net house conditions showed no leafminer damage, respectively (Figure 7).
During the last week, only 12.5% of the plants from open field conditions sustained no damage by leaf miners, whereas 87.6% recorded low to moderate damage (10–30%), compared to 75–84.4% plants grown on colored net houses, which did not have leafminer damage (Figure 7).
For spider mite infestation, differences among damage level were observed for weeks 9 and 11 (week 9: Chi-square = 21.21, p < 0.0001; and week 11: Chi-square = 11.45, p = 0.0007) (Figure 8). More specifically, during week 9, 91% of open field condition plants showed no visual damage caused by spider mite, compared to 37.5 and 56.2% of the plants evaluated on the conventional and colored net house conditions, respectively. In addition, 34.4% of colored net house plants showed 10% damage level, whereas 59% of conventional net house plants recorded 10–30% damage level. For week 11, only 3–6% of plants did not show any damage symptoms under conventional and colored net house conditions. 72% open field conditions plants sustained 10–20% damage, compared to 28 and 37.5% of the plants from conventional and colored net house conditions, respectively. In addition, 28% of the open field condition plants were moderately damaged (damage level 3), compared to 31% and 47% of the plants under conventional and colored net house conditions, respectively. About 22% conventional net house plants showed 40% damage caused by spider mites (Figure 8).

4. Discussion

In this study, the effect of different colored poly-net house was investigated and compared to open field conditions in terms of tomato morphometric parameters, including SPAD values, terminal leaflet area, and plant height, as well as productivity (i.e., yield), and nutritional yields (i.e., lycopene, β-carotene, and vitamin C). In addition, the overall incidence of whiteflies, leaf miners, and spider mite was also evaluated under the abovementioned conditions.
Use of a colored net house (i.e., magenta) led to taller plants with higher lycopene content, but with higher incidence of whiteflies, compared to a conventional net house (i.e., white net house) and open field conditions. Furthermore, plants under protected structures (i.e., colored and conventional net houses) recorded plants with lower SPAD values, but larger terminal leaflets, less damage caused by leaf miners, but in contrast, more damage by spider mites compared to those plants grown under open field conditions.
In general, vegetative and reproductive tomato growth stages might affect the recording of SPAD values as previously reported by other studies. Jiang et al. [22] have shown a strong correlation between SPAD values, and the content of chlorophyll a, b and total chlorophyll were dependent on the specific tomato growth stage. In terms of different SPAD value recordings in various treatments, protected cultivation offered a shade effect that reduced damaging effects caused by adverse environmental conditions [23]. In the current study, higher SPAD values were recorded under open field conditions, but in contrast, the same treatment recorded the lowest terminal leaflet area and plant height. High SPAD values can be the result of high plant temperature as consequence of unfavorable climatic conditions (i.e., water deficit), but also can depend on structural and phenological plant stages (i.e., flowering, fruit setting) [24]. Furthermore, and although not assessed in the current study, these authors also showed high SPAD values linked to a decrease in stomatal conductance, decreased photosynthesis, and retardation of development leading to low yield [24]. Given the fact that direct chlorophyl measurements were not recorded in the present study, a more detailed study is still needed to understand the relationship and differences between SPAD recordings and chlorophyll content for plants evaluated under different light conditions.
In terms of leaf area, a low light intensity may increase leaf area as an adaptation to shade, since cells expand more in order to receive higher amounts of light required for photosynthesis [15,25], which may explain why terminal leaf area was higher under protected structures compared to those evaluated under open field conditions.
In terms of yield, no significant differences were observed among the treatments, which could be caused in part for the differences in climatic conditions recorded under the different treatments, as protected cultivation regardless of the net color showed much higher temperatures and much lower relative humidity percentage compared to open field conditions. Previous studies have shown how an increase in temperatures could result in heat stress for tomato, evidenced as detrimental effects on fertility rate, flower drop, reduced fruit setting and in consequence reduce fruit production and lower yields [26,27,28]. Therefore, and although plants under colored shade conditions yielded taller plants, with larger leaves, the higher temperature recorded under this light condition may prevent the plants from achieving their full potential yield compared to conventional and open field conditions.
Another possibility in the lack of yield differences among the colored net houses with other treatments is a reduction in the blue light or a low R:FR ratio which prevailed under colored net house conditions compared to the other two treatments. Changes in light quality in the red (R) and far-red (FR) regions are detected by a family of red and far-red photoreceptors, which provide plants with important information in terms of crowded places as well as close proximity to other plants [29,30]. Furthermore, a low R:FR ratio is perceived by plants as a proximity signal (i.e., crowded of high density of plants), which elicits a shade-avoidance response [31], consisting of a series of changes that allow the plant to compete with neighboring plants for light resources. Such changes include stem and internode elongation, leaf petioles in older plants, and acceleration of flowering time [32]. However, given the changes in resource allocation, the activation of this response as a survival strategy may have an energetic cost that may cause low storage organ development, including a reduction on growth of leaves, roots, fruits and seeds [33]. In addition, plants growing under shade conditions may be affected on the sugar metabolism [34]. An alternative explanation is provided by Gent [35], who suggested that yield and plant growth may decrease when the climate is moderate, so the benefits of using shade are perceived only when plants are grown under a high sunlight intensity or in places under hot summer conditions. However, in the current study, although the sunlight intensity can be counteracted by the shading effect of the colored net houses, still more research is needed in order to reduce the high temperature inside these protected structures.
In our study, although no significant differences in yield were found, the lycopene content was positively affected by the colored net house conditions. Environmental factors, including light and temperature, may influence the chemical and nutritional composition of tomatoes, including lycopene, accounting for 80–90% of the total pigments presented in ripened tomato [36]. Previous studies had reported that the accumulation of lycopene is under the control of phytochromes located in the fruit, and an accumulation of this component is possible under red light treatment [37,38]. The results of the current study showed more lycopene on colored net house plants compared to conventional net house and open field condition plants. In addition, the differences with the other treatments could be due to direct exposure to excessive sunlight and high temperature that inhibit the synthesis of lycopene [15,39].
Whitefly incidence and spider mite damage were significantly higher on plants growing under colored net house conditions compared to those on conventional net house and open field conditions. In addition to the favorable high temperature and low humidity percentage, the shading effect offered by the colored net conditions seems to have offered the right conditions for the rapid multiplication of whitefly population under this particular protected structure. In contrast, the high temperature and low relative humidity recorded under protected conditions seemed to deter the presence of leaf miners, as damage levels were very low, whereas higher damage levels were observed under more mild temperature and higher relative humidity conditions offered by open field conditions. Furthermore, the size of the insects is another important aspect to consider, as it had been previously shown that whiteflies and spider mites can easily enter through the nets, even if they are 50–60 mesh size [40]. In addition, several studies had also indicated the need to optimize the mesh size to reduce adverse climatic conditions by allowing better ventilation, and reducing the heat, while offering effective protection against insect pests [41,42].
As previously mentioned, plants growing under shade conditions or low R:FR suffer from shade avoidance response that may affect several phytohoromones, which are responsible for growth and reallocation of plant resources, leading to plant survival in crowded communities. However, the cost of this shade avoidance response is among others a down regulation of the jasmonic acid pathway, therefore reducing the defense response of plants to the attack of insect pests, exposing the plant to high levels of hervibory as previously documented for different crop plants [43,44,45,46].

5. Conclusions

The use of colored shade nets continues to be a good strategy to allow a better utilization of the sunlight due to the manipulation of the light spectrum which in turns promote desire physiological plant responses. Thus, the use of colored net houses has a positive effect on tomato production in terms of improvement in morphometric parameters, such as plant height, and leaf area, and nutritional content such as lycopene. However, in order to obtain more yields under this production system, the improvement of growing conditions that reduce elevated temperature and providing a proper relative humidity are key for this technology to be adapted to the local growing conditions in Taiwan. In addition, it is also important to use integrated pest management approaches to ensure low numbers of small-sized tomato pests under protected cultivation conditions.

Author Contributions

Conceptualization, R.S. and P.S.-C.; methodology, P.S.-C. and M.-Y.L.; software, P.S.-C.; validation, P.S.-C., M.-Y.L. and R.S.; formal analysis, P.S.-C.; investigation, P.S.-C.; resources, R.S.; data curation, P.S.-C.; writing—original draft preparation, P.S.-C.; writing—review and editing, R.S., M.-Y.L. and P.S.-C.; visualization, P.S.-C.; supervision, R.S.; project administration, R.S.; funding acquisition, R.S. All authors have read and agreed to the published version of the manuscript.

Funding

This research was funded by the Council of Agriculture, Taiwan and by core donors to the World Vegetable Center: Taiwan, the Foreign, Commonwealth & Development Office (FCDO) from the UK government, United States Agency for International Development (USAID), Australian Centre for International Agricultural Research (ACIAR), Germany, Thailand, Philippines, Korea, and Japan.

Data Availability Statement

The data presented in this study are available on request from the corresponding author. The data is publicly available and can be accessed from https://worldveg.tind.io/.

Acknowledgments

The authors express their gratitude to the Safe and Sustainable Value Chains Flagship Program and the Nutrition Group at World Vegetable Center for their continuous support for the field work, laboratory analysis and general assistance.

Conflicts of Interest

The authors declare no conflict of interest.

References

  1. Costa, J.M.; Heuvelink, E. The Global Tomato Industry. In Tomatoes; CABI Publishing: Wallingford, UK, 2018; pp. 276–313. [Google Scholar]
  2. FAO. Crops and Livestock Products. Available online: http://www.fao.org/faostat/en/#data/QCL (accessed on 30 July 2021).
  3. Rajapakse, N.C.; Shahak, Y. Light-quality manipulation by horticulture industry. In Light and Plant Development. Annal Plant Reviews; Whitelam, G.C., Halliday, K.J., Eds.; Blackwell Publishing: Oxford, UK, 2007; Volume 30, pp. 290–312. [Google Scholar]
  4. Arsovski, A.A.; Galstyan, A.; Guseman, J.M.; Nemhauser, J.L. Photomorphogenesis. Arab. Book 2012, 10, e0147. [Google Scholar] [CrossRef] [Green Version]
  5. Bentsink, L.; Koornneef, M. Seed Dormancy and Germination. Arab. Book 2008, 6, e0119. [Google Scholar] [CrossRef] [Green Version]
  6. Alvarez-Buylla, E.R.; Benítez, M.; Corvera-Poiré, A.; Chaos-Cador, A.; de Folter, S.; Gamboa de Buen, A.; Garay-Arroyo, A.; García-Ponce, B.; Jaimes-Miranda, F.; Pérez-Ruiz, R.V.; et al. Flower Development. Arab. Book 2010, 8, e0127. [Google Scholar] [CrossRef] [Green Version]
  7. Pedmale, U.V.; Celaya, R.B.; Liscum, E. Phototropism: Mechanism and Outcomes. Arab. Book 2010, 8, e0125. [Google Scholar] [CrossRef] [Green Version]
  8. Wang, H.; Deng, X.W. Phytochrome Signaling Mechanism. Arab. Book 2004, 3, e0074. [Google Scholar] [CrossRef] [Green Version]
  9. Yu, X.; Liu, H.; Klejnot, J.; Lin, C. The Cryptochrome Blue Light Receptors. Arab. Book 2010, 8, e0135. [Google Scholar] [CrossRef] [PubMed] [Green Version]
  10. Chaves, I.; Pokorny, R.; Byrdin, M.; Hoang, N.; Ritz, T.; Brettel, K.; Essen, L.O.; van der Horst, G.T.; Batschauer, A.; Ahmad, M. The cryptochromes: Blue light photoreceptors in plants and animals. Annu. Rev. Plant. Biol. 2011, 62, 335–364. [Google Scholar] [CrossRef]
  11. Rizzini, L.; Favory, J.J.; Cloix, C.; Faggionato, D.; O’Hara, A.; Kaiserli, E.; Baumeister, R.; Schafer, E.; Nagy, F.; Jenkins, G.I.; et al. Perception of UV-B by the Arabidopsis UVR8 protein. Science 2011, 332, 103–106. [Google Scholar] [CrossRef] [Green Version]
  12. Shahak, Y.; Gussakovsky, E.E.; Gal, E.; Ganelevin, R. Colornets: Crop protection and light-quality manipulation in one technology. Acta Hortic. 2004, 659, 143–151. [Google Scholar] [CrossRef]
  13. Kotilainen, T.; Robson, T.M.; Hernández, R. Light quality characterization under climate screens and shade nets for controlled-environment agriculture. PLoS ONE 2018, 13, e0199628. [Google Scholar] [CrossRef] [PubMed]
  14. Ilić, Z.S.; Fallik, E. Light quality manipulation improves vegetable quality at harvest and postharvest: A review. Environ. Exp. Bot. 2017, 139, 79–90. [Google Scholar] [CrossRef]
  15. Ilić, S.Z.; Milenković, L.; Šunić, L.; Fallik, E. Effect of coloured shade-nets on plant leaf parameters and tomato fruit quality. J. Sci. Food Agric. 2015, 95, 2660–2667. [Google Scholar] [CrossRef]
  16. Selahle, M.K.; Sivakumar, D.; Soundy, P. Effect of photo-selective nettings on postharvest quality and bioactive compounds in selected tomato cultivars. J. Sci. Food Agric. 2014, 94, 2187–2195. [Google Scholar] [CrossRef]
  17. Díaz-Pérez, J.C. Bell pepper (Capsicum annuum L.) crop as affected by shade level: Fruit yield, quality, and postharvest attributes, and incidence of phytophthora blight (caused by Phytophthora capsici Leon.). HortScience 2014, 49, 891–900. [Google Scholar] [CrossRef] [Green Version]
  18. Süß, A.; Danner, M.; Obster, C.; Locherer, M.; Hank, T.; Richter, K. Measuring leaf chlorophyll content with the Konica Minolta SPAD-502Plus—Theory, Measurement, Problems, Interpretation. EnMAP Field Guides Tech. Rep. GFZ Data Serv. 2015. [Google Scholar] [CrossRef]
  19. Rodriguez-Amaya, D.B.; Kimura, M. Harvest Plus Handbook for Carotenoids Analysis; Harvest Plus Technical Monograph 2; International Food Policy Research Institute (IFPRI): Washington, DC, USA; International Center for Tropical Agriculture (CIAT): Cali, Colombia, 2004; p. 58. [Google Scholar]
  20. Pelletier, O. Vitamin C (L-ascorbic and dehydro-L-ascorbic acids). In Methods of Vitamin Assay, 4th ed.; Augustin, J., Klein, B.P., Becker, D.A., Venugopal, P.B., Eds.; Wiley: New York, NY, USA, 1985; pp. 303–347. [Google Scholar]
  21. Nihoul, P.; Van Impe, G.; Hance, T. Characterizing indices of damage to tomato by the two-spotted spider mite, Tetranychus urticae Koch (Acari: Tetranychidae) to achieve biological control. J. Hortic. Sci. 1991, 66, 643–648. [Google Scholar] [CrossRef]
  22. Jiang, C.; Johkan, M.; Hohjo, M.; Tsukagoshi, S.; Maruo, T. A correlation analysis on chlorophyll content and SPAD value in tomato leaves. Hort. Res. 2017, 71, 37–42. [Google Scholar] [CrossRef]
  23. Ilić, Z.S.; Milenković, L.; Šunić, L.; Manojlović, M. Color shade nets improve vegetables quality at harvest and maintain quality during storage. Contemp. Agric. 2018, 67, 9–19. [Google Scholar] [CrossRef] [Green Version]
  24. Nemeskéri, E.; Neményi, A.; Bőcs, A.; Pék, Z.; Helyes, L. Physiological factors and their relationship with the productivity of processing tomato under different water supplies. Water 2019, 11, 586. [Google Scholar] [CrossRef] [Green Version]
  25. Boardman, N.K. Comparative photosynthesis of sun and shade plants. Ann. Rev. Plant Physiol. 1977, 28, 355–377. [Google Scholar] [CrossRef]
  26. Berry, S.; Uddin, M. Effect of high temperature on fruit set in tomato cultivars and selected germplasm. HortScience 1988, 23, 606–608. [Google Scholar]
  27. Peet, M.M.; Willits, D.; Gardner, R. Response of ovule development and post-pollen production processes in male-sterile tomatoes to chronic, sub-acute high temperature stress. J. Exp. Bot. 1997, 48, 101–111. [Google Scholar] [CrossRef]
  28. Ayankojo, I.T.; Morgan, K.T. Increasing air temperatures and its effects on growth and productivity of tomato in South Florida. Plants. 2020, 9, 1245. [Google Scholar] [CrossRef]
  29. Franklin, K.A.; Whitelam, G.C. Phytochromes and shade-avoidance responses in plants. Ann. Bot. 2005, 96, 169–175. [Google Scholar] [CrossRef] [Green Version]
  30. Schrager-Lavelle, A.; Herrera, L.A.; Maloof, J.N. Tomato phyE is required for shade avoidance in the absence of phyB1 and phyB2. Front. Plant Sci. 2016, 7, 1275. [Google Scholar] [CrossRef] [Green Version]
  31. Smith, H.; Whitelam, G. Phytochrome, a family of photoreceptors with multiple physiological roles. Plant Cell Environ. 1990, 13, 695–707. [Google Scholar] [CrossRef]
  32. Nozue, K.; Tat, A.V.; Devisetty, U.K.; Robinson, M.; Mumbach, M.R.; Ichihashi, Y.; Lekkala, S.; Maloof, J.N. Shade avoidance components and pathways in adult plants revealed by phenotypic profiling. PLoS Genet. 2015, 11, e1004953. [Google Scholar] [CrossRef] [Green Version]
  33. de Wit, M.; George, G.M.; Ince, Y.C.; Dankwa-Egli, B.; Hersch, M.; Zeeman, S.C.; Fankhauser, C. Changes in resource partitioning between and within organs support growth adjustment to neighbor proximity in Brassicaceae seedlings. Proc. Natl. Acad. Sci. USA 2018, 115, E9953–E9961. [Google Scholar] [CrossRef] [Green Version]
  34. Quinet, M.; Angosto, T.; Yuste-Lisbona, F.J.; Blanchard-Gros, R.; Bigot, S.; Martinez, J.P.; Lutts, S. Tomato fruit development and metabolism. Front. Plant Sci. 2019, 10, 1554. [Google Scholar] [CrossRef] [Green Version]
  35. Gent, M.P.N. Effect of degree and duration of shade on quality of greenhouse tomato. HortScience 2007, 42, 514–520. [Google Scholar] [CrossRef]
  36. García-Valverde, V.; Navarro-Gonzáles, I.; García-Alonso, J.; Periago, J.M. Antioxidant bioactive compounds in selected industrial processing and fresh consumption tomato cultivars. Food Bioprod. Technol. 2013, 6, 391–402. [Google Scholar] [CrossRef]
  37. Lee, G.H.; Bunn, J.M.; Han, Y.J.; Christenbury, G.D. Ripening characteristics of light irradiation tomatoes. J. Food Sci. 1997, 62, 138–140. [Google Scholar] [CrossRef]
  38. Alba, R.; Cordonnier-Pratt, C.; Pratt, L.H. Fruit-localized phytochromes regulate lycopene accumulation independently of ethylene production in tomato. Plant Physiol. 2000, 123, 363–370. [Google Scholar] [CrossRef] [Green Version]
  39. Brandt, S.; Pék, Z.; Barna, E.; Lugasi, A.; Helyes, L. Lycopene content and colour of ripening tomatoes as affected by environmental conditions. J. Sci. Food Agric. 2006, 86, 568–572. [Google Scholar] [CrossRef]
  40. Kaur, S.; Srinivasan, R.; Cheema, D.; Lal, T.; Ghai, T.; Chadha, M. Monitoring of major pests on cucumber, sweet pepper and tomato under net-house conditions in Punjab, India. Pest. Manag. Hortic. Ecosyst. 2010, 16, 148–155. [Google Scholar]
  41. Saidi, M.; Gogo, E.O.; Itulya, F.M.; Martin, T.; Ngouajio, M. Microclimate modification using eco-friendly nets and floating row covers improves tomato (Lycopersicon esculentum) yield and quality for small holder farmers in East Africa. Agric. Sci. 2013, 4, 577. [Google Scholar] [CrossRef] [Green Version]
  42. Nordey, T.; Basset-Mens, C.; De Bon, H.; Martin, T.; Déletré, E.; Simon, S.; Parrot, L.; Despretz, H.; Huat, J.; Biard, Y.; et al. Protected cultivation of vegetable crops in sub-Saharan Africa: Limits and prospects for smallholders. A review. Agron. Sustain. Dev. 2017, 37, 1–20. [Google Scholar] [CrossRef] [Green Version]
  43. Moreno, J.E.; Tao, Y.; Chory, J.; Ballare, C.L. Ecological modulation of plant defense via phytochrome control of jasmonate sensitivity. Proc. Natl. Acad. Sci. USA 2009, 106, 4935–4940. [Google Scholar] [CrossRef] [PubMed] [Green Version]
  44. Agrawal, A.A.; Kearney, E.E.; Hastings, A.P.; Ramsey, T.E. Attenuation of the jasmonate burst, plant defensive traits, and resistance to specialist monarch caterpillars on shaded common milkweed (Asclepias syriaca). J. Chem. Ecol. 2012, 38, 893–901. [Google Scholar] [CrossRef]
  45. de Wit, M.; Spoel, S.H.; Sanchez-Perez, G.F.; Gommers, C.M.M.; Pieterse, C.M.J.; Voesenek, L.A.; Pierik, R. Perception of low red: Far-red ratio compromises both salicylic acid- and jasmonic acid-dependent pathogen defences in Arabidopsis. Plant J. 2013, 75, 90–103. [Google Scholar] [CrossRef] [Green Version]
  46. Yang, C.W.; Li, L. Hormonal regulation in shade avoidance. Front. Plant Sci. 2017, 8, 1527. [Google Scholar] [CrossRef] [PubMed]
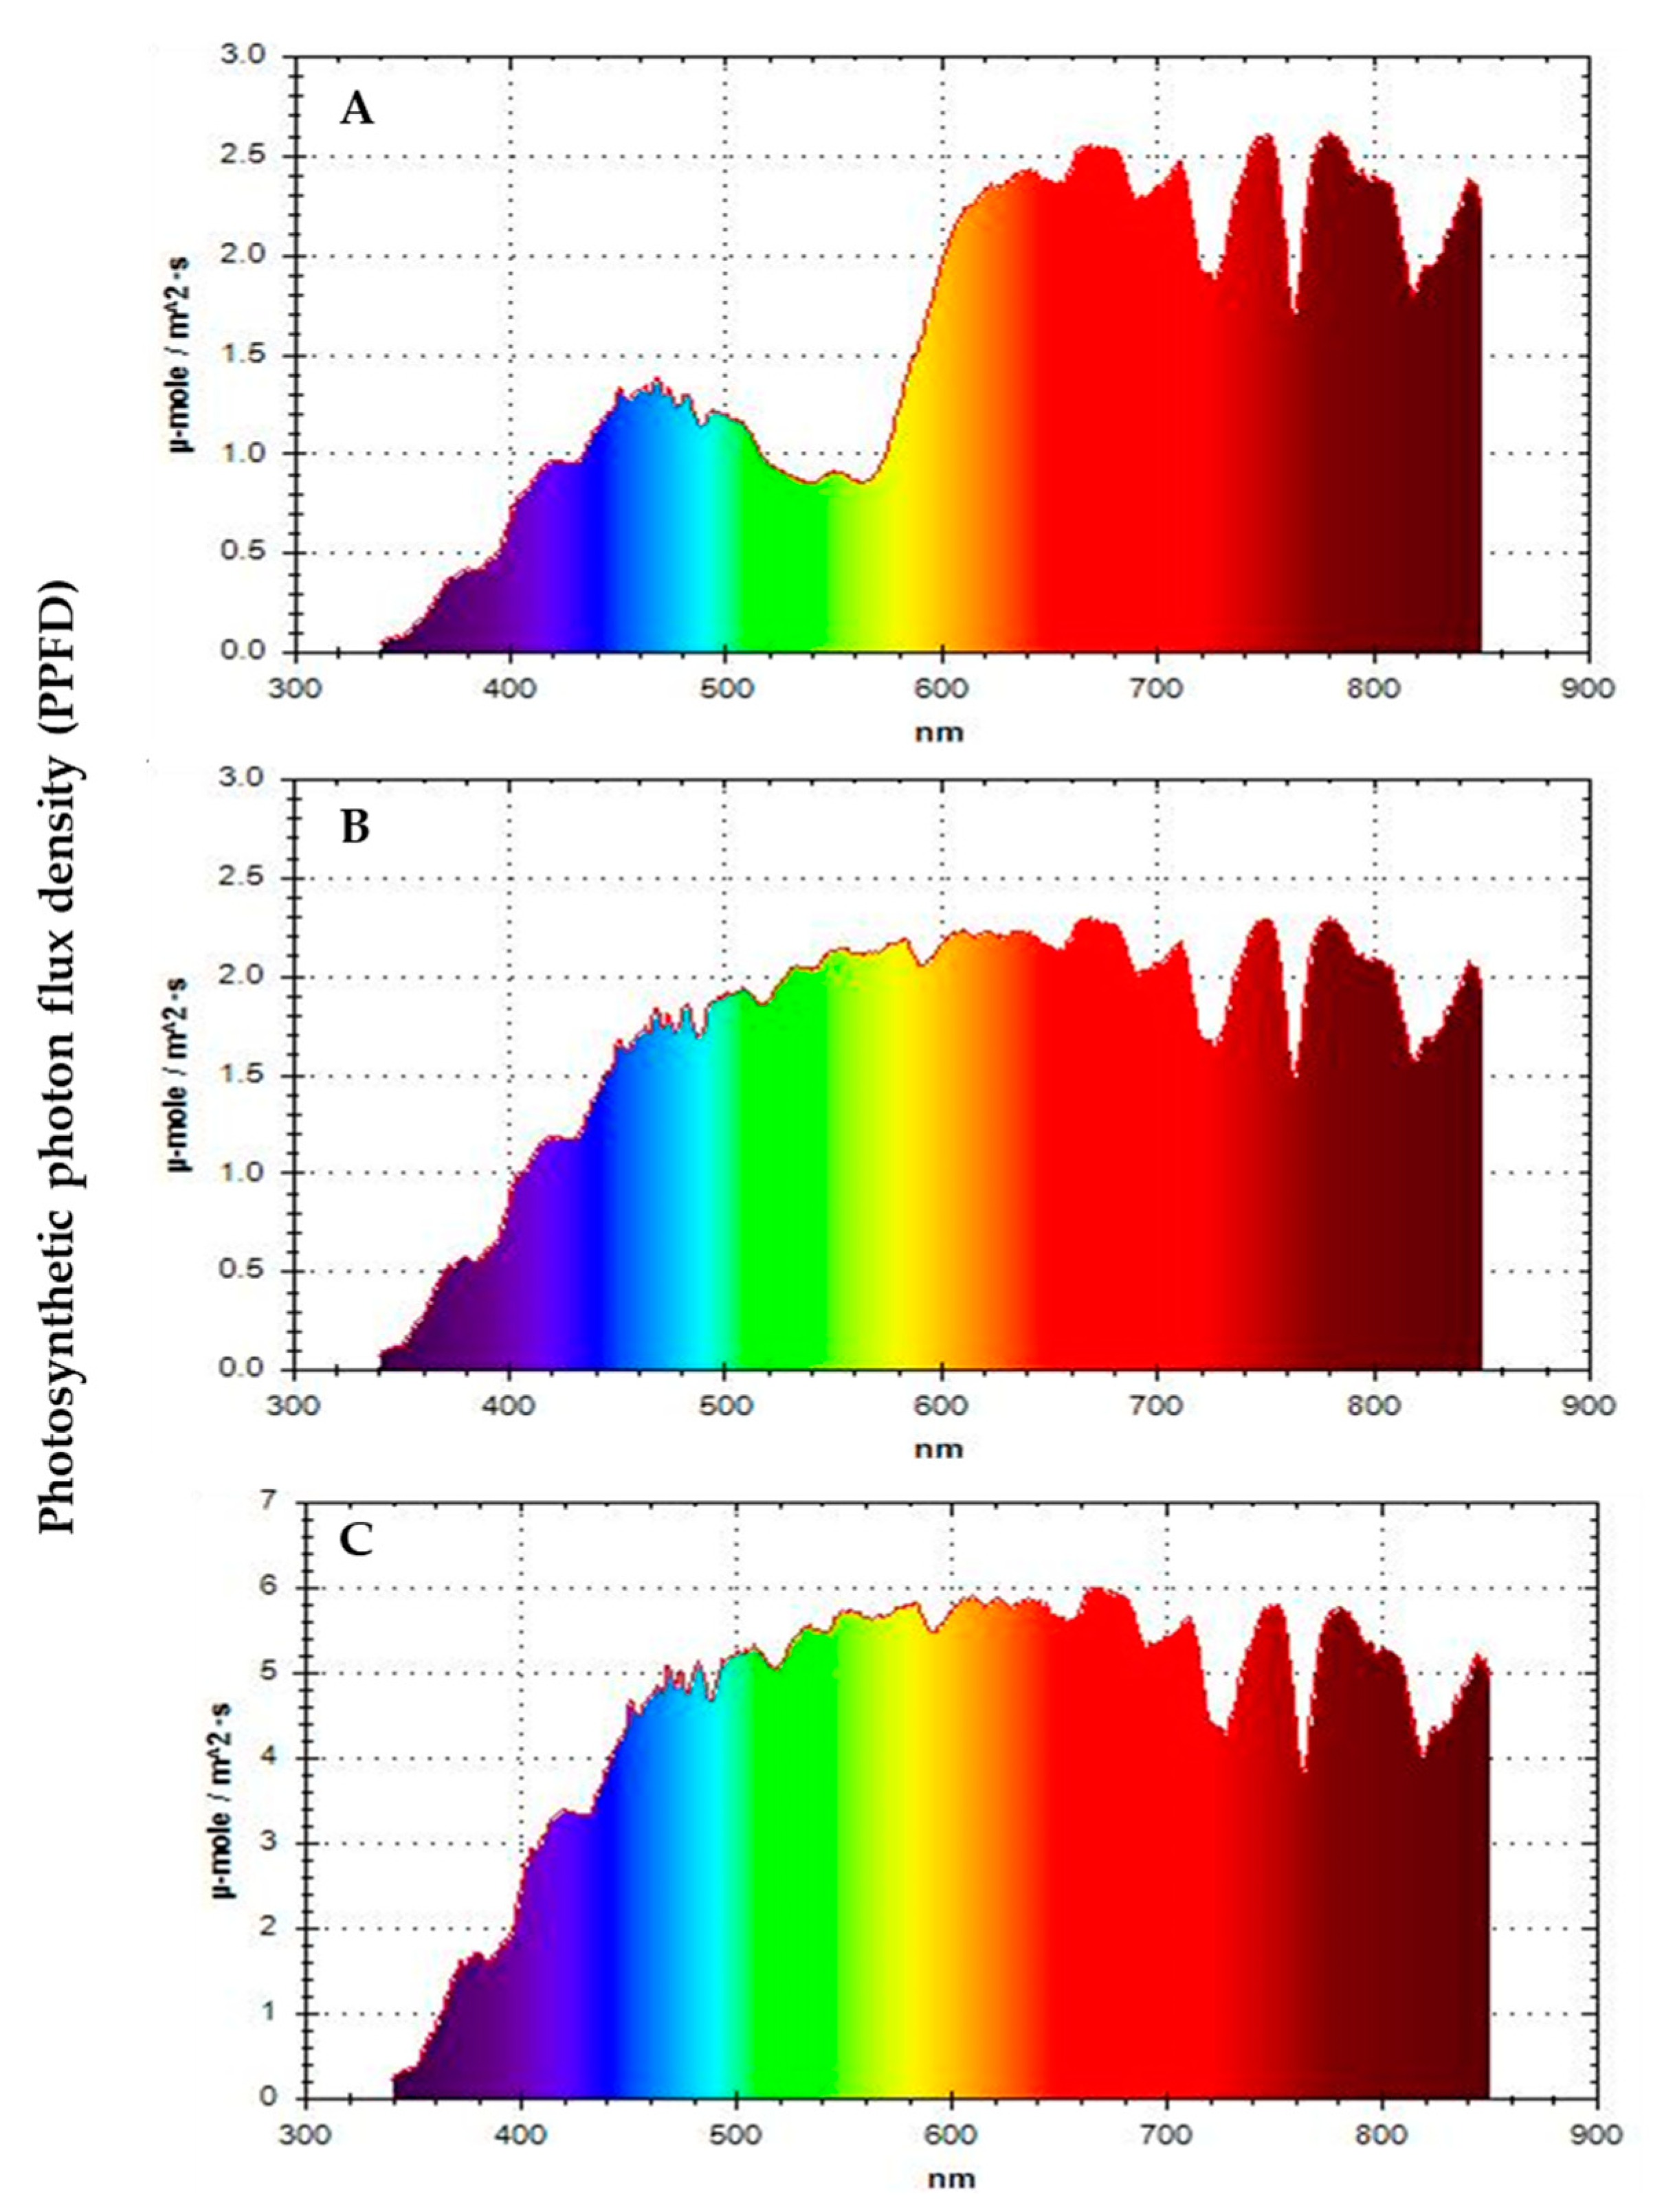
Figure 1. General Photosynthetic photon flux density (PPFD) measured at three light conditions: (A) Colored net house (magenta color pattern), (B) conventional net house (white), and (C) open field conditions.
Crops 01 00010 g001
Figure 2. Climatic conditions, (A) mean air temperature at noon (°C ± SD), and (B) relative humidity (RH% ± SD) measured at three light conditions: Colored net house (magenta color pattern), conventional net house, and open field conditions. Weekly measures collected during 12 March–13 May 2020.
Crops 01 00010 g002
Figure 3. Chlorophyll content represented by measured SPAD values (±SE) of tomato leaves evaluated under three different light conditions, colored net house (magenta color pattern), conventional net house, and open field conditions. Weekly measures collected during 12 March–13 May 2020. Statistical significances are represented by lower letters within each evaluation week. Week 2 (F2,95 = 37.26; p > F ≤ 0.0001); Week 3 (F2,95 = 37.26; p > F ≤ 0.0001); Week 4 (F2,95 = 63.57; p > F ≤ 0.0001); Week 5 (F2,95 = 38.66; p > F ≤ 0.0001); Week 6 (F2,95 = 21.99; p > F ≤ 0.0001); Week 7 (F2,95 = 3.49; p > F = 0.0346); Week 8 (F2,95 = 6.5; p > F = 0.0023); Week 9 (F2,95 = 23.57; p > F ≤ 0.0001); Week 10 (F2,95 = 16.7; p >F ≤ 0.0001); Week 11 (F2,95 = 9.46; p > F = 0.002). Standard error of the sample (SE) was calculated based on n = 32 observations/light condition.
Crops 01 00010 g003
Figure 4. Plant height (cm) (±SD) of tomato plants evaluated under three different light conditions, colored net house (magenta color pattern), conventional net house, and open field conditions. Weekly measures collected during 12 March–13 May 2020. Statistical significances are represented by lower letters within each evaluation week. Week 2 (F2,95 = 27.84; p > F ≤ 0.0001); Week 3 (F2,95 = 44.17; p > F ≤ 0.0001); Week 4 (F2,95 = 62.66; p > F ≤ 0.0001); Week 5 (F2,95 = 35.39; p > F ≤ 0.0001); Week 6 (F2,95 = 54.2; p > F ≤ 0.0001); Week 7 (F2,95 = 129.6; p > F ≤ 0.0001); Week 8 (F2,95 = 184.16; p > F ≤ 0.0001); Week 9 (F2,95 = 100.88; p > F ≤ 0.0001); Week 10 (F2,95 = 194.55; p > F ≤ 0.0001); Week 11 (F2,95 = 265.69; p > F ≤ 0.0001). Standard error of the sample (SE) was calculated based on n = 32 observations/light condition.
Crops 01 00010 g004
Figure 5. Terminal leaflet area (cm2) from the 8th node (±SD) of tomato plants evaluated under three different light conditions, colored net house (magenta color pattern), conventional net house, and open field conditions. Weekly measures collected during 26 March–13 May 2020. Statistical significances are represented by lower letters within each evaluation week. Week 4 (F2,95 = 30.74; p > F ≤ 0.0001); Week 5 (F2,95 = 10.95; p > F ≤ 0.0001); Week 6 (F2,95 = 10.98; p > F ≤ 0.0001); Week 7 (F2,95 = 9.69; p > F = 0.0002); Week 8 (F2,95 = 7.48; p > F = 0.001); Week 9 (F2,95 = 1.45; p > F = 0.2135); Week 10 (F2,95 = 10.36; p > F ≤ 0.0001); Week 11 (F2,95 = 23.48; p > F ≤ 0.0001). Standard error of the sample (SE) was calculated based on n = 32 observations/light condition.
Crops 01 00010 g005
Figure 6. Mean whitefly population (±SE) recorded on tomato plants evaluated under three different light conditions, colored net house (magenta color pattern), conventional net house, and open field conditions. Weekly measures collected during 19 March–13 May 2020. Statistical significances are represented by lower letters within each evaluation week. Week 3 (F2,95 = 4.56; p > F = 0.0129); Week 4 (F2,95 = 1.29; p > F = 0.2736); Week 5 (F2,95 = 15.88; p > F ≤ 0.0001); Week 6 (F2,95 = 19.28; p > F ≤ 0.0001); Week 7 (F2,95 = 13.84; p > F ≤ 0.0001); Week 8 (F2,95 = 15.06; p > F ≤ 0.0001); Week 9 (F2,95 = 45.35; p > F ≤ 0.0001); Week 10 (F2,95 = 90.86; p > F ≤ 0.0001); Week 11 (F2,95 = 91.62; p > F ≤ 0.0001). Standard error of the sample (SE) was calculated based on n = 32 observations/light condition.
Crops 01 00010 g006
Figure 7. Distribution of leafminer damage levels on tomato plants evaluated under three different light conditions, colored net house (magenta color pattern), conventional net house, and open field conditions. Weekly measures collected during 30 April–13 May 2020. Visual damage based on a 0–5 scale [21], level 0 = plants no affected; level 1 = 10%; level 2 = 20%; level 3 = 30%; level 4 = 40%; level 5 = 50% (N = 32 plants/growing condition).
Crops 01 00010 g007
Figure 8. Distribution of spider mite damage level on tomato plants evaluated under three different light conditions, colored net house (magenta color pattern), conventional net house, and open field conditions. Weekly measures collected during 30 April–13 May 2020. Visual damage based on a 0–5 scale [21], level 0 = plants no affected; level 1 = 10%; level 2 = 20%; level 3 = 30%; level 4 = 40%; level 5 = 50% (N = 32 plants/growing condition).
Crops 01 00010 g008
Table 1. Radiance, Photosynthetic photon flux density (PPFD), luminance and light spectrum percentages measured at three light conditions: Colored net house (magenta color pattern), conventional net house (white), and open field conditions *.
ParameterOpen FieldColored Net HouseConventional Net House
Material--PolyethylenePolyethylene
Radiance range (W⋅m−2)336.5–458.796.9–192.5124.3–228.9
PPFD range (μmol cm−2 s−1)1544.9–2304.1457.9–1019.8573.2–1153.8
Luminance range (lux)82,520–86,59019,559–24,23232,248–41,780
Red (R) range %37.5–38.952.1–53.238.5–39.2
Green (G) range %35.9–36.023.9–24.136.1–36.2
Blue (B) range %26.0–27.123.2–24.725.3–26.1
R/FR range %123.0–127.2117.6–122.8124.0–126.4
B/R range %66.9–72.243.9–47.564.7–67.8
* Red (600~700)/(400~700), Green (500~600)/(400~700), Blue (400~500)/(400~700), R/FR (655~665)/(725~735), B/R (400~500)/(600~700).
Table 2. Productivity and nutritional yield (±SE) for tomato evaluated under three different light conditions, colored net house (magenta color pattern), conventional net house, and open field conditions.
TreatmentNYield
(t/ha)
Lycopene
(g/ha)
ß-Carotene
(g/ha)
Vitamin C
(g/ha)
Open field411.6 ± 2.4645.7 ± 133.4 b92.6 ± 19.13911.6 ± 807.9
Colored net house416.1 ± 4.01846.6 ± 464.5 a116.2 ± 29.25796.9 ± 1458.2
Conventional net house415.7 ± 4.31041.6 ± 285.8 b130.2 ± 35.74228.2 ± 1160.1
F 2,111.7612.671.692.87
Pr > F0.25100.00700.26160.1332
Publisher’s Note: MDPI stays neutral with regard to jurisdictional claims in published maps and institutional affiliations.

