Article

The Gut Microbiota of Naturally Occurring and Laboratory Aquaculture Lytechinus variegatus Revealed Differences in the Community Composition, Taxonomic Co-Occurrence, and Predicted Functional Attributes

1
Department of Biology, The University of Alabama at Birmingham, 1300 University Blvd., Birmingham, AL 35294, USA
2
Department of Cell, Developmental and Integrative Biology, The University of Alabama at Birmingham, 1918 University Blvd., Birmingham, AL 35294, USA
*
Author to whom correspondence should be addressed.
Equal contribution by these authors presented alphabetically.
Current address: School of Medicine, University of Alabama at Birmingham, Birmingham, AL 35294, USA.
§
Current address: Department of Genetics, University of Alabama at Birmingham, Birmingham, AL 35294, USA.
Submission received: 20 May 2021 / Revised: 26 June 2021 / Accepted: 1 July 2021 / Published: 14 July 2021
(This article belongs to the Special Issue Microbiome in Ecosystem)

Abstract

:
Sea urchins, in many instances, are collected from the wild, maintained in the laboratory aquaculture environment, and used as model animals for various scientific investigations. It has been increasingly evident that diet-driven dysbiosis of the gut microbiome could affect animal health and physiology, thereby impacting the outcome of the scientific studies. In this study, we compared the gut microbiome between naturally occurring (ENV) and formulated diet-fed laboratory aquaculture (LAB) sea urchin Lytechinus variegatus by amplicon sequencing of the V4 region of the 16S rRNA gene and bioinformatics tools. Overall, the ENV gut digesta had higher taxa richness with an abundance of Propionigenium, Photobacterium, Roseimarinus, and Flavobacteriales. In contrast, the LAB group revealed fewer taxa richness, but noticeable abundances of Arcobacter, Agarivorans, and Shewanella. However, Campylobacteraceae, primarily represented by Arcobacter spp., was commonly associated with the gut tissues of both ENV and LAB groups whereas the gut digesta had taxa from Gammaproteobacteria, particularly Vibrio spp. Similarly, the co-occurrence network displayed taxonomic organizations interconnected by Arcobacter and Vibrio as being the key taxa in gut tissues and gut digesta, respectively. Predicted functional analysis of the gut tissues microbiota of both ENV and LAB groups showed a higher trend in energy-related metabolisms, whereas amino acids, carbohydrate, and lipid metabolisms heightened in the gut digesta. This study provides an outlook of the laboratory-formulated diet-fed aquaculture L. variegatus gut microbiome and predicted metabolic profile as compared to the naturally occurring animals, which should be taken into consideration for consistency, reproducibility, and translatability of scientific studies.

1. Introduction

Organisms from all domains of life cohabit in the nearshore marine ecosystems worldwide, where they thrive by modulating their community structure with the fluctuating biotic and abiotic factors, food sources, and other perturbances, such as natural calamities and human activities [1,2,3]. The resiliency of these ecosystems in such changing environments is often contingent upon the composition and metabolic activities of microbial communities that help sustain some of the crucial trophic functions [2]. However, oftentimes organisms from their natural habitat are collected and transferred to laboratories and used as model animals for various scientific studies. These organisms are maintained in the laboratory aquaculture environment where they are fed formulated feed with balanced nutrients. Studies have shown that such controlled laboratory conditions and feeding lab-standardized or commercially available diet reshape gut microbiota from their natural habitat in a variety of laboratory model animals such as Mus musculus [4], Danio rerio [5], Caenorhabditis elegans [6,7], and Drosophila [8]. The pivotal role of diet and gut microbiome in maintaining host metabolisms, health, and disease has been a well-established fact now [9,10,11]. Dysbiosis of the gut microbiota as a result of improper selection of diet thereby affecting the homeostasis of laboratory animal models has been a growing concern in the outcome and interpretation of various scientific studies [12,13,14,15].
Oftentimes, the sea urchins, including the green sea urchins, Lytechinus variegatus (order Temnopleuroida, family Toxopneustidae), are collected from their natural habitats, acclimated, and maintained in the laboratory aquaculture, fed a laboratory-standardized formulated diet, and used for basic and applied research [16,17]. L. variegatus inhabit the area along the U.S. South-Eastern Coastal waters and into the Gulf of Mexico; although considered omnivorous, they primarily graze upon seagrass, algae, and decomposed materials in their natural habitats [18,19,20,21]. L. variegatus represents a characteristic deuterostome gut system [22], in which the ingested food along with the natural microbial communities from their habitat is encapsulated in the pharynx by a thick mucus layer known as gut digesta. The microbiota in the gut digesta remains separated from that of the gut tissue during their passage through the gut lumen until egested [23,24,25,26]. The culture-dependent studies of urchins from their natural habitat have shown representative bacteria from the gut capable of alginolytic activities [27]. In addition, gelatin, protein, and amino acid assimilation by the gut microbiota have also been elaborated in urchins [28,29,30]. However, the laboratory-maintained urchins are normally fed a diet consisting of combinations of naturally occurring algal and seagrass sources [16,31] or a formulated feed optimized for their nutritional requirements and health [32]. These conditions contrast the food in their natural habitat and the diverse marine microorganisms associated with it [33,34,35,36,37,38,39,40]. Consequently, the laboratory-standardized formulated diet could potentially reshape the gut microbiota and metabolic role in laboratory aquaculture L. variegatus. In this study, we elucidate a comparative outlook of the gut microbial community compositions along with the taxonomic co-occurrence network and predicted metabolic profiles in naturally occurring and formulated diet-fed laboratory aquaculture L. variegatus using 16S rRNA-targeted metagenomics approach and bioinformatics tools.

2. Materials and Methods

2.1. Sample Description and High-Throughput Sequencing

Adult L. variegatus were collected from Saint Joseph Bay Aquatic Preserve, Florida (29.80° N 85.36° W), and transported to the University of Alabama at Birmingham (UAB) and held for six months in a recirculating saltwater tank system before tissue collection and processed for the microbiome analysis (LAB group; n = 3), as described elsewhere [41]. The LAB urchins were fed ad libitum once every 24–48 h with a formulated feed consisting of 6% lipid, 28% protein, and 36% carbohydrate relative percentages [32], and the aquaria conditions were maintained at 22 ± 2 °C with a pH of 8.2 ± 0.2 and salinity of 32 ± 1 parts per thousand (ppt.). Similarly, adult L. variegatus (n = 3) from the same location (29.80° N 85.36° W) with 1 m2 area were collected and transported to UAB (ENV group), and tissues were retrieved and processed for microbiome analysis within 7 ± 1 h after collection. The conditions of the water were recorded as follows: 20 ± 2 °C with a pH of 7.8 ± 0.2 and salinity of 28 ± 1 ppt. during sample collection [42]. The gut tissues and the digesta were collected from urchins using the procedures described elsewhere [24]. Briefly, a radial incision was made around the Aristotle’s Lantern mastication apparatus of the urchins using sterile instruments. The pharynx enclosed by the lantern was separated from the digestive tract, collected intact, without tearing, and rinsed with sterile phosphate-buffered saline water (1× PBS, pH 7.4) (Fisher Scientific, Hampton, NH, USA). The gut tissues were then carefully opened by incision and the digesta were separated by gently rinsing with sterile 1× PBS (pH 7.4). The gut tissues were examined under a dissecting scope to make sure no residual digesta associated with the tissues before subjected to DNA purification. Similarly, the gut digesta were gently rinsed multiple times in sterile 1× PBS (pH 7.4) to remove any gut tissue-associated residual bacteria. All procedures were followed according to the Animal Care and Use Committee (IACUC), University of Alabama at Birmingham under the Animal Project Number (APN): IACUC-21893 (22 November 2019–21 November 2022 (S.A. Watts).
The metacommunity DNA samples from urchins were purified using the Zymo Research kit (Irvine, CA, USA). Then high throughput amplicon sequencing (HTS) was performed on an Illumina MiSeq sequencing platform using the 250 bp paired-end kits (Illumina, Inc., San Diego, CA, USA) and by targeting the V4 hypervariable region of the bacterial 16S rRNA gene [41,42]. The resultant sequences were demultiplexed and FASTQ formatted [43,44] and then deposited on the National Center for Biotechnology Information (NCBI) Sequence Read Archive (SRA) under Bioproject #PRJNA291441 and #PRJNA326427 for the LAB and ENV groups, respectively, as described previously [45]. The subgroups for the LAB group were relabeled for this study as LAB.Gut.Tissue (n = 3) and LAB.Gut.Digesta (n = 3), and for the ENV group the samples were relabeled as ENV.Gut.Tissue (n = 3) and ENV.Gut.Digesta (n = 3).

2.2. Taxonomic Distribution

The taxonomic profiles of the gut tissues and gut digesta of both ENV and LAB urchins were determined using the QIIME2 (v.2020.8) bioinformatics tool [46]. The raw sequence data from all samples were demultiplexed. The q2-demux (manifest method) plugin, followed by denoising via DADA2 (q2-dada2) was used for quality filtering [47]. Amplicon sequence variants (ASVs) were aligned using mafft (q2-alignment) [48], and this was used to build a phylogeny with fasttree2 (q2-phylogeny), [48,49] with the default FastTree building method [49]. The “core-metrics-phylogenetic” command (q2-diversity plugin) was used to generate Alpha-diversity metrics (Faith’s Phylogenetic Diversity, and observed features) [50], Simpson [51] and Shannon [52], beta diversity metrics (weighted UniFrac), unweighted UniFrac [53], Jaccard distance, and Bray-Curtis dissimilarity, and Principal Coordinate Analysis (PCoA). The samples were rarefied (subsampled without replacement) based on the minimum value of 36,535 sequences per sample. The taxonomy was assigned to ASVs via the q2-feature-classifier plugin [54], “classify-sklearn” command against the silva-138-99-nb-classifier [55]. The taxonomy was collapsed into tables using the “qiime taxa collapse” command [46]. ANOSIM values were generated with the q2-diversity plugin [56], via the “beta-group-significance command” and “anosim” parameters. Adonis values were generated with the q2-diversity plugin [57], via the “adonis” command [58]. To determine the taxa with significant differential abundance between gut tissue and gut digesta samples in the compartmentalized gut ecosystem, the ASV table of all the gut tissue and gut digesta samples were further analyzed by the Linear Discriminant Analysis (LDA) Effect Size (LEfSe) (v1.0.8.post1) and visualized via python3 package Matplotlib (v3.1.0) and Seaborn (v0.9.0). Briefly, the non-parametric Kruskal-Wallis sum-rank test was used between classes to determine significant differential abundance set at a significance of p = 0.05 [59], followed by the pairwise Wilcoxon signed-rank test between the subclasses at a significance of p = 0.05 [60]. The resultant data was used for LDA analysis using the log(10) values at an inclusion threshold of ±3.6 [61,62]. Those taxa with a significant effect size were also listed in a table format, to show the LDA effect size and average relative abundance in each group with standard deviations determined through the statistical analysis of metagenomic profiles. The heatmap was generated using the attribute clustermap of Seaborn (v0.9.0) with average linkage and the Euclidean distance metric of Z-score normalized relative abundance for hierarchical clustering. The representative sequence corresponding to the highly abundant Campylobacteraceae ASV determined in this study was further analyzed by using NCBI Basic Local Alignment Search Tool (BLAST) [63] against the non-redundant nucleotide collection (nr/nt) database optimized for highly similarity sequences via MEGABLAST (http://blast.ncbi.nlm.nih.gov, accessed on 28 August 2020).

2.3. Co-Occurrence Analysis of Microbial Taxa

Co-occurrence Network interference (CoNet v1.1.1) [64,65,66] was used to determine significant co-occurrence patterns between the microbial communities of the gut tissue and the gut digesta. To accomplish this, the ASV table data was uploaded into Cytoscape (v3.8.0) [64,65] through the CoNet (v1.1.1) plugin. A parent–child exclusion was applied, and the links between higher-level taxa were not explored. The gut digesta and gut tissue taxonomic entries with a cumulative group sum of 200 and at least 2/3 of samples containing non-zero values were kept with a 10-8 pseudo-count to determine the significant co-occurrences between taxa [64,66,67,68,69,70,71,72,73]. The 200 highest (most positive) and lowest (most negative) edges were chosen and combined via the union approach using the mean value [68]. Multi-edge scores were then shuffled row-wise at 100 permutations (for the randomization). The brown method [74] was used to merge node pairs, which were assigned via the p-values of the multi-edges. The unstable edges were filtered out, and the threshold was set to a p < 0.05 for significance [64,65] to determine the q-value (the corrected significance value). The final network was assembled in Cytoscape (v3.8.0). The radial layout algorithm was used from the yFiles plugin (v1.0) [74], and NetworkAnalyzer (v2.7) [75] determined the topological parameter (undirected approach). The node sizes were scaled according to their group abundance size, and edges were scales via q-value. Edges were colored via their positive (co-presence; green) and negative (co-exclusion; red) association. The nodes which had a significant number of edges (high degree), closeness centrality, and low betweenness centrality (determined via Network Analyzer (v2.7)) have been described elsewhere as key taxa [68,76,77,78]. Microsoft Excel software (Seattle, WA, USA) was used to plot these features as a scatter plot (y = closeness centrality; x = betweenness centrality). The top 5 nodes were then selected as likely to be key taxa based on closeness centrality scores.

2.4. Predicted Functional Analysis

The predicted functional capacity of gut microbial communities was determined through Phylogenetic Investigation of Communities by Reconstruction of Unobserved States (PICRUSt2) [79]. This was accomplished using the PICRUSt2 picrust2_pipeline.py single script. The script runs sequence placement, hidden-state prediction of genomes, metagenome prediction, pathway-level predictions, and the weighted Nearest Sequenced Taxon Index (NSTI) values. This single script outputs the unstratified EC number metagenome predictions, KO metagenome predictions, and predicted pathway abundances and coverages per sample. To add descriptions of each pathway the “add_descriptions.py” command was used to describe each functional category. This was further analyzed using linear discriminant analysis (LDA) effect size (LEFSe) against predicted functional profiles corresponding to the microbial communities of L. variegatus gut tissues and gut digesta. The visualization was performed using BURRITO software (a visualization tool for exploratory data analysis of metagenomic data) (http://borenstein-lab.github.io/burrito/, accessed on 24 August 2020) estimated functional abundances using the QIIME2 16S rRNA ASV table, and the PICRUSt2 KEGG_metagenome_output table to compute species abundance, function abundance, and the share of each function linked to each species, which then displayed metabolic pathways of amino acid, carbohydrate, energy, membrane transport, cell motility, and cofactors, which were selected for bar plot analysis (plotted using R ggplot package) [80].

3. Results

3.1. Read Quality and Sample Statistics

The raw sequence count of the V4 segment of the 16S rRNA generated from the paired-end Illumina MiSeq across all samples yielded 1,433,598 reads following quality checking (Supplementary Table S1). A total of 834 observed ASVs were identified following quality filtering through QIIME2 (v.2020.8) (Table 1). The observed taxonomic distribution is listed in Supplementary Table S2.

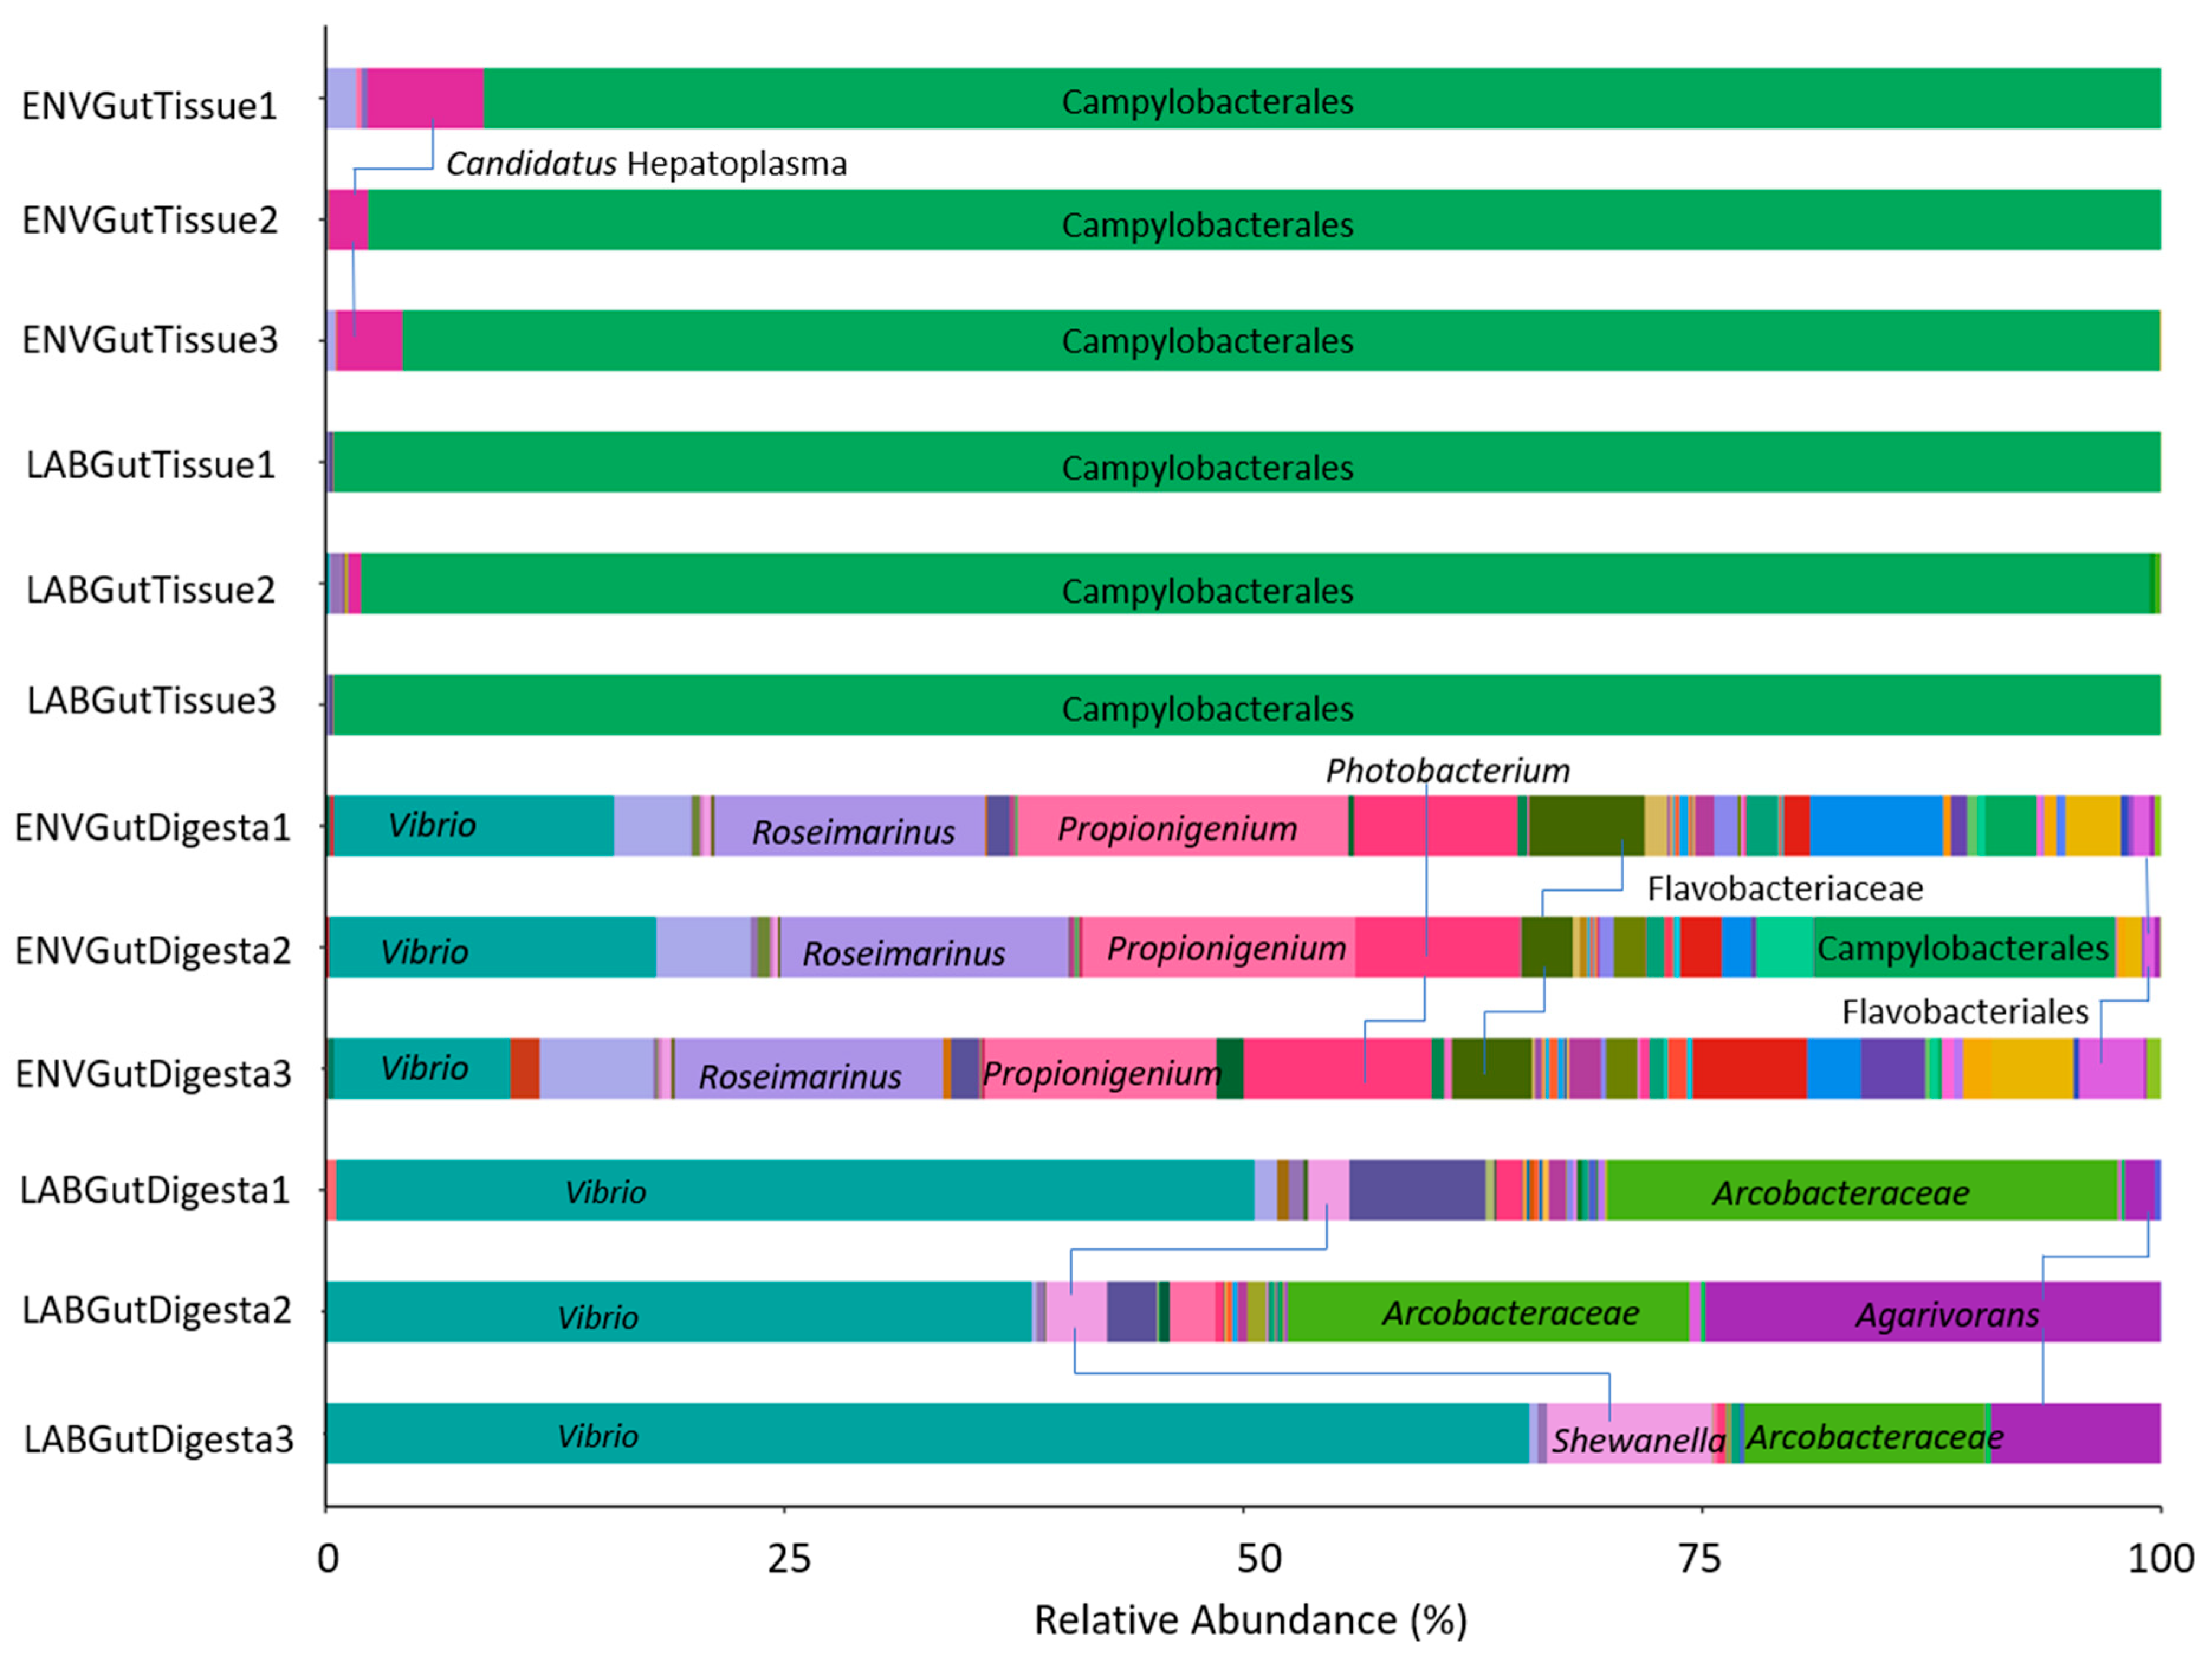
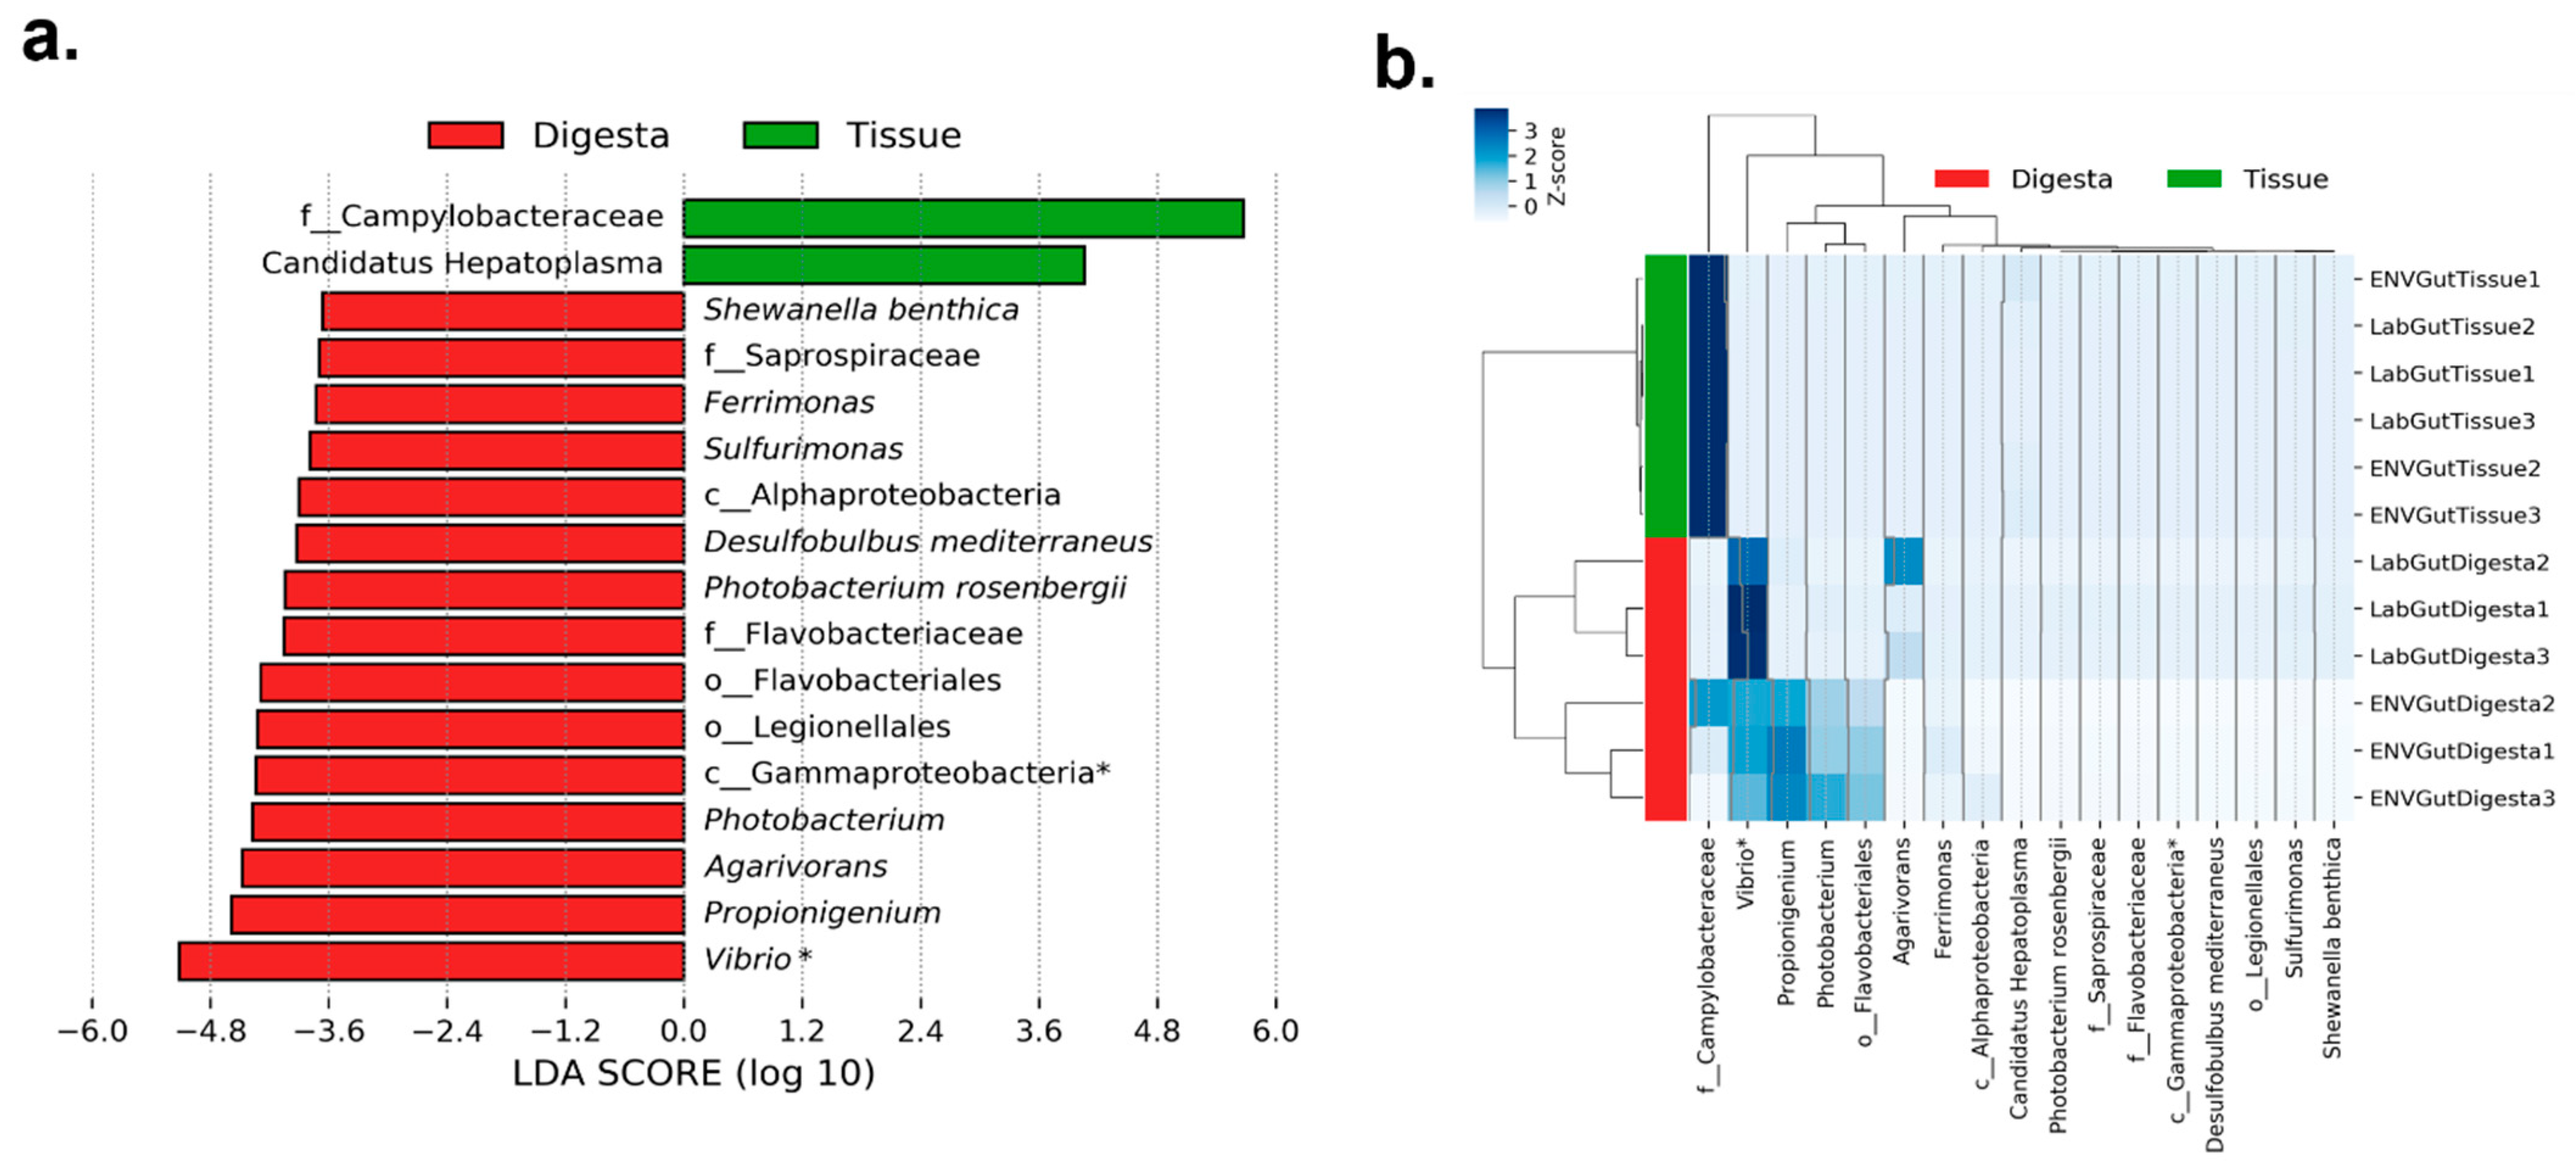
3.2. Taxonomic Distribution across Samples

At the phylum level, the gut tissue of both the LAB and ENV L. variegatus was dominated by Proteobacteria, which is represented by an almost exclusive abundance of the class Epsilonproteobacteria (data not shown). At the highest achievable taxonomic resolution determined through the described bioinformatics tools, these taxa were identified as order Campylobacterales, primarily represented by the Campylobacteraceae family of bacteria, comprising >90% of the relative abundance in all gut tissues (Figure 1; Supplementary Table S2). Further analysis using the NCBI BLAST alignment (http://ncbi.nlm.nih.gov, accessed on 28 August 2020) of the representative sequence provided an additional resolution to this taxon. From the top 100 assigned identities, 34% were related to Uncultured Arcobacter sp., 8% to Arcobacter sp., 7% as Arcobacter bivalviorum, and 3% to Sulfuricurvum sp., all with an E-value < 5E−83 and percent identity > 89.76% (data not shown). The ENV gut tissue showed a noticeable abundance of Candidatus Hepatoplasma (~2.5–7.5%). However, the relative abundance of this taxon was negligible in the LAB group (<1%).
The gut digesta of both the LAB and ENV groups showed taxa assigned to Gammaproteobacteria to be the most abundant. From this class, Vibrio was found to be the more dominant taxon in the LAB digesta (~35–65%), as compared to the ENV digesta (~9–18%). However, the LAB gut digesta showed a unique abundance of taxa that were not noticeable in the ENV digesta, which included Agarivorans (~2–24%) and Shewanella algae (~2–8%) from Gammaproteobacteria, Rhodobacteraceae from Alphaproteobacteria (~3–7%), and order Campylobacterales (~13–40%). In contrast, the ENV digesta showed Photobacterium of Gammaproteobacteria (~9–11%), Propionigenium of Fusobacteria (~9–12%), Roseimarinus of Bacteroidetes (~9–11%), and a noticeable abundance of Flavobacteriales (~8–13%) (Figure 1; Supplementary Table S2).

3.3. Alpha Diversity
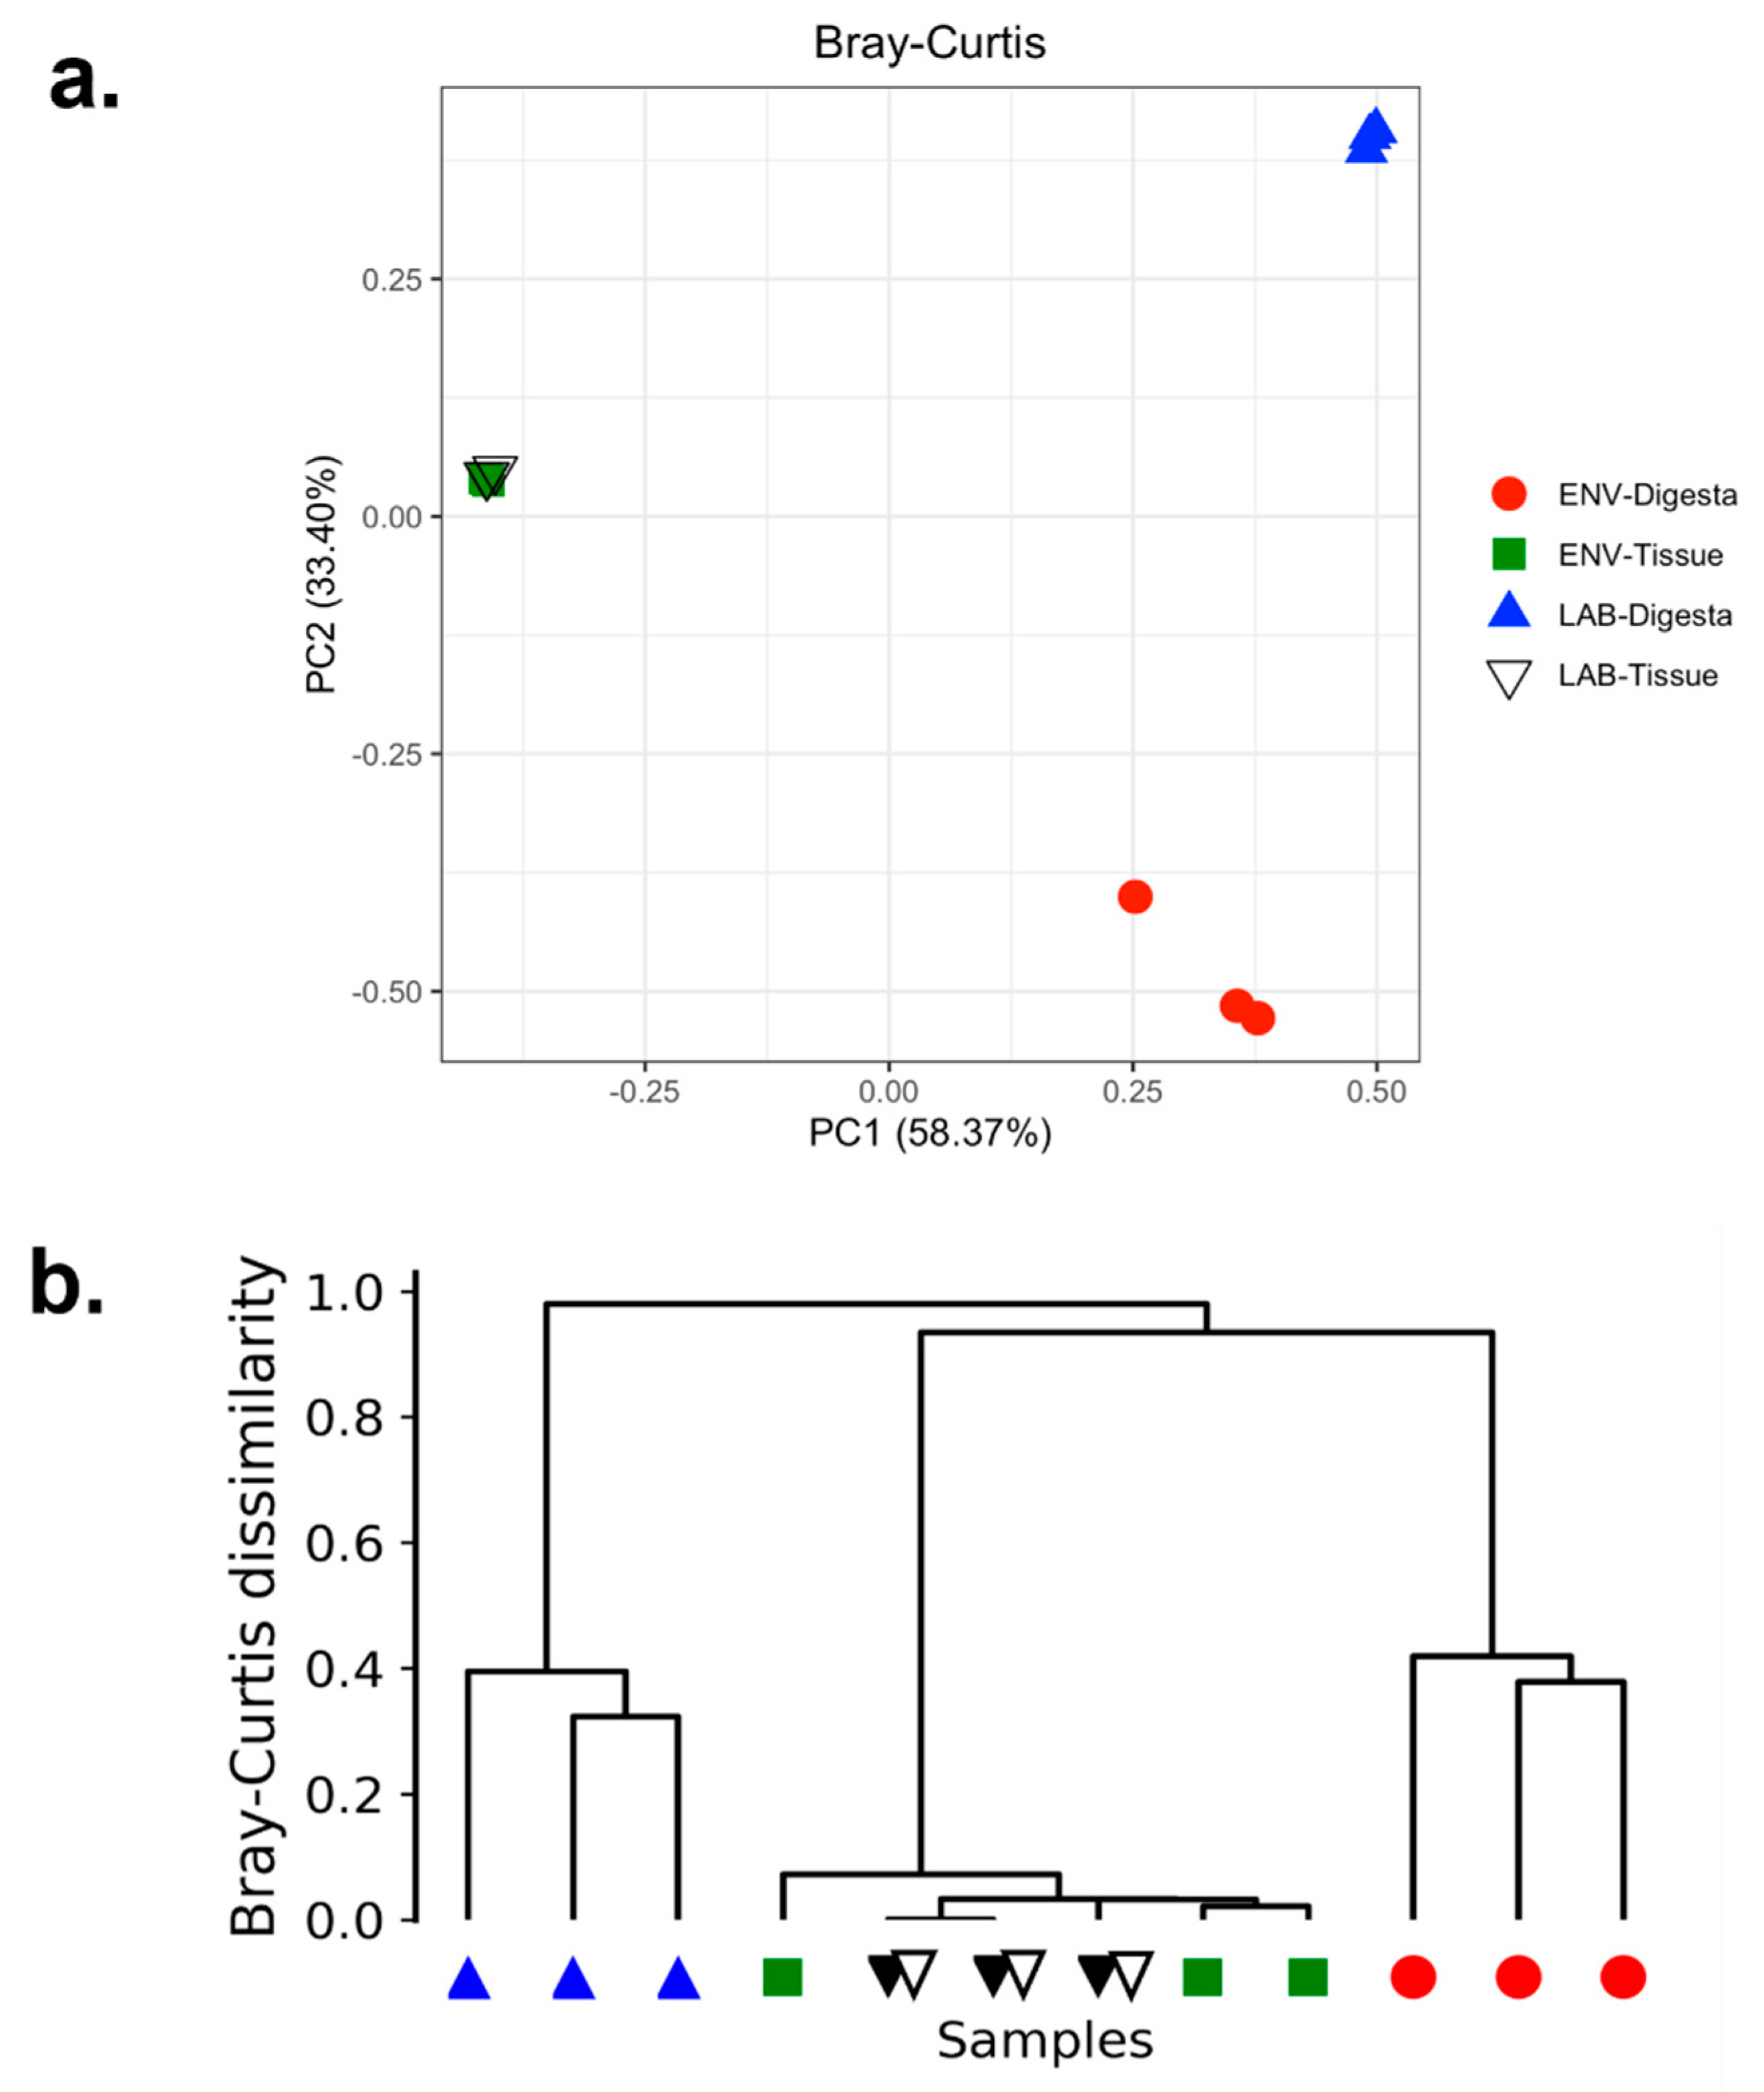
The alpha diversity for both LAB gut tissue and digesta showed lower taxonomic diversity as compared to the ENV group (Table 1). Overall, the LAB and ENV gut tissue had the least number of ASVs compared to the gut digesta samples. The ENV gut digesta had the highest diversity and ASV count, followed by the LAB gut digesta that showed a comparatively moderate alpha diversity and ASV count. A t-test comparison between the alpha diversity values of the gut tissues from the LAB and ENV groups showed no significant (p > 0.05) differences using the Shannon (p = 0.58) and Simpson (p = 0.227) metrics. However, a comparison between the LAB and ENV digesta showed significant differences in the Shannon (p = 0.02) and Simpson (p = 0.05) values between the two groups.

3.4. Beta Diversity

The microbial taxonomic distribution patterns determined through Bray-Curtis metrics across all samples determined that the gut tissues from both the LAB and ENV groups cluster strongly together (Figure 2a). For the gut digesta, distinct subclustering according to group assignment was observed. These cluster patterns were also elaborated in a dendrogram (Figure 2b). ANOSIM and Adonis also supported the low within-group variation shown by the cluster patterns, revealing R and R2 values of 0.778 and 0.913, respectively (p = 0.001), thus indicating significant grouping based on biological replicates.
LEfSe analysis performed between the collective gut tissue and gut digesta showed those taxa that contributed most to the effect size (Figure 3a,b). For the gut tissue samples, the highest effect size was attributed to the abundant Campylobacteraceae taxon (LDA score = 5.65) followed by Candidatus_Hepatoplasma. For the gut digesta, Vibrio showed the highest effect size (LDA score = 5.11). This taxon was more abundant in the LAB digesta (44.66 ± 5.04), as compared to the ENV digesta (16.21 ± 4.99). This was followed by Flavobacteriales, Propionigenium, and Photobacterium, which were noticeably abundant in the ENV digesta, whereas Agarivorans and Rhodobacteraceae in the LAB digesta. Few taxa that were represented at low abundances in the LAB digesta, particularly, Alteromonadales and OM60 presented in Supplementary Table S2 and withing phylum Gammaproteobacteria (Figure 3a,b). Similarly, order Marinilabiliaceae of phylum Bacteroidetes and family Pirellulaceae of phylum Planctomycete were also found in reasonably low abundances in the gut ENV gut digesta. These taxa were negligibly abundant in the gut tissues (Supplementary Table S2).

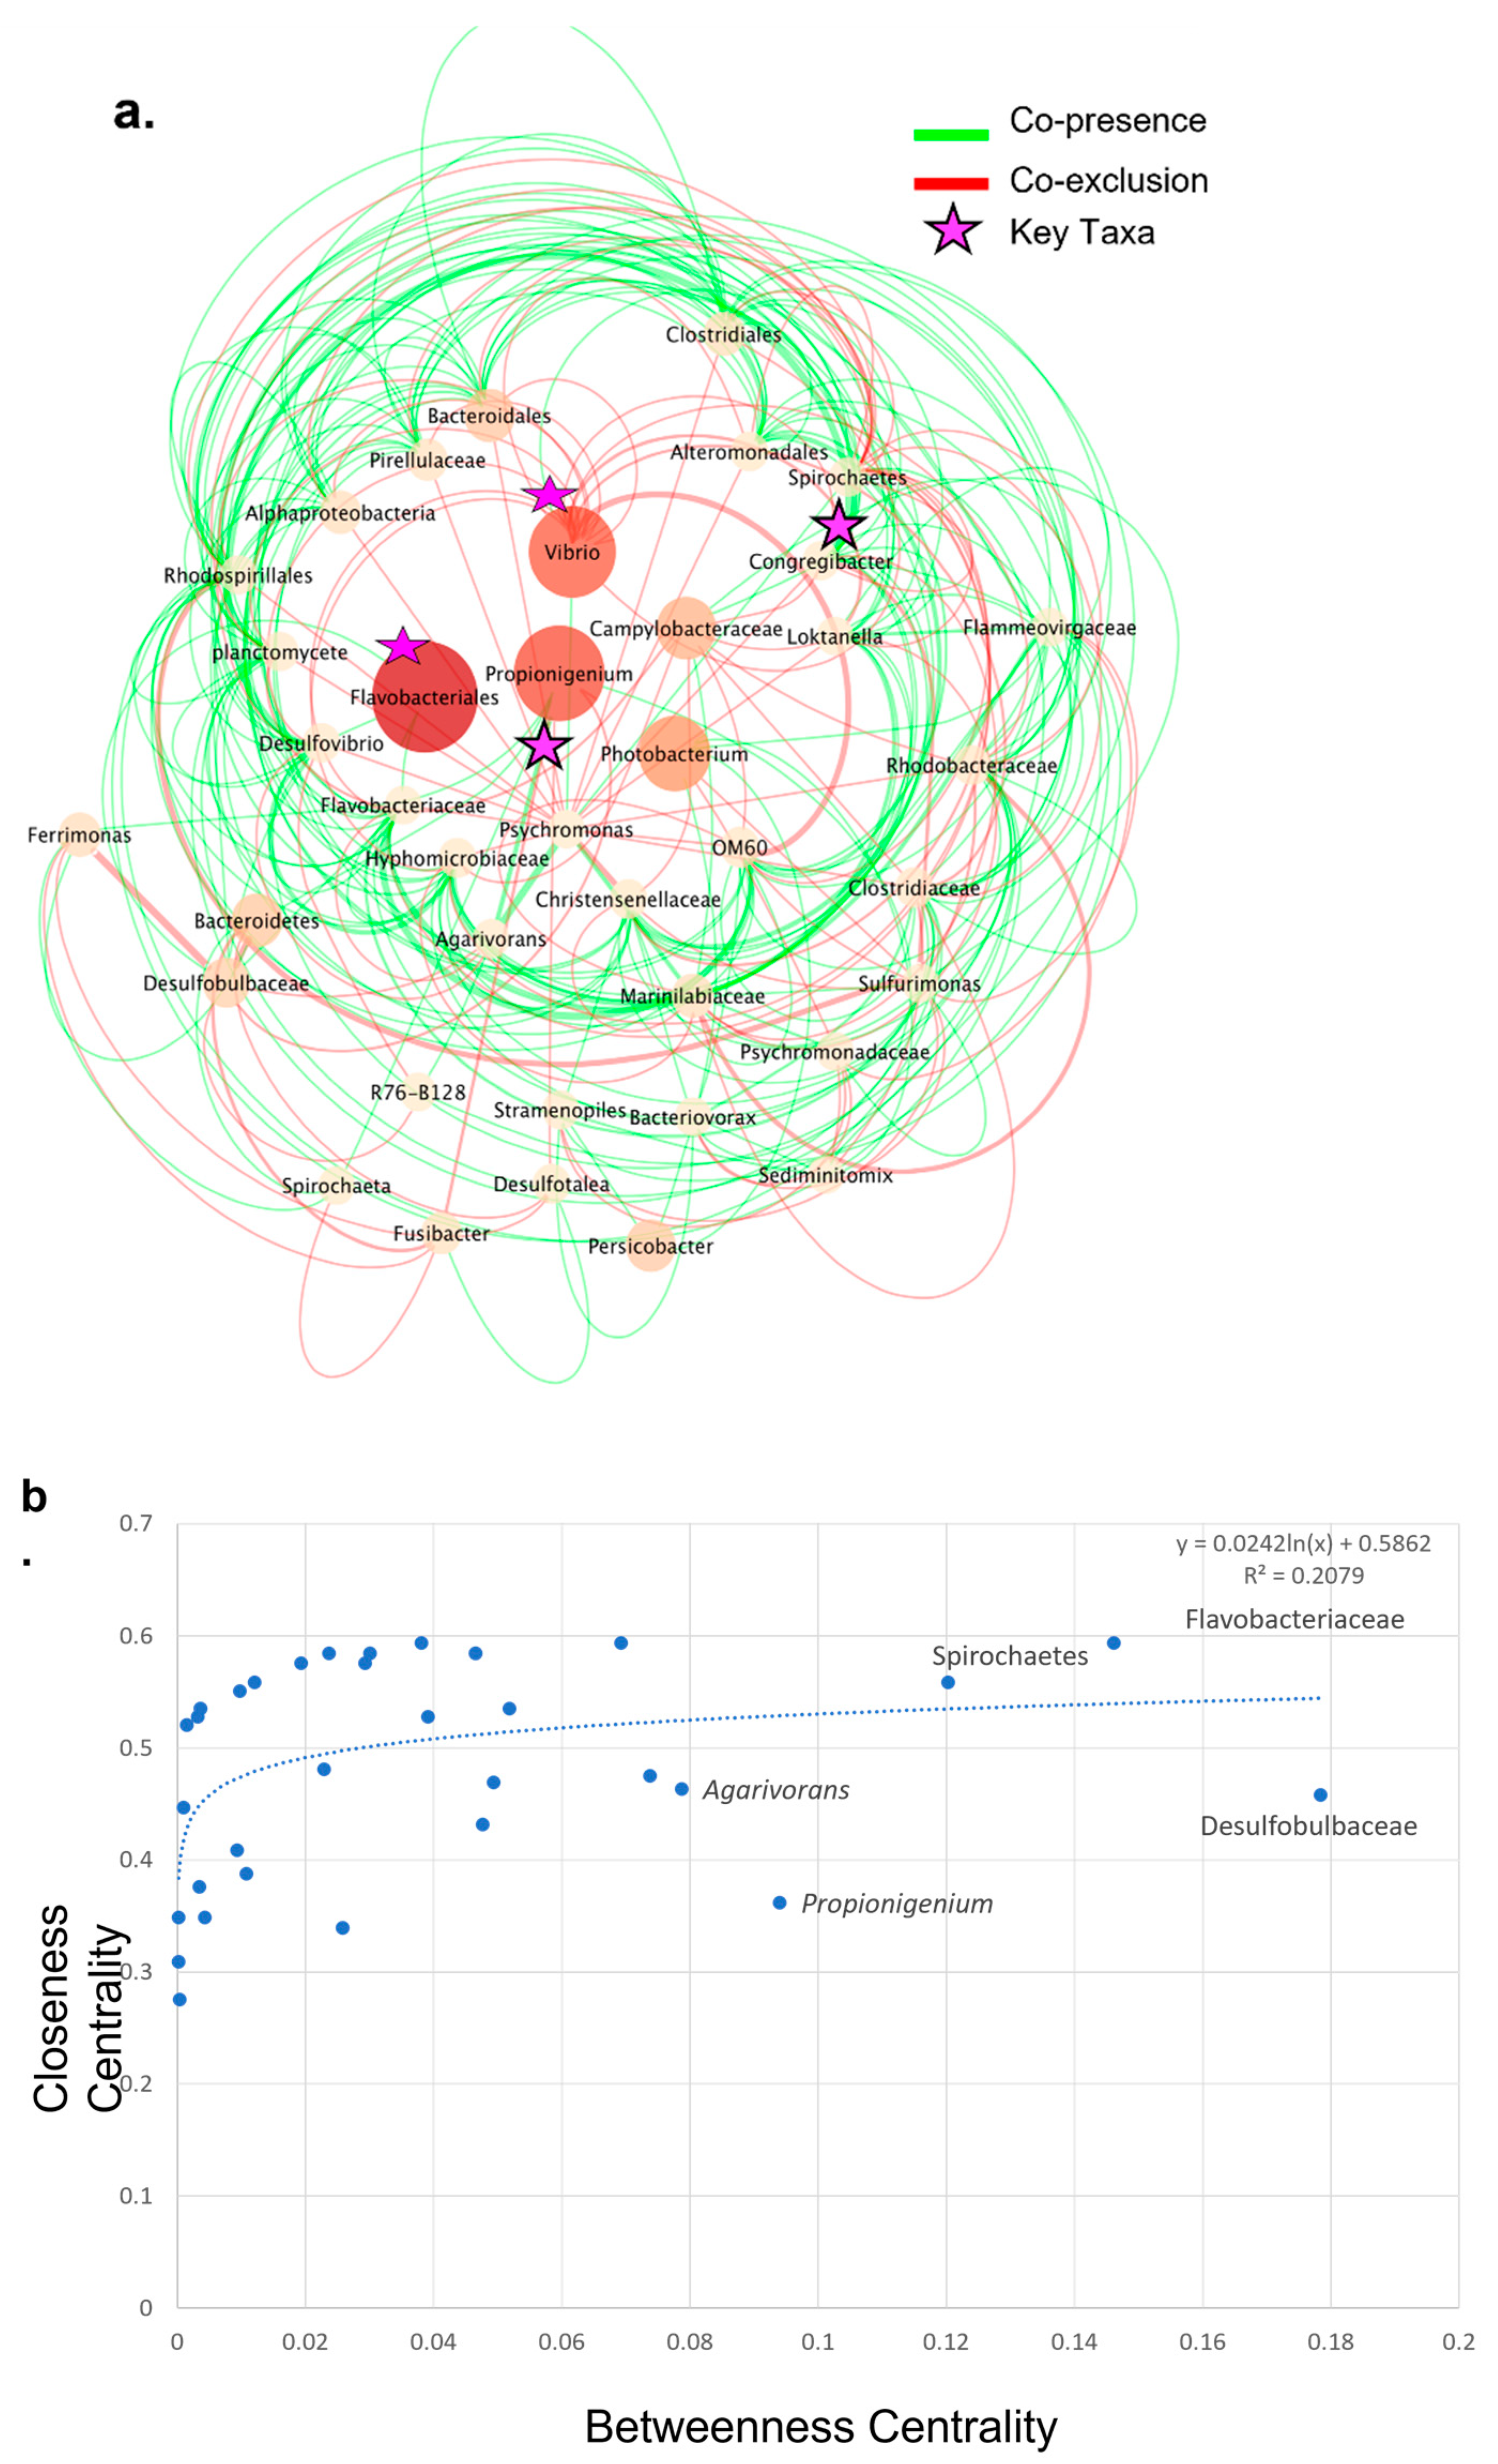
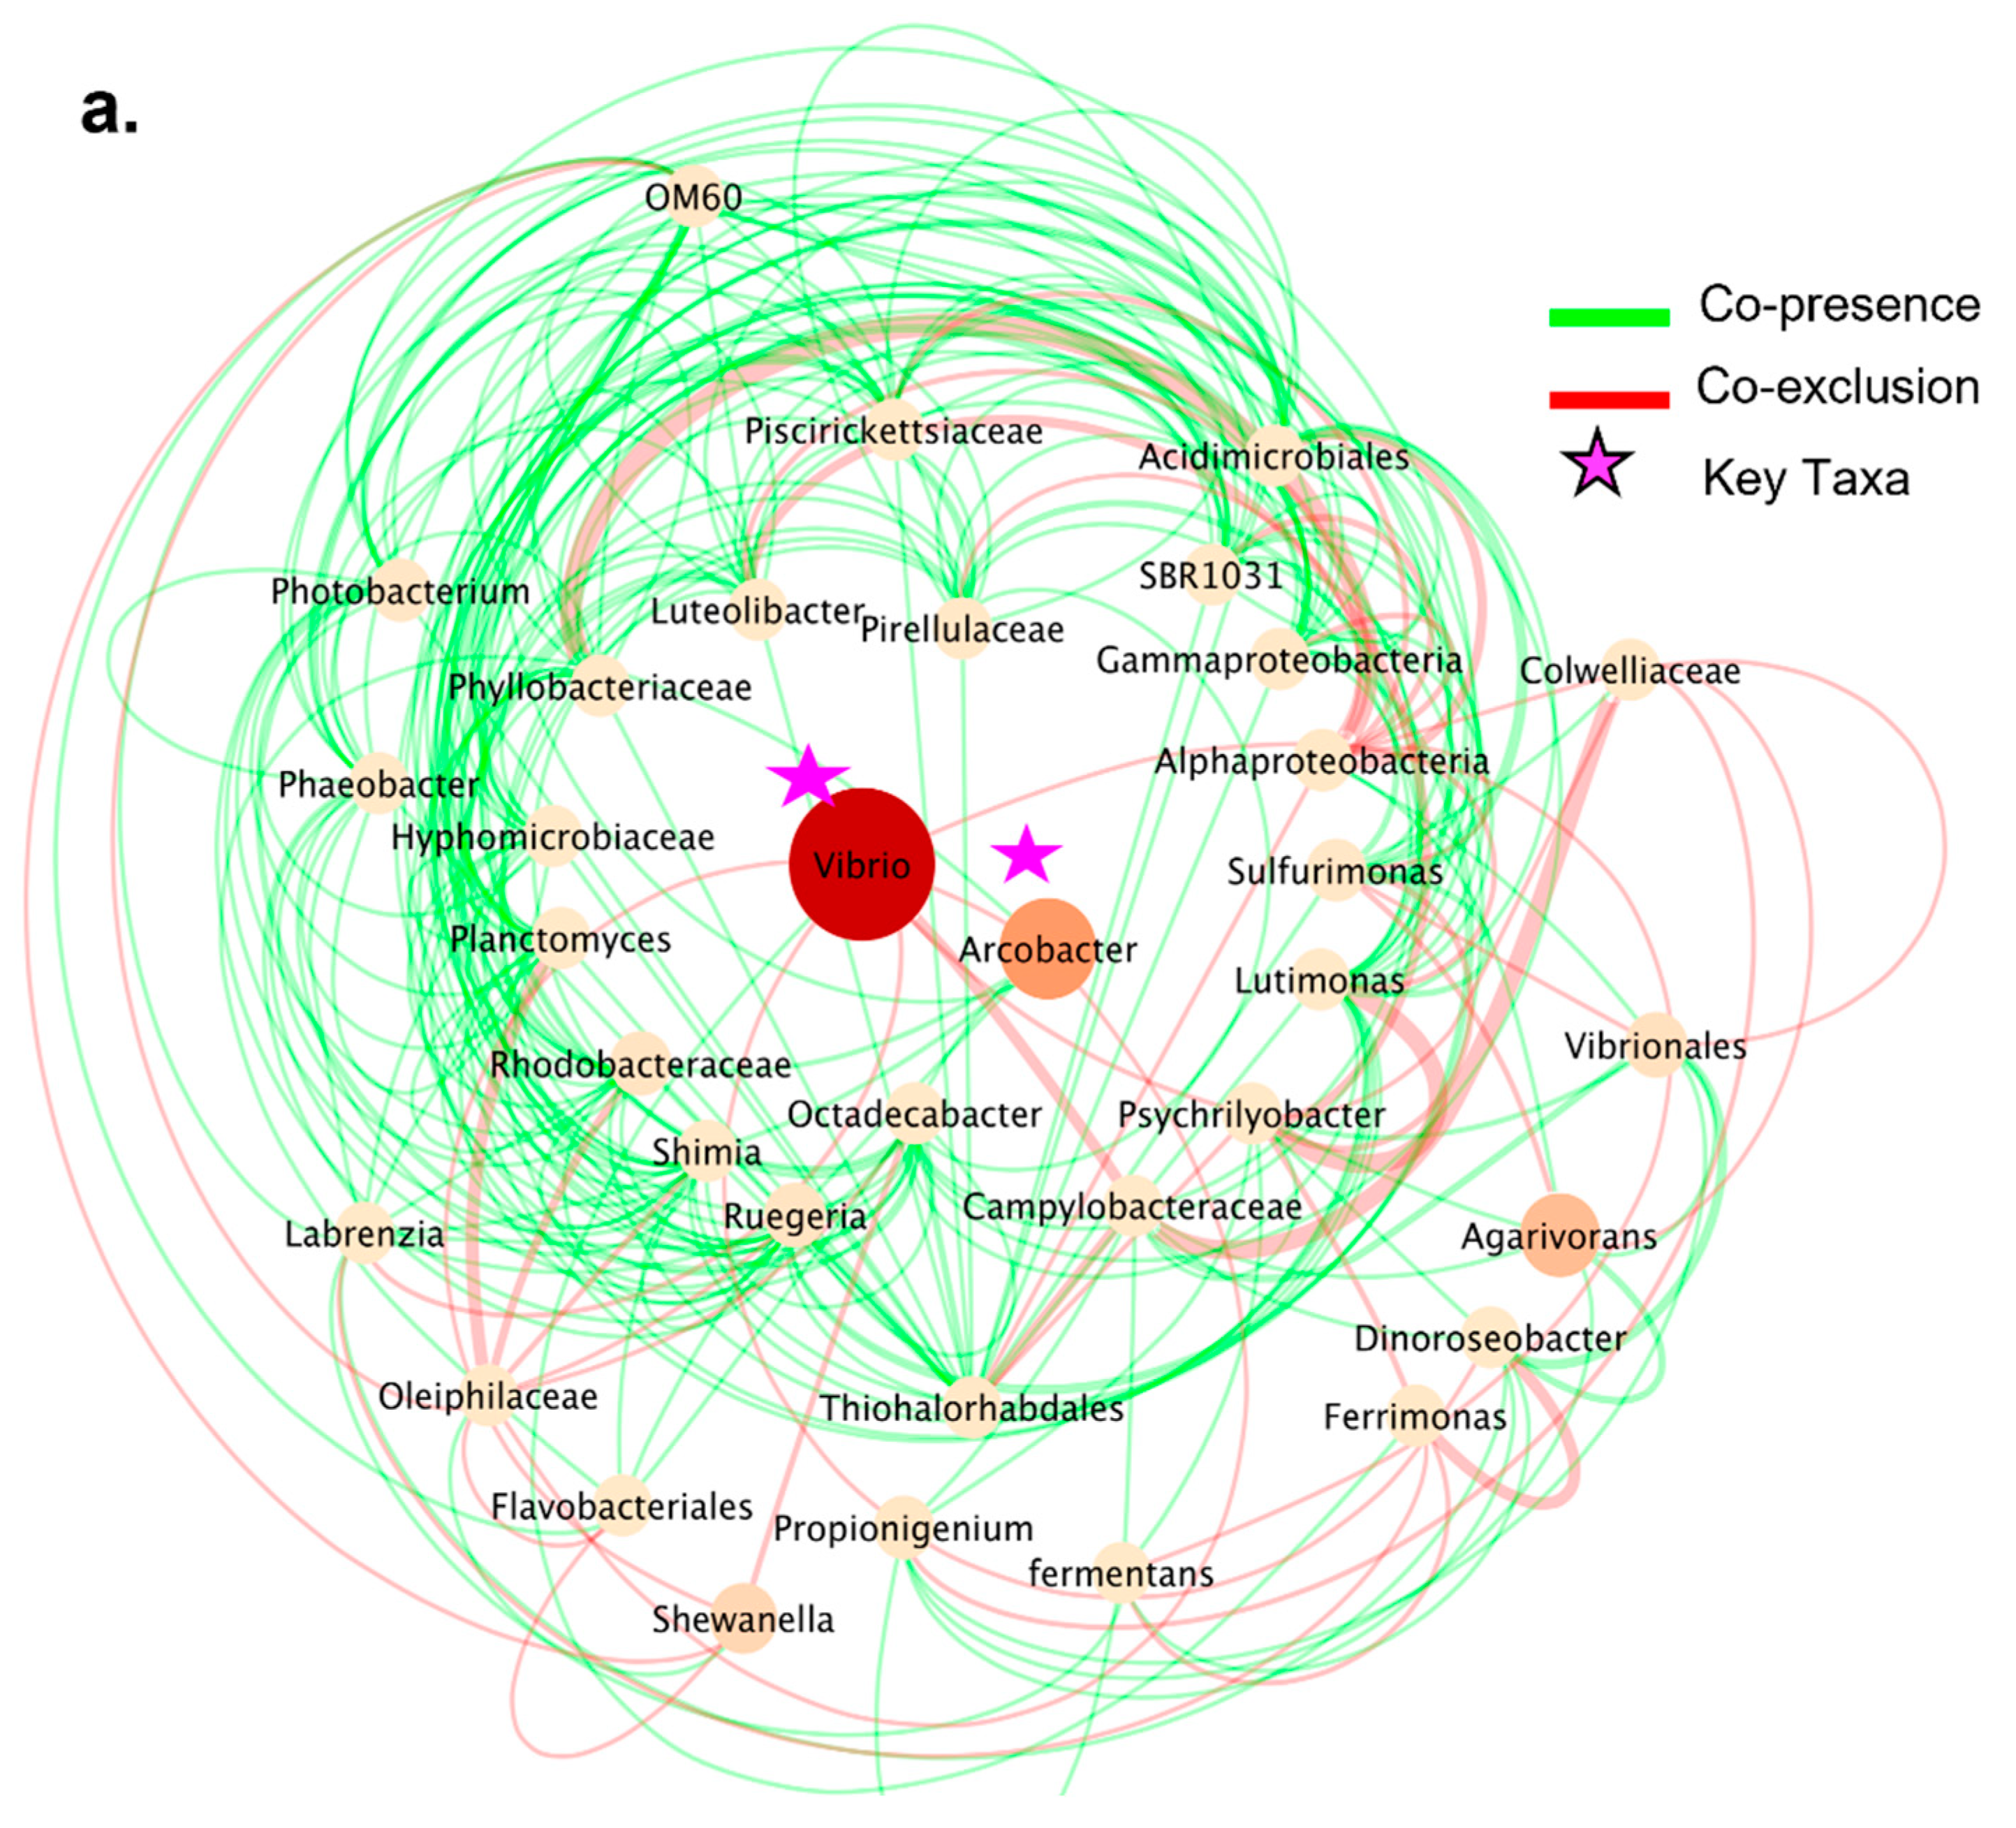
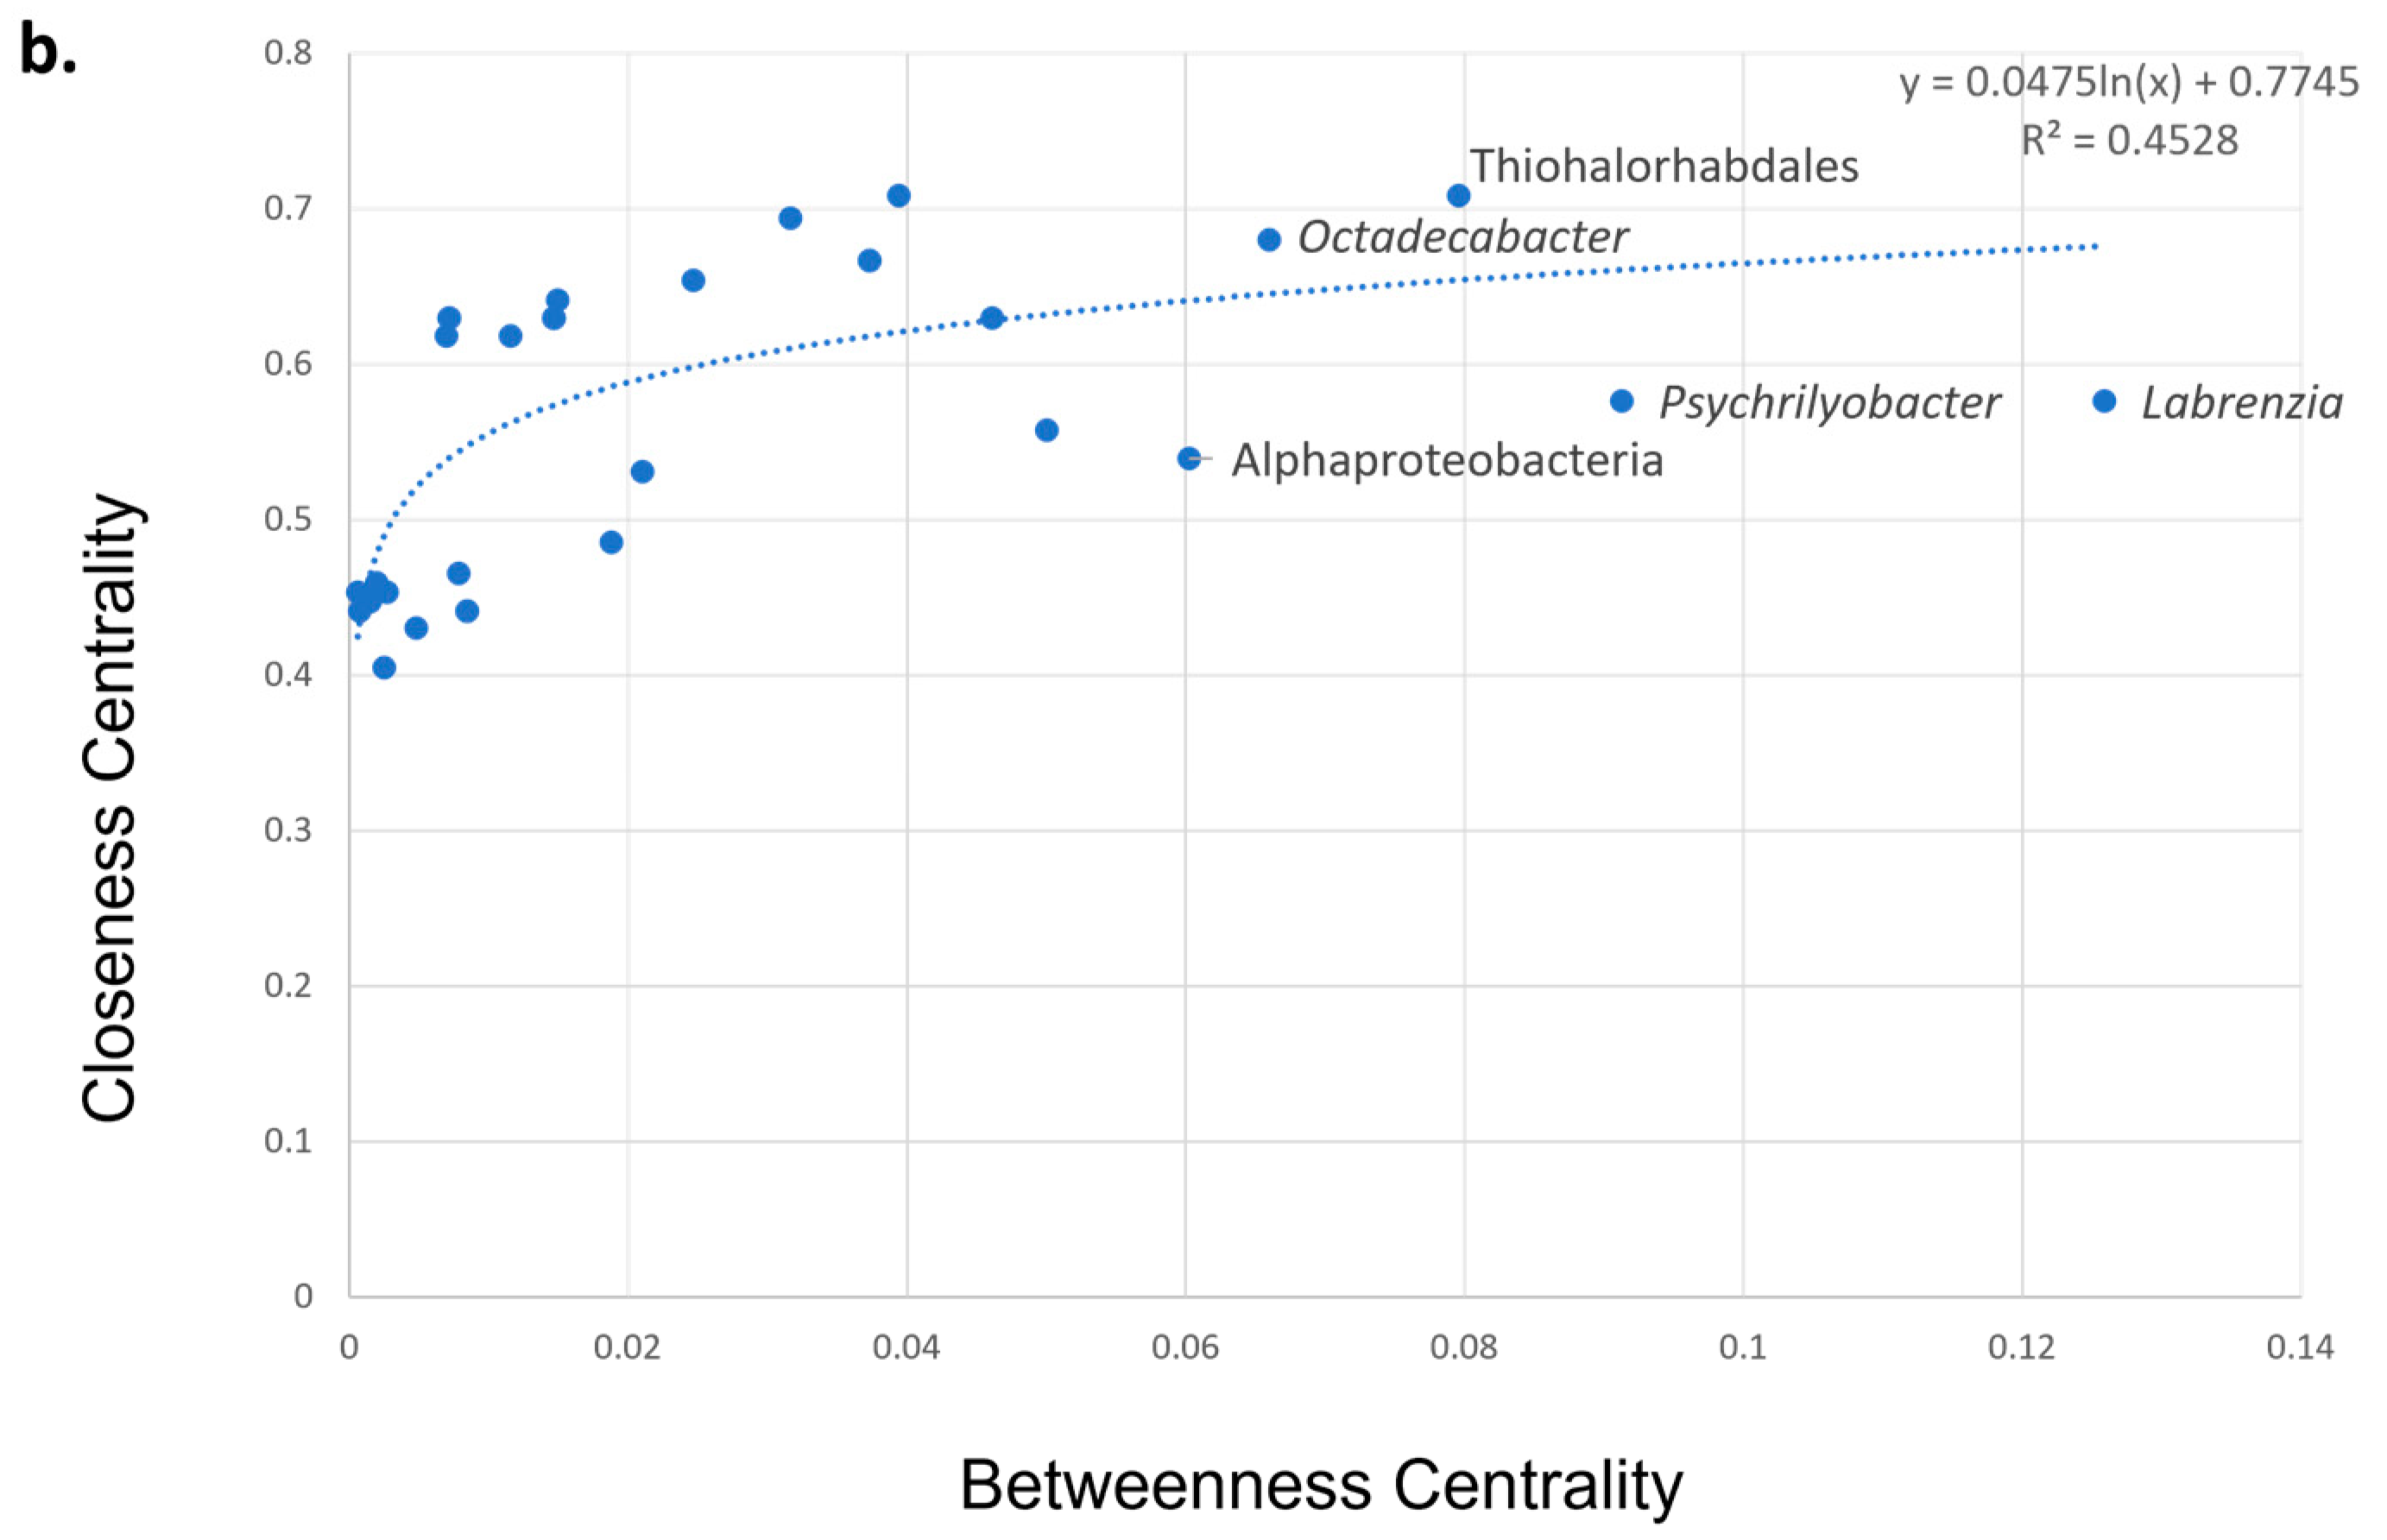
3.5. Co-Presence, Co-Exclusion, and Key Taxa in ENV and LAB Digesta

The co-occurrence network representing potential interactions occurring among the microbial taxa from ENV urchin digesta produced 39 nodes and 254 edges (Figure 4a). NetworkAnalyzer (v2.7) determined the network properties and showed an average number of neighbors of 13.026, the characteristic path length of 1.693, with a network density of 0.171, and a clustering coefficient of 0.387. The bacterium with the largest degree was Congregibacter (22 total), with most of these associations shown as co-presence (16 total). Closeness centrality values were plotted against betweenness centrality values to display trends via scatter plot analysis (Figure 4b). The top five candidate key taxa in ENV urchins digesta were chosen based on the descriptions of the topological qualities of taxonomic nodes and ranked via their closeness centrality described elsewhere [77]. The key taxa were represented by Desulfobulaceae, Flavobacteriales, Spirochaetes, Propionigenium, and Agarivorans (Figure 4b).
In contrast, the network of the LAB urchin digesta yielded 35 nodes, 245 edges (Figure 5a). NetworkAnalyzer (v2.7) revealed an average number of neighbors of 14, the characteristic path length of 1.768, with a network density of 0.206, and a clustering coefficient of 0.390. The largest abundance taxa were Vibrio and Arcobacter. Closeness centrality values plotted against betweenness centrality values displayed the top five key taxa, Labrenzia, Psychrilyobacter, Thiohalorhabdales, Octadecabacter, and Alphaproteobacteria (Figure 5b).
The network of LAB urchin gut tissues yielded 15 nodes, 53 edges (Supplementary Figure S1a). NetworkAnalyzer (v2.7) showed an average number of neighbors of 7.1, a characteristic path length of 1.433, a network density of 0.252, and a clustering coefficient of 0.377. The largest abundance of the taxon was Campylobacteraceae (>90%). Closeness centrality values plotted against betweenness centrality values displayed the top five candidate key taxa, Luteolibacter, Arcobacter, Vibrio, Ruegeria, and Comamonadaceae (Supplementary Figure S1b).
The network of ENV urchin gut tissues yielded 10 nodes, 17 edges (Supplementary Figure S2a). NetworkAnalyzer (v2.7) showed the average number of neighbors of 3.4, the characteristic path length of 1.047, with a network density of 0.189, and a clustering coefficient of 0.305. Similar to the LAB urchin gut tissues, the largest abundance of the taxon was Campylobacteraceae (>90%). The closeness centrality and betweenness centrality values represented in the scatter plot showed Campylobacteraceae, Alphaproteobacteria, Bacteroidales, Flavobacteriales, and Propionigenium as the top five taxa (Supplementary Figure S2b). The LAB and ENV gut tissue networks are provided in the supplementary material, due to the large abundance of Campylobacteraceae (>90%), and minimal taxa diversity.

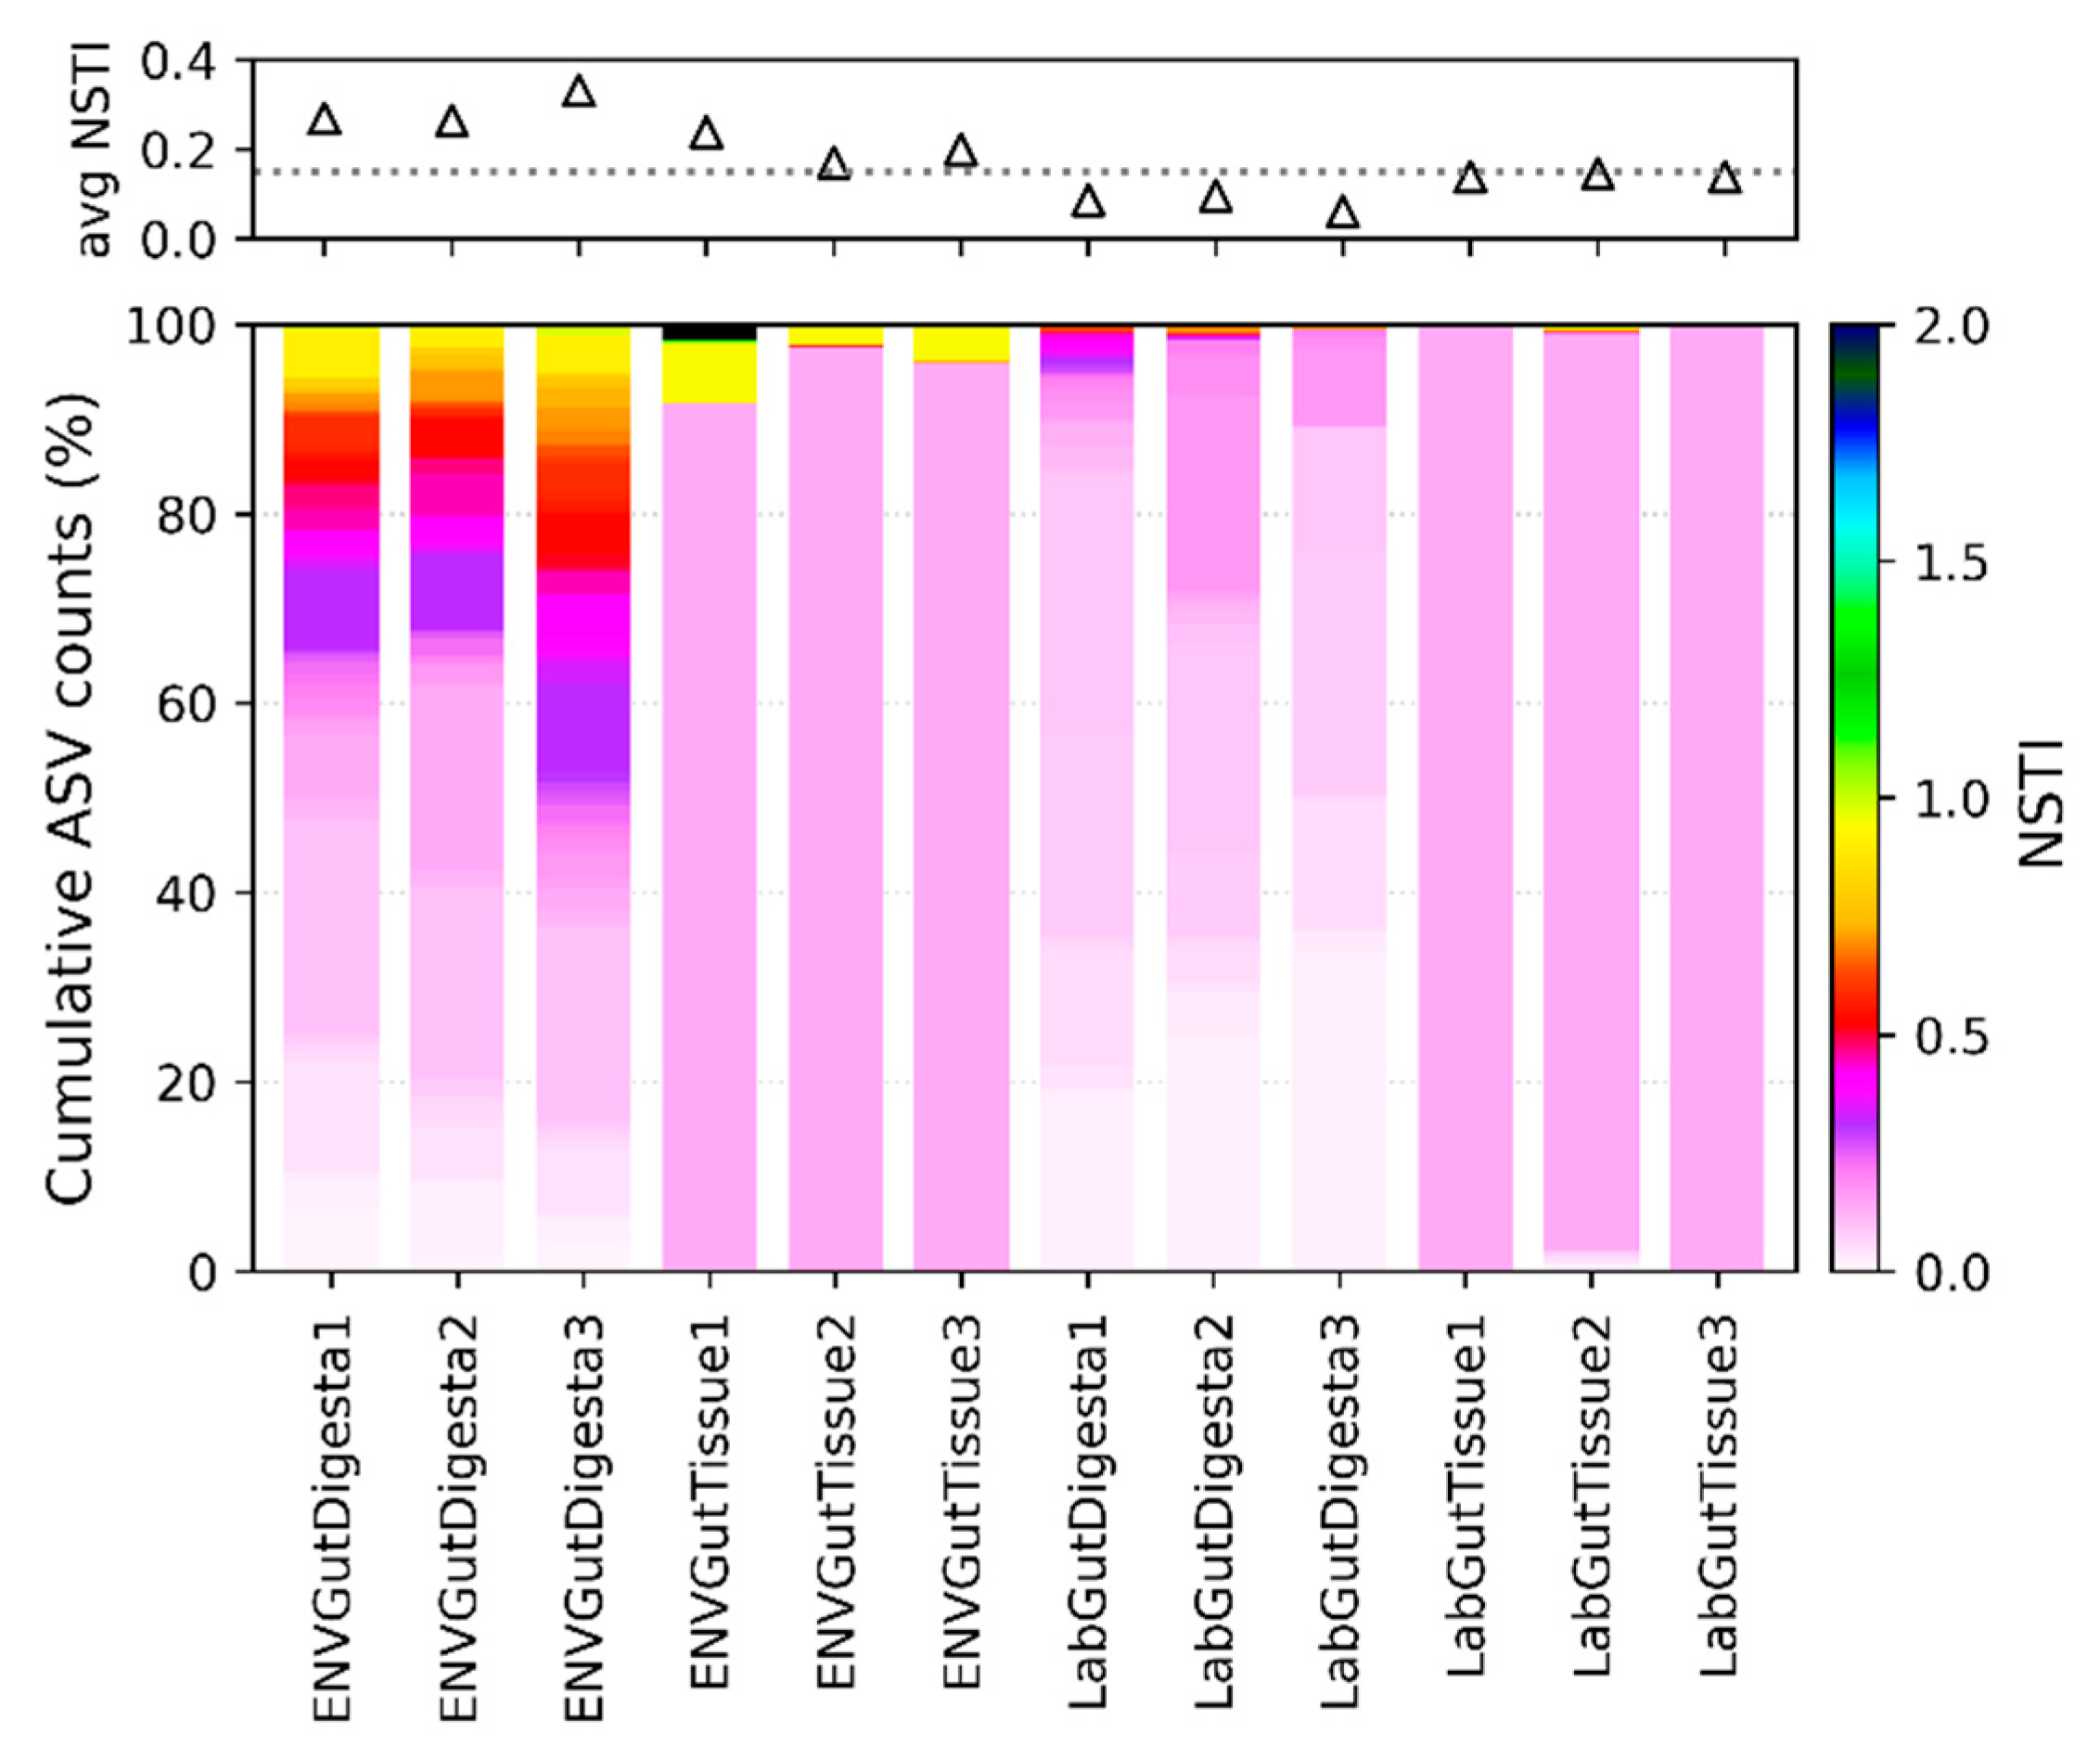
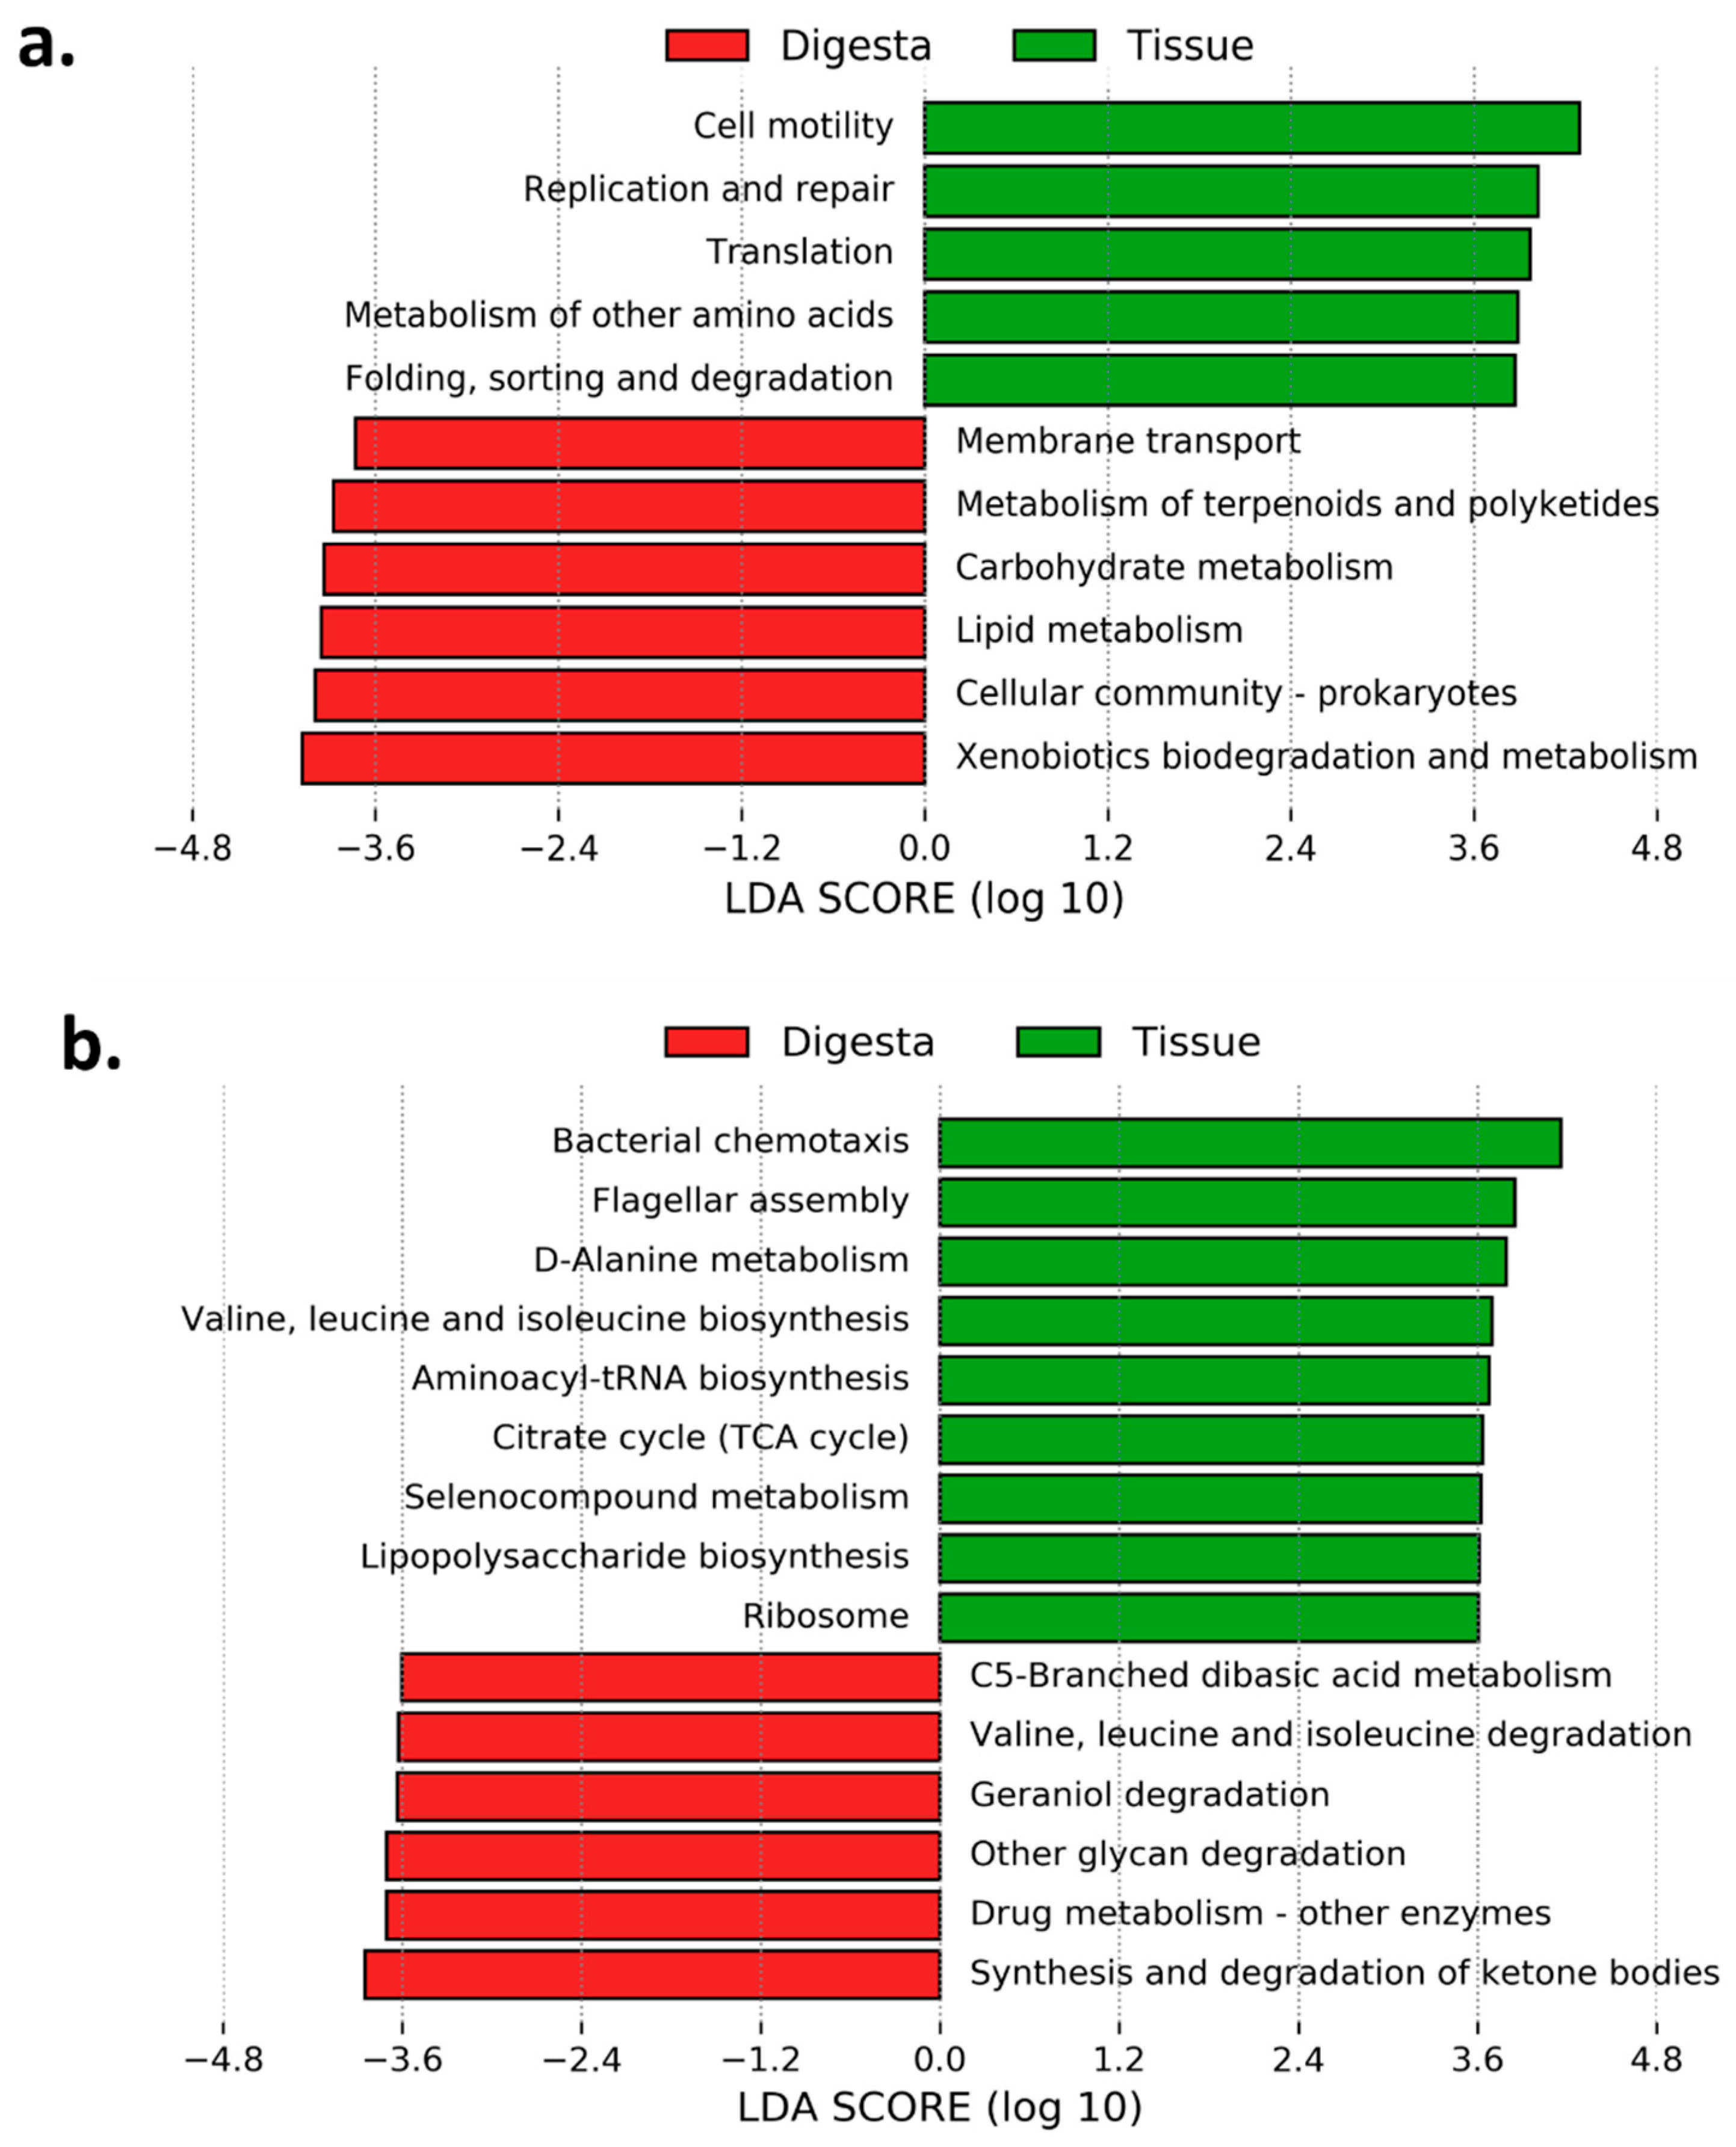
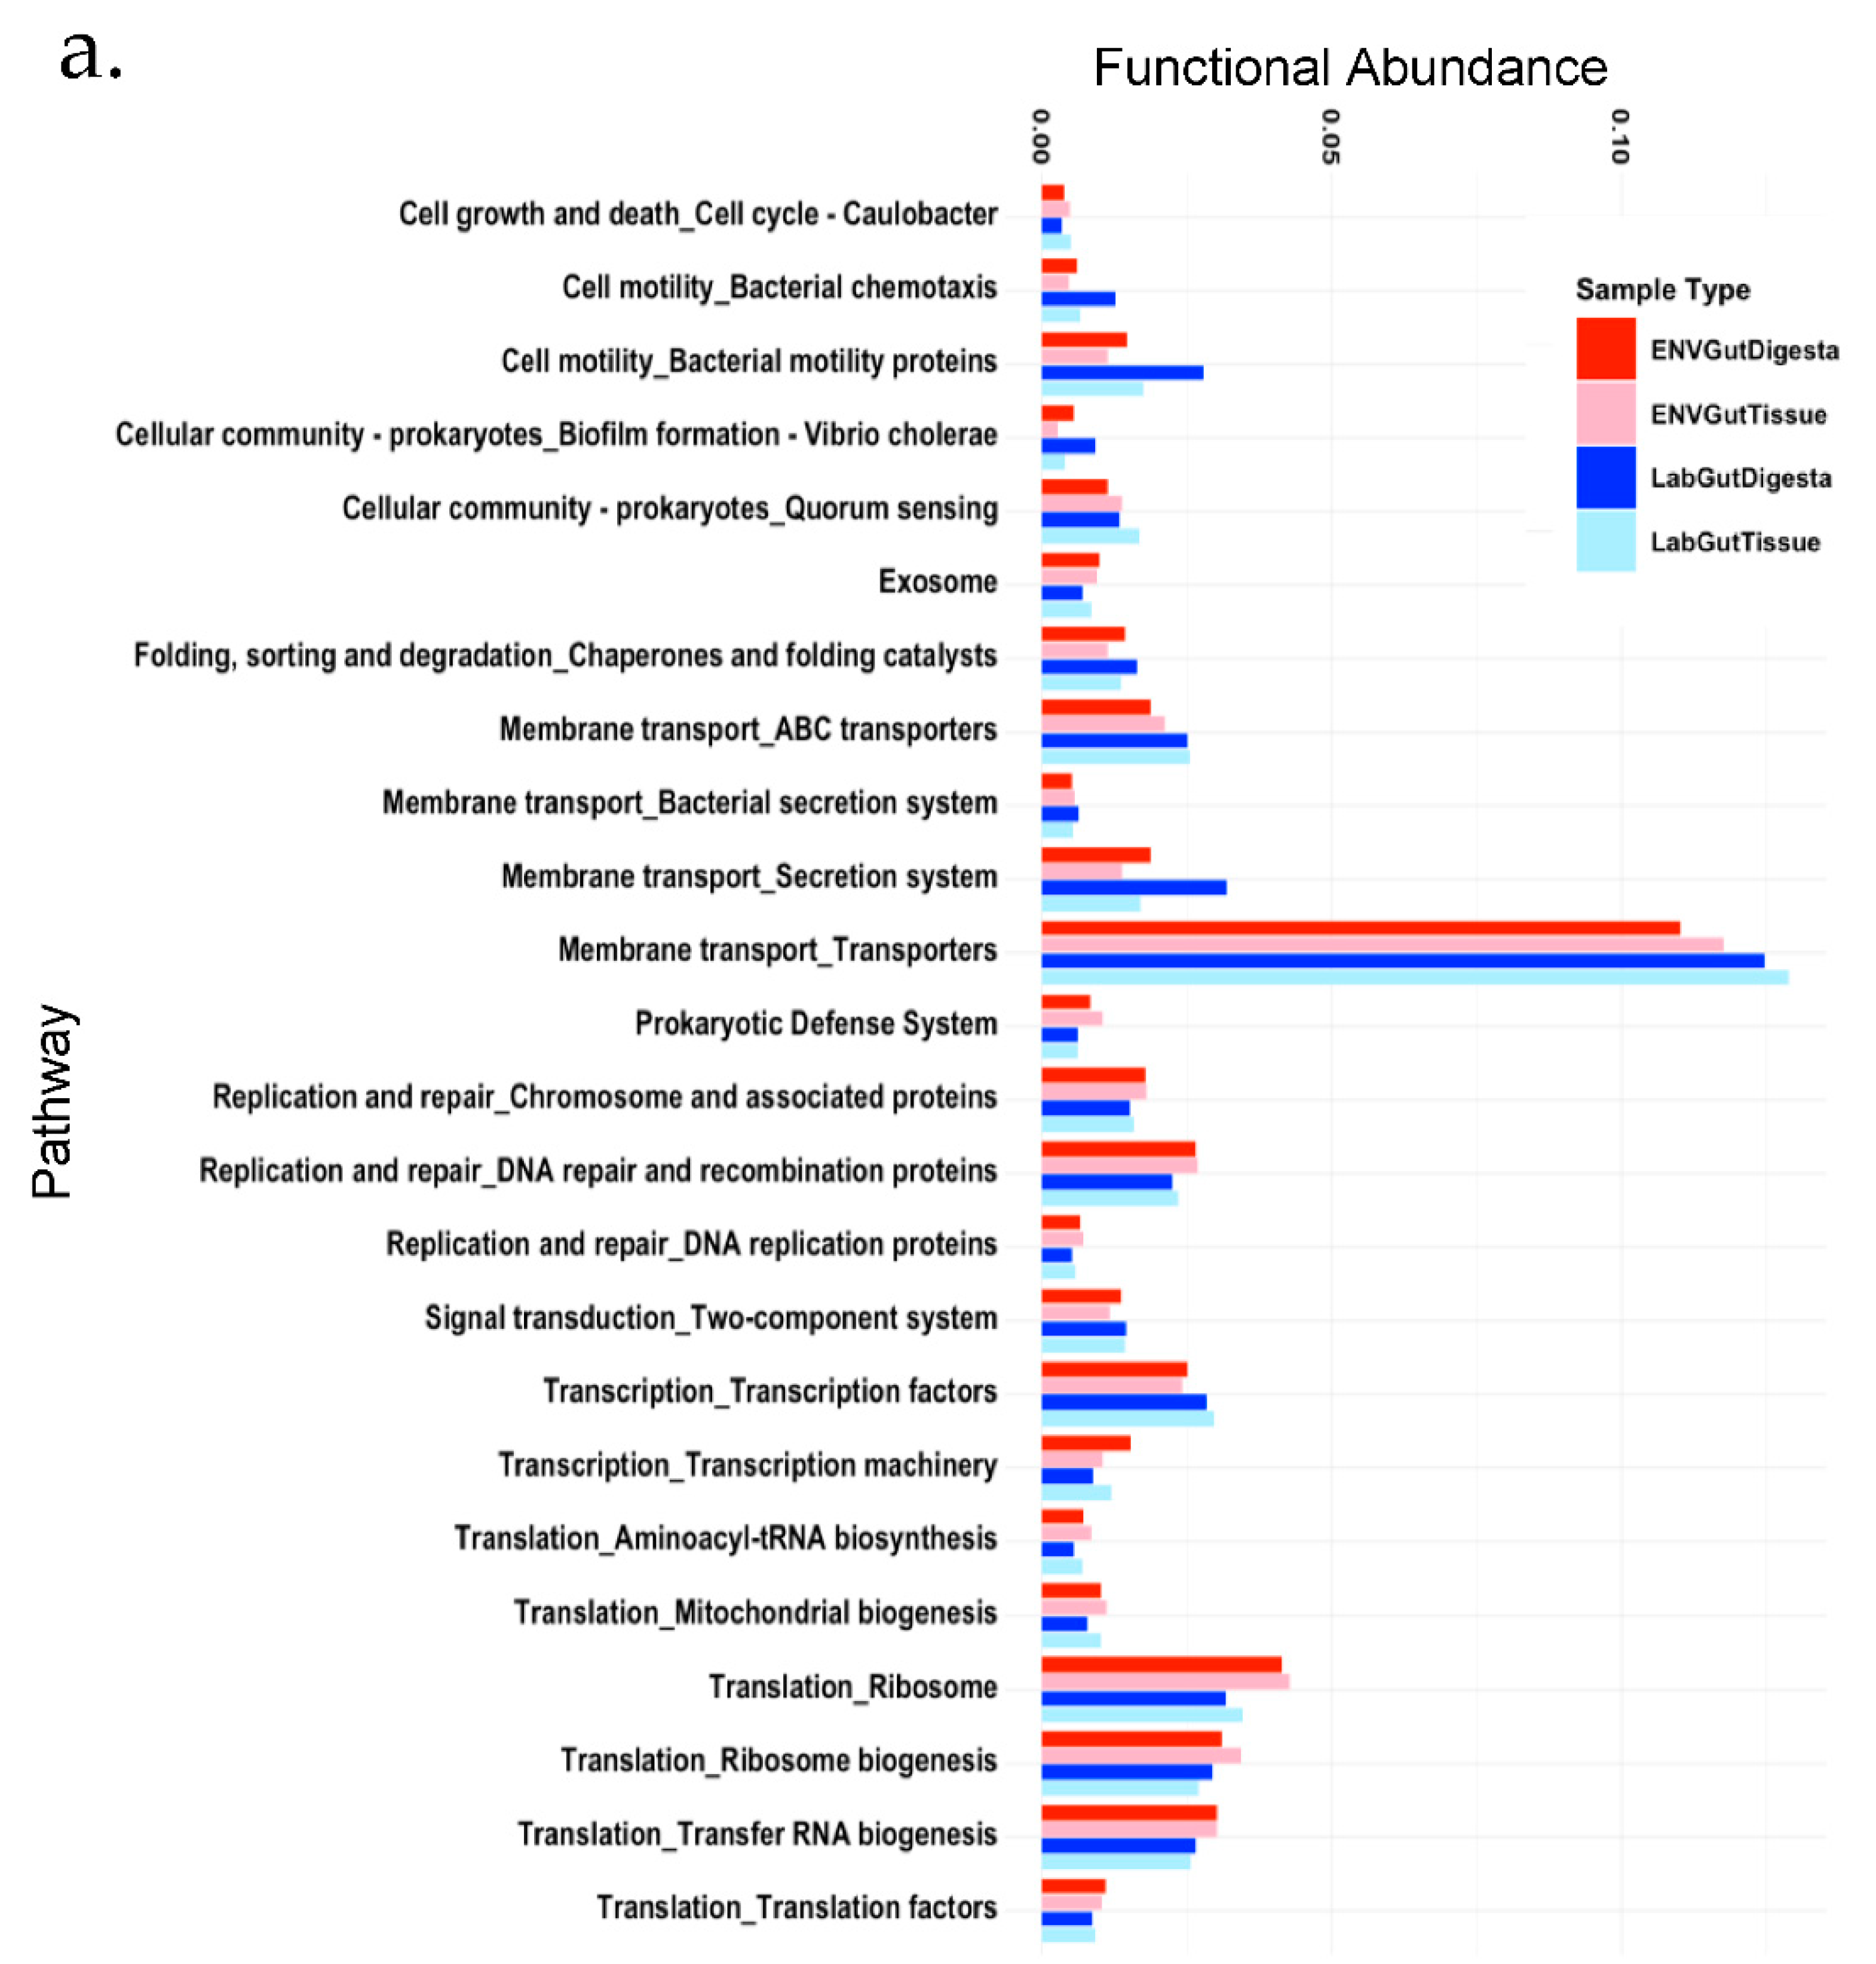
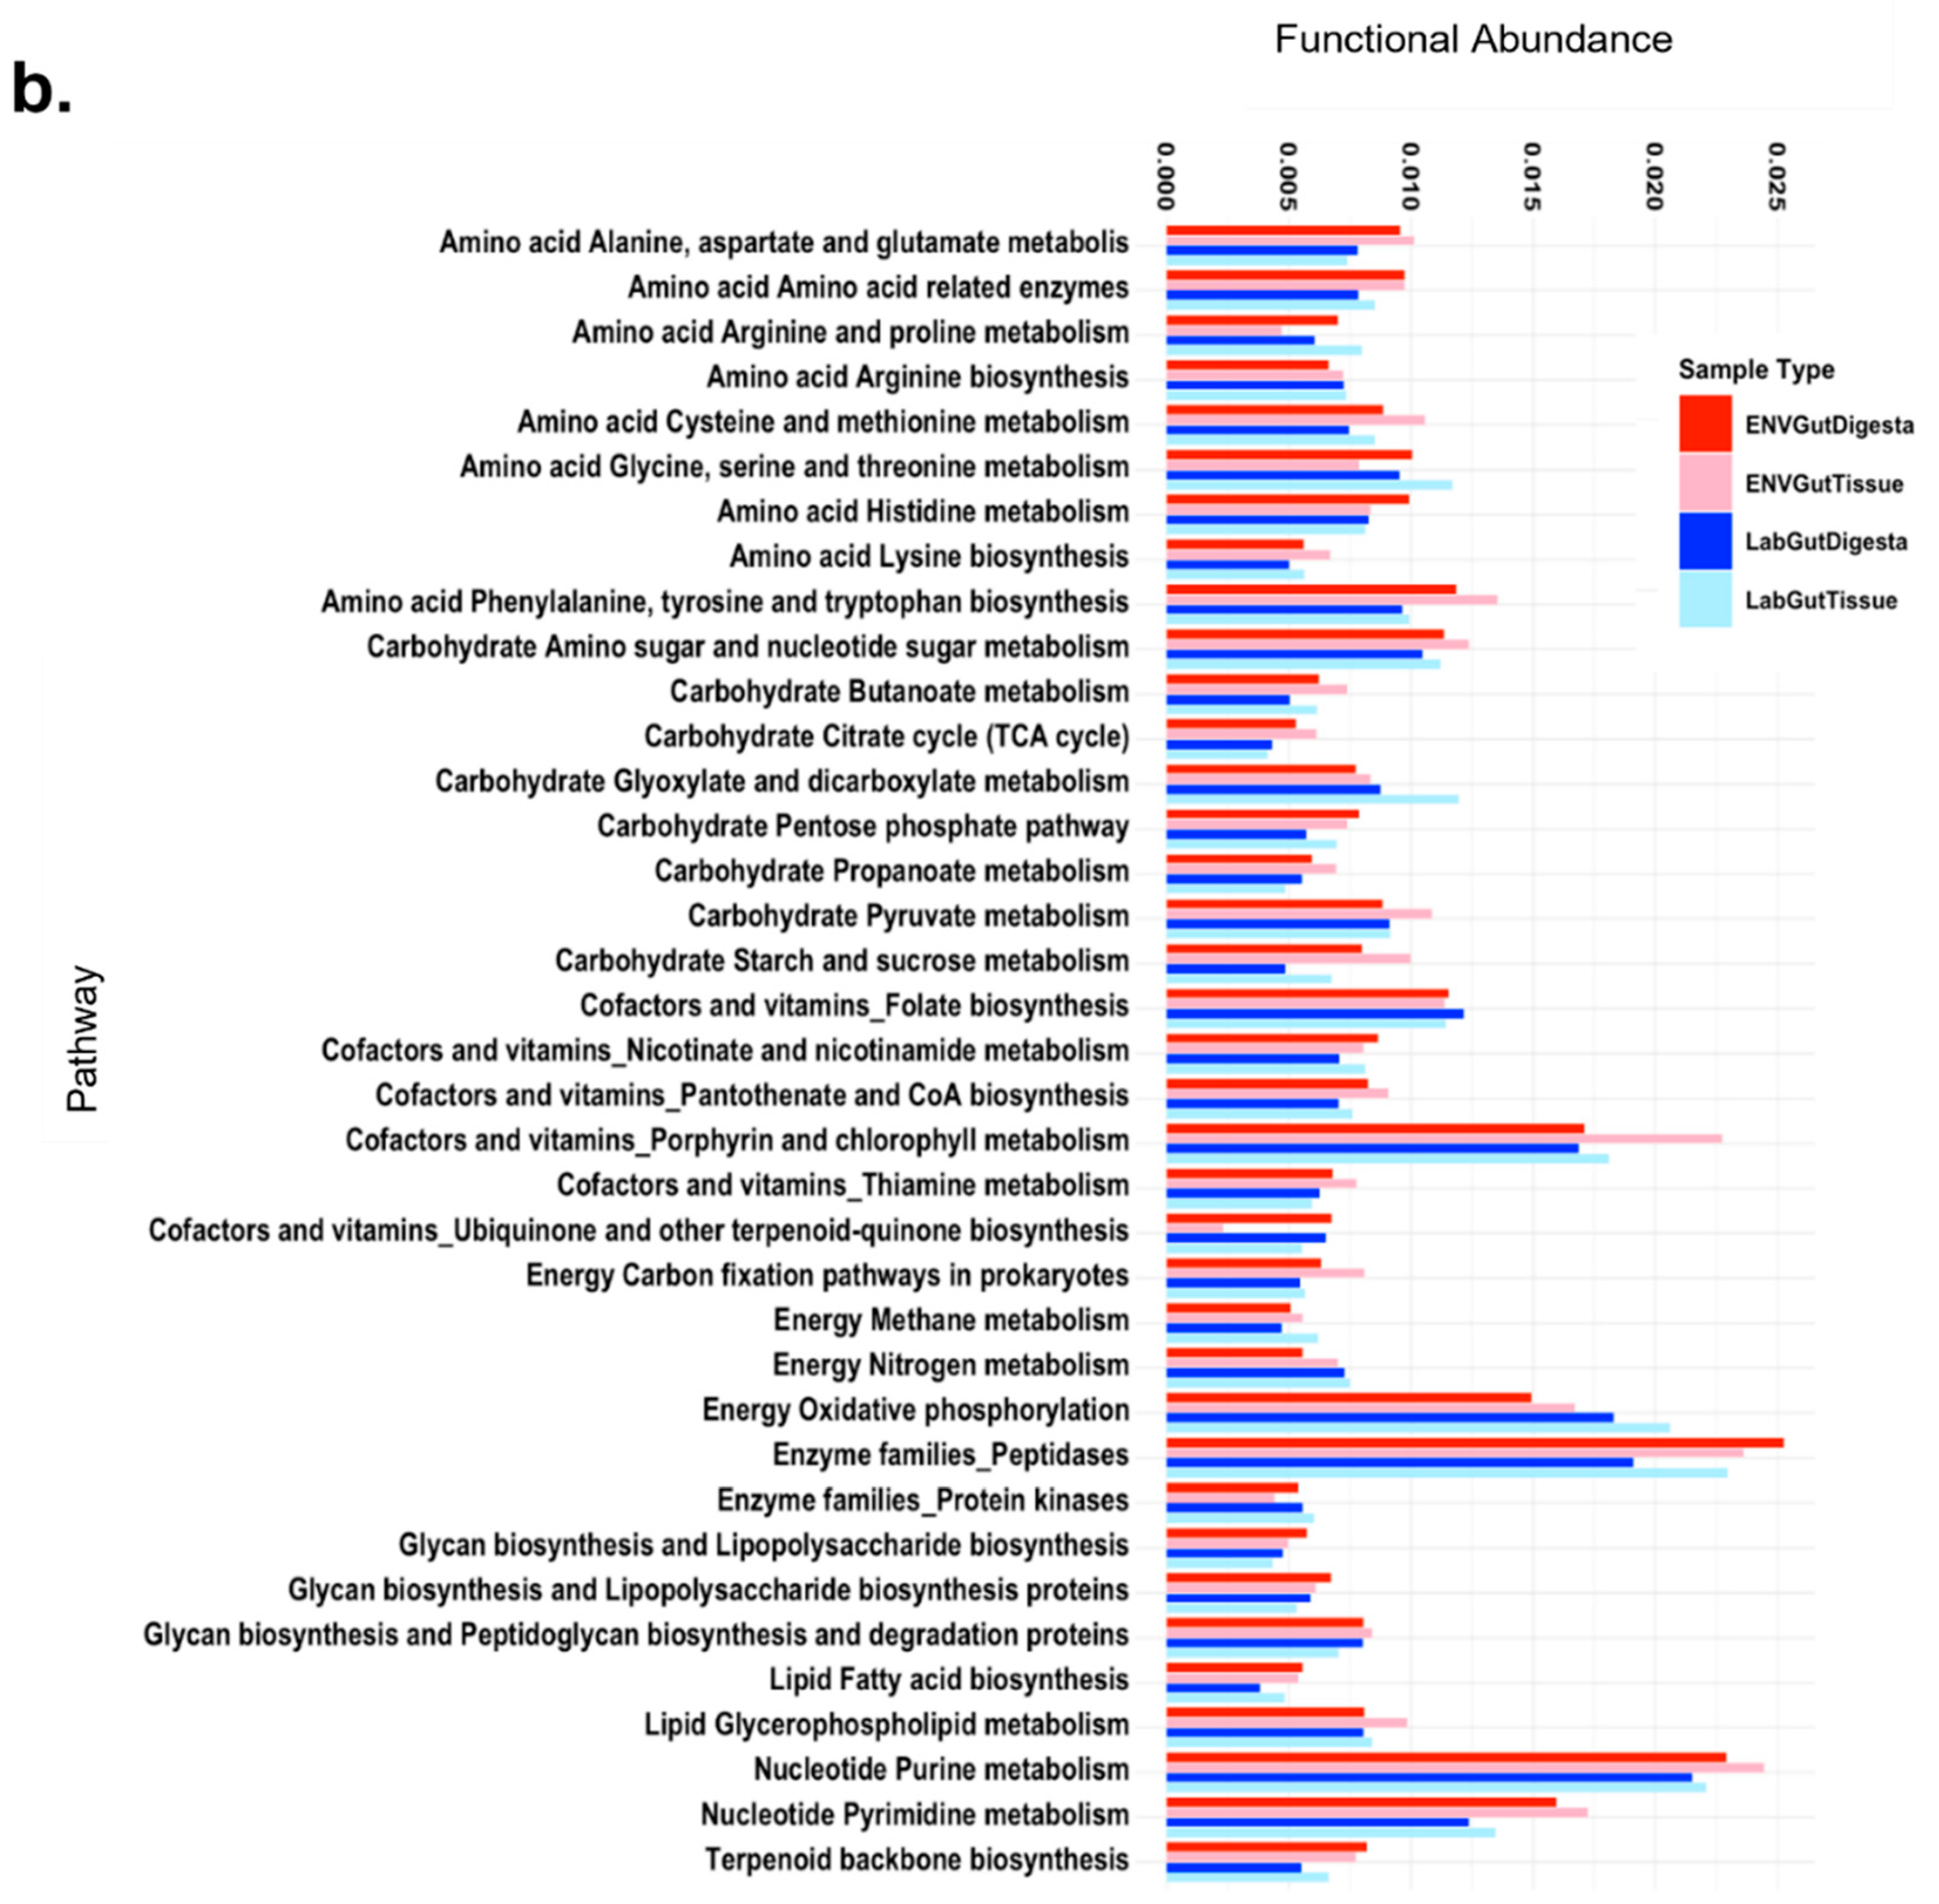
3.6. Predicted Functional Analysis

The NSTI values calculated through PICRUST (v2.3.0) showed an average value of 0.14 (ranging from 0.08–0.20) (Figure 6).
Overall, the trends of KEGG-Level-2 categories were consistent among sample replicates, irrespective of habitat (Figure 7a). The LAB and ENV gut tissues showed heightened cell motility, replication and repair, translation, and other amino acid metabolism pathways when compared to the gut digesta. In contrast, the gut digesta of both groups showed a heightened abundance of carbohydrate metabolism, lipid metabolism, membrane transport, metabolism of terpenoids [81,82], and xenobiotics biodegradation as compared to the gut tissues. Moreover, these metabolic categories were noticeably enriched in the ENV gut digesta as compared to the LAB gut digesta. KEGG-level-3 observations showed a preferential abundance of methionine metabolism, oxidative phosphorylation, glyoxylate and dicarboxylate metabolism, porphyrin and chlorophyll metabolism, purine metabolism, and pyrimidine metabolism in the gut tissue as well as categories related to transport systems (membrane transport, ABC transport, membrane transporters) (Figure 7b). The gut digesta displayed categories related to peptidase metabolism, folate biosynthesis, glycan and lipopolysaccharide biosynthesis proteins, and histidine metabolism. Gut digesta also displayed a higher abundance of categories related to bacterial motility and chaperones. Other categories that were enriched in the ENV group in contrast to the LAB group included peptidase metabolism, chlorophyll metabolism, purine metabolism, tryptophan metabolism, glutamate metabolism, methionine metabolism, lysine biosynthesis, pyruvate metabolism, and translation pathways (Figure 7a,b and Figure 8). When LAB and ENV gut digesta were compared, the enriched pathways in LAB gut digesta were bacterial chemotaxis and flagellar assembly, both of which were related to cell mobility; on the other hand, the ENV gut digesta showed higher differential abundance in streptomycin biosynthesis and other glycan degradation (Supplementary Figure S3). When LAB and ENV gut tissue were compared, only carbon fixation pathways were identified as differentially abundant pathways in the LAB group (data not shown).

4. Discussion

The sequence dataset used in this study was analyzed using the QIIME2/ASV tools, which have been described as superior tools on multiple fronts, such as the recovery of sequences, by avoiding spurious taxa assignments as well as providing more accurate diversity estimates as compared to previously reported tools, including QIIME1 (v1.9.1) and others [45,47,83,84]. Based upon the current analysis, the microbiota in the L. variegatus gut ecosystem using the rarified HTS data revealed that Arcobacter spp. belonging to Epsilonproteobacteria were the dominant taxon in the gut tissues of both LAB and ENV samples (Figure 1). In general, these findings are comparable qualitatively to other studies [24,25,31,45,85]. Besides Arcobacter, other members of the Epsilonproteobacteria are commonly associated with other marine Echinoderms, such as unculturable Helicobacter in sea stars Patiria pectinifera and Asterias amurensis [86], and Helicobacter, Sulfurospirillum, and Sulfuricurvum among the sea cucumber [87]. The presence of Epsilonproteobacteria (33.6%) has been reported on the surface of a red urchin Loxechinus albus from a fish farming of aquaculture environment [88]. The source of the reported Epsilonproteobacteria in a closed aquaculture environment [88] could be the shedding of the gut contents. Interestingly, the Epsilonproteobacteria was not detected in the gut microbiota of an Antarctic heart urchin (Spatangoida) Abatus agassizii [89], although the explanation for such variation is currently unknown. In contrast, a comparison between the LAB and ENV gut digesta showed noticeable differences in microbial community composition. Overall, both LAB and ENV gut digesta showed Vibrio to be dominant, which is consistent with previously reported urchins Strongylocentrotus droebachiensis, Tripneustes ventricosus [30], Strongylocentrotus intermedius, Strongylocentrotus nudus [90], Echinus esculentus [91], L. variegatus [85], Hemicentrotus pulcherrimus [92], and Strongylocentrotus purpuratus [41], as well as in the coelomic fluid of Paracentrotus lividus [93].
However, the higher relative abundance of Vibrio in the LAB group could be due to the relatively higher salt concentration (32 ± 1 ppt.), pH (~8.4), and temperature (22 ± 2 °C) used in the laboratory aquaculture as compared to the conditions of their natural habitat (salinity = 28 ± 1 ppt.; pH = 7.8 ± 0.2; temperature = 20 ± 2 °C) [94]. Other differences included a prevalence of Photobacterium in the ENV group, certain species of which have been reported to perform lipid metabolisms in another urchin species, Paracentrotus lividus [95,96,97]. Additionally, the prevalence of a strictly anaerobic genus Propionigenium of phylum Fusobacteria in the ENV groups likely due to the higher fraction of non-digestible carbohydrates in seagrass compared to the laboratory-formulated feed. Propionigenium spp. generate the fatty acid propionate from succinate [98,99,100] and may benefit urchins through such health-related effects as mitigation of inflammation [99].
Although the gut tissues in both ENV and LAB groups had comparable taxonomic diversity, the differences in the alpha diversity observed could be due to the diverse bacterial taxa in the nearshore Gulf of Mexico marine habitat (Table 1). Additionally, fluctuations of the abiotic factors such as pH, temperature, photoperiod, and salinity could also promote differences in the microbial diversity on a temporal scale [101,102,103,104]. Moreover, it has been reported that diet plays a significant role in the gut microbial composition in a wide range of organisms [105,106]. Although L. variegatus generally grazes seagrass in their habitat, they also consume alternate food sources such as detritus materials, various algae, and their epibionts [33,35]. In contrast, the defined laboratory-maintained aquaculture conditions could have contributed to the low alpha diversity in the gut digesta of the LAB group. This could be due to the small number of species outcompeting other species due to excess nutrient loading in laboratory-maintained conditions [107]. Although a similar reduction of the alpha diversity has been reported [8,108,109], this is not a universal trend in laboratory-maintained animals, as had been observed in the zebrafish [5], baboon [110], hydra [111], fruit flies [112], and birds [113,114,115], at least at the phylum and class levels. Thus, in our study, the replacement of the diet from their natural habitat with the defined nutritionally balanced feed used ad libitum for the LAB group likely restructured the gut microbial community but may need further investigation. However, it is important to note that the differences in the gut microbiota in experimental animals when maintained and fed a formulated diet as compared to animals used directly from the wild could impact the interpretations of the outcomes of various scientific studies [12,15].
The ANOSIM and Adonis statistics (p = 0.001) supported distinct cluster patterns of the four groups comprising the gut tissue and gut digesta of the LAB (n = 3) and ENV (n = 3) urchin’s biological replicates used in this study. The microbial communities of the gut tissue and gut digesta showed unique cluster patterns of biological replicates as determined by beta diversity analysis (Figure 2a,b). Notably, the gut tissues of both the LAB and ENV groups clustered together, indicating a gut tissue-specific microbiota likely maintained following the transition to the laboratory aquaculture environment. Although the LAB and ENV gut digesta showed common higher taxonomic classifications, such as Gammaproteobacteria, differences at the lower taxonomic levels were noted. Such results suggest that habitat may influence the microbial community composition in the gut digesta environment. The LEfSe analysis between the gut tissue and gut digesta across both groups predicted Campylobacteraceae and Vibrio to contribute to the uniquely separated microbial ecology in the L. variegatus gut ecosystem (Figure 3a,b).
To gain further insight into the interactive aspects of the microbiota, we used CoNet (v1.1.1) [64,66,67] analysis for theoretical modeling of relationships occurring at the taxonomic level in the gut digesta of ENV and LAB urchins. Overall, the CoNet identified highly abundant Propionigenium as the key taxon in the ENV gut digesta (45%) (Figure 4a,b), with a high degree of positive associations with other taxa, while it exhibited relatively low abundance in the LAB gut digesta (~2%). In addition, the Propionigenium also exhibited a significant degree of positive associations (six out of seven) with taxa in the LAB digesta other than the ones in the ENV digesta (Figure 5a,b). Interestingly, Propionigenium was also found in the purple urchins, S. purpuratus, suggesting their dominant influence in structuring the gut microbial communities in urchins [41,76]. Propionigenium is known for energy metabolism primarily through membrane-associated energy transduction and ATP synthesis [116]. Thus, a high degree of association and abundance of Propionigenium in the gut digesta microbial community likely support the CoNet results.
Two of the taxa identified in both LAB and ENV gut digesta were Desulfobacteraceae and Desulfovibrio. The highest resolution in the ENV gut digesta, which were included in the top 15 most likely key taxa in the gut digesta, were sulfur-reducing bacteria (<1%), which represented a total degree of 9 and 18 associations with the majority of those indicated as co-exclusion relationships. These taxa belong to the phylum Deltaproteobacteria and represent species known to use sulfate as electron acceptors [117]. However, in LAB gut digesta, the resolution significantly decreased. The CoNet (v1.1.1) [64,65,66] analysis was used to perform the theoretical modeling of the relationships occurring between microbial taxa in the gut tissue between ENV and LAB urchins. Campylobacteraceae (~90%) abundance was responsible for the majority of LAB and ENV tissue, and this resulted in a reduced network structure. Overall, the CoNet identified Arcobacter as the key taxon (<1%) for the LAB gut tissue, with a high degree of positive associations (7 out of 13) (Supplementary Figure S1a). Alphaproteobacteria was identified as a key taxon for the ENV gut tissue, with a high degree of positive associations (3 out of 5) (Supplementary Figure S1b). It is important to note that this network will be influenced by Campylobacteraceae, as well as the reduced number of taxa to work with.
Although Vibrio comprises a noticeably abundant taxon in both the ENV and LAB groups, low-abundance taxa such as Congregibacter (<1%), a member of Gammaproteobacteria, in the ENV group exhibited a high closeness centrality compared to betweenness centrality, as well as a large number of edges (22 total), with 16 positive associations to other taxa (Figure 4a,b). The Congregibacter is an aerobic, bacteriochlorophyll a-producing, a photosynthetic bacterium found in marine environments, and contributes to marine carbon cycling [118]. Thus, it is reasonable to predict that this bacterium, although found in relatively low abundance, will exhibit a high degree of interaction with other taxa and potentially play an important role in energy metabolism in the gut digesta of the ENV samples. In the LAB group, Octadecabacter (<1%), a member of Proteobacteria, was observed to have a high closeness centrality compared to betweenness centrality, and a large number of edges (22 total), with 20 positive associations to other taxa (Figure 5a,b). Octadecabacter has been described as part of the marine Roseobacter clade, which is found as a dominant symbiont in the brittle star Amphipholis squamata inhabiting shallow intertidal cold coastal waters, and which might play a possible role in nutrient uptake [119]. Octadecabacter has also been found in extremely cold Arctic and Antarctic Sea ice ecosystems, with the possible role of nitrogen metabolism [120]. However, the presence of this bacterium and its potential metabolic role in LAB urchins in our study is unclear and may need further investigation in future studies.
The predicted functional analysis of the gut microbial communities using PICRUSt2 (v2.3.0-b) indicated carbohydrate, amino acid, and lipid metabolisms to be more dominant in the gut digesta than in the gut tissue in both LAB and ENV groups (Figure 7a,b). These results indicate that the gut digesta is the primary location for the microbial-driven metabolism of environmental and laboratory-prepared dietary macromolecules [121,122,123]. Moreover, these metabolic categories were enriched in the ENV gut digesta, suggesting a higher metabolic capacity. Conversely, the gut tissues of both groups showed energy metabolism to be significantly heightened as compared to the gut digesta (Figure 8). This category includes nitrogen and sulfur metabolisms, which have been attributed to the microbial communities of other urchins [29,30,93,124,125]. Additionally, Arcobacter spp. has been described as a chemolithoautotrophic bacterium [78], performing crucial biochemical processes in the marine environment, such as sulfur oxidation in hydrothermal vents [126] and nitrogen metabolisms [127]. However, whether these metabolisms are of any benefit to their host’s health and nutrition, including the specific metabolic input of the dominant Epsilonproteobacteria of the gut tissue, remains to be clarified.
Bacterial motility is an essential virulence factor in pathogens, including Vibrio, which can affect a vast range of aquatic organisms [128]. In our study, as compared to the ENV digesta, the LAB gut digesta showed higher differential abundance in cell motility (bacterial chemotaxis and flagellar assembly in Supplementary Figure S3). This could have caused adverse outcomes reflecting the lower alpha diversity in the LAB gut digesta (Table 1) [107,129]. The glycan degradation pathway, on the other hand, was the most differentially abundant in ENV gut digesta group (Supplementary Figure S3). It has been reported that gut microbiota can forage glycans from the host as a nutrient source [130,131]. However, further studies are needed to better understand the nutrient exchange between the host and the gut digesta to maintain a steady-state metabolic benefit for this animal.

5. Conclusions

In conclusion, L. variegatus maintained a distinct microbial community representing primarily Arcobacter spp. in the gut tissues. Predicted functional roles indicated that this taxon is involved in the energy metabolisms irrespective of the laboratory conditions (LAB) or their natural habitat (ENV). While a comparison of the microbiota at the most resolved level exhibited distinct differences between the gut digesta of the LAB and ENV groups, consistencies were observed at the phylum or the class level. The co-presence, co-exclusion, and the key taxa determined through CoNet network revealed an abundance of Vibrio in both ENV and LAB gut digesta, with ENV gut digesta having an abundance of Flavobacteriales, Propionigenium, Photobacterium, and Campylobacteraceae. However, the LAB gut digesta displayed only an abundance of Vibrio and Arcobacter. The ENV gut digesta revealed Congregibacter and Rhodobacteraceae as having the highest degrees (22 and 21), and LAB gut digesta revealed Octadecabacter and Ruegeria as having the highest degrees (22 and 21). The CoNet analysis revealed an abundance of Campylobacteraceae in both ENV and LAB gut tissue, with Alphaproteobacteria have the highest degrees (2 and 3), and LAB gut digesta revealed Arcobacter as having the highest degrees (6 and 7). Additionally, the metabolisms of macronutrients in the gut digesta were consistently higher than the gut tissues in both LAB and ENV groups. These results indicate that the gut digesta is potentially the primary location in the L. variegatus gut ecosystem at which maximum microbial energy metabolisms occur.
The results from this provide an insight into the potential impact of the diet on structuring and predicted metabolic functions of the gut microbial communities of laboratory aquaculture vs. naturally occurring L. variegatus. Such changes likely contribute to the host’s metabolism and health, further emphasizing the importance of gut microbiome composition and the selection of diet, which may affect the reproducibility, consistency, and interpretation of scientific data when L. variegatus are used directly from their natural habitat, compared to a laboratory aquaculture environment, in various laboratory experiments. However, we realize that future studies may be needed to further elaborate the significance of the close association of Epsilonproteobacteria with the gut tissues and the potential role of habitat-specific or laboratory-formulated diet in restructuring the microbiota, particularly in the mucous-encapsulated high-energy gut digesta that contribute to the host’s metabolism and health.

Supplementary Materials

The following are available online at https://0-www-mdpi-com.brum.beds.ac.uk/article/10.3390/applmicrobiol1020016/s1, Figure S1: Co-occurrence Network (CoNet) patterns of the laboratory maintained (LAB) Lytechinus variegatus gut tissues displaying (A) edges with taxonomic co-exclusion and co-presence, and (B) scatter plot analysis showing top 5 taxa ranked via their closeness centrality, Figure S2: Co-occurrence Network (CoNet) patterns of the naturally occurring (ENV) Lytechinus variegatus gut tissues displaying (A) edges with taxonomic co-exclusion and co-presence, and (B) scatter plot analysis showing top 5 taxa ranked via their closeness centrality, Figure S3: Linear discriminant analysis (LDA) effect size (LEfSe) predicted functional profiles corresponding to the microbial communities of the Lytechinus variegatus gut digesta between LAB and ENV samples. Table S1: The QIIME2 (v.2020.8) ASV table data generated through DADA2 (v1.10) for all samples in this study with taxonomy assigned; Table S2: A list of Amplicon Sequence Variant (ASV) found by QIIME2 output in the analyzed samples.

Author Contributions

Conceptualization: G.B.H.G., J.A.H. and A.K.B.; Methodology, Software, Validation: G.B.H.G., J.-W.C., J.A.H. and H.K.; Formal Analysis, Data Curation, Visualization: G.B.H.G., J.A.H., J.-W.C. and A.K.B.; Writing, Review & Editing: G.B.H.G., J.A.H., A.K.B., C.D.M. and S.A.W.; Supervision: A.K.B.; Funding Acquisition: C.D.M. and S.A.W. All authors have read and agreed to the published version of the manuscript.

Funding

The following are acknowledged for their support of the Microbiome Resource at the University of Alabama at Birmingham: School of Medicine, Comprehensive Cancer Center (P30AR050948; C.D.M.), Center for Clinical Translational Science (UL1TR000165; C.D.M.), UAB Microbiome Center (C.D.M.), Heflin Center for Genomic Sciences; UAB NORC Lab Animal Nutrition Core (NIH P30DK056336).

Institutional Review Board Statement

The study was conducted according to the guidelines approved by the animal care and use under the Institutional Animal Care and Use Committee IACUC-21893; 22 November 2019–21 November 2022 (S.A.W.), the University of Alabama at Birmingham.

Informed Consent Statement

No human subject or sample was used in this study.

Data Availability Statement

The HTS datasets of the samples are publicly available at the BioSample Submission Portal (https://0-www-ncbi-nlm-nih-gov.brum.beds.ac.uk/bioproject/) under the BioProject IDs PRJNA291441 and PRJNA326427.

Acknowledgments

We would like to thank Peter Eipers of the Department of Cell, Developmental and Integrative Biology, and Michael Crowley of the Heflin Center for Genomics Sciences at the University of Alabama at Birmingham (UAB) for assistance in high-throughput sequencing for this study, and the Biology Department at UAB for logistics and graduate tuition and stipend support. The animal care and use for the experiments were conducted in accordance with the UAB Animal Care and Use Committee (IACUC) under the Animal Project Number (APN): IACUC-21893 (November 22, 2019–21 November 2022) (S.A. Watts).

Conflicts of Interest

The authors declare that this research was conducted in the absence of any commercial or financial relationships that could be construed as a potential conflict of interest.

References

  1. Elmqvist, T.; Folke, C.; Nyström, M.; Peterson, G.; Bengtsson, J.; Walker, B.; Norberg, J. Response diversity, ecosystem change, and resilience. Front. Ecol. Environ. 2003, 1, 488–494. [Google Scholar] [CrossRef]
  2. Levin, S.A.; Lubchenco, J. Resilience, robustness, and marine ecosystem-based management. Bioscience 2008, 58, 27–32. [Google Scholar] [CrossRef] [Green Version]
  3. Palumbi, S.R.; McLeod, K.L.; Grünbaum, D. Ecosystems in action: Lessons from marine ecology about recovery, resistance, and reversibility. BioScience 2008, 58, 33–42. [Google Scholar] [CrossRef]
  4. Rosshart, S.P.; Vassallo, B.G.; Angeletti, D.; Hutchinson, D.S.; Morgan, A.P.; Takeda, K.; Hickman, H.D.; McCulloch, J.A.; Badger, J.H.; Ajami, N.J. Wild mouse gut microbiota promotes host fitness and improves disease resistance. Cell 2017, 171, 1015–1028.e13. [Google Scholar] [CrossRef] [Green Version]
  5. Roeselers, G.; Mittge, E.K.; Stephens, W.Z.; Parichy, D.M.; Cavanaugh, C.M.; Guillemin, K.; Rawls, J.F. Evidence for a core gut microbiota in the zebrafish. ISME J. 2011, 5, 1595–1608. [Google Scholar] [CrossRef] [PubMed] [Green Version]
  6. Dirksen, P.; Marsh, S.A.; Braker, I.; Heitland, N.; Wagner, S.; Nakad, R.; Mader, S.; Petersen, C.; Kowallik, V.; Rosenstiel, P. The native microbiome of the nematode Caenorhabditis elegans: Gateway to a new host-microbiome model. BMC Biol. 2016, 14, 1–16. [Google Scholar] [CrossRef] [PubMed] [Green Version]
  7. Zhang, F.; Berg, M.; Dierking, K.; Félix, M.-A.; Shapira, M.; Samuel, B.S.; Schulenburg, H. Caenorhabditis elegans as a model for microbiome research. Front. Microbiol. 2017, 8, 485. [Google Scholar] [CrossRef]
  8. Staubach, F.; Baines, J.F.; Künzel, S.; Bik, E.M.; Petrov, D.A. Host species and environmental effects on bacterial communities associated with Drosophila in the laboratory and in the natural environment. PLoS ONE 2013, 8, e70749. [Google Scholar] [CrossRef] [Green Version]
  9. Hills, R.D.; Pontefract, B.A.; Mishcon, H.R.; Black, C.A.; Sutton, S.C.; Theberge, C.R. Gut microbiome: Profound implications for diet and disease. Nutrients 2019, 11, 1613. [Google Scholar] [CrossRef] [Green Version]
  10. Fan, Y.; Pedersen, O. Gut microbiota in human metabolic health and disease. Nat. Rev. Microbiol. 2021, 19, 55–71. [Google Scholar] [CrossRef] [PubMed]
  11. Valdes, A.M.; Walter, J.; Segal, E.; Spector, T.D. Role of the gut microbiota in nutrition and health. BMJ 2018, 361, k2179. [Google Scholar] [CrossRef] [Green Version]
  12. Ericsson, A.C.; Franklin, C.L. The gut microbiome of laboratory mice: Considerations and best practices for translational research. Mamm. Genome 2021, 1–12. [Google Scholar]
  13. Turner, P.V. The role of the gut microbiota on animal model reproducibility. Anim. Models Exp. Med. 2018, 1, 109–115. [Google Scholar] [CrossRef] [PubMed]
  14. Ricci, M. Laboratory animal control diets: Very important, often neglected. Lab. Anim. 2015, 44, 240. [Google Scholar] [CrossRef]
  15. Xiang, Z.; Zhu, H.; Yang, B.; Fan, H.; Guo, J.; Liu, J.; Kong, Q.; Teng, Q.; Shang, H.; Su, L. A glance at the gut microbiota of five experimental animal species through fecal samples. Sci. Rep. 2020, 10, 1–11. [Google Scholar] [CrossRef] [PubMed]
  16. McBride, S.C. Sea urchin aquaculture. In Proceedings of the American Fisheries Society Symposium. Am. Fish. Soc. Symp. 2005, 46, 179–208. [Google Scholar]
  17. Heflin, L.E.; Makowsky, R.; Taylor, J.C.; Williams, M.B.; Lawrence, A.L.; Watts, S.A. Production and economic optimization of dietary protein and carbohydrate in the culture of juvenile sea urchin Lytechinus variegatus. Aquaculture 2016, 463, 51–60. [Google Scholar] [CrossRef] [Green Version]
  18. Albright, R.; Bland, C.; Gillette, P.; Serafy, J.E.; Langdon, C.; Capo, T.R. Juvenile growth of the tropical sea urchin Lytechinus variegatus exposed to near-future ocean acidification scenarios. J. Exp. Mar. Biol. Ecol. 2012, 426, 12–17. [Google Scholar] [CrossRef] [PubMed] [Green Version]
  19. Hendler, G. Sea Stars, Sea Urchins, and Allies: Echinoderms of Florida and the Caribbean; Smithsonian Institution Press: Washington, DC, USA, 1995; 390p. [Google Scholar]
  20. Watanabe, J.M.; Harrold, C. Destructive grazing by sea urchins Strongylocentrotus spp. in a central California kelp forest: Potential roles of recruitment, depth, and predation. Mar. Ecol. Prog. Ser. Oldendorf 1991, 71, 125–141. [Google Scholar] [CrossRef]
  21. Watts, S.A.; McClintock, J.B.; JLawrence, J.M. Lytechinus. In Developments in Aquaculture and Fisheries Science; Lawrence, J.M., Ed.; Elsevier: Amsterdam, The Netherlands, 2020; Volume 43, pp. 661–680. [Google Scholar]
  22. Annunziata, R.; Perillo, M.; Andrikou, C.; Cole, A.G.; Martinez, P.; Arnone, M.I. Pattern and process during sea urchin gut morphogenesis: The regulatory landscape. Genesis 2014, 52, 251–268. [Google Scholar] [CrossRef]
  23. De Ridder, C.; Jangoux, M. Digestive systems: Echinoidea. In Echinoderm Nutrition; CRC Press: Boca Raton, FL, USA, 2020; pp. 213–234. [Google Scholar]
  24. Hakim, J.A.; Koo, H.; Dennis, L.N.; Kumar, R.; Ptacek, T.; Morrow, C.D.; Lefkowitz, E.J.; Powell, M.L.; Bej, A.K.; Watts, S.A. An abundance of Epsilonproteobacteria revealed in the gut microbiome of the laboratory cultured sea urchin, Lytechinus variegatus. Front. Microbiol. 2015, 6, 1047. [Google Scholar] [CrossRef]
  25. Hakim, J.A.; Koo, H.; Kumar, R.; Lefkowitz, E.J.; Morrow, C.D.; Powell, M.L.; Watts, S.A.; Bej, A.K. The gut microbiome of the sea urchin, Lytechinus variegatus, from its natural habitat demonstrates selective attributes of microbial taxa and predictive metabolic profiles. FEMS Microbiol. Ecol. 2016, 92, fiw146. [Google Scholar] [CrossRef] [Green Version]
  26. Holland, N.D.; Ghiselin, M.T. A comparative study of gut mucous cells in thirty-seven species of the class Echinoidea (Echinodermata). Biol. Bull. 1970, 138, 286–305. [Google Scholar] [CrossRef]
  27. Lasker, R.; Giese, A.C. Nutrition of the sea urchin, Strongylocentrotus purpuratus. Biol. Bull. 1954, 106, 328–340. [Google Scholar] [CrossRef]
  28. Beleneva, I.; Kukhlevskii, A. Characterization of Vibrio gigantis and Vibrio pomeroyi isolated from invertebrates of Peter the Great Bay, Sea of Japan. Microbiology 2010, 79, 402–407. [Google Scholar] [CrossRef]
  29. Guerinot, M.L.; Patriquin, D. The association of N 2-fixing bacteria with sea urchins. Mar. Biol. 1981, 62, 197–207. [Google Scholar] [CrossRef]
  30. Guerinot, M.; Patriquin, D. N2-fixing vibrios isolated from the gastrointestinal tract of sea urchins. Can. J. Microbiol. 1981, 27, 311–317. [Google Scholar] [CrossRef]
  31. Brothers, C.J.; Van Der Pol, W.J.; Morrow, C.D.; Hakim, J.A.; Koo, H.; McClintock, J.B. Ocean warming alters predicted microbiome functionality in a common sea urchin. Proc. R. Soc. B 2018, 285, 20180340. [Google Scholar] [CrossRef] [PubMed]
  32. Hammer, H.; Hammer, B.; Watts, S.; Lawrence, A.; Lawrence, J. The effect of dietary protein and carbohydrate concentration on the biochemical composition and gametogenic condition of the sea urchin Lytechinus variegatus. J. Exp. Mar. Biol. Ecol. 2006, 334, 109–121. [Google Scholar] [CrossRef]
  33. Beddingfield, S.D.; McClintock, J.B. Food Resource Utilization in the Sea Urchin Lytechinus variegatus in Contrasting Shallow-Water Microhabits of Saint Joseph Bay, Florida. Gulf Mex. Sci. 1999, 17, 3. [Google Scholar] [CrossRef]
  34. Deming, J.W.; Carpenter, S.D. Factors influencing benthic bacterial abundance, biomass, and activity on the northern continental margin and deep basin of the Gulf of Mexico. Deep Sea Res. Part II Top. Stud. Oceanogr. 2008, 55, 2597–2606. [Google Scholar] [CrossRef]
  35. Beddingfield, S.D.; McClintock, J.B. Demographic characteristics of Lytechinus variegatus (Echinoidea: Echinodermata) from three habitats in a North Florida Bay, Gulf of Mexico. Mar. Ecol. 2000, 21, 17–40. [Google Scholar] [CrossRef]
  36. Erwin, P.M.; Olson, J.B.; Thacker, R.W. Phylogenetic diversity, host-specificity and community profiling of sponge-associated bacteria in the northern Gulf of Mexico. PLoS ONE 2011, 6, e26806. [Google Scholar] [CrossRef] [PubMed] [Green Version]
  37. Felder, D.L.; Camp, D.K. Gulf of Mexico Origin, Waters, and Biota: Biodiversity; Texas A&M University Press: College Station, TX, USA, 2009. [Google Scholar]
  38. Kellogg, C.A.; Lisle, J.T.; Galkiewicz, J.P. Culture-independent characterization of bacterial communities associated with the cold-water coral Lophelia pertusa in the northeastern Gulf of Mexico. Appl. Environ. Microbiol. 2009, 75, 2294–2303. [Google Scholar] [CrossRef] [PubMed] [Green Version]
  39. Koo, H.; Mojib, N.; Thacker, R.W.; Bej, A.K. Comparative analysis of bacterial community-metagenomics in coastal Gulf of Mexico sediment microcosms following exposure to Macondo oil (MC252). Antonie Leeuwenhoek 2014, 106, 993–1009. [Google Scholar] [CrossRef] [PubMed]
  40. Skoog, A.; Biddanda, B.; Benner, R. Bacterial utilization of dissolved glucose in the upper water column of the Gulf of Mexico. Limnol. Oceanogr. 1999, 44, 1625–1633. [Google Scholar] [CrossRef] [Green Version]
  41. Hakim, J.A.; Schram, J.B.; Galloway, A.W.; Morrow, C.D.; Crowley, M.R.; Watts, S.A.; Bej, A.K. The purple sea urchin Strongylocentrotus purpuratus demonstrates a compartmentalization of gut bacterial microbiota, predictive functional attributes, and taxonomic co-occurrence. Microorganisms 2019, 7, 35. [Google Scholar] [CrossRef] [Green Version]
  42. Kozich, J.J.; Westcott, S.L.; Baxter, N.T.; Highlander, S.K.; Schloss, P.D. Development of a dual-index sequencing strategy and curation pipeline for analyzing amplicon sequence data on the MiSeq Illumina sequencing platform. Appl. Environ. Microbiol. 2013, 79, 5112–5120. [Google Scholar] [CrossRef] [Green Version]
  43. Kumar, R.; Eipers, P.; Little, R.B.; Crowley, M.; Crossman, D.K.; Lefkowitz, E.J.; Morrow, C.D. Getting started with microbiome analysis: Sample acquisition to bioinformatics. Curr. Protoc. Hum. Genet. 2014, 82, 18.8.1–18.8.29. [Google Scholar] [CrossRef] [PubMed] [Green Version]
  44. Cock, P.J.; Fields, C.J.; Goto, N.; Heuer, M.L.; Rice, P.M. The Sanger FASTQ file format for sequences with quality scores, and the Solexa/Illumina FASTQ variants. Nucleic Acids Res. 2010, 38, 1767–1771. [Google Scholar] [CrossRef] [Green Version]
  45. Hakim, J.A.; Morrow, C.D.; Watts, S.A.; Bej, A.K. High-throughput amplicon sequencing datasets of the metacommunity DNA of the gut microbiota of naturally occurring and laboratory aquaculture green sea urchins Lytechinus variegatus. Data Brief 2019, 26, 104405. [Google Scholar] [CrossRef]
  46. Bolyen, E.; Rideout, J.R.; Dillon, M.R.; Bokulich, N.A.; Abnet, C.C.; Al-Ghalith, G.A.; Alexander, H.; Alm, E.J.; Arumugam, M.; Asnicar, F. Reproducible, interactive, scalable and extensible microbiome data science using QIIME 2. Nat. Biotechnol. 2019, 37, 852–857. [Google Scholar] [CrossRef]
  47. Callahan, B.J.; McMurdie, P.J.; Rosen, M.J.; Han, A.W.; Johnson, A.J.A.; Holmes, S.P. DADA2: High-resolution sample inference from Illumina amplicon data. Nat. Methods 2016, 13, 581–583. [Google Scholar] [CrossRef] [Green Version]
  48. Katoh, K.; Standley, D.M. MAFFT multiple sequence alignment software version 7: Improvements in performance and usability. Mol. Biol. Evol. 2013, 30, 772–780. [Google Scholar] [CrossRef] [Green Version]
  49. Price, M.N.; Dehal, P.S.; Arkin, A.P. FastTree 2–approximately maximum-likelihood trees for large alignments. PLoS ONE 2010, 5, e9490. [Google Scholar] [CrossRef] [PubMed]
  50. Faith, D.P. Conservation evaluation and phylogenetic diversity. Biol. Conserv. 1992, 61, 1–10. [Google Scholar] [CrossRef]
  51. Simpson, E.H. Measurement of diversity. Nature 1949, 163, 688. [Google Scholar] [CrossRef]
  52. Shannon, C.E. A mathematical theory of communication. Bell Syst. Tech. J. 1948, 27, 379–423. [Google Scholar] [CrossRef] [Green Version]
  53. Lozupone, C.; Lladser, M.E.; Knights, D.; Stombaugh, J.; Knight, R. UniFrac: An effective distance metric for microbial community comparison. ISME J. 2011, 5, 169–172. [Google Scholar] [CrossRef] [Green Version]
  54. Bokulich, N.A.; Kaehler, B.D.; Rideout, J.R.; Dillon, M.; Bolyen, E.; Knight, R.; Huttley, G.A.; Caporaso, J.G. Optimizing taxonomic classification of marker-gene amplicon sequences with QIIME 2’s q2-feature-classifier plugin. Microbiome 2018, 6, 1–17. [Google Scholar] [CrossRef] [PubMed]
  55. Yilmaz, P.; Parfrey, L.W.; Yarza, P.; Gerken, J.; Pruesse, E.; Quast, C.; Schweer, T.; Peplies, J.; Ludwig, W.; Glöckner, F.O. The SILVA and “all-species living tree project (LTP)” taxonomic frameworks. Nucleic Acids Res. 2014, 42, D643–D648. [Google Scholar] [CrossRef] [PubMed] [Green Version]
  56. Anderson, M.J.; Walsh, D.C. PERMANOVA, ANOSIM, and the Mantel test in the face of heterogeneous dispersions: What null hypothesis are you testing? Ecol. Monogr. 2013, 83, 557–574. [Google Scholar] [CrossRef]
  57. Anderson, M.J. A new method for non-parametric multivariate analysis of variance. Austral Ecol. 2001, 26, 32–46. [Google Scholar]
  58. Oksanen, J.; Blanchet, F.G.; Kindt, R.; Legendre, P.; Minchin, P.; O’hara, R.; Simpson, G.; Solymos, P.; Stevens, M.; Wagner, H. Vegan: Community Ecology Package. R Package Version. 2.0-10. CRAN. 2013. Available online: https://www.researchgate.net/publication/258996451_Vegan_Community_Ecology_Package_R_Package_Version_20-10 (accessed on 14 July 2021).
  59. Kruskal, W.H.; Wallis, W.A. Use of ranks in one-criterion variance analysis. J. Am. Stat. Assoc. 1952, 47, 583–621. [Google Scholar] [CrossRef]
  60. Wilcoxon, F. Individual comparisons by ranking methods. In Breakthroughs in Statistics; Springer: Berlin/Heidelberg, Germany, 1992; pp. 196–202. [Google Scholar]
  61. Fisher, R.A. The use of multiple measurements in taxonomic problems. Ann. Eugen. 1936, 7, 179–188. [Google Scholar] [CrossRef]
  62. Segata, N.; Izard, J.; Waldron, L.; Gevers, D.; Miropolsky, L.; Garrett, W.S.; Huttenhower, C. Metagenomic biomarker discovery and explanation. Genome Biol. 2011, 12, 1–18. [Google Scholar] [CrossRef] [PubMed] [Green Version]
  63. Altschul, S.F.; Gish, W.; Miller, W.; Myers, E.W.; Lipman, D.J. Basic local alignment search tool. J. Mol. Biol. 1990, 215, 403–410. [Google Scholar] [CrossRef]
  64. Faust, K.; Raes, J. Microbial interactions: From networks to models. Nat. Rev. Microbiol. 2012, 10, 538–550. [Google Scholar] [CrossRef]
  65. Shannon, P.; Markiel, A.; Ozier, O.; Baliga, N.S.; Wang, J.T.; Ramage, D.; Amin, N.; Schwikowski, B.; Ideker, T. Cytoscape: A software environment for integrated models of biomolecular interaction networks. Genome Res. 2003, 13, 2498–2504. [Google Scholar] [CrossRef]
  66. Faust, K.; Sathirapongsasuti, J.F.; Izard, J.; Segata, N.; Gevers, D.; Raes, J.; Huttenhower, C. Microbial co-occurrence relationships in the human microbiome. PLoS Comput. Biol. 2012, 8, e1002606. [Google Scholar] [CrossRef]
  67. Faust, K.; Raes, J. CoNet app: Inference of biological association networks using Cytoscape. F1000Research 2016, 5, 1519. [Google Scholar] [CrossRef]
  68. Choma, M.; Bárta, J.; Šantrůčková, H.; Urich, T. Low abundance of Archaeorhizomycetes among fungi in soil metatranscriptomes. Sci. Rep. 2016, 6, 1–6. [Google Scholar] [CrossRef]
  69. Pearson, K. Notes on Regression and Inheritance in the Case of Two Parents. Proc. R. Soc. Lond. 1895, 58, 240–242. [Google Scholar]
  70. Spearman, C. The Proof and Measurement of Association Between Two Things. In Studies in Individual Differences: The Search for Intelligence; Jenkins, J.J., Paterson, D.G., Eds.; Appleton-Century-Crofts: Norwalk, CT, USA, 1961; pp. 45–58. [Google Scholar] [CrossRef]
  71. Bray, J.R.; Curtis, J.T. An ordination of the upland forest communities of southern Wisconsin. Ecol. Monogr. 1957, 27, 325–349. [Google Scholar] [CrossRef]
  72. Kullback, S.; Leibler, R.A. On information and sufficiency. Ann. Math. Stat. 1951, 22, 79–86. [Google Scholar] [CrossRef]
  73. Cover, T.M.; Thomas, J.A. Information theory and statistics. Elem. Inf. Theory 1991, 1, 279–335. [Google Scholar]
  74. Wiese, R.; Eiglsperger, M.; Kaufmann, M. yFiles—Visualization and automatic layout of graphs. In Graph Drawing Software; Springer: Berlin/Heidelberg, Germany, 2004; pp. 173–191. [Google Scholar]
  75. Assenov, Y.; Ramírez, F.; Schelhorn, S.-E.; Lengauer, T.; Albrecht, M. Computing topological parameters of biological networks. Bioinformatics 2008, 24, 282–284. [Google Scholar] [CrossRef] [PubMed] [Green Version]
  76. Berry, D.; Widder, S. Deciphering microbial interactions and detecting keystone species with co-occurrence networks. Front. Microbiol. 2014, 5, 219. [Google Scholar] [CrossRef] [Green Version]
  77. Ma, B.; Wang, H.; Dsouza, M.; Lou, J.; He, Y.; Dai, Z.; Brookes, P.C.; Xu, J.; Gilbert, J.A. Geographic patterns of co-occurrence network topological features for soil microbiota at continental scale in eastern China. ISME J. 2016, 10, 1891–1901. [Google Scholar] [CrossRef] [PubMed]
  78. Wang, Y.; Sheng, H.-F.; He, Y.; Wu, J.-Y.; Jiang, Y.-X.; Tam, N.F.-Y.; Zhou, H.-W. Comparison of the levels of bacterial diversity in freshwater, intertidal wetland, and marine sediments by using millions of illumina tags. Appl. Environ. Microbiol. 2012, 78, 8264–8271. [Google Scholar] [CrossRef] [Green Version]
  79. Langille, M.G.; Zaneveld, J.; Caporaso, J.G.; McDonald, D.; Knights, D.; Reyes, J.A.; Clemente, J.C.; Burkepile, D.E.; Thurber, R.L.V.; Knight, R. Predictive functional profiling of microbial communities using 16S rRNA marker gene sequences. Nat. Biotechnol. 2013, 31, 814–821. [Google Scholar] [CrossRef] [PubMed]
  80. McNally, K.; Hogg, A.; Loizou, G. A computational workflow for probabilistic quantitative in vitro to in vivo extrapolation. Front. Pharmacol. 2018, 9, 508. [Google Scholar] [CrossRef] [Green Version]
  81. Zidorn, C. Secondary metabolites of seagrasses (Alismatales and Potamogetonales; Alismatidae): Chemical diversity, bioactivity, and ecological function. Phytochemistry 2016, 124, 5–28. [Google Scholar] [CrossRef]
  82. Windyaswari, A.; Purba, J.; Nurrahmah, S.; Ayu, I.; Imran, Z.; Amin, A.; Kurniawan, F.; Pratiwi, N.; Iswantari, A. Phytochemical profile of sea grass extract (Enhalus acoroides): A new marine source from Ekas Bay, East Lombok. In Proceedings of the IOP Conference Series: Earth and Environmental Science; 2019; Volume 278, p. 012081. [Google Scholar] [CrossRef]
  83. Prodan, A.; Tremaroli, V.; Brolin, H.; Zwinderman, A.H.; Nieuwdorp, M.; Levin, E. Comparing bioinformatic pipelines for microbial 16S rRNA amplicon sequencing. PLoS ONE 2020, 15, e0227434. [Google Scholar] [CrossRef] [PubMed] [Green Version]
  84. Straub, D.; Blackwell, N.; Langarica-Fuentes, A.; Peltzer, A.; Nahnsen, S.; Kleindienst, S. Interpretations of environmental microbial community studies are biased by the selected 16S rRNA (Gene) amplicon sequencing pipeline. Front. Microbiol. 2020, 11, 2652. [Google Scholar] [CrossRef] [PubMed]
  85. Nelson, L.; Blair, B.; Murdock, C.; Meade, M.; Watts, S.; Lawrence, A.L. Molecular Analysis of gut microflora in captive-raised sea urchins (Lytechinus variegatus). J. World Aquac. Soc. 2010, 41, 807–815. [Google Scholar] [CrossRef]
  86. Nakagawa, S.; Saito, H.; Tame, A.; Hirai, M.; Yamaguchi, H.; Sunata, T.; Aida, M.; Muto, H.; Sawayama, S.; Takaki, Y. Microbiota in the coelomic fluid of two common coastal starfish species and characterization of an abundant Helicobacter-related taxon. Sci. Rep. 2017, 7, 1–10. [Google Scholar] [CrossRef] [Green Version]
  87. Enomoto, M.; Nakagawa, S.; Sawabe, T. Microbial communities associated with holothurians: Presence of unique bacteria in the coelomic fluid. Microbes Environ. 2009, 27, 300–305. [Google Scholar] [CrossRef] [Green Version]
  88. Medina, D.A.; Suárez, R.; Godoy, M. Microbial Diversity of the Red Sea Urchin Loxechinus albus during Controlled Farming in Puerto Montt, Chile, Using 16S rRNA Gene Amplicon Sequencing. Microbiol. Resour. Announc. 2019, 8. [Google Scholar] [CrossRef] [PubMed] [Green Version]
  89. Schwob, G.; Cabrol, L.; Poulin, E.; Orlando, J. Characterization of the gut microbiota of the Antarctic heart urchin (Spatangoida) Abatus agassizii. Front. Microbiol. 2020, 11, 308. [Google Scholar] [CrossRef] [Green Version]
  90. Sawabe, T.; Oda, Y.; Shiomi, Y.; Ezura, Y. Alginate degradation by bacteria isolated from the gut of sea urchins and abalones. Microb. Ecol. 1995, 30, 193–202. [Google Scholar] [CrossRef]
  91. Unkles, S. Bacterial flora of the sea urchin Echinus esculentus. Appl. Environ. Microbiol. 1977, 34, 347–350. [Google Scholar] [CrossRef] [PubMed] [Green Version]
  92. Kim, D.; Baik, K.S.; Hwang, Y.S.; Choi, J.-S.; Kwon, J.; Seong, C.N. Vibriohemicentroti sp. nov., an alginate lyase-producing bacterium, isolated from the gut microflora of sea urchin (Hemicentrotus pulcherrimus). Int. J. Syst. Evol. Microbiol. 2013, 63, 3697–3703. [Google Scholar] [CrossRef] [PubMed] [Green Version]
  93. Meziti, A.; Kormas, K.A.; Pancucci-Papadopoulou, M.-A.; Thessalou-Legaki, M. Bacterial phylotypes associated with the digestive tract of the sea urchin Paracentrotus lividus and the ascidian Microcosmus sp. Russ. J. Mar. Biol. 2007, 33, 84–91. [Google Scholar] [CrossRef]
  94. Farmer, J., III; Hickman-Brenner, F. The Genera Vibrio and Photobacterium; The Prokaryotes; Dworkin, M., Falkow, S., Rosenberg, E., Schleifer, K.H., Stackenbrandt, E., Eds.; Springer: New York, NY, USA, 2006. [Google Scholar]
  95. Gomez-Gil, B.; Roque, A.; Rotllant, G.; Peinado, L.; Romalde, J.L.; Doce, A.; Cabanillas-Beltran, H.; Chimetto, L.A.; Thompson, F.L. Photobacterium swingsii sp. nov., isolated from marine organisms. Int. J. Syst. Evol. Microbiol. 2011, 61, 315–319. [Google Scholar] [CrossRef]
  96. Seo, H.J.; Bae, S.S.; Lee, J.-H.; Kim, S.-J. Photobacterium frigidiphilum sp. nov., a psychrophilic, lipolytic bacterium isolated from deep-sea sediments of Edison Seamount. Int. J. Syst. Evol. Microbiol. 2005, 55, 1661–1666. [Google Scholar] [CrossRef] [Green Version]
  97. Yoon, J.-H.; Lee, J.-K.; Kim, Y.-O.; Oh, T.-K. Photobacterium lipolyticum sp. nov., a bacterium with lipolytic activity isolated from the Yellow Sea in Korea. Int. J. Syst. Evol. Microbiol. 2005, 55, 335–339. [Google Scholar] [CrossRef] [Green Version]
  98. De Vadder, F.; Kovatcheva-Datchary, P.; Zitoun, C.; Duchampt, A.; Bäckhed, F.; Mithieux, G. Microbiota-produced succinate improves glucose homeostasis via intestinal gluconeogenesis. Cell Metab. 2016, 24, 151–157. [Google Scholar] [CrossRef] [Green Version]
  99. Reichardt, N.; Duncan, S.H.; Young, P.; Belenguer, A.; Leitch, C.M.; Scott, K.P.; Flint, H.J.; Louis, P. Phylogenetic distribution of three pathways for propionate production within the human gut microbiota. ISME J. 2014, 8, 1323–1335. [Google Scholar] [CrossRef] [PubMed] [Green Version]
  100. Schink, B.; Pfennig, N. Propionigenium modestum gen. nov. sp. nov. a new strictly anaerobic, nonsporing bacterium growing on succinate. Arch. Microbiol. 1982, 133, 209–216. [Google Scholar] [CrossRef] [Green Version]
  101. Apprill, A. Marine animal microbiomes: Toward understanding host–microbiome interactions in a changing ocean. Front. Mar. Sci. 2017, 4, 222. [Google Scholar] [CrossRef] [Green Version]
  102. Costello, E.K.; Stagaman, K.; Dethlefsen, L.; Bohannan, B.J.; Relman, D.A. The application of ecological theory toward an understanding of the human microbiome. Science 2012, 336, 1255–1262. [Google Scholar] [CrossRef] [PubMed] [Green Version]
  103. Martínez, I.; Stegen, J.C.; Maldonado-Gómez, M.X.; Eren, A.M.; Siba, P.M.; Greenhill, A.R.; Walter, J. The gut microbiota of rural papua new guineans: Composition, diversity patterns, and ecological processes. Cell Rep. 2015, 11, 527–538. [Google Scholar] [CrossRef] [PubMed] [Green Version]
  104. Vellend, M. Conceptual synthesis in community ecology. Q. Rev. Biol. 2010, 85, 183–206. [Google Scholar] [CrossRef] [Green Version]
  105. David, L.A.; Maurice, C.F.; Carmody, R.N.; Gootenberg, D.B.; Button, J.E.; Wolfe, B.E.; Ling, A.V.; Devlin, A.S.; Varma, Y.; Fischbach, M.A. Diet rapidly and reproducibly alters the human gut microbiome. Nature 2014, 505, 559–563. [Google Scholar] [CrossRef] [Green Version]
  106. Reese, A.T.; Dunn, R.R. Drivers of microbiome biodiversity: A review of general rules, feces, and ignorance. MBio 2018, 9. [Google Scholar] [CrossRef] [Green Version]
  107. Lozupone, C.A.; Stombaugh, J.I.; Gordon, J.I.; Jansson, J.K.; Knight, R. Diversity, stability and resilience of the human gut microbiota. Nature 2012, 489, 220–230. [Google Scholar] [CrossRef] [Green Version]
  108. Gall, C.A.; Scoles, G.A.; Magori, K.; Mason, K.L.; Brayton, K.A. Laboratory colonization stabilizes the naturally dynamic microbiome composition of field collected Dermacentor andersoni ticks. Microbiome 2017, 5, 1–10. [Google Scholar] [CrossRef] [Green Version]
  109. Ng, S.H.; Stat, M.; Bunce, M.; Simmons, L.W. The influence of diet and environment on the gut microbial community of field crickets. Ecol. Evol. 2018, 8, 4704–4720. [Google Scholar] [CrossRef]
  110. Tsukayama, P.; Boolchandani, M.; Patel, S.; Pehrsson, E.C.; Gibson, M.K.; Chiou, K.L.; Jolly, C.J.; Rogers, J.; Phillips-Conroy, J.E.; Dantas, G. Characterization of wild and captive baboon gut microbiota and their antibiotic resistomes. Msystems 2018, 3. [Google Scholar] [CrossRef] [PubMed] [Green Version]
  111. Fraune, S.; Bosch, T.C. Long-term maintenance of species-specific bacterial microbiota in the basal metazoan Hydra. Proc. Natl. Acad. Sci. USA 2007, 104, 13146–13151. [Google Scholar] [CrossRef] [PubMed] [Green Version]
  112. Cox, C.R.; Gilmore, M.S. Native microbial colonization of Drosophila melanogaster and its use as a model of Enterococcus faecalis pathogenesis. Infect. Immun. 2007, 75, 1565–1576. [Google Scholar] [CrossRef] [Green Version]
  113. Hird, S.M. Evolutionary biology needs wild microbiomes. Front. Microbiol. 2017, 8, 725. [Google Scholar] [CrossRef]
  114. Scupham, A.J.; Patton, T.G.; Bent, E.; Bayles, D.O. Comparison of the cecal microbiota of domestic and wild turkeys. Microb. Ecol. 2008, 56, 322–331. [Google Scholar] [CrossRef] [PubMed]
  115. Xenoulis, P.G.; Gray, P.L.; Brightsmith, D.; Palculict, B.; Hoppes, S.; Steiner, J.M.; Tizard, I.; Suchodolski, J.S. Molecular characterization of the cloacal microbiota of wild and captive parrots. Vet. Microbiol. 2010, 146, 320–325. [Google Scholar] [CrossRef]
  116. Schäfer, G. Membrane-Associated Energy Transduction in Bacteria and Archaea; Encyclopedia of Biological Chemistry, 2nd ed.; Elsevier: Amsterdam, The Nethrlands, 2013; pp. 28–35. [Google Scholar]
  117. Roalkvam, I.; Drønen, K.; Stokke, R.; Daae, F.L.; Dahle, H.; Steen, I.H. Physiological and genomic characterization of Arcobacter anaerophilus IR-1 reveals new metabolic features in Epsilonproteobacteria. Front. Microbiol. 2015, 6, 987. [Google Scholar] [CrossRef] [PubMed] [Green Version]
  118. Spring, S.; Lünsdorf, H.; Fuchs, B.M.; Tindall, B.J. The photosynthetic apparatus and its regulation in the aerobic gammaproteobacterium Congregibacter litoralis gen. nov., sp. nov. PLoS ONE 2009, 4, e4866. [Google Scholar] [CrossRef] [Green Version]
  119. Morrow, K.M.; Tedford, A.R.; Pankey, M.S.; Lesser, M.P. A member of the Roseobacter clade, Octadecabacter sp., is the dominant symbiont in the brittle star Amphipholis squamata. FEMS Microbiol. Ecol. 2018, 94, fiy030. [Google Scholar] [CrossRef] [Green Version]
  120. Vollmers, J.; Voget, S.; Dietrich, S.; Gollnow, K.; Smits, M.; Meyer, K.; Brinkhoff, T.; Simon, M.; Daniel, R. Poles apart: Arctic and Antarctic Octadecabacter strains share high genome plasticity and a new type of xanthorhodopsin. PLoS ONE 2013, 8, e63422. [Google Scholar] [CrossRef] [Green Version]
  121. Sauchyn, L.K.; Lauzon-Guay, J.-S.; Scheibling, R.E. Sea urchin fecal production and accumulation in a rocky subtidal ecosystem. Aquat. Biol. 2011, 13, 215–223. [Google Scholar] [CrossRef]
  122. Sauchyn, L.K.; Scheibling, R.E. Fecal production by sea urchins in native and invaded algal beds. Mar. Ecol. Prog. Ser. 2009, 396, 35–48. [Google Scholar] [CrossRef] [Green Version]
  123. Sauchyn, L.K.; Scheibling, R.E. Degradation of sea urchin feces in a rocky subtidal ecosystem: Implications for nutrient cycling and energy flow. Aquat. Biol. 2009, 6, 99–108. [Google Scholar] [CrossRef] [Green Version]
  124. Becker, P.T.; Samadi, S.; Zbinden, M.; Hoyoux, C.; Compère, P.; De Ridder, C. First insights into the gut microflora associated with an echinoid from wood falls environments. Cah. Biol. Mar. 2009, 50, 343. [Google Scholar]
  125. Tanrattanapitak, N.; Pairohakul, S. Bacterial Community in Gut Contents of the Sea Urchin Diadema setosum (Leske, 1778) and the Ambient Sediments from Sichang Island using Metagenomics Approaches. NU Int. J. Sci. 2018, 15, 117–125. [Google Scholar]
  126. Wirsen, C.O.; Sievert, S.M.; Cavanaugh, C.M.; Molyneaux, S.J.; Ahmad, A.; Taylor, L.; DeLong, E.; Taylor, C.D. Characterization of an autotrophic sulfide-oxidizing marine Arcobacter sp. that produces filamentous sulfur. Appl. Environ. Microbiol. 2002, 68, 316–325. [Google Scholar] [CrossRef] [Green Version]
  127. Pati, A.; Gronow, S.; Lapidus, A.; Copeland, A.; Del Rio, T.G.; Nolan, M.; Lucas, S.; Tice, H.; Cheng, J.-F.; Han, C. Complete genome sequence of Arcobacter nitrofigilis type strain (CI T). Stand. Genom. Sci. 2010, 2, 300–308. [Google Scholar] [CrossRef] [Green Version]
  128. Yang, Q.; Defoirdt, T. Quorum sensing positively regulates flagellar motility in pathogenic V ibrio harveyi. Environ. Microbiol. 2015, 17, 960–968. [Google Scholar] [CrossRef]
  129. Huttenhower, C.; Gevers, D.; Knight, R.; Abubucker, S.; Badger, J.H.; Chinwalla, A.T.; Creasy, H.H.; Earl, A.M.; FitzGerald, M.G.; Fulton, R.S. Structure, function and diversity of the healthy human microbiome. Nature 2012, 486, 207. [Google Scholar]
  130. Bell, A.; Juge, N. Mucosal glycan degradation of the host by the gut microbiota. Glycobiology 2020. [Google Scholar] [CrossRef]
  131. Martens, E.C.; Chiang, H.C.; Gordon, J.I. Mucosal glycan foraging enhances fitness and transmission of a saccharolytic human gut bacterial symbiont. Cell Host Microbe 2008, 4, 447–457. [Google Scholar] [CrossRef] [PubMed] [Green Version]
Figure 1. Relative abundance stacked column bar graph showing top 100 taxa at the most resolved level across all samples (n = 3 for each sample) in the gut ecosystem of the green sea urchin Lytechinus variegatus. Taxonomic identities were based on their assignment through the (SILVA v138) database as determined by the Quantitative Insights into Microbial Ecology (QIIME_2, v2020.8) and graphed using R (ggplot package). Sample designations are as follows: EnvGutTissue = naturally occurring L. variegatus gut tissues; LabGutTissue = laboratory-maintained L. variegatus gut tissues; EnvGutDigesta = naturally occurring L. variegatus gut digesta; LabGutDigesta = laboratory-maintained L. variegatus gut digesta. The relative abundance plot was created using Microsoft Excel Software (Seattle, WA, USA). Some of the major taxa are indicated within the graph. Due to the insufficient space within some of the stacked column bars, the common taxa are indicated by the connecting lines. A list of taxa and their abundances is presented in Supplementary Table S1.
Applmicrobiol 01 00016 g001
Figure 2. Beta diversity analysis of gut microbiota of Lytechinus variegatus was observed across all similarity metrics determined for the ASV table. (a) A Bray-Curtis PCOA plot to display sample clustering patterns based on observed ASVs. (b) Dendrogram analysis was also performed, and the cluster pattern was based on the average of the Bray-Curtis distance matrix data generated via QIIME2 (v2020.8), and (a) plotted with R (ggplot package) and (b) python3 (package matplotlib and scipy). Bray-Curtis distance matrix data generated via qiime_2(v2020.8), and the q2-qiime diversity beta-group-significance. The group assignments are indicated as follows: ENV-Tissue (Green Square; n = 3) = naturally occurring L. variegatus gut tissues; ENV-Digesta (Red Circle; n = 3) = naturally occurring L. variegatus gut digesta; LAB-Digesta (Blue Triangle; n = 3) = laboratory-maintained L. variegatus gut digesta. LAB-Tissue (Open Triangle; n = 3) = laboratory-maintained L. variegatus gut tissues.
Applmicrobiol 01 00016 g002
Figure 3. (a) Linear Discriminant Analysis (LDA) Effect Size (LEfSe) analysis was performed on the taxonomic data of the Lytechinus variegatus samples at the highest resolution. The effect size was visualized as a bar graph of two classes, one class representing the gut tissue samples (n = 6; green bars) that comprised the subclass laboratory-maintained sea urchin gut tissue (n = 3), and naturally occurring sea urchin gut tissue (n = 3); and the other class representing the gut digesta samples (n = 6; red bars) that comprised the subclass laboratory-maintained sea urchin gut digesta (n = 3) and naturally occurring sea urchin gut digesta (n = 3). The values shown on the x-axis correspond to the log(10) effect size values at an inclusion threshold of ±3.6. (b) Heatmap of the 17 differentially abundant taxa revealed by LEfSe between sea urchin gut digesta and gut tissues. Green bar = gut tissues (n = 6); red bar = gut digesta (n = 6). The relative abundances were converted to Z-scores by taxa, shown in blue color. Relative abundances are also indicated through black track lines. Dendrograms represent a clustering of taxa (columns) and samples (rows) based on hierarchical clustering with Euclidean distance metric and average linkage. (* = Taxonomic classification beyond the level could not be identified in the reference database).
Applmicrobiol 01 00016 g003
Figure 4. (a) Co-occurrence Network interference (CoNet v1.1.1) was used to determine significant co-occurrence patterns between the microbiota of naturally occurring (ENV) Lytechinus variegatus gut digesta, as analyzed through Cytoscape (v3.8.0). The gut digesta taxonomic entries with a cumulative group sum of 200 and at least 2/3 of samples containing non-zero values were kept with a 10-8 pseudo-count to determine the significant co-occurrences between taxa. The 200 highest (most positive) and lowest (most negative) edges were chosen and combined with the union approach using the mean value. Multi-edge scores were then shuffled row-wise at 100 permutations (for the randomization). The network analysis displays edges based on the q-value, which were merged via the brown method at p < 0.05 and are shown as red (co-exclusion) and green (co-presence). The radial layout algorithm was used from the yFiles plugin (v1.0), and NetworkAnalyzer (v2.7) was used to determine the topological parameters (undirected approach). The node size was scaled according to their group abundance size, and edges were scaled via the q-value. (b) A scatter plot analysis was conducted based on the topological metrics selected by NetworkAnalyzer (v2.7) to reveal patterns of key (keystone) species between the naturally occurring L. variegatus gut digesta taxonomy based on the closeness and betweenness centrality scores, and the degree (the number of co-exclusion and co-presence edges). Microsoft Excel software (Seattle, WA, USA) was used to determine the linear regression. The linear regression between closeness and betweenness centrality was displayed as logarithmic (R2 value = 0.2079). The top 5 taxonomic entries are shown and ranked via their closeness centrality.
Applmicrobiol 01 00016 g004
Figure 5. (a) Co-occurrence Network interference (CoNet v1.1.1) was used to determine significant co-occurrence patterns between the microbiota of laboratory maintained (LAB) Lytechinus variegatus gut digesta, as analyzed through Cytoscape (v3.8.0). The gut digesta taxonomic entries with a cumulative group sum of 200 and at least 2/3 of samples containing non-zero values were kept with a 10-8 pseudo-count to determine the significant co-occurrences between taxa. The 200 highest (most positive) and lowest (most negative) edges were chosen and combined with the union approach using the mean value. Multi-edge scores were then shuffled row-wise at 100 permutations (for the randomization). The network analysis displays edges based on the q-value, which were merged via the brown method at p < 0.05 and are shown as red (co-exclusion) and green (co-presence). The radial layout algorithm was used from the yFiles plugin (v1.0), and NetworkAnalyzer (v2.7) determined the topological parameters (undirected approach). The node size was scaled according to the group abundance size, and edges were scaled via the q-value. (b) A scatter plot analysis was conducted based on the topological metrics selected by NetworkAnalyzer (v2.7), to reveal patterns of key species between the LAB L. variegatus gut digesta based on closeness and betweenness centrality scores, and with the degree (the number of co-exclusion and co-presence edges). Microsoft Excel software (Seattle, WA, USA) was used to determine the linear regression. The linear regression between closeness and betweenness centrality was displayed as logarithmic (R2 value = 0.4528). The top 5 taxonomic entries are shown and ranked via their closeness centrality.
Applmicrobiol 01 00016 g005aApplmicrobiol 01 00016 g005b
Figure 6. The distribution of Amplicon Sequence Variants (ASV) read counts with different Nearest Sequenced Taxon Index (NSTI) values of Lytechinus variegatus gut microbiota using a method described elsewhere [79]. The x-axis indicates the sample category, and the y-axis indicates the cumulative percentage of ASV read counts. The color key indicates the NSTI value for ASVs. The mean NSTI values for ENV gut digesta, ENV gut tissue, LAB gut digesta, and LAB gut tissue were 0.29 ± 0.04 (mean ± SD), 0.20 ± 0.03, 0.08 ± 0.02, and 0.14 ± 0.004, respectively. NSTI < 0.15 indicates a moderate to high quality of metagenomic content prediction.
Applmicrobiol 01 00016 g006
Figure 7. (a) Linear discriminant analysis (LDA) effect size (LEfSe) predicted functional profiles corresponding to the microbial communities of the Lytechinus variegatus gut tissues (n = 6) (green bar) and gut digesta (n = 6) (red bar). Linear discriminant analysis was used to determine the effect size with an inclusion threshold of ±3.6 for logarithmic LDA scores. The analysis was performed using the Level 2 KEGG BRITE hierarchical functional categories using PICRUSt2 (v2.3.0-b) script pathway_pipeline.py with manually curated mapfile from https://www.genome.jp/kegg-bin/get_htext?ko00001.keg (accessed on 6 September 2020). (b) Linear discriminant analysis (LDA) effect size (LEfSe) predicted functional profiles corresponding to the microbial communities of the Lytechinus variegatus gut tissues (n = 6) (green bar) and gut digesta (n = 6) (red bar). Linear discriminant analysis was used to determine the effect size with an inclusion threshold of ±3.6 for logarithmic LDA scores. The analysis was performed at the Level 3 KEGG BRITE hierarchical functional categories using PICRUSt2 (v2.3.0-b) script pathway_pipeline.py with manually curated mapfile from https://www.genome.jp/kegg-bin/get_htext?ko00001.keg (accessed on 6 September 2020).
Applmicrobiol 01 00016 g007
Figure 8. (a) Horizontal barplot of predicted KEGG orthology (KO) metabolic functions of Lytechinus variegatus gut microbiota determined through Phylogenetic Investigation of Communities by Reconstruction of Unobserved States (PICRUSt2 v2.3.0-b) script pathway_pipeline.py. Light blue = LAB gut tissue (n = 3), light red = ENV gut tissue (n = 3), Blue = LAB gut digesta (n = 3) and Red = ENV gut digesta (n = 3). The ASV table was generated from QIIME2 (v2020.8). The analysis and visualization were performed via BURRITO (a visualization tool for exploratory data analysis of metagenomic data). The horizontal barplot contains KEGG BRITE categorical levels cellular processes, environmental information processing, and genetic information processing. The KEGG BRITE levels SuperPathway and SubPathway are displayed on the horizontal barplot. The x-axis displays the functional abundance of each sample, and the y-axis displays the name of the pathway. (b) Horizontal barplot of predicted KEGG orthology (KO) metabolic functions of Lytechinus variegatus gut microbiota determined through Phylogenetic Investigation of Communities by Reconstruction of Unobserved States (PICRUSt2 v2.3.0-b) script pathway_pipeline.py. Light blue = LAB gut tissue (n = 3), light red = ENV gut tissue (n = 3), blue = LAB gut digesta (n = 3) and red = ENV gut digesta (n = 3). The ASV table was generated using QIIME2 (v2020.8). The analysis and visualization were performed via BURRITO (a visualization tool for exploratory data analysis of metagenomic data). The horizontal barplot contains the KEGG BRITE categorical level metabolism. The KEGG BRITE levels SuperPathway and SubPathway are displayed on the horizontal barplot. The x-axis displays the functional abundance of each sample, and the y-axis displays the name of the pathway.
Applmicrobiol 01 00016 g008aApplmicrobiol 01 00016 g008b
Table 1. Alpha diversity analysis based on observed ASVs, Shannon’s index, and Simpson’s index of each Lytechinus variegatus gut microbiota sample used in this study. The group assignments are indicated as ENV = naturally occurring L. variegatus, and LAB = laboratory-maintained L. variegatus.
SampleObserved ASVsShannon DiversitySimpson Diversity
ENV.Gut.Digesta.12505.4877679540.944642074
ENV.Gut.Digesta.21524.8418859210.930314741
ENV.Gut.Digesta.32956.0618626780.962199539
ENV.Gut.Tissue.1150.5713632070.160769415
ENV.Gut.Tissue.2140.1891634680.047561491
ENV.Gut.Tissue.3110.3029960140.082618331
LAB.Gut.Digesta.12073.9677392120.859951252
LAB.Gut.Digesta.21613.7287898030.866174131
LAB.Gut.Digesta.3543.1094025590.841666322
LAB.Gut.Tissue.1290.0576241240.012002203
LAB.Gut.Tissue.2740.3954916960.069834258
LAB.Gut.Tissue.3280.0767861170.012002203
Publisher’s Note: MDPI stays neutral with regard to jurisdictional claims in published maps and institutional affiliations.

