
Investigation of Binary Liquids in Unstable States—An Experimental Approach


Institute of Thermal Physics Ural Branch of Russian Academy of Sciences, 620016 Ekaterinburg, Russia
*
Author to whom correspondence should be addressed.
Liquids 2021, 1(1), 36-46; https://0-doi-org.brum.beds.ac.uk/10.3390/liquids1010003
Submission received: 29 March 2021
/
Revised: 4 May 2021
/
Accepted: 24 May 2021
/
Published: 28 May 2021
(This article belongs to the Section Physics of Liquids)
Abstract
:In this article, we present a methodology for conducting measurements based on pulse heating of a wire probe in partially soluble binary liquids. These liquids, which can be rapidly transferred to the region of unstable states above the diffusional spinodal, are novel research objects for the thermophysics of extreme states. Using the example of aqueous solutions of polypropylene glycol and glycol monobutyl ether having a lower critical solution temperature, the key hypothesis of the study on the general measurability of the properties of unstable solutions has been confirmed. The characteristic heating times from 1 to 15 milliseconds corresponded to the thickness of the heated layer comprising a few micrometers. The pressure was varied from units of MPa to 100 MPa. The conditions for the transition from measurements on pure components to those on solutions are formulated. The characteristic thermal patterns of the decay of unstable states depending on pressure and heating rate are revealed. The general possibility of using partially soluble binary liquids as a promising coolant in processes involving powerful local heat release is demonstrated.
1. Introduction
Most fluid technologies are based on mixtures. Scientifically, the phase diagrams of solutions are much more diverse than those of pure substances [1]. In this regard, research into the properties of solutions containing components with various degrees of thermo-dynamic compatibility is of particular relevance. In general, the degree of compatibility depends on both temperature and pressure [2,3]. The properties of solutions are conventionally studied in absolutely stable states. For these states, numerous experimental methods and techniques have been developed for collecting primary data and converting them into the actual values of properties, in particular, thermophysical properties [4,5]. The THW technique is a good example of a widely used technique for determining the thermal conductivity of solutions with the characteristic heating time of 1 s [6,7]. This technique requires the constancy of the heat release power in a wire probe, which serves as a basis for the correct recalculation of the primary values into the values of thermal conductivity [8].
Methods for studying the properties of solutions in the region of both not fully stable [9] states, superheated with respect to the liquid–vapor or liquid–liquid (in the case of lower critical solution temperature, LCST) equilibrium line, and unstable states, superheated with respect to the diffusional (or liquid–liquid) spinodal, have received little attention so far. This circumstance is obviously associated with experimental difficulties [9] arising due to limitations imposed on the duration of measurements and the volume of super-heated samples. At the same time, such states can and do arise during the intensification of the heat transfer process and miniaturization of the device dimensions. The miniaturization is a modern technological trend [10,11,12].
2. Background
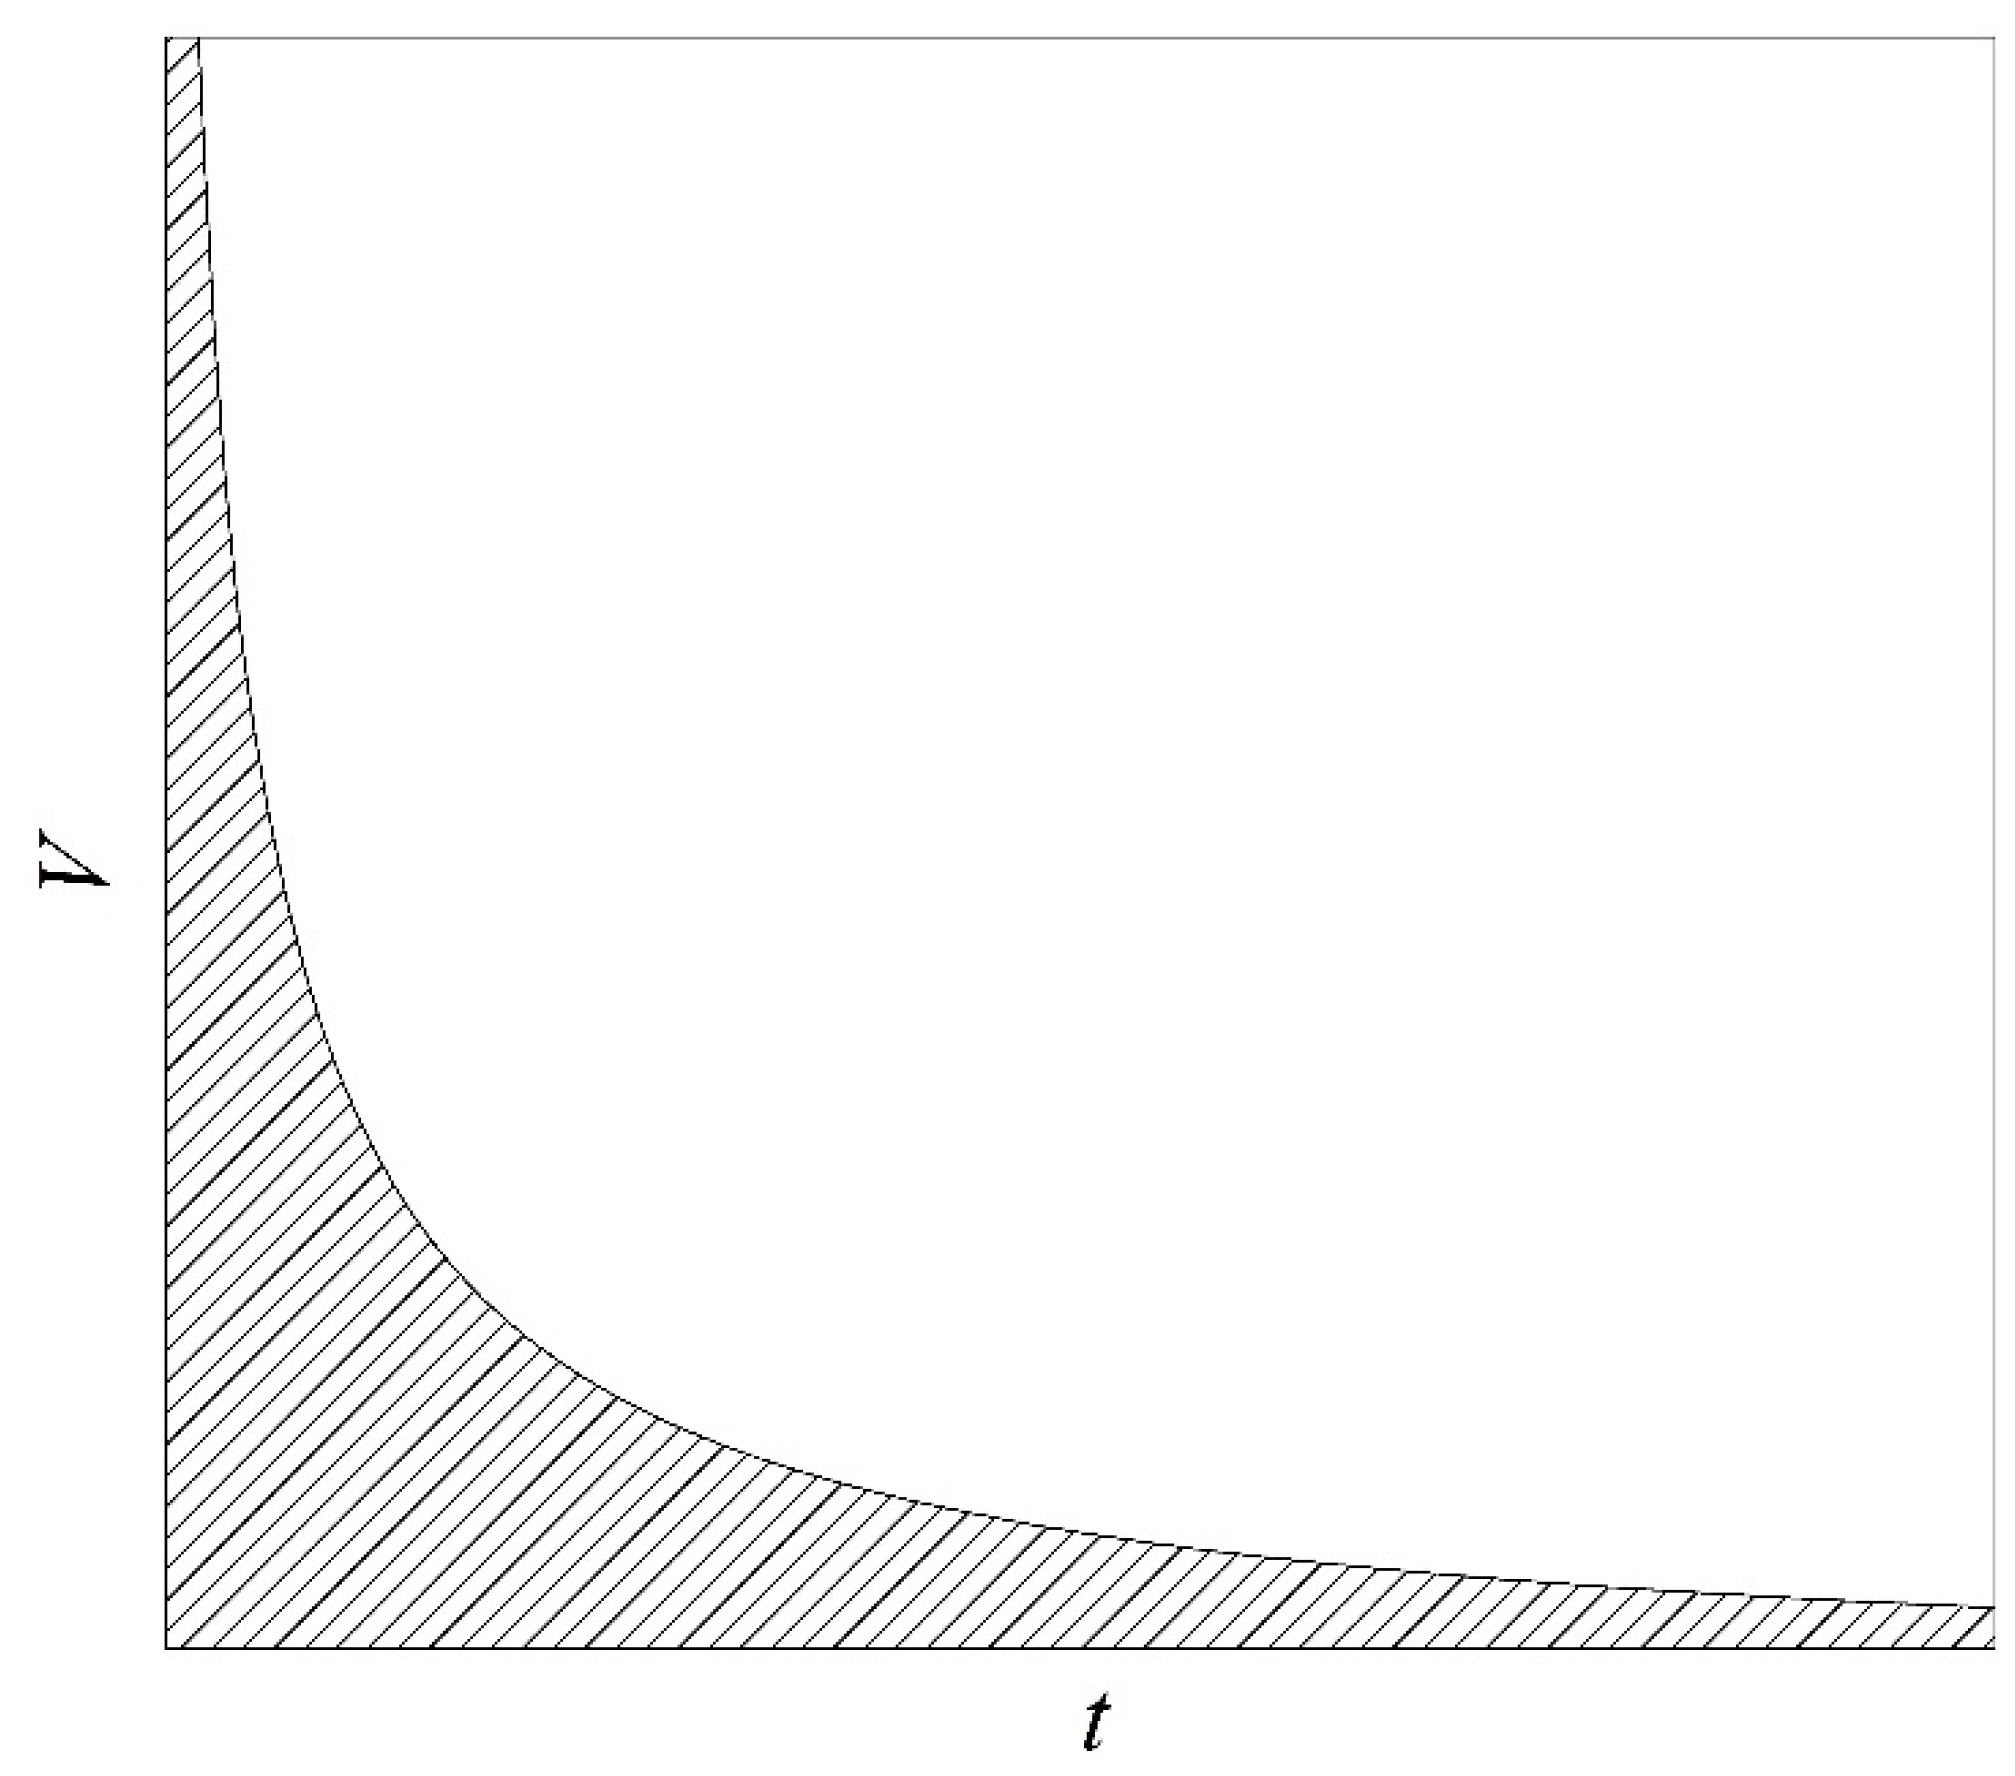
The phenomenon of superheating liquids is attracting research attention due to the substantial length of the region of superheated states in the phase diagram of substance. For a number of reasons [13], a considerably extended two-phase equilibrium region of a mixture with respect to the pure liquid is observed. This characteristic feature has found application in high-performance technical applications [4]. At the same time, strict limitations on the magnitude of the product V·t are imposed in the corresponding experimental technique [13]; see Figure 1. Here, V is the volume of a superheated substance; t is the duration of observing the superheated state, including the duration of the emergence of such a state and the actual time of measurements. In turn, this circumstance imposes stringent requirements on the speed and size of sensors developed for conducting measurements in superheated (as well as stretched [14]) liquids.
For the study of superheated states of substances, taking into account the above-mentioned limitations, methods involving pulse heating of a thin wire probe (resistance thermometer) and pressure drop in a temperature-controlled volume have been developed, see Ref. [13] and the bibliography therein. Within the framework of this approach, two techniques have been developed for collecting the primary data in experiments on not fully stable solutions, namely the controlled heating of a wire probe [15] and the application of a micro-optical probe as a waveguide densitometer–reflectometer [16]. The choice of the probe type and the specific measurement technique is carried out in accordance with the problem statement. In this study, the wire probe technique is applied.
Figure 1.
Explanation of the choice of parameters in experiments on the study of the attainable superheating of liquids [17]. The volume of superheated substance V versus the duration of observation of the superheated state t. The area of acceptable parameter values is shaded.
Figure 1.
Explanation of the choice of parameters in experiments on the study of the attainable superheating of liquids [17]. The volume of superheated substance V versus the duration of observation of the superheated state t. The area of acceptable parameter values is shaded.
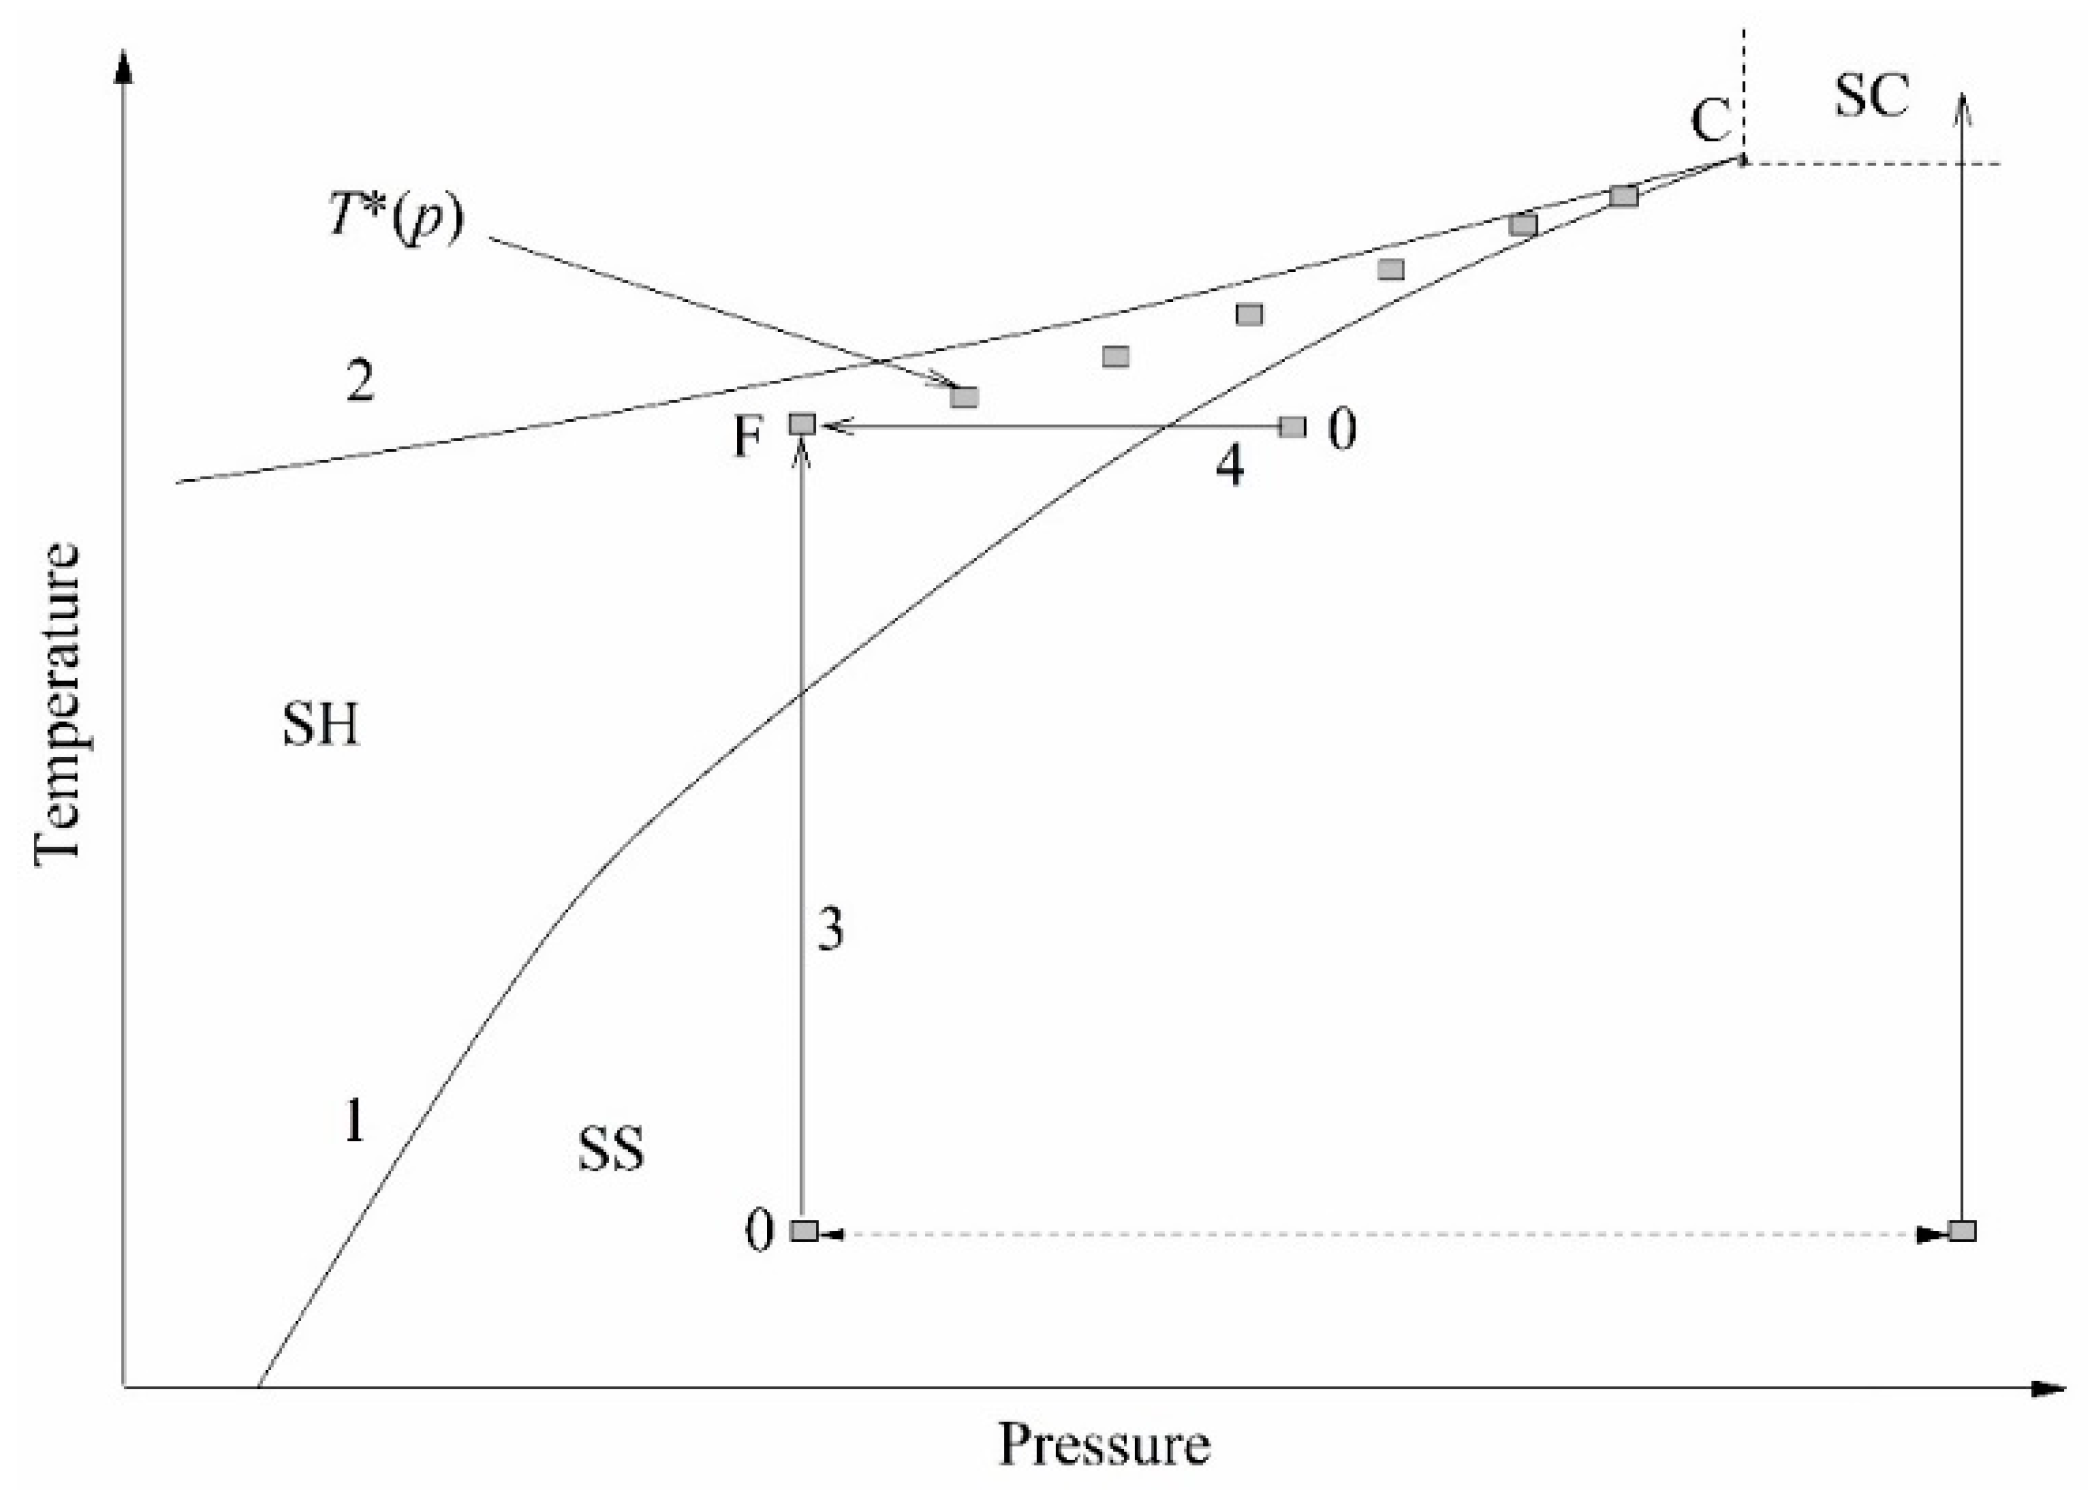
The essence of experiments on a short-term transition of a liquid from an initially stable state to a not fully stable state, superheated with respect to the liquid–vapor and/or liquid–liquid equilibrium temperature, can be conveniently explained using the p–T diagram; see Figure 2. Heating is carried out along the isobar; pressure p serves as an experimental parameter. In the course of heating, the temperature T crosses the liquid–vapor equilibrium line. At this moment, no response of the system is observed. At a sufficiently rapid heating, a monotonous increase in temperature continues until a spontaneous boiling-up occurs; see, as an example, [9,13] and the bibliography therein. Spontaneous boiling-up is a process confined in time, which is repeatable with respect to temperature and accompanied by a distinct response signal.
The value of the spontaneous boiling-up temperature at a selected heating rate has been referred to as “the attainable superheat temperature” T* [17]. The attainable superheat line T*(p) terminates at the critical point of the substance, where the properties of the liquid and vapor phases become indistinguishable. The transition to the region of supercritical pressures (p > pc) is accompanied by a change in the polarity of the response signal. The transition of a compressed fluid (p > pc) to the region of supercritical temperatures (T > Tc), which is inhomogeneous with respect to the density of its structural elements, is characterized by a threshold decrease in the instantaneous heat transfer coefficient k(t) = q/∆T(t) [18]. Here, q is the heat flux density, and ∆T is the probe temperature rise. This provides a basis for the unambiguous detection of the critical pressure of liquids, including those that are multicomponent and thermally unstable. When the constant heating power mode P(t) = const is selected, the probe temperature rise ∆Ti(t) at a given time is an informative parameter when comparing the heat transfer intensity in a series of experiments. Here, the subscript “i” is the sample number or pressure value in this series of experiments. Namely, the higher the ∆T(t) value, the higher the thermal resistance of the sample and the lower the heat transfer coefficient in a given heat release mode.
3. Problem Statement
This work sets out to develop an approach to the study of solution properties in not fully stable and unstable states. At this stage of the study, the term “properties of solutions” implies their lifetime in an unstable state (depending on the degree of superheating) and the instantaneous heat transfer coefficient. The values of the instantaneous heat transfer coefficient are taken with respect to those for a pure component or a solution of the given concentration, which is determined by extrapolating values from the region of stable states. Our research is based on the following hypotheses [19]:
- The short-term existence of a solution in the region of unstable states, along with the measurability of its properties in such states;
- The confinement of the unstable state decay process in time (spinodal decomposition), sufficient for the unambiguous registration of its signs in real time;
- The change in the response signal polarity when the pressure value (in the step-by-step pressure increase course) crosses the critical isobar or its effective value.
4. Experimental Section
The formulated problem was tackled by the pulse heating method equipped with the function of controlling the heating parameters during a pulse [9]. The method was selected due to its capability of minimizing the V·t product, detecting the heat-flux density disturbance (associated, for example, with spontaneous boiling-up against the background of monotonic heating) and repeating the selected heating mode in a series of high-precision measurements. The latter circumstance is important for the correct comparison of the signal-response characteristics in the course of a systematic change in the experimental parameter. Experimental parameters can be pressure, the solution concentration, and the degree of its superheat with respect to the diffusional spinodal, T-Tsp. In experiments, the change in the average integral probe temperature was monitored during the pulse T(t) at a given heat release power P(t). The primary data are the voltage drop across the probe and the standard resistor Ui(t). On their basis, the reproducibility of the set value P(t) in a series of measurements and, taking into account the standard calibration of platinum resistance thermometers, the evolution of the temperature of the probe T(t) were monitored.
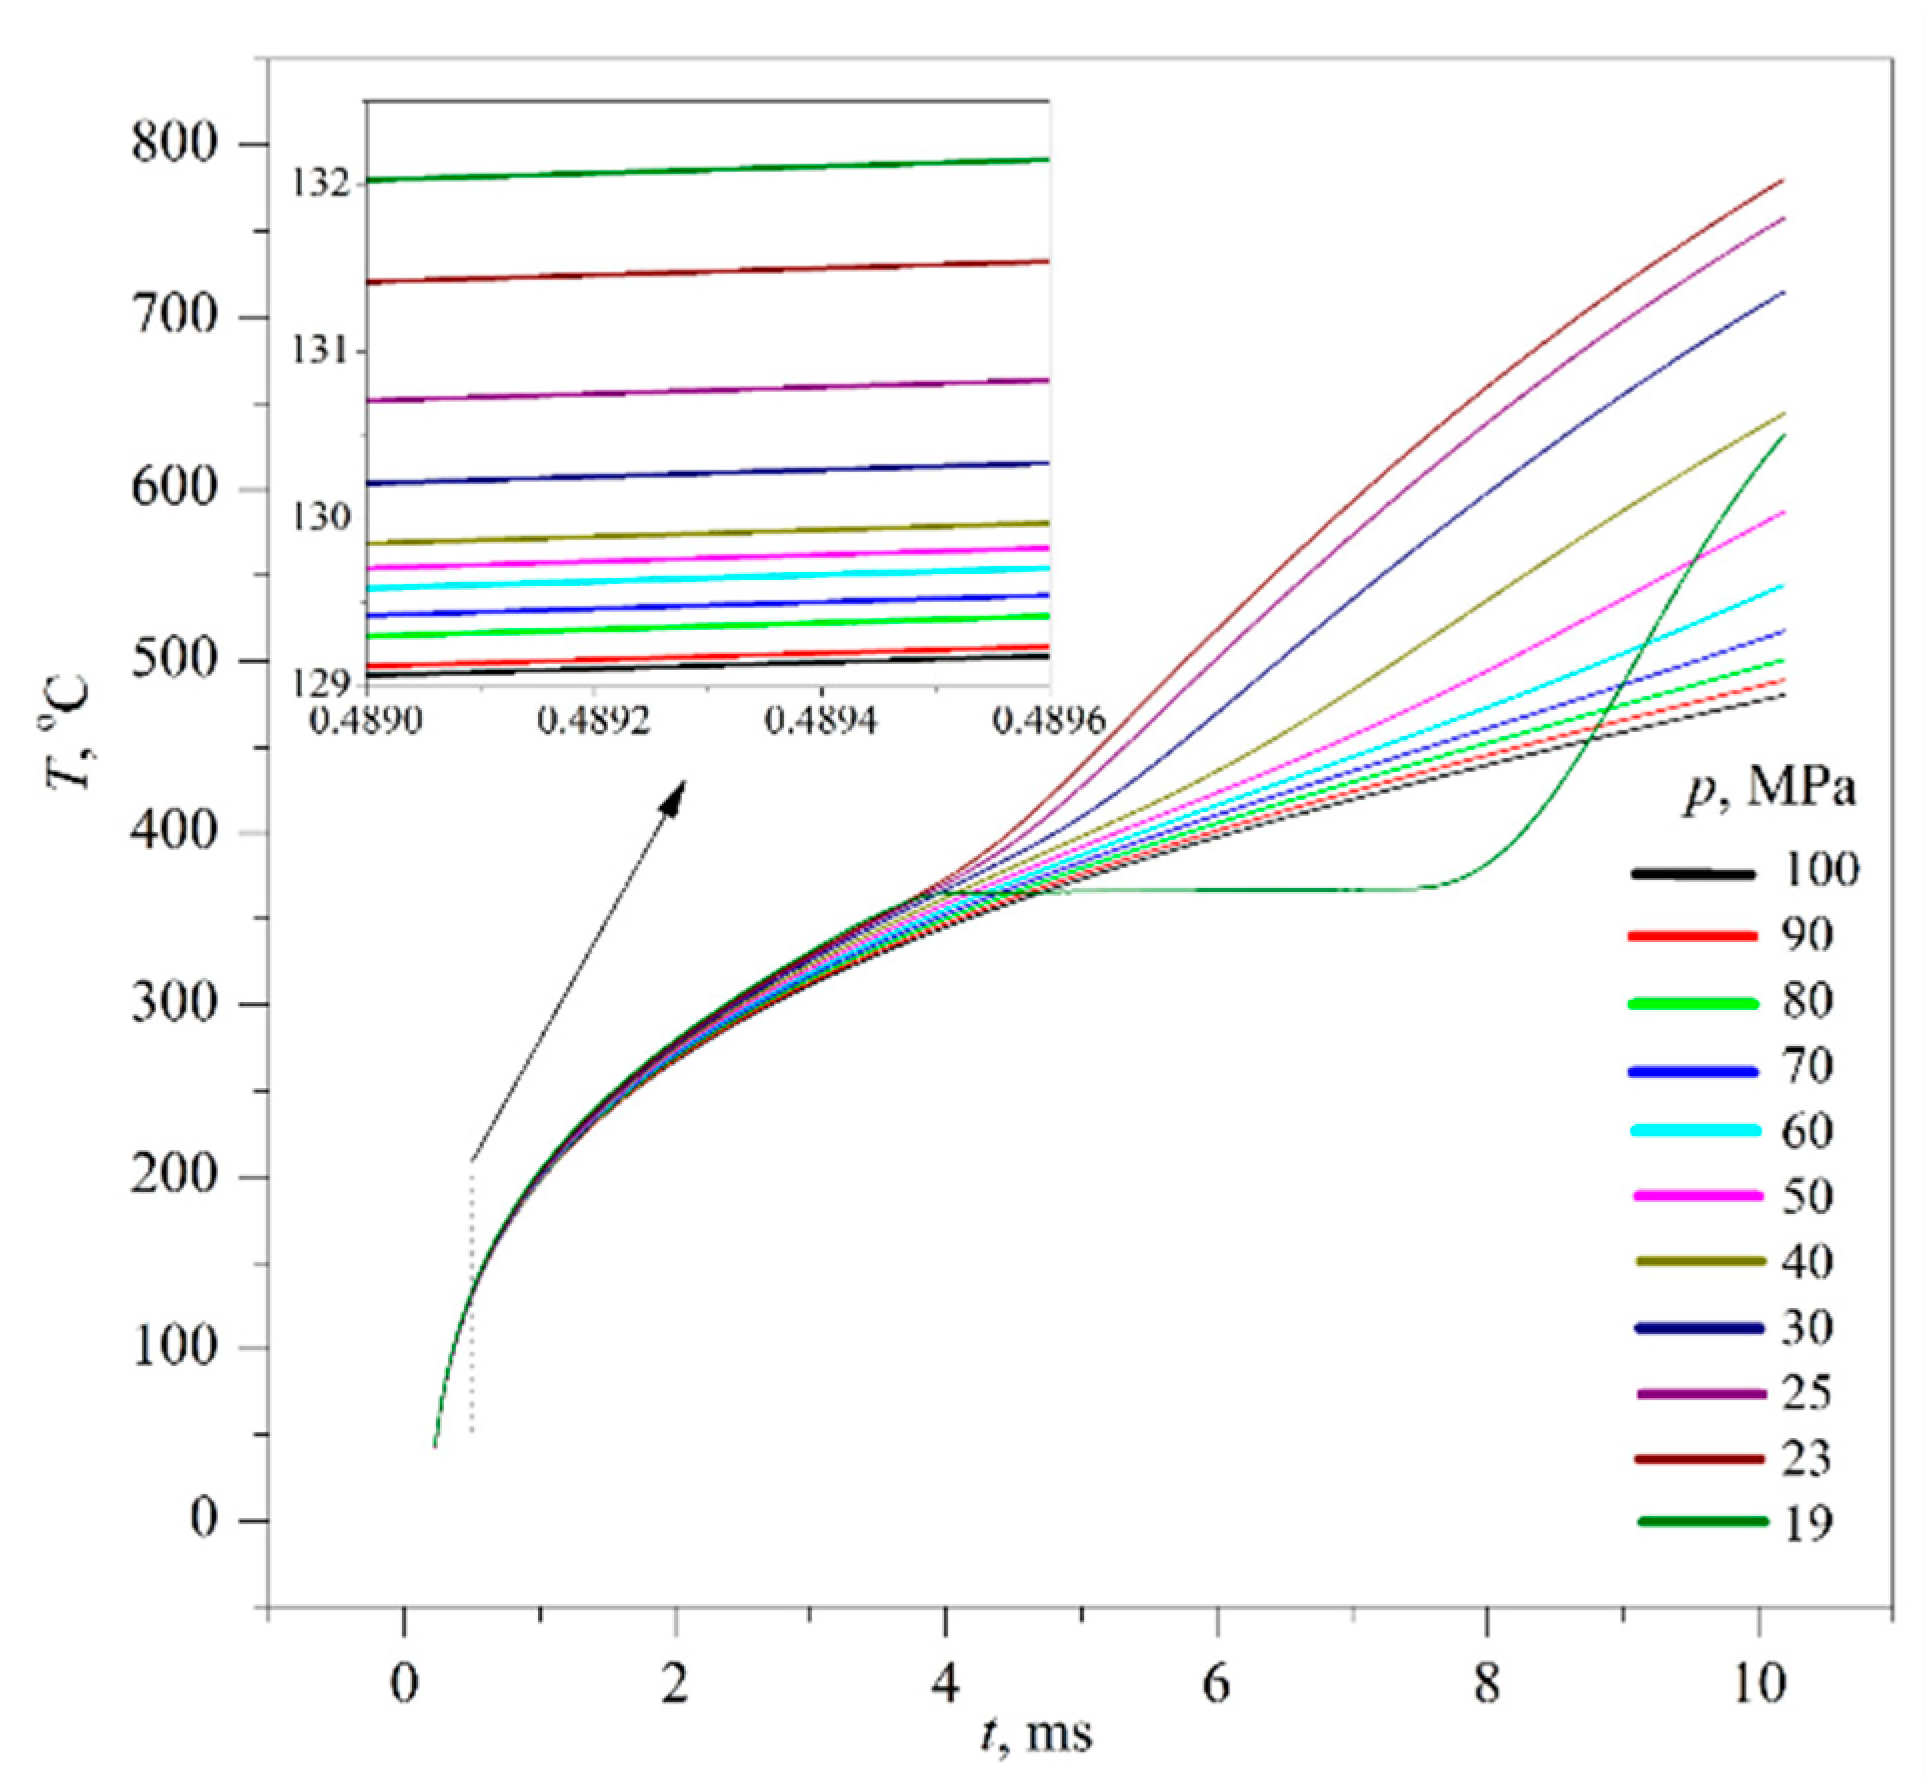
In order to reduce the influence of approximations inherent in probe methods and associated with deviations of experimental conditions from the ideal model [8], it is convenient to use the mode of relative measurements. In this case, it is advisable to fix one of the key variables of the method, namely, P(t) ≈ const or T(t > t1) ≈ const, where t1 is the duration of heating from the initial temperature T0 to its specified value. Then, the difference in the course of the resulting curves T(t) in the first case or curves P(t > t1) in the second case, due to a change in the experimental parameter, will reflect the difference in the heat flux density. Consequently, it will reflect the difference in the coefficient of heat transfer from the probe to the sample at a selected (generally, arbitrary) timing. Following [20], the condition for the transition from measurements on pure components to measurements on solutions will be the repeatability of the heating function in a series of experiments and the sensitivity of the response signal to a small change in the parameter; see Figure 3.
The latter circumstance makes it appropriate to use the heating mode in the form of constant current in the probe circuit, I(t) ≈ const. The primary variables for this case are shown in Figure 4. This mode is a natural amplification of differences in the signal-response amplitude against the background of small parameter changes. Therefore, at a strictly specified heating mode, the results of such measurements will serve as functions of not only the process characteristics but also, in a relative mode, of the sample properties.
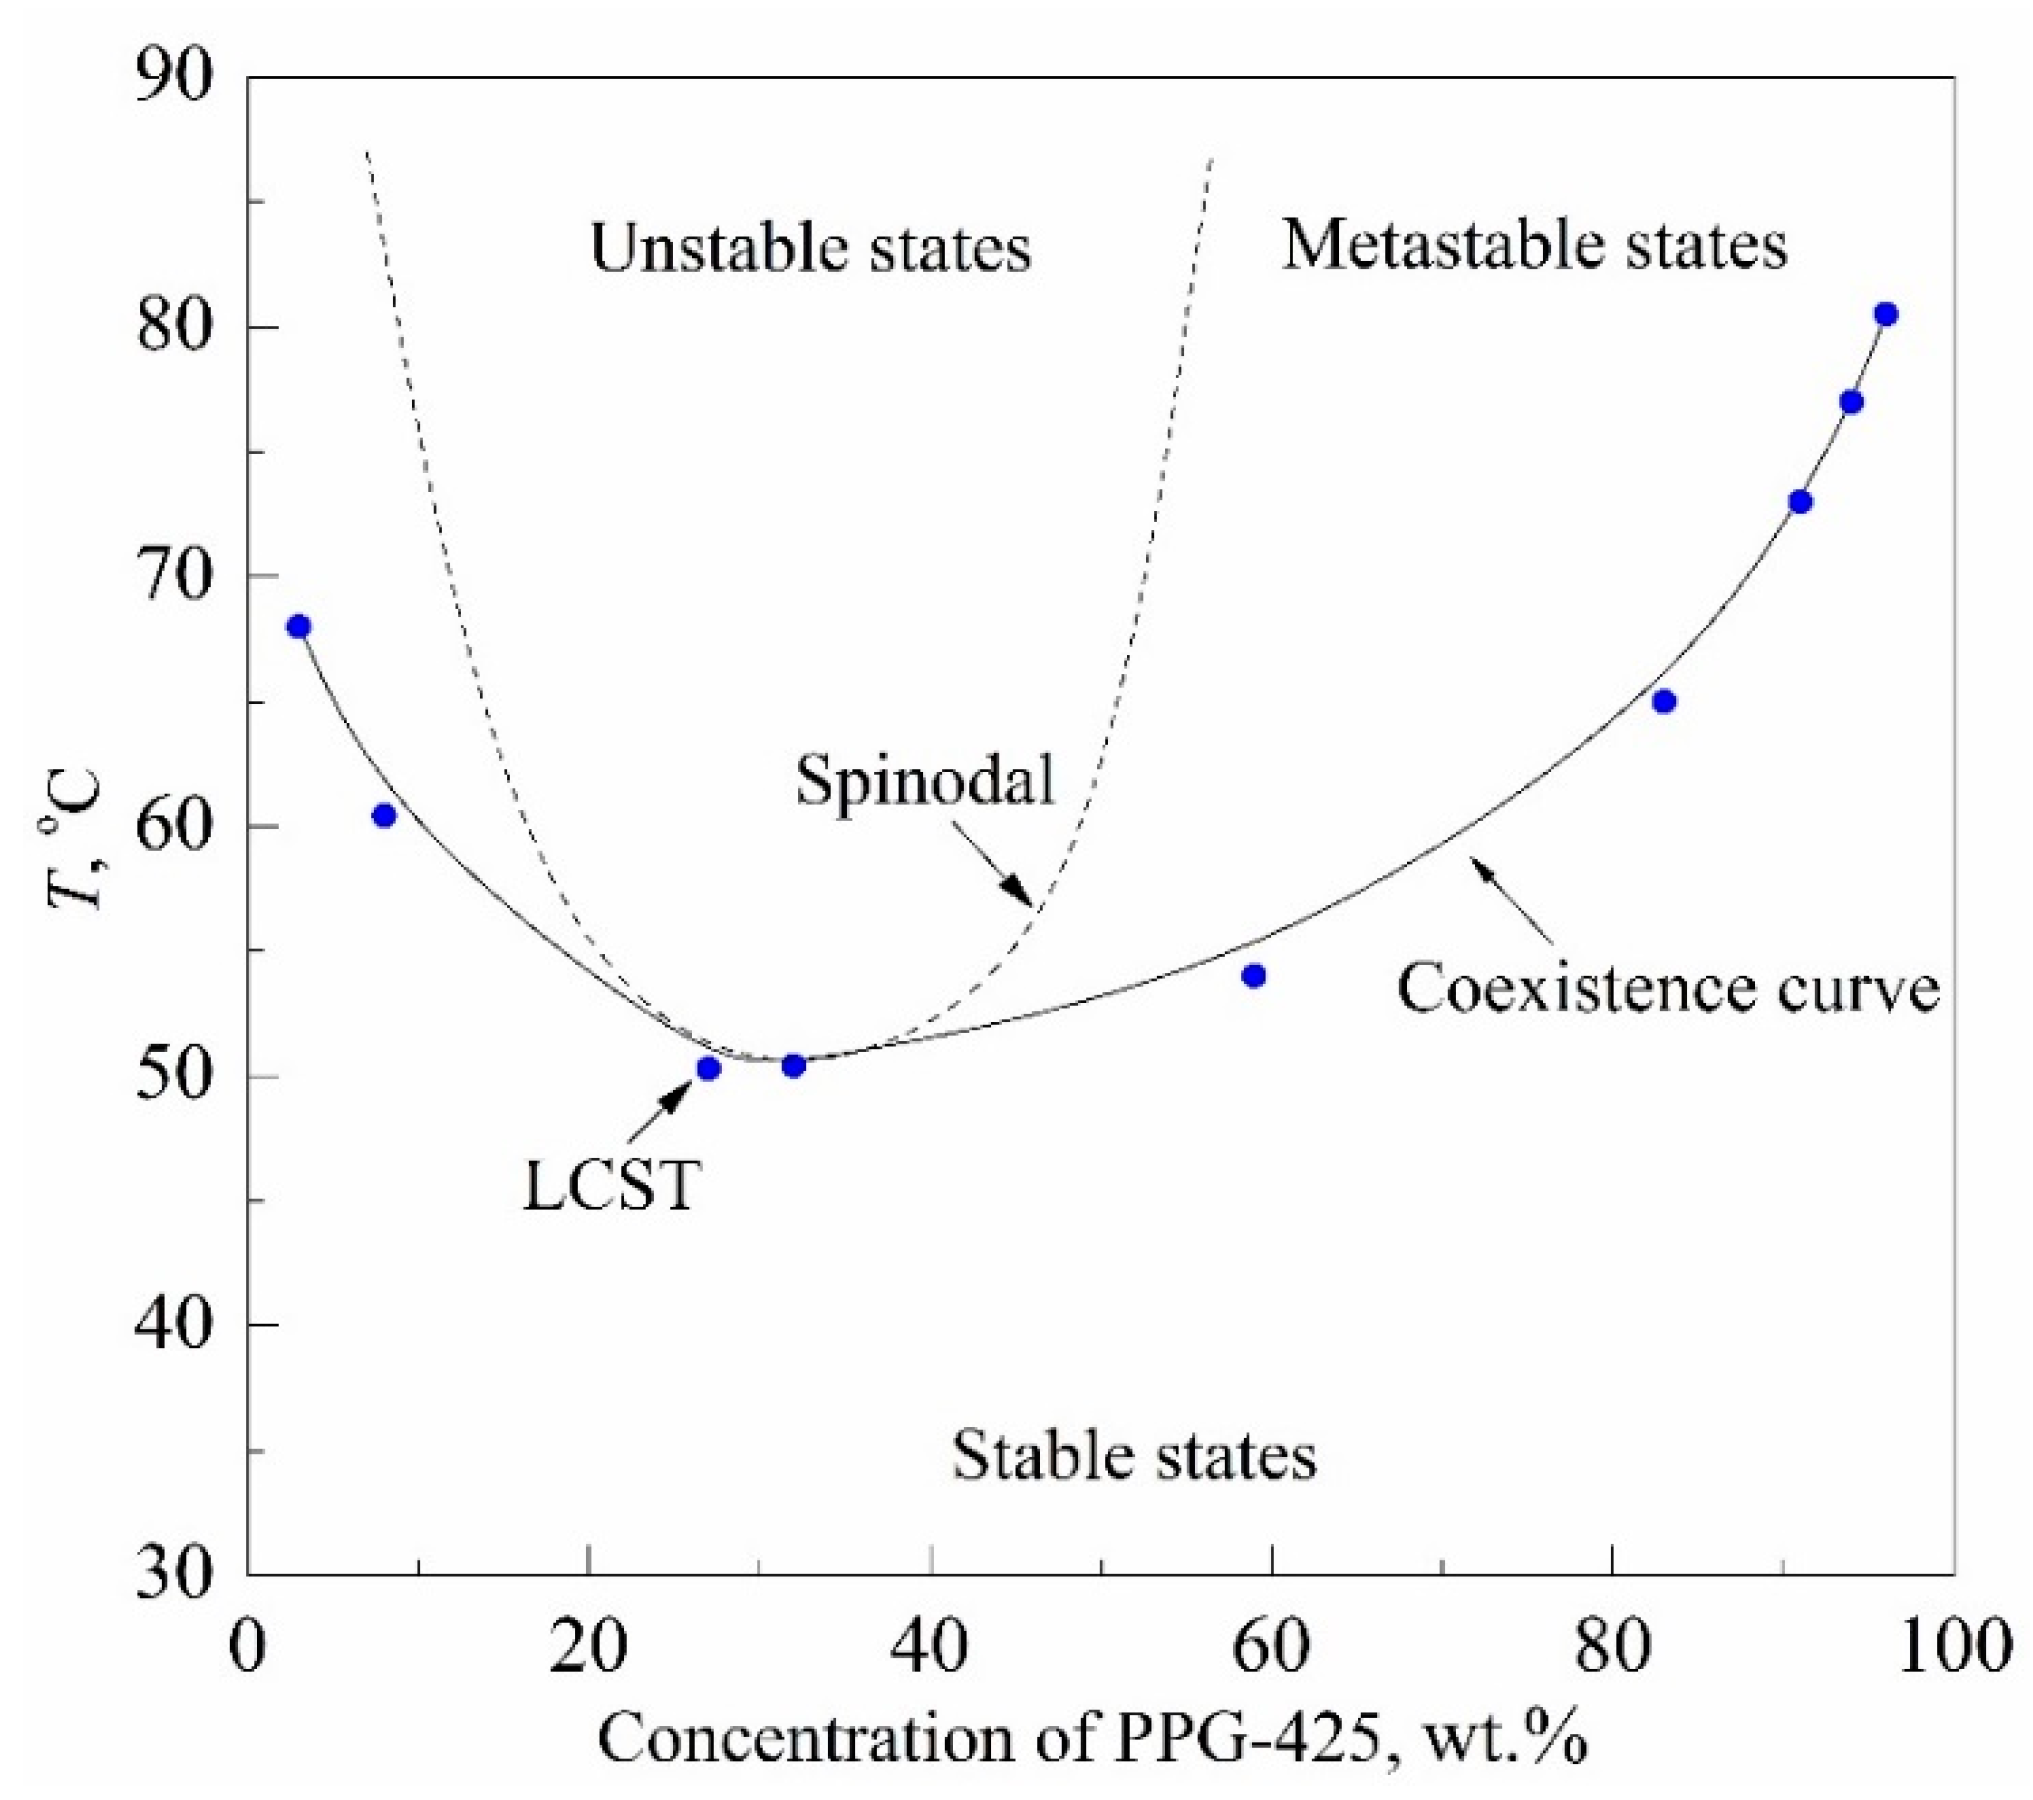
The research objects were aqueous solutions of 425-molecular-weight polypropylene glycol (PPG-425) and glycol monobutyl ether (GME) having a lower critical solution temperature (LCST); see Figure 5. The estimate of the LCST coordinates for these solutions known from the literature is as follows: 328 K; 0.27 PPG wt. fr. [21] and 317 K; 0.3 GME wt. fr. [22], respectively. The initial state of the solution is at a temperature of T0 ≈ 295 K, which is in the region of its stable states.
5. Results
Typical results of experiments on the fast transition of initially stable solutions to the region of unstable states are presented below; see Figure 6, Figure 7, Figure 8, Figure 9 and Figure 10. The main study object was a 30% PPG solution in water, whose composition was close to the critical concentration. In this connection, the region of unstable states is separated from the region of stable states only by a narrow (in temperature) strip of metastable states; see Figure 5. To avoid the effect of spontaneous boiling up of a solution superheated with respect to the liquid–vapor equilibrium temperature, the experiments were carried out at elevated pressures. The pressure in the substance, reduced to the critical value, was varied from p/pc ≈ 0.3 to supercritical values p > pc. The heating rate was varied from 105 K/s (constant power mode) to 106 K/s (constant current one). The probe was a platinum wire having a diameter of 20 μm and a length of 1 cm. The probe was connected to a negative feedback loop [9]. This circuit reproduces the specified heating mode, taking into account the change in the properties of the probe material and substance along with temperature.
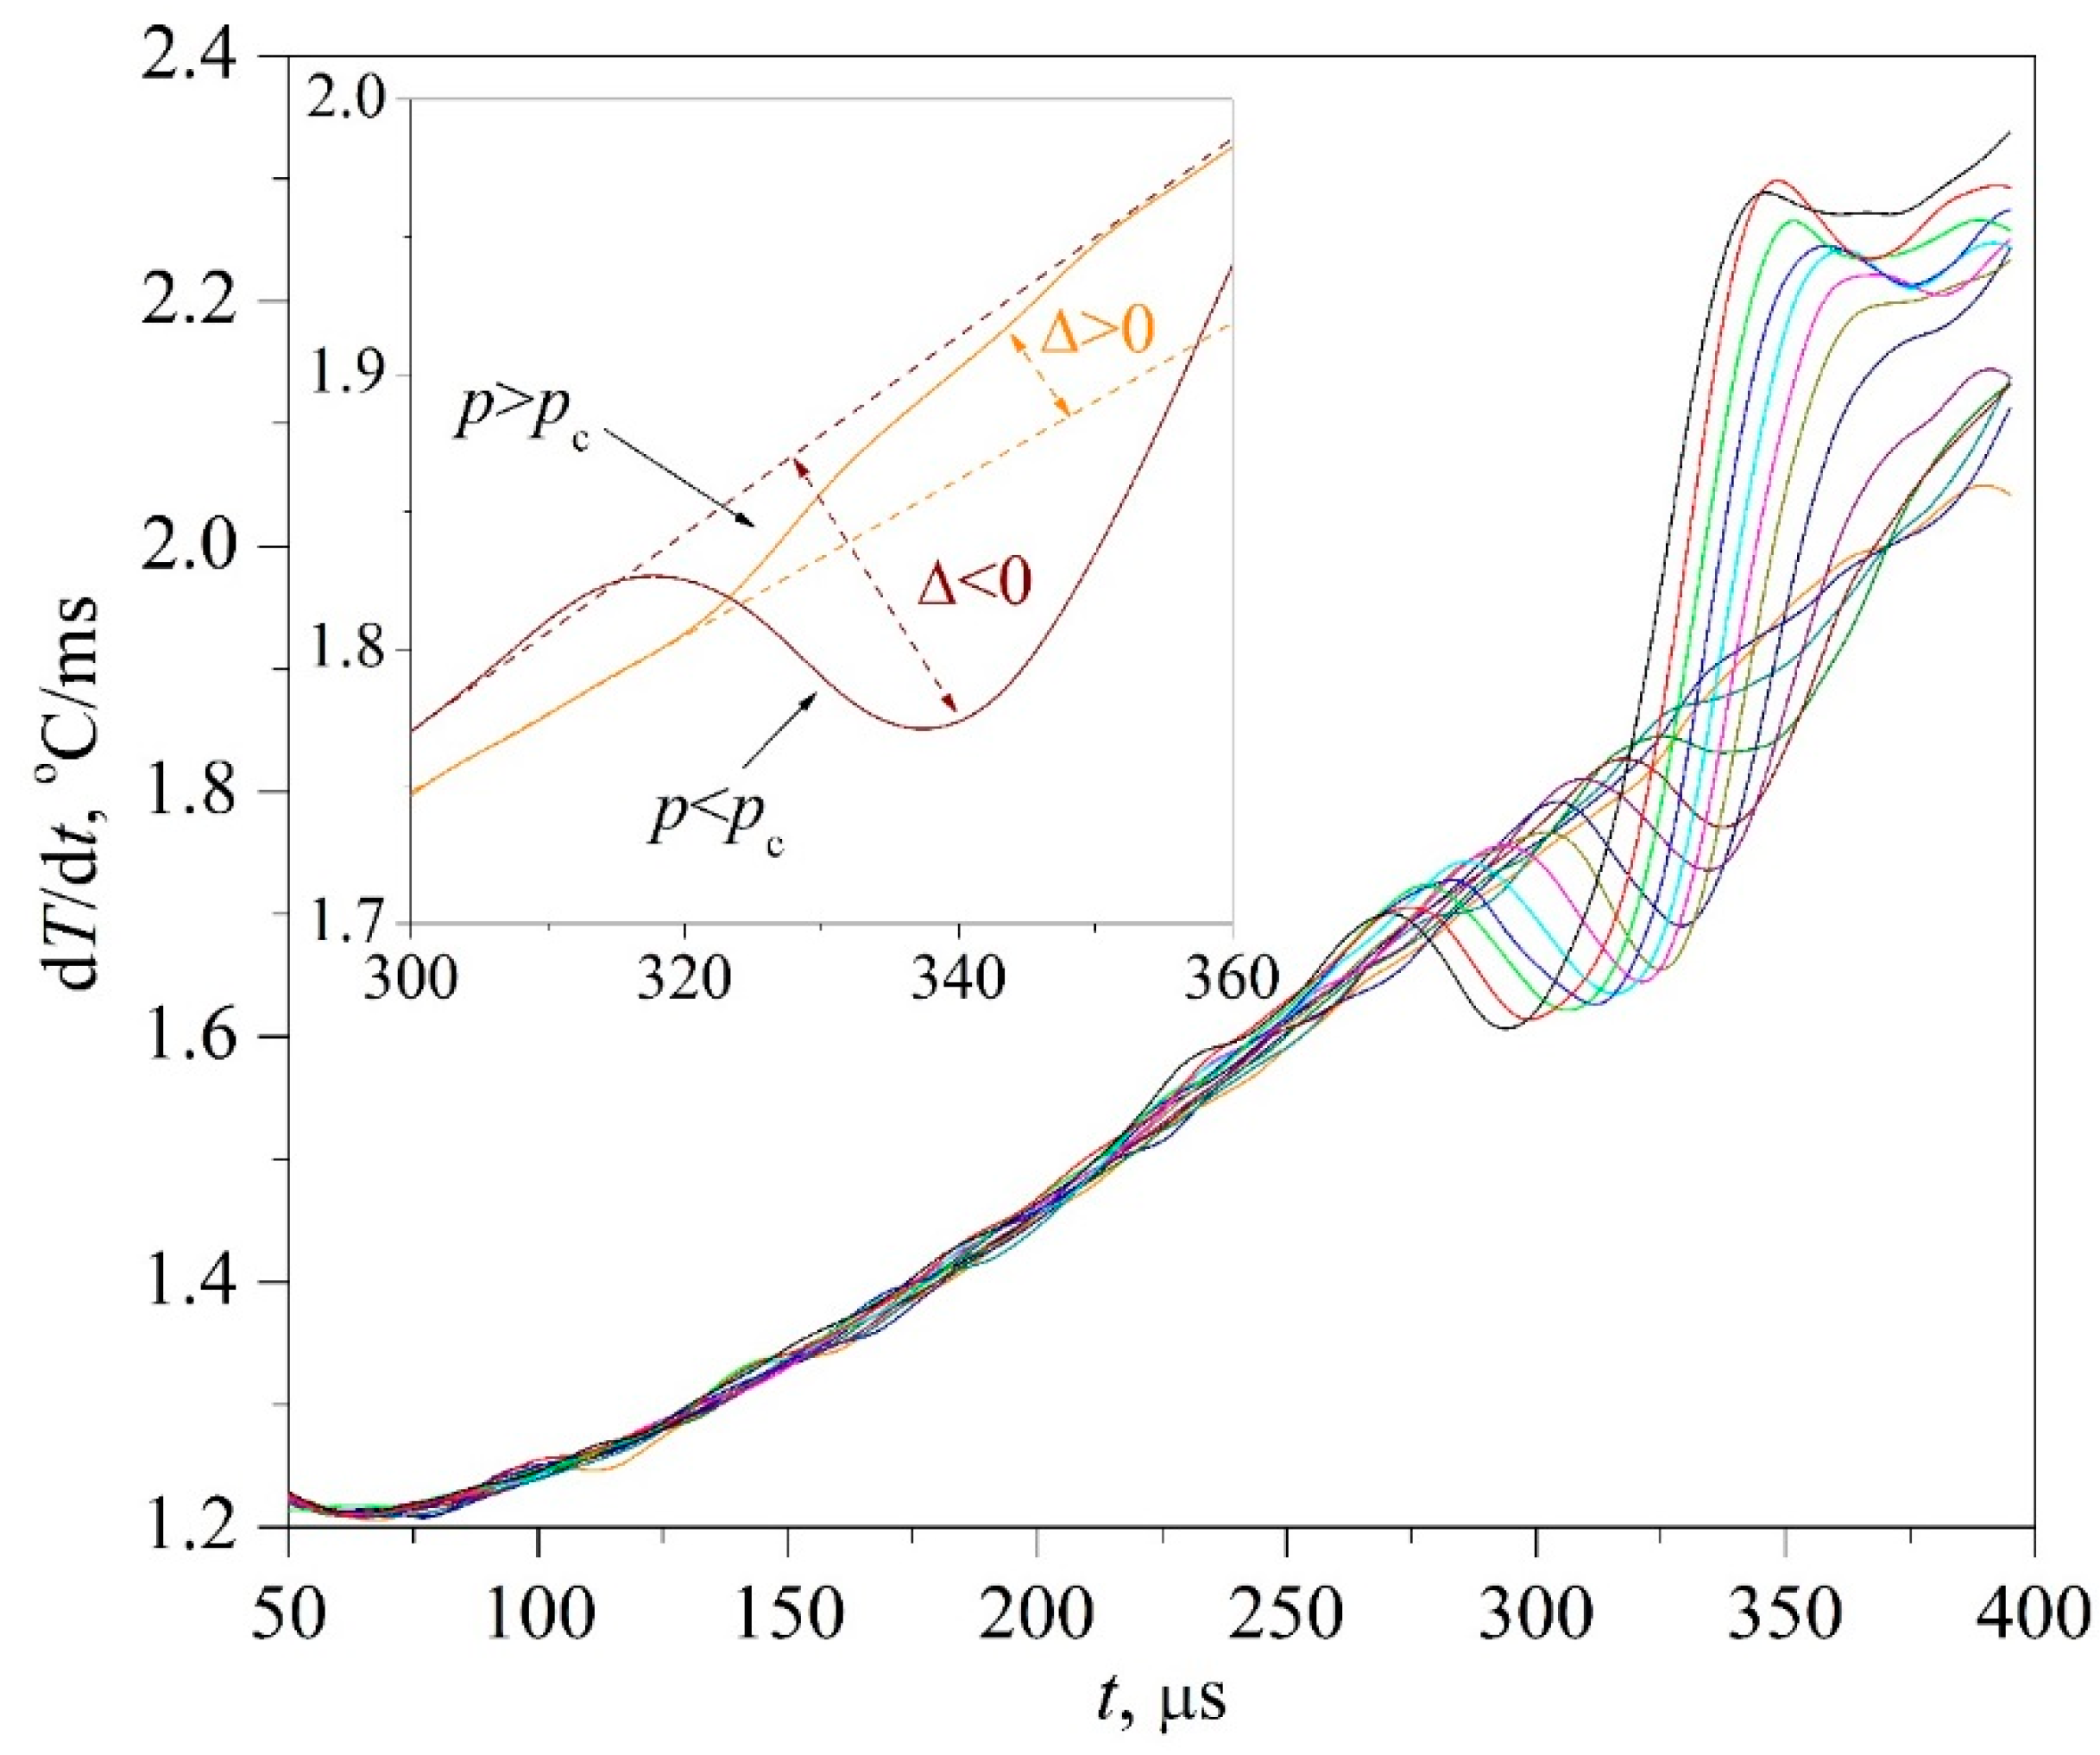
A sign of spinodal decomposition [3,23], as the most probable relaxation process in the considered part of the phase diagram (T > Tsp), was a disturbance of the signal-response smooth course in the form of U(t) or T(t). The downward deviation of the signal relative to the extrapolation of its undisturbed path corresponds to an increase in the heat flux through the probe surface (for example, in the case of spontaneous boiling-up). In turn, the upward deviation corresponds to its decrease (in the case of transition of the compressed fluid to the supercritical region of temperatures). A change in the signal-response polarity during changes in pressure is a sign of crossing the critical isobar (p = pc) [24]. This circumstance underlies the technique for assessing the critical pressure of a solution in unstable states; see Figure 6. For assessing the corresponding value of the critical temperature Tc = T(p = pc), a calibration procedure for the probe with respect to the reference substances is required.
The time confinement of the effect due to spinodal decomposition, as expected, turned out to be less than that of the effect due to spontaneous boiling up; see Figure 7. This circumstance required the application of a differentiation procedure; see Figure 8 and Figure 9, as well as procedures for accumulating response signals for a given heating mode. At the initial, so-called diffusion stage of spinodal decomposition, a decrease in the heat flux density is more likely. At the next, convective stage, its intensification is more probable [25,26]. The scale of the effect systematically decreased with increasing the heating rate; see Figure 7a,b, which can be explained by a decrease in the thickness of the heated layer l~(a·t)0.5 that forms the corresponding response signal.
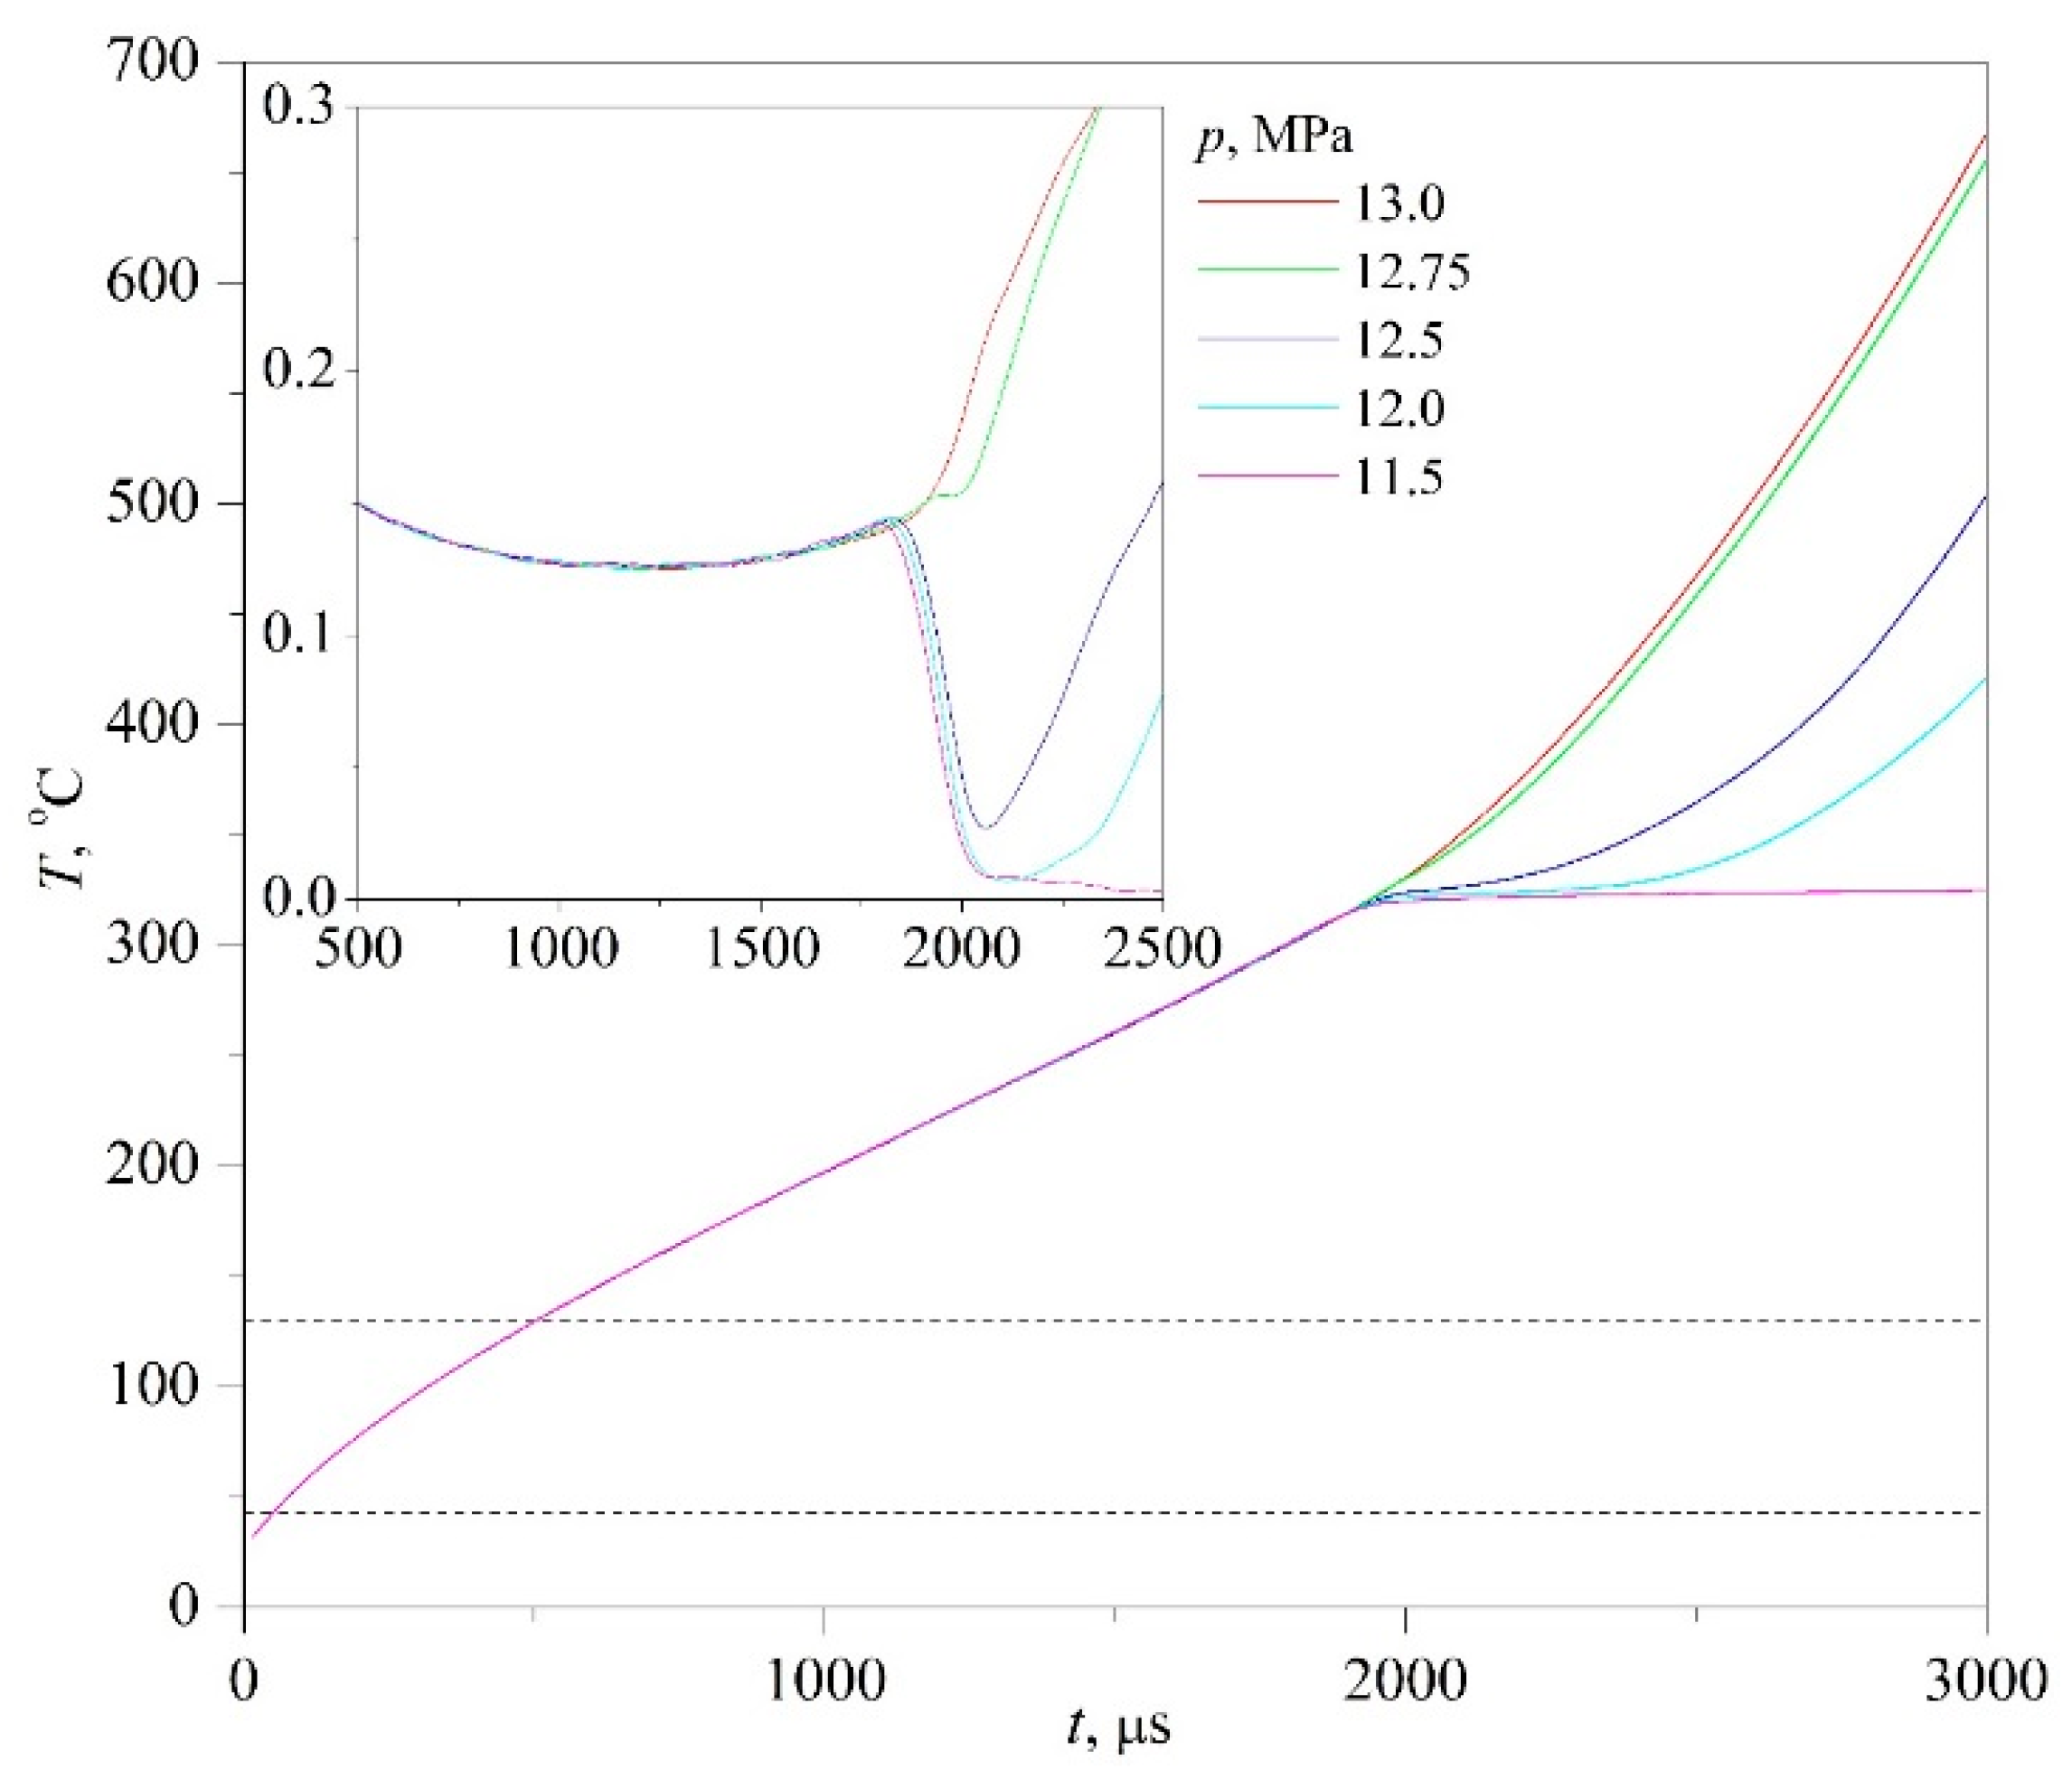
Apparently, the very possibility of spinodal decomposition at a selected scale of characteristic times presupposes a sufficient degree of deepening into the region of unstable states. The degree of superheating the PPG solution with respect to the diffusional spinodal was 150 K and higher. In turn, in experiments with an aqueous solution of MBE, having a closed loop type of the liquid–liquid critical curve, no signs of spinodal decomposition were revealed. Here, we observe a conventional spontaneous boiling-up of the solution (p < pc) or its supercritical transition (p > pc); see Figure 10 for an MBE concentration close to the critical value (LCST). An increase in the duration of crossing the instability region by the order of magnitude did not change the essence of the observed pattern. A possible explanation for this result is as follows. The region of incompatibility of components in terms of temperature (TUCST-TLCST) is limited to a much smaller value, which is approximately 87 K at atmospheric pressure.
For the lowest heating rate in our experiments, the temperature curves have a tendency to level off. In this case, the density of the heat flux in the solution essentially exceeded the corresponding value for pure water. The latter has been obtained in the heat conduction mode under comparable conditions. For the highest heating rate, the effect was significantly “smeared”. Its separation was carried out by comparison with a known homogeneous “reference substance”, which was selected to be water at the supercritical pressure. The corresponding selection of parameters of the heating function was performed; see Figure 7b, Figure 8b and Figure 9b. It should be noted that the comparison of heating function parameters for the solution under study and pure water, which provides close trajectories of the probe temperature, makes it possible to calibrate the intensity of heat transfer by the solution in the appropriate units for water. In particular, at not too short heating times up to the onset of spinodal decomposition (tsp > 1 ms), a significantly enhanced heat transfer was observed. For the 30% PPG solution discussed above, the enhancement comprised almost an order of magnitude.
6. Conclusions
Based on the experience of working with not fully stable systems, we propose a methodology for investigating solutions in thermodynamically unstable states. The potential of the methodology was demonstrated on the examples of PPG-425/water and GME/water solutions short-term superheated with respect to the diffusion spinodal. In particular, we have found the conditions for observing the ordinary (non-polymeric) solutions in unstable states. The attainable degrees of superheat and the characteristic lifetimes of an unstable solution preceding the onset of its decay have been revealed. It has been found that the scale of the signal-response, which indicates such an onset against the smooth background process, is much smaller than the corresponding scale typical of spontaneous boiling up. This feature required changes in the approach to the primary data processing developed for the boiling-up process.
Taking into account the diversity of phase diagrams of partially compatible solutions, the proposed approach applied to other systems may undergo only partial transformations. Judging by the observed unexpectedly significant enhancement in heat transfer at the convective stage of decay, the discussed objects can find application in the problems of removing high-density heat fluxes from local areas of heat-generating surfaces [25,26,27,28,29,30], for example, in miniature chemical reactors and microelectronics.
Author Contributions
All authors made a significant contribution to the discussion of the idea of the article, preparation, and conduct of experiments, processing of the results, as well as writing the article; review and editing was performed by A.I. All authors have read and agreed to the published version of the manuscript.
Funding
This study was supported by the Russian Science Foundation (project No. 19-19-00115).
Institutional Review Board Statement
Not applicable.
Informed Consent Statement
Not applicable.
Data Availability Statement
The datasets of the primary experimental data are available from the corresponding author on request.
Acknowledgments
The authors are grateful to A.D. Yampol’skiy for technical support of the experimental software and D.V. Volosnikov for help in purchasing samples and preparing solutions.
Conflicts of Interest
The authors declare no conflict of interest.
References
- Imre, A.R.; Kraska, T. Stability limits in binary fluids mixtures. J. Chem. Phys. 2005, 122, 064507. [Google Scholar] [PubMed]
- Skripov, V.P.; Faizullin, M.Z. Crysyal-Liquid-Gas Phase Transitions and Thermodynamic Similarity; Wiley-VCH Verlag GmbH & Co. KGaA: Weinheim, Germany, 2006; p. 180. [Google Scholar]
- Levelt Sengers, J.M.H. How Fluids Unmix. Discoveries by the School of Van Der Waals and Kamerlingh Onnes; Royal Netherlands Academy of Arts and Sciences: Amsterdam, The Netherlands, 2002. [Google Scholar]
- Safarov, J.; Ashurova, U.; Ahmadov, B.; Abdullayev, E.; Shahverdiyev, A.; Hassel, E. Thermophysical properties of Diesel fuel over a wide range of temperatures and pressures. Fuel 2018, 216, 870–889. [Google Scholar]
- Polikhronidi, N.G.; Batyrova, R.G.; Wu, J.; Abdulagatov, I.M. PVT and Thermal-Pressure Coefficient Measurements and Derived Thermodynamic Properties of 2-Propanol in the Critical and Supercritical Regions. Int. J. Thermophys. 2020, 41, 92. [Google Scholar]
- Assael, M.J.; Antoniadis, K.D.; Wakeham, W.A. Historical Evolution of the Transient Hot-Wire Technique. Int. J. Thermophys. 2010, 31, 1051–1072. [Google Scholar]
- Friend, D.G.; Roder, H.M. The thermal conductivity surface for mixtures of methane and ethane. Int. J. Thermophys. 1987, 8, 13–26. [Google Scholar] [CrossRef]
- Hammerschmidt, U.; Sabuga, W. Transient hot wire (THW) method: Uncertainty assessment. Int. J. Thermophys. 2000, 21, 1255–1278. [Google Scholar] [CrossRef]
- Rutin, S.B.; Skripov, P.V. Investigation of not fully stable fluids by the method of controlled pulse heating. 1. Experimental approach. Thermochim. Acta 2013, 562, 70–74. [Google Scholar] [CrossRef]
- Xing, W.; Ullmann, A.; Brauner, N.; Plawsky, J.; Peles, Y. Advancing micro-scale cooling by utilizing liquid-liquid phase separation. Sci. Rep. 2018, 8, 12093. [Google Scholar] [CrossRef]
- Kuznetsov, V.V. Fundamental issues related to flow boiling and two-phase flow patterns in microchannels—Experimental challenges and opportunities. Heat Trans. Eng. 2019, 40, 711–724. [Google Scholar] [CrossRef]
- Zeng, B.; Wang, Y.; Zaytsev, M.E.; Xia, C.; Zandvliet, H.J.W.; Lohse, D. Giant plasmonic bubbles nucleation under different ambient pressures. Phys. Rev. E 2020, 102, 063109. [Google Scholar] [CrossRef]
- Skripov, P.V.; Skripov, A.P. The Phenomenon of Superheat of Liquids: In Memory of Vladimir P. Skripov. Int. J. Thermophys. 2010, 31, 816–830. [Google Scholar] [CrossRef]
- Arvengas, A.; Davitt, K.; Caupin, F. Fiber optic probe hydrophone for the study of acoustic cavitation in water. Rev. Sci. Instrum. 2011, 82, 034904. [Google Scholar] [CrossRef] [Green Version]
- Skripov, P.V.; Smotritskiy, A.A.; Starostin, A.A.; Shishkin, A.V. A method of controlled pulse heating: Applications. J. Eng. Thermophys. 2007, 16, 155–163. [Google Scholar] [CrossRef]
- Gurashkin, A.L.; Starostin, A.A.; Ermakov, G.V.; Skripov, P.V. Communication: High speed optical investigations of a character of boiling-up onset. J. Chem. Phys. 2012, 136, 021102. [Google Scholar] [CrossRef] [PubMed]
- Skripov, V.P. Metastable States. J. Non-Equilib. Thermodyn. 1992, 17, 193–236. [Google Scholar]
- Skripov, P.V.; Rutin, S.B. Features of supercritical heat transfer at short times and small sizes. Int. J. Thermophys. 2021, 42, 110. [Google Scholar] [CrossRef]
- Igolnikov, A.A.; Rutin, S.B.; Skripov, P.V. Short-term measurements in thermally-induced unstable states of mixtures with LCST. Thermochim. Acta 2021, 695, 178815. [Google Scholar] [CrossRef]
- Rutin, S.B.; Skripov, P.V. Comments on “The Apparent Thermal Conductivity of Liquids Containing Solid Particles of Nanometer Dimensions: A Critique” (Int. J. Thermophys. 36, 1367 (2015)). Int. J. Thermophys. 2016, 37, 102. [Google Scholar] [CrossRef]
- Firman, P.; Kahlweit, M. Phase behavior of the ternary system H2O-oil-polypropyleneglycol (PPG). Colloid Polym. Sci. 1986, 264, 936. [Google Scholar] [CrossRef]
- Jang, S.; Hyeong, S.; Shin, M.S.; Kim, H. Isobaric vapor–liquid equilibria for the n-heptane+ethylene glycol monopropyl ether and n-octane+ethylene glycol monopropyl ether systems. Fluid Phase Equilib. 2010, 298, 270–275. [Google Scholar] [CrossRef]
- Debenedetti, P.G. Metastable Liquids: Concepts and Principles; Princeton University Press: Princeton, NJ, USA, 1996. [Google Scholar]
- Rutin, S.B.; Galkin, D.A.; Skripov, P.V. Investigation of not fully stable fluids by the method of controlled pulse heating. 3. Attainable superheat of solutions with different types of critical curve. Thermochim. Acta 2017, 651, 47–52. [Google Scholar] [CrossRef]
- Ullmann, A.; Poesio, P.; Brauner, N. Enhancing heat transfer rates by inducing liquid-liquid phase separation: Applications and modeling. Interfacial Phenom. Heat Transfer 2015, 3, 41–67. [Google Scholar] [CrossRef]
- Poesio, P.; Lezzi, A.M.; Beretta, G.P. Evidence of convective heat transfer enhancement induced by spinodal decomposition. Phys. Rev. E 2007, 75, 066306. [Google Scholar] [CrossRef] [PubMed]
- Rutin, S.B.; Igolnikov, A.A.; Skripov, P.V. High-power heat release in supercritical water: Insight into the heat transfer deterioration problem. J. Eng. Thermophys. 2020, 29, 67–74. [Google Scholar] [CrossRef]
- Wang, H.; Leung, L.K.H.; Wang, W.; Bi, Q. A review on recent heat transfer studies to supercritical pressure water in channels. Appl. Thermal Eng. 2018, 142, 573–596. [Google Scholar] [CrossRef]
- Volodin, O.A.; Pecherkin, N.I.; Pavlenko, A.N.; Zubkov, N.I. Heat transfer and crisis phenomena at boiling of refrigerant films falling down the surfaces obtained by deformational cutting. Interfacial Phenom. Heat Transfer 2017, 5, 215–222. [Google Scholar] [CrossRef]
- Gogonin, I.I.; Misyura, S.Y. Film Heat Exchangers: Hydrodynamics and Heat Transfer (Review). J. Eng. Thermophys. 2020, 29, 686–710. [Google Scholar] [CrossRef]
Figure 2.
A schematic diagram of a pulsed experiment in the pressure–temperature plane of a simple liquid. Here, 0—initial state, F—spontaneous boiling-up temperature T*(p), C—critical point, line 1—liquid–vapor binodal Ts(p), 2—spinodal of liquid, 3 and 4—the trajectories entering the region of superheated states using techniques of pulse heating and pressure drop, respectively. SS—the region of stable states of liquid, SH—the region of superheated states of liquid, SC—the region of supercritical states.

Figure 3.
Heating curves for water under the constant power mode at subcritical (p = 19 MPa) and supercritical (the other curves) pressures.
Figure 3.
Heating curves for water under the constant power mode at subcritical (p = 19 MPa) and supercritical (the other curves) pressures.

Figure 4.
Raw signals of the voltage drop across the probe and the current in the probe circuit in an experiment at the constant current mode.
Figure 4.
Raw signals of the voltage drop across the probe and the current in the probe circuit in an experiment at the constant current mode.
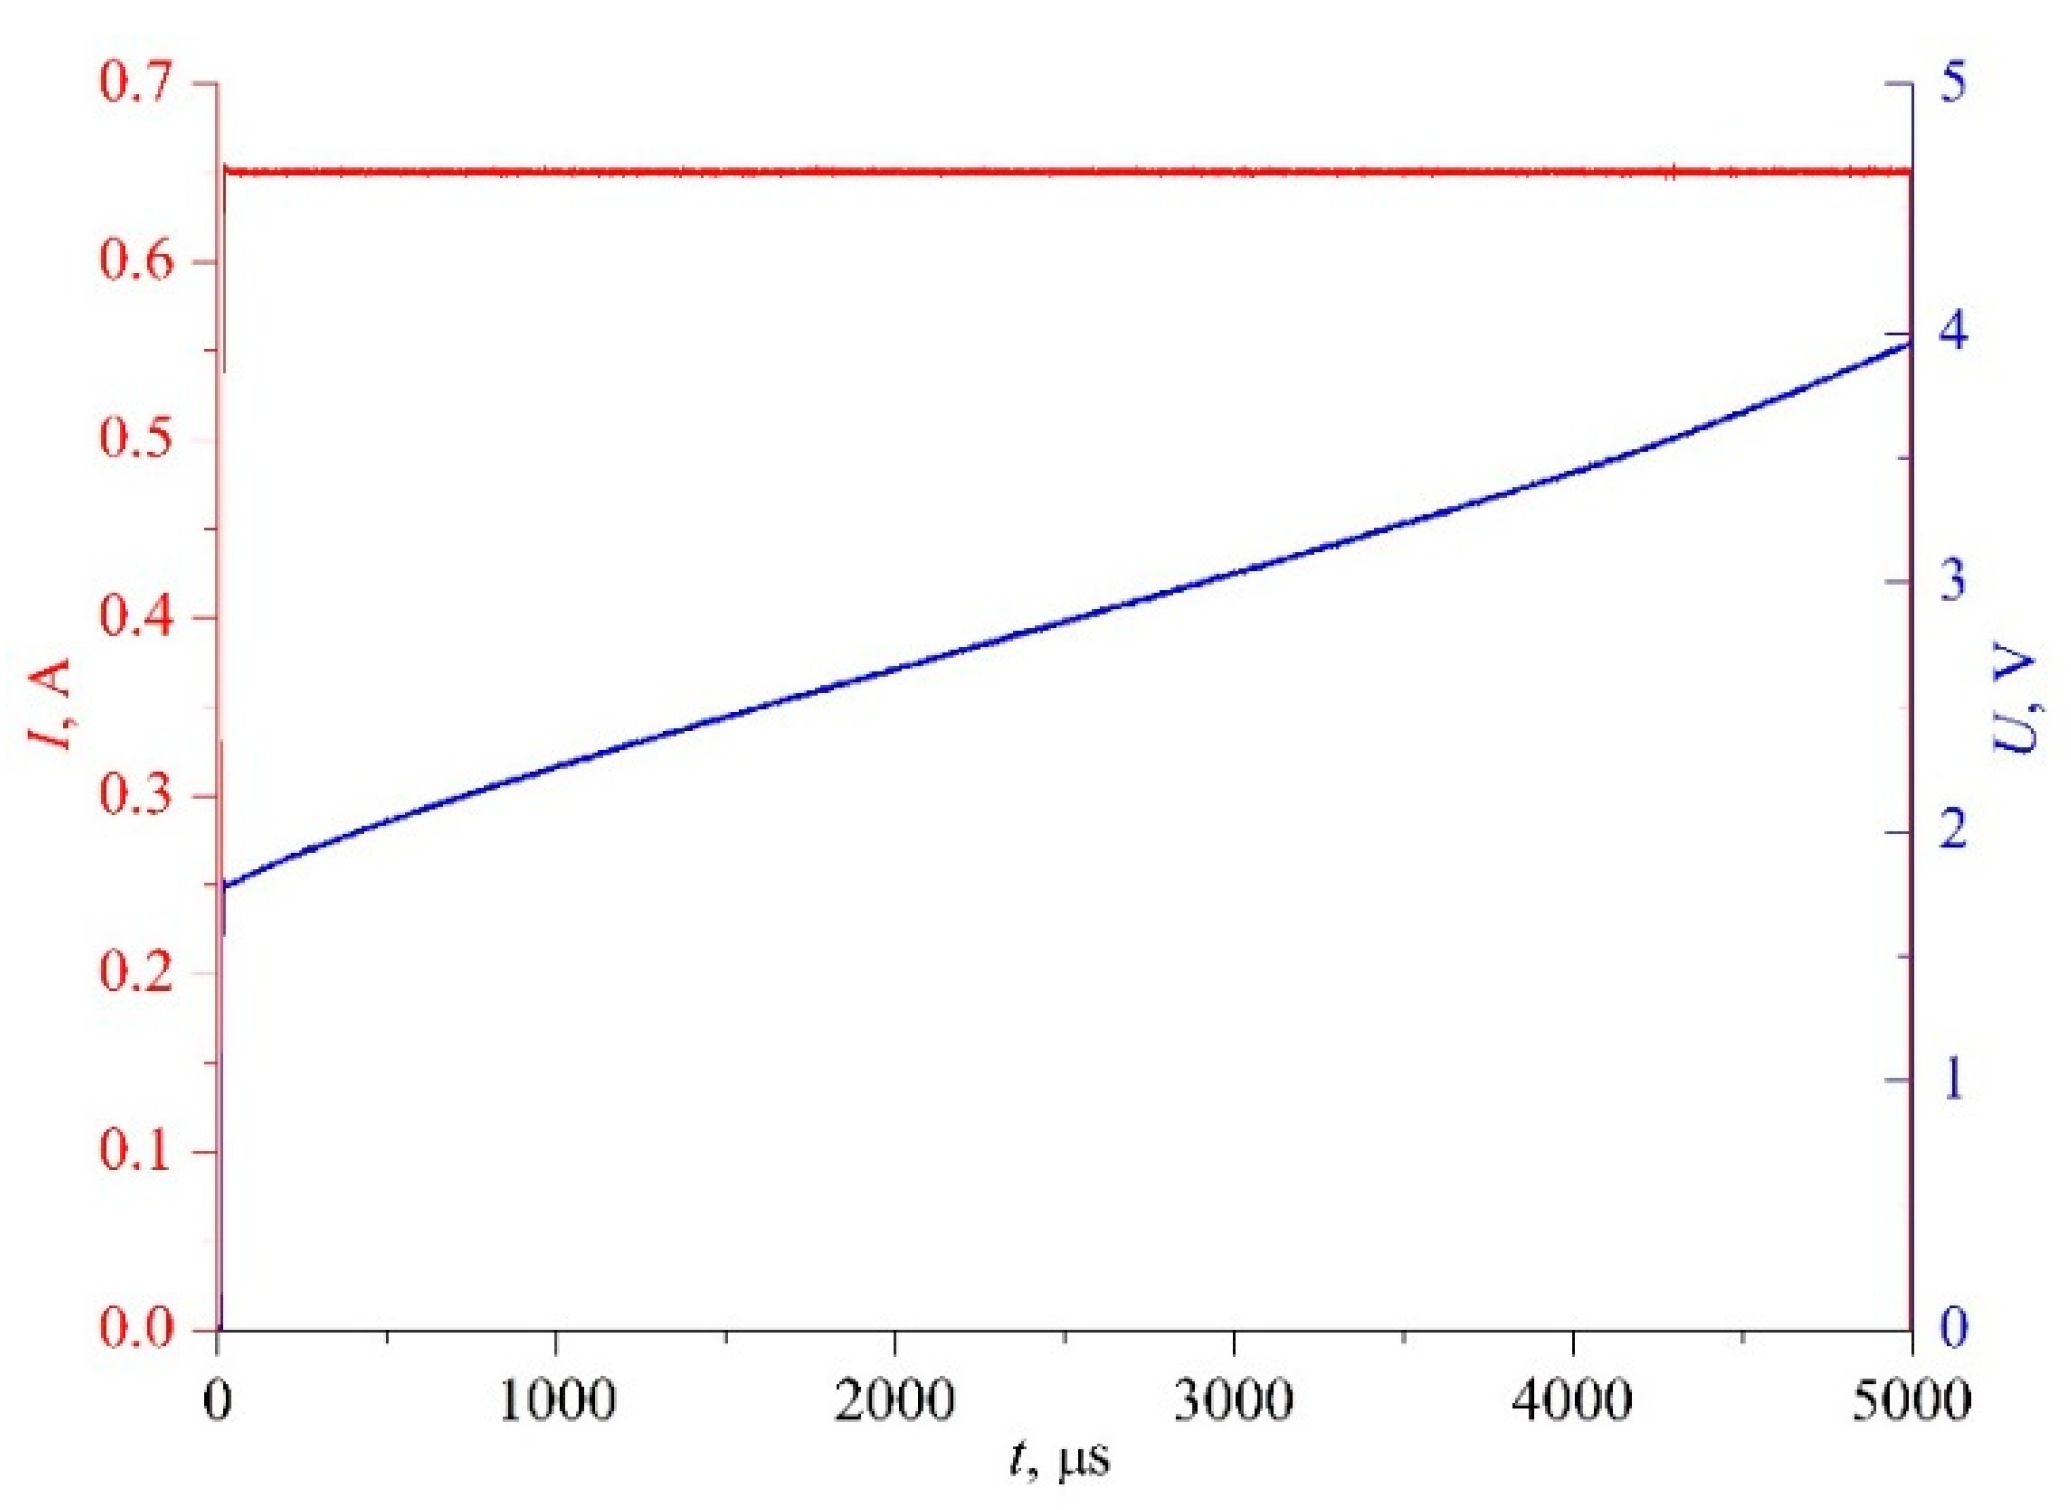
Figure 5.
A schematic view of the liquid–liquid phase diagram for water/PPG-425 solution: 1—liquid–liquid binodal; 2—evaluation for liquid–liquid spinodal position; LCST—lower critical solution temperature; binodal Ts(c; p = 0.1 MPa) is higher than 100 °C and did not hit the shown diagram field.
Figure 5.
A schematic view of the liquid–liquid phase diagram for water/PPG-425 solution: 1—liquid–liquid binodal; 2—evaluation for liquid–liquid spinodal position; LCST—lower critical solution temperature; binodal Ts(c; p = 0.1 MPa) is higher than 100 °C and did not hit the shown diagram field.

Figure 6.
Derivatives of the probe temperature with respect to time for the solution along the isobars from 6.6 to 13.1 MPa under the constant current mode. The insert shows the subcritical isobar at 11.1 MPa and the first supercritical isobar at 13.1 MPa.
Figure 6.
Derivatives of the probe temperature with respect to time for the solution along the isobars from 6.6 to 13.1 MPa under the constant current mode. The insert shows the subcritical isobar at 11.1 MPa and the first supercritical isobar at 13.1 MPa.

Figure 7.
Heating curves for the solution under the constant power mode (a) and the constant current mode (b); pressure serves as a parameter.
Figure 7.
Heating curves for the solution under the constant power mode (a) and the constant current mode (b); pressure serves as a parameter.
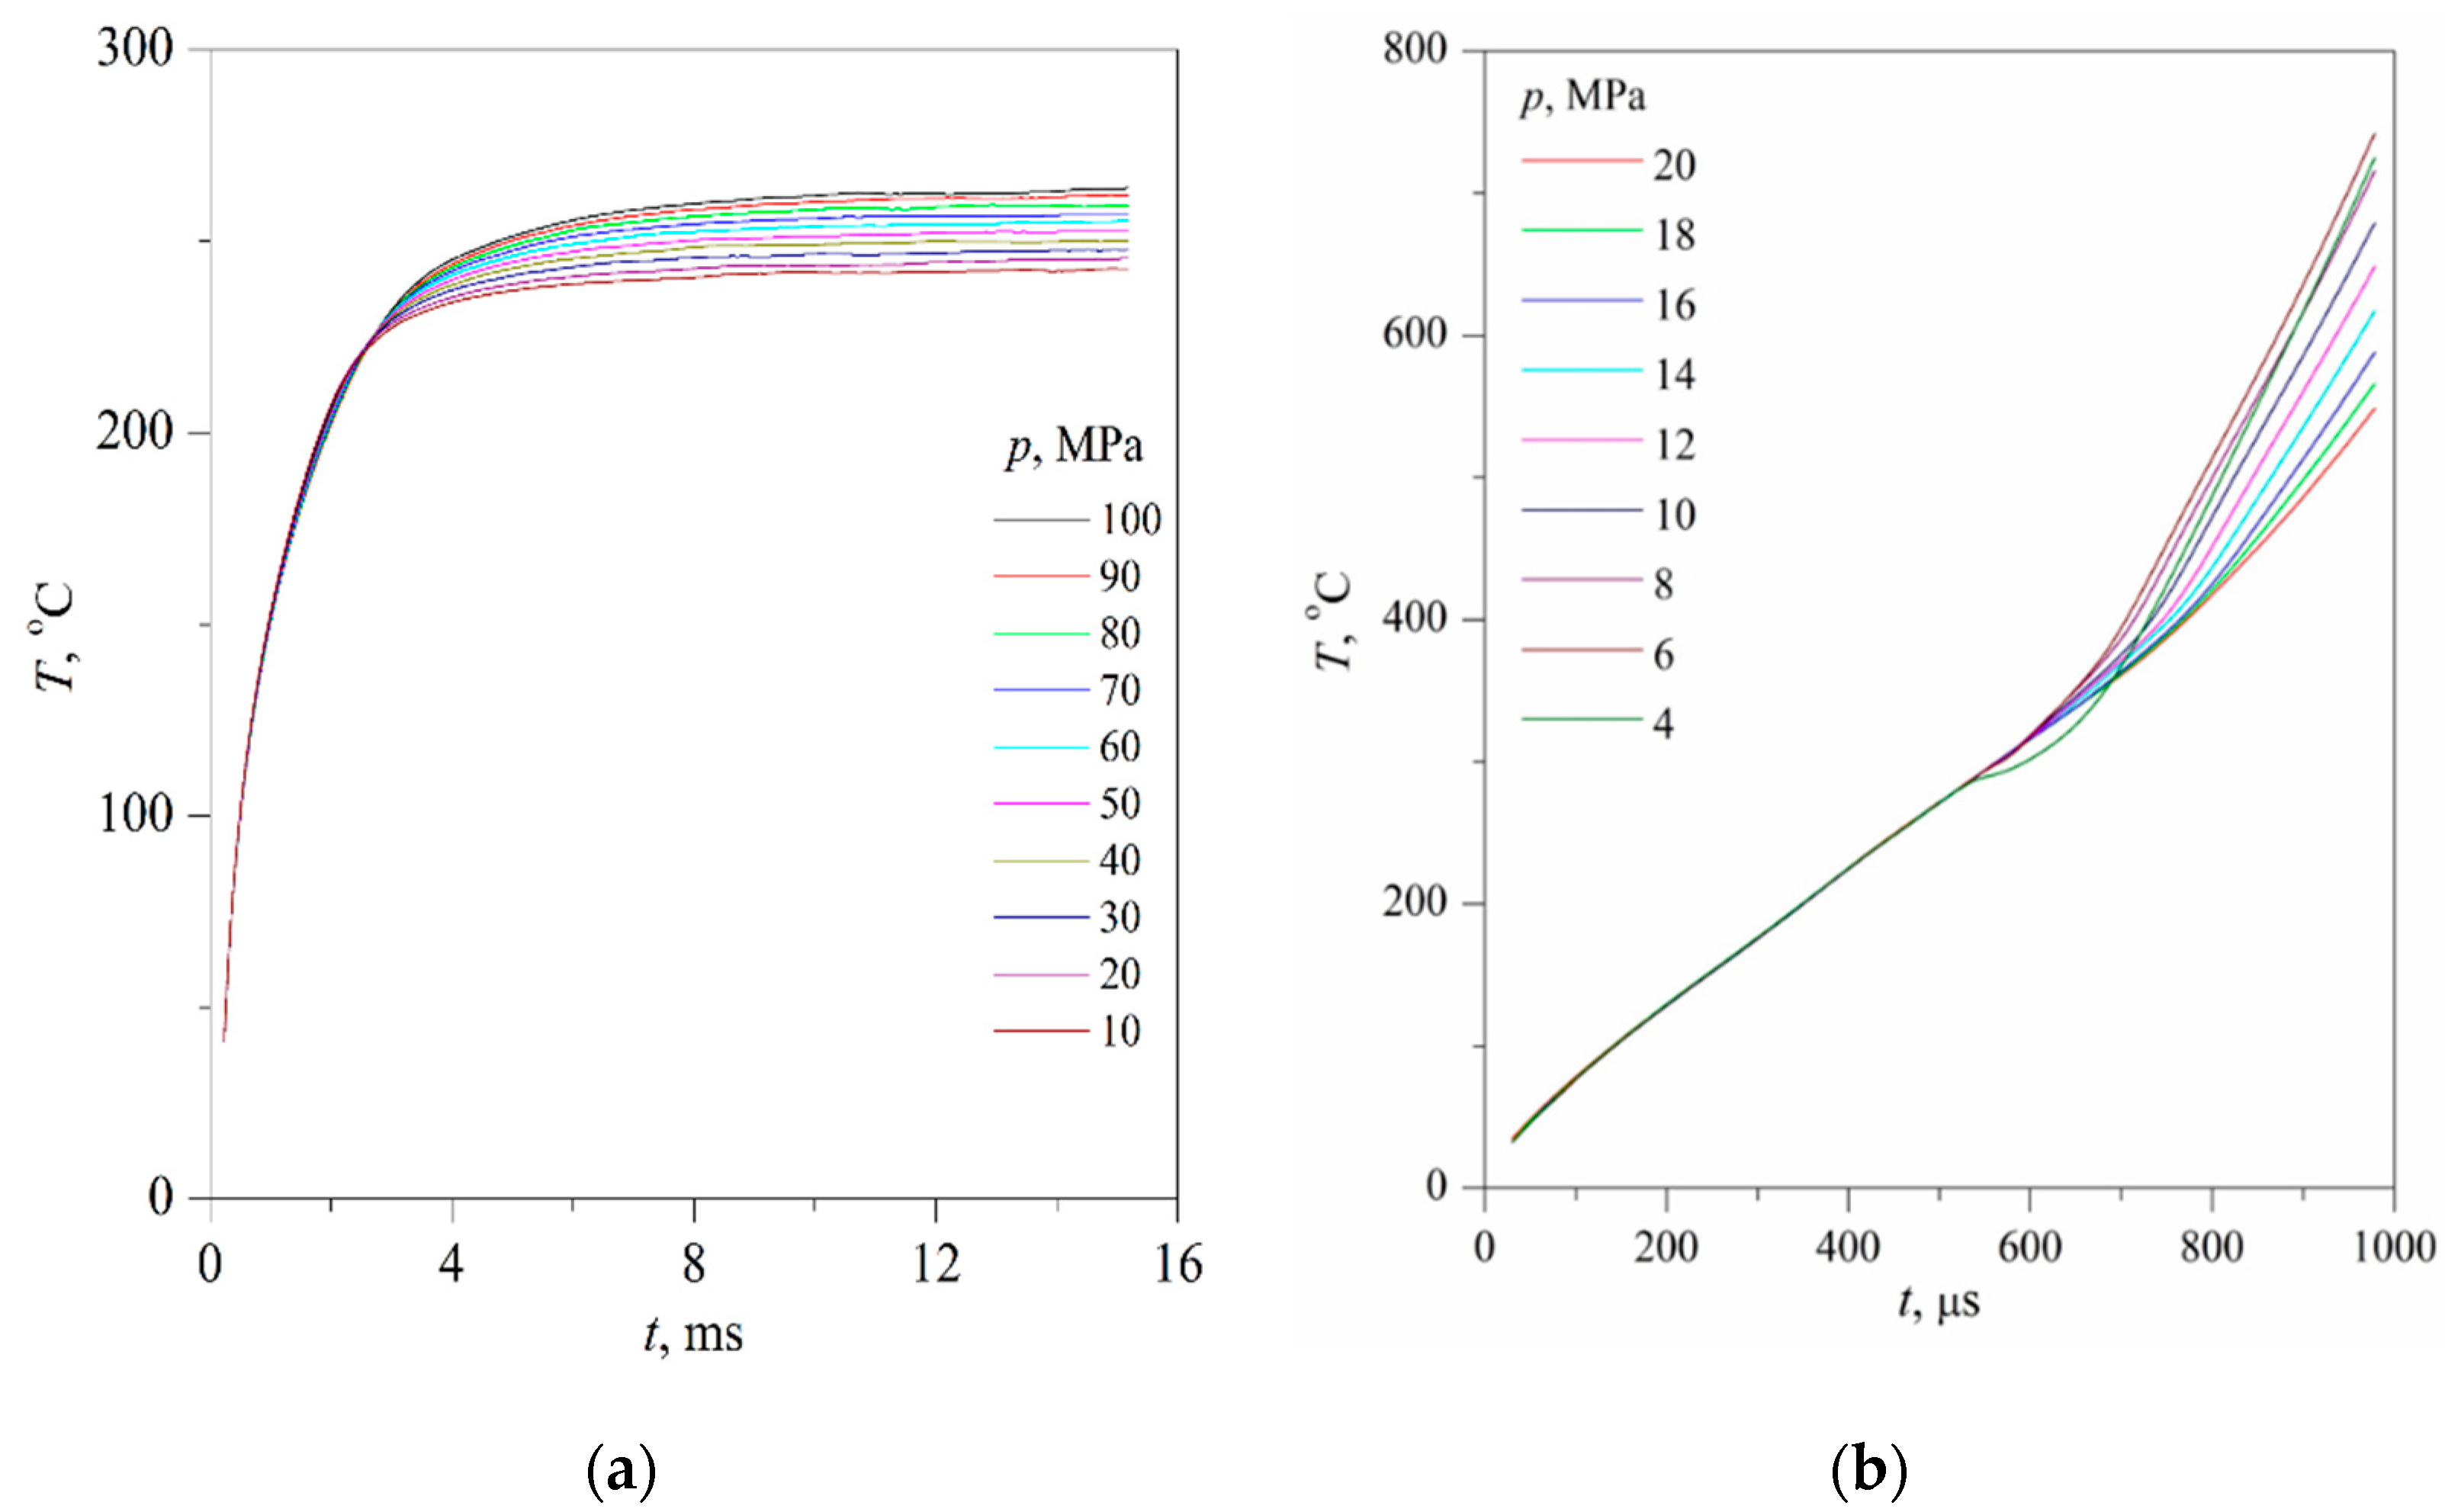
Figure 8.
Derivatives of probe temperature with respect to time for the solution (see Figure 7) under the constant power mode (a) and the constant current mode (b). The arrows show the estimated timing of the spinodal decomposition onset for two selected isobars. Here and below, the dotted line (right Figure) shows the corresponding curve for pure water obtained under comparable heating conditions.

Figure 9.
The second derivatives of the probe temperature with respect to time for the solution (see Figure 7) under the constant power mode (a) and the constant current mode (b).
Figure 9.
The second derivatives of the probe temperature with respect to time for the solution (see Figure 7) under the constant power mode (a) and the constant current mode (b).

Figure 10.
Heating curves for the aqueous solution of MBE at the constant current mode and their derivatives (see the insert) with respect to time. The pressure serves as a parameter; the apparent critical pressure is evaluated at 12.75 MPa. The dashed lines show the values of the lower and upper critical solution temperatures.
Publisher’s Note: MDPI stays neutral with regard to jurisdictional claims in published maps and institutional affiliations. |
© 2021 by the authors. Licensee MDPI, Basel, Switzerland. This article is an open access article distributed under the terms and conditions of the Creative Commons Attribution (CC BY) license (https://creativecommons.org/licenses/by/4.0/).
Share and Cite
MDPI and ACS Style
Igolnikov, A.; Rutin, S.; Skripov, P. Investigation of Binary Liquids in Unstable States—An Experimental Approach. Liquids 2021, 1, 36-46. https://0-doi-org.brum.beds.ac.uk/10.3390/liquids1010003
AMA Style
Igolnikov A, Rutin S, Skripov P. Investigation of Binary Liquids in Unstable States—An Experimental Approach. Liquids. 2021; 1(1):36-46. https://0-doi-org.brum.beds.ac.uk/10.3390/liquids1010003
Chicago/Turabian StyleIgolnikov, Alexander, Sergey Rutin, and Pavel Skripov. 2021. "Investigation of Binary Liquids in Unstable States—An Experimental Approach" Liquids 1, no. 1: 36-46. https://0-doi-org.brum.beds.ac.uk/10.3390/liquids1010003