
Are COVID-19 Data Reliable? A Quantitative Analysis of Pandemic Data from 182 Countries


1
School of Business and Management, IU International University of Applied Sciences, 10247 Berlin, Germany
2
Sydney Medical School, Nepean Clinical School, University of Sydney, Sydney, NSW 2747, Australia
*
Author to whom correspondence should be addressed.
COVID 2021, 1(1), 137-152; https://0-doi-org.brum.beds.ac.uk/10.3390/covid1010013
Submission received: 17 June 2021
/
Revised: 3 July 2021
/
Accepted: 7 July 2021
/
Published: 16 July 2021
Abstract
:When it comes to COVID-19, access to reliable data is vital. It is crucial for the scientific community to use data reported by independent territories worldwide. This study evaluates the reliability of the pandemic data disclosed by 182 countries worldwide. We collected and assessed conformity of COVID-19 daily infections, deaths, tests, and vaccinations with Benford’s law since the beginning of the coronavirus pandemic. It is commonly accepted that the frequency of leading digits of the pandemic data shall conform to Benford’s law. Our analysis of Benfordness elicits that most countries partially distributed reliable data over the past eighteen months. Notably, the UK, Australia, Spain, Israel, and Germany, followed by 22 different nations, provided the most reliable COVID-19 data within the same period. In contrast, twenty-six nations, including Tajikistan, Belarus, Bangladesh, and Myanmar, published less reliable data on the coronavirus spread. In this context, over 31% of countries worldwide seem to have improved reliability. Our measurement of Benfordness moderately correlates with Johns Hopkin’s Global Health Security Index, suggesting that the quality of data may depend on national healthcare policies and systems. We conclude that economically or politically distressed societies have declined in conformity to the law over time. Our results are particularly relevant for policymakers worldwide.
1. Introduction
The World Health Organization’s (WHO) announcement on 10 January 2020 [1] confirmed first cases of the novel coronavirus—also known as COVID-19 or SARS-CoV-2—in Wuhan City, China, on 31 December 2019. After eighteen months, the world now faces millions of incidents, and a tidal wave of data on COVID-19 spread has emerged. Since the beginning of the pandemic, all countries affected by the virus unanimously reported two metrics, “New Cases”—individuals testing positive for the virus, and “New Deaths”—the number of death incidents due to infection with the virus [2]. After introducing COVID-19 tests, countries commenced reporting “New Tests”—the number of daily tests conducted. The emergence of the COVID-19 vaccines by pharmaceutical companies enabled national vaccination programs. As such, “New Vaccinations”—the number of people vaccinated daily—were reported by countries that adapted their preventive measures against the deadly virus. Today, we know that the pandemic’s growth follows the logistic law [3].
There is no doubt that access to reliable data is vital for the fight against the pandemic. Scientists typically develop new insights based on publicly available data. Restricting interventions colloquially known as lockdowns, travel bans, and flying restrictions have been implemented by many governments in numerous countries around the world. It is for this reason that public confidence in data is vital for the effective implementation of these interventions and policies. Public doubts about the credibility of COVID-19 data can cause a sluggish response to the pandemic in the beginning or, in the worst-case, civil disobedience [2].
Several researchers conducted forensic studies on COVID-19 data. Koch and Okamura [4] confirmed the reliability of the official data coming from COVID-19 flashpoints, the United States, China, and Italy. Idrovo and Manrique–Hernández likewise proved China’s conformity to the law [5]. Jackson and Sambridge [6] assessed data from 51 countries from 16 January 2020 to 9 April 2020, providing some evidence for the overall reliability of COVID-19 data worldwide. Wei and Vellwock studied the pandemic data from over twenty hot spots. They confirmed the Benfordness of few countries, such as the US, Spain, the UK, France, China, Belgium, Pakistan, and Italy. Russia and Iran were identified as clear violators of the law [7]. Lee et al. discovered that Japan did not provide reliable data [8]. According to Isea, China, Germany, Brazil, Venezuela, Norway, South Africa, Singapore, Ecuador, Egypt, Ireland, France, Australia, Colombia, India, Russia, and Croatia comply with the law. However, Italy, Portugal, Netherlands, the UK, Denmark, Belgium, and Chile did not pass three tests carried out [9]. In the most extensive study of COVID-19 data, Farhadi investigated over 100,000 integers from 154 countries and applied three goodness-of-fit measures [2]. Approximately 28% of countries adhered well to the anticipated distribution frequency, while six countries disclosed fully undependable data. Farhadi recommended replicating the very same study by applying additional tests based on larger sets of observations at a later point in time. Clearly, extending the timeframe and improving the statistical measurement shall add value to the body of knowledge. Table 1 summarizes the main characteristics of the prior research into the COVID-19 data reliability.
To this point, the previous studies on COVID-19 data faced two major challenges: (a) inconsistent data typically limited to a small sample size and (b) inconsistent application of various statistical techniques to evaluate the reliability of the data [2,3,4,5,6,7,8,9]. Our primary rationale is to overcome the prior limitations and provide a comprehensive assessment of the most recent data. Hence, we aim to assess Benfordness by extending the number of statistical tests and maximizing the timeframe of the analysis to over eighteen months since the beginning of the COVID-19 pandemic.
2. Method
2.1. Benford’s Law and Goodness-of-Fit Tests
Benford’s law (BL), also known as “the law of the first digits,” is a widely known technique for the detection of data manipulation and fraud. Its core idea relates to the frequency of leading digits in naturally generated datasets. The idea relies on Newcomb’s findings of 1881, which addressed the probabilities of first-digit numbers by the Equation (1) [10]:
According to BL, the leading digits of numbers follow a particular logarithmic pattern: 30.1% for one, 17.6% for two, 12.5% for three, 9.7% for four, 7.9% for five, 6.7% for six, 5.8% for seven, 5.1% for eight, and 4.6% for nine [10,11]. See Table 2.
In an artificially generated dataset, the frequencies diverge from the BL distribution. Benfordness can only be applied to data with a geometrical tendency and characterized by the non-existence of minima and maxima. BL is common practice in social sciences and has been applied in various disciplines, such as finance and accounting [12,13,14], politics [15,16], and pandemics [2,3,4,5,6,7,8,9]. The body of knowledge is built on different goodness-of-fit tests to assess the divergence of the observed and expected frequencies. The techniques commonly used are Kolmogorov-Smirnov statistic, Chi-square, Euclidean distance, Mean Absolute Deviation, z-values, and Sum of Squared Difference.
The Kolmogorov–Smirnov statistic (K-S) is a non-parametric test for discrete data and quantifies the empirical distance between the observed and expected frequencies [17,18]. The K-S statistic was frequently applied to detect potential anomalies and incompliance of data in prior research [2,5]. Manipulation is evident if the K-S statistic is greater than the square root of the total number of the leading digits observed in a probability sample (cut-off). Once the K-S statistic is identified, the null hypothesis can be accepted, if: . The is calculated as , where is the cumulative observed distribution, and F is Benford’s cumulative distribution. Considering the critical value at a 5% significance, K is set to 1.36; for a 1%, K is set to 1.63 [2,17]. The non-parametric K-S test is distribution-free and more powerful when the sample size is small [2,17]. This technical characteristic is of particular importance in the case of small samples of epidemics. The K-S statistic is one of the most precise techniques to assess BL reliability in the context of COVID-19 data [17].
Another prevalent technique is the Pearson’s chi-square ( goodness-of-fit test with a confirmatory null hypothesis [7,9,19]. It is common knowledge that the test is sensitive to the sample size and cannot make reliable inferences when the dataset consists of 5000 observations or more [2,19]. Principally, if the sample size is too big, the null hypothesis will likely be rejected (even if there is no significant difference between the actual and expected subsets). For a small sample size, encounters difficulties in measurement as well. The test is computed as follows, cf. Equation (2):
As a less sensitive technique to the sample size, researchers apply the d-factor (d*), which is calculated by the Equation (3):
where and are the observed and expected frequencies [2,7,19]. The d* ultimately measures the Euclidian distance between the measured and expected frequencies of leading digits. The d* quantifies the distance between the sample and the cumulative distribution function of the reference dataset after normalization by 1.03606, the maximum possible distance [19]. A d-factor (d*) equal to 0.0 suggests full conformity to BL, while the highest Euclidian distance, d* = 1.0, signifies full non-conformity. A d* above 0.2 indicates non-conformity with the law [2,7,19].
In this study, we further apply additional tests, i.e., Mean Absolute Deviation (MAD) and Sum of Squared Difference (SSD), which are less dependent on the sample size [20,21,22]. The Equation (4) shows the MAD calculation as the average absolute deviation of observed and expected frequencies:
SSD takes the sum of the squares of the deviation of each digit’s frequency from the expected frequency of BL [22]. SSD is calculated by the Equation (5):
For both the MAD and SSD statistics, k is the number of leading digit bins, and are the observed and expected Benford’s frequencies. A and an indicate non-conformity with the law [21,22].
In order to be consistent with prior research, we postulate the following null hypothesis for all countries in scope—mainly, H0: COVID-19 data from Ji adhere to BL, where Ji stands for individual jurisdiction in the scope. We operationalize the statistical measures and goodness-of-fit tests based on a 0.05 significance level.
2.2. COVID-19 Data Sampling
Consistent with the extant body of knowledge, we desire a sample size of 1000 observations or larger for each country (also referred to jurisdiction or territory), although the minimum threshold for the analysis of the BL compliance is not specified in the body of knowledge. The measurement of Benfordness makes only sense if the COVID-19 samples are not too small. Small datasets cannot detect nonconformities to BL. The quality of the assessment rises if the sample size and range of the underpinning dataset grow.
This study employs the theory based on the largest dataset available from over 182 countries worldwide. We collected a sample from the COVID-19 database by the Centre for Systems Science and Engineering at Johns Hopkins University and Our World in Data [23]. repository; our dataset includes daily observations, such as New Cases, New Deaths, New Tests, and New Vaccinations. By adding new variables to the COVID-19 observed samples, i.e., “New Tests” and “New Vaccinations,” (which were technically not available) our study incorporates the most comprehensive dataset on SARS-CoV-2 globally. We collected 216,378 integers, which were reported by 182 countries from 21 January 2020 to 6 June 2021. We use “New Vaccinations” as additional measure, which was technically not reported and available in prior research [6]. We also documented leading digits of 86,917 new cases, 77,137 new deaths, 42,322 new tests, and 10,092 new vaccinations worldwide. Small samples of seven jurisdictions (), including the Vatican and Tanzania, were removed from our analysis. Small samples cannot detect non-conformity to the law. Our final dataset consists of 176 countries with about 873 COVID-19 related observations on average.
3. Results
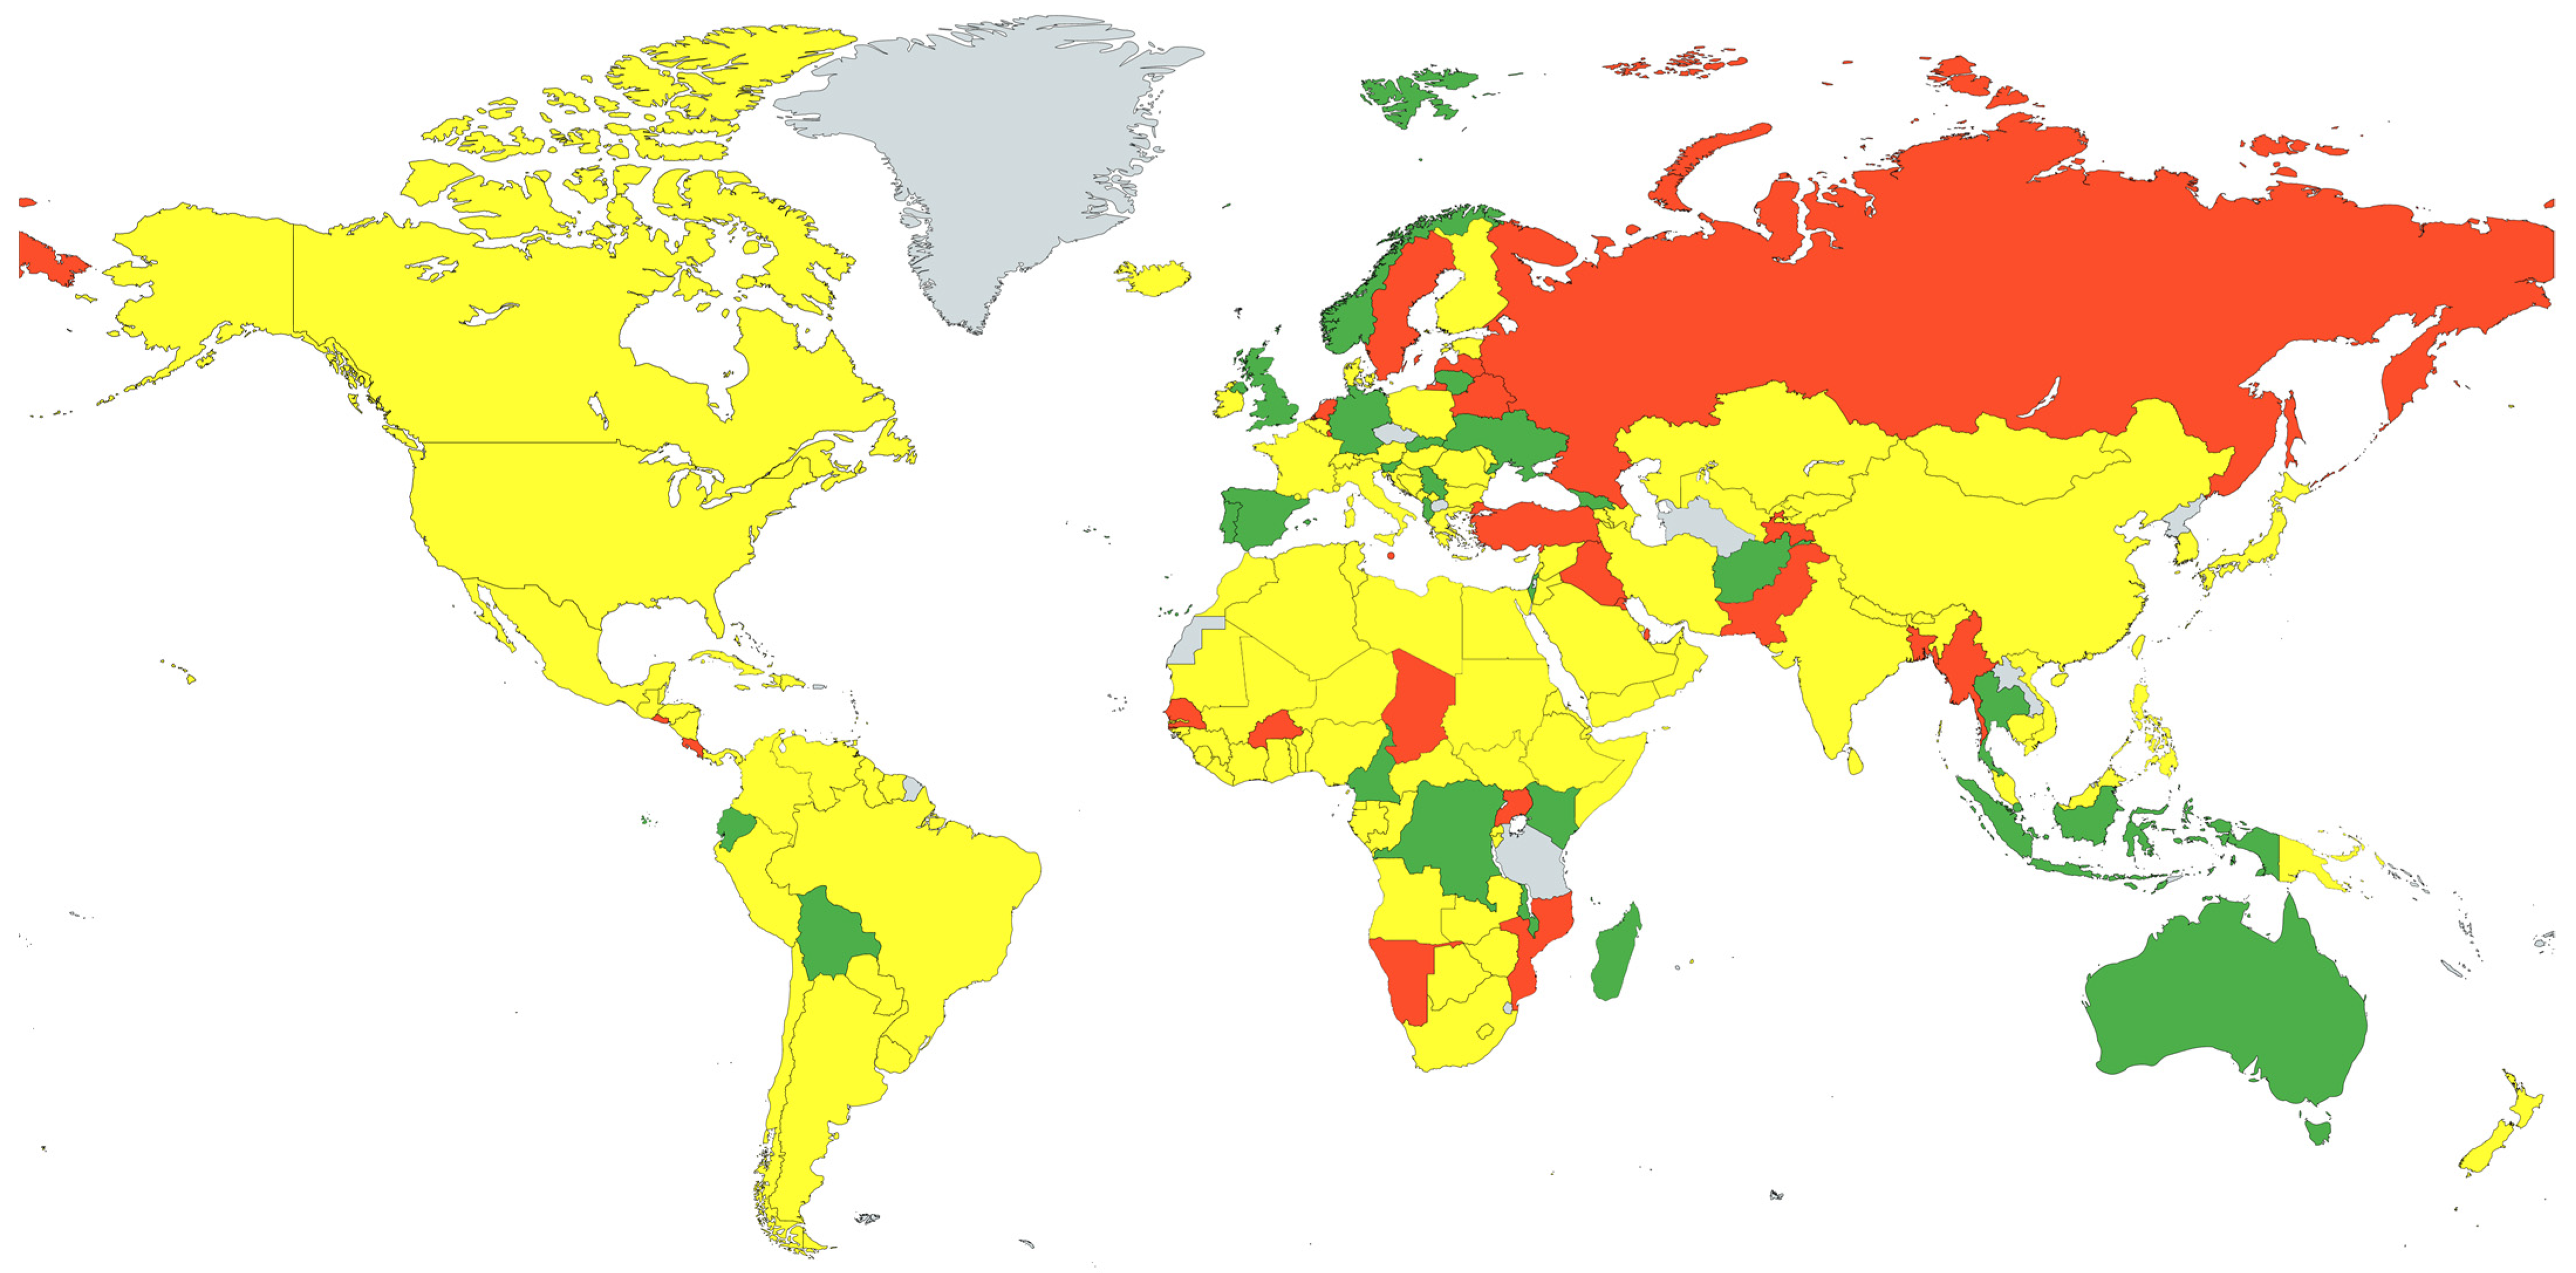
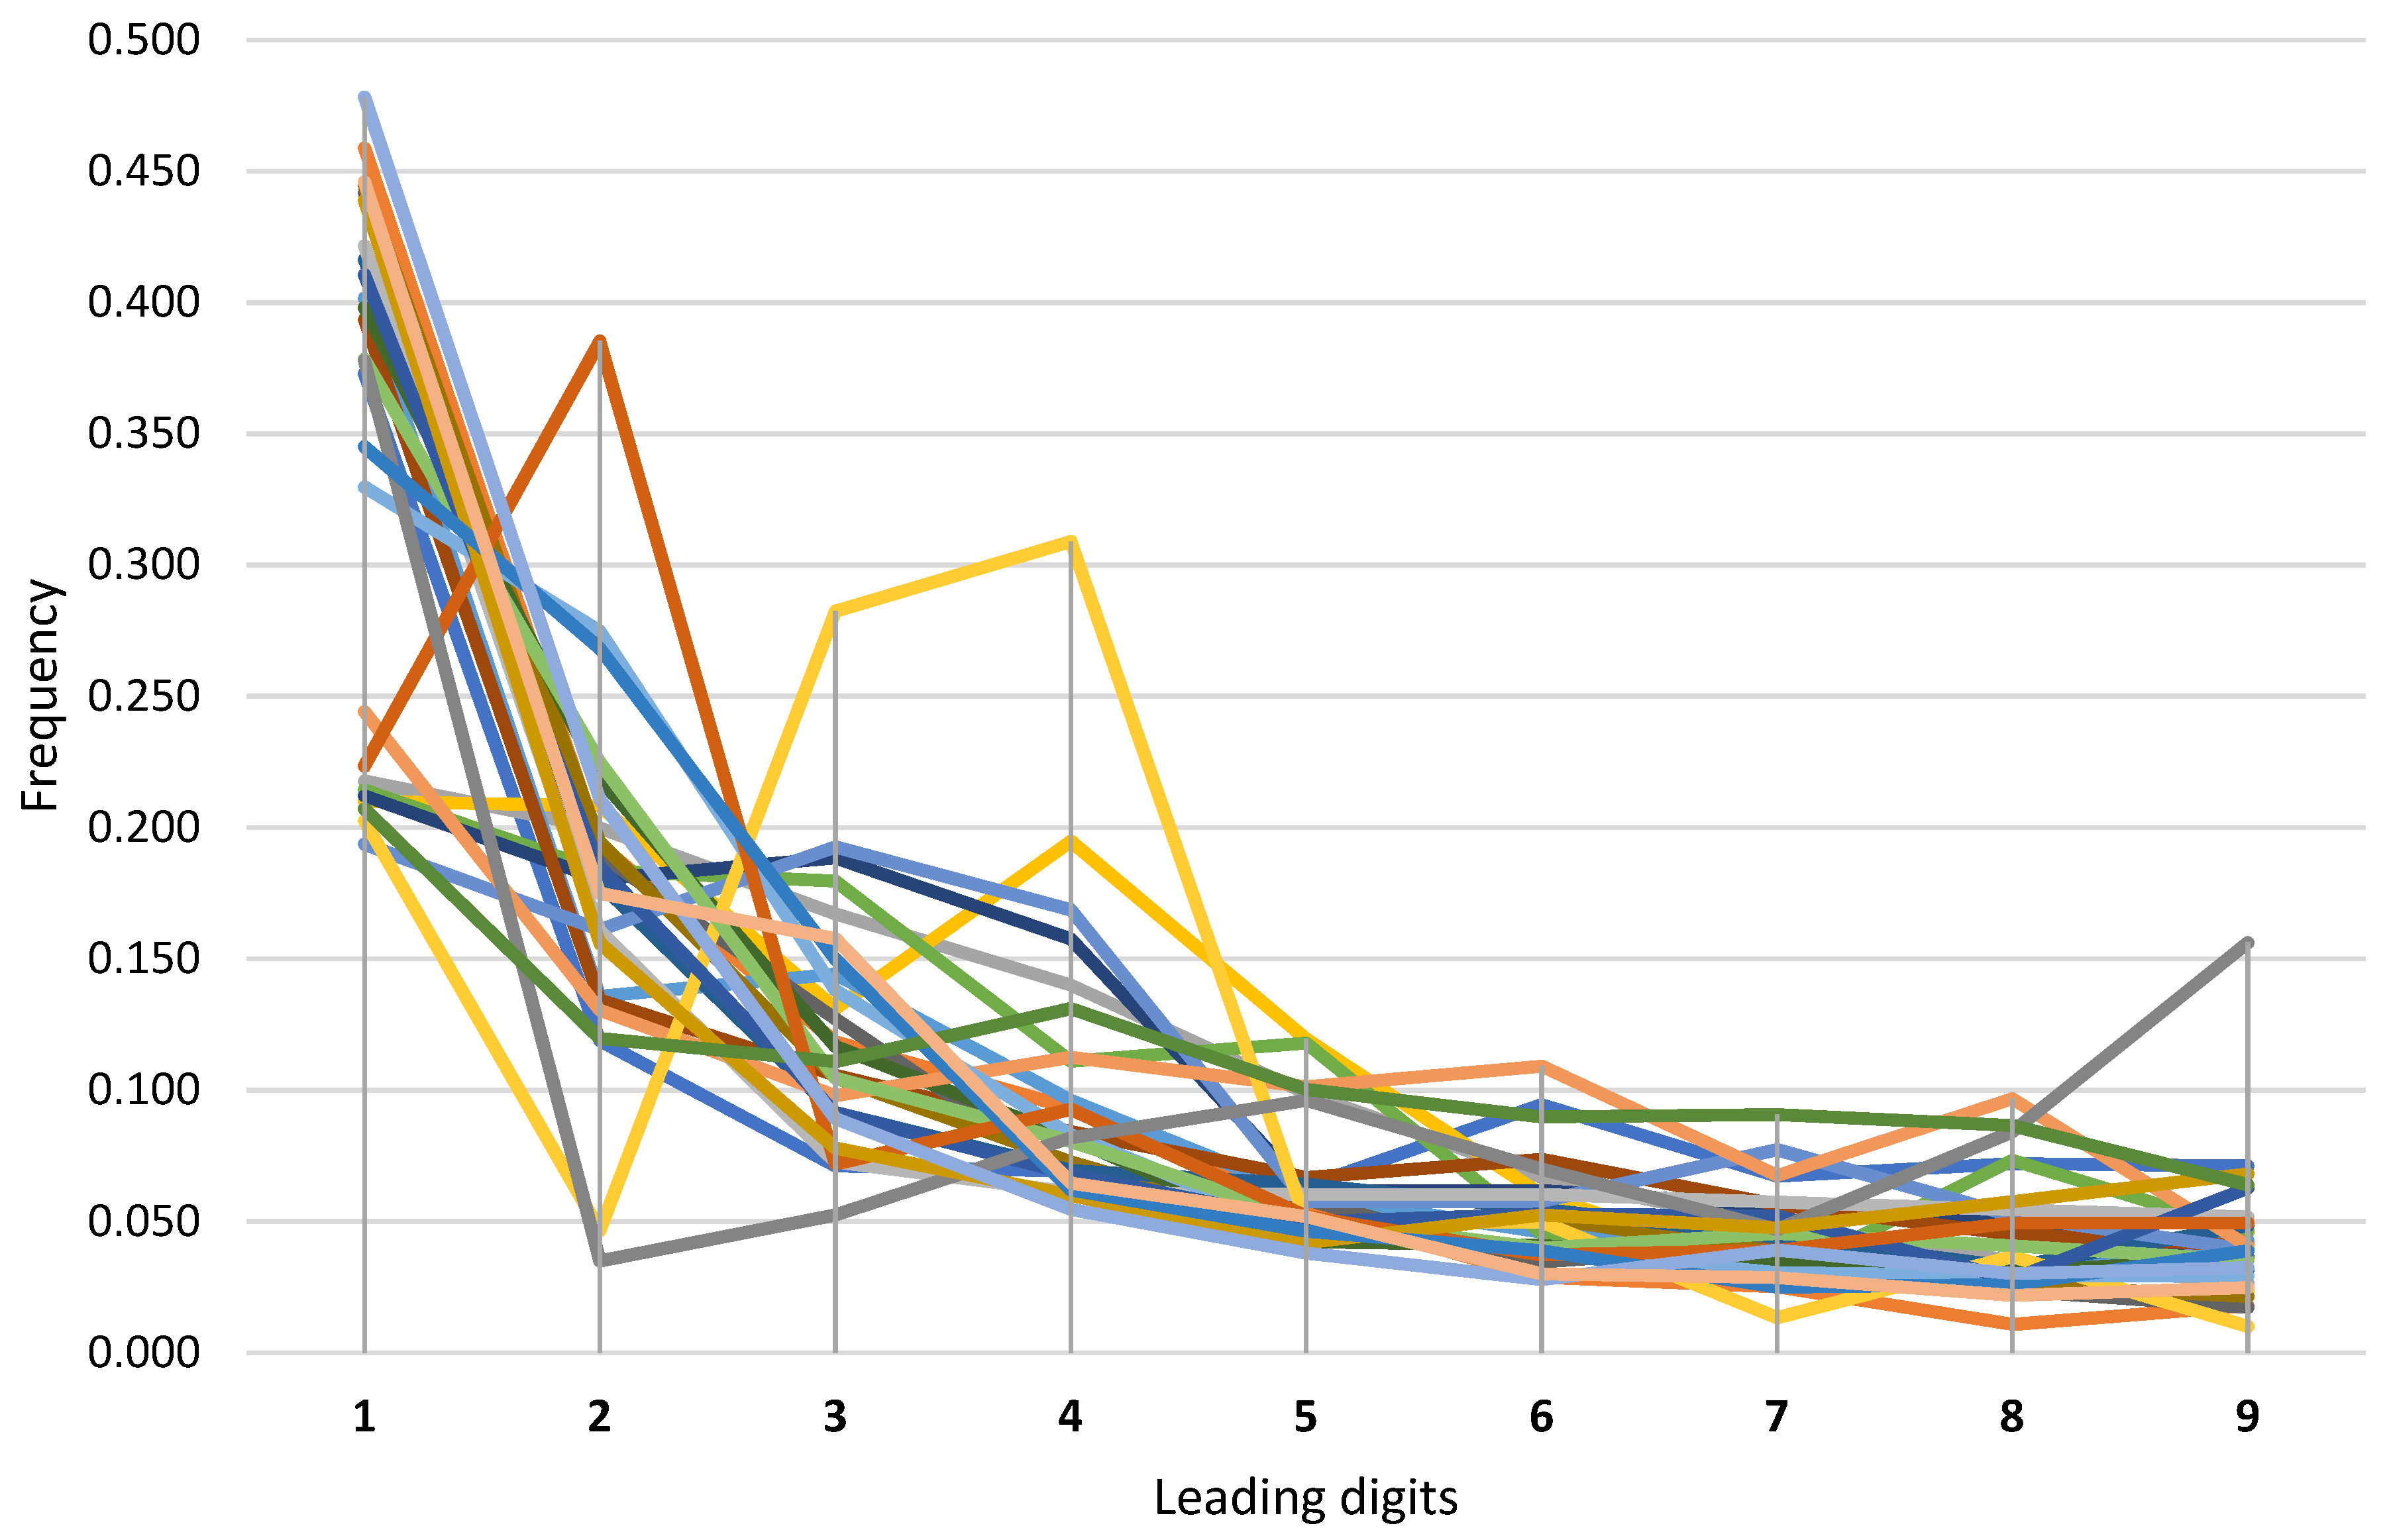
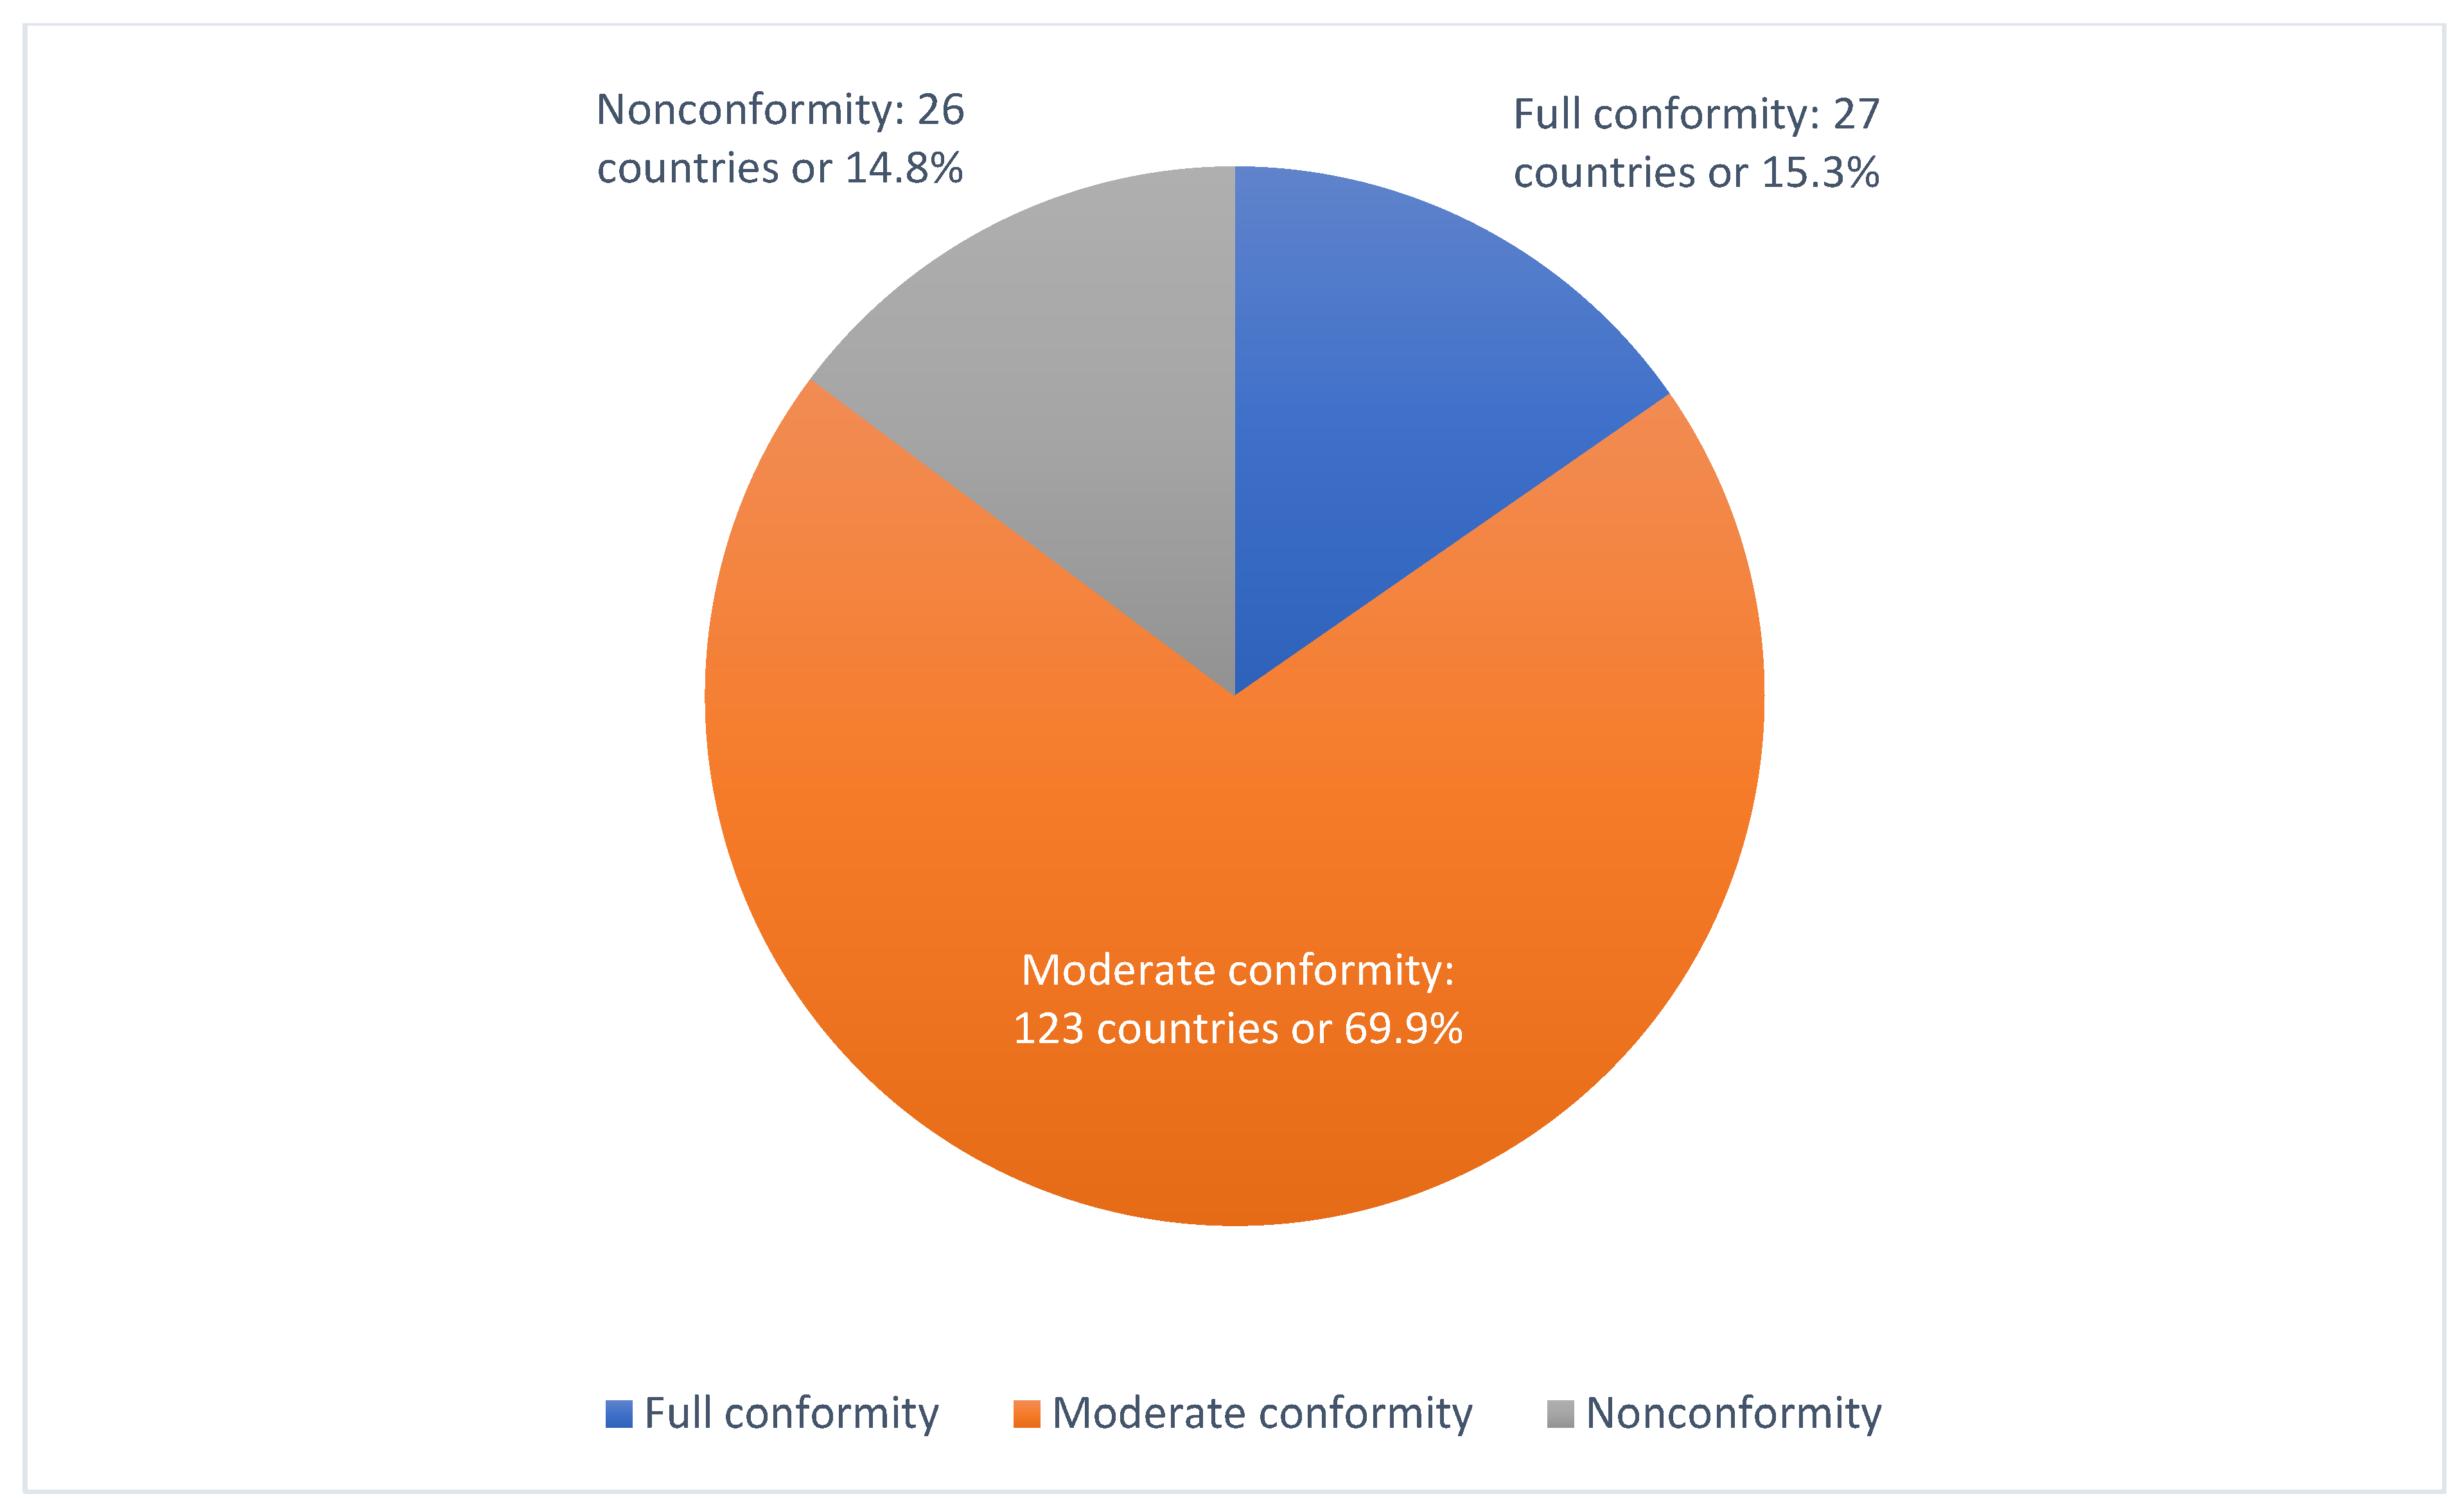
For each country, we evaluated the consistency of the pandemic data’s leading digits with BL. We operationalized the goodness-of-fit tests, K-S, , d*, MAD, and SSD at a significant level. 32% of countries worldwide showed evident improvements in Benfordness, while 68% demonstrated non-conformity with BL. The results are coded as a global map (see Figure 1). As emphasized in Figure 2, twenty-seven countries (or 15.3%) disclosed data that fully comply with the law (green countries in Figure 1). For these countries, we accept the null hypothesis based on all tests. Twenty-six countries (or 14.8%) did not meet the requirements of BL tests based on all measures (see Figure 3). These jurisdictions failed to pass all goodness-of-fit tests. We rejected the null hypothesis for these jurisdictions, which are highlighted red on our global map. Notably, 123 countries or 69.9% demonstrated partial compliance with BL as they could pass at least one of the goodness-of-fit tests, flagged yellow (see Figure 4). Grey areas were excluded in our analysis as they do not offer a sufficient sample size. Figure 5 summarizes the global distribution of COVID-19 Benfordness.
Table 3 summarizes the results of the statistical analyses for all countries. The K-S, MAD, and statistics reveal similar patterns, while Euclidean distance does not always flag non-conformity to BL. According to the K-S statistics, the most substantial evidence for abnormalities regarding BL was found with Bangladesh with : 0.037 and : 0.177 at a 5% confidence level, followed by Myanmar and Kuwait. Based on the test, we specifically recognized Bangladesh with the most notable non-conformity (n: 1332; χ2: 177.155; p < 0.000). See Table 4 for the list of abbreviations.
In line with prior research [7,16,23], a Euclidean distance above 0.2 can be considered an indicator of BL non-conformity. In this context, Tajikistan showed by far the largest distance from Benford’s proportions according to the Euclidean statistic (, followed by El Salvador (, Nicaragua and Timor (. Similarly, the very same countries, Tajikistan, Belarus, Nicaragua, and El Salvador, elicited large MAD and SSD statistics. Corresponding to the previous measures with a and an Tajikistan was ranked one for non-conformity to the law in our assessment. Tajikistan, Belarus, and El Salvador failed to confirm the null hypothesis based on all goodness-of-fit tests (see Table 3). It is noteworthy to emphasize that the null hypothesis can be confirmed for the UK, Spain, Australia, Israel, and Germany, as well as twenty-two nations. According to the K-S statistics, the UK (n: 1358, cut-off: 0.037, K-S: 0.015) and Australia (n: 878, cut-off: 0.046, K-S: 0.021) disclosed the most reliable data worldwide.
4. Conclusions
Can we rely on COVID-19 data? To address the central question of this study, we investigated data from 182 countries worldwide. To improve the accuracy of the statistical measurements, we applied five statistical tests. Farhadi applied K-S, chi-square, and d* statistics in a timeframe of nine months [2]; Koch and Okamura used the Kuiper test (a modified K-S test), chi-square, and d* for [4]; Wie and Vellwock operationalized d* statistics for circa eight months [7]. The results confirm that 15.34% of countries do not adhere to BL at all. This is, to some extent, in agreement with prior research [2,3,4,5,6,7,8,9]. Most European countries, except Latvia, Luxembourg, the Netherlands, and Sweden, demonstrated conformity by satisfying at least one of the tests. This is also true for the Americas and APAC regions. Apparently, the US revealed a declining pattern of BL reliability. Remarkably, the UK (n: 1358, d*: 0.022; K-S: 0.015), Australia (n: 878, d*: 0.025, K-S: 0.021), Spain (n: 690, d*: 0.026, K-S: 0.028), and Israel (n: 1335, d*: 0.028, K-S: 0.026) overwhelmingly conform to BL. This group could evidently maintain or improve the quality of COVID-19 incident reports compared to prior research; in a nine-month study of COVID-19 data, Farhadi identified the following measures for the UK (n: 593, d*: 0.076; K-S: 0.051), Australia (n: 497, d*: 0.029, K-S: 0.031), Spain (n: 353, d*: 0.086, K-S: 0.074), and Israel (n: 597, d*: 0.081, K-S: 0.087) [2]. This development goes in line with the organizational learning theory suggesting that proficiency in the fight against pandemics grows by gaining experience in managing pandemics over time. These countries introduced advanced programs to counter the epidemic within their national borders, such as non-pharmaceutical measures (lockdowns, travel bans, and social distancing) or progressive vaccinations. Consistent with Farhadi’s results, Germany was able to maintain the BL reliability (n: 911, d*: 0.040; K-S: 0.043 as of June 6, 2021, versus n: 408, d*: 0.032; K-S: 0.026 as of September 22, 2020). The US, which was identified as one of the champions of Benfordness by Farhadi, could partially pass the goodness-of-fit tests. With a non-confirmatory K-S-statistic (n:1389, cut-off: 0.036, K-S: 0.050), the null hypothesis for the US was rejected based on one test in our study. This suggests a decreased Benfordness of the US data over the past nine months from 24 February 2020 to 6 June 2021. Similarly, China conformed to BL in prior studies [2,4,5,24]; according to our results, however, China with 572 observations did not pass three tests applied in our evaluation.
Furthermore, 14.8% of the countries did not pass any of the tests applied in this study. Therefore, we rejected the null hypothesis for these cases. The most significant irregularities occurred in Tajikistan, Belarus, Myanmar, Turkey, Bangladesh, and El Salvador. In January 2021, Tajikistan declared itself COVID-19 free, which explains the lack of BL conformity in our assessment [25]. Distressed social-economic conditions can explain the poor reliability of pandemic data in Belarus and Myanmar [26,27]. Experts posit that Bangladesh has seen a decline in COVID-19 incidents as it reduced the number of tests affecting the recorded infection rates [28]. Turkey, which could not pass any goodness-of-fit test in our study, strives for a speedy recovery of its suffering hospitality industry [29]. It is noteworthy that 70% of El Salvador’s population work in an informal economy [30]. These distressed countries have been facing major economic, social, or political challenges during the course of the pandemic.
Notably, Johns Hopkins University (JHU) studied national capabilities, procedures, systems, and policies to respond to epidemic challenges across 195 countries [24]. Considering the Global Health Security Index of JHU (GHSI), we recognize consistency in the case of Tajikistan, ranked 144 for early detection and reporting. However, Latvia remains questionable. As a former member of the Soviet Union, it was placed second in the GHSI after the US and Australia; surprisingly and contrary to the JHU’s results, Latvia significantly violates BL. This was also confirmed in prior research [2]. Furthermore, JHU identified the highest scores for “early detection and reporting for epidemics of potential international concern” for the countries with significant BL conformity, such as Australia (ranked 2nd), the UK (ranked 6th), Germany (ranked 10th), or Spain (ranked 7th). However, countries with poor BL conformity demonstrated much weaker epidemic reporting capabilities worldwide. We conducted Farhadi’s approach [2], and in a further attempt, operationalized Pearson’s product-moment correlation analysis to explore the relationship between the GHSI scores and the goodness-of-fit tests. Preliminary analyses were conducted to ensure no violation of assumptions of normality, linearity, and homoscedasticity. We identified a negative partial correlation between the GHSI score and K-S statistic, which suggests correlation at a moderate level (r: −0.27, n: 176, p < 0.0005) that all countries with a high GHSI score provide reliable COVID-19 data. Our results are consistent with prior investigations [2].
Contradictions with the law may be an indicator of data manipulation or the act of creating artificially fabricated data [2,3,4,5,6,7,8,9]. If so, there is a strong need to understand the actual numbers of the death cases. Irregularities with BL may pertain to varying national policies and limited preventing capacity to detect and report COVID-19 incidents; the WHO claimed early on that some nations do not have sufficient access to testing kits [31]. To effectively fight the spread of any disease in the future, we recommend establishing global governance for pandemic measurement [2,32,33]. Having access to reliable data is vital in the fight against disastrous pandemics and submicroscopic infectious organisms.
5. Future Research
In our study, we identified tangible improvements in the quality of pandemic data, as well as diminishing data reliability in the context of COVID-19 data in several countries worldwide. It is of particular importance to understand the formative indicators and causality of these developments. To address this issue accurately, one shall further examine the economic, political, and social conditions of these jurisdictions and the impact of the COVID-19 pandemic on Benfordness. In the case of the red-flagged countries, we still need to gain a deeper understanding of the domestic healthcare processes and epidemic reporting policies. Based on the key results of this study, the authors recommend reproducing the forensic BL assessment in a later re-examination of the pandemic data. Ensuring BL reliability may be a fundamental step in the fight against epidemics in general, as well as COVID-19 in particular. We further recommend investigating the regressive and correlative relationships of our results with the social-political and economic transformation indices, e.g., the Bertelsmann Transformation Index (or BTI). Through this approach, evidence may be found for a causal relationship between the social-economic and political variables and the phenomenon of BL non-conformity of epidemic data. Ultimately, we hope to have contributed to the combat against SARS-CoV-2 with this paper.
6. Limitation
The data gathered from all countries in our study are affected by diverging public health systems and data reporting policies. Lack of common policies for reporting on a global basis, particularly in developing countries, may have affected the efficiency and effectiveness of COVID-19 reports.
Author Contributions
Conceptualization, N.F.; methodology, N.F.; software, N.F.; validation, N.F., H.L.; formal analysis, N.F.; investigation, H.L.; resources, H.L.; data curation, N.F., H.L.; writing—original draft preparation, N.F.; writing—review and editing, N.F., H.L.; visualization, N.F.; project administration, N.F., H.L.; funding acquisition, N/A; Both authors have read and agreed to the published version of the manuscript.
Funding
This research received no external funding.
Institutional Review Board Statement
Not applicable.
Informed Consent Statement
Not applicable.
Data Availability Statement
Our data on confirmed cases and deaths come from the COVID-19 Data Repository by the Center for Systems Science and Engineering (CSSE) at Johns Hopkins University (see https://systems.jhu.edu, last accessed on 15 July 2021). Testing for COVID-19: this data is collected by the Our World in Data team from official reports (see https://ourworldindata.org/coronavirus-testing#which-countries-do-we-have-testing-data-for, last accessed on 15 July 2021). Vaccinations against COVID-19 data is collected by the Our World in Data (see https://github.com/owid/covid-19-data/blob/master/public/data/README.md, last accessed on 15 July 2021).
Conflicts of Interest
The authors declare no conflict of interest.
References
- World Health Organization. Coronavirus Disease (COVID-19) Outbreak; WHO: Geneva, Switzerland, 2020; Available online: https://www.who.int/emergencies/diseases/novel-coronavirus-2019 (accessed on 13 June 2021).
- Farhadi, N. Can we rely on Covid-19 data? An assessment of data from over 200 countries. Sci. Prog. 2021, 104, 1–19. [Google Scholar] [CrossRef] [PubMed]
- Castorina, P.; Iorio, A.; Lanteri, D. Data Analysis on Coronavirus Spreading by Macroscopic Growth Laws. Cornell University, 2020. Available online: https://arxiv.org/abs/2003.00507v3 (accessed on 13 June 2021).
- Koch, C.; Okamura, K. Benford’s Law and COVID-19 Reporting. 2020. Available online: https://papers.ssrn.com/sol3/papers.cfm?abstract_id=3586413 (accessed on 13 June 2021).
- Idrovo, A.J.; Manrique-Hernandez, E.F. Data Quality of Chinese Surveillance of 270 COVID-19: Objective Analysis Based on WHO’s Situation Reports. Asia Pac. J. Public Health 2020, 32, 165–167. [Google Scholar] [CrossRef] [PubMed]
- Sambridge, M.; Jackson, A. National COVID Numbers—Benford’s Law Looks for Errors. Nature 2020. Available online: https://0-www-nature-com.brum.beds.ac.uk/articles/d41586-020-01565-5 (accessed on 13 June 2021).
- Wie, A.; Vellwock, A.E. Is COVID-19 Data Reliable? A Statistical Analysis with Benford’s Law. 2020. Available online: https://www.researchgate.net/publication/344164702_Is_COVID-19_data_reliable_A_statistical_analysis_with_Benford%27s_Law (accessed on 13 June 2021).
- Lee, K.-B.; Han, S.; Jeong, Y. COVID-19 flattening the curve, and Benford’s law. Phys. A 2020. [Google Scholar] [CrossRef]
- Isea, R. How valid are the Reported Cases of People Infected with Covid-19 in the World? Int. J. Coronaviruses 2020, 1, 53–56. [Google Scholar] [CrossRef]
- Newcomb, S. Note on the Frequency of Use of the Different Digits in Natural 242 Numbers. Am. J. Math. 1881, 4, 39–40. [Google Scholar] [CrossRef] [Green Version]
- Benford, F. The Law of Anomalous Numbers. Proc. Am. Philos. Soc. 1938, 78, 551–572. [Google Scholar]
- Durtschi, C.; Hillison, W.; Pacini, C. The Effective Use of Benford’s law to assist in Detecting Fraud in Accounting Data. JFAR 2004, 5, 17–34. [Google Scholar]
- Grammatikos, T.; Papanikolaou, N.I. Applying Benford’s law to Detect Accounting 250 Data Manipulation in the Banking Industry. J. Financ. Serv. Res. 2021, 59, 115–142. [Google Scholar] [CrossRef]
- Cho, T.W.; Gaines, B.J. Breaking the (Benford) Law: Statistical Fraud Detection in Campaign Finance. Am. Stat. 2007, 61, 218–223. [Google Scholar]
- Roukema, B.F. A first-digit anomaly in the 2009 Iranian presidential election. J. Appl. Stat. 2014, 41, 164–199. [Google Scholar] [CrossRef] [Green Version]
- Furlan, L.V. Das Harmoniegesetz der Statistik: Eine Untersuchung uber die Metrische Interdependenz der Sozialen Erscheinungen. Verlag fur Recht und Gesellschaft; Verlag fur Recht und Gesellschaft: Basel, Switzerland, 1948. [Google Scholar]
- Simard, R.; L’Ecuyer, P. Computing the Two-Sided Kolmogorov–Smirnov Distribution. J. Stat. Softw. 2011, 39, 1–18. [Google Scholar] [CrossRef] [Green Version]
- Bushee, B. Benford’s Law. Wharton University, 2018. Available online: https://www.coursera.org/lecture/accounting-analytics/benfords-Law-3-6-oPSSY (accessed on 13 June 2021).
- Goodman, Q. The promises and pitfalls of Benford’s law. Significance 2016, 13, 38–41. [Google Scholar] [CrossRef]
- Nigrini, M.J. Benford’s Law Applications for Forensic Accounting, Auditing and Fraud Detection; Wiley Corporate, F&A: Hoboken, NJ, USA, 2012. [Google Scholar]
- Slepkov, A.D.; Ironside, K.B.; DiBattista, D. Benford’s Law: Textbook Exercises and Multiple-Choice Testbanks. PLoS ONE 2019, 10, e0117972. [Google Scholar] [CrossRef] [PubMed] [Green Version]
- Kossovsky, A.E. Benford’s Law: Theory, the General Law of Relative Quantities, and Forensic Fraud Detection Applications; World Scientific: Singapore, 2014. [Google Scholar]
- Dong, E.; Du, H.; Gardner, L. An interactive web-based dashboard to track COVID-19 in real time. Lancet 2020, 20, 533–534. Available online: https://www.thelancet.com/journals/laninf/article/PIIS1473-3099(20)30120-1/fulltext (accessed on 12 July 2021). [CrossRef]
- Johns Hopkins University. Global Health Security Index. 2019. Available online: https://www.ghsindex.org/ (accessed on 13 June 2021).
- Putz, C. If Only It Were That Easy: Tajikistan Declares Itself COVID-19 Free. The Diplomat. 2021. Available online: https://thediplomat.com/2021/01/if-only-it-were-that-easy-tajikistan-declares-itself-covid-19-free (accessed on 13 June 2021).
- Vector, D. What’s Happening in Belarus? Here Are the Basics. New York Times. 2021. Available online: https://www.nytimes.com/2021/05/26/world/europe/whats-happening-in-belarus.html (accessed on 13 June 2021).
- Cuddy, A. Myanmar Coup: What Is Happening and Why? BBC News. 2021. Available online: https://www.bbc.com/news/world-asia-55902070 (accessed on 13 June 2021).
- Deutsche Welle. Why Bangladeshis No Longer Fear the Coronavirus. 2021. Available online: https://www.dw.com/en/bangladesh-coronavirus-no-fear/a-55091050 (accessed on 13 June 2021).
- Yackley, A.J. Dollar Blow for Turkey as Tourism Season Runs into the Sand. Financial Times. 2021. Available online: https://www.ft.com/content/f7f4f65f-400d-437d-9ffa-e50fec485942 (accessed on 13 June 2021).
- Associate Press. El Salvador’s President Wants Bitcoin as Legal Tender. 2021. Available online: https://apnews.com/article/donald-trump-el-salvador-health-coronavirus-pandemic-technology-b1c08cae170aede89ea5cb41d97048cd (accessed on 13 June 2021).
- Farge, E. WHO to Start Coronavirus Testing in Rebel Syria; Iran Raises Efforts, Official Says. Available online: https://web.archive.org/web/20200316212446if_/https://www.reuters.com/article/us-health-coronavirus-mideast/who-to-start-coronavirus-testing-in-rebel-syria-iran-raises-efforts-official-says-idUSKBN2133PK (accessed on 13 June 2021).
- Alberti, T.; Faranda, D. On the uncertainty of real-time predictions of epidemic growths: A COVID-19 case study for China and Italy. Commun. Nonlinear Sci. Numer. Simul. 2020, 90, 105372. [Google Scholar] [CrossRef] [PubMed]
- Balsari, S.; Buckee, C.; Khanna, T. Which COVID-19 Data Can You Trust? Harvard Business Review. 2020. Available online: https://hbr.org/2020/05/which-COVID-19-data-can-you-trust (accessed on 13 June 2021).
Figure 1.
Reliability of COVID-19 data worldwide.

Figure 2.
Twenty-seven countries with the highest level of conformity with BL.
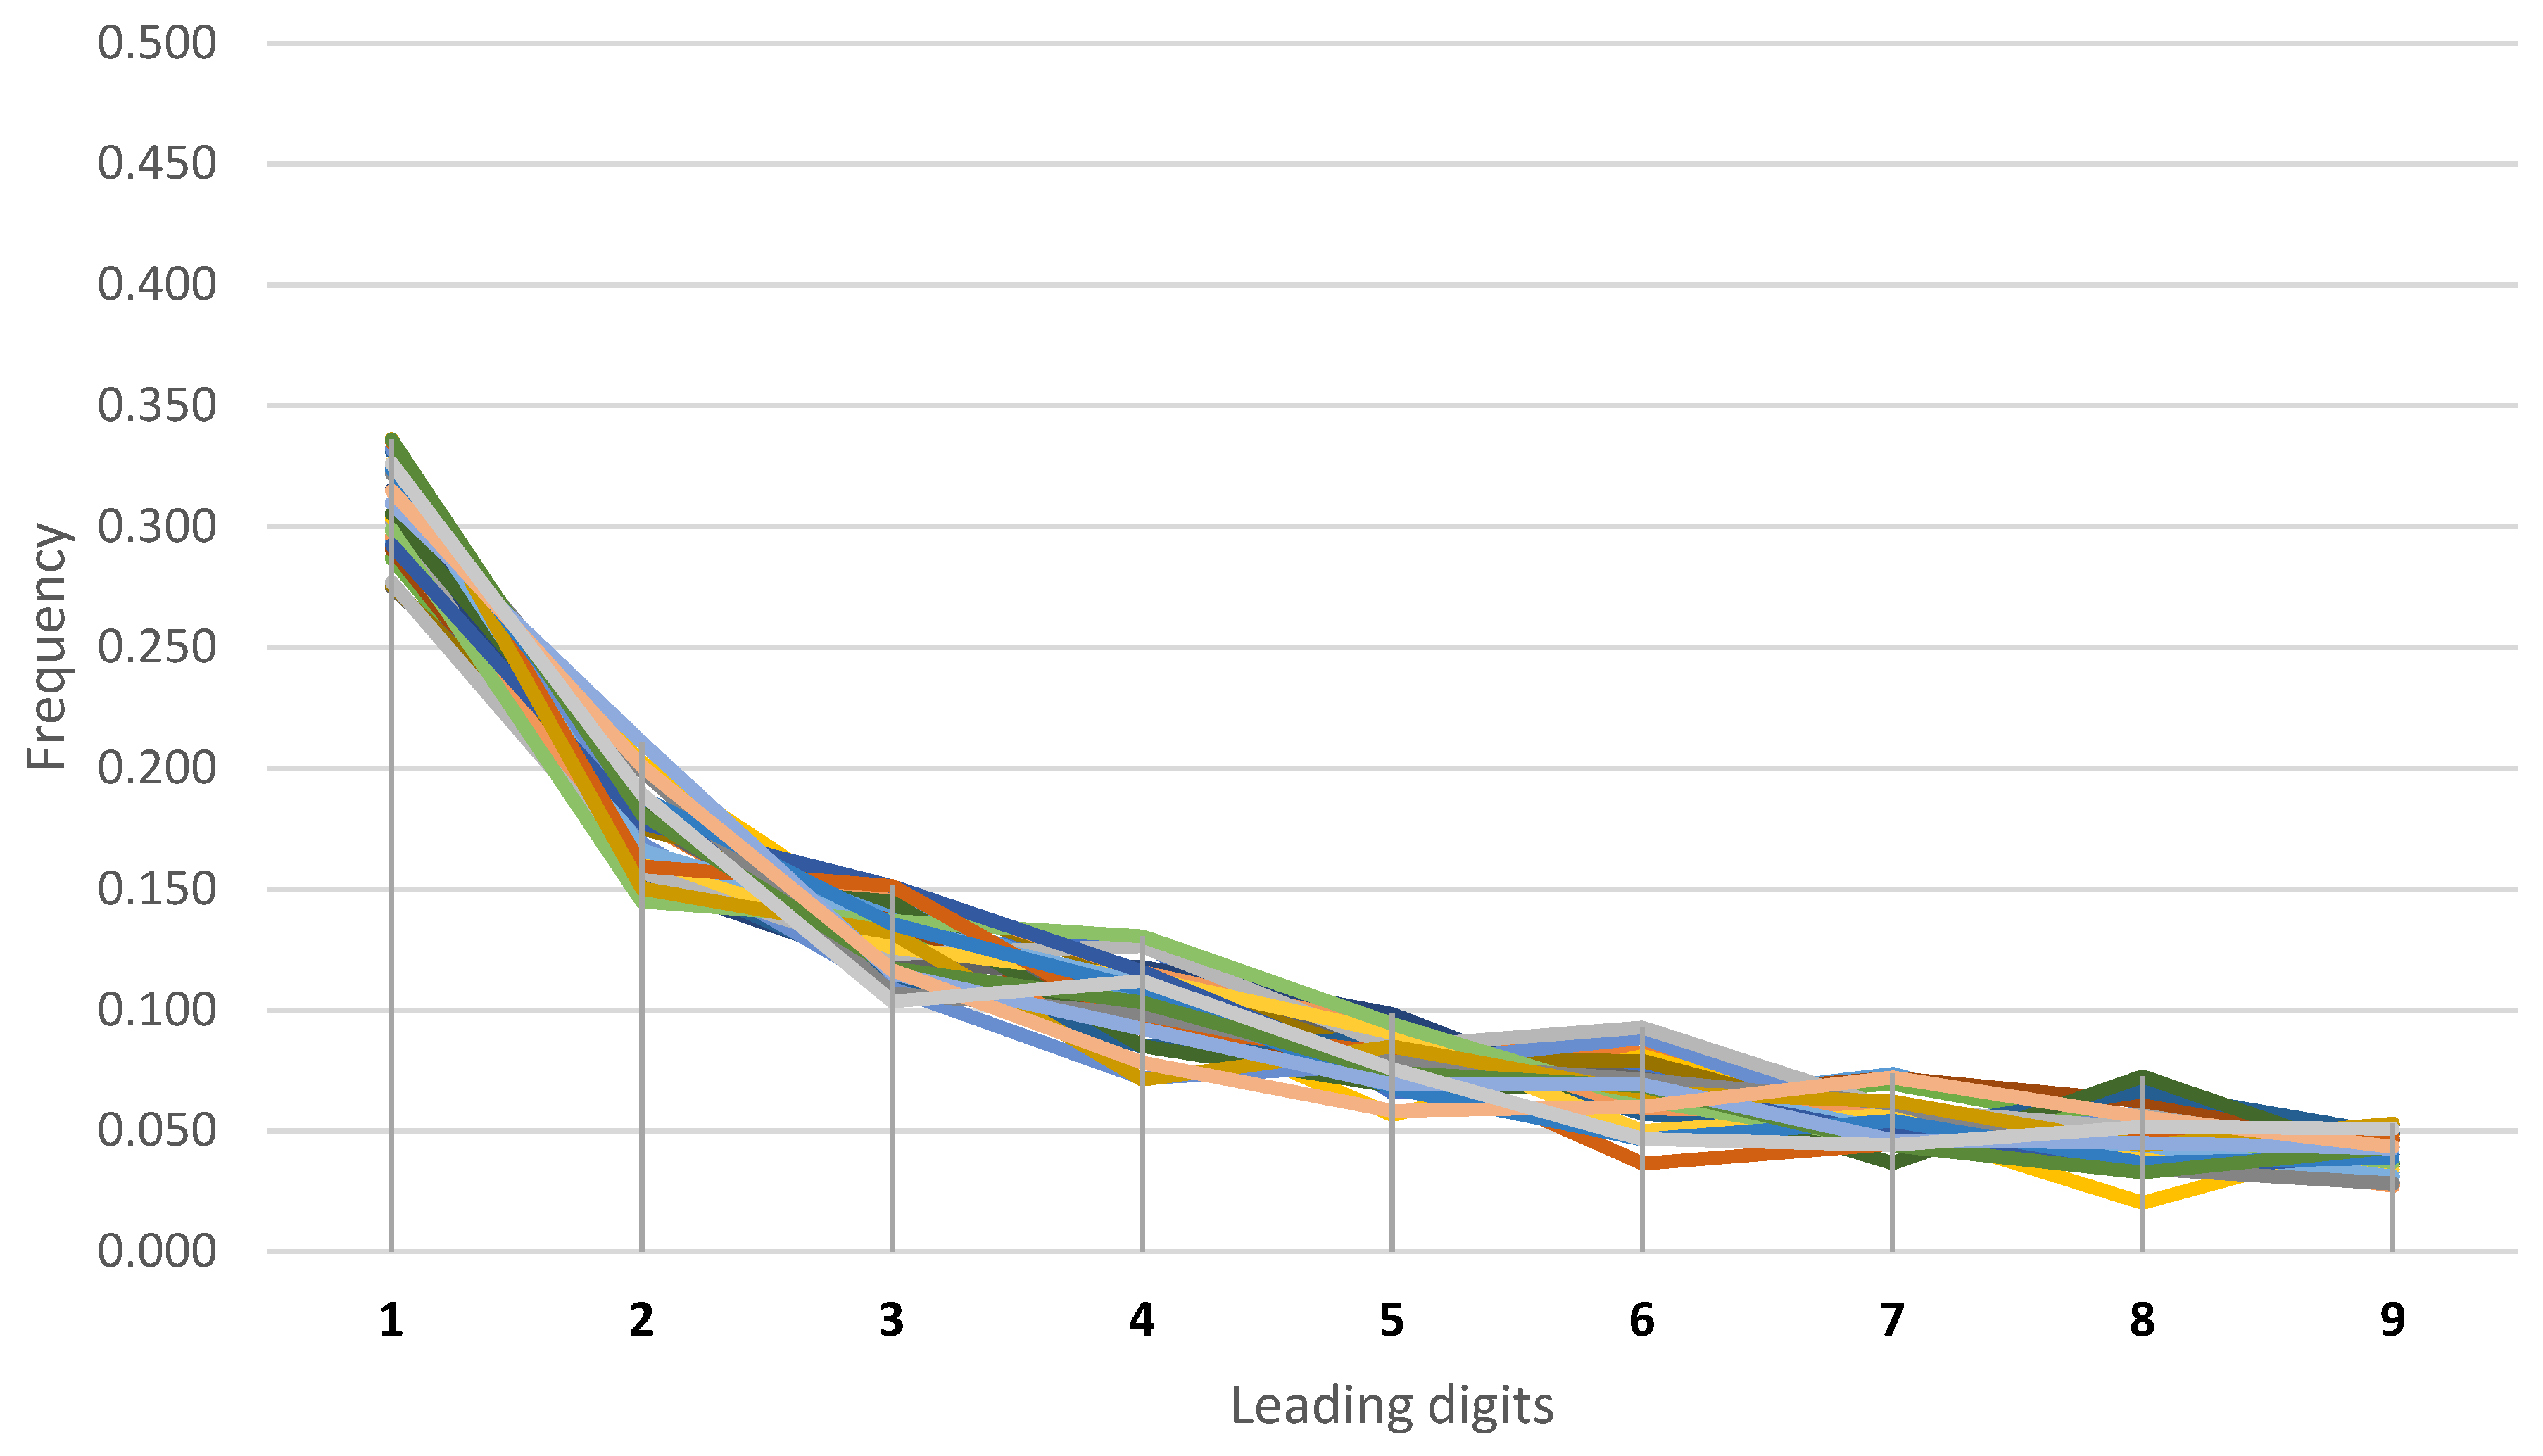
Figure 3.
Twenty-six countries with the lowest level of conformity with BL.

Figure 4.
123 countries with a moderate level of conformity with BL.
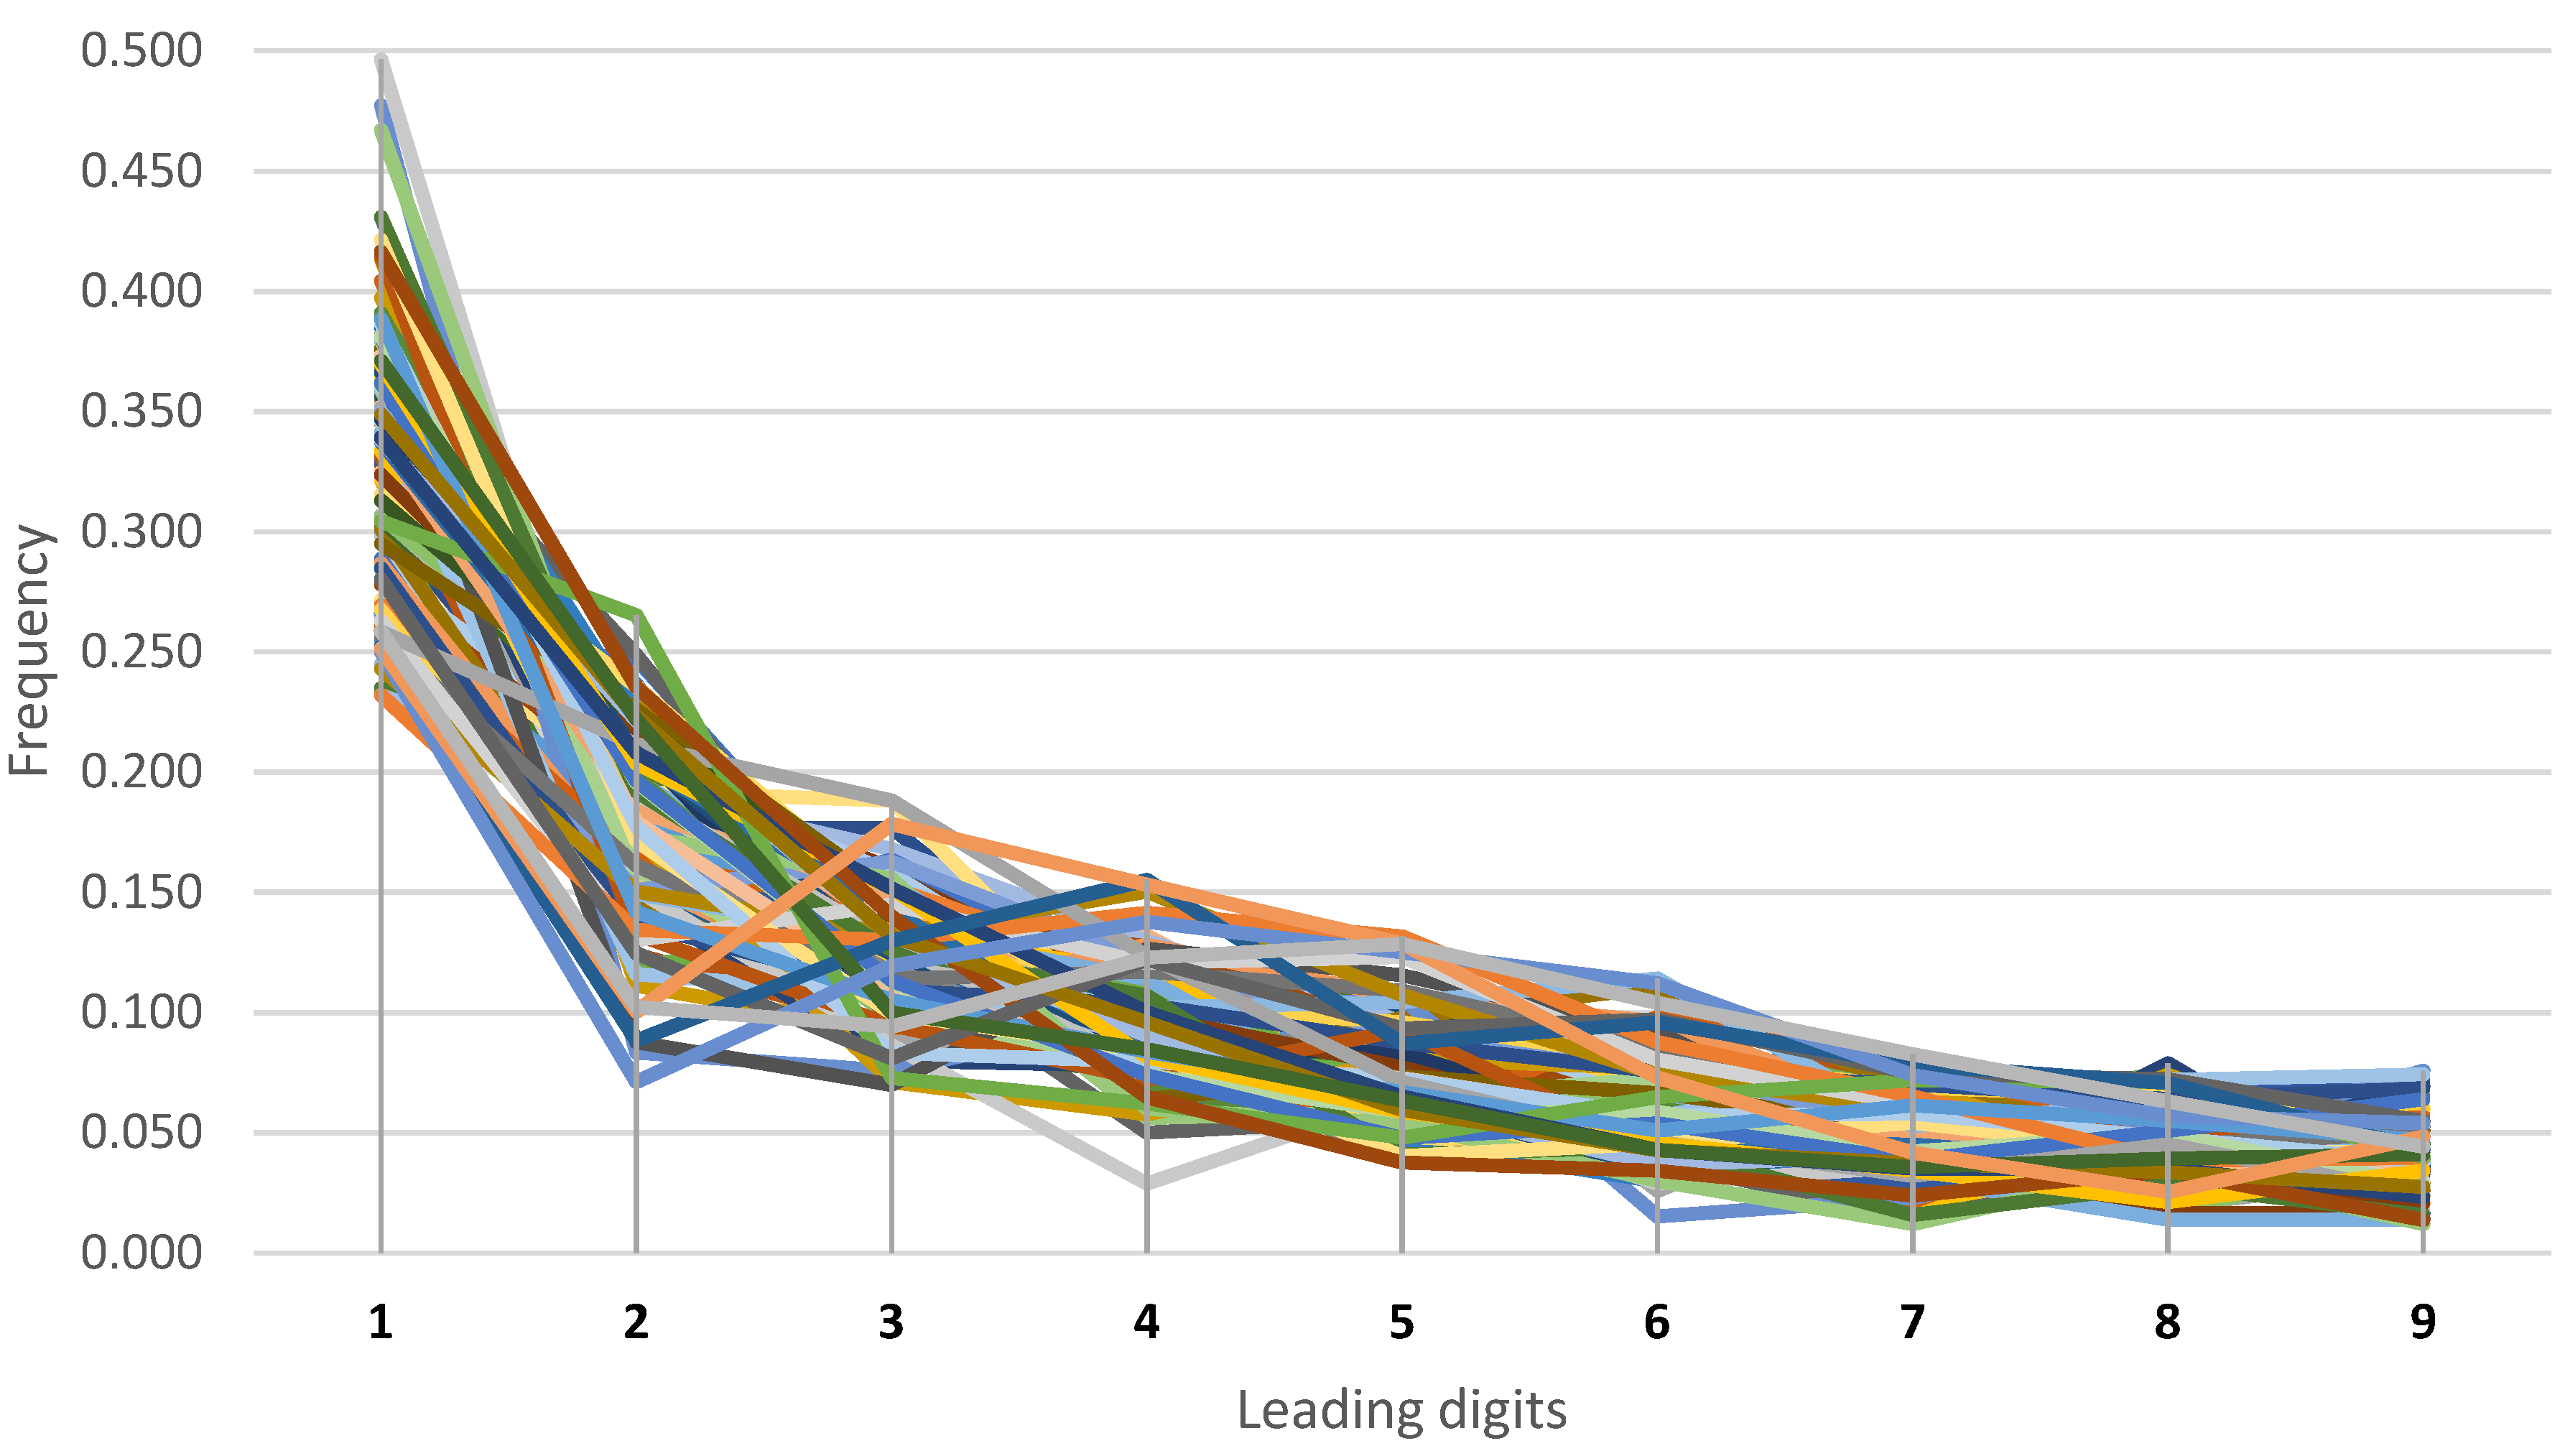
Figure 5.
Distribution of conformity to BL.


Table 1.
Prior research into COVID-19 data reliability measured by Benford’s law.
| Researcher | Variables | Deadline | Number of Countries |
|---|---|---|---|
| Idrovo and Manrique-Hernández | Confirmed cases, suspected cases, and deaths, cumulated confirmed cases and deaths | 21 January 2020–15 March 2020 | 1 |
| Koch and Okamura | Confirmed cases, deaths, and recoveries | 20 January 2020–10 April 2020 | 3 |
| Lee, Han, and Jeong | Number of deaths | 22 January 2020–6 April 2020 | 10 |
| Jackson and Sambridge | Cumulated confirmed cases and deaths | 16 January 2020–9 April 2020 | 51 |
| Isea | Daily cases and deaths | 29 December 2019–30 April 2020 | 23 |
| Wei and Vellwock | Total confirmed cases, daily cases and deaths | not stated–1 September 2020 | 20 |
| Farhadi | Daily cases, deaths, tests | 31 December 2019–24 September 2020 | 154 |
Table 2.
Benford’s Law Distribution of First Digit.
| First Digit | 1 | 2 | 3 | 4 | 5 | 6 | 7 | 8 | 9 |
|---|---|---|---|---|---|---|---|---|---|
| Benford’s frequency | 0.301 | 0.176 | 0.125 | 0.097 | 0.079 | 0.067 | 0.058 | 0.051 | 0.046 |
Table 3.
Results of the leading digit distribution analysis.
| Location | Improve | Flag | N | GHSI Score | GHSI Rank | d* | Chi Square | p-Value | K-S | Cut-Off | SSD | MAD | 1 | 2 | 3 | 4 | 5 | 6 | 7 | 8 | 9 |
|---|---|---|---|---|---|---|---|---|---|---|---|---|---|---|---|---|---|---|---|---|---|
| Comoros | + | G | 243 | 27 | 160 | 0.041 | 0.671 | 0.715 | 0.029 | 0.087 | 17.693 | 0.012 | 0.292 | 0.181 | 0.128 | 0.128 | 0.066 | 0.074 | 0.045 | 0.058 | 0.029 |
| United Kingdom | + | G | 1358 | 78 | 2 | 0.022 | 0.269 | 0.874 | 0.015 | 0.037 | 5.308 | 0.006 | 0.295 | 0.178 | 0.122 | 0.094 | 0.088 | 0.082 | 0.059 | 0.039 | 0.043 |
| Australia | + | G | 878 | 76 | 4 | 0.025 | 0.143 | 0.931 | 0.021 | 0.046 | 6.566 | 0.006 | 0.302 | 0.154 | 0.129 | 0.101 | 0.088 | 0.069 | 0.055 | 0.057 | 0.046 |
| Cameroon | + | G | 247 | 34 | 115 | 0.048 | 0.580 | 0.748 | 0.042 | 0.087 | 24.721 | 0.013 | 0.304 | 0.202 | 0.134 | 0.101 | 0.057 | 0.081 | 0.053 | 0.020 | 0.049 |
| Cape Verde | + | G | 883 | 75 | 5 | 0.035 | 1.062 | 0.588 | 0.024 | 0.046 | 12.976 | 0.011 | 0.294 | 0.159 | 0.143 | 0.106 | 0.086 | 0.061 | 0.074 | 0.044 | 0.033 |
| Spain | + | G | 690 | 66 | 15 | 0.026 | 0.676 | 0.713 | 0.028 | 0.052 | 7.074 | 0.007 | 0.287 | 0.162 | 0.130 | 0.101 | 0.090 | 0.062 | 0.070 | 0.051 | 0.046 |
| Slovenia | + | G | 1231 | 67 | 12 | 0.040 | 4.459 | 0.108 | 0.025 | 0.039 | 17.484 | 0.012 | 0.315 | 0.154 | 0.118 | 0.118 | 0.098 | 0.058 | 0.055 | 0.041 | 0.042 |
| Israel | + | G | 1335 | 47 | 54 | 0.028 | 3.830 | 0.147 | 0.026 | 0.037 | 8.642 | 0.008 | 0.291 | 0.160 | 0.137 | 0.092 | 0.076 | 0.064 | 0.072 | 0.062 | 0.046 |
| Ecuador | - | G | 1284 | 50 | 45 | 0.032 | 4.380 | 0.112 | 0.027 | 0.038 | 11.222 | 0.008 | 0.275 | 0.179 | 0.121 | 0.113 | 0.087 | 0.072 | 0.055 | 0.046 | 0.052 |
| Portugal | + | G | 1343 | 60 | 20 | 0.042 | 8.880 | 0.012 | 0.027 | 0.037 | 19.040 | 0.012 | 0.276 | 0.175 | 0.149 | 0.114 | 0.080 | 0.079 | 0.051 | 0.042 | 0.035 |
| Lithuania | + | G | 1190 | 55 | 33 | 0.042 | 5.817 | 0.055 | 0.030 | 0.039 | 19.319 | 0.013 | 0.331 | 0.160 | 0.114 | 0.085 | 0.088 | 0.057 | 0.050 | 0.066 | 0.049 |
| Albania | + | G | 1281 | 53 | 39 | 0.040 | 0.495 | 0.781 | 0.030 | 0.038 | 16.956 | 0.012 | 0.305 | 0.183 | 0.144 | 0.085 | 0.069 | 0.068 | 0.037 | 0.073 | 0.037 |
| Bolivia | - | G | 1267 | 36 | 102 | 0.048 | 12.762 | 0.002 | 0.031 | 0.038 | 24.243 | 0.012 | 0.332 | 0.169 | 0.109 | 0.072 | 0.077 | 0.088 | 0.052 | 0.054 | 0.047 |
| Thailand | + | G | 1028 | 73 | 6 | 0.043 | 9.379 | 0.009 | 0.035 | 0.042 | 20.066 | 0.013 | 0.296 | 0.159 | 0.151 | 0.116 | 0.092 | 0.059 | 0.057 | 0.043 | 0.027 |
| Madagascar | - | G | 625 | 40 | 86 | 0.051 | 1.762 | 0.414 | 0.045 | 0.054 | 28.185 | 0.014 | 0.277 | 0.157 | 0.123 | 0.126 | 0.085 | 0.093 | 0.059 | 0.051 | 0.029 |
| Malawi | - | G | 739 | 28 | 154 | 0.041 | 7.871 | 0.020 | 0.042 | 0.050 | 17.702 | 0.012 | 0.326 | 0.164 | 0.126 | 0.114 | 0.091 | 0.050 | 0.057 | 0.039 | 0.034 |
| Kenya | - | G | 999 | 47 | 55 | 0.036 | 4.676 | 0.097 | 0.037 | 0.043 | 13.686 | 0.011 | 0.323 | 0.166 | 0.135 | 0.111 | 0.068 | 0.071 | 0.050 | 0.044 | 0.031 |
| Indonesia | - | G | 1242 | 57 | 30 | 0.050 | 6.403 | 0.041 | 0.033 | 0.039 | 27.089 | 0.013 | 0.299 | 0.145 | 0.137 | 0.130 | 0.094 | 0.063 | 0.046 | 0.049 | 0.037 |
| Democratic Rep. of Congo | - | G | 992 | 52 | 42 | 0.039 | 8.025 | 0.018 | 0.038 | 0.043 | 16.050 | 0.011 | 0.292 | 0.177 | 0.151 | 0.116 | 0.073 | 0.069 | 0.048 | 0.033 | 0.040 |
| Georgia | - | G | 740 | 52 | 42 | 0.055 | 9.347 | 0.009 | 0.044 | 0.050 | 32.725 | 0.014 | 0.335 | 0.159 | 0.151 | 0.093 | 0.082 | 0.036 | 0.045 | 0.050 | 0.047 |
| Afghanistan | - | G | 814 | 32 | 130 | 0.042 | 3.843 | 0.146 | 0.044 | 0.048 | 19.157 | 0.012 | 0.322 | 0.199 | 0.107 | 0.098 | 0.079 | 0.071 | 0.061 | 0.034 | 0.028 |
| Serbia | + | G | 1318 | 52 | 41 | 0.051 | 9.552 | 0.008 | 0.035 | 0.037 | 27.600 | 0.013 | 0.336 | 0.150 | 0.132 | 0.071 | 0.085 | 0.066 | 0.062 | 0.044 | 0.053 |
| Singapore | - | G | 516 | 59 | 24 | 0.040 | 6.294 | 0.043 | 0.057 | 0.060 | 17.148 | 0.013 | 0.324 | 0.188 | 0.136 | 0.109 | 0.068 | 0.047 | 0.054 | 0.037 | 0.039 |
| Norway | + | G | 1066 | 65 | 16 | 0.042 | 9.673 | 0.008 | 0.040 | 0.042 | 18.949 | 0.011 | 0.336 | 0.181 | 0.117 | 0.103 | 0.074 | 0.068 | 0.044 | 0.033 | 0.043 |
| Germany | - | G | 911 | 66 | 14 | 0.040 | 1.897 | 0.387 | 0.043 | 0.045 | 16.883 | 0.010 | 0.310 | 0.211 | 0.115 | 0.092 | 0.069 | 0.069 | 0.046 | 0.045 | 0.043 |
| Slovakia | + | G | 1150 | 48 | 52 | 0.043 | 2.459 | 0.292 | 0.039 | 0.040 | 19.395 | 0.013 | 0.315 | 0.201 | 0.117 | 0.078 | 0.058 | 0.060 | 0.072 | 0.056 | 0.043 |
| Ukraine | + | G | 1178 | 38 | 94 | 0.045 | 6.767 | 0.034 | 0.038 | 0.040 | 21.283 | 0.013 | 0.326 | 0.189 | 0.104 | 0.112 | 0.076 | 0.047 | 0.044 | 0.052 | 0.051 |
| Luxembourg | - | R | 1027 | 44 | 67 | 0.115 | 100.876 | 0.000 | 0.083 | 0.042 | 142.875 | 0.034 | 0.373 | 0.119 | 0.071 | 0.069 | 0.063 | 0.094 | 0.067 | 0.072 | 0.071 |
| Sao Tome and Principe | - | R | 279 | 31 | 139 | 0.170 | 47.748 | 0.000 | 0.175 | 0.081 | 308.597 | 0.039 | 0.459 | 0.194 | 0.118 | 0.093 | 0.054 | 0.029 | 0.025 | 0.011 | 0.018 |
| Pakistan | - | R | 1286 | 36 | 105 | 0.107 | 86.303 | 0.000 | 0.083 | 0.038 | 122.535 | 0.029 | 0.218 | 0.200 | 0.167 | 0.140 | 0.099 | 0.067 | 0.048 | 0.035 | 0.026 |
| Qatar | + | R | 1114 | 41 | 82 | 0.145 | 140.096 | 0.000 | 0.091 | 0.041 | 226.746 | 0.039 | 0.210 | 0.208 | 0.131 | 0.195 | 0.119 | 0.060 | 0.031 | 0.022 | 0.023 |
| Maldives | - | R | 936 | 34 | 121 | 0.112 | 49.834 | 0.000 | 0.101 | 0.044 | 135.825 | 0.027 | 0.402 | 0.136 | 0.144 | 0.096 | 0.060 | 0.046 | 0.041 | 0.033 | 0.043 |
| Russia | - | R | 1297 | 44 | 63 | 0.115 | 73.142 | 0.000 | 0.087 | 0.038 | 140.934 | 0.031 | 0.214 | 0.184 | 0.180 | 0.111 | 0.118 | 0.045 | 0.029 | 0.073 | 0.046 |
| Iraq | - | R | 1231 | 26 | 167 | 0.123 | 66.979 | 0.000 | 0.089 | 0.039 | 161.702 | 0.029 | 0.212 | 0.180 | 0.188 | 0.158 | 0.062 | 0.062 | 0.056 | 0.050 | 0.032 |
| Latvia | + | R | 1154 | 63 | 17 | 0.102 | 50.915 | 0.000 | 0.092 | 0.040 | 110.782 | 0.022 | 0.393 | 0.134 | 0.106 | 0.084 | 0.067 | 0.074 | 0.056 | 0.045 | 0.041 |
| Burkina Faso | - | R | 464 | 30 | 145 | 0.150 | 55.086 | 0.000 | 0.157 | 0.063 | 242.833 | 0.035 | 0.442 | 0.190 | 0.127 | 0.067 | 0.058 | 0.034 | 0.041 | 0.024 | 0.017 |
| Chad | - | R | 468 | 29 | 150 | 0.152 | 50.635 | 0.000 | 0.162 | 0.063 | 248.236 | 0.036 | 0.444 | 0.194 | 0.105 | 0.073 | 0.047 | 0.051 | 0.038 | 0.026 | 0.021 |
| Namibia | - | R | 951 | 36 | 104 | 0.123 | 60.390 | 0.000 | 0.118 | 0.044 | 161.190 | 0.027 | 0.416 | 0.179 | 0.091 | 0.069 | 0.064 | 0.055 | 0.044 | 0.033 | 0.048 |
| Liechtenstein | - | R | 686 | 44 | 71 | 0.117 | 41.237 | 0.000 | 0.140 | 0.052 | 145.983 | 0.031 | 0.398 | 0.219 | 0.117 | 0.082 | 0.042 | 0.041 | 0.035 | 0.031 | 0.036 |
| Sweden | - | R | 919 | 72 | 7 | 0.144 | 55.668 | 0.000 | 0.122 | 0.045 | 224.055 | 0.036 | 0.194 | 0.161 | 0.193 | 0.169 | 0.058 | 0.058 | 0.077 | 0.052 | 0.039 |
| Netherlands | - | R | 889 | 76 | 3 | 0.100 | 45.611 | 0.000 | 0.130 | 0.046 | 107.664 | 0.030 | 0.244 | 0.130 | 0.098 | 0.112 | 0.101 | 0.109 | 0.067 | 0.097 | 0.040 |
| Mozambique | - | R | 1046 | 28 | 153 | 0.134 | 83.369 | 0.000 | 0.121 | 0.042 | 192.475 | 0.029 | 0.422 | 0.161 | 0.073 | 0.061 | 0.060 | 0.060 | 0.057 | 0.054 | 0.052 |
| Tajikistan | - | R | 301 | 32 | 130 | 0.306 | 54.806 | 0.000 | 0.228 | 0.078 | 1007.938 | 0.082 | 0.203 | 0.047 | 0.282 | 0.309 | 0.050 | 0.050 | 0.013 | 0.037 | 0.010 |
| Uganda | - | R | 819 | 44 | 63 | 0.115 | 41.974 | 0.000 | 0.140 | 0.048 | 142.794 | 0.031 | 0.330 | 0.275 | 0.138 | 0.083 | 0.046 | 0.039 | 0.031 | 0.029 | 0.029 |
| Costa Rica | - | R | 1081 | 45 | 62 | 0.101 | 40.234 | 0.000 | 0.126 | 0.041 | 109.721 | 0.028 | 0.378 | 0.225 | 0.105 | 0.080 | 0.051 | 0.040 | 0.045 | 0.041 | 0.035 |
| Turkey | - | R | 1325 | 52 | 40 | 0.122 | 76.199 | 0.000 | 0.118 | 0.037 | 159.610 | 0.030 | 0.411 | 0.185 | 0.091 | 0.068 | 0.050 | 0.053 | 0.052 | 0.028 | 0.063 |
| El Salvador | - | R | 1155 | 44 | 65 | 0.226 | 72.338 | 0.000 | 0.132 | 0.040 | 546.613 | 0.047 | 0.223 | 0.385 | 0.072 | 0.093 | 0.052 | 0.037 | 0.039 | 0.049 | 0.049 |
| Belarus | - | R | 916 | 35 | 108 | 0.205 | 179.177 | 0.000 | 0.152 | 0.045 | 449.259 | 0.053 | 0.378 | 0.035 | 0.052 | 0.082 | 0.096 | 0.070 | 0.047 | 0.084 | 0.156 |
| Senegal | - | R | 1219 | 38 | 95 | 0.153 | 128.220 | 0.000 | 0.138 | 0.039 | 252.393 | 0.037 | 0.439 | 0.156 | 0.078 | 0.060 | 0.042 | 0.053 | 0.048 | 0.057 | 0.068 |
| Malta | - | R | 1081 | 37 | 98 | 0.122 | 54.984 | 0.000 | 0.161 | 0.041 | 159.349 | 0.036 | 0.345 | 0.268 | 0.150 | 0.062 | 0.046 | 0.039 | 0.025 | 0.026 | 0.039 |
| Kuwait | - | R | 1236 | 46 | 59 | 0.126 | 102.810 | 0.000 | 0.164 | 0.039 | 169.644 | 0.037 | 0.207 | 0.120 | 0.111 | 0.131 | 0.100 | 0.090 | 0.091 | 0.087 | 0.064 |
| Myanmar | - | R | 897 | 43 | 72 | 0.193 | 141.797 | 0.000 | 0.212 | 0.045 | 399.077 | 0.047 | 0.478 | 0.211 | 0.089 | 0.055 | 0.038 | 0.028 | 0.039 | 0.030 | 0.032 |
| Bangladesh | - | R | 1332 | 35 | 113 | 0.160 | 177.155 | 0.000 | 0.177 | 0.037 | 274.090 | 0.039 | 0.446 | 0.175 | 0.158 | 0.065 | 0.052 | 0.030 | 0.029 | 0.022 | 0.025 |
| Burundi | + | Y | 255 | 23 | 177 | 0.084 | 5.900 | 0.052 | 0.042 | 0.085 | 75.552 | 0.020 | 0.259 | 0.247 | 0.129 | 0.102 | 0.075 | 0.075 | 0.039 | 0.039 | 0.035 |
| Tunisia | + | Y | 741 | 34 | 122 | 0.049 | 1.681 | 0.432 | 0.028 | 0.050 | 25.807 | 0.016 | 0.321 | 0.150 | 0.108 | 0.101 | 0.097 | 0.084 | 0.070 | 0.040 | 0.028 |
| Equatorial Guinea | + | Y | 155 | 16 | 195 | 0.081 | 5.403 | 0.067 | 0.074 | 0.109 | 71.277 | 0.023 | 0.355 | 0.161 | 0.129 | 0.097 | 0.110 | 0.026 | 0.071 | 0.019 | 0.032 |
| Benin | - | Y | 168 | 29 | 150 | 0.061 | 3.663 | 0.160 | 0.075 | 0.105 | 39.345 | 0.019 | 0.321 | 0.190 | 0.149 | 0.113 | 0.065 | 0.077 | 0.018 | 0.042 | 0.024 |
| Ghana | - | Y | 793 | 36 | 105 | 0.055 | 10.155 | 0.006 | 0.035 | 0.048 | 32.314 | 0.015 | 0.266 | 0.208 | 0.142 | 0.116 | 0.067 | 0.055 | 0.055 | 0.048 | 0.042 |
| Somalia | - | Y | 331 | 17 | 194 | 0.062 | 3.019 | 0.221 | 0.055 | 0.075 | 40.701 | 0.018 | 0.341 | 0.190 | 0.097 | 0.073 | 0.076 | 0.054 | 0.054 | 0.076 | 0.039 |
| Lesotho | - | Y | 241 | 30 | 144 | 0.088 | 5.570 | 0.062 | 0.066 | 0.088 | 83.903 | 0.026 | 0.365 | 0.158 | 0.145 | 0.071 | 0.083 | 0.058 | 0.025 | 0.079 | 0.017 |
| Malaysia | + | Y | 1195 | 62 | 18 | 0.052 | 8.787 | 0.012 | 0.030 | 0.039 | 29.398 | 0.015 | 0.328 | 0.142 | 0.107 | 0.091 | 0.094 | 0.081 | 0.057 | 0.064 | 0.035 |
| Botswana | + | Y | 180 | 31 | 139 | 0.080 | 3.316 | 0.191 | 0.079 | 0.101 | 68.924 | 0.019 | 0.361 | 0.194 | 0.122 | 0.050 | 0.056 | 0.067 | 0.061 | 0.039 | 0.050 |
| Oman | - | Y | 695 | 43 | 73 | 0.063 | 8.769 | 0.012 | 0.044 | 0.052 | 43.012 | 0.018 | 0.345 | 0.153 | 0.135 | 0.065 | 0.072 | 0.059 | 0.047 | 0.059 | 0.065 |
| Papua New Guinea | - | Y | 212 | 28 | 155 | 0.093 | 7.982 | 0.018 | 0.081 | 0.093 | 92.590 | 0.024 | 0.382 | 0.156 | 0.118 | 0.085 | 0.094 | 0.033 | 0.038 | 0.061 | 0.033 |
| Kosovo | + | Y | 613 | 19 | 189 | 0.073 | 15.973 | 0.000 | 0.048 | 0.055 | 57.386 | 0.020 | 0.349 | 0.148 | 0.085 | 0.075 | 0.088 | 0.070 | 0.069 | 0.070 | 0.046 |
| Greece | + | Y | 1233 | 54 | 37 | 0.059 | 18.225 | 0.000 | 0.036 | 0.039 | 37.519 | 0.016 | 0.265 | 0.211 | 0.142 | 0.084 | 0.101 | 0.066 | 0.058 | 0.042 | 0.032 |
| Belize | + | Y | 395 | 32 | 135 | 0.065 | 6.175 | 0.046 | 0.064 | 0.068 | 45.385 | 0.016 | 0.354 | 0.182 | 0.129 | 0.068 | 0.078 | 0.056 | 0.068 | 0.035 | 0.028 |
| Central African Republic | - | Y | 211 | 27 | 159 | 0.104 | 7.976 | 0.019 | 0.088 | 0.094 | 117.203 | 0.027 | 0.389 | 0.152 | 0.085 | 0.128 | 0.066 | 0.071 | 0.047 | 0.033 | 0.028 |
| Nigeria | + | Y | 922 | 38 | 96 | 0.056 | 10.820 | 0.004 | 0.045 | 0.045 | 33.339 | 0.014 | 0.346 | 0.151 | 0.129 | 0.103 | 0.081 | 0.073 | 0.042 | 0.047 | 0.028 |
| Bulgaria | - | Y | 1194 | 46 | 61 | 0.048 | 9.217 | 0.010 | 0.040 | 0.039 | 24.370 | 0.012 | 0.341 | 0.153 | 0.121 | 0.108 | 0.072 | 0.059 | 0.049 | 0.052 | 0.044 |
| Bahamas | - | Y | 368 | 31 | 142 | 0.081 | 9.860 | 0.007 | 0.072 | 0.071 | 70.910 | 0.017 | 0.372 | 0.177 | 0.098 | 0.101 | 0.073 | 0.065 | 0.054 | 0.016 | 0.043 |
| Algeria | + | Y | 897 | 24 | 173 | 0.062 | 17.434 | 0.000 | 0.047 | 0.045 | 41.616 | 0.017 | 0.329 | 0.156 | 0.082 | 0.099 | 0.071 | 0.060 | 0.059 | 0.070 | 0.072 |
| Mauritius | - | Y | 188 | 35 | 114 | 0.116 | 9.613 | 0.008 | 0.103 | 0.099 | 145.528 | 0.029 | 0.404 | 0.154 | 0.133 | 0.069 | 0.059 | 0.043 | 0.021 | 0.059 | 0.059 |
| Eritrea | + | Y | 180 | 22 | 178 | 0.089 | 2.842 | 0.241 | 0.106 | 0.101 | 85.701 | 0.026 | 0.356 | 0.228 | 0.106 | 0.083 | 0.039 | 0.050 | 0.067 | 0.044 | 0.028 |
| St. Vincent & the Grenadines | - | Y | 162 | 34 | 117 | 0.135 | 11.659 | 0.003 | 0.113 | 0.107 | 194.677 | 0.033 | 0.414 | 0.111 | 0.093 | 0.080 | 0.074 | 0.080 | 0.037 | 0.074 | 0.037 |
| Jordan | - | Y | 904 | 42 | 80 | 0.069 | 2.339 | 0.311 | 0.048 | 0.045 | 50.371 | 0.016 | 0.289 | 0.237 | 0.100 | 0.104 | 0.062 | 0.071 | 0.044 | 0.051 | 0.043 |
| Kyrgyzstan | - | Y | 677 | 49 | 47 | 0.078 | 25.854 | 0.000 | 0.057 | 0.052 | 64.878 | 0.022 | 0.244 | 0.208 | 0.151 | 0.121 | 0.095 | 0.062 | 0.058 | 0.038 | 0.024 |
| Seychelles | + | Y | 173 | 32 | 133 | 0.096 | 8.408 | 0.015 | 0.115 | 0.103 | 99.877 | 0.026 | 0.382 | 0.208 | 0.127 | 0.087 | 0.052 | 0.046 | 0.046 | 0.023 | 0.029 |
| Andorra | + | Y | 394 | 31 | 143 | 0.057 | 12.815 | 0.002 | 0.078 | 0.069 | 34.776 | 0.017 | 0.325 | 0.185 | 0.135 | 0.132 | 0.076 | 0.056 | 0.033 | 0.033 | 0.025 |
| Yemen | + | Y | 548 | 19 | 190 | 0.057 | 6.733 | 0.035 | 0.066 | 0.058 | 35.325 | 0.015 | 0.349 | 0.193 | 0.126 | 0.086 | 0.055 | 0.058 | 0.049 | 0.047 | 0.036 |
| South Sudan | - | Y | 384 | 22 | 180 | 0.092 | 11.672 | 0.003 | 0.079 | 0.069 | 91.440 | 0.023 | 0.380 | 0.138 | 0.107 | 0.091 | 0.096 | 0.049 | 0.049 | 0.060 | 0.029 |
| Poland | + | Y | 1296 | 55 | 32 | 0.060 | 25.505 | 0.000 | 0.043 | 0.038 | 38.032 | 0.019 | 0.261 | 0.200 | 0.140 | 0.110 | 0.097 | 0.080 | 0.047 | 0.029 | 0.036 |
| Nepal | - | Y | 1170 | 35 | 111 | 0.056 | 11.773 | 0.003 | 0.046 | 0.040 | 33.148 | 0.014 | 0.347 | 0.148 | 0.118 | 0.103 | 0.078 | 0.055 | 0.051 | 0.061 | 0.040 |
| Zambia | + | Y | 1010 | 29 | 152 | 0.054 | 0.012 | 0.994 | 0.050 | 0.043 | 31.699 | 0.014 | 0.302 | 0.137 | 0.114 | 0.125 | 0.100 | 0.080 | 0.057 | 0.050 | 0.036 |
| Cambodia | + | Y | 300 | 39 | 89 | 0.075 | 13.945 | 0.001 | 0.092 | 0.079 | 60.309 | 0.025 | 0.280 | 0.200 | 0.160 | 0.117 | 0.097 | 0.083 | 0.030 | 0.017 | 0.017 |
| Ireland | - | Y | 1208 | 59 | 23 | 0.062 | 12.574 | 0.002 | 0.046 | 0.039 | 41.844 | 0.015 | 0.347 | 0.137 | 0.132 | 0.109 | 0.076 | 0.059 | 0.043 | 0.047 | 0.050 |
| Vietnam | + | Y | 452 | 49 | 50 | 0.081 | 12.304 | 0.002 | 0.075 | 0.064 | 70.418 | 0.019 | 0.376 | 0.155 | 0.131 | 0.086 | 0.062 | 0.058 | 0.049 | 0.033 | 0.051 |
| Brazil | - | Y | 888 | 60 | 22 | 0.051 | 8.189 | 0.017 | 0.055 | 0.046 | 28.303 | 0.014 | 0.262 | 0.160 | 0.127 | 0.098 | 0.100 | 0.083 | 0.075 | 0.054 | 0.039 |
| Djibouti | - | Y | 432 | 23 | 175 | 0.068 | 7.371 | 0.025 | 0.079 | 0.065 | 49.710 | 0.017 | 0.356 | 0.199 | 0.111 | 0.095 | 0.053 | 0.049 | 0.046 | 0.049 | 0.042 |
| Morocco | + | Y | 1308 | 44 | 68 | 0.049 | 6.044 | 0.049 | 0.045 | 0.038 | 26.028 | 0.011 | 0.300 | 0.222 | 0.116 | 0.096 | 0.070 | 0.050 | 0.060 | 0.046 | 0.041 |
| Congo | + | Y | 1145 | 27 | 160 | 0.038 | 12.849 | 0.002 | 0.049 | 0.040 | 15.226 | 0.011 | 0.304 | 0.182 | 0.152 | 0.110 | 0.072 | 0.063 | 0.045 | 0.034 | 0.038 |
| South Korea | + | Y | 1299 | 70 | 9 | 0.061 | 1.826 | 0.401 | 0.046 | 0.038 | 40.559 | 0.017 | 0.298 | 0.133 | 0.129 | 0.126 | 0.105 | 0.085 | 0.049 | 0.042 | 0.033 |
| Lebanon | - | Y | 807 | 43 | 73 | 0.057 | 14.883 | 0.001 | 0.058 | 0.048 | 34.396 | 0.014 | 0.346 | 0.188 | 0.125 | 0.090 | 0.079 | 0.074 | 0.045 | 0.029 | 0.024 |
| Sudan | - | Y | 847 | 26 | 163 | 0.061 | 13.935 | 0.001 | 0.058 | 0.047 | 40.087 | 0.014 | 0.359 | 0.165 | 0.115 | 0.084 | 0.083 | 0.058 | 0.048 | 0.051 | 0.038 |
| Paraguay | + | Y | 1228 | 36 | 103 | 0.058 | 3.315 | 0.191 | 0.049 | 0.039 | 36.169 | 0.017 | 0.314 | 0.196 | 0.140 | 0.056 | 0.059 | 0.092 | 0.052 | 0.052 | 0.038 |
| Azerbaijan | - | Y | 888 | 34 | 117 | 0.057 | 13.634 | 0.001 | 0.058 | 0.046 | 34.794 | 0.013 | 0.306 | 0.177 | 0.177 | 0.092 | 0.075 | 0.046 | 0.051 | 0.043 | 0.033 |
| Iceland | - | Y | 797 | 46 | 58 | 0.071 | 20.778 | 0.000 | 0.062 | 0.048 | 54.824 | 0.020 | 0.331 | 0.124 | 0.094 | 0.088 | 0.093 | 0.077 | 0.078 | 0.061 | 0.054 |
| Cuba | - | Y | 1117 | 35 | 110 | 0.061 | 11.846 | 0.003 | 0.052 | 0.041 | 40.132 | 0.018 | 0.346 | 0.184 | 0.098 | 0.089 | 0.063 | 0.045 | 0.073 | 0.064 | 0.039 |
| Angola | - | Y | 677 | 25 | 170 | 0.061 | 16.569 | 0.000 | 0.067 | 0.052 | 40.082 | 0.015 | 0.301 | 0.227 | 0.140 | 0.095 | 0.075 | 0.047 | 0.044 | 0.046 | 0.024 |
| Niger | - | Y | 423 | 32 | 132 | 0.078 | 13.168 | 0.001 | 0.086 | 0.066 | 65.329 | 0.019 | 0.371 | 0.191 | 0.106 | 0.092 | 0.073 | 0.057 | 0.040 | 0.028 | 0.040 |
| New Zealand | - | Y | 711 | 54 | 35 | 0.079 | 16.060 | 0.000 | 0.066 | 0.051 | 66.206 | 0.019 | 0.235 | 0.205 | 0.120 | 0.105 | 0.108 | 0.084 | 0.060 | 0.044 | 0.038 |
| Uzbekistan | - | Y | 655 | 34 | 116 | 0.095 | 31.531 | 0.000 | 0.069 | 0.053 | 96.707 | 0.027 | 0.232 | 0.192 | 0.168 | 0.130 | 0.096 | 0.078 | 0.058 | 0.027 | 0.018 |
| Monaco | - | Y | 335 | 33 | 125 | 0.084 | 13.777 | 0.001 | 0.097 | 0.074 | 75.835 | 0.021 | 0.373 | 0.197 | 0.128 | 0.084 | 0.069 | 0.039 | 0.033 | 0.045 | 0.033 |
| Peru | - | Y | 1216 | 49 | 49 | 0.062 | 19.499 | 0.000 | 0.051 | 0.039 | 40.612 | 0.014 | 0.352 | 0.142 | 0.112 | 0.095 | 0.070 | 0.068 | 0.061 | 0.058 | 0.043 |
| Philippines | - | Y | 1329 | 48 | 53 | 0.074 | 28.708 | 0.000 | 0.050 | 0.037 | 58.785 | 0.019 | 0.272 | 0.192 | 0.188 | 0.082 | 0.087 | 0.053 | 0.044 | 0.046 | 0.037 |
| Italy | - | Y | 1401 | 56 | 31 | 0.053 | 28.798 | 0.000 | 0.049 | 0.036 | 30.554 | 0.016 | 0.284 | 0.205 | 0.158 | 0.091 | 0.089 | 0.065 | 0.044 | 0.032 | 0.032 |
| Mali | + | Y | 641 | 29 | 147 | 0.069 | 17.817 | 0.000 | 0.072 | 0.054 | 50.585 | 0.016 | 0.360 | 0.189 | 0.125 | 0.094 | 0.070 | 0.039 | 0.058 | 0.034 | 0.031 |
| Colombia | + | Y | 1247 | 44 | 65 | 0.057 | 0.907 | 0.636 | 0.052 | 0.039 | 35.473 | 0.014 | 0.289 | 0.136 | 0.164 | 0.111 | 0.074 | 0.062 | 0.065 | 0.057 | 0.043 |
| Chile | + | Y | 1310 | 58 | 27 | 0.055 | 8.617 | 0.013 | 0.052 | 0.038 | 32.810 | 0.017 | 0.269 | 0.156 | 0.152 | 0.116 | 0.092 | 0.082 | 0.063 | 0.035 | 0.035 |
| United States | - | Y | 1389 | 84 | 1 | 0.070 | 38.599 | 0.000 | 0.050 | 0.036 | 52.595 | 0.019 | 0.351 | 0.150 | 0.088 | 0.084 | 0.071 | 0.082 | 0.065 | 0.048 | 0.060 |
| Rwanda | - | Y | 917 | 34 | 117 | 0.048 | 14.015 | 0.001 | 0.062 | 0.045 | 25.234 | 0.014 | 0.334 | 0.178 | 0.133 | 0.117 | 0.067 | 0.051 | 0.058 | 0.031 | 0.033 |
| Croatia | - | Y | 1216 | 53 | 38 | 0.049 | 15.050 | 0.001 | 0.054 | 0.039 | 26.076 | 0.013 | 0.260 | 0.182 | 0.121 | 0.082 | 0.095 | 0.076 | 0.064 | 0.065 | 0.055 |
| Canada | - | Y | 1373 | 75 | 5 | 0.062 | 24.887 | 0.000 | 0.052 | 0.037 | 41.817 | 0.015 | 0.307 | 0.121 | 0.122 | 0.111 | 0.067 | 0.090 | 0.066 | 0.059 | 0.058 |
| Togo | - | Y | 951 | 33 | 129 | 0.086 | 37.973 | 0.000 | 0.063 | 0.044 | 79.918 | 0.023 | 0.364 | 0.146 | 0.080 | 0.078 | 0.074 | 0.064 | 0.070 | 0.055 | 0.069 |
| Belgium | + | Y | 1341 | 61 | 19 | 0.052 | 35.970 | 0.000 | 0.053 | 0.037 | 29.543 | 0.017 | 0.278 | 0.195 | 0.139 | 0.128 | 0.092 | 0.059 | 0.042 | 0.040 | 0.028 |
| Guinea-Bissau | - | Y | 209 | 20 | 186 | 0.113 | 18.146 | 0.000 | 0.135 | 0.094 | 135.866 | 0.032 | 0.364 | 0.249 | 0.120 | 0.081 | 0.086 | 0.038 | 0.014 | 0.033 | 0.014 |
| Uruguay | - | Y | 1013 | 41 | 81 | 0.062 | 12.697 | 0.002 | 0.062 | 0.043 | 41.453 | 0.017 | 0.301 | 0.146 | 0.115 | 0.075 | 0.098 | 0.111 | 0.068 | 0.057 | 0.030 |
| Hong Kong | - | Y | 574 | 28 | 156 | 0.092 | 21.168 | 0.000 | 0.084 | 0.057 | 89.973 | 0.022 | 0.385 | 0.153 | 0.108 | 0.078 | 0.057 | 0.066 | 0.051 | 0.064 | 0.037 |
| Bosnia and Herzegovina | - | Y | 1030 | 43 | 79 | 0.050 | 21.187 | 0.000 | 0.063 | 0.042 | 26.605 | 0.014 | 0.305 | 0.208 | 0.152 | 0.089 | 0.081 | 0.051 | 0.042 | 0.038 | 0.034 |
| Nicaragua | - | Y | 132 | 43 | 73 | 0.211 | 19.536 | 0.000 | 0.176 | 0.118 | 476.672 | 0.052 | 0.477 | 0.083 | 0.076 | 0.098 | 0.106 | 0.015 | 0.023 | 0.045 | 0.076 |
| Mexico | + | Y | 1412 | 58 | 28 | 0.063 | 2.001 | 0.368 | 0.055 | 0.036 | 43.110 | 0.020 | 0.287 | 0.156 | 0.105 | 0.128 | 0.106 | 0.096 | 0.059 | 0.042 | 0.021 |
| Argentina | - | Y | 1369 | 59 | 25 | 0.046 | 13.457 | 0.001 | 0.056 | 0.037 | 23.115 | 0.013 | 0.307 | 0.213 | 0.137 | 0.099 | 0.063 | 0.047 | 0.053 | 0.046 | 0.036 |
| Bahrain | + | Y | 1115 | 39 | 88 | 0.070 | 22.249 | 0.000 | 0.063 | 0.041 | 53.038 | 0.017 | 0.364 | 0.157 | 0.120 | 0.078 | 0.066 | 0.062 | 0.055 | 0.038 | 0.060 |
| San Marino | + | Y | 290 | 31 | 139 | 0.100 | 19.638 | 0.000 | 0.125 | 0.080 | 106.677 | 0.028 | 0.379 | 0.197 | 0.134 | 0.114 | 0.055 | 0.062 | 0.031 | 0.014 | 0.014 |
| Romania | + | Y | 1251 | 46 | 60 | 0.054 | 5.123 | 0.077 | 0.061 | 0.038 | 31.636 | 0.014 | 0.306 | 0.220 | 0.137 | 0.089 | 0.053 | 0.070 | 0.043 | 0.044 | 0.039 |
| Liberia | - | Y | 281 | 35 | 111 | 0.135 | 26.918 | 0.000 | 0.130 | 0.081 | 195.629 | 0.029 | 0.431 | 0.171 | 0.125 | 0.078 | 0.064 | 0.043 | 0.028 | 0.028 | 0.032 |
| Guatemala | - | Y | 1295 | 33 | 125 | 0.061 | 29.478 | 0.000 | 0.061 | 0.038 | 40.320 | 0.017 | 0.261 | 0.165 | 0.141 | 0.097 | 0.053 | 0.098 | 0.076 | 0.052 | 0.056 |
| Guinea | - | Y | 1044 | 33 | 125 | 0.072 | 30.669 | 0.000 | 0.068 | 0.042 | 55.286 | 0.016 | 0.369 | 0.171 | 0.117 | 0.093 | 0.083 | 0.051 | 0.042 | 0.043 | 0.031 |
| Suriname | - | Y | 521 | 37 | 100 | 0.115 | 25.926 | 0.000 | 0.096 | 0.060 | 142.452 | 0.026 | 0.397 | 0.173 | 0.071 | 0.058 | 0.081 | 0.077 | 0.069 | 0.036 | 0.038 |
| Saint Lucia | - | Y | 236 | 34 | 117 | 0.115 | 13.386 | 0.001 | 0.144 | 0.089 | 143.057 | 0.032 | 0.390 | 0.225 | 0.131 | 0.068 | 0.047 | 0.030 | 0.047 | 0.038 | 0.025 |
| Sierra Leone | + | Y | 399 | 38 | 92 | 0.101 | 15.642 | 0.000 | 0.112 | 0.068 | 109.284 | 0.025 | 0.391 | 0.198 | 0.110 | 0.070 | 0.048 | 0.060 | 0.045 | 0.038 | 0.040 |
| Haiti | - | Y | 440 | 32 | 138 | 0.077 | 14.272 | 0.001 | 0.109 | 0.065 | 63.501 | 0.024 | 0.350 | 0.207 | 0.155 | 0.080 | 0.059 | 0.057 | 0.039 | 0.025 | 0.030 |
| South Africa | - | Y | 1307 | 55 | 34 | 0.051 | 9.914 | 0.007 | 0.064 | 0.038 | 27.618 | 0.014 | 0.323 | 0.208 | 0.135 | 0.094 | 0.054 | 0.047 | 0.049 | 0.050 | 0.040 |
| Timor | - | Y | 139 | 73 | 6 | 0.210 | 25.374 | 0.000 | 0.195 | 0.115 | 472.994 | 0.046 | 0.496 | 0.151 | 0.086 | 0.029 | 0.065 | 0.029 | 0.036 | 0.065 | 0.043 |
| Guyana | - | Y | 577 | 32 | 137 | 0.077 | 14.948 | 0.001 | 0.096 | 0.057 | 63.211 | 0.021 | 0.315 | 0.236 | 0.144 | 0.101 | 0.049 | 0.042 | 0.050 | 0.036 | 0.028 |
| India | + | Y | 1320 | 47 | 57 | 0.085 | 52.542 | 0.000 | 0.064 | 0.037 | 77.131 | 0.024 | 0.345 | 0.116 | 0.108 | 0.092 | 0.064 | 0.057 | 0.073 | 0.072 | 0.074 |
| Moldova | - | Y | 884 | 43 | 78 | 0.085 | 29.256 | 0.000 | 0.079 | 0.046 | 78.338 | 0.019 | 0.380 | 0.160 | 0.102 | 0.075 | 0.064 | 0.072 | 0.053 | 0.049 | 0.045 |
| Trinidad and Tobago | - | Y | 853 | 37 | 99 | 0.066 | 15.502 | 0.000 | 0.081 | 0.047 | 47.259 | 0.019 | 0.347 | 0.211 | 0.101 | 0.086 | 0.083 | 0.050 | 0.047 | 0.042 | 0.033 |
| Armenia | - | Y | 1063 | 50 | 44 | 0.059 | 32.450 | 0.000 | 0.074 | 0.042 | 37.683 | 0.017 | 0.324 | 0.217 | 0.134 | 0.099 | 0.077 | 0.049 | 0.050 | 0.030 | 0.021 |
| Egypt | + | Y | 901 | 40 | 87 | 0.139 | 30.916 | 0.000 | 0.081 | 0.045 | 206.061 | 0.038 | 0.382 | 0.088 | 0.070 | 0.127 | 0.115 | 0.092 | 0.039 | 0.048 | 0.040 |
| Austria | - | Y | 1265 | 59 | 26 | 0.066 | 8.700 | 0.013 | 0.068 | 0.038 | 47.003 | 0.017 | 0.295 | 0.226 | 0.149 | 0.064 | 0.074 | 0.066 | 0.053 | 0.047 | 0.026 |
| Bhutan | - | Y | 636 | 40 | 85 | 0.082 | 23.532 | 0.000 | 0.097 | 0.054 | 71.710 | 0.022 | 0.366 | 0.208 | 0.124 | 0.088 | 0.063 | 0.035 | 0.042 | 0.038 | 0.036 |
| Kazakhstan | + | Y | 1160 | 41 | 83 | 0.061 | 18.710 | 0.000 | 0.072 | 0.040 | 40.319 | 0.017 | 0.313 | 0.222 | 0.139 | 0.095 | 0.061 | 0.043 | 0.040 | 0.034 | 0.053 |
| Dominican Republic | - | Y | 1205 | 38 | 91 | 0.069 | 14.702 | 0.001 | 0.071 | 0.039 | 51.746 | 0.019 | 0.255 | 0.151 | 0.163 | 0.122 | 0.090 | 0.078 | 0.051 | 0.052 | 0.037 |
| Macedonia | - | Y | 1273 | 44 | 67 | 0.055 | 13.658 | 0.001 | 0.070 | 0.038 | 32.322 | 0.015 | 0.339 | 0.184 | 0.149 | 0.087 | 0.056 | 0.046 | 0.049 | 0.047 | 0.043 |
| Mauritania | - | Y | 621 | 28 | 157 | 0.089 | 26.356 | 0.000 | 0.100 | 0.055 | 85.478 | 0.022 | 0.382 | 0.192 | 0.129 | 0.077 | 0.066 | 0.052 | 0.034 | 0.040 | 0.029 |
| Libya | - | Y | 1032 | 26 | 168 | 0.061 | 13.766 | 0.001 | 0.078 | 0.042 | 40.384 | 0.017 | 0.267 | 0.132 | 0.135 | 0.103 | 0.096 | 0.080 | 0.069 | 0.065 | 0.053 |
| Jamaica | - | Y | 911 | 29 | 147 | 0.081 | 18.392 | 0.000 | 0.083 | 0.045 | 70.719 | 0.022 | 0.245 | 0.149 | 0.132 | 0.102 | 0.104 | 0.114 | 0.053 | 0.064 | 0.037 |
| Antigua and Barbuda | - | Y | 167 | 29 | 147 | 0.182 | 28.846 | 0.000 | 0.194 | 0.105 | 354.099 | 0.044 | 0.467 | 0.174 | 0.156 | 0.060 | 0.054 | 0.030 | 0.012 | 0.036 | 0.012 |
| Panama | - | Y | 1327 | 44 | 68 | 0.053 | 24.376 | 0.000 | 0.071 | 0.037 | 30.231 | 0.016 | 0.285 | 0.137 | 0.109 | 0.103 | 0.087 | 0.075 | 0.070 | 0.064 | 0.069 |
| Mongolia | - | Y | 528 | 50 | 46 | 0.127 | 32.670 | 0.000 | 0.114 | 0.059 | 172.786 | 0.030 | 0.415 | 0.133 | 0.095 | 0.072 | 0.093 | 0.044 | 0.061 | 0.055 | 0.034 |
| Japan | - | Y | 1403 | 60 | 21 | 0.062 | 13.994 | 0.001 | 0.071 | 0.036 | 40.952 | 0.017 | 0.256 | 0.161 | 0.114 | 0.117 | 0.109 | 0.086 | 0.063 | 0.045 | 0.050 |
| Palestine | - | Y | 1025 | 22 | 179 | 0.086 | 20.281 | 0.000 | 0.084 | 0.042 | 78.862 | 0.022 | 0.243 | 0.150 | 0.133 | 0.150 | 0.107 | 0.074 | 0.060 | 0.043 | 0.040 |
| Switzerland | - | Y | 1132 | 67 | 13 | 0.058 | 23.038 | 0.000 | 0.082 | 0.040 | 36.236 | 0.018 | 0.337 | 0.205 | 0.141 | 0.085 | 0.067 | 0.046 | 0.045 | 0.037 | 0.036 |
| Barbados | + | Y | 318 | 32 | 133 | 0.144 | 37.916 | 0.000 | 0.156 | 0.076 | 224.021 | 0.035 | 0.431 | 0.192 | 0.126 | 0.107 | 0.041 | 0.044 | 0.016 | 0.028 | 0.016 |
| Cote d’Ivoire | - | Y | 985 | 45 | 62 | 0.070 | 25.310 | 0.000 | 0.089 | 0.043 | 52.255 | 0.020 | 0.338 | 0.221 | 0.132 | 0.090 | 0.062 | 0.037 | 0.041 | 0.039 | 0.041 |
| Zimbabwe | - | Y | 1004 | 38 | 92 | 0.089 | 38.520 | 0.000 | 0.089 | 0.043 | 85.562 | 0.020 | 0.386 | 0.179 | 0.111 | 0.080 | 0.073 | 0.057 | 0.041 | 0.036 | 0.038 |
| Estonia | - | Y | 1145 | 57 | 29 | 0.080 | 9.786 | 0.007 | 0.084 | 0.040 | 69.405 | 0.023 | 0.263 | 0.130 | 0.145 | 0.121 | 0.123 | 0.080 | 0.062 | 0.046 | 0.030 |
| China | - | Y | 572 | 48 | 51 | 0.127 | 39.363 | 0.000 | 0.120 | 0.057 | 173.961 | 0.027 | 0.421 | 0.171 | 0.100 | 0.084 | 0.040 | 0.045 | 0.054 | 0.042 | 0.042 |
| Sri Lanka | + | Y | 1105 | 34 | 120 | 0.094 | 38.592 | 0.000 | 0.087 | 0.041 | 95.596 | 0.019 | 0.386 | 0.177 | 0.083 | 0.080 | 0.072 | 0.057 | 0.058 | 0.048 | 0.038 |
| Taiwan | + | Y | 853 | 20 | 188 | 0.089 | 27.857 | 0.000 | 0.100 | 0.047 | 85.408 | 0.022 | 0.381 | 0.196 | 0.113 | 0.074 | 0.059 | 0.059 | 0.042 | 0.049 | 0.028 |
| Hungary | - | Y | 1299 | 54 | 35 | 0.079 | 23.001 | 0.000 | 0.081 | 0.038 | 66.352 | 0.022 | 0.362 | 0.196 | 0.113 | 0.074 | 0.048 | 0.054 | 0.038 | 0.051 | 0.064 |
| Montenegro | - | Y | 707 | 44 | 68 | 0.105 | 16.849 | 0.000 | 0.111 | 0.051 | 119.439 | 0.029 | 0.232 | 0.134 | 0.130 | 0.141 | 0.132 | 0.088 | 0.065 | 0.038 | 0.040 |
| France | - | Y | 1281 | 68 | 11 | 0.094 | 76.522 | 0.000 | 0.082 | 0.038 | 94.449 | 0.028 | 0.258 | 0.212 | 0.188 | 0.123 | 0.071 | 0.046 | 0.032 | 0.045 | 0.024 |
| Gambia | - | Y | 614 | 34 | 117 | 0.091 | 30.900 | 0.000 | 0.123 | 0.055 | 88.921 | 0.027 | 0.370 | 0.204 | 0.151 | 0.081 | 0.059 | 0.046 | 0.034 | 0.021 | 0.034 |
| Denmark | - | Y | 1256 | 70 | 8 | 0.096 | 49.049 | 0.000 | 0.088 | 0.038 | 98.450 | 0.021 | 0.389 | 0.142 | 0.105 | 0.084 | 0.067 | 0.051 | 0.061 | 0.055 | 0.047 |
| Iran | + | Y | 1127 | 38 | 97 | 0.112 | 5.333 | 0.069 | 0.093 | 0.041 | 135.330 | 0.028 | 0.304 | 0.265 | 0.073 | 0.062 | 0.048 | 0.065 | 0.072 | 0.071 | 0.040 |
| Cyprus | - | Y | 1029 | 43 | 77 | 0.070 | 44.142 | 0.000 | 0.100 | 0.042 | 52.767 | 0.022 | 0.339 | 0.208 | 0.152 | 0.100 | 0.065 | 0.043 | 0.035 | 0.035 | 0.023 |
| Gabon | - | Y | 293 | 20 | 186 | 0.148 | 30.780 | 0.000 | 0.190 | 0.079 | 234.031 | 0.042 | 0.416 | 0.235 | 0.140 | 0.065 | 0.038 | 0.034 | 0.024 | 0.034 | 0.014 |
| Honduras | - | Y | 803 | 28 | 156 | 0.084 | 27.827 | 0.000 | 0.116 | 0.048 | 75.724 | 0.026 | 0.280 | 0.125 | 0.081 | 0.122 | 0.093 | 0.097 | 0.075 | 0.072 | 0.055 |
| United Arab Emirates | - | Y | 1313 | 47 | 56 | 0.078 | 51.925 | 0.000 | 0.102 | 0.038 | 66.126 | 0.023 | 0.349 | 0.223 | 0.132 | 0.096 | 0.059 | 0.043 | 0.037 | 0.034 | 0.027 |
| Venezuela | - | Y | 793 | 23 | 176 | 0.119 | 22.070 | 0.000 | 0.137 | 0.048 | 151.751 | 0.031 | 0.252 | 0.088 | 0.130 | 0.155 | 0.087 | 0.096 | 0.078 | 0.071 | 0.043 |
| Finland | - | Y | 1121 | 69 | 10 | 0.093 | 38.588 | 0.000 | 0.116 | 0.041 | 93.114 | 0.026 | 0.371 | 0.222 | 0.100 | 0.085 | 0.063 | 0.043 | 0.036 | 0.039 | 0.041 |
| Syria | - | Y | 704 | 20 | 188 | 0.136 | 24.703 | 0.000 | 0.162 | 0.051 | 198.265 | 0.036 | 0.250 | 0.071 | 0.119 | 0.138 | 0.125 | 0.112 | 0.074 | 0.057 | 0.054 |
| Saudi Arabia | - | Y | 1345 | 49 | 47 | 0.128 | 37.702 | 0.000 | 0.125 | 0.037 | 176.310 | 0.037 | 0.251 | 0.100 | 0.178 | 0.153 | 0.129 | 0.073 | 0.042 | 0.025 | 0.048 |
| Ethiopia | - | Y | 1222 | 41 | 84 | 0.112 | 37.873 | 0.000 | 0.147 | 0.039 | 134.157 | 0.033 | 0.259 | 0.102 | 0.094 | 0.123 | 0.128 | 0.104 | 0.083 | 0.063 | 0.044 |
Table 4.
Abbreviations.
| ABBREVIATION | DESCRIPTION |
|---|---|
| Location | Country or territory |
| Improve | Development of Benford’s Law in reporting, including positive and negative development |
| Flag | Red, Green, and Yellow |
| N | Number of sample |
| d* | d-factor |
| Chi square | The Chi square goodness of fit test |
| p-value | p-value of the Chi square |
| K-S | Kolmogorov-Smirnov statistic |
| Cut-Off | Kolmogorov-Smirnov cut off |
| SSD | Sum of Squares Difference |
| MAD | Mean Absolute Deviation |
| 1 | Leading digit frequency with 1 |
| 2 | Leading digit frequency with 2 |
| 3 | Leading digit frequency with 3 |
| 4 | Leading digit frequency with 4 |
| 5 | Leading digit frequency with 5 |
| 6 | Leading digit frequency with 6 |
| 7 | Leading digit frequency with 7 |
| 8 | Leading digit frequency with 8 |
| 9 | Leading digit frequency with 9 |
Publisher’s Note: MDPI stays neutral with regard to jurisdictional claims in published maps and institutional affiliations. |
© 2021 by the authors. Licensee MDPI, Basel, Switzerland. This article is an open access article distributed under the terms and conditions of the Creative Commons Attribution (CC BY) license (https://creativecommons.org/licenses/by/4.0/).
Share and Cite
MDPI and ACS Style
Farhadi, N.; Lahooti, H. Are COVID-19 Data Reliable? A Quantitative Analysis of Pandemic Data from 182 Countries. COVID 2021, 1, 137-152. https://0-doi-org.brum.beds.ac.uk/10.3390/covid1010013
AMA Style
Farhadi N, Lahooti H. Are COVID-19 Data Reliable? A Quantitative Analysis of Pandemic Data from 182 Countries. COVID. 2021; 1(1):137-152. https://0-doi-org.brum.beds.ac.uk/10.3390/covid1010013
Chicago/Turabian StyleFarhadi, Noah, and Hooshang Lahooti. 2021. "Are COVID-19 Data Reliable? A Quantitative Analysis of Pandemic Data from 182 Countries" COVID 1, no. 1: 137-152. https://0-doi-org.brum.beds.ac.uk/10.3390/covid1010013