
Evaluation of COVID-19 Reported Statistical Data Using Cooperative Convolutional Neural Network Model (CCNN)


National Council for Scientific Research, Beirut 11072260, Lebanon
COVID 2022, 2(5), 674-690; https://0-doi-org.brum.beds.ac.uk/10.3390/covid2050051
Submission received: 16 April 2022
/
Revised: 3 May 2022
/
Accepted: 19 May 2022
/
Published: 23 May 2022
Abstract
:Coronavirus disease 2019 (COVID-19) is an infectious disease caused by severe acute respiratory syndrome coronavirus 2 (SARS-CoV-2). The disease was first identified in December 2019 in Wuhan, the capital of China’s Hubei province, and has since spread globally, resulting in the ongoing coronavirus pandemic. The most important type of COVID-19 confrontation is the use of polymerase chain reaction testing (PCR) to detect if a person is healthy or infected with COVID-19. Many countries released different numbers about the total cases of infected persons with the pandemic based on the number of total PCRs and other statistical numbers related to this disease. The total case numbers for some countries were very promising, such that they implied that these countries were to recover soon from these diseases. At other times, some countries overestimated the total number of cases or deaths to get financial aid. Therefore, there is a need to verify and evaluate these numbers by using machine-learning algorithms that proved to be efficient in solving many problems. The convolutional neural network (CNN) is an advanced machine-learning algorithm that was deployed to detect COVID-19 from different medical images such as X-ray images. However, CNN was not used to validate the published COVID-19 statistical data. In this paper, we adapted the self-organizing UNet (SO-UNet) in the cooperative convolutional neural network (CCNN) model to detect the accuracy of the reported COVID-19 statistics. The detection is based on using COVID-19 statistical variables that are reported by reliable and credible databases provided by known global organizations. These variables are used to create multi-dimension images to train and test the CCNN model. The results showed that reported important statistics for COVID-19 could be verified using the CCNN model. It also showed that the verified data coincided with the verification reported by the most important and trusted organizations in the world. Finally, the comparison of the new model to Benford’s law outcome proved the model’s credibility and efficiency in validating COVID-19 reported data.
1. Introduction
A pandemic is an epidemic of a disease that has spread across a large region, for instance, multiple continents or worldwide [1]. Throughout history, there have been several pandemics of respiratory diseases, such as the 1918 influenza pandemic (Spanish flu), also known as the 1918 flu pandemic [2]. Lasting from January 1918 to December 1920, it infected 500 million people—about a quarter of the world’s population at that time. The death toll is estimated to have been anywhere from 17 million to 50 million, and possibly as high as 100 million, making it one of the deadliest pandemics in human history.
In the 21st century, the deadliest known respiratory diseases are the coronavirus diseases, which started with the epidemic of severe acute respiratory syndrome (SARS) in 2002–2003, and the Middle East respiratory syndrome (MERS) in 2012 [3,4]. In addition, at the end of December 2019, another coronavirus (COVID-19) outbreak emerged, again causing global concern in human public health [5]. There were many theories about the origin of COVID-19, but according to [6], the SARS-CoV and SARS-CoV-2 emerged in China, which is home to more than 100 species of bats, many of which carry α- and/or β-coronaviruses.
Conducting PCR tests helps in fighting the spread of the pandemic. However, some countries try to avoid publishing the real number of tests to avoid the declaration of the number of infected people to avoid economic deterioration caused by a national lockdown. Others increase the number of PCR tests to get financial and medical support from international organizations [7].
There is literature that tackled the topic of fraud in COVID-19 tests or cases such as the study conducted by Kennedy et al. [8], where the authors used two different statistical methods and World Health Organization data to find fraud in the reported numbers by many nations. The authors proved that there are cases where reported statistics are unconvincing. Wu et al. [9] tackled the problem of COVID-19 underestimation in the United States. The authors used a semi-Bayesian probabilistic bias analysis to describe the incomplete testing and the imperfect diagnostic accuracy. According to the research study, the reported number of infections was 3 to 20 times higher than the number of confirmed cases.
However, authors used methods that work well for linear data and that is not the case for COVID-19 reported data where it is considered a non-linear problem [10,11,12].
Due to its efficiency and robustness in finding solutions for many non-linear and complex problems [13], the artificial neural network (ANN) is used in predicting many issues related to different disciplines such as environment, agriculture, medicine, climate, economy, and military [14,15,16,17].
Several types of research have tackled COVID-19 in different aspects using ANN. An important review on the use of ANN for COVID-19-related issues resulted in dividing the tackled topics into three [18]: (1) the epidemiology of COVID-19 where ANN is used to predict the spread of the pandemic or to predict the social behavior of the societies and individuals during the pandemic; (2) the diagnosis of COVID-19 where ANN is used to help in the COVID-19 diagnosis; and (3) the therapy for COVID-19 where authors indicated that there is poor literature and the only reliable published one is related to the use of ANN in finding different compounds for drugs.
ANN was used to predict the future number of cases (different countries) by taking the last 14 days [19]. Although the authors did not indicate the type of the artificial neural network, we concluded using several facts and clues that it is a feed-forward network (FFN). The results show low R2 except for one case (country).
ANN is also used to predict the number of rising COVID-19 infection and death cases in India, the USA, France, and the UK, considering the progressive trends of China and South Korea [20]. In this research, the accuracy of the results is not published, except the successful predictions of some cases. Moreover, there is no indication of the type of ANN network.
ANN’s multilayer perceptron type was used to predict the number of deaths and beds in Brazilian hospitals [21]. The research deployed different scenarios and the best were scenarios 3, 5, and 6 in predicting hospital bed occupancy on the 9th, 13th, and 20th days, respectively.
From the above literature, one can see that supervised ANN such as the feed-forward network (FFN) or multilayer perceptron networks was used in predicting many issues related to COVID-19 such as the number of cases, deaths, and occupied beds. ANN models were not used to verify COVID-19 multi-statistical variables from different sources or locations. This can be justified by the nature of ANN, which may fall in local minima and because of many factors including network architecture, the number of iterations, lack of complete data, and other important tuning issues [22,23].
2. State of the Art and Objectives
Investigating the literature, we mainly found that CNN was used to identify people infected with COVID-19 based on specific images such as X-ray images [24,25,26]. There is some existing research related to handling COVID-19 statistical data using CNN. Rahman et al. [27] proposed a CNN architecture to determine the number of people wearing facial masks from images captured by CCTV cameras. The outcome was a successful and promising one for more advanced results.
Another research conducted by Coppock et al. [28] to detect COVID-19 and control the spread of the pandemic using CNN architecture, and breath and cough audio.
CNN is also used to monitor people adopting safety measures [29] by placing cameras that track people’s compliance with the new safety measures.
The literature review showed that deep neural networks such as CNN can be used to help solve many issues related to COVID-19 such as diagnosis, pandemic spread, and people’s behavior. However, CNN and the combination of CNN and other architecture were not used to evaluate reported COVID-19 statistical data.
The hypothesis states that CNN can help in the evaluation of declared statistical data related to COVID-19 such as total tests, total cases, and total deaths data.
The first suggestion is to use UNet [30], which was first designed for medical image segmentation. UNet was later modified by including other techniques to solve other problems such as SO-UNet for urban forests [31]. This proves the ability of UNet to adapt to different problems and not only medical segmentation problems. The research work starts with a briefing on the source of data, the creation of input and training data, and the implementation of the cooperative convolutional neural network (CNN) model for the verification of the reported COVID-19 data. Finally, the experimental results and conclusions are provided.
3. Materials and Methods
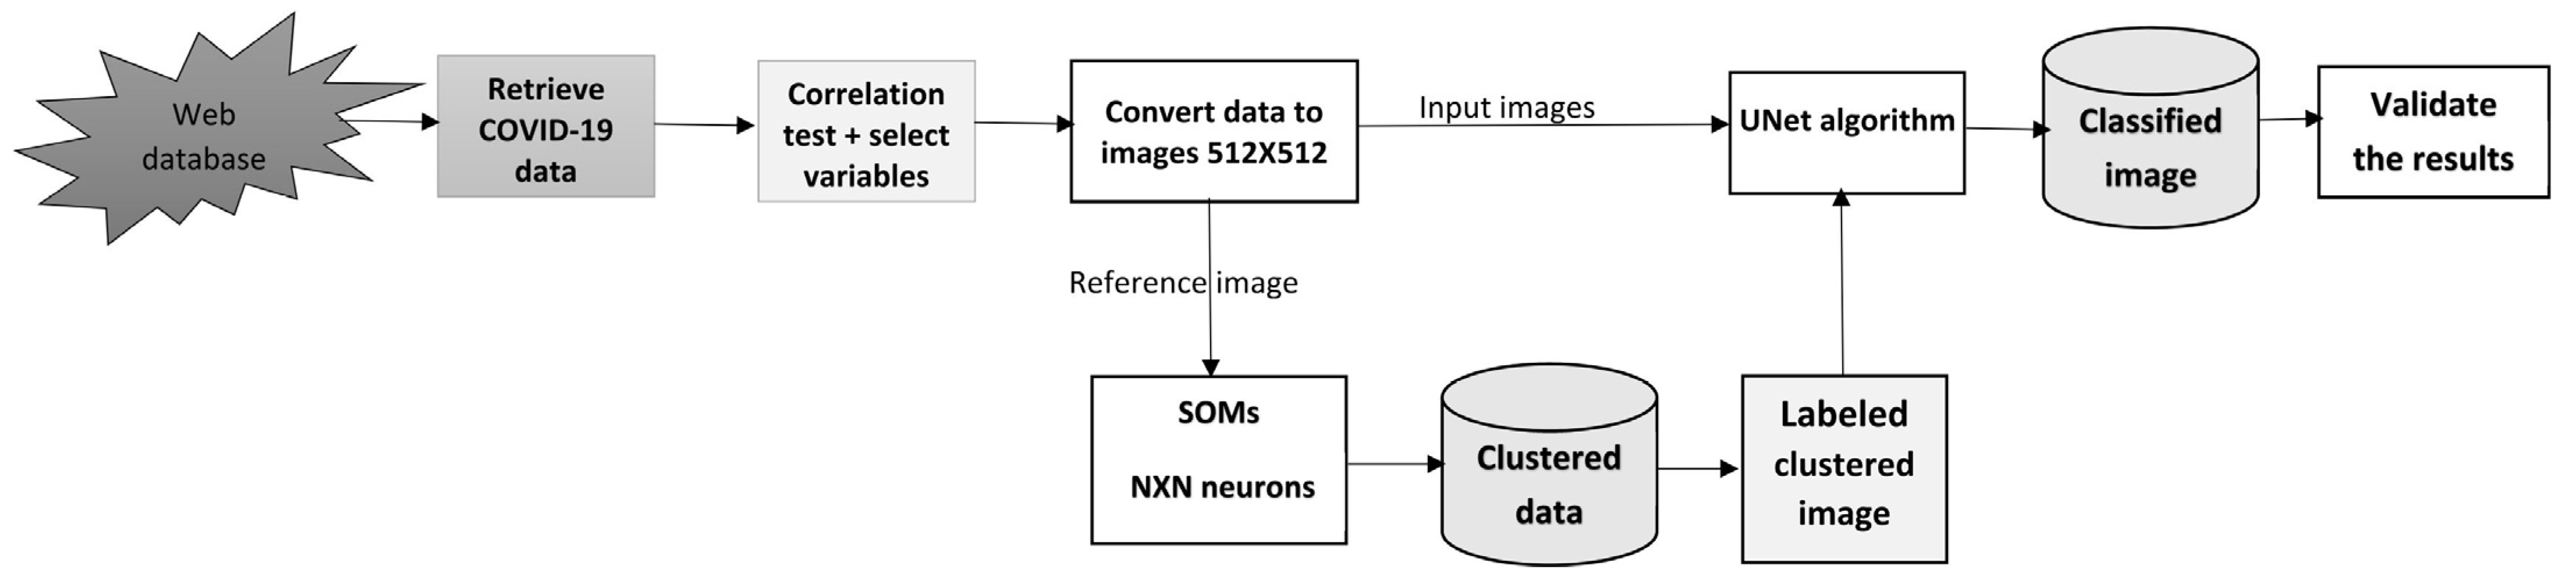
The most difficult issue in dealing with a large set of data is how to turn these data into something useful that can be handled by the most complicated and up-to-date algorithms. In this research, a new innovative model is implemented to handle COVID-19 data to produce different structures of simple multidimension data (Figure 1).
3.1. Data Source
To obtain data for completing the research, a reliable and trustful source of data is needed. For this reason, the data related to COVID-19 are downloaded from the “Our World in Data site” [32], a well-known and reliable database. The COVID-19 dataset reports and visualizes the data on confirmed cases and deaths from Johns Hopkins University (JHU). A team at its Center for Systems Science and Engineering (CSSE) maintains the JHU’s dataset. It has been publishing updates on confirmed cases and deaths for all countries since 22 January 2020. The COVID-19 dataset is available in CSV, XLSX, and JSON formats, and includes all of the historical data on the pandemic up to the date of publication. The CSV and XLSX files follow a format of one row per location and date. The JSON version is split by country ISO code (ISO 3166–1 three-letter country codes), with static variables and an array of daily records. These variables include daily updated COVID-19 information about the number of daily cases, cumulative cases, daily deaths, cumulative deaths, daily test cases, total test cases, daily vaccinated, total vaccinated, and other important information. The following table (Table 1) lists the data included in the dataset:
The data are read from the web and then are written to a file and processed using MATLAB [33]. The code for reading the data is available in Table S1. Different variables are used and are tested for correlation. The stronger has a higher chance to be selected for the model creation. However, this research focuses on selecting complete sets of data that start from an early outbreak of the pandemic until the completion of the research.
The selection of complete data is a tedious process that searches for countries with reliable and complete datasets that include most of the needed variables. The downloaded data were transferred from delimited text files to Microsoft Access Database Management System (DBMS) [34]. The following command shows an example of SQL code to select specific records from the MS Access-imported COVID-19 data.
SELECT Location, Date, Total_cases, Total_tests ROM [COVID-19_DATA] WHERE ((([COVID-19_DATA].Location) = “Canada”));
The above command informs MS Access DBMS to retrieve all COVID-19 records related to Canada. The same command was used to select records for the other countries. It was discovered that few countries have a complete set of data with credibility, such as the United States, Canada, Italy, Germany, France, China, Japan, Russia, United Kingdom, and other countries. Moreover, the objective was to verify the statistical information provided by the official sources in developing countries such as Lebanon and other countries. After checking the information related to Lebanon, we found that a reliable statistical chronological sequence of total PCR tests did not exist. To verify the credibility of total PCRs versus the number of total cases, a model was created based on the reliable selected data of some trusted countries (United States of America (USA), Canada, China, Germany, France, United Kingdom (UK), Japan, Australia, India, Kingdom of Saudi Arabia (KSA), United Arab Emirates (UAE), India, and Italy). However, we excluded some countries because some data were not reported. Some countries such as France, Germany, the United Kingdom (UK), and Australia did not witness the outbreak of this pandemic until a late date and their data are missing important information. Other countries such as China were able to control the outbreak earlier than any other country and large data for 2021 were missing. Finally, according to Bloomberg’s COVID-19 Resilience Ranking [35], the United Arab Emirates (UAE) remains number one worldwide in combating and reporting the COVID-19 pandemic.
3.2. Creating the Input and the Verification of COVID-19 Multidimensional Images
The first task is to select correlated variables for modeling purposes. It is necessary to check the completeness of the data concerning gaps in the provided COVID-19 daily statistics. Then we use the data to find common variables between different trusted countries.
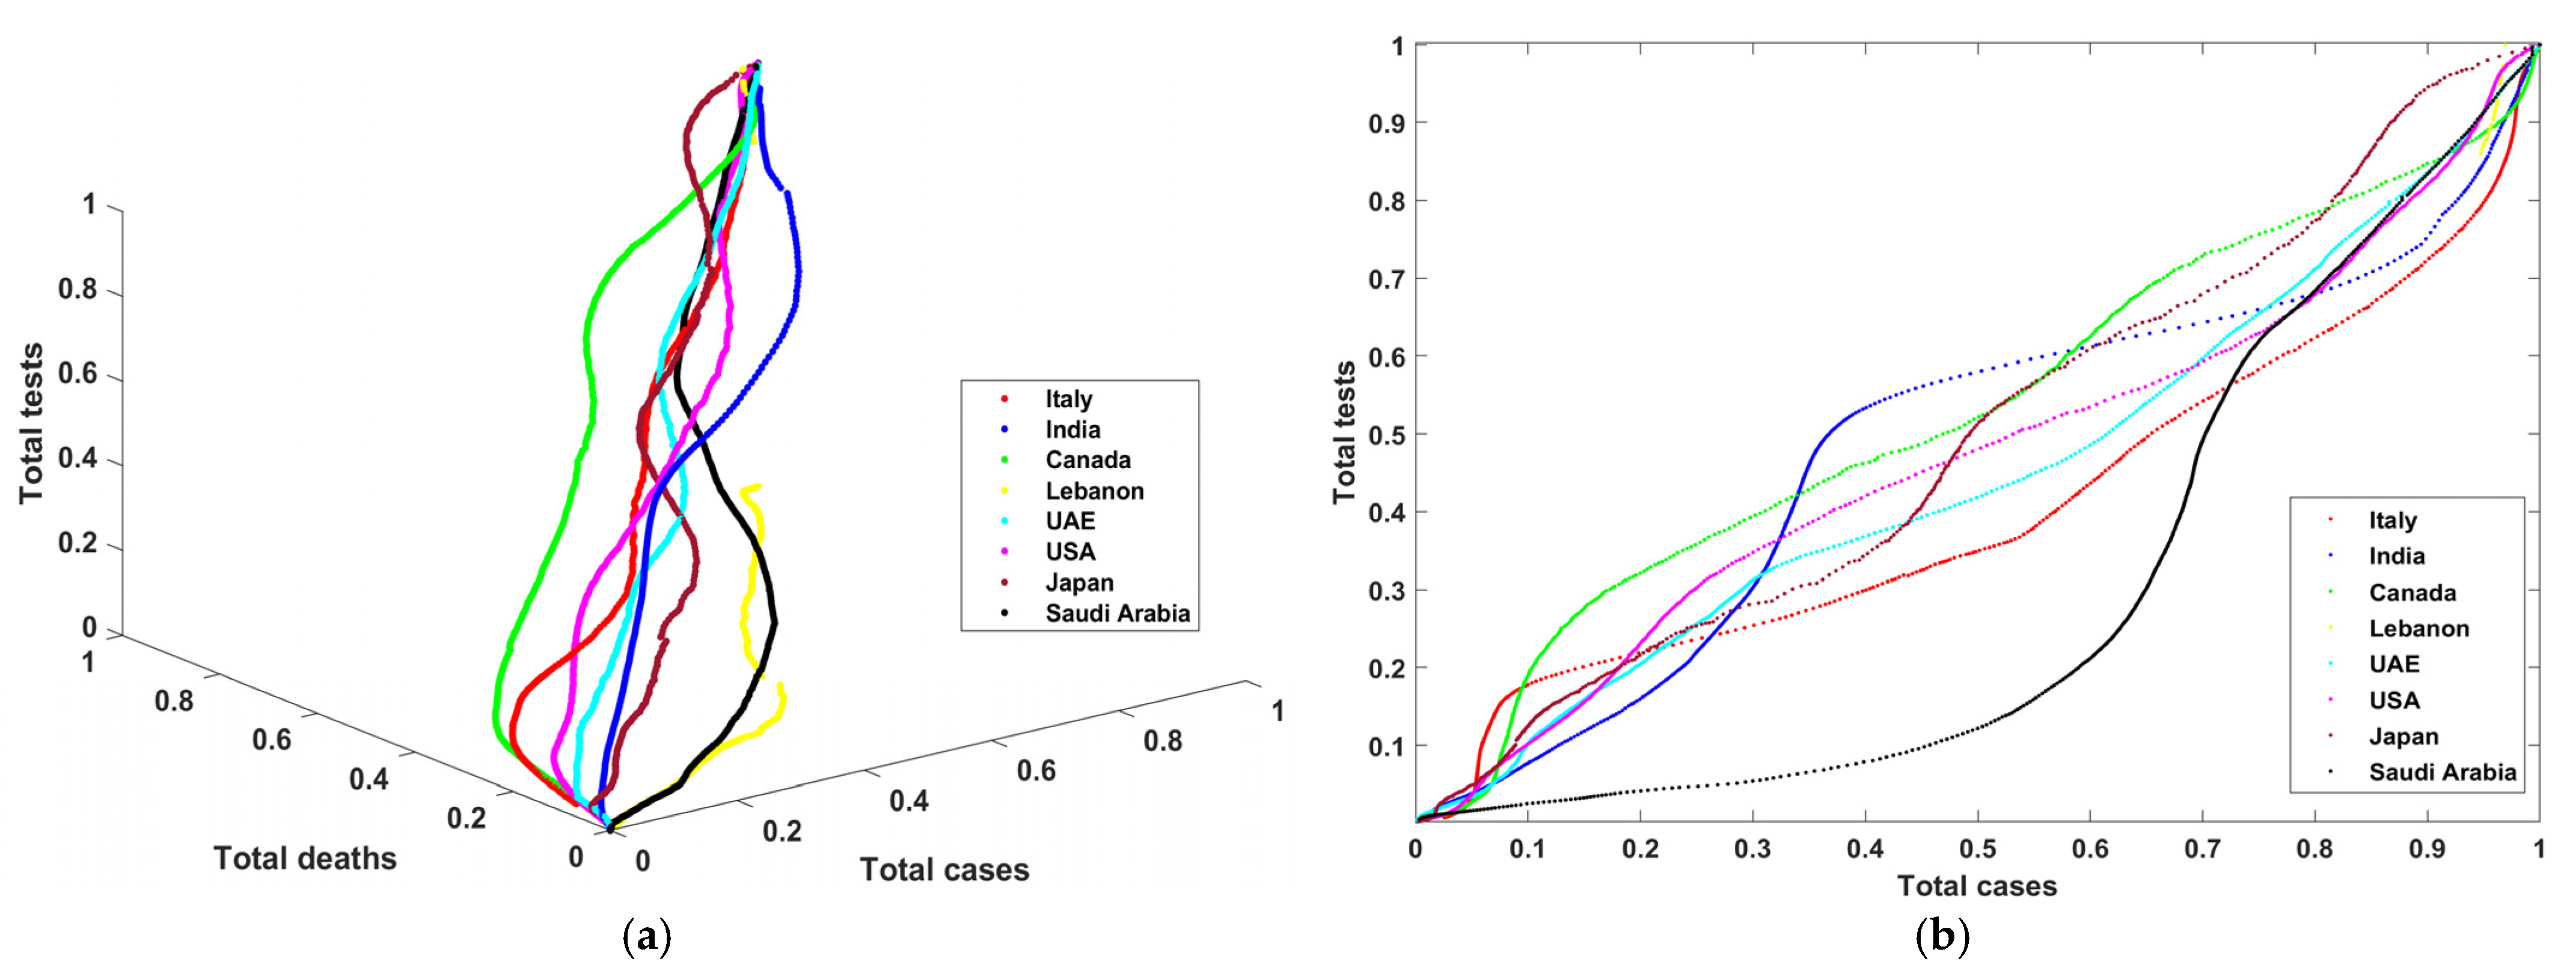
The outcome of this process is a set of variables strongly correlated for each selected country. The starting point for these data is the first week of April 2020 until the end of July 2021. There are 487 records with three variables: the total number of cases (TC), the total number of PCR tests (TT), and the total number of deaths (TD). These variables are normalized by dividing the variable by the maximum-recorded value. We obtained a list of records with values that range between 0 and 1. To measure the correlation between these variables, four different graphs are plotted. Figure 2a shows the curves that describe the progress of total tests vs. total cases vs. total deaths in three dimensions. Figure 2b–d show total tests vs. total cases, total tests vs. total deaths, and total cases vs. total deaths in two dimensions. One can notice in Figure 2a–d that Lebanon (yellow color) has incomplete curves, and that some countries recorded data describing the outbreak and the progress of COVID during that period. Moreover, one can notice from the graphs that there was extensive use of PCR tests and a low number of total cases (except in Saudi Arabia, with low total tests). Later, there was more control of the pandemic such that these PCR tests became proportional to the number of COVID-19 cases. Finally, the number of deaths is also linearly proportional to the number of cases and tests.
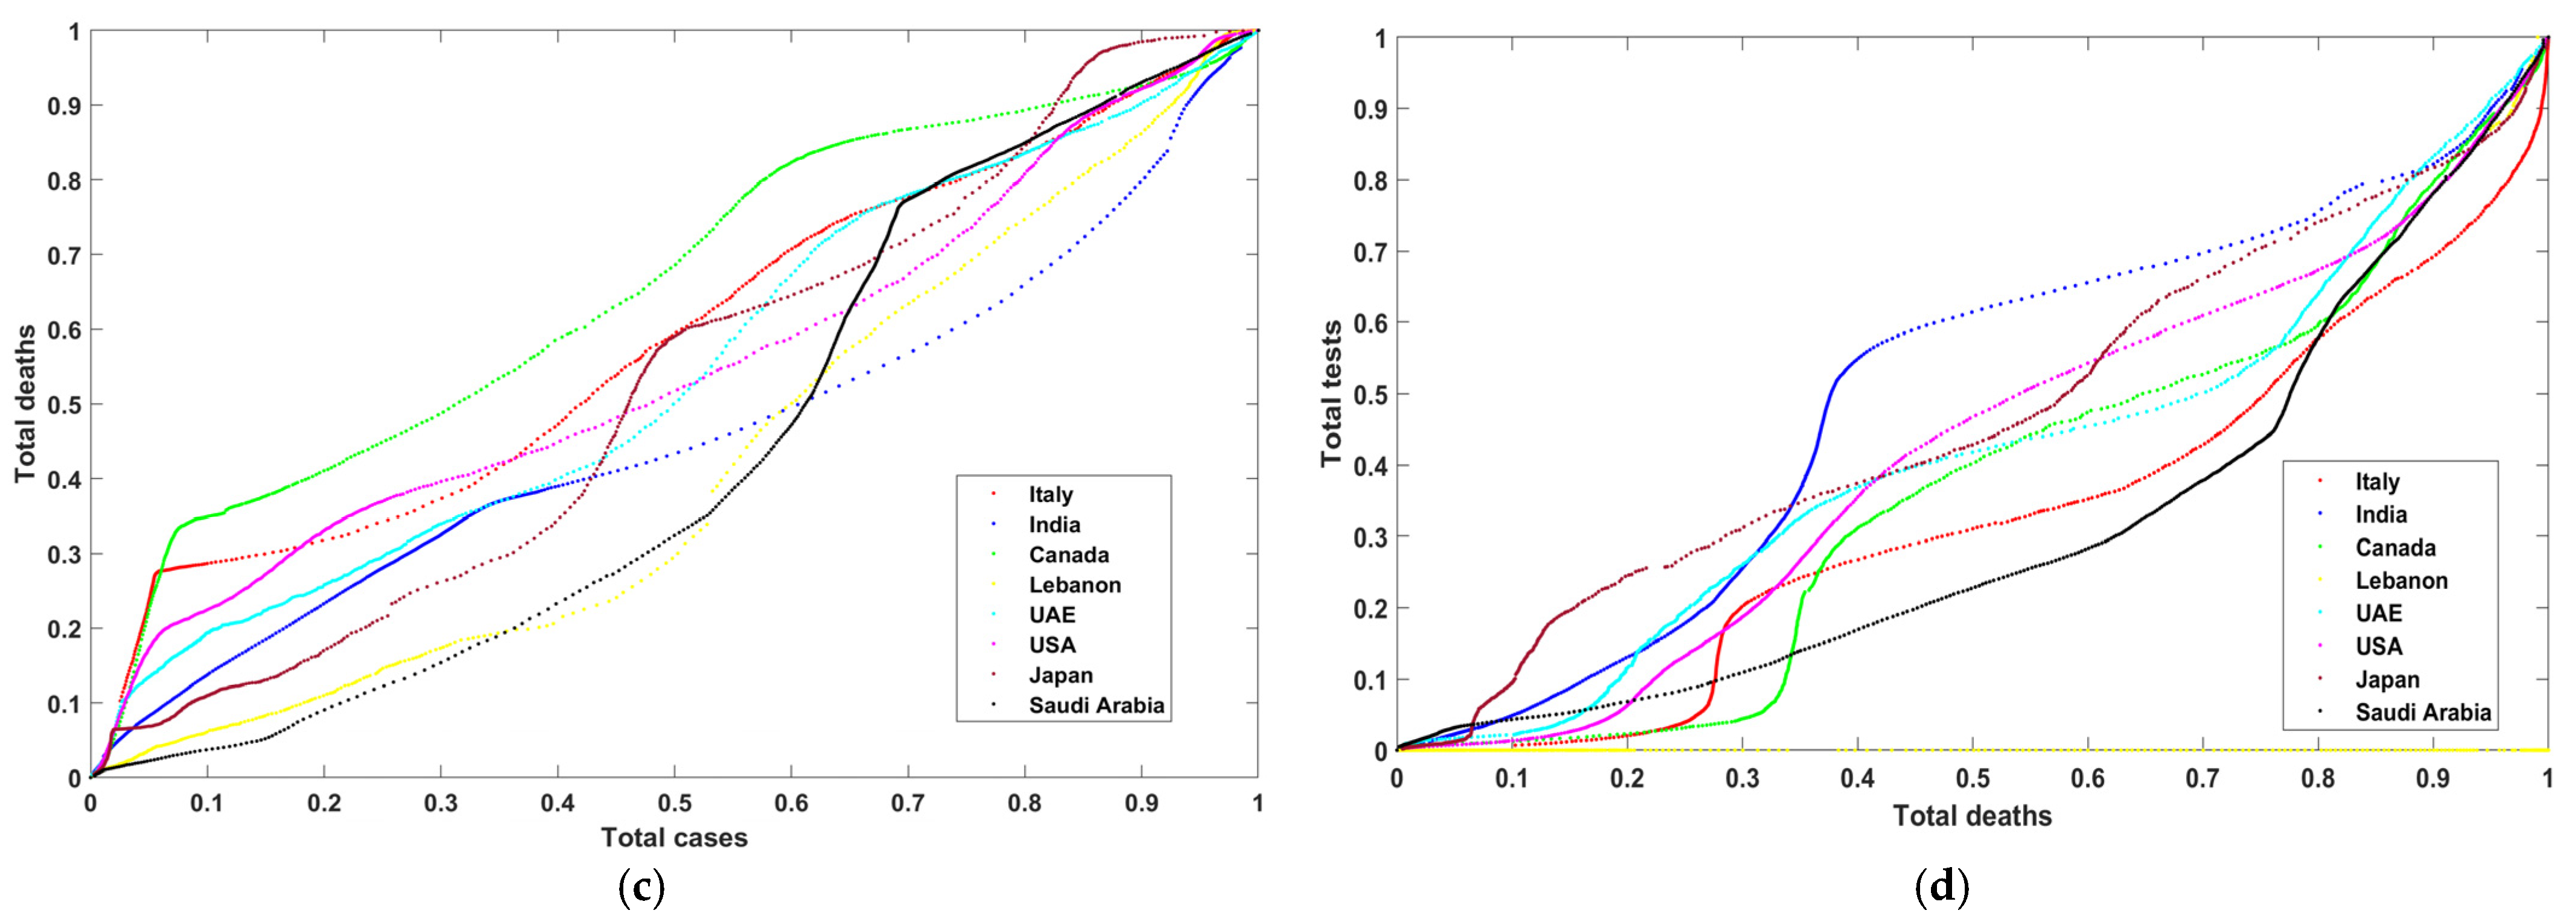
The initial size of the created multidimensional images is 35 ×14 × 3. Next, a bicubic interpolation method [36] is used to resample the images to size 512 × 512 × 3. Figure 3a–h show the resultant multidimensional images representing the USA, Canada, Japan, Saudi Arabia, United Arab Emirates, Italy, India, and Lebanon. These images consist of three bands: red (total tests), green (total deaths), and blue (total cases). One can notice that Figure 3b,h are comparable in color. These two figures represent the UAE and the USA, where both conducted extensive PCR tests. Their reported cases and deaths were coincident with these tests. We can also see Lebanon’s image has white spots on the yellow area. These patterns indicate that some information is missing. Lebanon did not report all test cases (PCRs).
3.3. Clustering and Extracting Patterns Using Self-Organizing Maps (SOMs)
The second task is to use self-organizing maps (SOMs) [22,23] to extract patterns from the reference data. SOMs have some requirements, such as determining the number of neurons and the number of iterations. Moreover, after obtaining the final clustered image, refinement is necessary to reduce over-segmentation. Calculating the Euclidean distance between each neuron and the other remaining neurons is the first step. The final obtained matrix (Euclidean distance) has a size of (N × N) × (N × N) where N is the number of neurons. Moreover, the lower left side of the matrix has all cell values equal zero. The maximum Euclidean distance for each neuron is selected from the matrix’s rows. The final vector is the position of the selected neuron that represents values less than or equal to N. The vector is used to label the final segmented image for use in training UNet. The following equations are used in the SOMs segmentation process.
where is the Euclidean distance between neuron i and neuron j. represents the Euclidean distance for neuron i and is the index of the maximum Euclidean distance in a vector with a length of N × N.
3.4. Evaluation of the COVID-19 Reported Data Using UNet Architecture
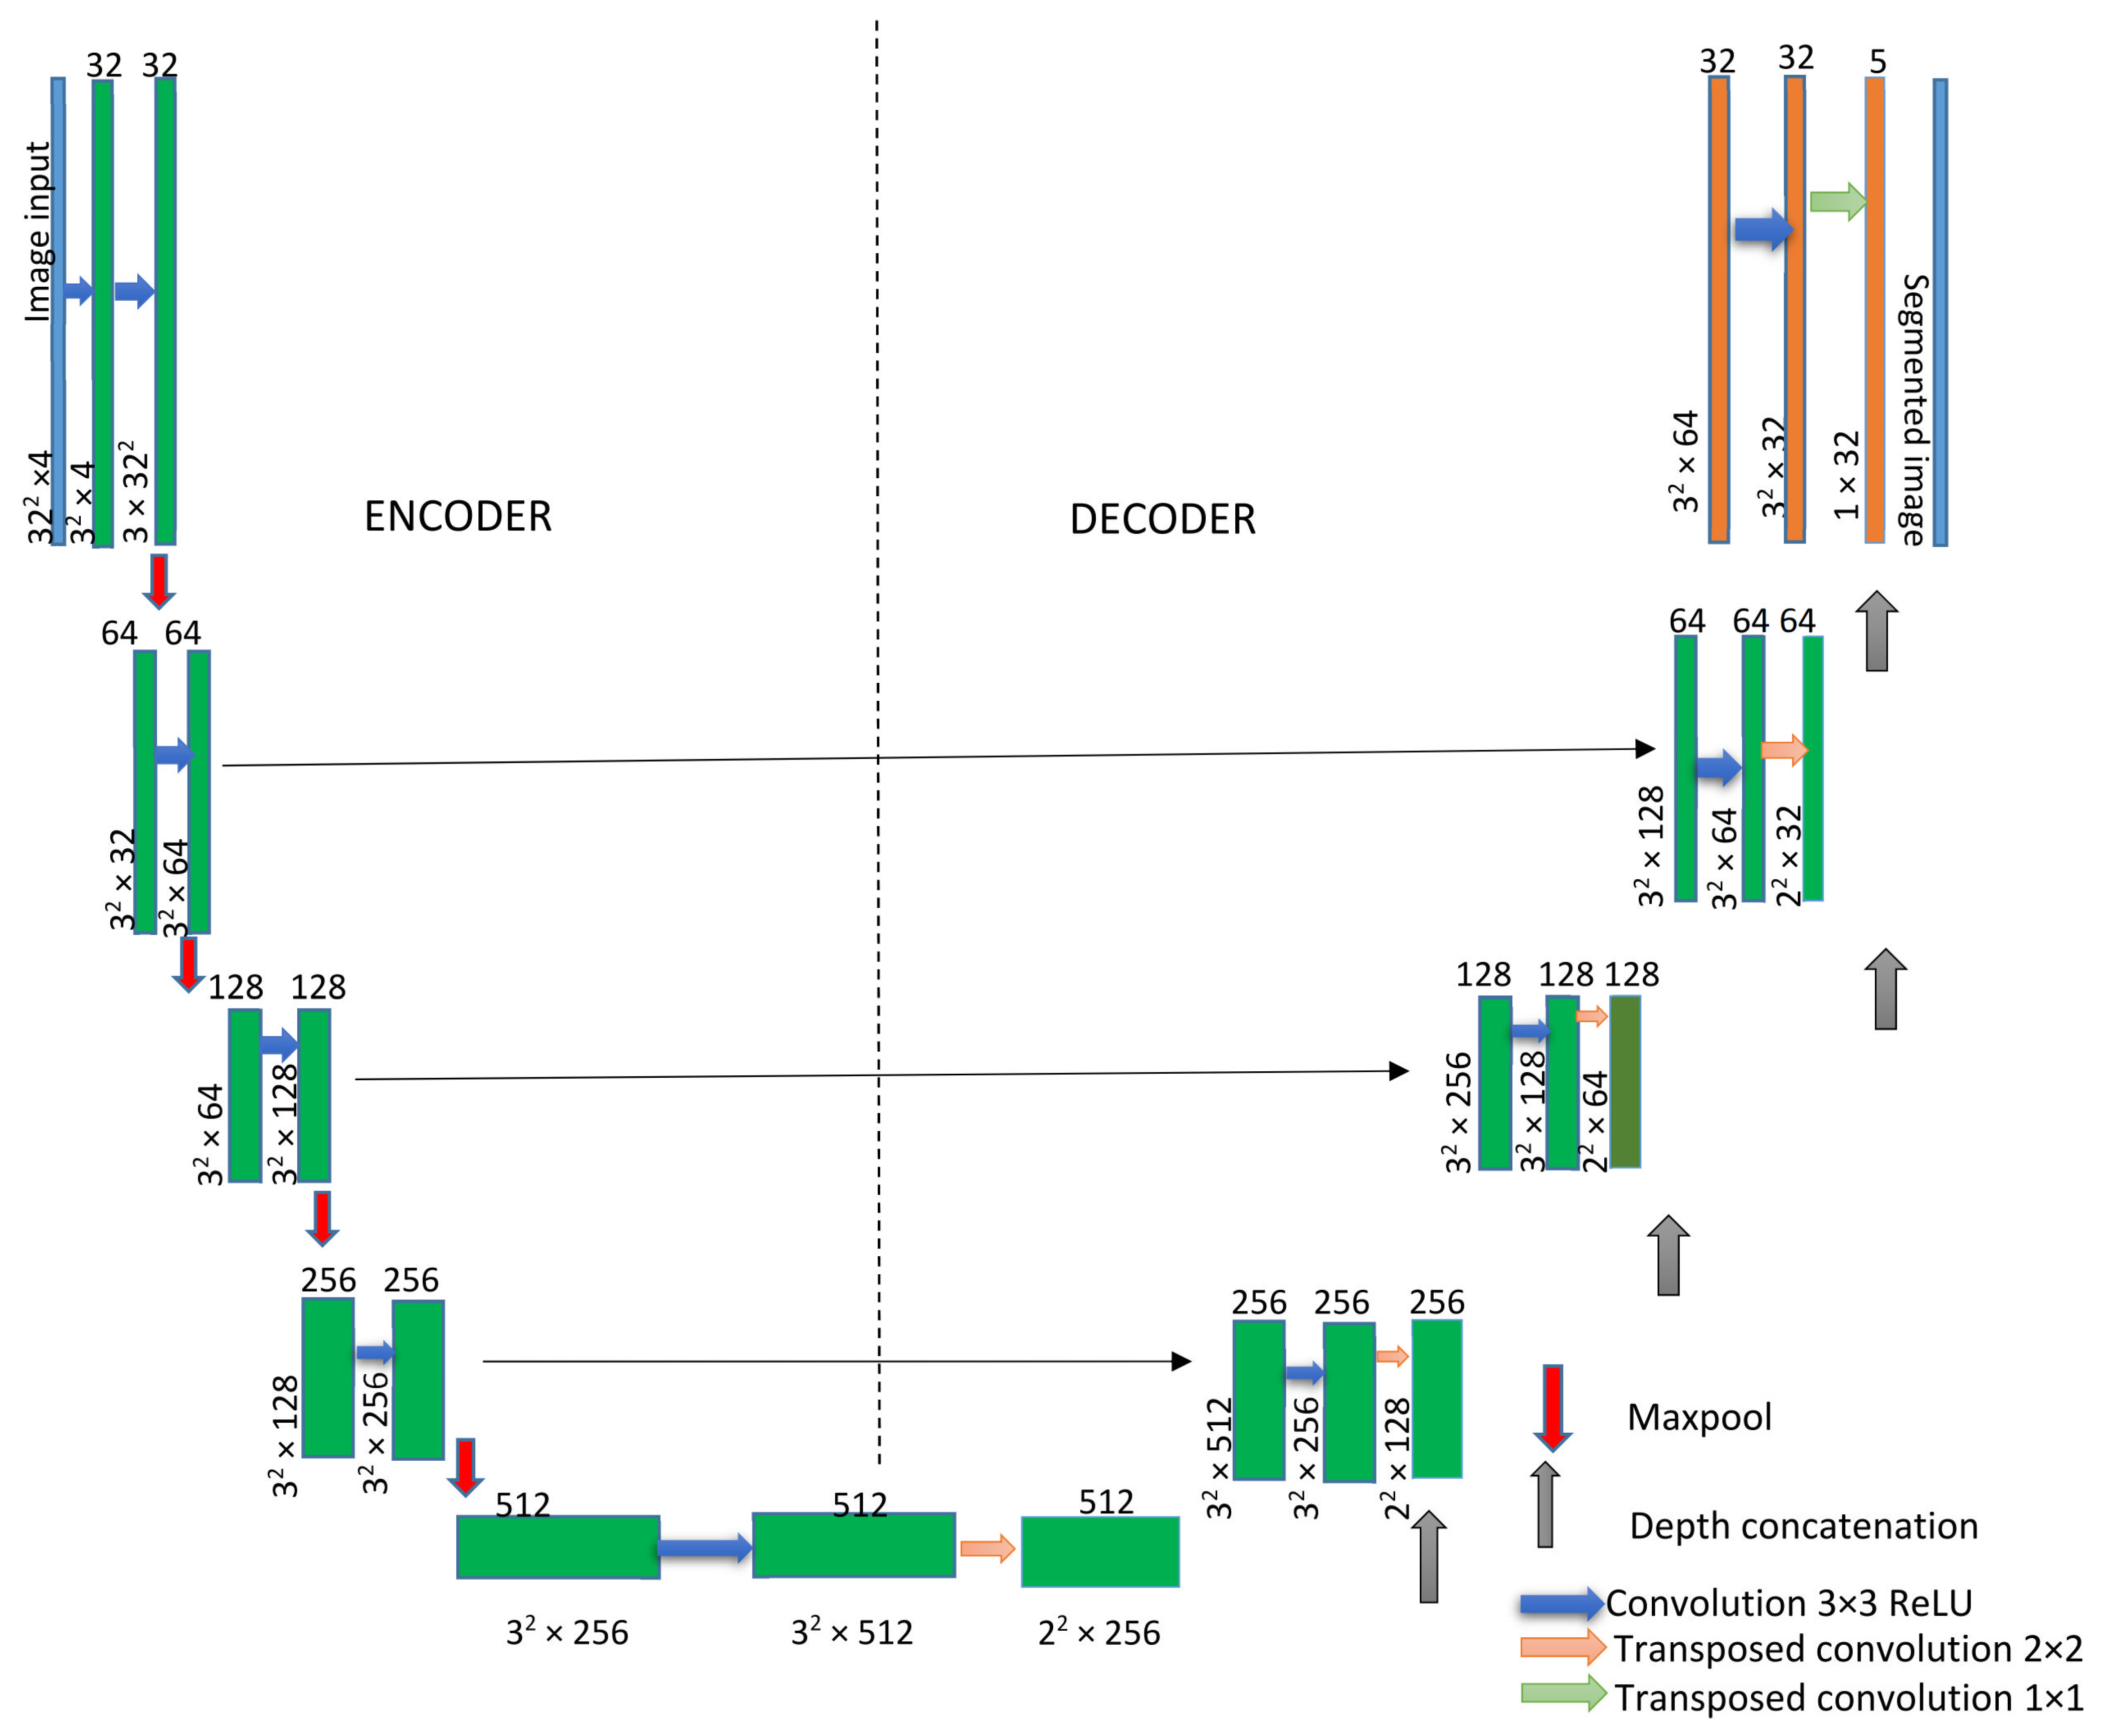
The UNet architecture consists of a decoder and encoder. The encoder decreases the spatial dimensions in every layer while the decoder increases the spatial dimensions. The encoder is the first half of the architecture (Figure 4). Normally, it is a pretrained classification network such as ResNet [37], where you apply convolution blocks, followed by a maximum pool layer as a downscaling process to encode the input image into feature representations at multiple, different levels.
UNet requires the predetermination of many input and setup parameters such as the size and dimension of the input data, training data, number and name of label data, initial learning rate, patches per image, input tile size, maximum epochs, and mini-batch size. The number of iterations is determined according to the following equation:
where is the total number of iterations, is the maximum epochs, is the patches per image, and is the mini-batch size.
Mini-batch gradient descent is a variation of the gradient descent algorithm that splits the training dataset into small batches that are used to calculate model error and update model coefficients.
UNet transforms multidimensional input images into classified images. The network does not have a fully connected layer. Only the convolution layers are used. The UNet architecture is based on several layers and these layers can be input with a 2D or 3D image layer, and convolutional layer (2D or 3D) to downsample or upsample (transpose).
Each standard convolution process is activated by a ReLU activation function. A ReLU layer performs a threshold operation on each element of the input, where any value less than zero is set to zero. Max pooling performs downsampling by dividing the input into rectangular pooling regions and computing the maximum of each region.
In the upsampling process, a transposed 2D convolution layer is used, followed by a depth concatenation layer that takes inputs that have the same height and width and concatenates them along the third dimension (the channel dimension).
Finally, a Softmax layer (normalized exponential function) [38] is often used as the last activation function of the UNet. Its job is normalizing the output of a network to a probability distribution over predicted output classes.
Loss functions are a key part of any machine-learning model: they define an objective against which the performance of the UNet model is measured, and the setting of the weight parameters learned by the model is determined by minimizing a chosen loss function.
We combined binary cross-entropy loss with dice loss [39] as the final loss function to support the rapid convergence of the model (Equation (4)):
where and denote the target labels and predicted probabilities of the c-th and p-th batch processing, respectively. T and R denote the true value and predicted result, respectively, of the image. C and P denote the number of classes and pixels, respectively.
3.5. Accuracy Computation and Confidence Index Determination
After the classification of the images that represent the COVID-19 data for different countries accumulated in two years, it is necessary to compute the accuracy. A confusion matrix [40] is the main source to compute the overall accuracy (OA) based on Equation (5).
T1 and T2 can be actual or predicted samples, and these samples are either positive when the actual sample matches the predicted or negative otherwise.
To be more confident in the obtained results, Benford’s law, also known as the Newcomb–Benford law or the first-digit law [41], can be used to determine the degree of confidence. The law is an observation that in many sets of numerical data, the leading digit is likely to be small. A group of statistical surveys can follow Benford’s law if the leading digit D occurs with probability as of Equation (6).
Based on Benford’s distribution, the probabilities for each number d as the first digit are presented in Table 2.
4. Experimental Results and Discussion
The experiment starts by setting up all the parameters for both SOMs and UNET to obtain the final segmented images. SOMs’ number of iterations is set to 200 and the number of neurons is N = 10 such that the size of SOMs network is 10 × 10.
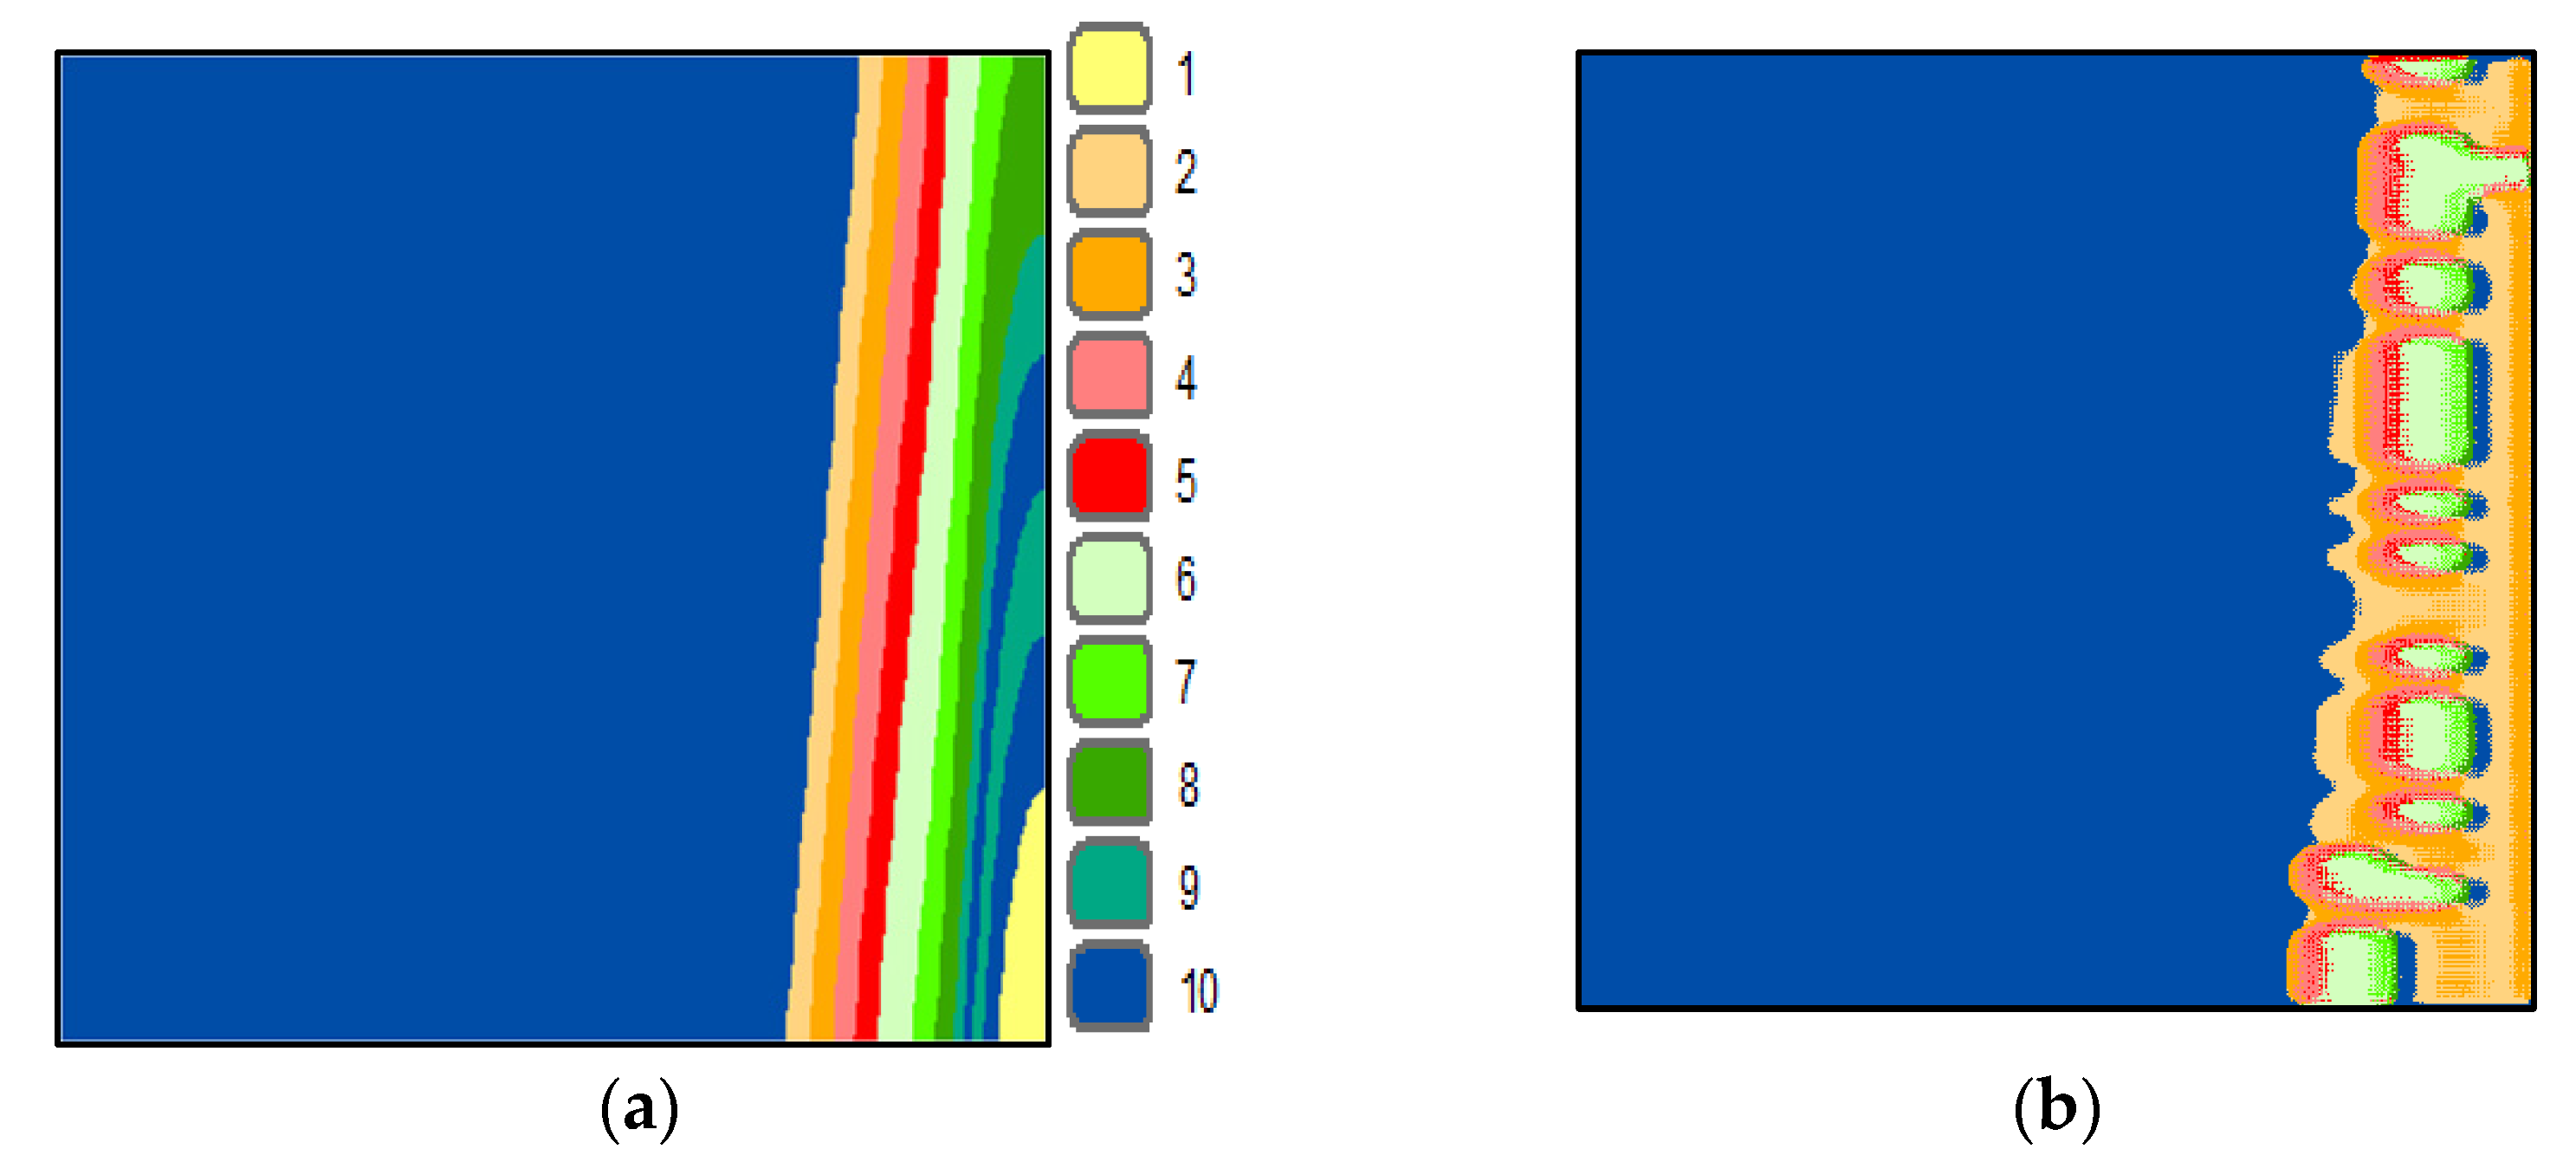
The reference image of the United Arab Emirates (UAE) is provided to SOMs as a vector of three dimensions representing the total number of cases, total deaths, and total PCR tests. The output is a weights vector of dimension equal to (N × N) × 3. The mean of the weights vector is computed and then Equations (1) and (2) are used to refine the weights and create the final labels. Figure 5a shows the SOMs’ neighbor weight distances image and the final segmented UAE image.
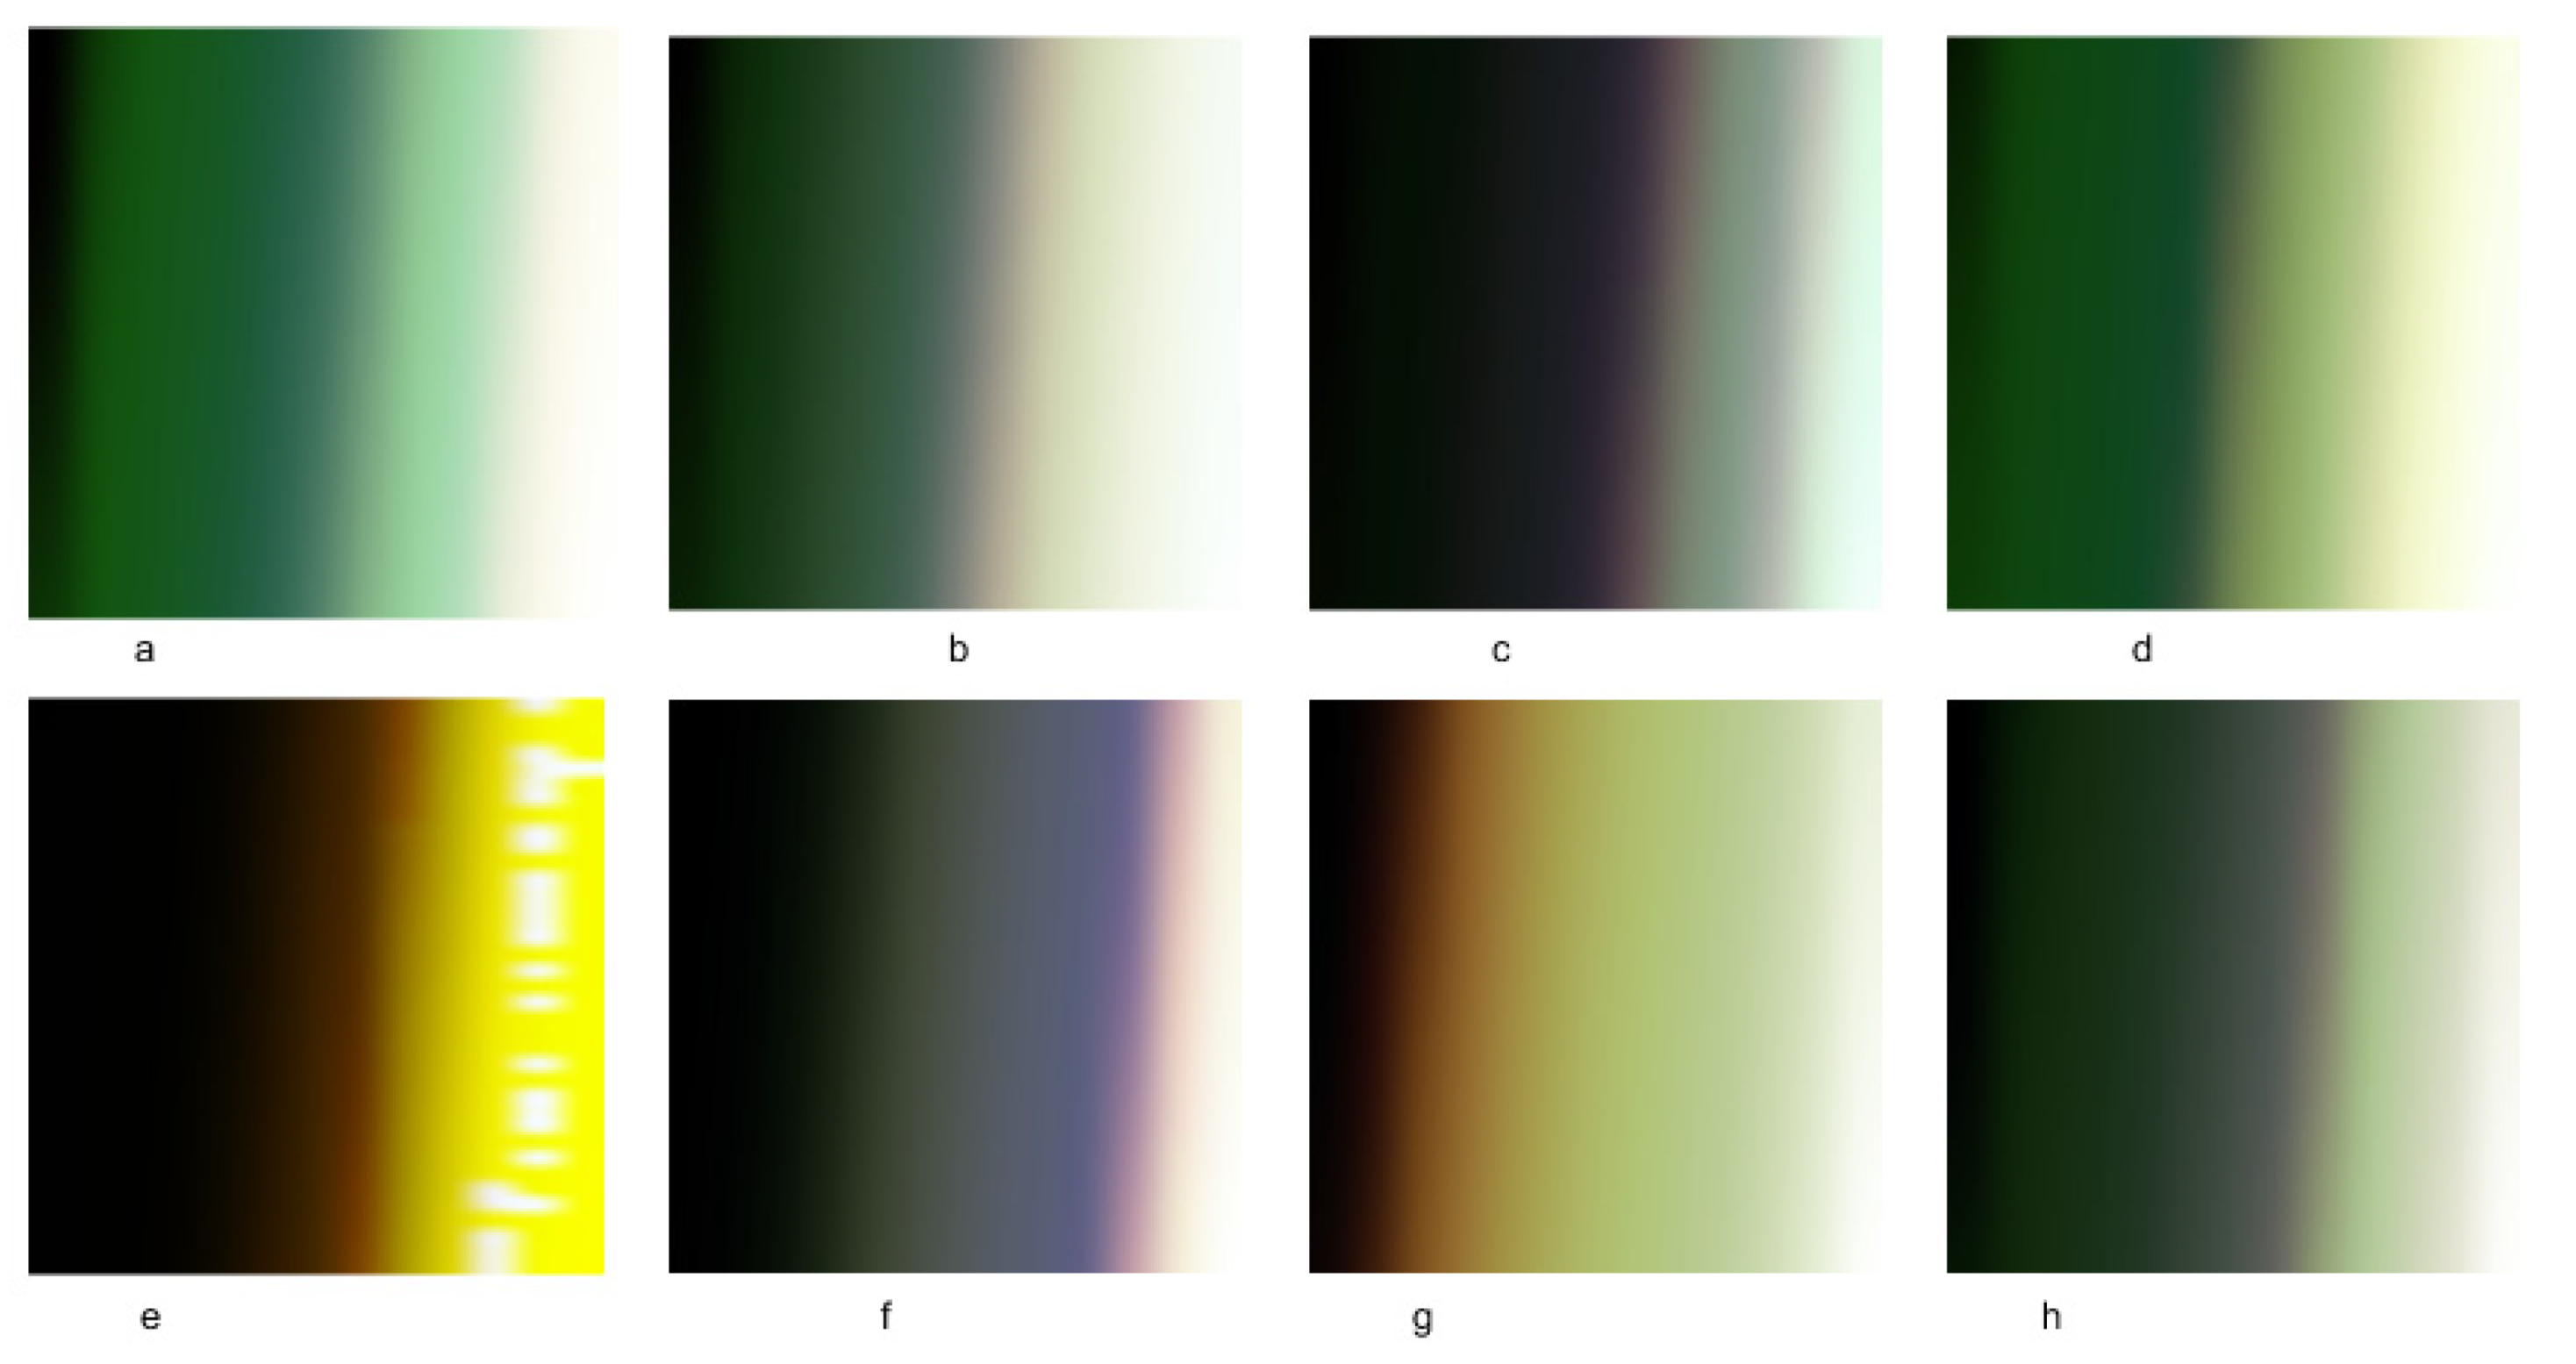
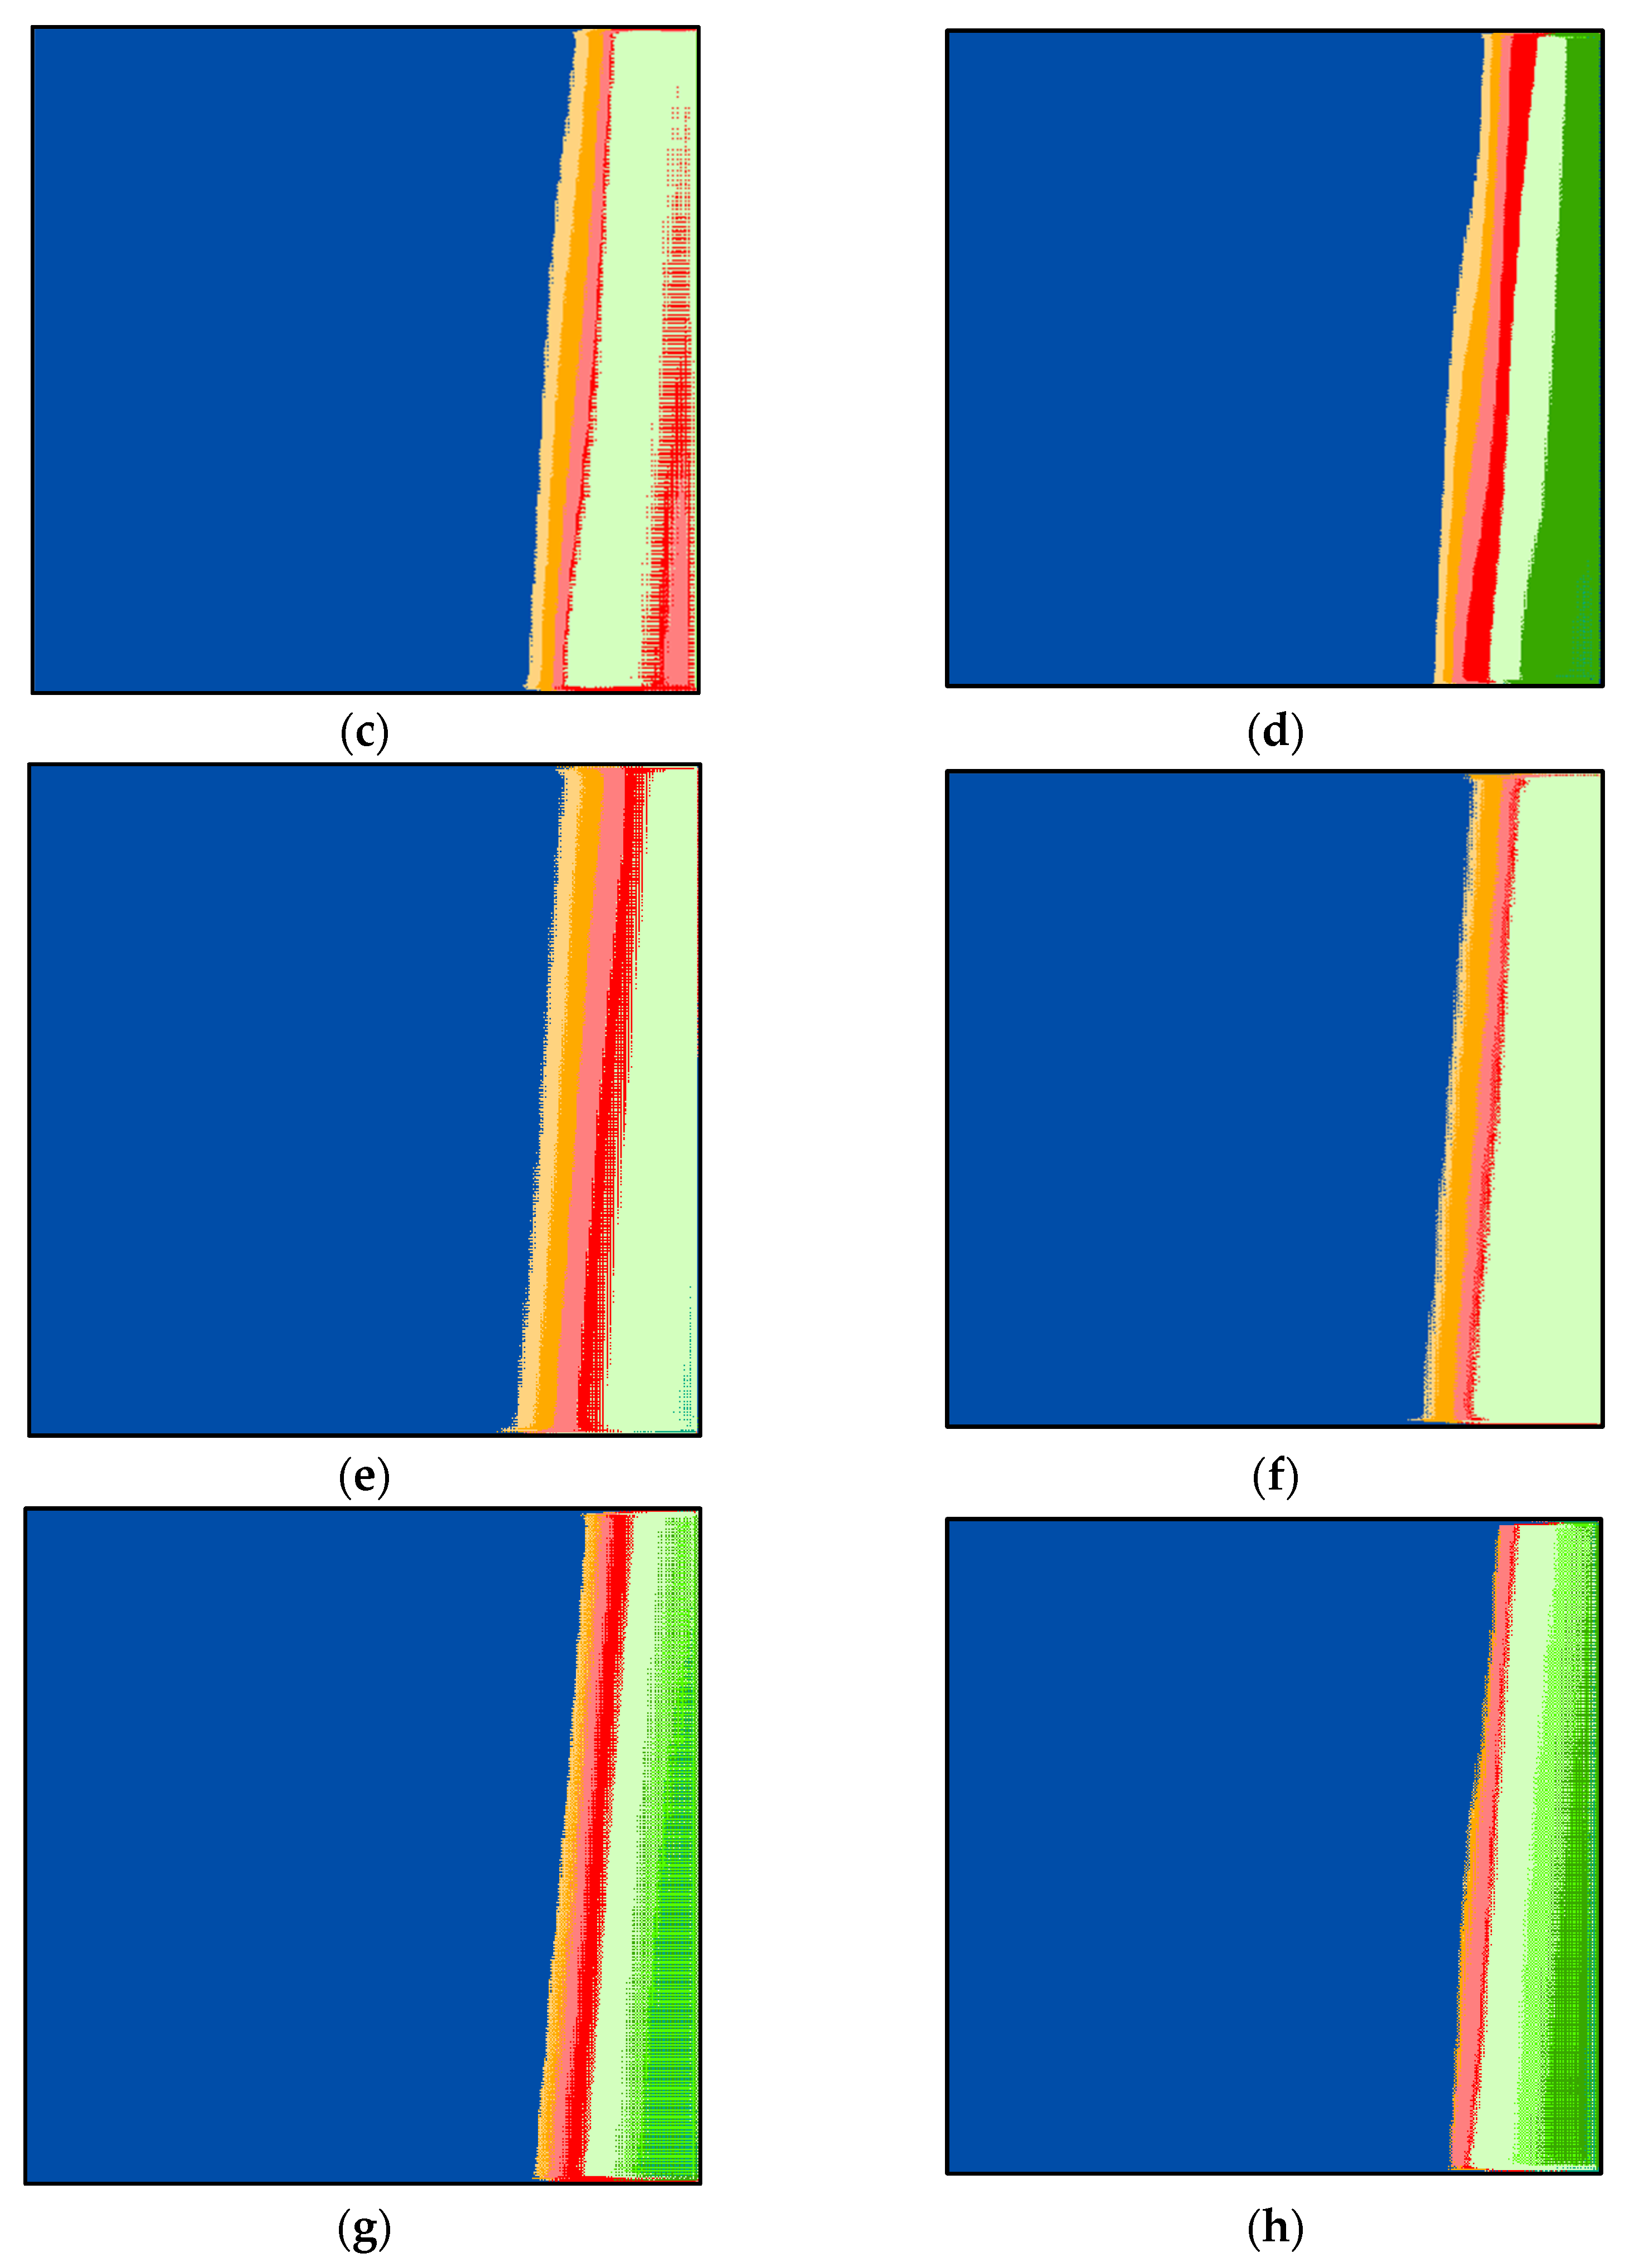
The important UNet parameters are set to provide the optimal result and to avoid falling in the local optima. The size of the provided input to UNet is 512 × 512 × 3 pixels. The number of mini-batches is 16 (mini-batch size), the number of patches per image is 128, the number of epochs is 32, the input tile size is 128 × 128 × 3, the initial learning rate is 0.005, and the number of classes is 10. Based on Equation (3), the number of iterations is equal to 256. The classifications are displayed in Figure 5b–h. By investigating these figures and by comparing them to the reference image (Figure 5a) visually, one can notice that class 1 (in light yellow) is missing from all figures. This explains why the UAE is one step ahead of other countries. The investigation revealed that the UAE had the highest number of PCRs per thousand of its population compared to other countries around the world [42].
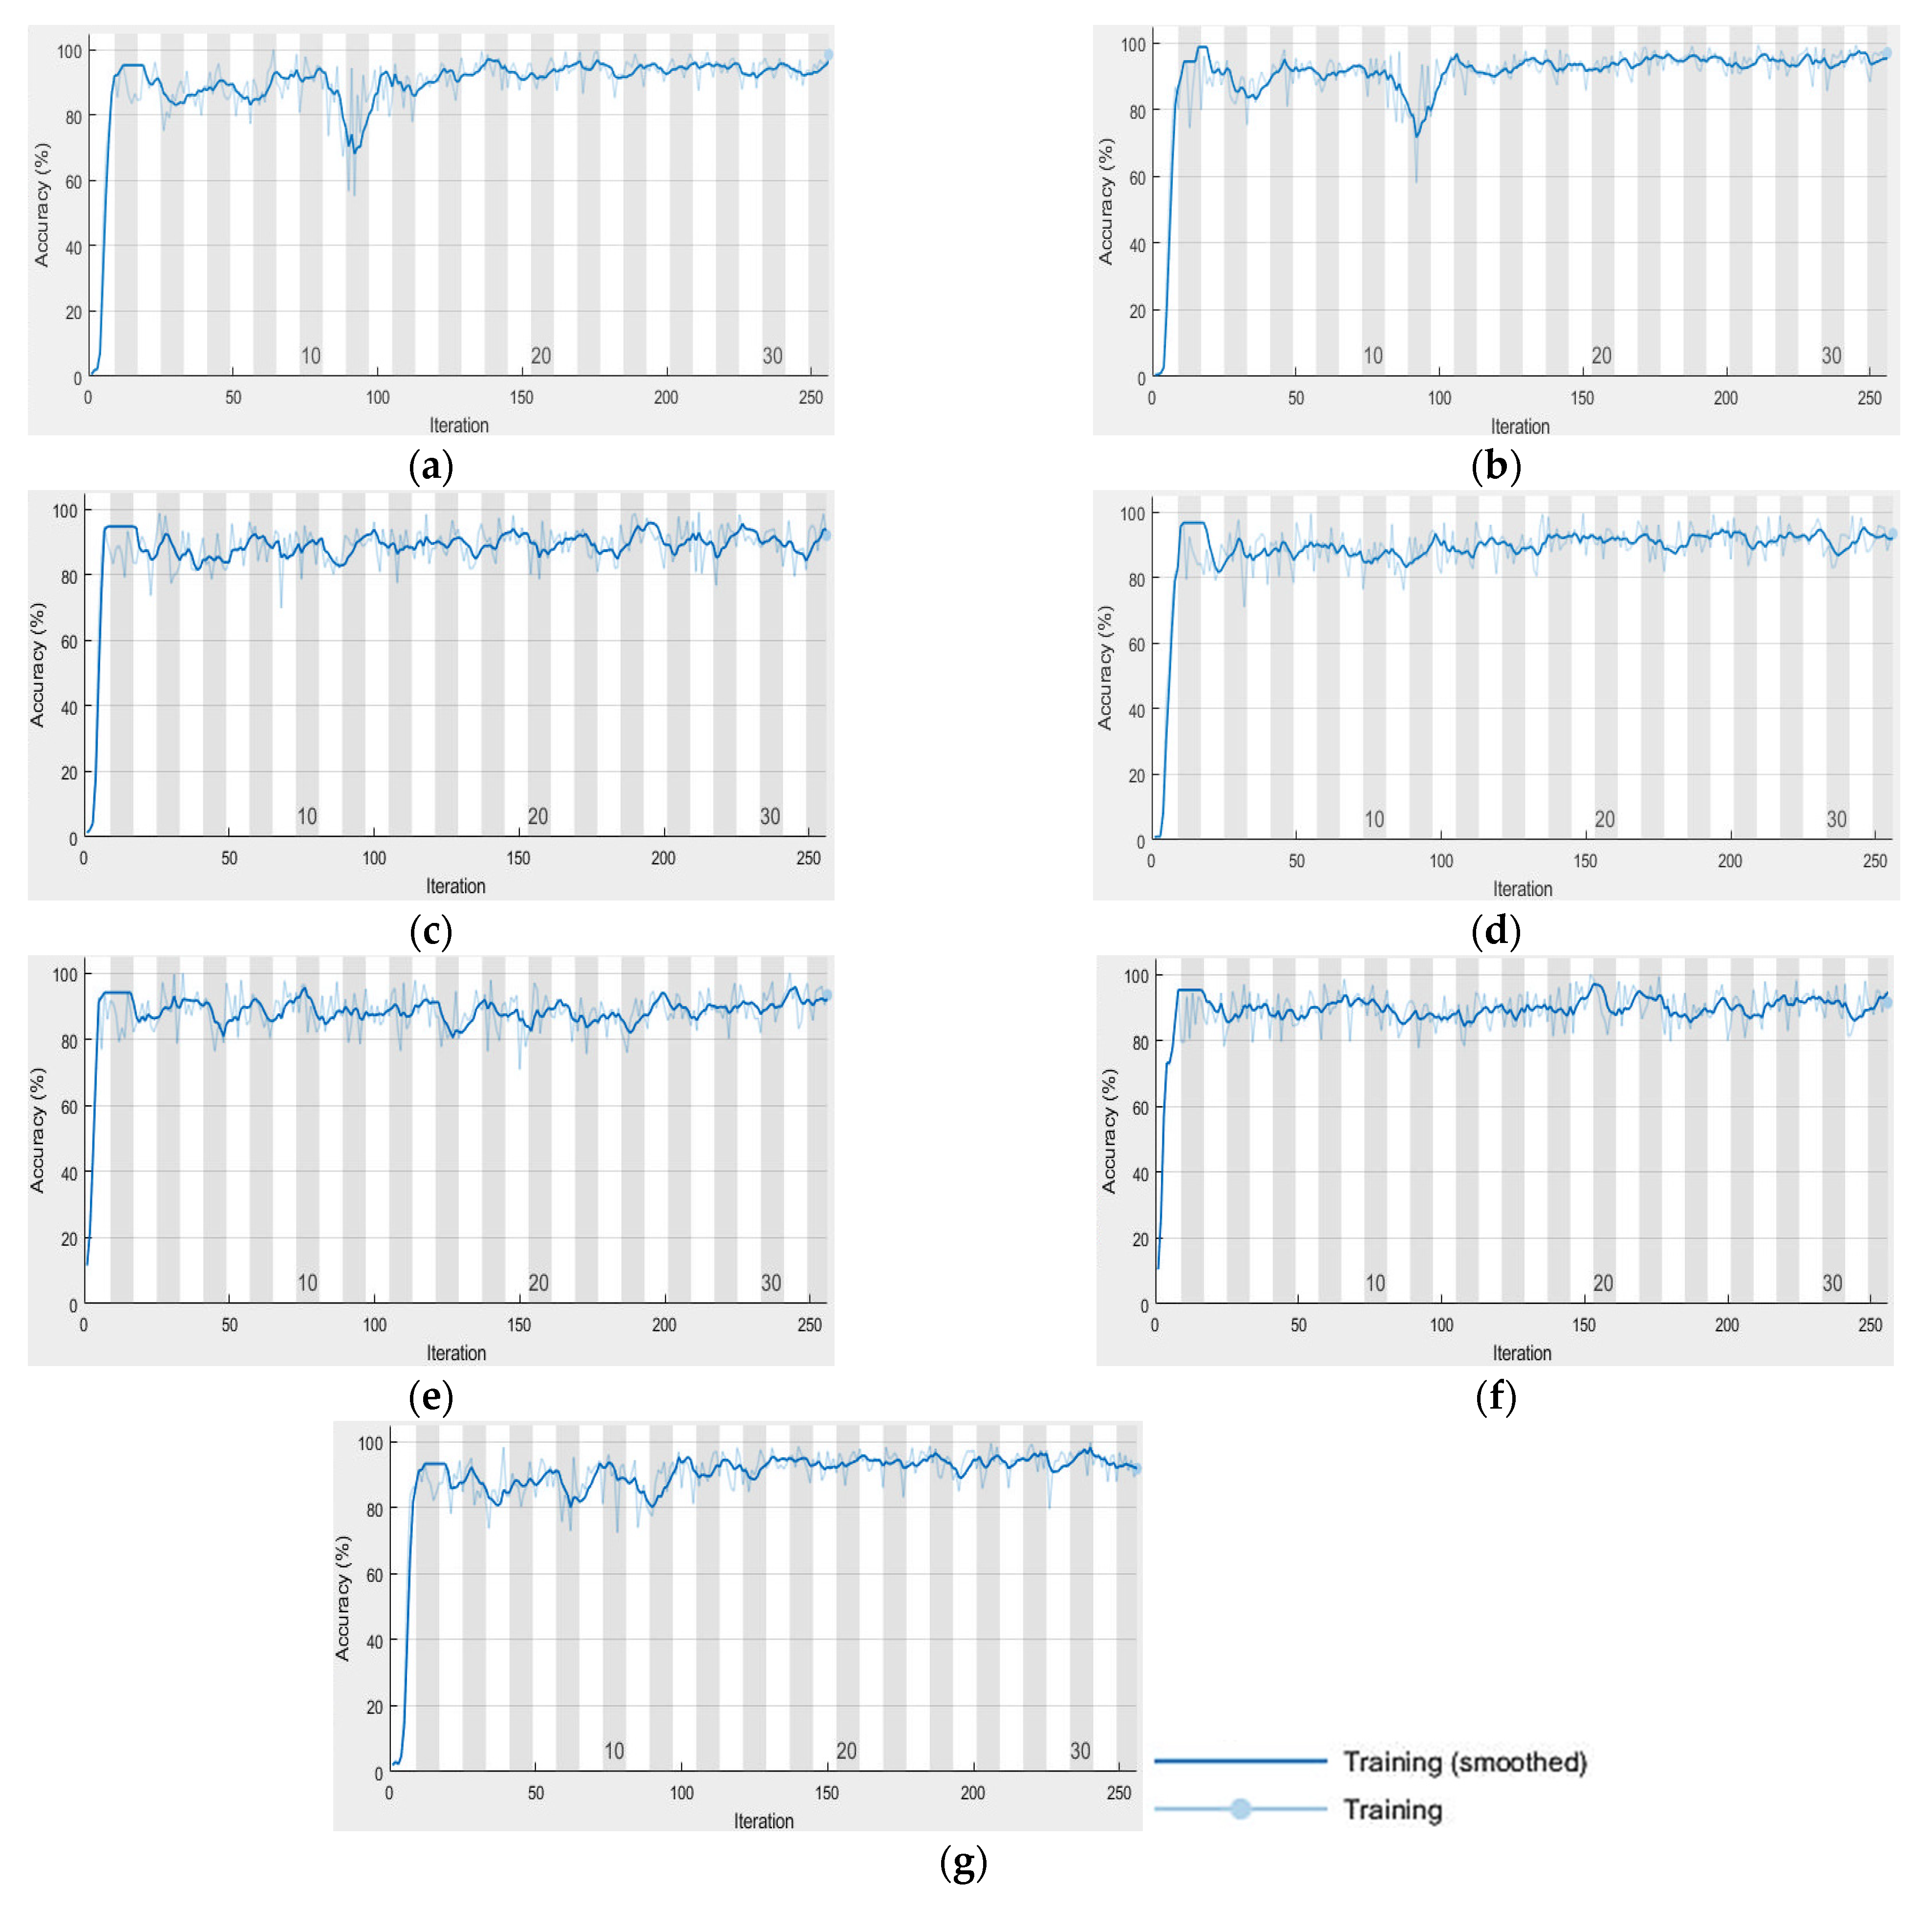
Furthermore, the segmented image by SOMs is analyzed statistically. The analysis showed that the percentage of pixels is as follows: 0.86, 2.26, 2.34, 2.38, 2.32, 3.27, 2.12, 2.52, 2.25, and 79.68% for clusters 1 to 10, respectively. This means that class 10 (dark blue) is the highest number of pixels, and class 1 (light yellow) is the lowest. The images (Figure 3a–g) are classified using UNet based on the previous settings. UNet progress during the classification of the images is shown in Figure 6a–g. The behavior of UNet is based on computing mini-batch accuracy that does not reflect the accuracy of the overall classified data. According to [43], the best mini-batch size should not be greater than 32. The overall classified image accuracy is determined using the confusion matrix, and the target data that was obtained previously using SOMs.
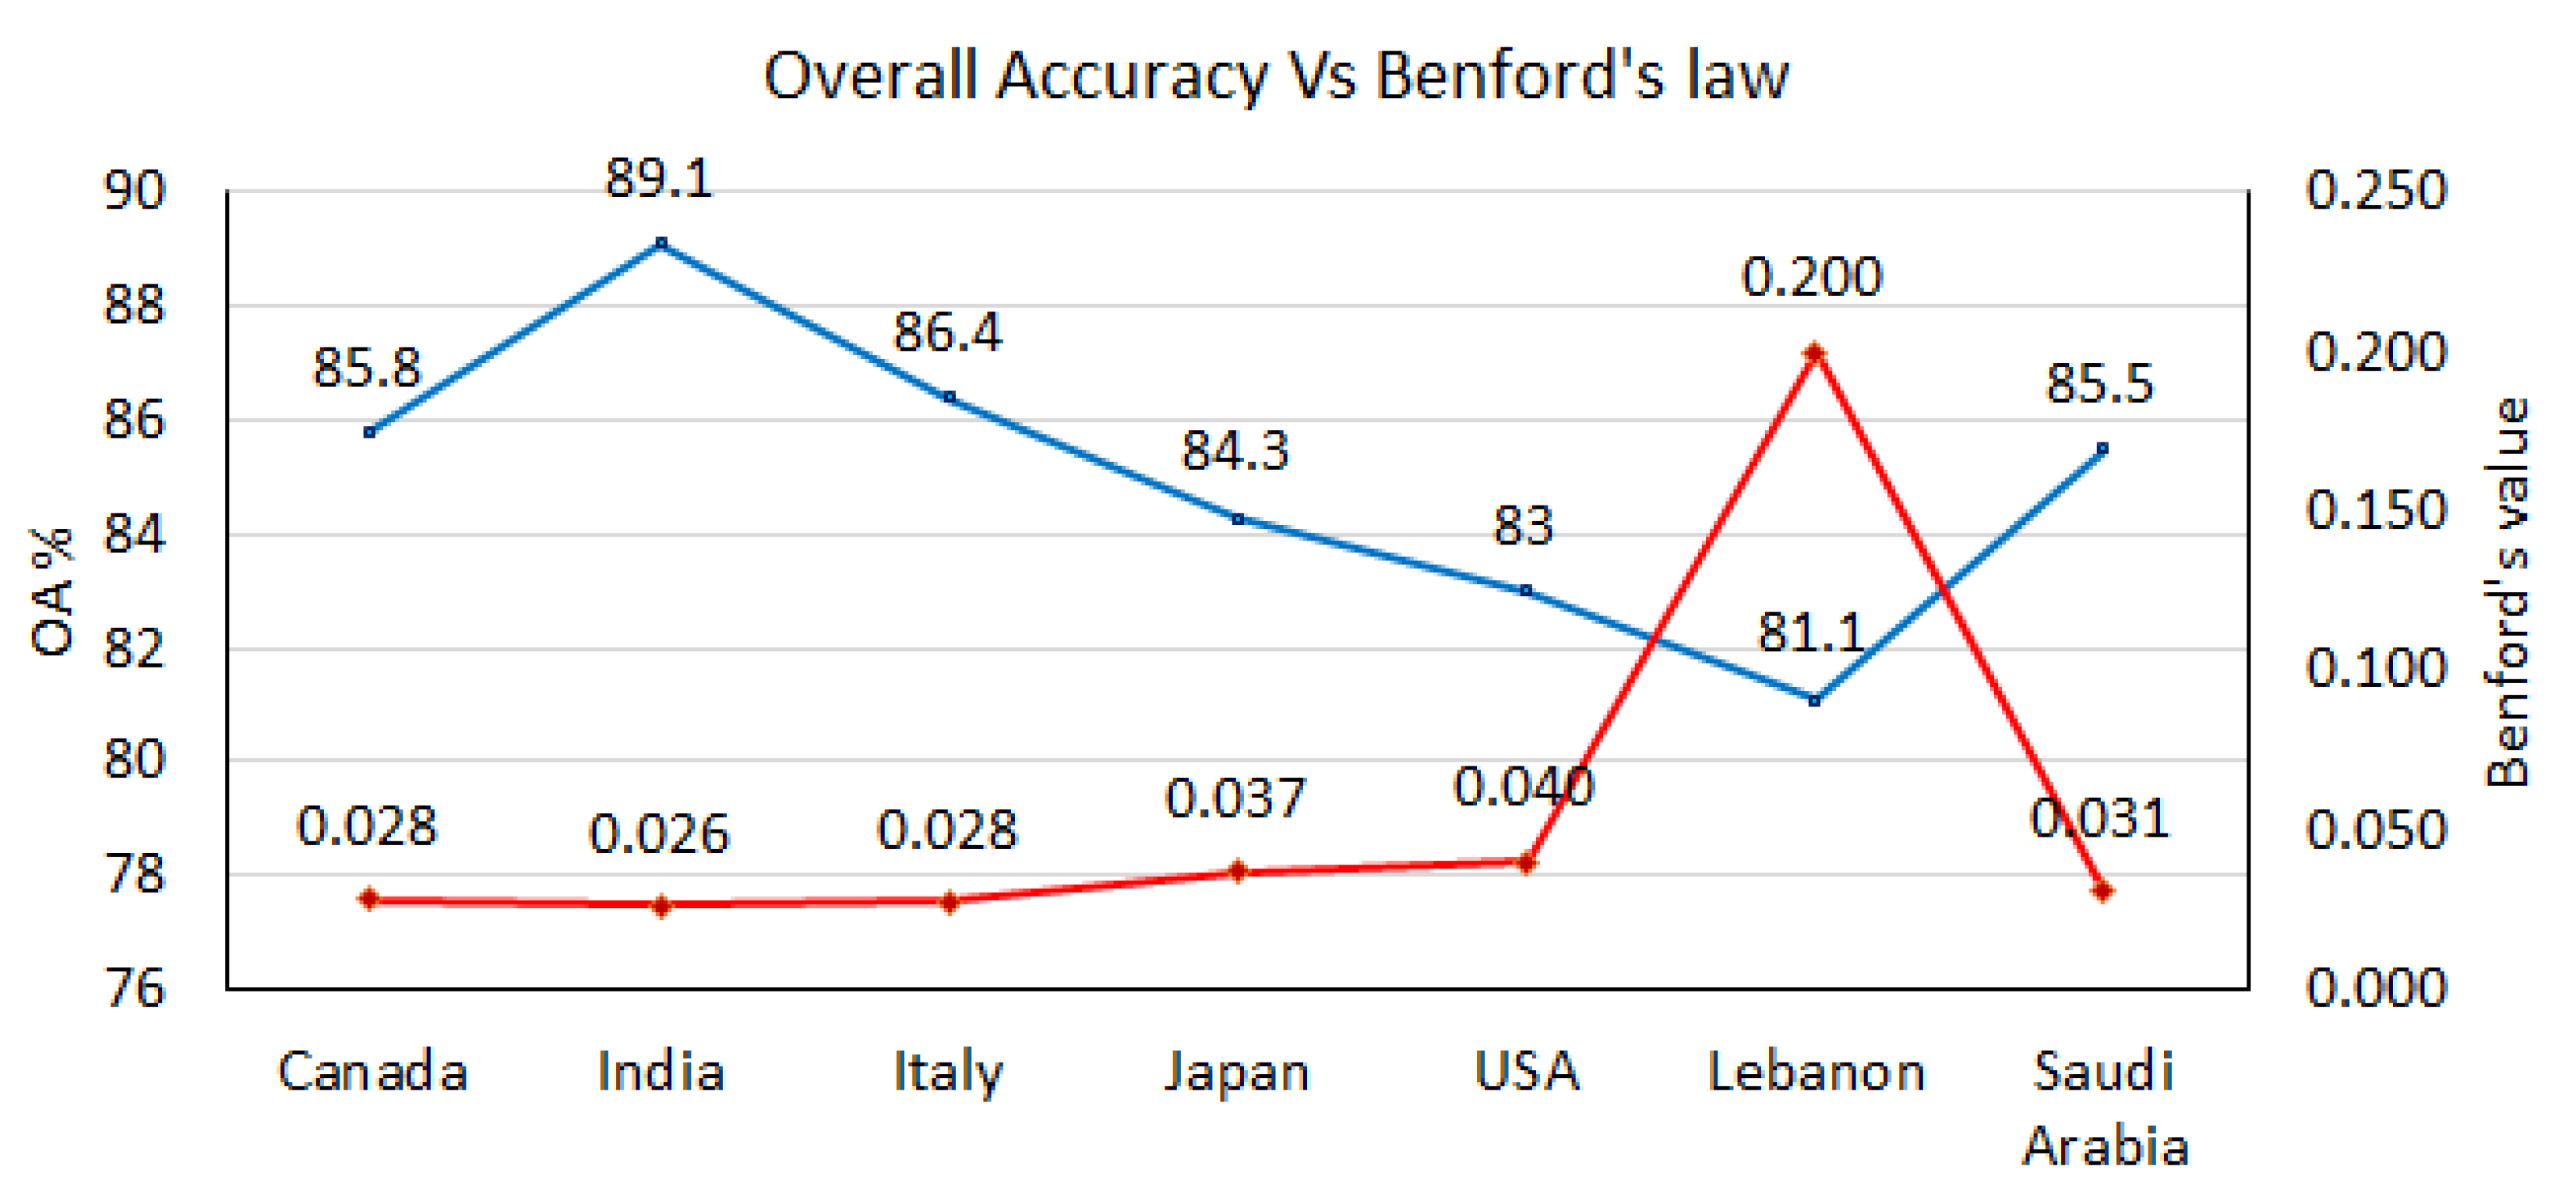
The overall accuracy (OA) for each country is calculated (Figure 7) based on Equation (5) and the confusion matrices (Table 3, Table 4, Table 5, Table 6, Table 7, Table 8 and Table 9).
Investigating the confusion matrices, it is noticeable that class 10 for both Italy and Japan are equal. This also means that Italy and Japan applied similar procedures in combating COVID-19 in most of the period covered by this research study.
It is noticeable from the OA that the most comparable one to the UAE is India, followed by Italy, Canada, Saudi Arabia, Japan, the USA, and Lebanon respectively. Investigating these results, one can notice that the worst one has large gaps in the reported PCRs; Japan had few days not reported. However, according to the results, these data are valid and acceptable.
Comparing the results to the reported ones in the literature such as the one based on the study conducted by Farhadi and Lahooti [44] that involved the use of Benford’s law, coincides with our finding of the credibility of the reported data by some countries such as Italy, the USA, and India. Kennedy et al. [8] also used statistical methods to validate the reported data, but they showed failure when some countries poorly reported their data. This includes few or no reported cases or tests. Our model is not sensitive to the poorly reported data as shown in some cases such as Lebanon and Japan.
To add more credibility to the obtained results, Benford’s law was used in combination with the mean absolute distance (MAD) (Equation (7)) to calculate the degree of confidence.
where is the predicted Benford’s probability from the supplied total number of cases, deaths, or tests. is the observed Benford’s probability from Table 1. The closer the MAD value is to zero, the higher the confidence degree.
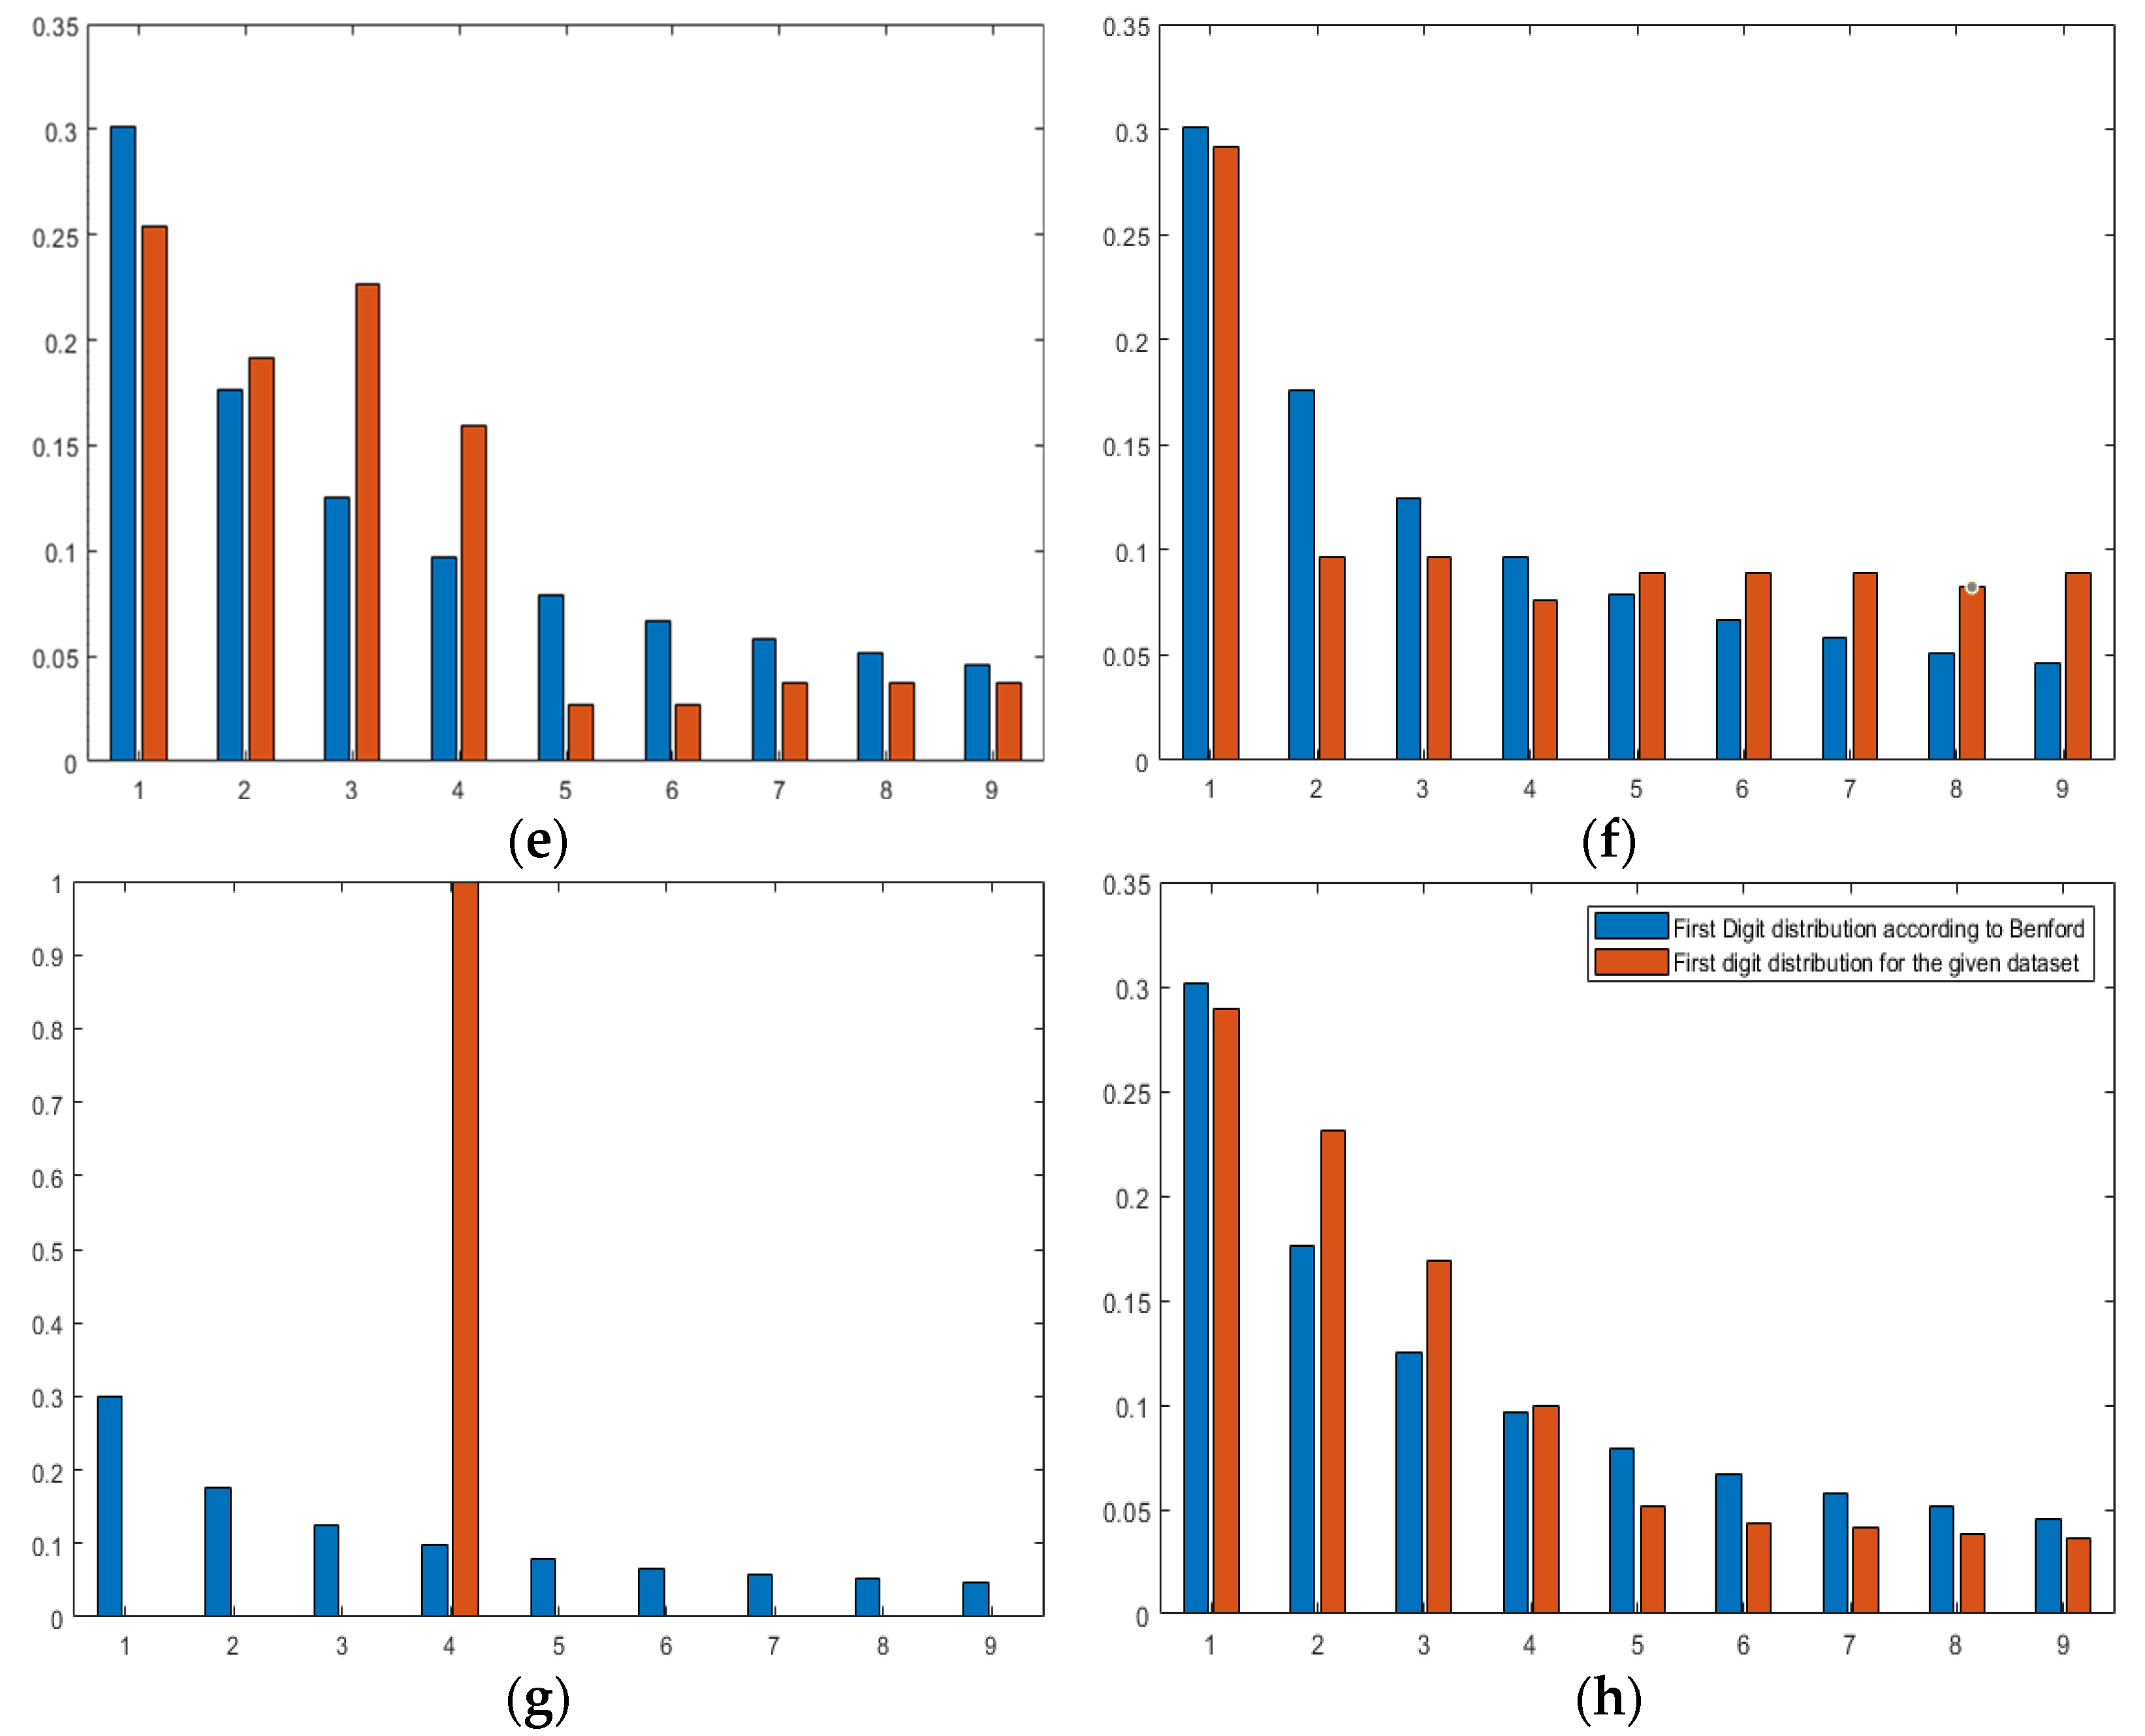
The MAD value for Canada, India, Italy, Japan, the USA, Saudi Arabia, Lebanon, and the UAE are 0.0284, 0.026173, 0.0275, 0.0372, 0.0401, 0.0308, 0.2001, and 0.0227, respectively. Moreover, the graphs showing Benfords’ observed versus predicted are displayed in Figure 8a–h.
The calculated Benford’s law values for all countries (except the UAE) are displayed with OAs in Figure 7. We can easily notice that Benford’s curve corresponds to OA’s curve such that the higher OA, the lower the Benford’s law value. This provides a high degree of confidence in the obtained results by the CCNN model.
Finally, it is important to note that the above experimental procedure can be applied to each variable separately. We can use an image with one band that represents one variable instead of using an image with three bands for three variables. As an example, if the total PCR tests are to be validated, then we can create one band image that goes through the same validation processes. In this case, the overall accuracy of the results is 72.4, 69.0, 68.1, 67.8, 67.8, 60.4, and 45.7 for Italy, Canada, Japan, India, Saudi Arabia, the USA, and Lebanon, respectively. This means that the highest efficiency in conducting PCR tests compared to the UAE is Italy and the lowest in Lebanon. This is due to several issues such as gaps in the reported PCR test data.
5. Conclusions
Our research results proved that COVID-19 statistical data reported by countries around the world can be verified using hybrid deep learning, also known as cooperative convolutional neural networks (CCNN). Multi-dimension images were created representing different reported COVID-19 statistical data by different countries. The CCNN model helped to successfully validate the data reported by seven countries from three different continents. The validation of the data reported by the seven countries was based on credible and trusted data from the UAE (reference image). This Arabic gulf country was classified as the number one country in the world in reporting COVID-19 data and in confronting the pandemic. CCNN validated the reported data by matching patterns between the input images and the reference image. Although some countries such as Lebanon lacked complete records of PCR tests, the outcome showed that around 80% of the reported data are credible (except PCRs). In general, the results of the validation by the (CCNN) showed that India, Italy, Canada, Saudi Arabia, Japan, the USA, and Lebanon agreed 89.1, 86.4, 85.8, 85.5, 84.3, 83, and 81.1%, respectively, with the UAE. Moreover, using Benford’s law added more confidence to the obtained results by the CCNN. In the future, the research will include more parameters such as the total number of vaccinations.
Supplementary Materials
The following supporting information can be downloaded at: https://0-www-mdpi-com.brum.beds.ac.uk/article/10.3390/covid2050051/s1, Table S1: MATLAB code for reading data.
Funding
This research received no external funding.
Data Availability Statement
Data are available upon request.
Conflicts of Interest
The author declare no conflict of interest.
References
- Miquel, P. Dictionary of Epidemiology; Oxford University Press: Oxford, UK, 2008; 179p. [Google Scholar]
- Spreeuwenberg, P.; Kroneman, M.; Paget, J. Reassessing the Global Mortality Burden of the 1918 Influenza Pandemic. Am. J. Epidemiol. 2018, 187, 2561–2567. [Google Scholar] [CrossRef] [PubMed] [Green Version]
- Arabi, M.Y.; Balkhy, H.; Hayden, F.; Bouchama, A.; Luke, T.; Baillie, J.; Al-Omari, A.; Hajeer, A.; Senga, M. Middle East respiratory syndrome. N. Engl. J. Med. 2017, 376, 584–594. [Google Scholar] [CrossRef] [PubMed]
- Fouchier, R.; Kuiken, T.; Schutten, M.; Amerongen, G.; Doornum, G.; Hoogen, B.; Peiris, M.; Lim, W.; Stohr, K. Koch’s postulates fulfilled for SARS virus. Nature 2003, 423, 240. [Google Scholar] [CrossRef] [PubMed]
- Bassetti, M.; Vena, A.; Giacobbe, D. The novel Chinese coronavirus (2019-nCoV) infections: Challenges for fighting the storm. Eur. J. Clin. Investig. 2020, 50, e13209. [Google Scholar] [CrossRef] [PubMed] [Green Version]
- Morens, D.; Breman, J.; Calisher, C.; Doherty, P.; Hahn, B. The Origin of COVID-19 and Why It Matters. Am. J. Trop. Med. Hyg. 2020, 103, 955–959. [Google Scholar] [CrossRef]
- Shadmi, E.; Chen, Y.; Dourado, I.; Faran-Perach, I.; Furler, J.; Hangoma, P.; Hanvoravongchai, P.; Obando, C.; Petrosyan, V.; Rao, K.D.; et al. Health equity and COVID-19 global perspectives. Int. J. Equity Health 2020, 19, 104. [Google Scholar] [CrossRef]
- Kennedy, A.P.; Yam, S.C.P. On the authenticity of COVID-19 case figures. PLoS ONE 2020, 15, e0243123. [Google Scholar] [CrossRef]
- Wu, S.L.; Mertens, A.N.; Crider, Y.S.; Nguyen, A.; Pokpongkiat, N.N.; Djajadi, S.; Seth, A.; Hsiang, M.S.; Colford, J.M., Jr.; Reingold, A.; et al. Substantial underestimation of SARS-CoV-2 infection in the United States. Natl. Commun. 2020, 11, 4507. [Google Scholar] [CrossRef]
- Abdulla, F.; Nain, Z.; Karimuzzaman, M.; Hossain, M.M.; Rahman, A. A Non-Linear Biostatistical Graphical Modeling of Preventive Actions and Healthcare Factors in Controlling COVID-19 Pandemic. Int. J. Environ. Res. Public Health 2021, 18, 4491. [Google Scholar] [CrossRef]
- Pérez Abreu, C.R.; Estrada, S.; de-la-Torre-Gutiérrez, H. A Two-Step Polynomial and Nonlinear Growth Approach for Modeling COVID-19 Cases in Mexico. Mathematics 2021, 9, 2180. [Google Scholar] [CrossRef]
- Namasudra, S.; Dhamodharavadhani, S.; Rathipriya, R. Nonlinear Neural Network Based Forecasting Model for Predicting COVID-19 Cases. Neural Process Lett. 2021. [Google Scholar] [CrossRef] [PubMed]
- Abiodun, O.; Jantan, A.; Omolara, A.; Dada, K.; Mohamed, N.; Arshad, H. State-of-the-art in artificial neural network applications: A survey. Heliyon 2018, 4, e00938. [Google Scholar] [CrossRef] [PubMed] [Green Version]
- Awad, M. Sea water chlorophyll-a estimation using hyperspectral images and supervised Artificial Neural Network. Ecol. Inform. 2014, 24, 60–68. [Google Scholar] [CrossRef]
- Ma, Y.; Wang, S. The Application of Artificial Neural Network in Medical Meteorology. In Future Control and Automation; Deng, W., Ed.; Lecture Notes in Electrical Engineering; Springer: Berlin/Heidelberg, Germany, 2012; Volume 172. [Google Scholar] [CrossRef]
- Sokolov-Mladenović, V.; Milovančević, M.; Mladenović, I.; Alizamir, M. Economic growth forecasting by artificial neural network with extreme learning machine based on trade, import and export parameters. Comput. Hum. Behav. 2016, 65, 43–45. [Google Scholar] [CrossRef]
- Choi, B.; Suh, J. Forecasting Spare Parts Demand of Military Aircraft: Comparisons of Data Mining Techniques and Managerial Features from the Case of South Korea. Sustainability 2020, 12, 6045. [Google Scholar] [CrossRef]
- Chang, A. Artificial intelligence and COVID-19: Present state and future vision. Intell. Based Med. 2020, 3–4, 100012. [Google Scholar] [CrossRef]
- Niazkar, H.; Niazkar, M. Application of artificial neural networks to predict the COVID-19 outbreak. Glob. Health Res. Policy 2020, 5, 50. [Google Scholar] [CrossRef]
- Tamang, S.; Singh, P.; Datta, B. Forecasting of COVID-19 cases based on prediction using artificial neural network curve fitting technique. Glob. J. Environ. Sci. Manag. 2020, 6, 53–64. [Google Scholar]
- Braga, M.D.B.; Fernandes, R.D.S.; Souza, G.N.D., Jr.; Rocha, J.E.C.D.; Dolácio, C.J.F.; Tavares, I.D.S., Jr.; Pinheiro, R.R.; Noronha, F.N.; Rodrigues, L.L.S.; Ramos, R.T.J.; et al. Artificial neural networks for short-term forecasting of cases, deaths, and hospital beds occupancy in the COVID-19 pandemic at the Brazilian Amazon. PLoS ONE 2021, 16, e0248161. [Google Scholar] [CrossRef]
- Awad, M. An unsupervised Artificial Neural Network method for satellite image segmentation. Int. Arab. J. Inf. Technol. 2010, 7, 199–205. [Google Scholar]
- Awad, M.; Chehdi, K.; Nasri, A. Multi-component Image Segmentation Using Genetic Algorithms and Artificial Neural Network. IEEE Geosci. Remote Sens. Lett. 2007, 4, 571–575. [Google Scholar] [CrossRef]
- Wang, S.; Zhu, Z.; Zhang, Y. PSCNN: PatchShuffle Convolutional Neural Network for COVID-19 Explainable Diagnosis. Front. Public Health 2021, 9, 768278. [Google Scholar] [CrossRef] [PubMed]
- Rahimzadeh, M.; Attar, A. A modified deep convolutional neural network for detecting COVID-19 and pneumonia from chest X-ray images based on the concatenation of Xception and ResNet50V2. Inform. Med. Unlocked 2020, 19, 100360. [Google Scholar] [CrossRef] [PubMed]
- Manzo, M.; Pellino, S. Fighting Together against the Pandemic: Learning Multiple Models on Tomography Images for COVID-19 Diagnosis. AI 2021, 2, 261–273. [Google Scholar] [CrossRef]
- Rahman, M.M.; Manik, M.M.H.; Islam, M.M.; Mahmud, S.; Kim, J.H. An automated system to limit COVID-19 using facial mask detection in smart city network. In Proceedings of the 2020 IEEE International IOT, Electronics and Mechatronics Conference (IEMTRONICS), Vancouver, BC, Canada, 9–12 September 2020; pp. 1–5. [Google Scholar] [CrossRef]
- Coppock, H.; Gaskell, A.; Tzirakis, P.; Baird, A.; Jones, L.; Schuller, B. End-to-end convolutional neural network enables COVID-19 detection from breath and cough audio: A pilot study. BMJ Innov. J. 2021, 7, 356–362. [Google Scholar] [CrossRef]
- Uddin, I.; Shah, S.; Al-Khasawneh, M. A Novel Deep Convolutional Neural Network Model to Monitor People following Guidelines to Avoid COVID-19. J. Sens. 2020, 2020, 8856801. [Google Scholar] [CrossRef]
- Ronneberger, O.; Fischer, P.; Brox, T. U-Net: Convolutional Networks for Biomedical Image Segmentation. In Medical Image Computing and Computer-Assisted Intervention (MICCAI); Lecture Notes in Computer Science; Springer: Berlin/Heidelberg, Germany, 2015; Volume 9351, pp. 234–241. [Google Scholar]
- Awad, M.; Lauteri, M. Self-Organizing Deep Learning (SO-UNet)—A Novel Framework to Classify Urban and Peri-Urban Forests. Sustainability 2021, 13, 5548. [Google Scholar] [CrossRef]
- Hasell, J.; Mathieu, E.; Beltekian, D.; Macdonald, B.; Giattino, C.; Ortiz-Ospina, E.; Roser, M.; Ritchie, H. A cross-country database of COVID-19 testing. Sci. Data 2020, 7, 345. [Google Scholar] [CrossRef]
- The Mathworks Inc. MATLAB R2019a Documentation. Available online: https://www.mathworks.com/help/pdf_doc/matlab/index.html (accessed on 8 August 2021).
- Reichardt, K. Using Microsoft Access® for Journal Collection Management. Ser. Libr. 2000, 37, 69–78. [Google Scholar] [CrossRef]
- Bloomberg, The COVID Resilience Ranking. Available online: https://www.bloomberg.com/graphics/covid-resilience-ranking/ (accessed on 23 March 2022).
- Keys, R. Cubic Convolution Interpolation for Digital Image Processing. IEEE Trans. Acoust. Speech Signal Processing 1981, 29, 1153–1160. [Google Scholar] [CrossRef] [Green Version]
- He, K.; Zhang, X.; Ren, S. Deep Residual Learning for Image Recognition. In Proceedings of the 2016 IEEE Conference on Computer Vision and Pattern Recognition (CVPR), Las Vegas, NV, USA, 27–30 June 2016; pp. 770–778. [Google Scholar]
- Tan, C.; Sun, F.; Kong, T.; Zhang, W.; Yang, C.; Liu, C. A Survey on Deep Transfer Learning. In Artificial Neural Networks and Machine Learning; Kůrková, V., Manolopoulos, Y., Hammer, B., Iliadis, L., Maglogiannis, I., Eds.; Lecture Notes in Computer Science; Springer: Cham, Switzerland, 2018; Volume 11141. [Google Scholar] [CrossRef] [Green Version]
- Milletari, F.; Navab, N.; Ahmdi, S.A. V-Net: Fully Convolutional Neural Networks for Volumetric Medical Image Segmentation. In Proceedings of the 2016 Fourth International Conference on 3D Vision (3DV), Stanford, CA, USA, 25–28 October 2016; pp. 565–571. [Google Scholar]
- Congalton, R. A review of assessing the accuracy of classifications of remotely sensed data. Remote Sens. Environ. 1991, 37, 35–46. [Google Scholar] [CrossRef]
- Berger, A.; Hill, T. The mathematics of Benford’s law: A primer. Stat. Methods Appl. 2020, 30, 779–795. [Google Scholar] [CrossRef]
- Al-Hosani, F.; Al-Mazrouei, S.; Al-Memari, S.; Al-Yafei, Z.; Paulo, M.S.; Koornneef, E. A Review of COVID-19 Mass Testing in the United Arab Emirates. Front. Public Health 2021, 9, 661134. [Google Scholar] [CrossRef] [PubMed]
- Kandel, I.; Castelli, M. The effect of batch size on the generalizability of the convolutional neural networks on a histopathology dataset. ICT Express 2020, 6, 312–315. [Google Scholar] [CrossRef]
- Farhadi, N.; Lahooti, H. Are COVID-19 Data Reliable? A Quantitative Analysis of Pandemic Data from 182 Countries. COVID 2021, 1, 137–152. [Google Scholar] [CrossRef]
Figure 1.
The new cooperative convolutional neural network (CCNN) model for the validation of COVID-19 reported data.
Figure 1.
The new cooperative convolutional neural network (CCNN) model for the validation of COVID-19 reported data.

Figure 2.
Different graphs for (a) the three total cases, (b) total cases vs. tests, (c) total cases vs. total deaths, and (d) total deaths vs. total tests.
Figure 2.
Different graphs for (a) the three total cases, (b) total cases vs. tests, (c) total cases vs. total deaths, and (d) total deaths vs. total tests.


Figure 3.
RGB images 512 × 512 pixels for (a) Canada, (b) USA, (c) Japan, (d) Italy, (e) Lebanon, (f) India, (g) Saudi Arabia, and (h) UAE.
Figure 3.
RGB images 512 × 512 pixels for (a) Canada, (b) USA, (c) Japan, (d) Italy, (e) Lebanon, (f) India, (g) Saudi Arabia, and (h) UAE.

Figure 4.
UNet architecture.

Figure 5.
Classified images of (a) the UAE (verification image), (b) Lebanon, (c) Canada, (d) India, (e) Saudi Arabia, (f) the USA, (g) Italy, and (h) Japan.
Figure 5.
Classified images of (a) the UAE (verification image), (b) Lebanon, (c) Canada, (d) India, (e) Saudi Arabia, (f) the USA, (g) Italy, and (h) Japan.


Figure 6.
UNet progress chart of (a) Canada, (b) India, (c) Italy, (d) the USA, (e) Japan, (f) Lebanon, and (g) Saudi Arabia.
Figure 6.
UNet progress chart of (a) Canada, (b) India, (c) Italy, (d) the USA, (e) Japan, (f) Lebanon, and (g) Saudi Arabia.

Figure 7.
Overall accuracies and Benford’s law values.

Figure 8.
Banford’s observed vs. predicted for (a) Canada, (b) India, (c) Italy, (d) Japan, (e) the USA, (f) Saudi Arabia, (g) Lebanon, and (h) the UAE.
Figure 8.
Banford’s observed vs. predicted for (a) Canada, (b) India, (c) Italy, (d) Japan, (e) the USA, (f) Saudi Arabia, (g) Lebanon, and (h) the UAE.


Table 1.
JHU’s COVID-19 dataset main data and sources.
| Metrics | Source | Updated | Countries |
|---|---|---|---|
| Vaccinations | Official data collated by the Our World in Data team | Every weekday | 218 |
| Tests & positivity | Official data collated by the Our World in Data team | Weekly | 187 |
| Hospital & ICU | Official data collated by the Our World in Data team | Daily | 47 |
| Confirmed cases | JHU CSSE COVID-19 Data | Daily | 216 |
| Confirmed deaths | JHU CSSE COVID-19 Data | Daily | 216 |
| Reproduction rate | Arroyo-Marioli F, Bullano F, Kucinskas S, Rondón-Moreno C | Daily | 192 |
| Policy responses | Oxford COVID-19 Government Response Tracker | Daily | 187 |
| Other variables of interest | International organizations (UN, World Bank, OECD, IHME…) | Fixed | 241 |
Table 2.
Digit’s probabilities in the first position.
| Digit | 1 | 2 | 3 | 4 | 5 | 6 | 7 | 8 | 9 |
|---|---|---|---|---|---|---|---|---|---|
| P | 0.301 | 0.176 | 0.125 | 0.097 | 0.079 | 0.067 | 0.058 | 0.051 | 0.046 |
Table 3.
Confusion matrix of Canada.
| Classes | 1 | 2 | 3 | 4 | 5 | 6 | 7 | 8 | 9 | 10 |
|---|---|---|---|---|---|---|---|---|---|---|
| 1 | 0 | 0 | 0 | 1191 | 530 | 337 | 190 | 0 | 0 | 0 |
| 2 | 0 | 4616 | 1047 | 0 | 0 | 0 | 0 | 0 | 0 | 273 |
| 3 | 0 | 42 | 5278 | 790 | 0 | 0 | 0 | 0 | 0 | 13 |
| 4 | 0 | 0 | 59 | 3766 | 1186 | 1214 | 0 | 0 | 0 | 12 |
| 5 | 0 | 0 | 0 | 22 | 281 | 5771 | 0 | 0 | 0 | 10 |
| 6 | 0 | 0 | 0 | 18 | 55 | 8475 | 0 | 0 | 0 | 16 |
| 7 | 0 | 0 | 0 | 25 | 52 | 5474 | 0 | 0 | 0 | 17 |
| 8 | 0 | 0 | 0 | 22 | 305 | 6119 | 135 | 0 | 0 | 14 |
| 9 | 0 | 0 | 0 | 36 | 2423 | 3240 | 209 | 0 | 0 | 0 |
| 10 | 0 | 869 | 0 | 1086 | 2172 | 2071 | 224 | 0 | 0 | 202,459 |
Table 4.
Confusion matrix of India.
| Classes | 1 | 2 | 3 | 4 | 5 | 6 | 7 | 8 | 9 | 10 |
|---|---|---|---|---|---|---|---|---|---|---|
| 1 | 0 | 0 | 0 | 0 | 0 | 0 | 0 | 1998 | 181 | 69 |
| 2 | 0 | 3700 | 1055 | 0 | 0 | 0 | 0 | 0 | 0 | 1181 |
| 3 | 0 | 542 | 3897 | 1684 | 0 | 0 | 0 | 0 | 0 | 0 |
| 4 | 0 | 0 | 93 | 3596 | 2548 | 0 | 0 | 0 | 0 | 0 |
| 5 | 0 | 0 | 0 | 27 | 4858 | 1199 | 0 | 0 | 0 | 0 |
| 6 | 0 | 0 | 0 | 3 | 45 | 8487 | 1 | 27 | 1 | 0 |
| 7 | 0 | 0 | 0 | 0 | 0 | 4428 | 8 | 1132 | 0 | 0 |
| 8 | 0 | 0 | 0 | 1 | 0 | 585 | 3 | 5961 | 2 | 43 |
| 9 | 0 | 0 | 0 | 0 | 0 | 0 | 0 | 5837 | 1 | 70 |
| 10 | 0 | 405 | 0 | 0 | 0 | 0 | 0 | 5467 | 12 | 202,997 |
Table 5.
Confusion matrix of Italy.
| Classes | 1 | 2 | 3 | 4 | 5 | 6 | 7 | 8 | 9 | 10 |
|---|---|---|---|---|---|---|---|---|---|---|
| 1 | 0 | 0 | 0 | 2 | 23 | 144 | 970 | 640 | 469 | 0 |
| 2 | 0 | 458 | 160 | 0 | 0 | 0 | 0 | 0 | 0 | 5318 |
| 3 | 0 | 1732 | 3047 | 1261 | 3 | 0 | 0 | 0 | 0 | 80 |
| 4 | 0 | 2 | 93 | 3813 | 2314 | 1 | 0 | 0 | 0 | 14 |
| 5 | 0 | 0 | 0 | 7 | 4789 | 1284 | 0 | 0 | 0 | 4 |
| 6 | 0 | 0 | 0 | 0 | 214 | 8350 | 0 | 0 | 0 | 0 |
| 7 | 0 | 0 | 0 | 0 | 51 | 4611 | 81 | 824 | 1 | 0 |
| 8 | 0 | 0 | 0 | 0 | 31 | 3081 | 1791 | 1679 | 13 | 0 |
| 9 | 0 | 0 | 0 | 0 | 16 | 634 | 2840 | 1576 | 842 | 0 |
| 10 | 0 | 0 | 0 | 0 | 20 | 347 | 2494 | 1495 | 1197 | 203,328 |
Table 6.
Confusion matrix of Japan.
| Classes | 1 | 2 | 3 | 4 | 5 | 6 | 7 | 8 | 9 | 10 |
|---|---|---|---|---|---|---|---|---|---|---|
| 1 | 0 | 0 | 0 | 0 | 0 | 126 | 246 | 1544 | 332 | 0 |
| 2 | 0 | 51 | 42 | 0 | 0 | 0 | 0 | 0 | 0 | 5843 |
| 3 | 0 | 103 | 1631 | 2645 | 0 | 0 | 0 | 0 | 0 | 1744 |
| 4 | 0 | 0 | 14 | 3302 | 1358 | 1523 | 0 | 0 | 0 | 40 |
| 5 | 0 | 3 | 10 | 1 | 104 | 5938 | 0 | 0 | 0 | 28 |
| 6 | 0 | 0 | 0 | 5 | 34 | 8139 | 360 | 0 | 3 | 23 |
| 7 | 0 | 0 | 0 | 0 | 17 | 2958 | 2551 | 24 | 18 | 0 |
| 8 | 0 | 0 | 0 | 1 | 4 | 2891 | 1961 | 1665 | 72 | 1 |
| 9 | 0 | 0 | 0 | 0 | 2 | 871 | 1289 | 3528 | 218 | 0 |
| 10 | 0 | 0 | 0 | 0 | 4 | 233 | 1099 | 3919 | 298 | 203,328 |
Table 7.
Confusion matrix of the USA.
| Classes | 1 | 2 | 3 | 4 | 5 | 6 | 7 | 8 | 9 | 10 |
|---|---|---|---|---|---|---|---|---|---|---|
| 1 | 0 | 0 | 0 | 0 | 23 | 2225 | 0 | 0 | 0 | 0 |
| 2 | 0 | 1326 | 4563 | 0 | 0 | 0 | 0 | 0 | 0 | 47 |
| 3 | 0 | 0 | 3583 | 2513 | 1 | 0 | 0 | 0 | 0 | 26 |
| 4 | 0 | 0 | 19 | 3018 | 1945 | 1246 | 0 | 0 | 0 | 9 |
| 5 | 0 | 0 | 8 | 21 | 106 | 5949 | 0 | 0 | 0 | 0 |
| 6 | 0 | 0 | 4 | 21 | 20 | 8519 | 0 | 0 | 0 | 0 |
| 7 | 0 | 0 | 0 | 5 | 21 | 5542 | 0 | 0 | 0 | 0 |
| 8 | 0 | 2 | 0 | 1 | 17 | 6574 | 1 | 0 | 0 | 0 |
| 9 | 0 | 0 | 0 | 0 | 10 | 5898 | 0 | 0 | 0 | 0 |
| 10 | 0 | 2136 | 42 | 0 | 13 | 5540 | 0 | 0 | 0 | 201,150 |
Table 8.
Confusion matrix of Lebanon.
| Classes | 1 | 2 | 3 | 4 | 5 | 6 | 7 | 8 | 9 | 10 |
|---|---|---|---|---|---|---|---|---|---|---|
| 1 | 0 | 1166 | 1052 | 4 | 0 | 0 | 0 | 0 | 0 | 26 |
| 2 | 0 | 830 | 604 | 376 | 25 | 0 | 0 | 1 | 0 | 4100 |
| 3 | 0 | 2090 | 1220 | 1279 | 330 | 233 | 4 | 0 | 0 | 967 |
| 4 | 0 | 1191 | 1606 | 1483 | 658 | 1232 | 45 | 0 | 0 | 22 |
| 5 | 0 | 368 | 1192 | 1530 | 560 | 2312 | 119 | 3 | 0 | 0 |
| 6 | 0 | 586 | 1146 | 1487 | 554 | 3729 | 691 | 230 | 0 | 141 |
| 7 | 0 | 1145 | 706 | 553 | 113 | 1668 | 640 | 311 | 0 | 432 |
| 8 | 0 | 2161 | 1470 | 409 | 92 | 886 | 360 | 479 | 0 | 738 |
| 9 | 0 | 2875 | 1825 | 63 | 5 | 122 | 120 | 153 | 0 | 745 |
| 10 | 0 | 3193 | 1801 | 19 | 2 | 17 | 9 | 227 | 0 | 203,613 |
Table 9.
Confusion matrix of the Kingdom of Saudi Arabia.
| Classes | 1 | 2 | 3 | 4 | 5 | 6 | 7 | 8 | 9 | 10 |
|---|---|---|---|---|---|---|---|---|---|---|
| 1 | 0 | 0 | 1 | 1 | 0 | 1922 | 0 | 3 | 193 | 128 |
| 2 | 0 | 3872 | 2049 | 13 | 0 | 0 | 0 | 0 | 0 | 2 |
| 3 | 0 | 6 | 5529 | 584 | 0 | 4 | 0 | 0 | 0 | 0 |
| 4 | 0 | 4 | 35 | 6186 | 0 | 12 | 0 | 0 | 0 | 0 |
| 5 | 0 | 0 | 0 | 2029 | 3905 | 150 | 0 | 0 | 0 | 0 |
| 6 | 0 | 0 | 0 | 0 | 4378 | 4186 | 0 | 0 | 0 | 0 |
| 7 | 0 | 0 | 0 | 0 | 36 | 5532 | 0 | 0 | 0 | 0 |
| 8 | 0 | 0 | 0 | 47 | 59 | 6487 | 0 | 0 | 1 | 1 |
| 9 | 0 | 0 | 0 | 31 | 32 | 5763 | 0 | 0 | 6 | 76 |
| 10 | 0 | 3009 | 24 | 34 | 22 | 5362 | 0 | 0 | 42 | 200,388 |
Publisher’s Note: MDPI stays neutral with regard to jurisdictional claims in published maps and institutional affiliations. |
© 2022 by the author. Licensee MDPI, Basel, Switzerland. This article is an open access article distributed under the terms and conditions of the Creative Commons Attribution (CC BY) license (https://creativecommons.org/licenses/by/4.0/).
Share and Cite
MDPI and ACS Style
Awad, M.M. Evaluation of COVID-19 Reported Statistical Data Using Cooperative Convolutional Neural Network Model (CCNN). COVID 2022, 2, 674-690. https://0-doi-org.brum.beds.ac.uk/10.3390/covid2050051
AMA Style
Awad MM. Evaluation of COVID-19 Reported Statistical Data Using Cooperative Convolutional Neural Network Model (CCNN). COVID. 2022; 2(5):674-690. https://0-doi-org.brum.beds.ac.uk/10.3390/covid2050051
Chicago/Turabian StyleAwad, Mohamad M. 2022. "Evaluation of COVID-19 Reported Statistical Data Using Cooperative Convolutional Neural Network Model (CCNN)" COVID 2, no. 5: 674-690. https://0-doi-org.brum.beds.ac.uk/10.3390/covid2050051