Technical Note

Covid19Risk.ai: An Open Source Repository and Online Calculator of Prediction Models for Early Diagnosis and Prognosis of Covid-19

1
The D-Lab, Department of Precision Medicine, GROW-School for Oncology, Maastricht University, P.O. Box 616, 6200 MD Maastricht, The Netherlands
2
Health Innovation Ventures, Oxfordlaan 55, 6229 EV Maastricht, The Netherlands
3
Medical Cloud Company, Clos Chanmurly 13, 4000 Liège, Belgium
*
Authors to whom correspondence should be addressed.
Submission received: 16 June 2021 / Revised: 6 August 2021 / Accepted: 9 August 2021 / Published: 20 August 2021

Abstract

:
Background: The current pandemic has led to a proliferation of predictive models being developed to address various aspects of COVID-19 patient care. We aimed to develop an online platform that would serve as an open source repository for a curated subset of such models, and provide a simple interface for included models to allow for online calculation. This platform would support doctors during decision-making regarding diagnoses, prognoses, and follow-up of COVID-19 patients, expediting the models’ transition from research to clinical practice. Methods: In this pilot study, we performed a literature search in the PubMed and WHO databases to find suitable models for implementation on our platform. All selected models were publicly available (peer reviewed publications or open source repository) and had been validated (TRIPOD type 3 or 2b). We created a method for obtaining the regression coefficients if only the nomogram was available in the original publication. All predictive models were transcribed on a practical graphical user interface using PHP 8.0.0, and were published online together with supporting documentation and links to the associated articles. Results: The open source website currently incorporates nine models from six different research groups, evaluated on datasets from different countries. The website will continue to be populated with other models related to COVID-19 prediction as these become available. This dynamic platform allows COVID-19 researchers to contact us to have their model curated and included on our website, thereby increasing the reach and real-world impact of their work. Conclusion: We have successfully demonstrated in this pilot study that our website provides an inclusive platform for predictive models related to COVID-19. It enables doctors to supplement their judgment with patient-specific predictions from externally validated models in a user-friendly format. Additionally, this platform supports researchers in showcasing their work, which will increase the visibility and use of their models.

1. Introduction

The recent COVID-19 pandemic, at its start, emphasized several key unmet needs in terms of patient stratification using quantifiable metrics [1]. These include (a) identifying, in the uninfected population, at-risk persons who should be subjected to stricter restrictions than the general population [2], and (b) in the infected population, improving the detection of high-risk patients by utilizing all available patient data (e.g., clinical, laboratory, genetic, and radiological features) so as to improve quality of care and use of hospital resources [3,4]. Now, with several vaccines emerging, there is another compelling reason for identifying those who are most at risk and should therefore receive the vaccines first [5,6,7].
Ideally, one should address the above needs using quantitative tools that (a) help people at home decide (in consultation with their doctor) whether their health status warrants being self-quarantined, and whether their symptoms (if present) indicate the need for visiting the hospital, and (b) help doctors during triage decide if a patient should be sent home, hospitalized in a ward, or admitted to intensive care [8]. Quantifying these probabilities can be done by using predictive machine learning models.
Currently, COVID-19 publications regarding such models are booming. There are numerous studies being published, from multiple countries and all using different inclusion criteria and outcome measures [4]. This heavily complicates the selection of the optimal model for a specific patient [9]. In addition, the quality of the research is sometimes suboptimal, as a recent review paper has shown [4].
We, as researchers working on COVID-19 models, saw an urgent need for a web-based platform that would serve as an open source repository for validated models. Such a platform would allow the user to have a quick overview of the strengths and weaknesses of the curated models that passed our quality checks. The platform would also allow the user to calculate the output of such models by simply providing the inputs in a user-friendly format, rather than creating their own implementation or conducting their own search to find a suitable implementation.
Our aim for this platform is to include validated prediction models (TRIPOD type 2b and 3) [10], acquired from institutions all over the world, related to all aspects of the disease, including a risk assessment of being infected, triage at hospital admission, prediction of recovery process during follow-up, and patient inclusion and stratification in clinical trials. We aim to be inclusive, and thus models that are outside the scope of risk assessment and patient stratification are still within the purview of the platform, e.g., diagnostic models. We believe it will be of interest to doctors who want to leverage the results of all the great research that is taking place, and it will also benefit researchers in dissemination of their own work and in learning about the findings of other groups.
The prototype of such a platform forms the basis of this paper. We intend to maintain this platform as a public service, and increase the number of curated models by encouraging other researchers to share their work through our platform. The benefits to them include (a) helping the researchers to generalize their models by allowing the models to be tested by research groups that are different from the ones that created the model (TRIPOD 4), and (b) an improved visibility of their model, which should stimulate usage and citations [11].

2. Methods

We reviewed the PubMed database of the National Center for Biotechnology Information (NCBI) and the World Health Organization (WHO) database for COVID-19 publications from December 2019 to June 2020. To find relevant publications to our focus we used the terms in the search field: “COVID 2019 prognostic models”, “novel coronavirus 2019 diagnostic tools”, “COVID-19 predictive models”, and “machine-learning COVID 19 models”.
The steps that we followed from the literature search until the final stage of publishing online are shown in Figure 1.
In order to assess the reporting quality of the models from the studies, we tested each paper for its compliance to the TRIPOD (Transparent Reporting of studies on prediction models for Individual Prognosis Or Diagnosis) reporting guideline as shown in Figure 2 [10,12].

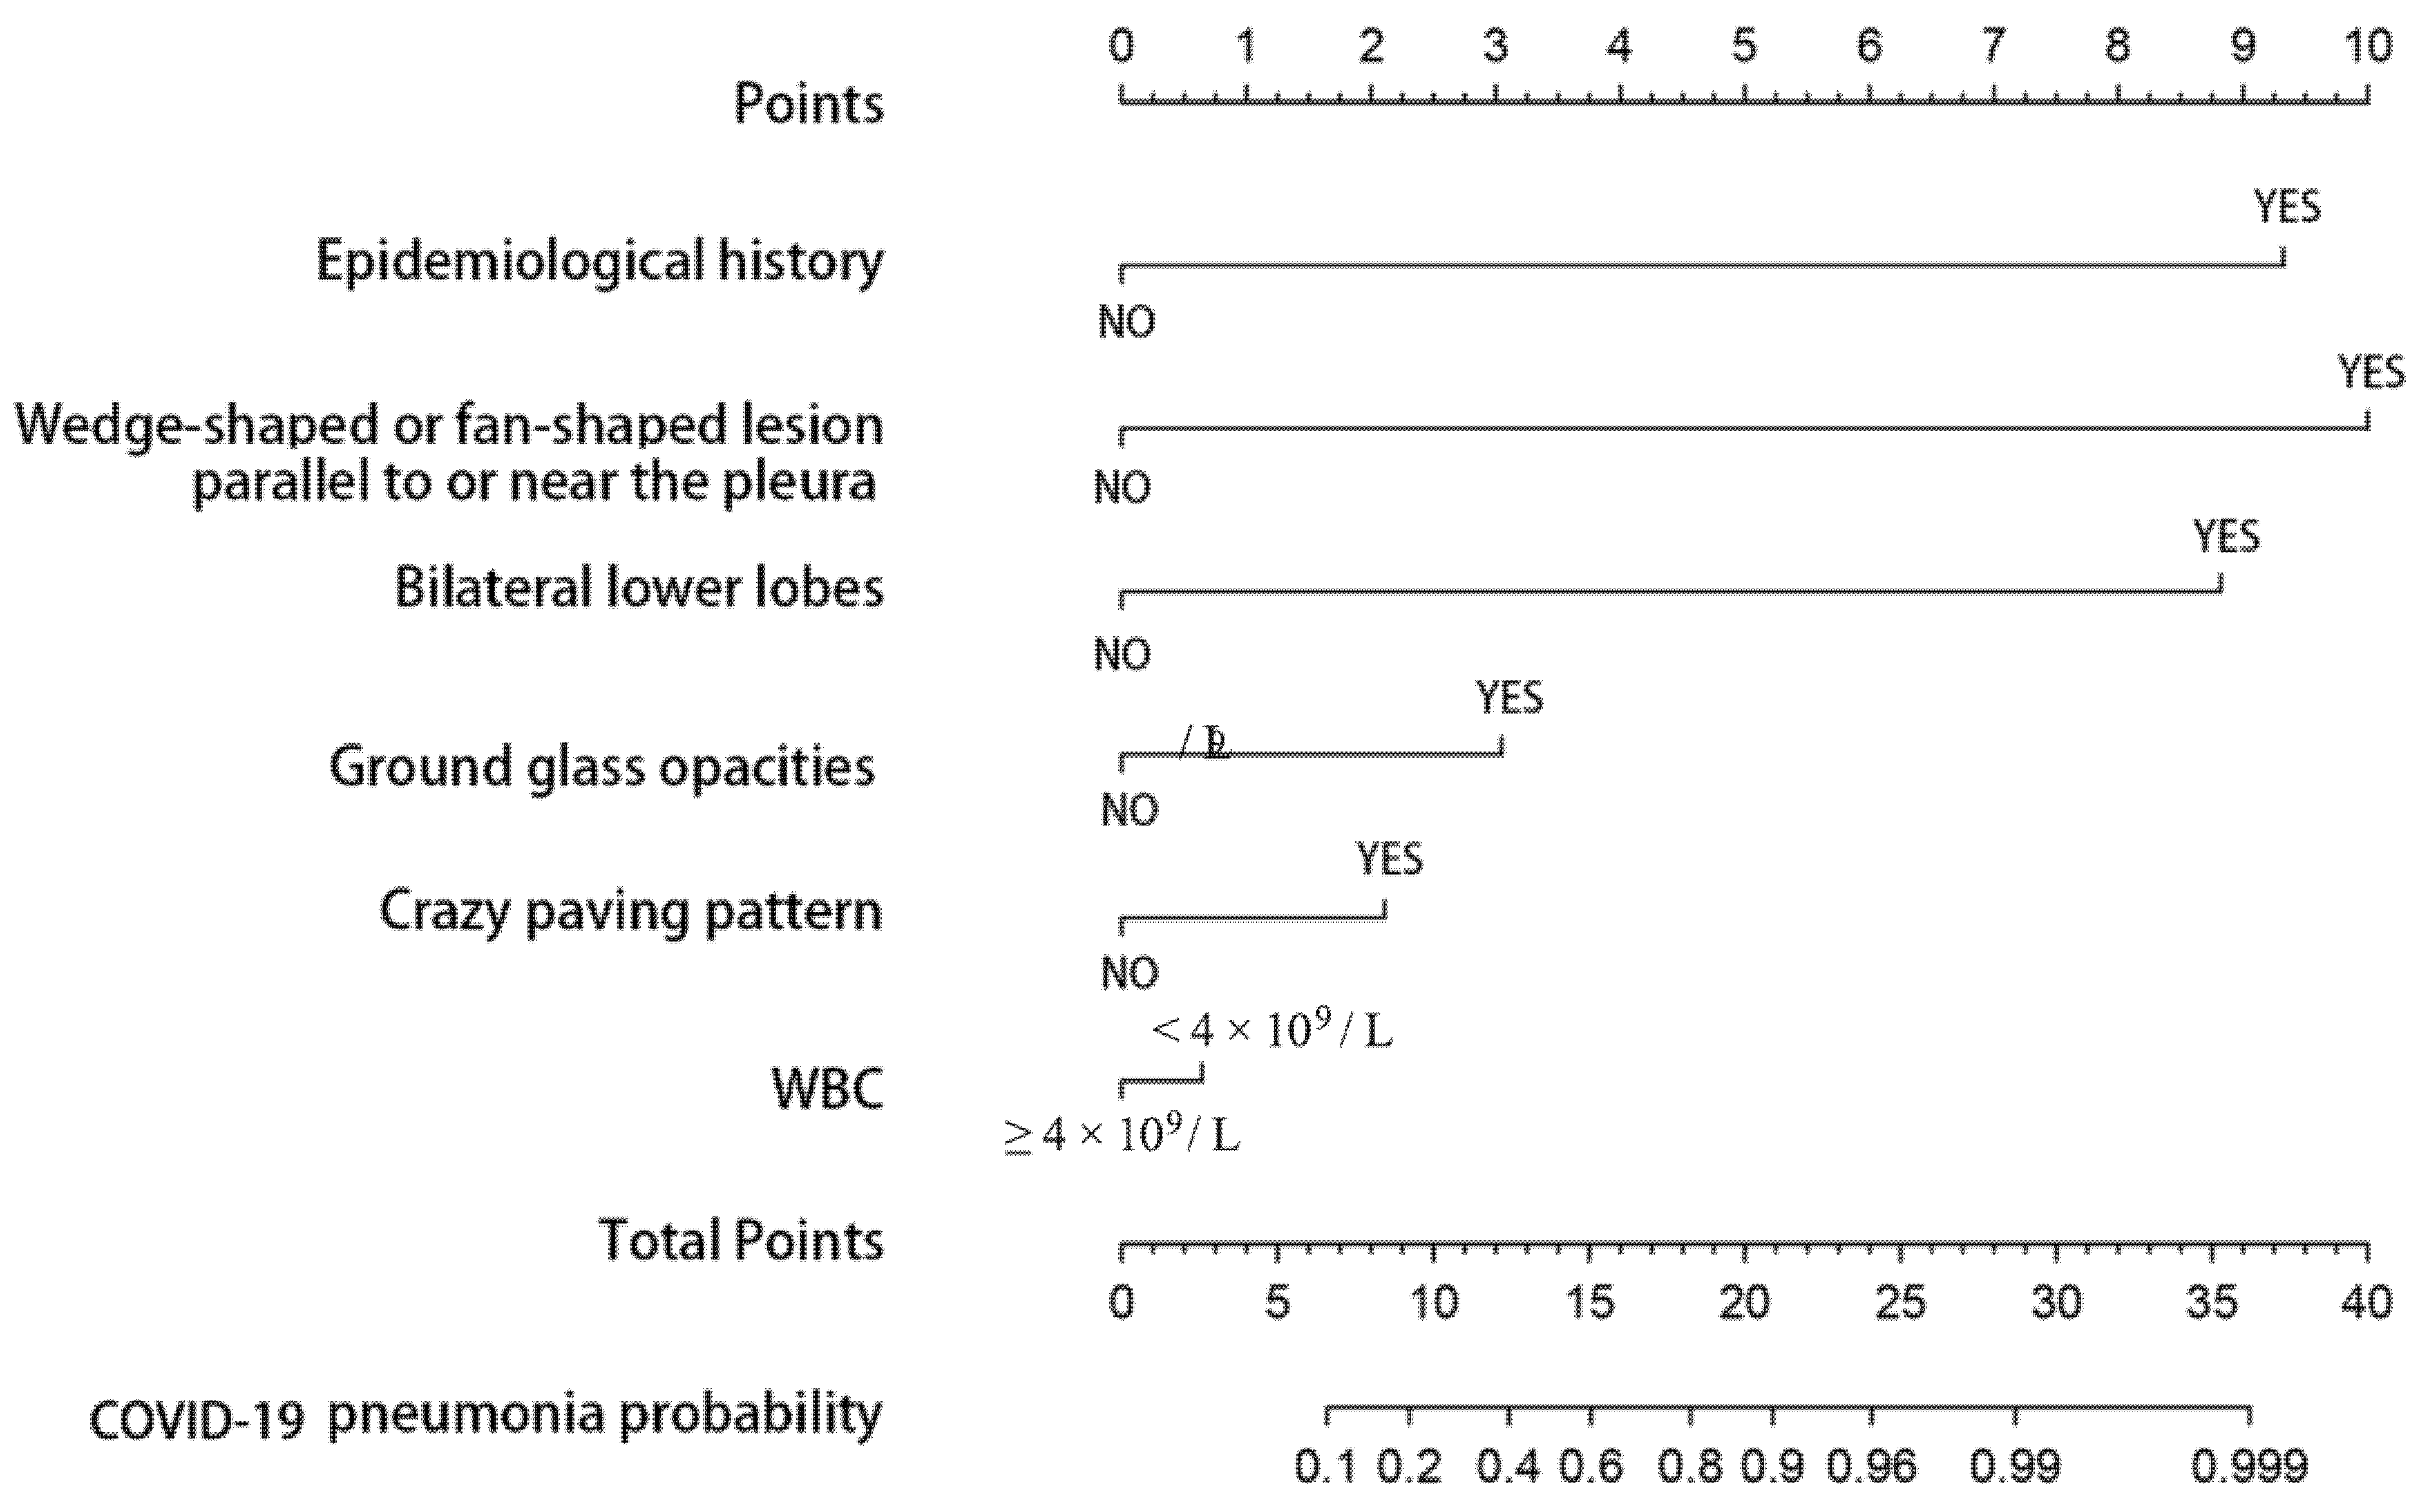
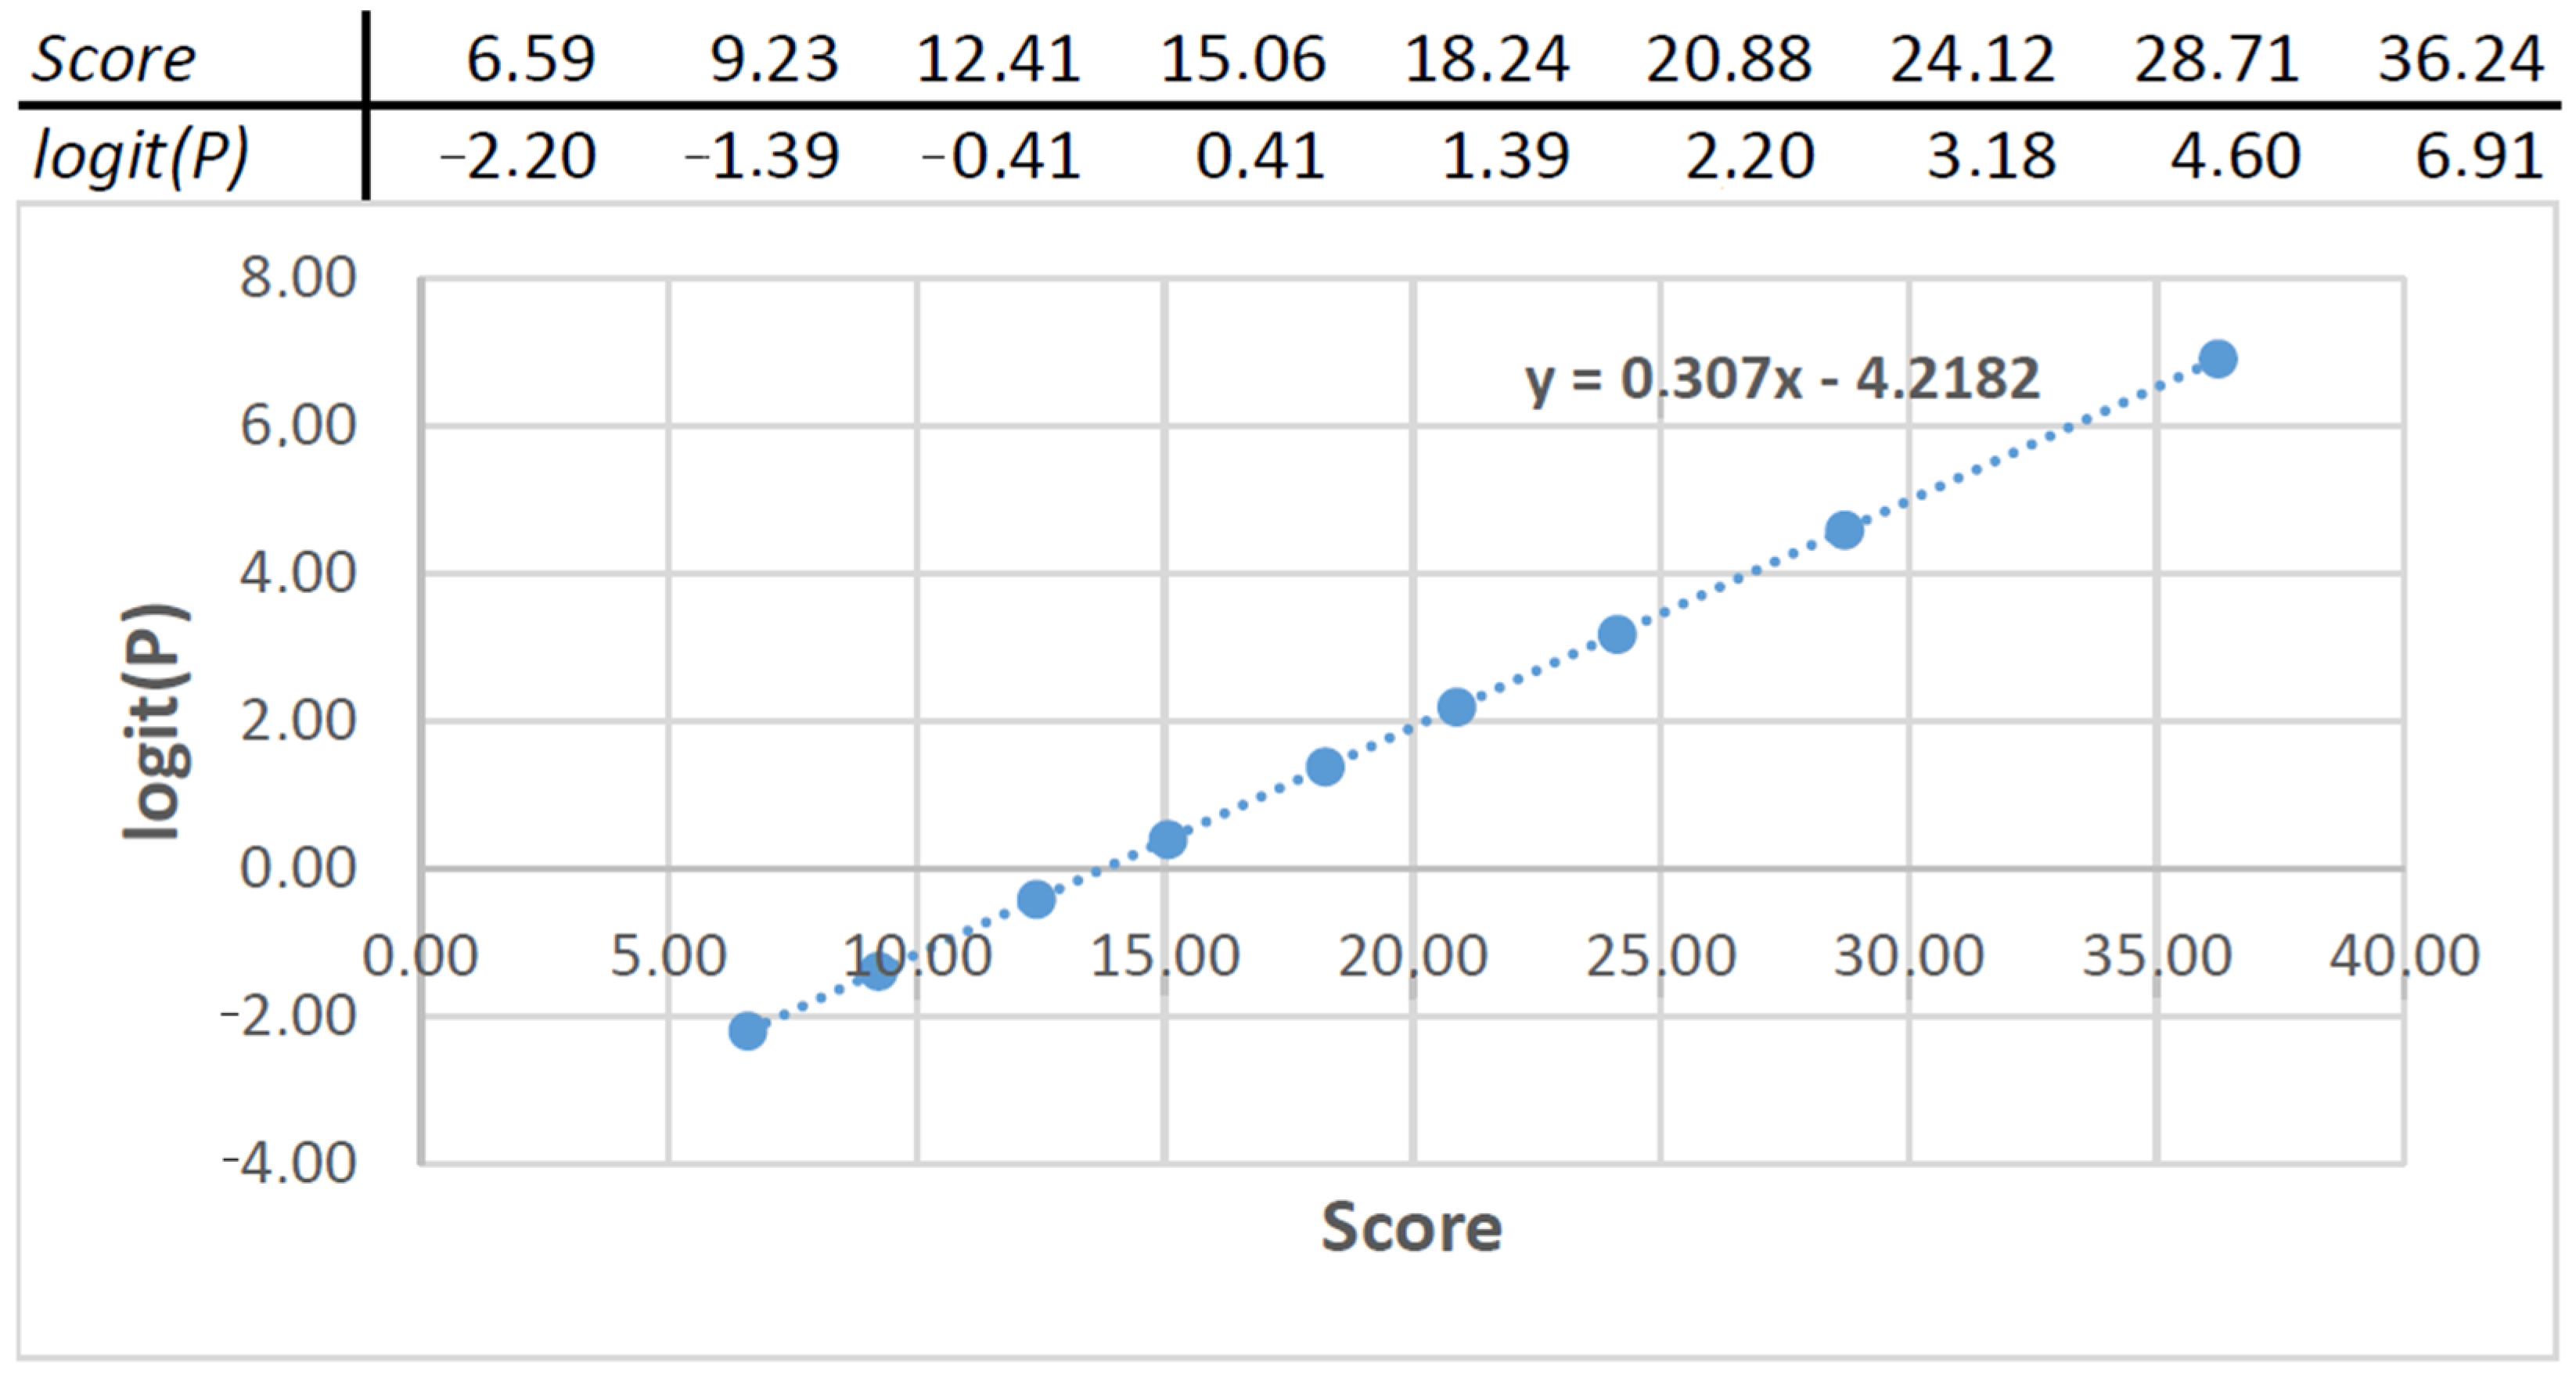
Getting Model Coefficients from a Nomogram

In order to improve readability and interpretability by medical specialists, regression models are often published as nomograms, without the model coefficients. To publish the models in a consistent manner on our platform, we used a simple method to extract the coefficients from nomograms. We took a number of sample patients, covering a variety of possible input parameters, and calculated the results using the nomogram and the logistic formula. This was used to check if the outcomes were the same for all patients. This check was applied to all conversions. This method is explained using an example taken from one of the implemented models [3], and is shown below in Figure 3.
The first step was to determine the relationship between the parameter and the nomogram score, which was done by reading the nomogram, as shown in Table 1.
The relationship between the parameters and the nomogram score P t o t a l is described by the following equation:
P t o t a l = x 1 · 9.32 + x 2 · 10 + x 3 · 8.82 + x 4 · 3.04 + x 5 · 2.10 + x 6 · 0.63
The next step is to determine the relationship between the nomogram score and the probability through the regression equation. A logistic regression model follows the following equation:
l o g i t ( p ) = β 0 + n β n · x n
The logit of the probability and the nomogram score should have a linear relationship, from which the slope was used to determine the value of the coefficients, and the intercept of the model was extracted (Figure 4).
For this example the regression coefficients are shown in Table 2.
All the models are written in PHP 8.0.0, where, for regression models, we set the coefficients and variables in the PHP syntax, thereby making the models operate identically. For the frontend side we used languages such as HTML, CSS and JavaScript for some specific functionalities. The backend of this platform is PHP based and the database is MySQL.

3. Results

We have created an open source website (Available online: https://covid19risk.ai/ (accessed on 27 April 2020)) to serve as an archive for published AI prediction models related to all aspects of COVID-19, including diagnosis, theragnosis (how to treat the patient, risk stratification), and follow-up (treatment response and complication).
Currently there are nine models implemented and published as illustrated in Table 3. Every showcased model includes a description of the methodology and clinical datasets used for model development and validation, and the limitations of each model are explicit.
For each online model given, doctors can find: (a) the intended use (predicted outcome) of the model, (b) to which patients does this tool apply (particularly among individuals with preexisting medical conditions), (c) the information and the parameters that need to be entered by the doctor, and (d) how the tool was developed. The doctors can visit the website, choose an applicable model, and fill in the variables asked in order to generate a probability. The COVID-19 predictive models on the website use the same calculations as the models described in the scientific publications on which they are based.
The main result of our work is a broadly applicable platform, which includes validated models regarding different stages, symptoms and outcomes of COVID-19. This repository of COVID-19 predictive models will serve as a decision aid for doctors.

4. Discussion

This platform can be viewed as a “model zoo” aimed at researchers and clinicians and with an adequate grasp of the medical complexities associated with COVID-19. The aim for all showcased models is to stimulate research and supplement clinical judgment, not substitute it. The open source website is not intended for unaided use by laypeople (e.g., patients). We re-emphasize that this manuscript and the website in its current form are only a prototype. We do not claim that all models that would pass our selection criteria have been included. Similarly, any model not currently included on the platform should not be seen as problematic.
For patient privacy, we implemented the ones that had the logistic formula and the ones that did not have dicom images. Our inclusion period ranged from December 2019 until June 2020. Recently, articles have been published that look at biomarkers such angiopoietin or interleukin and that are linked to COVID-19 hospital mortality and non-resolving pulmonary conditions [16,17]. We will incorporate such machine learning models by collaborating with external groups responsible for this type of model. Additionally, a more structured semantic-based organization will be provided, with the ability to categorize models based on the outcome being modeled (e.g., COVID-19 diagnosis, probability of severe disease, mortality risk) as well as separating models based on the type of input data required (e.g., demographic, comorbidity, laboratory test, imaging, genetic). We envision, once we separate models based on the outcome being modeled, having additional pages on the website that compare models designed to predict a particular outcome (e.g., comparing models in terms of their ability to predict COVID-19 mortality). However, we believe it is premature to do this currently for the following reasons: (1) if the models being compared were evaluated on vastly different cohorts (e.g., a Chinese vs European cohort or a referral hospital for high-risk patients vs a small rural healthcare center), this would doubtless affect model performance, and thus a simple numerical comparison would likely be misleading, (2) the external validation datasets used in these early studies are often small, leading to large statistical uncertainties. In the future, when the models become more extensively validated in a manner that addresses the previously mentioned limitations (e.g., by evaluating the models on larger cohorts from multiple countries), including such comparisons would be informative for the website user.
The models are intended for research purposes using clinical cohorts only, not for individual usage. These models should only be used by physicians who are familiar with the complexity of diagnostic and treatment decisions in infectious diseases and should not be used directly by patients. We underline that the goal of these models is to provide information to physicians and that they should not be used for decision support.
This paper should be seen by researchers from outside our collaboration as an invitation to participate on this platform, with the option of keeping the code hidden from the end user while still offering full functionality. We will assist external researchers for the successful incorporation of their models on our platform. This will create synergies that are bound to accelerate AI research on COVID-19. It will also ensure that models get the recognition they deserve and are used widely, instead of gathering dust as often happens when there are many publications on the same broad theme during a short period (a certainty in the context of COVID-19, given its world-changing nature).
The method we used for retrieving coefficients of a regression model from a nomogram has certain limitations. For one, the accuracy is highly dependent on the resolution of the published model. Another limitation is that although the coefficients of the model are retrieved, the standard error for the coefficients of the parameters cannot be obtained from a nomogram alone. However, the method can be applied to any nomogram, making it a tool that can be broadly used and not restricted to COVID-19.

5. Conclusions

Our platform (Available online: https://covid19risk.ai/ (accessed on 27 April 2020)), at the current prototype stage, includes nine validated machine-learning models to serve as decision aids to doctors for various aspects of COVID-19 patient care. Our method for obtaining regression coefficients from a nomogram can be used by other researchers, including in non-COVID contexts. Our platform will be maintained and regularly updated for at least three years, since we have secured funding for this period (DRAGON grant). Therefore, we are encouraging research groups to collaborate with us to share their models with the world.

Author Contributions

Conceptualization, I.H. and P.L.; methodology, Y.v.W.; software, I.H.; validation, A.C., C.O. and G.W.; formal analysis, C.O.; investigation, A.C.; resources, P.L.; data curation, Y.v.W.; writing—original draft preparation, I.H.; writing—review and editing, A.C.; visualization, I.H.; supervision, A.C.; project administration, B.v.E.; funding acquisition, P.L. All authors have read and agreed to the published version of the manuscript.

Funding

European Commission’s Horizon 2020 Research and Innovation programme under grant agreement 101016131 (ICOVID) and the Innovative Medicines Initiative 2 Joint Undertaking under grant agreement No 101005122 (DRAGON).

Institutional Review Board Statement

Not applicable.

Informed Consent Statement

Not applicable.

Data Availability Statement

Not applicable.

Acknowledgments

Authors acknowledge financial support from the European Commission’s Horizon 2020 research and innovation programme under grant agreement MSCA-ITN-PREDICT n° 766276, the IMI2 Joint undertaking program under grant agreement DRAGON n° 101005122 and iCovid grant.

Conflicts of Interest

Philippe Lambin reports, within and outside the submitted work, grants/sponsored research agreements from Varian medical, Oncoradiomics, ptTheragnostic/DNAmito, Health Innovation Ventures. He received an advisor/presenter fee and/or reimbursement of travel costs/external grant writing fee and/or in kind manpower contribution from Oncoradiomics, BHV, Merck, Varian, Elekta, ptTheragnostic and Convert pharmaceuticals. Lambin has shares in the company Oncoradiomics SA, Convert pharmaceuticals SA and The Medical Cloud Company SPRL and is co-inventor of two issued patents with royalties on radiomics (PCT/NL2014/050248, PCT/NL2014/050728) licensed to Oncoradiomics and one issue patent on mtDNA (PCT/EP2014/059089) licensed to ptTheragnostic/DNAmito, three non-patented invention (softwares) licensed to ptTheragnostic/DNAmito, Oncoradiomics and Health Innovation Ventures and three non-issues, non licensed patents on Deep Learning-Radiomics and LSRT (N2024482, N2024889, N2024889). He confirms that none of the above entities or funding was involved in the preparation of this paper.

References

  1. Wu, G.; Yang, P.; Xie, Y.; Woodruff, H.C.; Rao, X.; Guiot, J.; Frix, A.-N.; Louis, R.; Moutschen, M.; Li, J.; et al. Development of a Clinical Decision Support System for Severity Risk Prediction and Triage of COVID-19 Patients at Hospital Admission: An International Multicenter Study. Eur. Respir. J. 2020, 56, 2001104. [Google Scholar] [CrossRef] [PubMed]
  2. Song, C.-Y.; Xu, J.; He, J.-Q.; Lu, Y.-Q. COVID-19 early warning score: A multi-parameter screening tool to identify highly suspected patients. MedXRiv 2020. [Google Scholar] [CrossRef] [Green Version]
  3. Wang, Z.; Weng, J.; Li, Z.; Hou, R.; Zhou, L.; Ye, H.; Chen, Y.; Yang, T.; Chen, D.; Wang, L.; et al. Development and Validation of a Diagnostic Nomogram to Predict COVID-19 Pneumonia. MedRxiv 2020. [Google Scholar] [CrossRef]
  4. Wynants, L.; Van Calster, B.; Collins, G.S.; Riley, R.D.; Heinze, G.; Schuit, E.; Bonten, M.M.J.; Dahly, D.L.; Damen, J.A.; Debray, T.P.A.; et al. Prediction models for diagnosis and prognosis of covid-19: Systematic review and critical appraisal. BMJ 2020, 369, m1328. [Google Scholar] [CrossRef] [PubMed] [Green Version]
  5. Reiter, P.L.; Pennell, M.L.; Katz, M.L. Acceptability of a COVID-19 vaccine among adults in the United States: How many people would get vaccinated? Vaccine 2020, 38, 6500–6507. [Google Scholar] [CrossRef] [PubMed]
  6. Williams, L.; Gallant, A.J.; Rasmussen, S.; Nicholls, L.A.B.; Cogan, N.; Deakin, K.; Young, D.; Flowers, P. Towards intervention development to increase the uptake of COVID-19 vaccination among those at high risk: Outlining evidence-based and theoretically informed future intervention content. Br. J. Health Psychol. 2020, 25, 1039–1054. [Google Scholar] [CrossRef] [PubMed]
  7. Persad, G.; Peek, M.E.; Emanuel, E.J. Fairly Prioritizing Groups for Access to COVID-19 Vaccines. JAMA 2020, 324, 1601–1602. [Google Scholar] [CrossRef] [PubMed]
  8. Helms, J.; CRICS TRIGGERSEP Group (Clinical Research in Intensive Care and Sepsis Trial Group for Global Evaluation and Research in Sepsis); Tacquard, C.; Severac, F.; Leonard-Lorant, I.; Ohana, M.; Delabranche, X.; Merdji, H.; Clere-Jehl, R.; Schenck, M.; et al. High risk of thrombosis in patients with severe SARS-CoV-2 infection: A multicenter prospective cohort study. Intensive Care Med. 2020, 46, 1089–1098. [Google Scholar] [CrossRef] [PubMed]
  9. Jehi, L.; Ji, X.; Milinovich, A.; Erzurum, S.; Merlino, A.; Gordon, S.; Young, J.B.; Kattan, M.W. Development and validation of a model for individualized prediction of hospitalization risk in 4,536 patients with COVID-19. PLoS ONE 2020, 15, e0237419. [Google Scholar] [CrossRef]
  10. Collins, G.S.; Reitsma, J.B.; Altman, D.G.; Moons, K.G.M. Transparent Reporting of a Multivariable Prediction Model for Individual Prognosis or Diagnosis (TRIPOD): The TRIPOD Statement. Eur. Urol. 2015, 67, 1142–1151. [Google Scholar] [CrossRef] [PubMed] [Green Version]
  11. Naseem, M.; Akhund, R.; Arshad, H.; Ibrahim, M.T. Exploring the Potential of Artificial Intelligence and Machine Learning to Combat COVID-19 and Existing Opportunities for LMIC: A Scoping Review. J. Prim. Care Community Health 2020, 11, 2150132720963634. [Google Scholar] [CrossRef] [PubMed]
  12. Van Wijk, Y.; Halilaj, I.; Van Limbergen, E.; Walsh, S.; Lutgens, L.; Lambin, P.; Vanneste, B.G. Decision Support Systems in Prostate Cancer Treatment: An Overview. Biomed. Res. Int. 2019, 2019, 4961768. [Google Scholar] [CrossRef] [PubMed] [Green Version]
  13. Gong, J.; Ou, J.; Qiu, X.; Jie, Y.; Chen, Y.; Yuan, L.; Cao, J.; Tan, M.; Xu, W.; Zheng, F.; et al. A Tool to Early Predict Severe Corona Virus Disease 2019 (COVID-19): A Multicenter Study using the Risk Nomogram in Wuhan and Guangdong, China. Clin Infect Dis. 2020, 71, 833–840. [Google Scholar] [CrossRef] [PubMed] [Green Version]
  14. COVID-19 Vulnerability Index (cv19index)—ClosedLoop.ai. Available online: https://closedloop.ai/c19index/ (accessed on 15 December 2020).
  15. COVID-19 Prognostic Tool. Available online: https://qxmd.com/calculate (accessed on 15 December 2020).
  16. Villa, E.; Critelli, R.; Lasagni, S.; Melegari, A.; Curatolo, A.; Celsa, C.; Romagnoli, D.; Melegari, G.; Pivetti, A.; Di Marco, L.; et al. Dynamic angiopoietin-2 assessment predicts survival and chronic course in hospitalized patients with COVID-19. Blood Adv. 2021, 5, 662–673. [Google Scholar] [CrossRef] [PubMed]
  17. HaHalasz, G.; Sperti, M.; Villani, M.; Michelucci, U.; Agostoni, P.; Biagi, A.; Rossi, L.; Botti, A.; Mari, C.; Maccarini, M.; et al. A Machine Learning Approach for Mortality Prediction in COVID-19 Pneumonia: Development and Evaluation of the Piacenza Score. J. Med. Internet Res. 2021, 23, e29058. [Google Scholar] [CrossRef] [PubMed]
Figure 1. The workflow from defining the convenient models until the end phase.
Biomed 01 00003 g001
Figure 2. TRIPOD types classifications [10].
Biomed 01 00003 g002
Figure 3. “Development and Validation of a Diagnostic Nomogram to Predict COVID-19 Pneumonia”, Available online: https://www.medrxiv.org/content/10.1101/2020.04.03.20052068v1 (accessed on 20 April 2020).
Biomed 01 00003 g003
Figure 4. Logit(P) plotted against the nomogram score.
Biomed 01 00003 g004
Table 1. Point reading for the nomogram.
Parameter (Unit)EquationValuePoints
Epidemiological history (yes/no, Boolean)x119.32
00.00
Wedge/fan-shaped lesion (yes/no, Boolean)x2110.00
00
Bilateral lower lobes (yes/no, Boolean)x318.82
00.00
Ground glass opacities (yes/no, Boolean)x413.04
00.00
Crazy paving pattern (yes/no, Boolean)x512.10
00.00
WBC (<4 × 10⁹/L, Boolean)x610.63
00.00
Table 2. Coefficients and intercept extracted from nomogram.
Parameter (Unit)Coefficient
Epidemiological history0.93
Wedge/fan-shaped lesion0.64
Bilateral lower lobes0.19
Ground glass opacities0.93
Crazy paving pattern0.64
WBC0.19
Intercept−4.23
Table 3. For every model: input features, output, cohort type and TRIPOD type.
Model NrInput Features-OutputCohort TypeTripod Type
Model 1Input features: Age, hospital staff (Yes/No).
Output: Probability of severe illness [1].
Asymptomatic COVID positive patientsType 2b
Model 2Input features: Age, hospital staff (Yes/No), body temperature, days since onset of symptoms.
Output: Probability of severe illness [1].
Symptomatic COVID positive patientsType 2b
Model 3Input features: Age, CT lesion score (0 = no lung parenchyma involved, 1 = up to 5% of lung parenchyma involved, 2 = 5–25%, 3 = 26–50%, 4 = 51–75%, 5 = 76–100% of lung parenchyma involved; final CT score is a total score from five lobes).
Output: Probability of severe illness [1].
COVID positive patients with semantic CT featuresType 2b
Model 4Input features: Age, Lymphocyte, C-reactive protein, Lactate dehydrogenase, Creatine kinase, Urea, Calcium.
Output: Probability of severe illness [1].
COVID-19 positive patients with blood test resultsType 3
Model 5Input features: Signs of pneumonia on CT, History of close contact with Covid-19 confirmed, Patient(yes/No), Fever, Age, Gender, Max temperature, Respiratory symptoms, Neutrophil-to-lymphocyte ratio. Output: Probability of severe illness [2].COVID-19 positive patientsType 2b
Model 6Input features: Age, Direct bilirubin, Red blood cell distribution width, Blood urea nitrogen, C-reactive protein, Lactate dehydrogenase, Albumin.
Output: Probability of severe illness [13].
COVID-19 positive patientsType 2b
Model 7Input features: Age, Sex, Diabetes, COPD or emphysema, or chronic Bronchitis, Asthma, Cystic fibrosis, Hypertension, Had a heart attack, had a stroke, Coronary atherosclerosis or other heart disease, Congestive heart failure, Rheumatic kidney disease, Chronic kidney disease, Liver disease, Cancer, Neurocognitive conditions, Sickle cell anemia, HIV infection (Yes/No).
Health history: Organ transplant, Hemodialysis treatment, pneumonia, acute bronchitis, influenza or other acute respiratory infection, pregnant last 2 weeks, hospital admission/emergency last year, height, weigh.Symptoms: fever, shortness in breath, cough, fatigue, body aches, headache, diarrhea, sore throat, decrease smell and taste (Yes/No).
Output: Predicts vulnerability score to serious illness from COVID-19 [14].
COVID-19 positive patients (vulnerable to develop serious complications)Type 3
Model 8Input features: Age, cardiovascular disease, diabetes, chronic respiratory disease, hypertension, cancer, prior stroke, heart disease, chronic kidney disease.
Output: Estimate mortality rates in patients with COVID-19 [15].
COVID-19 positive patientsType 3
Model 9Input features: Epidemiological history, wedge-shaped or fan-shaped lesion parallel or near to the pleura, bilateral lower lobes, ground glass opacities, crazy paving pattern, WBC.
Output: Probability of severe illness [3].
Suspected COVID-19 pneumonia patientsType 2b
Publisher’s Note: MDPI stays neutral with regard to jurisdictional claims in published maps and institutional affiliations.

