An Autopsy-Based Analysis of Fatal Road Traffic Collisions: How the Pattern of Injury Differs with the Type of Vehicle


Abstract
:1. Introduction
2. Materials and Methods
3. Results
3.1. Epidemiological Data
3.2. Autopsy Reports
4. Discussion
4.1. Car Drivers
4.2. Pedestrians
4.3. Motorcyclists
4.4. Cyclists
4.5. Truck Drivers
5. Conclusions
Author Contributions
Funding
Institutional Review Board Statement
Informed Consent Statement
Conflicts of Interest
References
- World Health Organization. Road Traffic Injuries. Available online: https://www.who.int/health-topics/road-safety#tab=tab_1 (accessed on 5 June 2021).
- ISTAT. Incidenti Stradali in Italia. Available online: https://www.istat.it/it/archivio/245757 (accessed on 5 June 2021).
- Adminaité-Fodor, D.; Caroline, H.; Jost, G. 13th Annual Road Safety Performance Index Report; European Transport Safety Council: Brussels, Belgium, 2019; pp. 6–42. [Google Scholar]
- European Road Safety Observatory. Annual Accident Report 2018; European Road Safety Observatory: Brussels, Belgium, 2018; pp. 3–85. [Google Scholar]
- Amadasi, A.; Cerutti, E.; Spagnoli, L.; Blandino, A.; Rancati, A.; Gallo, C.; Mancini, E.; Rizzi, V.; Cattaneo, C. The toll of traffic-related fatalities in a metropolitan Italian area through the experience of the Department of Legal Medicine. Int. J. Inj. Contr. Saf. Promot. 2016, 23, 197–205. [Google Scholar] [CrossRef] [PubMed]
- Statistical Dataset Road Traffic Statistics (TRA). Data on Road Traffic by Road and Vehicle Type, Produced by Department for Transport. Available online: https://www.gov.uk/government/statistical-data-sets/road-traffic-statistics-tra (accessed on 7 June 2021).
- Statistical Dataset Reported Drinking and Driving (RAS51). Data about the Reported Drink Drive Accidents and Casualties, Produced by Department for Transport. Available online: https://www.gov.uk/government/statistical-data-sets/reported-drinking-and-driving-ras51 (accessed on 7 June 2021).
- Westerman, S.J.; Haigney, D. Individual differences in driver stress, error and violation. Personal. Individ. Differ. 2000, 29, 981–998. [Google Scholar] [CrossRef]
- Stachl, C.; Buehner, M. Show me how you Drive and I’ll Tell you who you are Recognizing Gender Using Automotive Driving Parameters. Procedia Manuf. 2015, 3, 5587–5594. [Google Scholar] [CrossRef] [Green Version]
- Buschmann, C.; Gross, A.; Tsokos, M.; Kleber, C. Fatal bicycle accidents in the city of Berlin from 2000–2009—Circumstantial features, accident mechanism, and causes of death. ZVS 2014, 60, 9–27. [Google Scholar]
- Faduyile, F.; Emiogun, F.; Soyemi, S.; Oyewole, O.; Okeke, U.; Williams, O. Pattern of Injuries in Fatal Motorcycle Accidents Seen in Lagos State University Teaching Hospital: An Autopsy-Based Study. Open Access Maced. J. Med. Sci. 2017, 5, 112–116. [Google Scholar] [CrossRef] [Green Version]
- Bil, M.; Bilova, M.; Dobias, M.; Andrasik, R. Circumstances and causes of fatal cycling crashes in the Czech Republic. Traffic Inj. Prev. 2016, 17, 394–399. [Google Scholar] [CrossRef]
- Pfeifer, R.; Schick, S.; Holzmann, C.; Graw, M.; Teuben, M.; Pape, H.C. Analysis of Injury and Mortality Patterns in Deceased Patients with Road Traffic Injuries: An Autopsy Study. World J. Surg. 2017, 41, 3111–3119. [Google Scholar] [CrossRef] [Green Version]
- Kibayashi, K.; Shimada, R.; Nakao, K. Fatal traffic accidents and forensic medicine. IATSS Res. 2014, 38, 71–76. [Google Scholar] [CrossRef] [Green Version]
- Schmitt, K.U.; Niederer, P.; Muser, M.; Walz, F. Trauma Biomechanics—Accidental Injury in Traffic and Sports, 2nd ed.; Springer: Berlin, Germany, 2007; pp. 75–78, 135–142. [Google Scholar]
- Leijdesdorff, H.A.; van Dijck, J.T.; Krijnen, P.; Vleggeert-Lankamp, C.L.; Schipper, I.B.; Regional Trauma Center West-Netherlands’ Research Group. Injury pattern, hospital triage, and mortality of 1250 patients with severe traumatic brain injury caused by road traffic accidents. J. Neurotrauma 2014, 31, 459–465. [Google Scholar] [CrossRef]
- Töro, K.; Hubay, M.; Sótonyi, P.; Keller, E. Fatal traffic injuries among pedestrians, bicyclists and motor vehicle occupants. Forensic Sci. Int. 2005, 151, 151–156. [Google Scholar] [CrossRef]
- Jia, M.; Li, Z.; Zhang, J.; Huang, P.; Wang, J.; Zou, D.; Tao, L.; Chen, Y. Finite element analysis to determine the cause of ring fractures in a motorcyclist’s head. Leg. Med. 2020, 45, 101697. [Google Scholar] [CrossRef] [PubMed]
- Konrad, C.J.; Fieber, T.S.; Schuepfer, G.K.; Gerber, H.R. Are fractures of the base of the skull influenced by the mass of the protective helmet? A retrospective study in fatally injured motorcyclists. J. Trauma Acute Care Surg. 1996, 41, 854–858. [Google Scholar] [CrossRef] [PubMed]
- Gentile, G.; Tambuzzi, S.; Giovanetti, G.; Zoja, R. Sudden death due to cardiac contusion: Forensic implications in a rare pediatric case. J. Forensic Sci. 2021, in press. [Google Scholar] [CrossRef] [PubMed]
- Kullgren, A.; Stigson, H.; Ydenius, A.; Axelsson, A.E.M. The potential of vehicle and road infrastructure interventions in fatal bicyclist accidents on Swedish roads-What can in-depth studies tell us? Traffic Inj. Prev. 2019, 20, S7–S12. [Google Scholar] [CrossRef] [PubMed] [Green Version]
- Devivo, M.J. Epidemiology of traumatic spinal cord injury: Trends and future implications. Spinal Cord 2012, 50, 365–372. [Google Scholar] [CrossRef]
- Ferro, S.; Cecconi, L.; Bonavita, J.; Pagliacci, M.C.; Biggeri, A.; Franceschini, M. Incidence of traumatic spinal cord injury in Italy during 2013-2014: A population-based study. Spinal Cord 2017, 55, 1103–1107. [Google Scholar] [CrossRef]
- De Vivo, M.J.; Kartus, P.L.; Stover, S.L.; Rutt, R.D.; Fine, P.R. Cause of death for patients with spinal cord injuries. Arch. Intern. Med. 1989, 149, 1761–1766. [Google Scholar] [CrossRef]
- Lieutaud, T.; Ndiaye, A.; Frost, F.; Chiron, M.; Registry Group. A 10-year population survey of spinal trauma and spinal cord injuries after road accidents in the Rhône area. J. Neurotrauma 2010, 27, 1101–1107. [Google Scholar] [CrossRef]
- Zulkipli, Z.H.; Faudzi, S.A.M.; Mohamed, N. Spine Injuries among Fatal Victims of Vehicular Accidents in Kuala Lumpur, Malaysia. In Proceedings of the 2012 IRCOBI Conference, Dublin, Ireland, 12–14 September 2012; pp. 33–42. [Google Scholar]
- Watanabe, K.; Fukuda, I.; Asari, Y. Management of traumatic aortic rupture. Surg. Today 2013, 43, 1339–1346. [Google Scholar] [CrossRef]
- Balm, R.; Legemate, D.A. Traumatic aortic rupture. Br. J. Surg. 2006, 93, 1033–1034. [Google Scholar] [CrossRef]
- Chatzaraki, V.; Thali, M.J.; Ampanozi, G.; Schweitzer, W. Fatal Road Traffic Vehicle Collisions With Pedestrian Victims: Forensic Postmortem Computed Tomography and Autopsy Correlation. Am. J. Forensic Med. Pathol. 2018, 39, 130–140. [Google Scholar] [CrossRef] [PubMed] [Green Version]
- ISTAT. Morti E Feriti in Incidenti Stradali. Available online: http://dati.istat.it/Index.aspx?DataSetCode=DCIS_MORTIFERITISTR1 (accessed on 8 June 2021).
- Schulz, E.; Jahn, R. Ringfrakturen der Schädelbasis [Ring fractures of the base of the skull]. Z. Rechtsmed. 1983, 90, 137–145. [Google Scholar] [CrossRef] [PubMed]


| Car | Pedestrian | Motorbike | Bicycle | Truck | |
|---|---|---|---|---|---|
| Head (n; %) | 32 (80) | 38 (95) | 28 (70) | 37 (93) | 16 (80) |
| Neck (n; %) | 10 (25) | 6 (15) | 19 (48) | 15 (38) | 6 (30) |
| Thorax (n; %) | 39 (98) | 36 (90) | 38 (95) | 37 (93) | 19 (95) |
| Abdomen (n; %) | 29 (73) | 22 (55) | 28 (70) | 24 (60) | 15 (75) |
| Pelvis (n; %) | 18 (45) | 15 (38) | 8 (20) | 13 (33) | 10 (50) |
| Limbs (n; %) | 24 (60) | 20 (50) | 19 (48) | 15 (38) | 11 (55) |
| Anatomical Region | Car | Pedestrian | Motorbike | Bicycle | Truck | |
|---|---|---|---|---|---|---|
| Head | Neurocranium Top (n; %) | 19 (47.5) | 22 (55) | 6 (15) | 15 (37.5) | 9 (45) |
| Neurocranium Base (n; %) | 20 (50) | 26 (65) | 18 (45) | 28 (70) | 9 (45) | |
| Exposition of Cerebral Parenchyma (n; %) | 5 (12.5) | 9 (22.5) | 3 (7.5) | 4 (10) | 2 (10) | |
| Destruction of Cerebral Parenchyma (n; %) | 8 (20) | 12 (30) | 6 (15) | 10 (25) | 2 (10) | |
| Epidural Hematoma (n; %) | 7 (17.5) | 7 (17.5) | 3 (7.5) | 8 (20) | 3 (15) | |
| Dura Mater Laceration (n; %) | 7 (17.5) | 6 (15) | 3 (7.5) | 9 (22.5) | 5 (25) | |
| Subdural Hematoma (n; %) | 16 (40) | 24 (60) | 18 (45) | 24 (60) | 8 (40) | |
| Subarachnoid Hematoma (n; %) | 25 (62.5) | 32 (80) | 25 (62.5) | 30 (75) | 12 (60) | |
| Intraventricular Hemorrhage (n; %) | 20 (50) | 24 (60) | 20 (50) | 26 (65) | 11 (55) | |
| Neck | Esophagus Transection (n; %) | 0 (0) | 0 (0) | 2 (5) | 0 (0) | 0 (0) |
| Trachea Transection (n; %) | 0 (0) | 0 (0) | 4 (10) | 2 (5) | 0 (0) | |
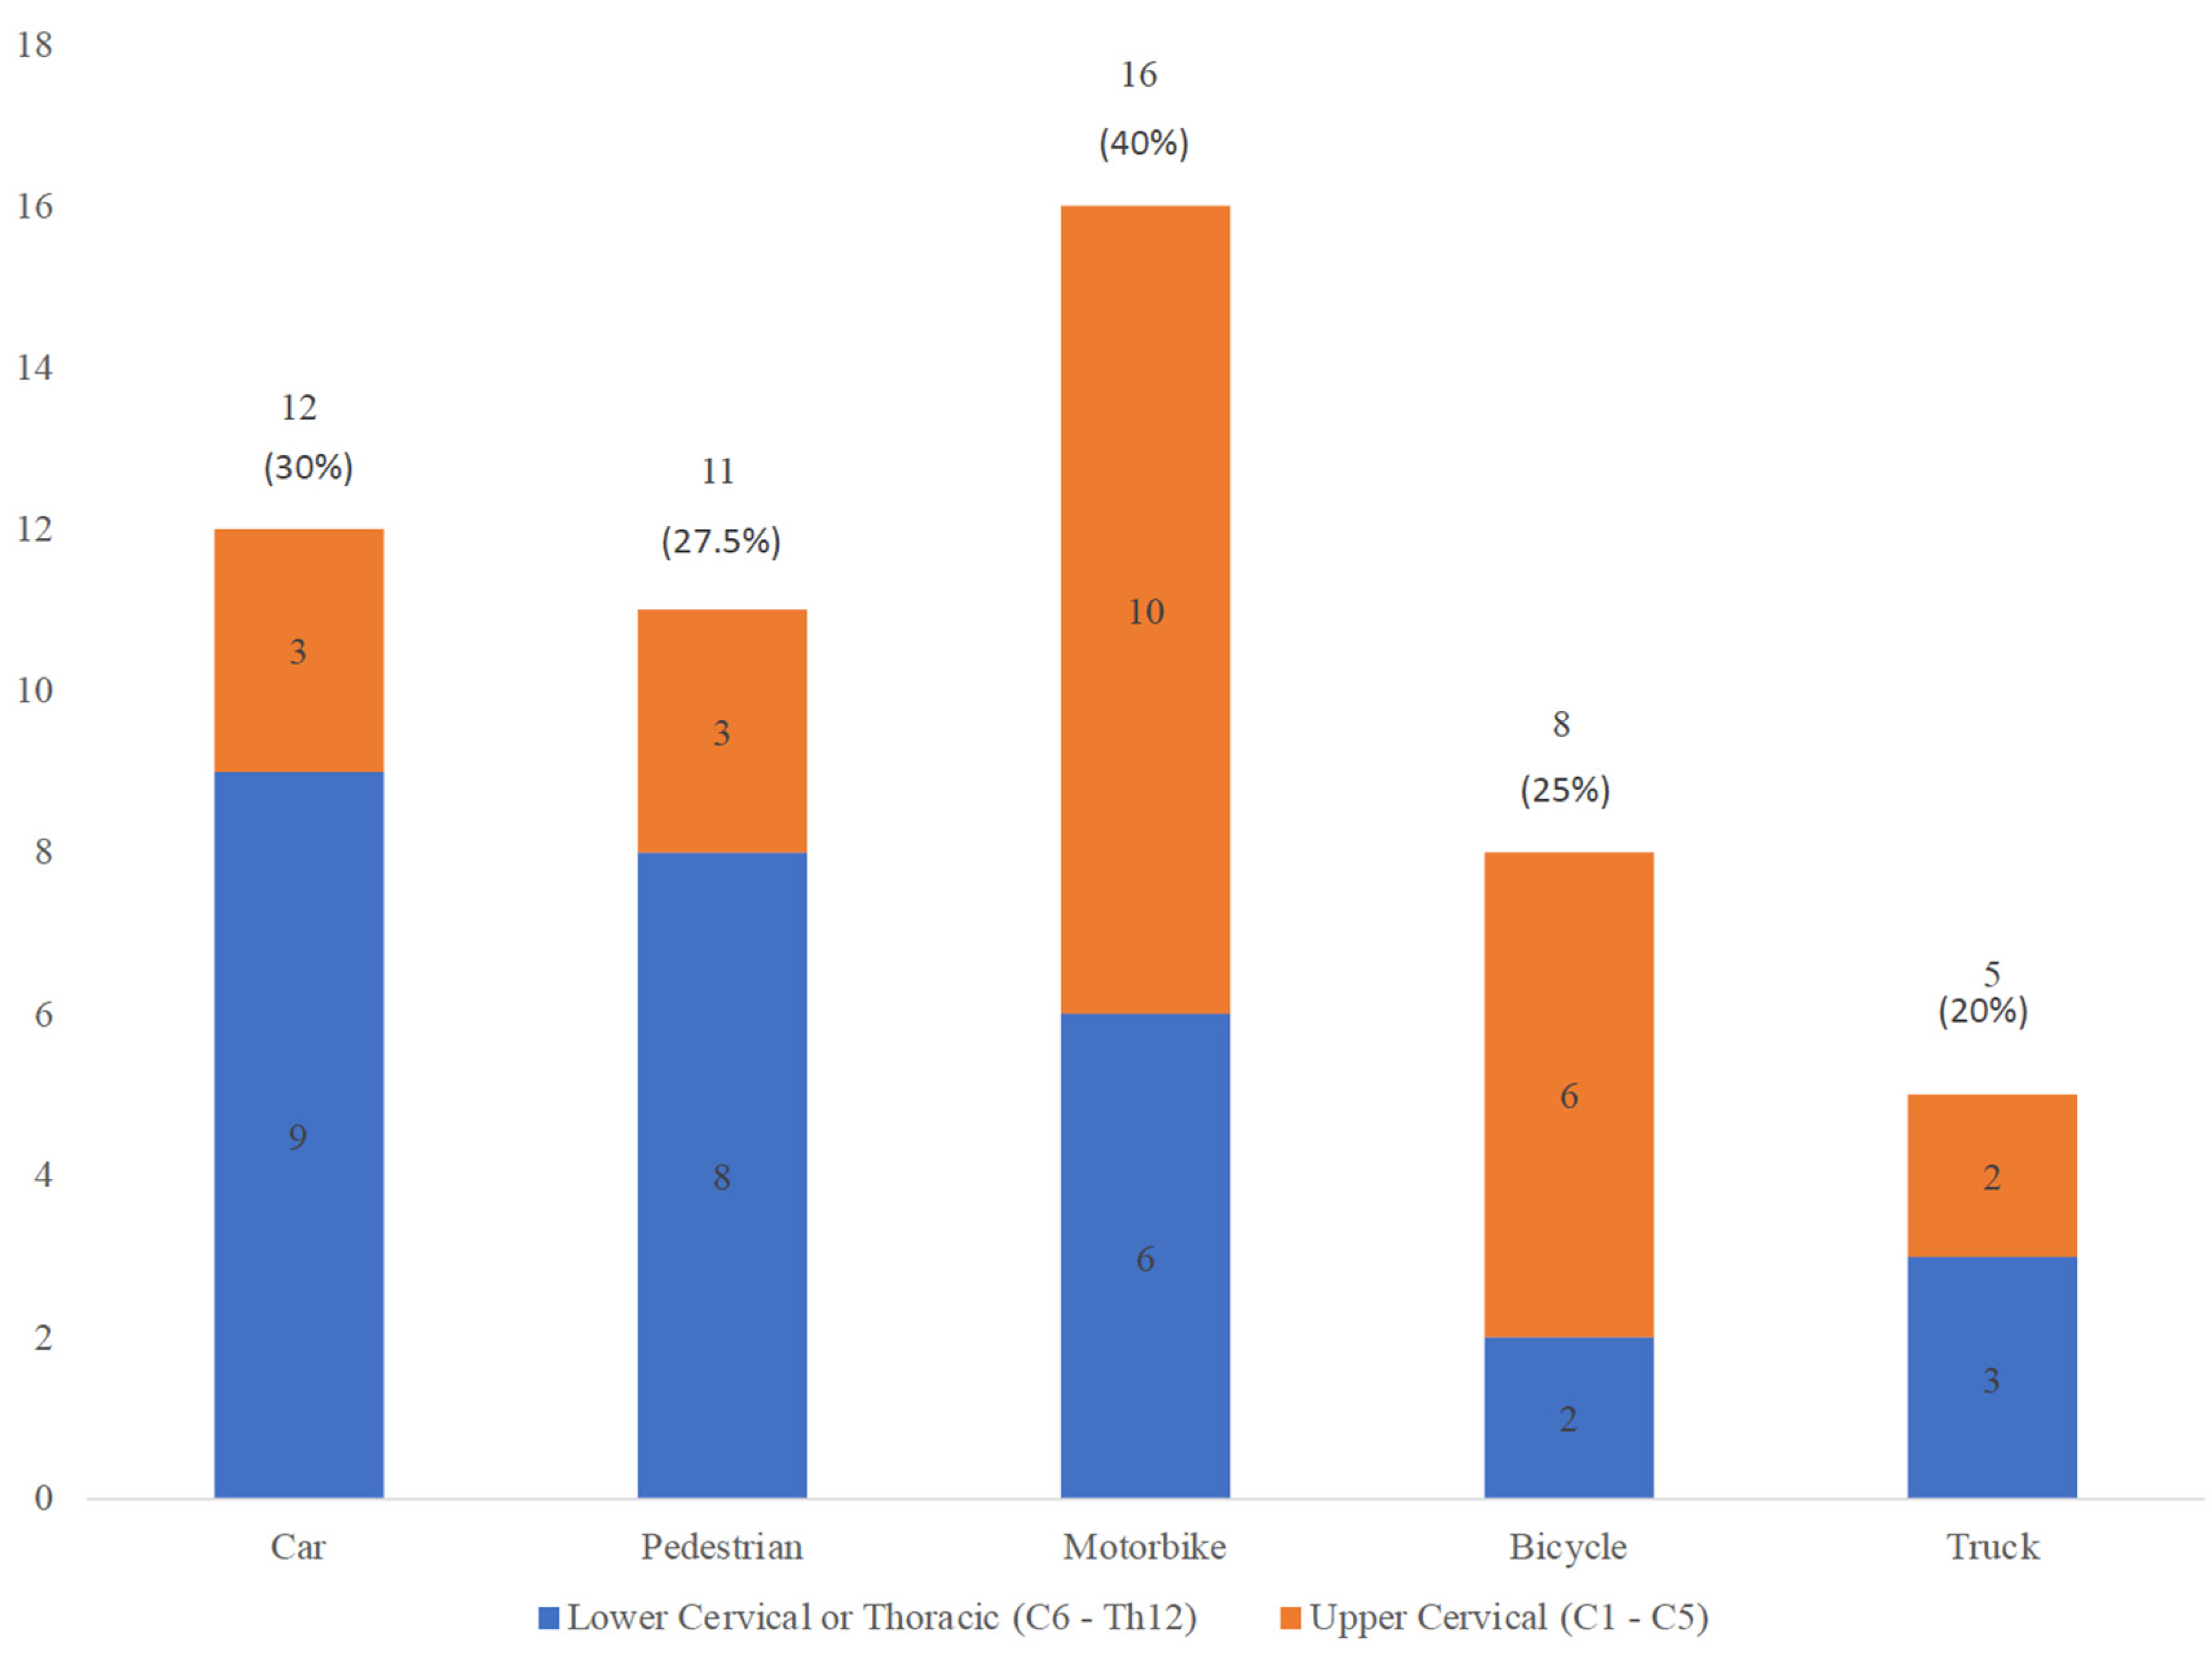
| Spinal Cord Injury and Transections (n; %) | 12 (30) | 11 (28) | 16 (40) | 8 (20) | 5 (25) | |
| Thorax | Left Lung Laceration (n; %) | 8 (20) | 7 (17.5) | 9 (22.5) | 8 (20) | 3 (15) |
| Right Lung Laceration (n; %) | 10 (25) | 7 (17.5) | 9 (22.5) | 9 (22.5) | 4 (20) | |
| Pericardial Rupture (n; %) | 12 (30) | 12 (30) | 9 (22.5) | 15 (37.5) | 4 (20) | |
| Cardiac Rupture (n; %) | 10 (25) | 5 (12.5) | 3 (7.5) | 6 (15) | 0 (0) | |
| Superior Vena Cava Laceration (n; %) | 0 (0) | 1 (2.5) | 2 (5) | 2 (5) | 0 (0) | |
| Pulmonary Vessels Laceration (n; %) | 1 (2.5) | 2 (5) | 1 (2.5) | 1 (2.5) | 0 (0) | |
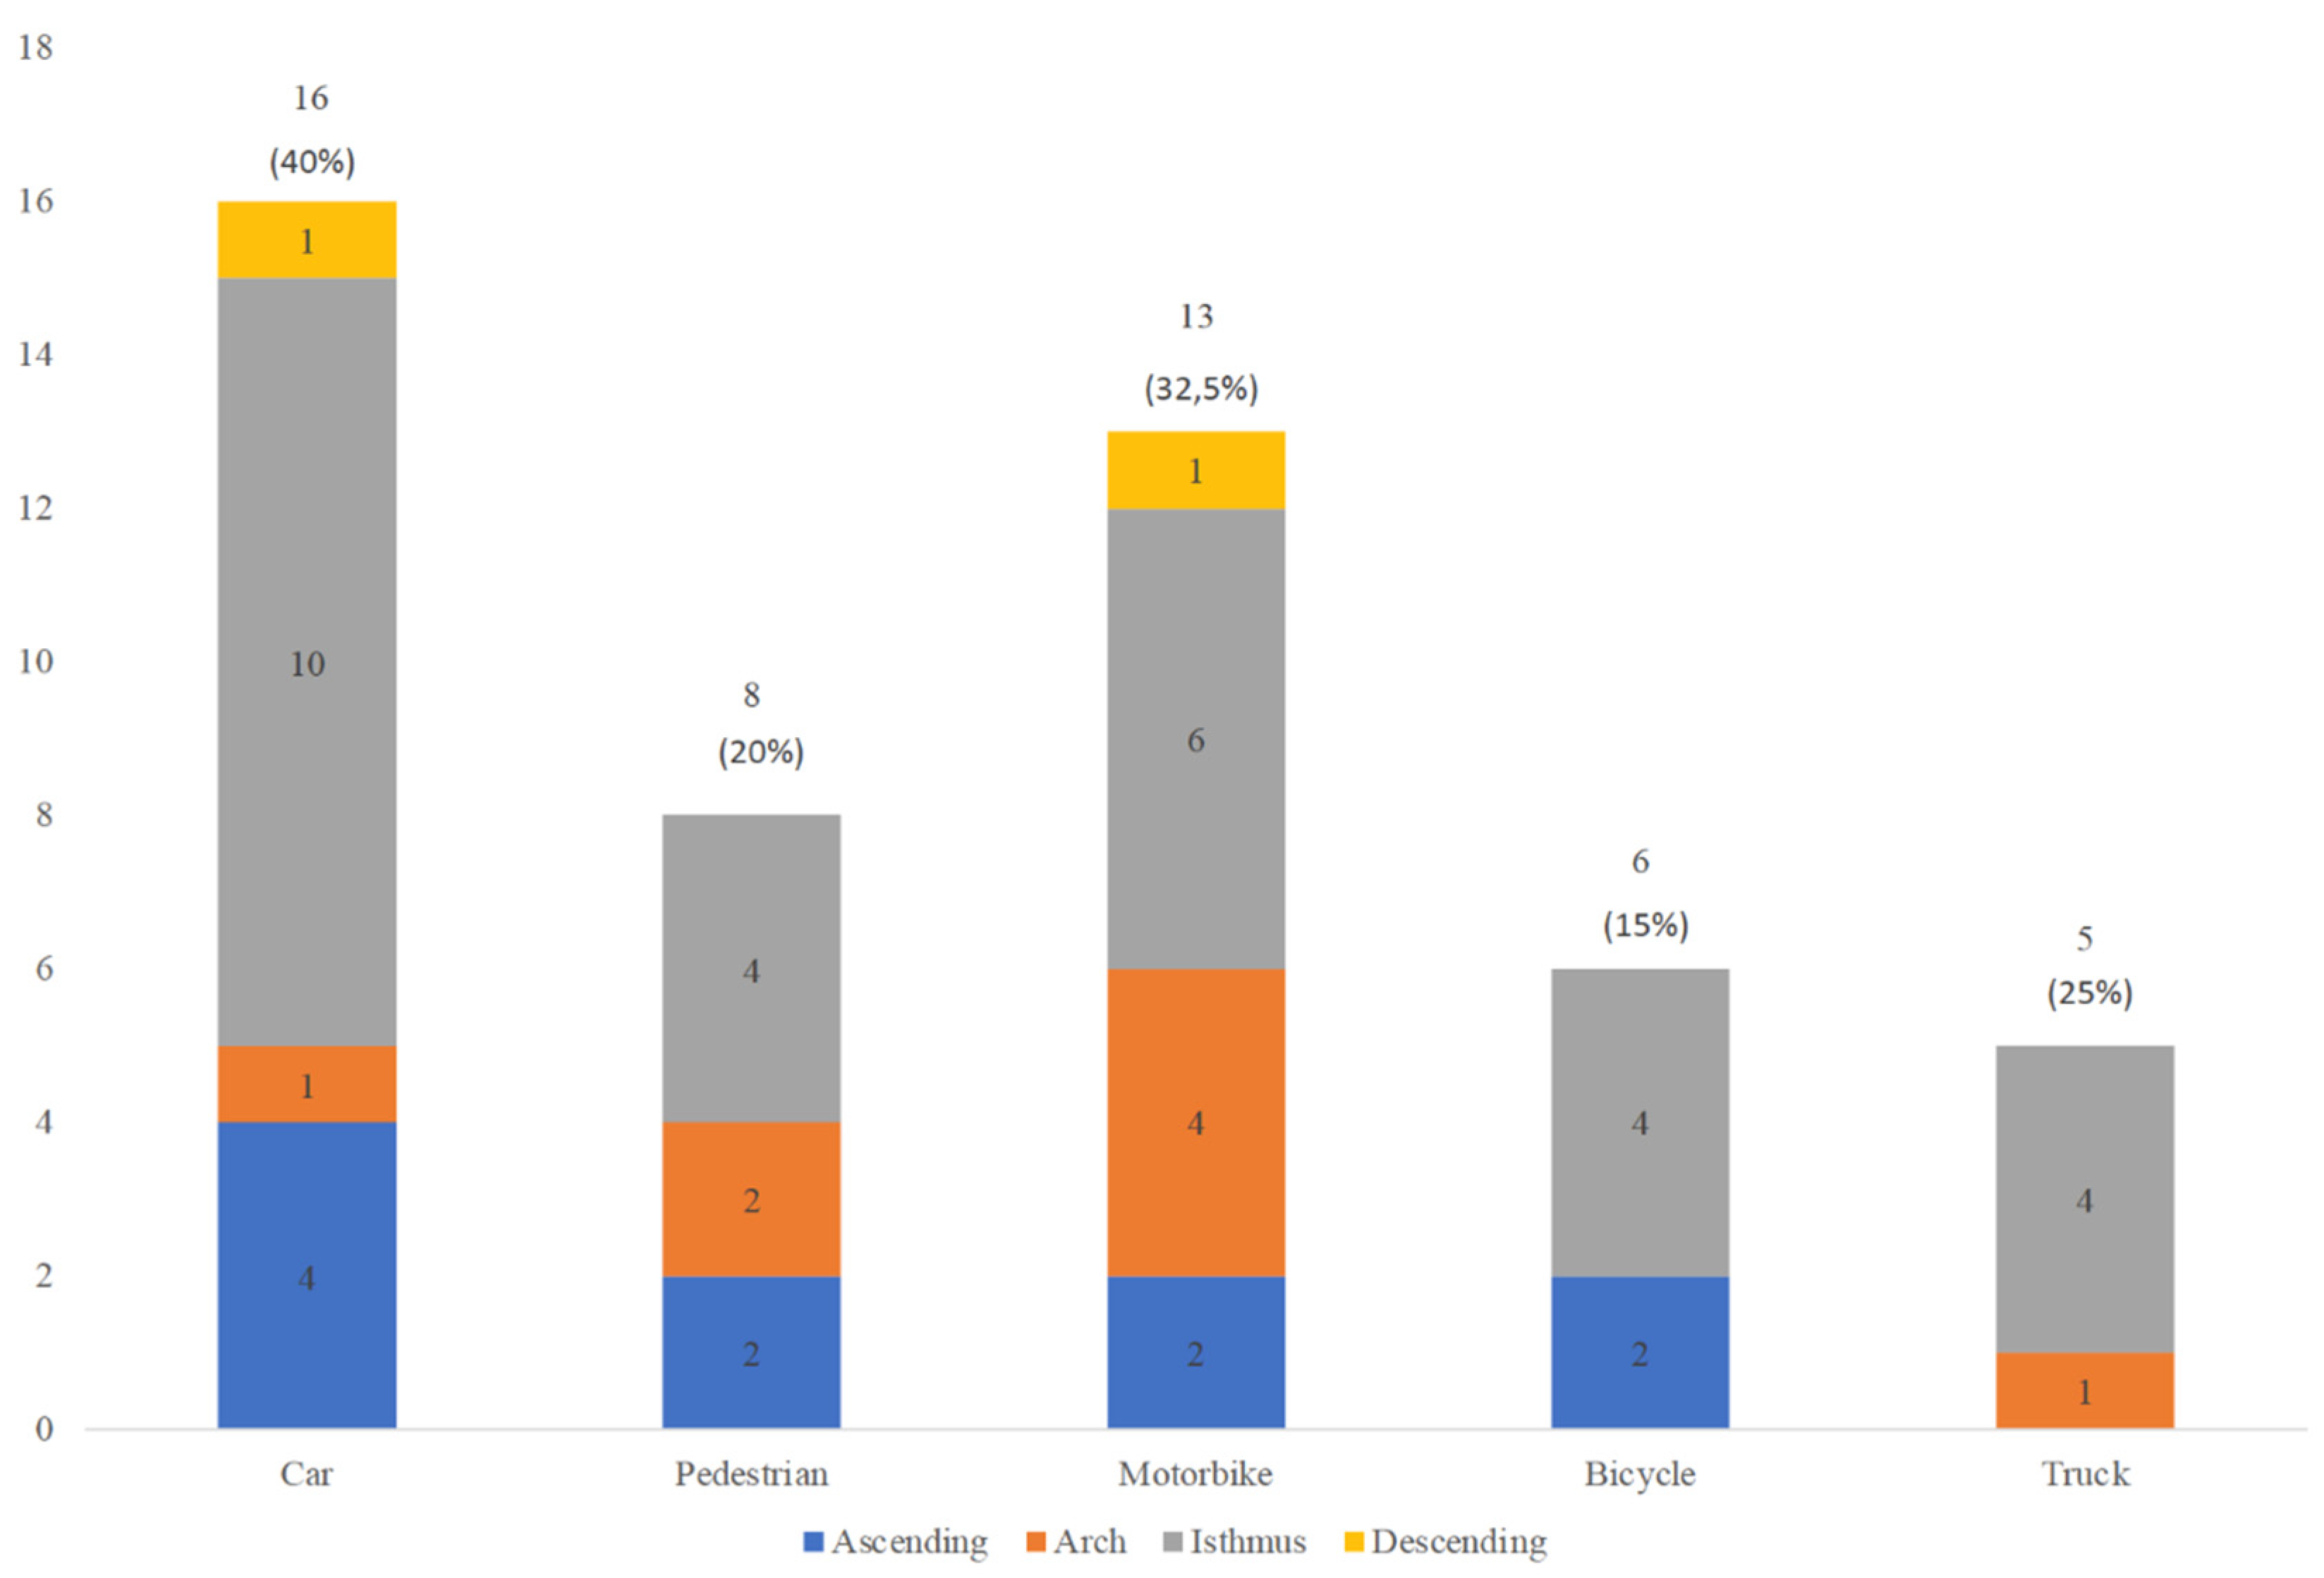
| Thoracic Aorta Laceration (n; %) | 16 (40) | 8 (20) | 14 (35) | 6 (15) | 5 (25) | |
| Inferior Vena Cava Laceration (n; %) | 1 (2.5) | 2 (5) | 2 (5) | 1 (2.5) | 1 (5) | |
| Diaphragm Laceration (n; %) | 5 (12.5) | 1 (2.5) | 2 (5) | 7 (17.5) | 5 (25) | |
| Abdomen | Abdominal Aorta Laceration (n; %) | 0 (0) | 1 (2.5) | 0 (0) | 1 (2.5) | 1 (5) |
| Liver Laceration (n; %) | 26 (65) | 12 (30) | 22 (55) | 15 (37.5) | 10 (50) | |
| Splenic Laceration (n; %) | 14 (35) | 7 (17.5) | 13 (32.5) | 8 (20) | 6 (30) | |
| Left Renal Artery Laceration (n; %) | 3 (7.5) | 2 (5) | 4 (10) | 4 (10) | 1 (5) | |
| Left Kidney Laceration (n; %) | 3 (7.5) | 1 (2.5) | 2 (5) | 3 (7.5) | 2 (10) | |
| Right Renal Artery Laceration (n; %) | 1 (2.5) | 4 (10) | 3 (7.5) | 3 (7.5) | 0 (0) | |
| Right Kidney Laceration (n; %) | 0 (0) | 3 (7.5) | 3 (7.5) | 3 (7.5) | 3 (15) | |
| Intestine Laceration (n; %) | 0 (0) | 1 (2.5) | 2 (5) | 1 (2.5) | 3 (15) | |
| Pelvis | Bladder Laceration (n; %) | 1 (2.5) | 2 (5) | 1 (2.5) | 2 (5) | 0 (0) |
| Pelvic fracture (n; %) | 17 (42.5) | 15 (37.5) | 7 (17.5) | 13 (32.5) | 10 (50) | |
| Limbs | Upper Limbs Fractures (n; %) | 16 (40) | 11 (28) | 15 (38) | 7 (18) | 8 (40) |
| Lower Limbs Fractures (n; %) | 17 (43) | 17 (43) | 13 (33) | 12 (30) | 9 (45) | |
Publisher’s Note: MDPI stays neutral with regard to jurisdictional claims in published maps and institutional affiliations. |
© 2021 by the authors. Licensee MDPI, Basel, Switzerland. This article is an open access article distributed under the terms and conditions of the Creative Commons Attribution (CC BY) license (https://creativecommons.org/licenses/by/4.0/).
Share and Cite
Tambuzzi, S.; Rittberg, W.; Cattaneo, C.; Collini, F. An Autopsy-Based Analysis of Fatal Road Traffic Collisions: How the Pattern of Injury Differs with the Type of Vehicle. Trauma Care 2021, 1, 162-172. https://0-doi-org.brum.beds.ac.uk/10.3390/traumacare1030014
Tambuzzi S, Rittberg W, Cattaneo C, Collini F. An Autopsy-Based Analysis of Fatal Road Traffic Collisions: How the Pattern of Injury Differs with the Type of Vehicle. Trauma Care. 2021; 1(3):162-172. https://0-doi-org.brum.beds.ac.uk/10.3390/traumacare1030014
Chicago/Turabian StyleTambuzzi, Stefano, Wendelin Rittberg, Cristina Cattaneo, and Federica Collini. 2021. "An Autopsy-Based Analysis of Fatal Road Traffic Collisions: How the Pattern of Injury Differs with the Type of Vehicle" Trauma Care 1, no. 3: 162-172. https://0-doi-org.brum.beds.ac.uk/10.3390/traumacare1030014