Article

Toll-Like Receptor Signalling Pathways Regulate Hypoxic Stress Induced Fibroblast Growth Factor but Not Vascular Endothelial Growth Factor-A in Human Microvascular Endothelial Cells

Academic Ophthalmology, School of Medicine, Queens Medical Centre, University of Nottingham, Eye & ENT Building, B Floor, Derby Road, Nottingham NG7 2UH, UK
*
Authors to whom correspondence should be addressed.
Int. J. Transl. Med. 2021, 1(1), 25-38; https://0-doi-org.brum.beds.ac.uk/10.3390/ijtm1010003
Submission received: 30 March 2021 / Revised: 11 May 2021 / Accepted: 12 May 2021 / Published: 27 May 2021
(This article belongs to the Special Issue Diabetic Retinopathy)

Abstract

:
Retinal diseases are the leading causes of irreversible blindness worldwide. The role of toll-like receptor (TLR) signalling mechanisms (MyD88 and TRIF) in the production of pro-angiogenic growth factors from human microvascular endothelial cells (HMEC-1) under hypoxic stress remains unexplored. HMEC-1 was incubated under normoxic (5% CO2 at 37 °C) and hypoxic (1% O2, 5% CO2, and 94% N2; at 37 °C) conditions for 2, 6, 24, and 48 h, respectively. For TLR pathway analysis, HMEC-1 was pre-treated with pharmacological inhibitors (Pepinh-MyD88 and Pepinh-TRIF) and subjected to normoxia and hypoxia conditions. Gene and protein expressions of vascular endothelial growth factor-A (VEGF-A), fibroblast growth factor (FGF-2), hypoxia inducible factor 1-alpha (HIF1-α) were performed using quantitative polymerase chain reaction (qPCR), ELISA, and Western blot methodologies. Levels of TLR3 and TLR4 were analysed by flow cytometry. Under hypoxia, levels of VEGF-A and FGF-2 were elevated in a time-dependent fashion. Inhibition of MyD88 and TRIF signalling pathways decreased FGF-2 levels but failed to modulate the secretion of VEGF-A from HMEC-1. Blocking a known regulator, endothelin receptor (ETR), also had no effect on VEGF-A secretion from HMEC-1. Overall, this study provides the proof-of-concept to target TLR signalling pathways for the management of blinding retinal diseases.

1. Introduction

Vision is paramount for healthy ageing, and its impairment or loss is considered a major disability. Retinal diseases such as age-related macular degeneration (AMD) and diabetic retinopathy (DR), including diabetic macular oedema (DMO), are the leading causes of irreversible blindness worldwide [1]. AMD is a progressive neurodegenerative disease of the retina, which is clinically sub-divided into two forms: dry (geographic atrophy—GA) and wet (neovascular—nAMD). It is highly prevalent in individuals above 60 years of age and accounts for approximately 8.7% of all blindness [2]. DR, with DMO or proliferative DR (PDR), is highly prevalent in the working-age population and commonly affects individuals that are suffering from long-standing diabetes mellitus [1]. DMO, PDR, and nAMD are characterised by increased vascular permeability resulting in macular oedema and/or neovascularisation, with haemorrhage in retinal and vitreous space, fibrotic scarring, and traction retinal detachment. Inflammation and hypoxia/ischaemia are the two main pathophysiological determinants of retinal and choroidal vascular abnormalities that are associated with these diseases [1].
Hypoxia is a condition in which oxygen tension is adequately deficient at tissue level, this then upregulates cellular expression of hypoxia-inducible factor-1α (HIF1-α) [3]. HIF1-α regulates the synthesis and release of angiogenic factors such as fibroblast growth factor (FGF-2) and VEGF-A [4]. Hypoxia-activated endothelin-1/endothelin receptor signalling has been implicated in VEGF-A production from macrovascular endothelial cells and melanoma cells [5]. Moreover, increased plasma levels of endothelin-1 have been associated with the risk of nAMD [6]. Thus far, the underlying mechanisms of pathophysiology of hypoxia-mediated microvascular angiogenesis/proliferation and resultant fibrotic scarring remain elusive.
Toll-like receptors (TLRs) are a distinct family of transmembrane pattern-recognition receptors that are expressed on a variety of ocular tissues and cells and have been associated with a number of vascular and inflammatory diseases [7,8,9]. TLR3 has been shown to be present on RPE, retinal and choroidal endothelial cells [7,10]. Ligand activation of TLR3 in RPE cells increases Toll/interleukin-1 receptor (TIR) domain-containing adaptor protein-inducing interferon-β (TRIF) dependent secretion of VEGF and reduction in RPE viability [11]. Mouse models deficient in TLR3 showed augmented laser-induced neovascularization [12,13], while loss-of-function polymorphism of TLR3 gene in humans has been reported to be protective against dry AMD [14,15]. Thus far, the role of TLR3 on vascular endothelial cells during hypoxic stress remains unexplored. TLR4 mediates its downstream signalling through both myeloid differentiation factor 88 (MyD88), as well as TRIF-dependent signalling pathways [16]. Our laboratory was first to demonstrate the expression of TLR4 on primary retinal and choroidal vascular endothelial cells [7]. Previous studies have implicated the role of TLR4 in retinal damage caused by ischaemia and PDR [17,18]. In addition, TLR4 was shown to participate in phagocytosis of photoreceptor outer segments by the RPE [19,20]. These findings suggest that TLR4 on RPE and photoreceptors cells has a crucial role in retinal ischaemic injury. However, the role of TLR4 on microvascular endothelium during ischaemic injury is still not clearly understood.
In this study, we aimed to establish the role of MyD88 and TRIF signalling pathways on production of VEGF-A and FGF-2 from the human microvascular endothelial cells, as a model for retinal microvascular endothelium, during normoxia and hypoxia. We have also validated the role of ETR in regulation of VEGF-A in HMEC-1 during hypoxia. As there may be significant exposure of donor eyes to post-mortem hypoxia preceding isolation of human retinal and choroidal endothelial cells (hREC and hCEC), and in order to allow for such potential variability in hypoxia exposure in the primary isolated hCEC, human microvascular EC lines (HMEC-1) were used for a significant part of this study after establishing their TLR expression as similar to that of hREC and hCEC. This study extends our previous reports on the signalling mechanisms in microvascular angiogenesis, and their relevance in intraocular, particularly retinal and choroidal ischaemia and neovascularisation. Here, we demonstrated that hypoxia-activated signalling pathways in HMEC-1 are regulated through TLRs.

2. Materials and Methods

The research was complied with the institutional regulations of good laboratory practice (GLP) and Health and Safety guidelines of the University of Nottingham. Aseptic conditions were followed in all experiments, which were performed within the laminar flow air hood (Envair, Rossendale, UK).

2.1. Cell Culture

Simian virus (SV-40) immortalised human microvascular endothelial cell line (HMEC-1) was commercially obtained (ATCC-LGC Standards, Teddington, Middlesex, UK). In this study, cellular passages 7 to 15 were utilised. HMEC-1 was cultured in the growth media recommended by ATCC (MCDB131 basal medium (ThermoFisher Scientific, Waltham, MA, USA) supplemented with 10% fetal bovine serum (FBS), 10 mM L-glutamine, 10 ng/mL epidermal growth factor (EGF), 1 µg/mL Hydrocortisone and antibiotic-antimitotic mixture (gentamicin and amphotericin B; Sigma-Aldrich, Gillingham, UK).

2.2. Normoxia and Hypoxia Treatment

HMEC-1 was seeded on appropriate culture plates and incubated at 37 °C, 5% CO2 (Sanyo Electric Co Ltd., Osaka, Japan) until 80% confluency. Before treatment, HMEC-1 was starved overnight in MCDB131 basal medium without growth factors. For hypoxic treatment, cells were exposed to 1% O2, 5% CO2, and 94% N2 within a tightly sealed hypoxia chamber InvivO2 400 (I&L Biosystems UK Ltd., Chertsey, Surrey, UK) for different durations (2, 6, 24 and 48 h, respectively). HMEC-1 incubated at normoxic conditions (37 °C and 5% CO2) was used as normoxia controls.

2.3. Inhibition of Key Signal Transduction Pathways

To assess the role of key signalling pathways in regulation of VEGF-A and FGF-2, we have used following pharmacological inhibitors: Pepinh-MyD88 (5, 10, 20 and 40 μM), Pepinh-TRIF (5, 10, 20 and 30 μM) and Pepinh-Control (20, 30 and 40 μM) (Invivogen, San Diego, CA, USA). In addition, a protein synthesis inhibitor, Cycloheximide (25 μg/mL, 50 μg/mL, 100 μg/mL) (Cell Signalling, London, UK) and an endothelin receptor agonist, BQ-123 (1 μM, 5 μM, 10μM) (Bio-Techne Ltd., Abingdon, UK), were also used to assess their effect on VEGF and FGF-2 secretion from HMEC-1.

2.4. Cell Viability Assay

HMEC-1 viability was determined using cell counting kit-8 (CCK-8) (Sigma-Aldrich, Gillingham, UK). Then, 1.5 × 10⁴ cells were seeded into each well of four individual 96-well plates and incubated at 37 °C, 5% CO2. Following overnight starvation, plates were incubated under normoxic and hypoxic conditions for different durations. At the end of each incubation, 10 μL CCK-8 was applied into each well and further incubated for 2 h. Viable cells converted the WST-8 dye into formazan, which was measured at optical density 450 nm using the CLARIOstar Microplate-reader (BMG LABTECH, Ortenberg, Germany).

2.5. Total RNA Isolation

Total RNA was extracted according to manufacturer’s protocol (RNeasy mini kit; Qiagen, Manchester, UK). Following treatment, HMEC-1 was lysed with 650 μL RLT lysis buffer (Qiagen, Manchester, UK) and homogenised using QIAshredder column. The lysate was then mixed with equal volume of 70% ethanol. The mixture was applied into new nucleic acid binding-column and centrifuged at 10,000× g for 15 s. The filtrate was discarded, and spin columns were washed with buffers RW1 and RPE (Qiagen, Manchester, UK), respectively, by centrifugation. Total RNA was eluted in RNase-free water and quantified using CLARIOstar Microplate-reader (BMG LABTECH, Ortenberg, Germany).

2.6. Reverse Transcription into Complementary DNA (cDNA)

Using a commercial kit (Quantitect Reverse Transcription kit; Qiagen, Manchester, UK), total RNA (1 μg) was reverse transcribed into cDNA. Total RNA was mixed with genomic DNA wipeout buffer (Qiagen, Manchester, UK) and incubated at 42 °C for 2 min. The mix was placed on ice, and then buffered reverse transcriptase (Quantitect Reverse Transcriptase, RT Buffer, and RT Primer mix; Qiagen, Manchester, UK) was added. The final mix was incubated for 30 min at 42 °C for cDNA synthesis. This was followed by a reverse transcriptase deactivation step for 3 min at 95 °C. cDNA samples were then stored at −20 °C until further analysis.

2.7. Quantitative Polymerase Chain Reaction (qPCR)

QPCR analysis of the desired gene of interest was performed using inventoried TaqMan probe chemistry (Table 1) (ThermoFisher Scientific, Waltham, MA, USA) as previously described [21]. The qPCR reactions were run in an 8-strip optical tubes (Starlab (UK) Ltd., Milton Keynes, UK) using Taqman gene expression mastermix in the Mx3005p real-time PCR instrument (Agilent Technologies, Cheshire, UK) as detailed in the manufacturers protocol (ThermoFisher Scientific, Waltham, MA, USA). Briefly, template cDNA was diluted 1 in 5 with nuclease-free water to perform qPCR in duplicate. Each reaction was prepared to 20 μL final reaction volume containing 15 μL of PCR reaction mix and 5 μL of diluted cDNA template. Each 8-strip tube was run with a Taqman probe/primer mix for the gene of interest and endogenous controls (Table 1). Appropriate negative non-template controls were also run. Samples were loaded and run under appropriately set experimental settings and PCR thermal cycling conditions recommended by the manufacturer. Data were acquired on the MxPro Software (version 4.01, Stratagene, Cambridge, UK) and transferred to a Microsoft Excel spreadsheet for analysis using the delta-delta CT comparative quantitation method.

2.8. Flow Cytometry

Flow cytometry was performed to analyse the intracellular and extracellular expression of TLR3 and TLR4 in response to normoxia and hypoxia. Following treatment, HMEC-1 was collected using 1× TrypLE buffer (Life Technologies Ltd., Paisley, UK) by centrifugation. For intracellular antigens, HMEC-1 was fixed in Cytofix/Cytoperm solution (BD Biosciences, Wokingham, UK) for 30 min at 4 °C, permeabilised with Perm Wash (BD Biosciences, Wokingham, UK) and blocked with 10% heat inactivated normal human serum (HINHS) for 30 min at 4 °C. For extracellular antigens, HMEC-1 was suspended in FACS Buffer, centrifuged, and blocked with 10% HINHS for 30 min at 4 °C. Staining was performed using PE-conjugated monoclonal anti-human antibodies: TLR3 (CD283; clone TLR3.7; RRID:AB_466235), TLR4 (CD284; clone HTA125; RRID:AB_2537727), and TLR9 (CD289; clone eB72-1665; RRID:AB_466238) (eBioscience, Hatfield, UK) in dark for 1 h at 4 °C. Unstained samples and samples stained with isotype-specific controls (Mouse IgG1 κ Isotype Control, and Mouse IgG2a κ Isotype Control; eBioscience, Hatfield, UK) served as negative controls. Immediately following staining, cells were fixed in 500 μL of 2% paraformaldehyde (PFA) for 15 min at 4 °C, washed in FACS buffer and re-suspended in 1x PBS for data acquisition on BD-LSRII Flow Cytometer. The data collected using FACS Diva software (Ver 6.0) and analysed using Kaluza data analysis software (Ver 2.0).

2.9. ELISA

The concentrations of VEGF-A and FGF-2 protein in the conditioned culture media was determined using ELISA as previously described [22]. Human VEGF-A and FGF2 DuoSet ELISA kits were supplied by R&D Systems (Minneapolis, MN, USA). ELISA plates were coated overnight with the working concentrations of capture antibody (VEGF-A: 1 μg/mL or FGF-2: 2 μg/mL) at room temperature. Plates were washed six times with Wash Buffer, blocked with Reagent Diluent (1% BSA in 1× PBS) and incubated for 1 h at room temperature. Washing steps were repeated and culture media was centrifuged at 1000 g for 5 min. Recombinant standards (at different concentrations) and samples (1 in 2 diluted) were incubated for 2 h at room temperature. ELISA plates washed and incubated with working concentrations of detection antibody (Biotin conjugated anti-human VEGF-A: 100 ng/mL) or (Biotic conjugated anti-human FGF2: 250 ng/mL) for 2 h at room temperature. After washing step, 100 μL of working dilution of streptavidin-HRP (40-fold dilution) was added to each well and incubated for 20 min in the dark. The plates were washed, and 100 μL of substrate solution (1:1 mixture of Colour Reagent A and B) was added to each well and incubated at room temperature for 20 min in the dark. The colour development was stopped using 50 μL of stop solution, and optical density was determined using CLARIOstar Microplate-reader (BMG LABTECH, Ortenberg, Germany) at 450 nm and corrected with 540 nm. The data were analysed by 4-parameter linear regression method.

2.10. Protein Estimation for Immunoblotting

Total protein was extracted from treated HMEC-1 using Urea lysis buffer containing 5% V/V glycerol, 10 mM Tris (pH 6.8), 0.05% W/V sodium dodecylsulfate (SDS) and 1 mM β-mercaptoethanol. The lysate was collected by centrifugation at 1000 g for 5 min at 4 °C. Protein concentrations were then determined with BCA Protein Assay Kit (Pierce; ThermoFisher Scientific, Waltham, MA, USA) according to manufacturer’s instructions at 562 nm optical density using CLARIOstar Microplate-reader (BMG LABTECH, Ortenberg, Germany).

2.11. Western Blot

Western blotting was performed as previously described [23]. Protein extracts were mixed with 4× SDS sample buffer and incubated for 3 min at 95 °C. Protein samples (100 μg) were separated using precast 4–12% NuPAGE gel and blotted onto a PVDF membrane. The membranes were then blocked with 5% W/V non-fat dry milk in 1× TBST (0.05 M tris-buffered saline (TBS) (pH 8.0) with 0.05% V/V Tween-20) and incubated with primary antibodies overnight at 4 °C: Rabbit anti-human β-Actin polyclonal antibody (pAb). (1:1000; Cat#4967; RRID:AB_330288; Cell Signalling, London, UK), Mouse anti-human HIF-1a monoclonal antibody (1:500; Clone 241809; Cat#MAB1536 RRID:AB_2116983; R&D Systems, Minneapolis, MN, USA) and Rabbit anti-human HIF-1α pAb (1:1000; Cat#NB100-479; RRID:AB_10000633; Novus Biologicals, Littleton, CO, USA). Membranes were washed and incubated with secondary antibodies at room temperature for 1 h (Anti-Rabbit IgG AP-Linked Ab. (1:1000; Cat#7054; RRID:AB_2099235; Cell Signalling, London, UK) and Anti-Mouse IgG AP-Linked Ab (1:1000; Cat#7056; RRID:AB_330921; Cell Signalling, London, UK). The stained membranes were then incubated with 6 mL of BCIP/NBT Purple Liquid Substrate (Sigma-Aldrich, Gillingham, UK) for 5 to 10 min in the dark. Developed membranes were briefly washed with dH2O and digitally scanned.

2.12. Data Analysis

Data were expressed as mean ± standard deviation (SD) of three biological replicates from each of two independent experiments. Statistical analysis of data was achieved using statistical software, GraphPad Prism version 7.0 (GraphPad Software Inc., San Diego, CA, USA). Alpha was set at p = 0.05, and different groups were analysed using two-way ANOVA.

3. Results

3.1. Effect of Hypoxia on HMEC-1 Viability

As a first step, we assessed the effect of hypoxia on viability of HMEC-1 for different durations (24 and 48 h). As shown in Figure 1, no significant decrease in HMEC-1 viability was detected at 24 h under hypoxia. However, a 54% reduction in cell viability (p ≤ 0.0001) was observed following 48 h of hypoxic stress compared to cells incubated in normoxic conditions.

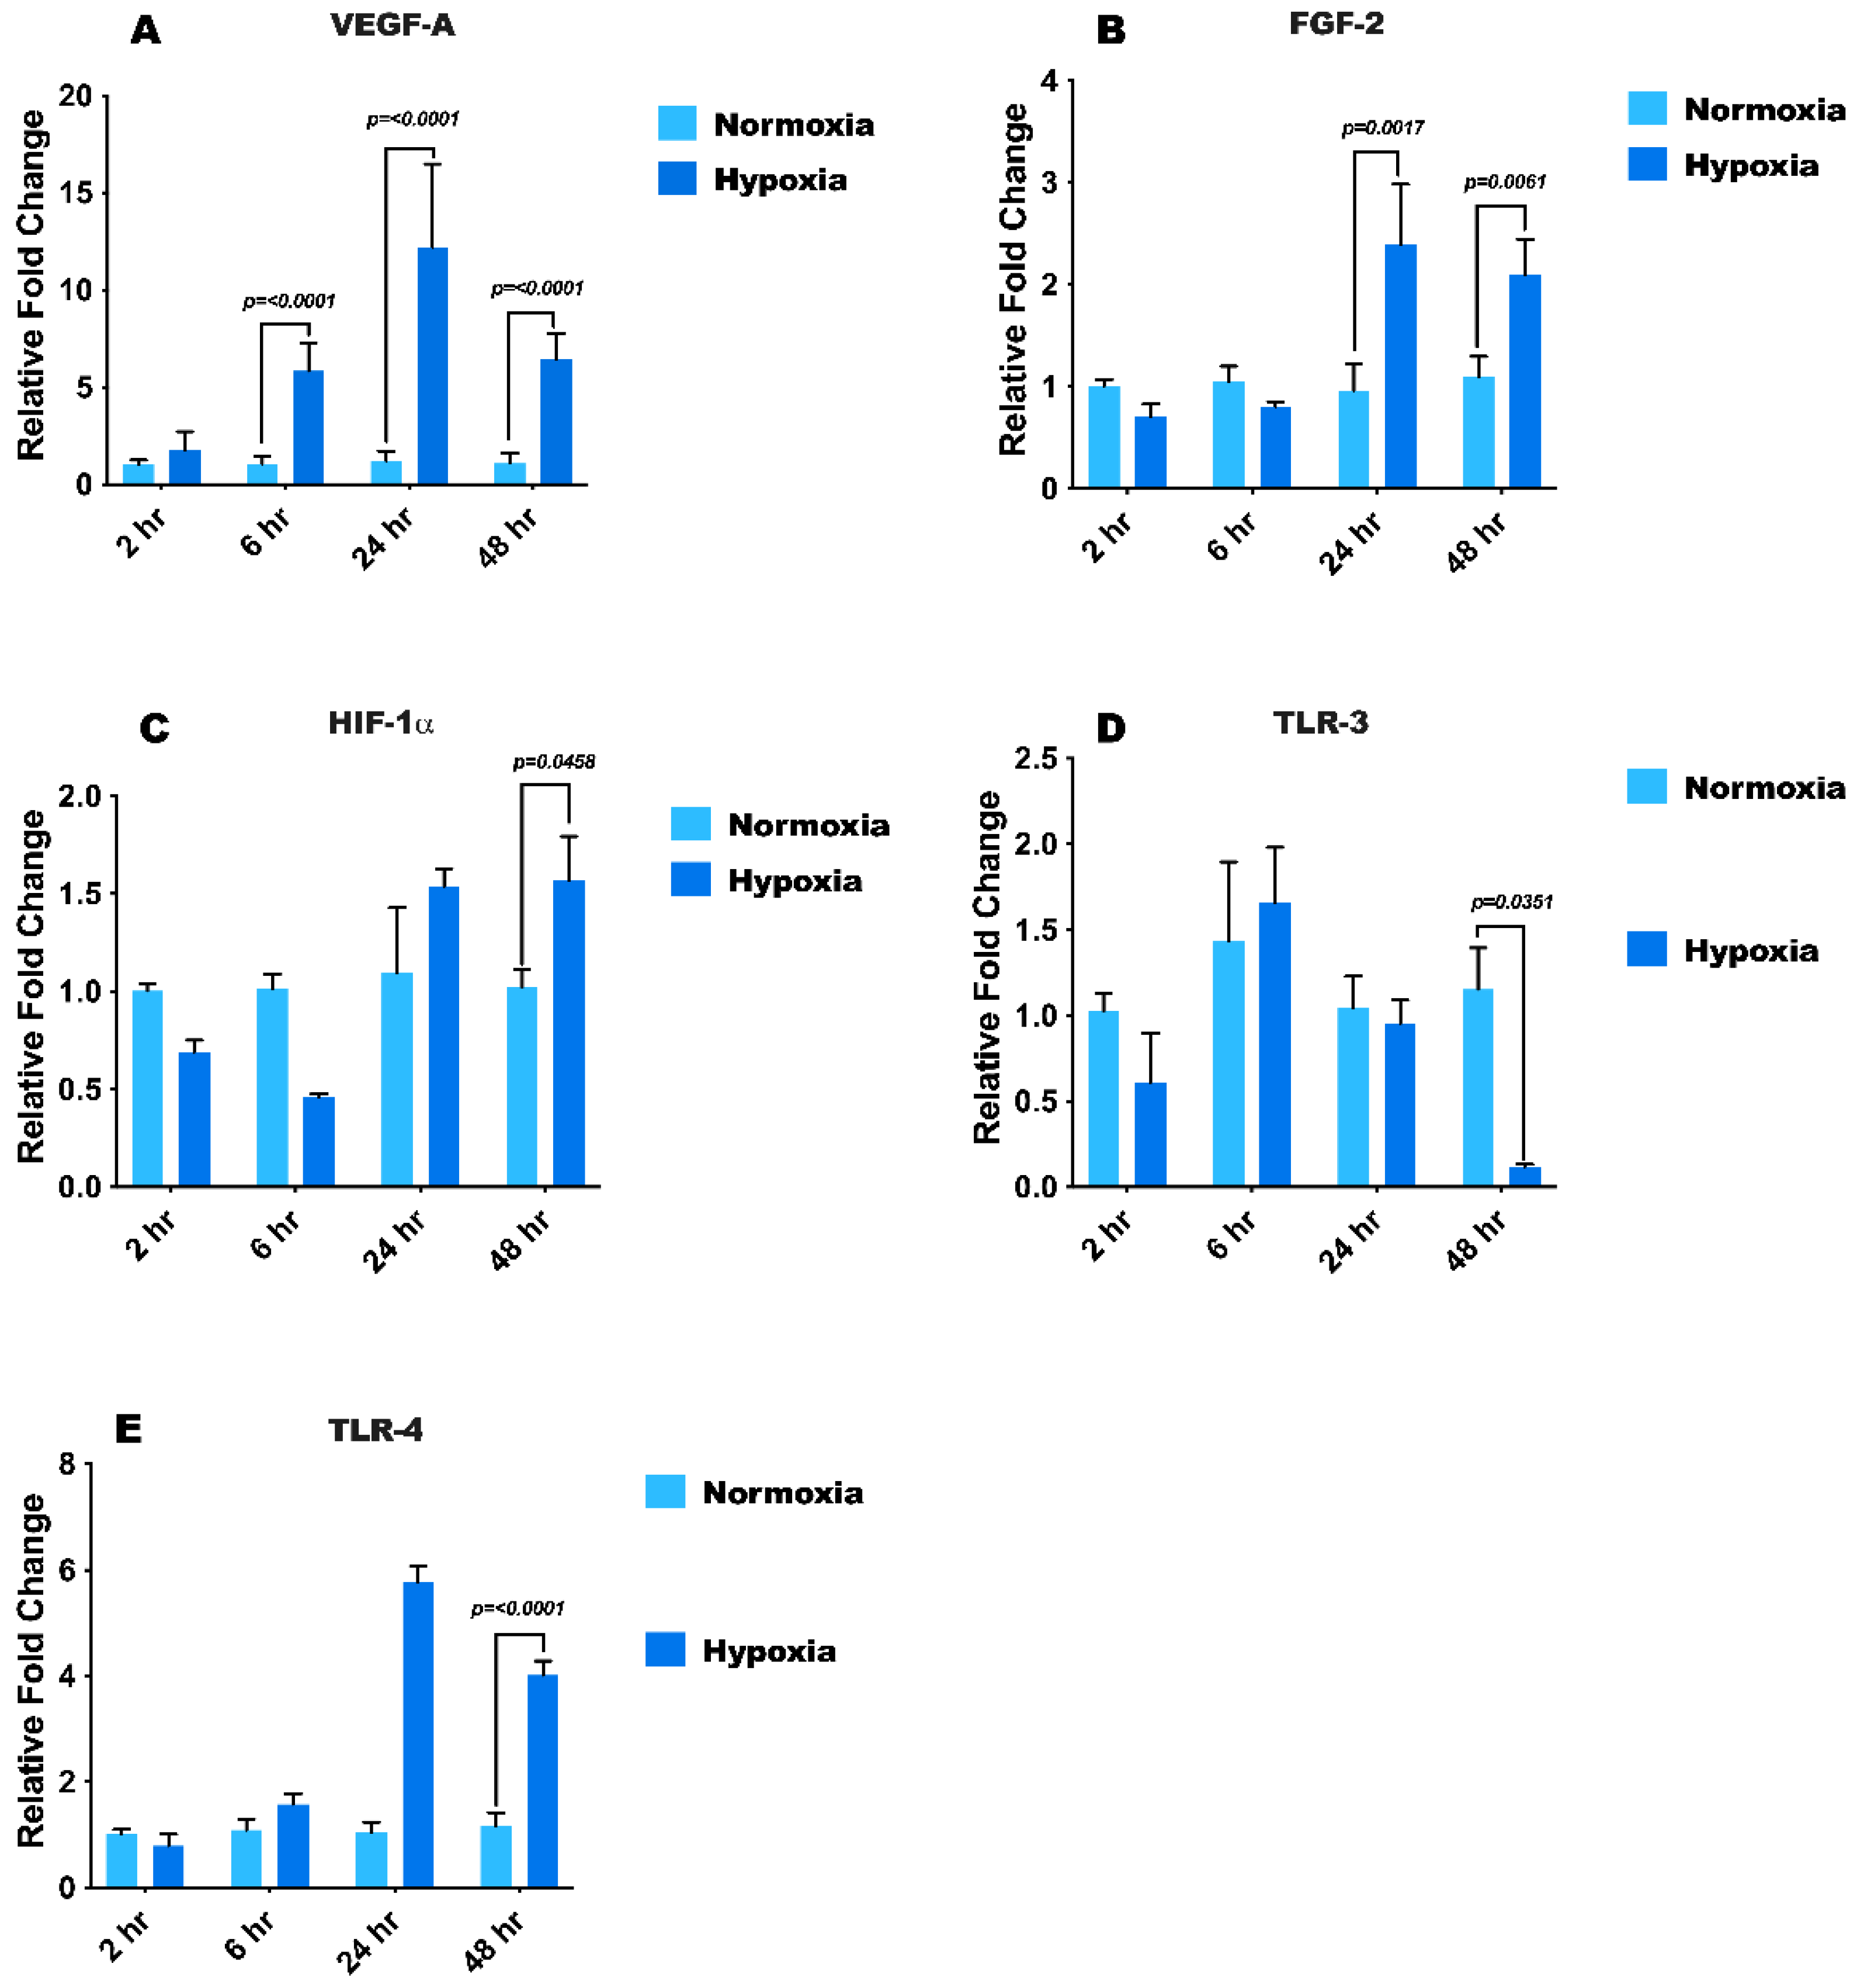
3.2. Hypoxia Treatment Modulates mRNA Expression of Growth Factors, HIF1-α, and Toll-Like Receptors

We aimed to assess the longitudinal effect of hypoxic stress on mRNA expression of VEGF-A, FGF2, HIF1-α, TLR3 and TLR4 in HMEC-1. Under hypoxia (Figure 2A), VEGF-A mRNA was elevated to 5.8 ± 1.45 folds at 6 h (p ≤ 0.0001) and 12.2 ± 4.27 folds at 24 h (p ≤ 0.0001). At 48 h, VEGF-A mRNA was moderately declined (6.4 ± 1.3 folds; p ≤ 0.0001) but remained at high levels similar to that at the 6 h time-point. FGF-2 (Figure 2B), on the other hand, was elevated up to 2.4 ± 1-fold at 24 h (p = 0.0017) and remained unchanged until 48 h (p = 0.0061) of hypoxia. HIF1-α (Figure 2C) showed reduced expression until 6-h hypoxic stress compared to normoxia. However, after 24 h of hypoxic stress, HIF1-α mRNA was modestly elevated with significant increase noted at 48 h (1.60 ± 0.15 folds; p = 0.0458). As shown in Figure 2D, TLR3 mRNA levels did not change significantly under hypoxia until 24 h. Notably, at 48 h, TLR3 mRNA was reduced by more than 90% (p = 0.0351) in hypoxic samples. In stark contrast, TLR4 mRNA (Figure 2E) was increased at 24 h (5.8 ± 0.53 folds) and sustained until 48 h of hypoxic stress (4.0 ± 0.73 folds, p ≤ 0.001).

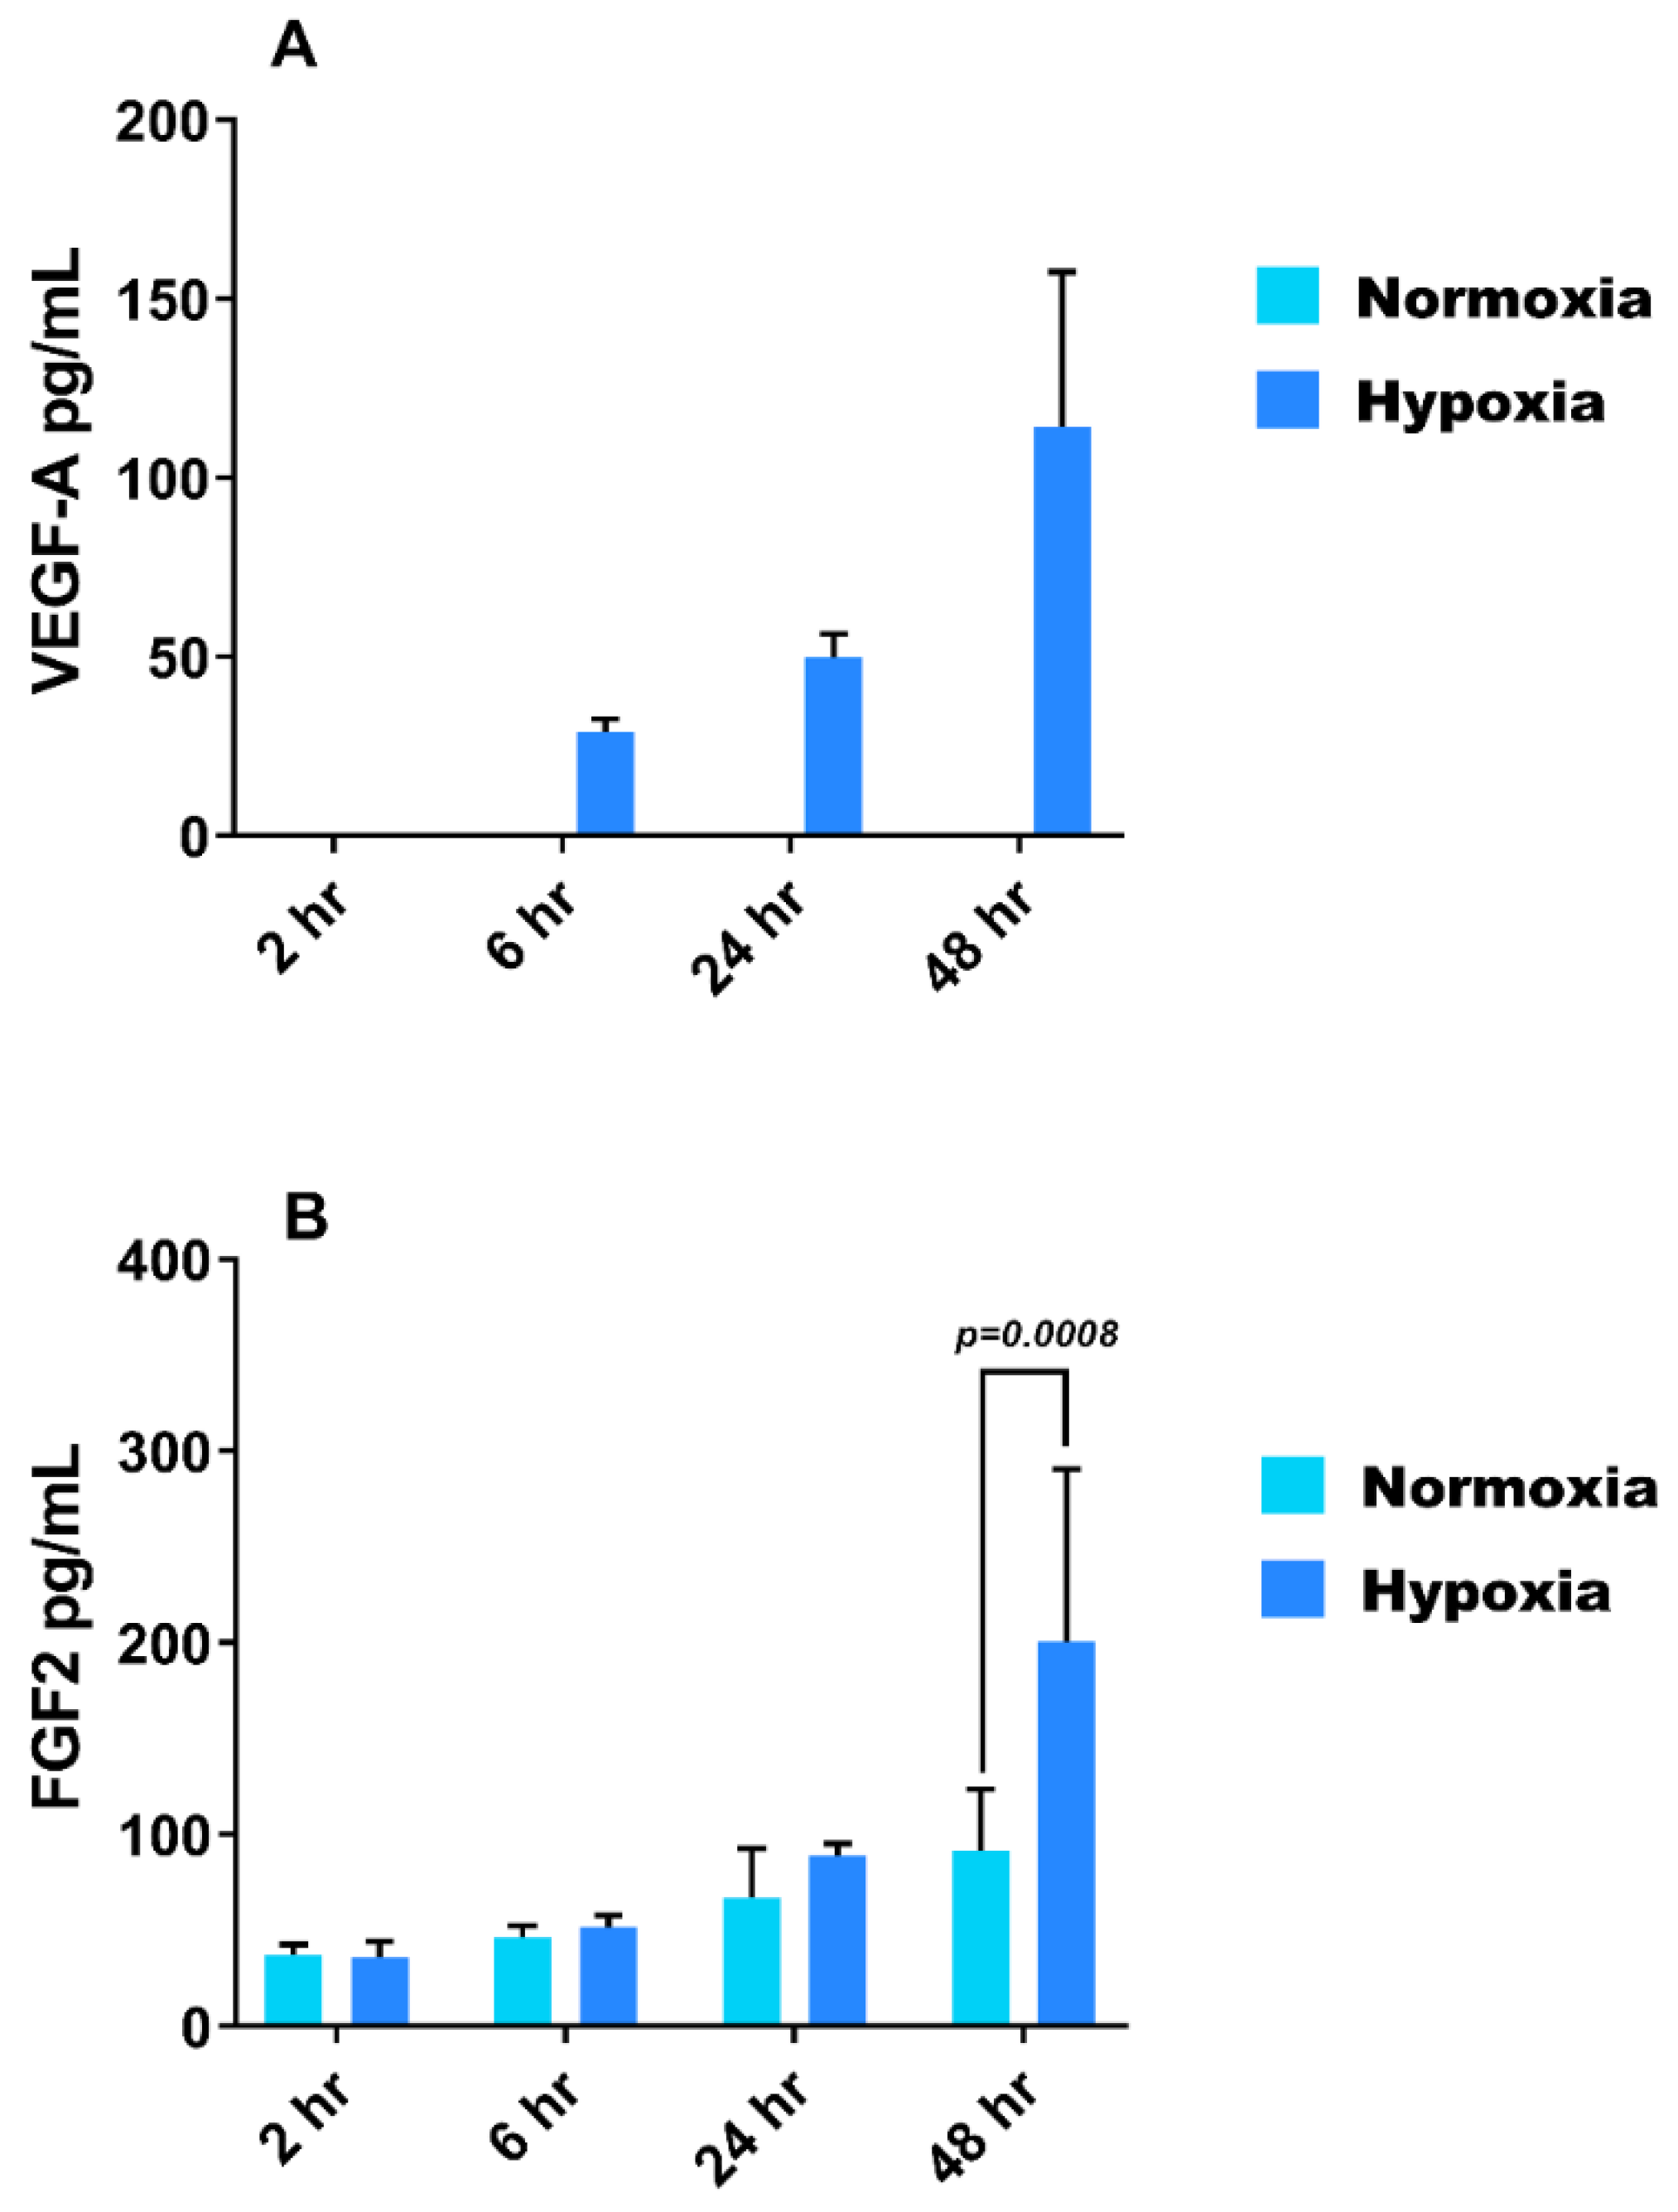
3.3. Effect of Hypoxia on VEGF-A and FGF-2 Secretion from HMEC-1

Next, we quantitated the secretion of VEGF-A and FGF-2 protein from HMEC-1 under hypoxia for different durations. As shown in Figure 3A, VEGF-A protein was not secreted in normoxic conditions. Under hypoxia, a time-dependent increased secretion of VEGF-A starting 6 h was noted. After 48 h of hypoxia challenge, VEGF-A protein was increased and found to be 114 ± 43.25 pg/mL. Correspondingly, FGF-2 was released at normal levels in supernatants of HMEC-1 under normoxic conditions (Figure 3B). Until 24 h of hypoxia, FGF-2 was secreted at basal levels. Notably, at 48 h duration, the levels increased significantly to 200 ± 89.86 pg/mL; p = 0.0008.

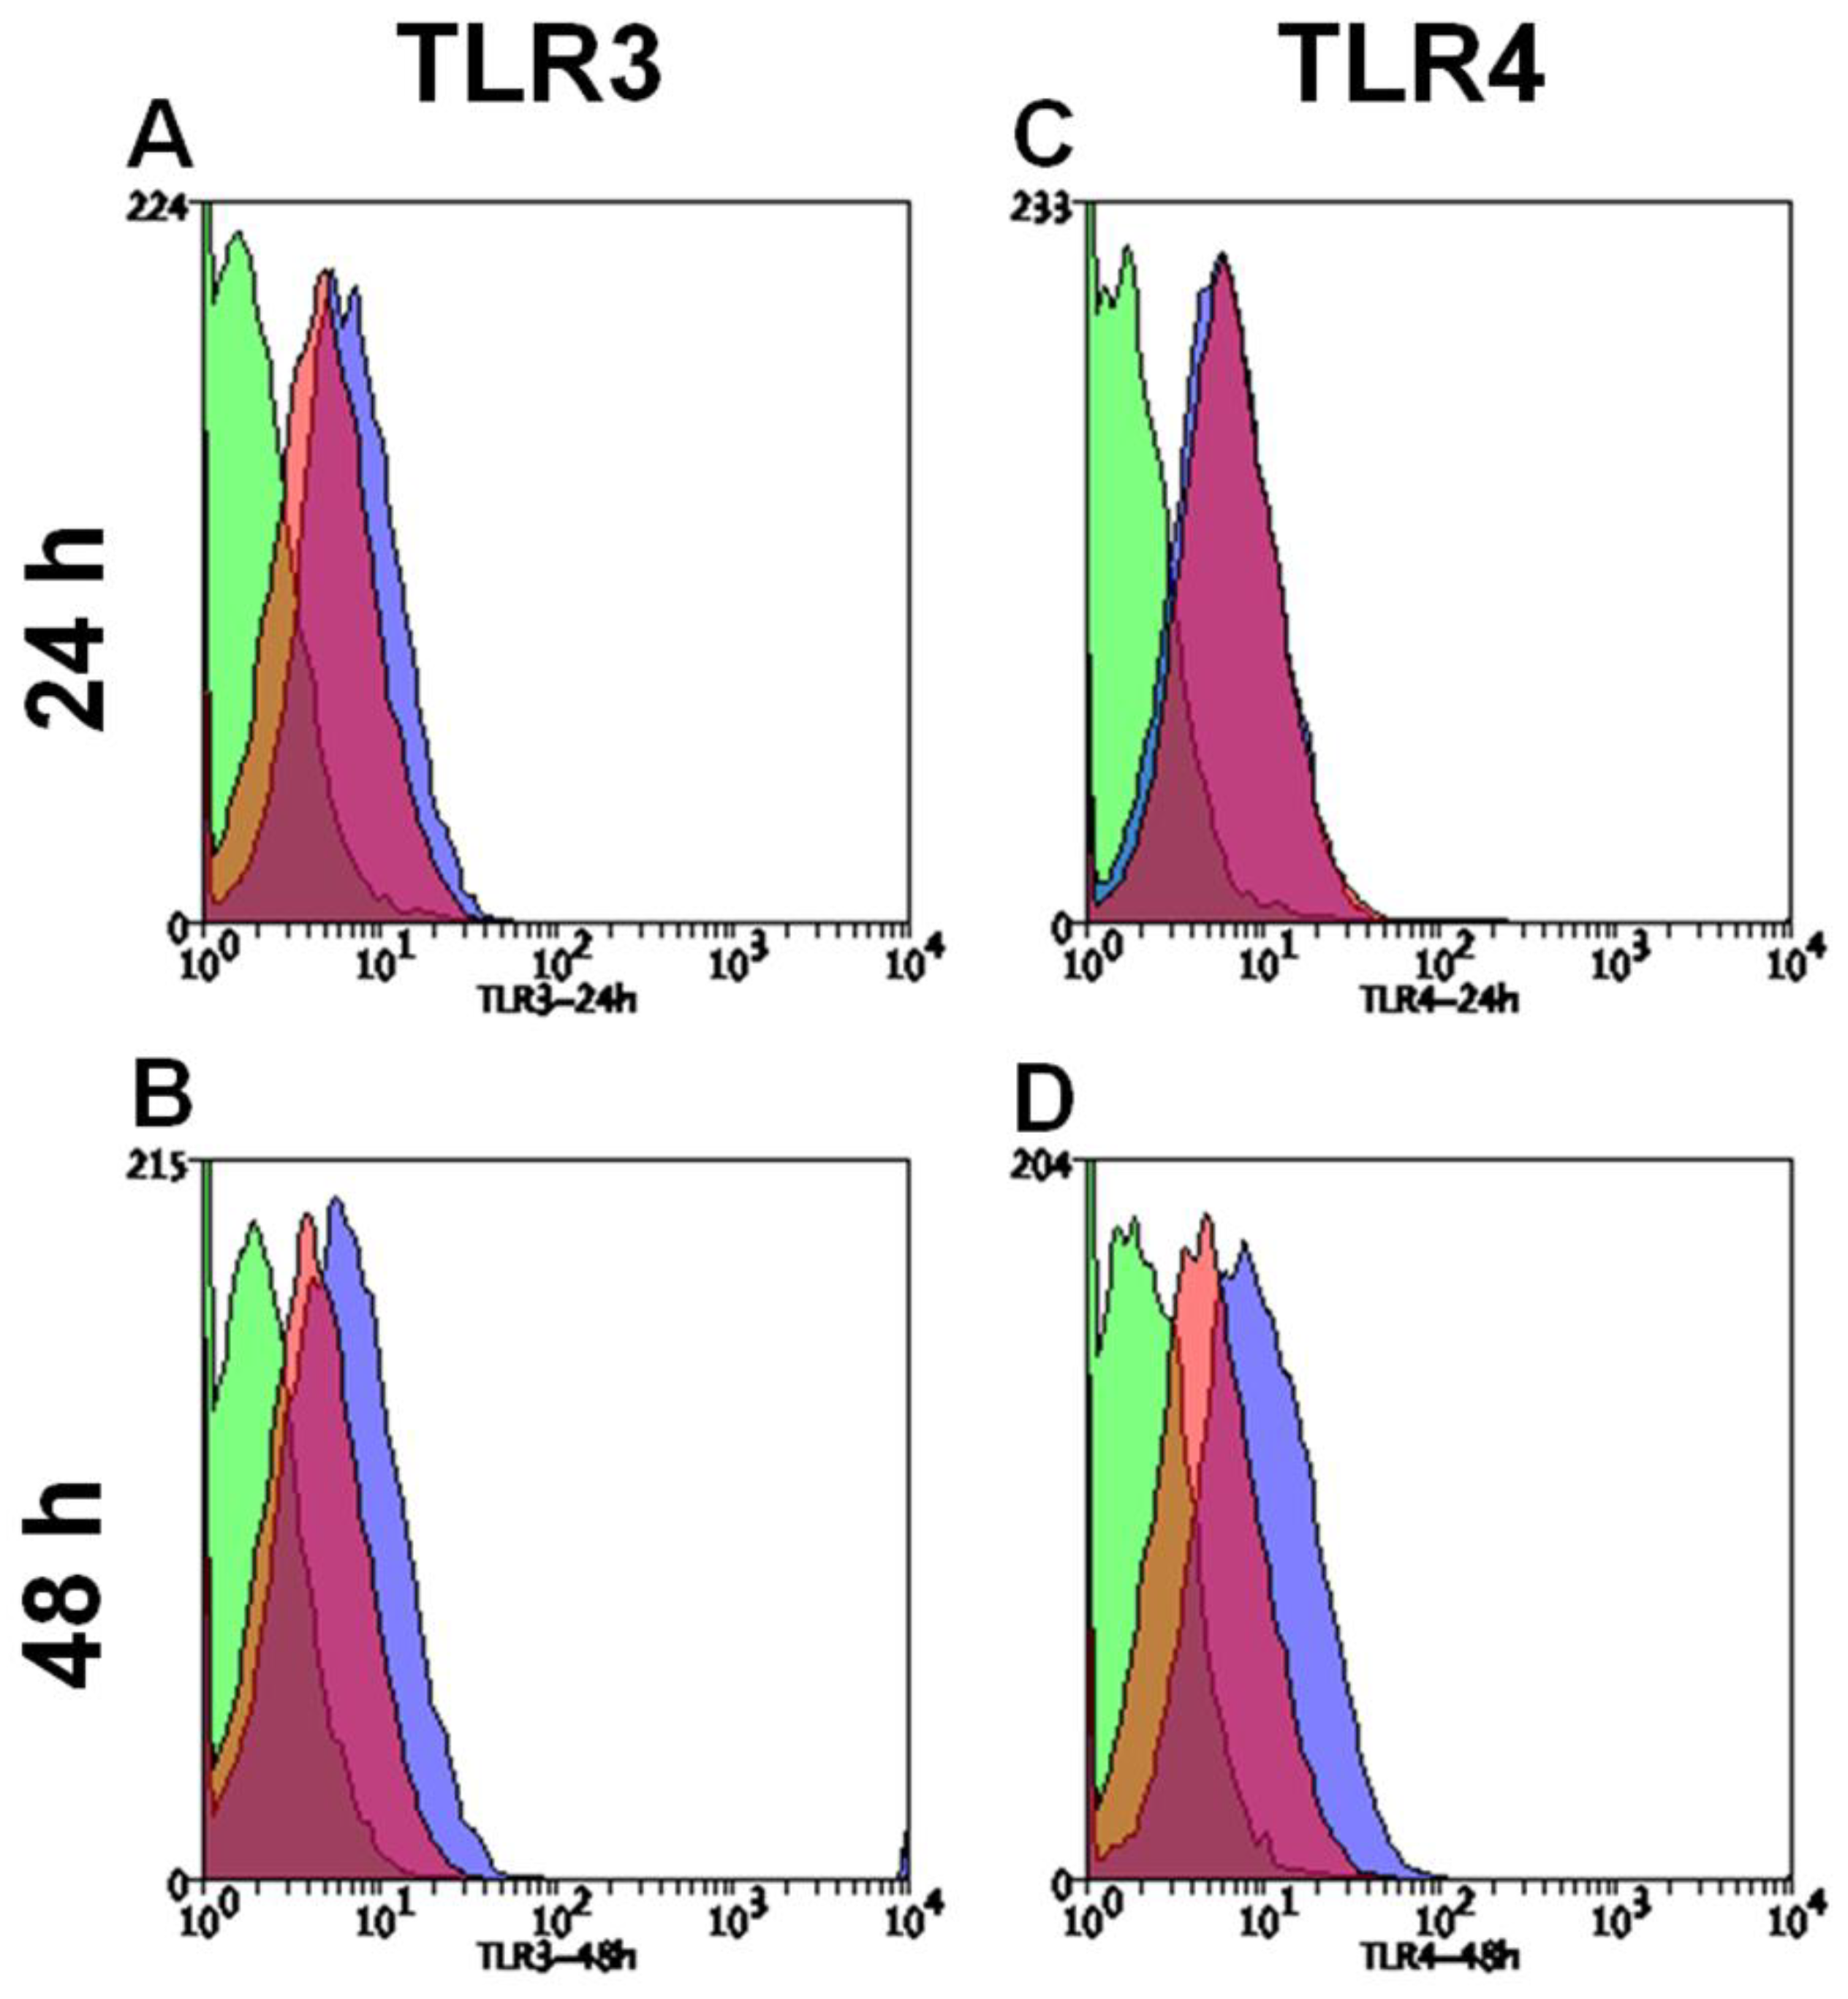
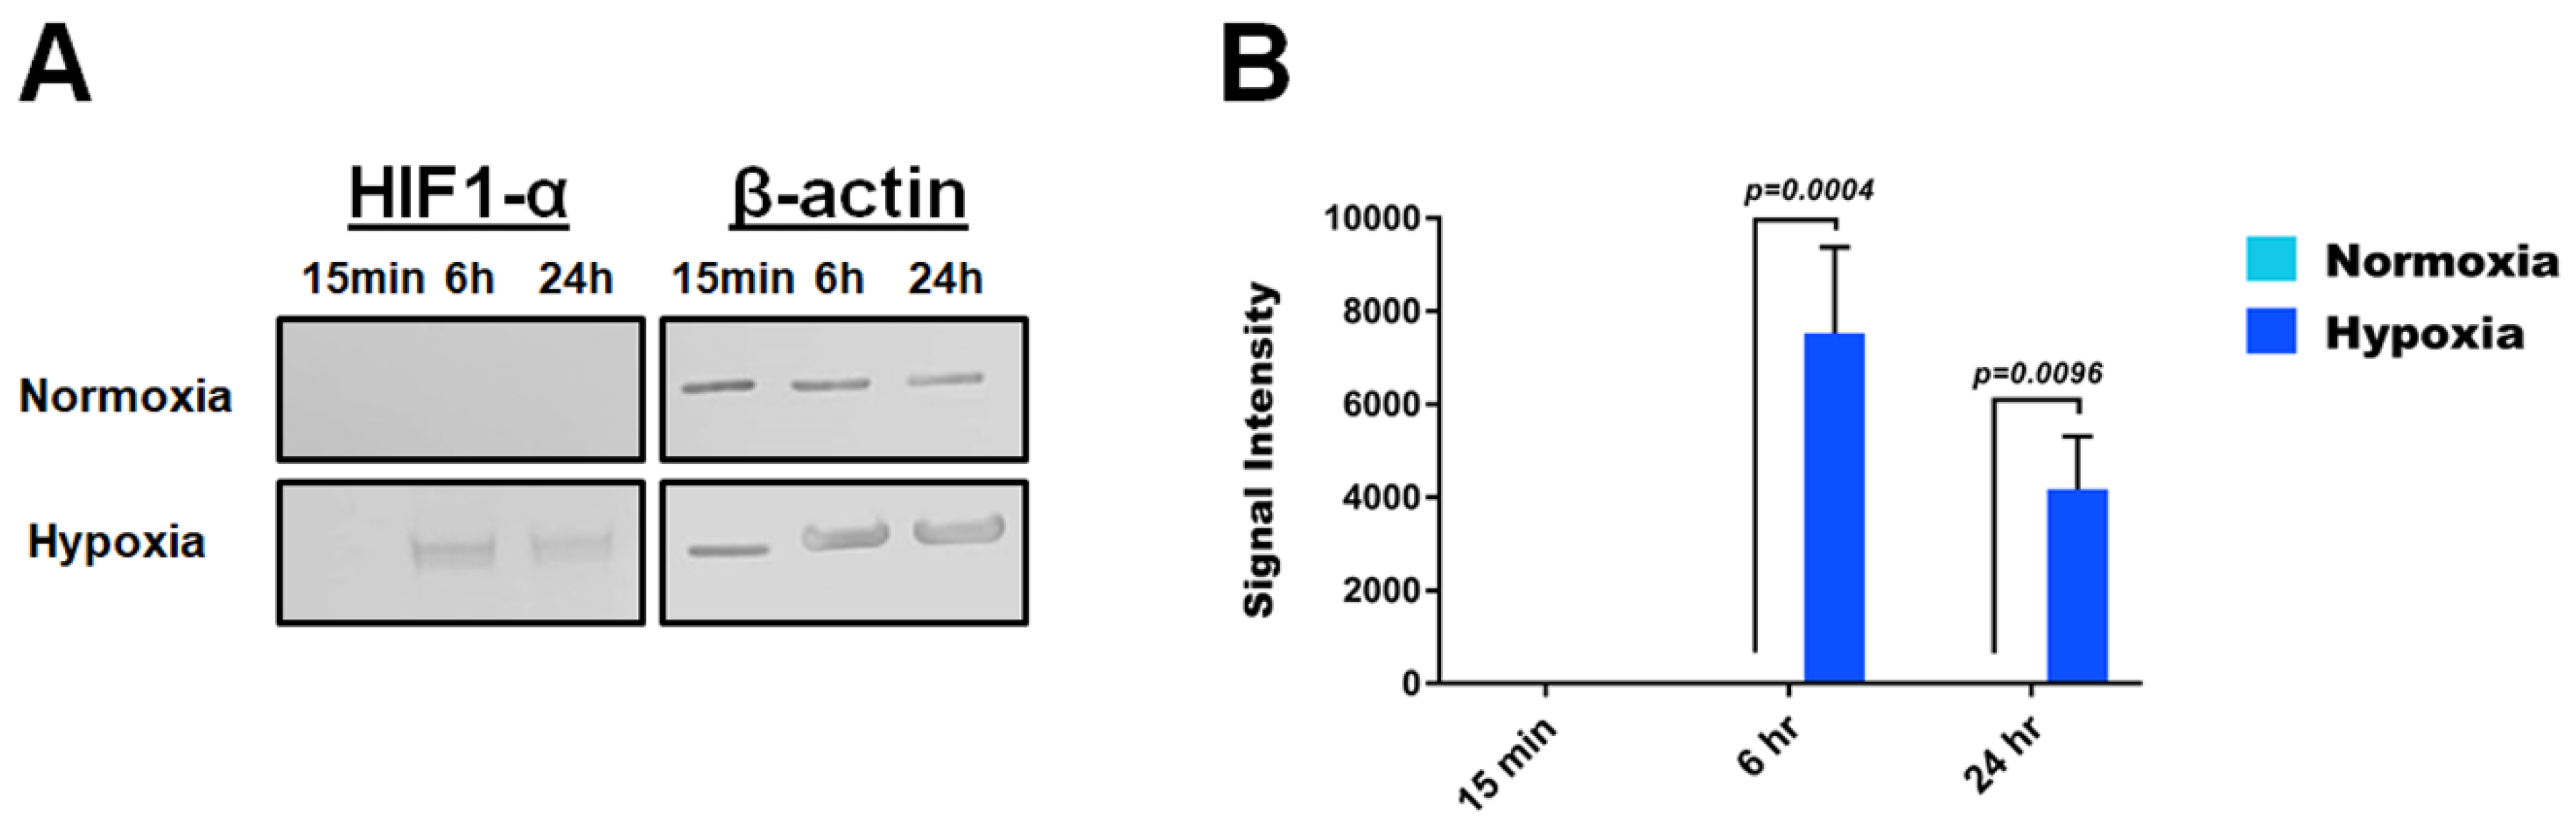
3.4. Hypoxia Modulates Protein Expression of TLR3, TLR4 and HIF1-α in HMEC-1

We examined the effect of hypoxic stress on intracellular levels of TLR3 and TLR4 at 24 and 48 h time-points using flow cytometry. After 24 h under hypoxia, a mild increase in TLR3 levels was noted in HMEC-1 (Figure 4A). However, TLR4 levels remained unchanged (Figure 4C). Notably, after 48 h of hypoxic stress, both TLR3 (Figure 4B) and TLR4 (Figure 4D) intracellular levels were elevated. We did not observe positive staining for TLR3 and TLR4 on extracellular surface of normoxic or hypoxic HMEC-1 (data not shown). As shown in Figure 5, signal intensity of HIF1-α was increased by 6 h (p = 0.0004) and remained elevated up to 24 h (p = 0.0096) of hypoxia. However, in normoxic HMEC-1 lysates, we did not observe a positive protein band signal for HIF1-α. The loading control, β-actin, was used to normalise the signal intensity.

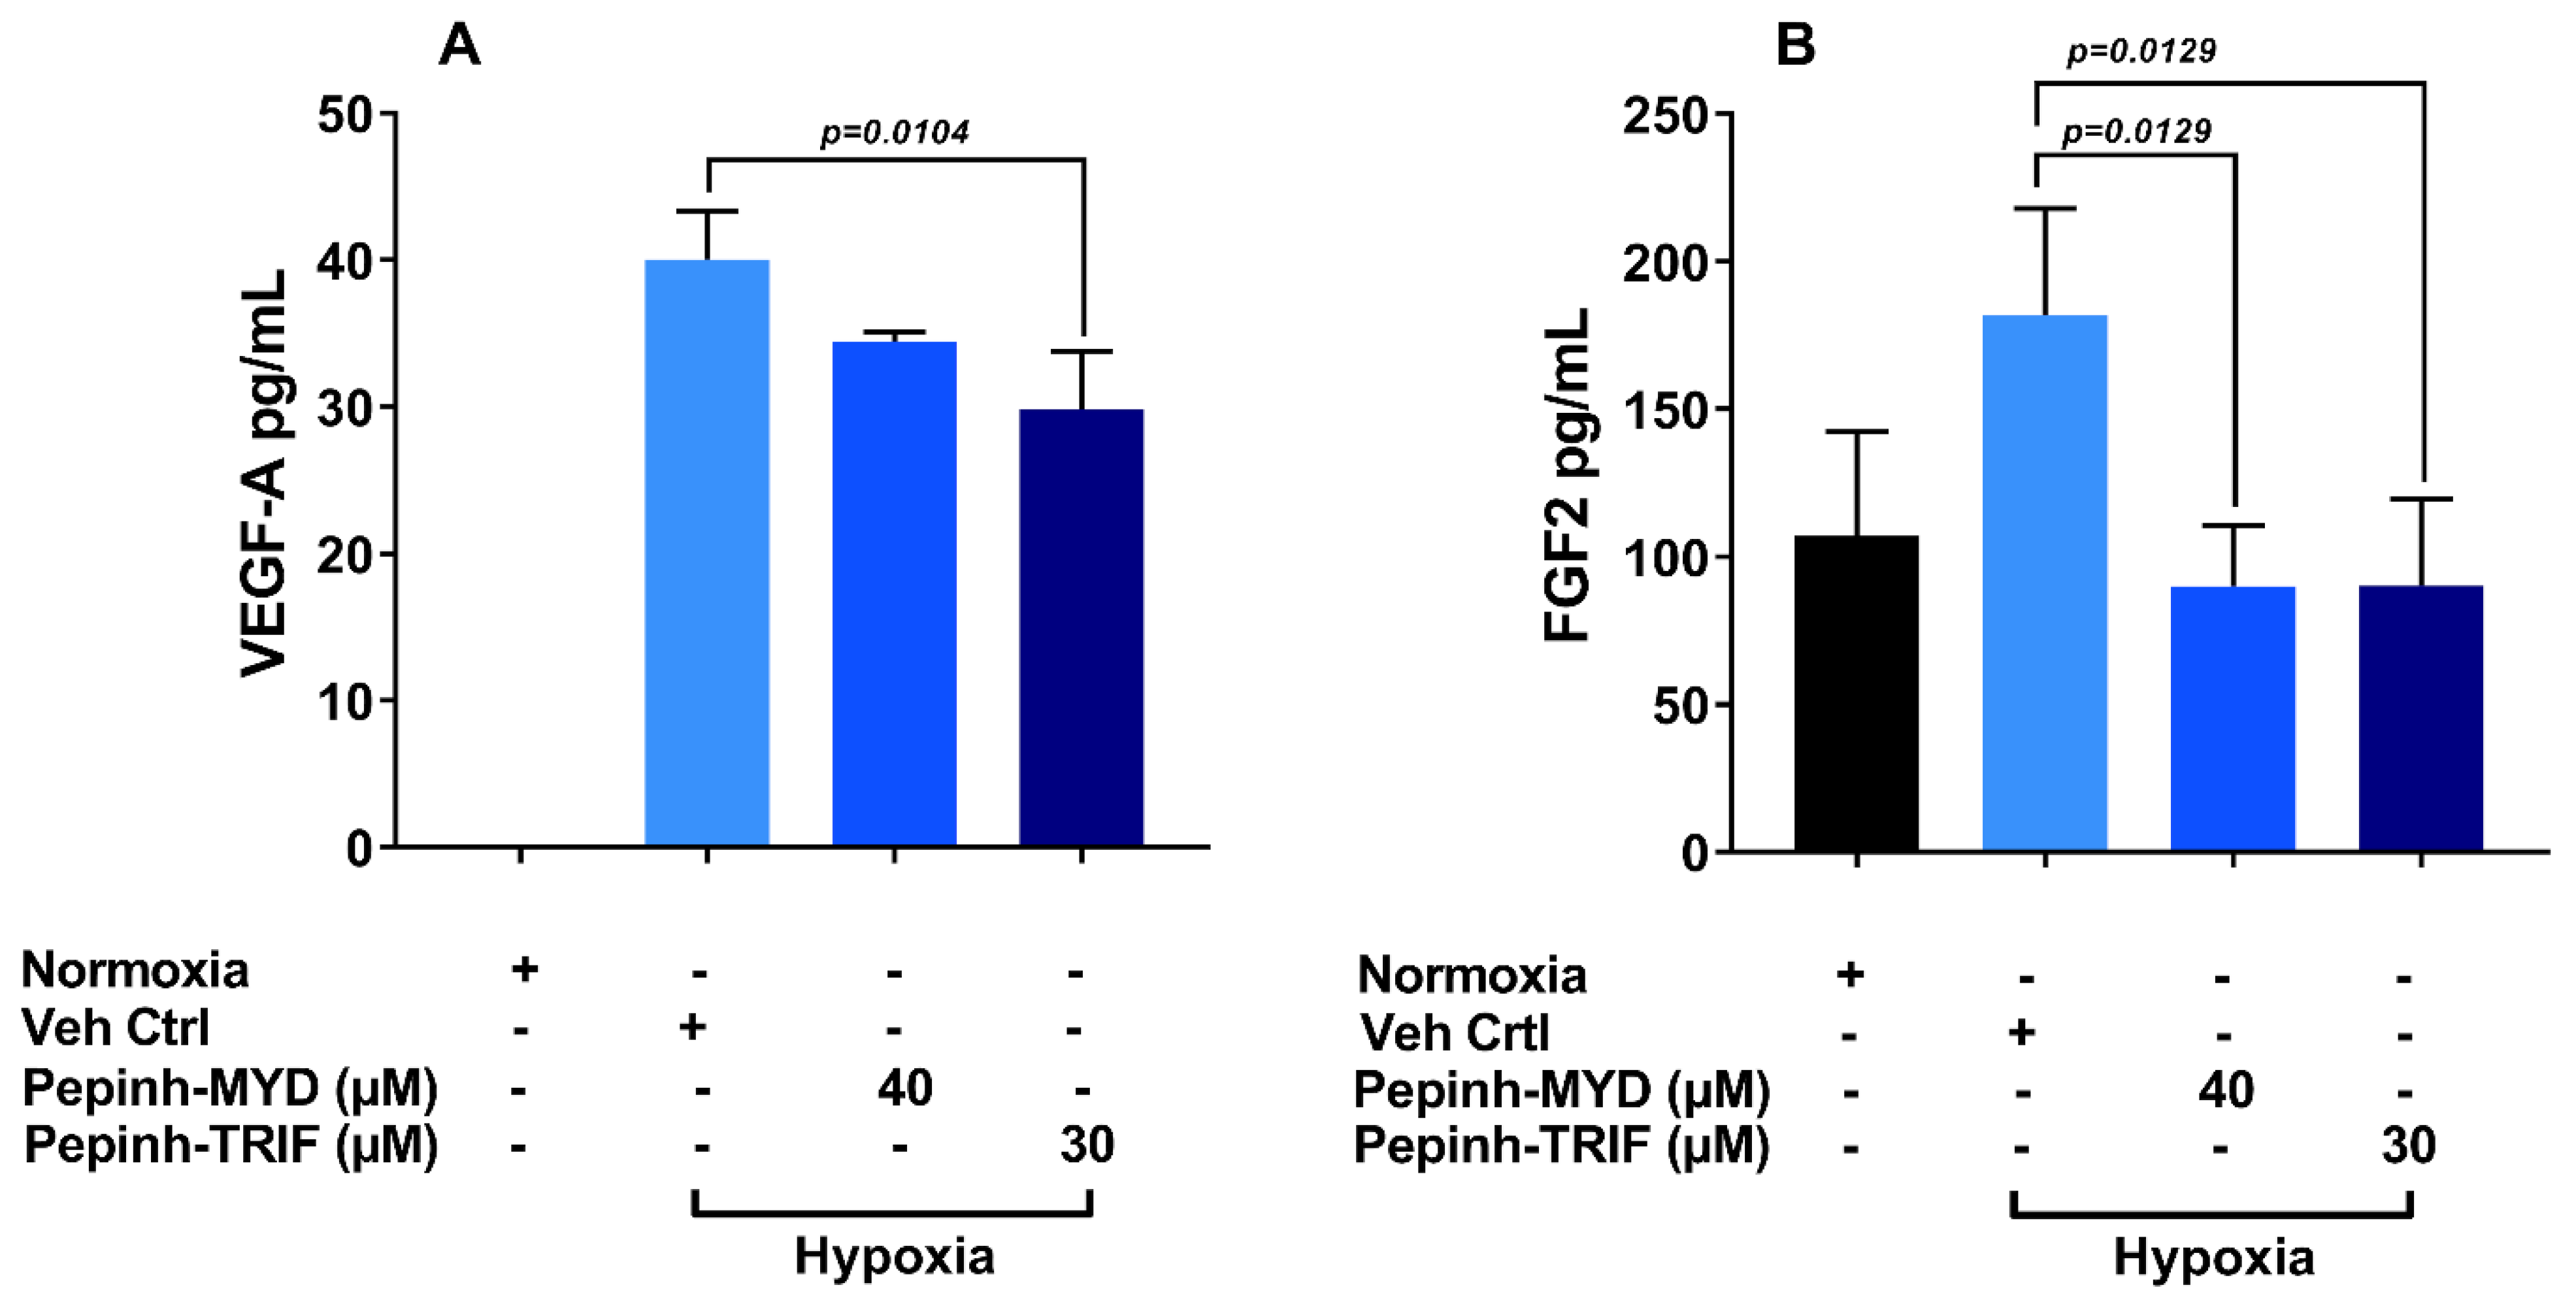
3.5. TRIF Activation Pathway Plays a Key Role in Induction of VEGF-A and FGF-2 under Hypoxia

To study the role of TLR signalling pathways in regulation of VEGF-A and FGF-2 secretion under hypoxia, we pre-treated HMEC-1 with pharmacological inhibitor peptides against MyD88 (Pepinh-MYD; 40 μM) and TRIF (Pepinh-TRIF; 30 μM) for 6 h prior to hypoxic stress for 48 h. As shown in Figure 6A, MyD88 pathway inhibition did not affect the VEGF-A levels under hypoxia. Blocking TRIF pathway significantly reduced VEGF-A (up to 25%) compared to vehicle pre-treatment (29.83 ± 3.92 pg/mL; p = 0.0104). Unlike VEGF-A, inhibition of MyD88 has markedly decreased FGF2 production (90.0 ± 20.44 SD pg/mL; p = 0.0129) with levels matching basal FGF2 release from normoxic HMEC-1 (Figure 6B). Similarly, inhibition of TRIF pathway prior to hypoxia also reduced FGF2 levels significantly (90.1 ± 29.24 SD pg/mL; p = 0.0129).

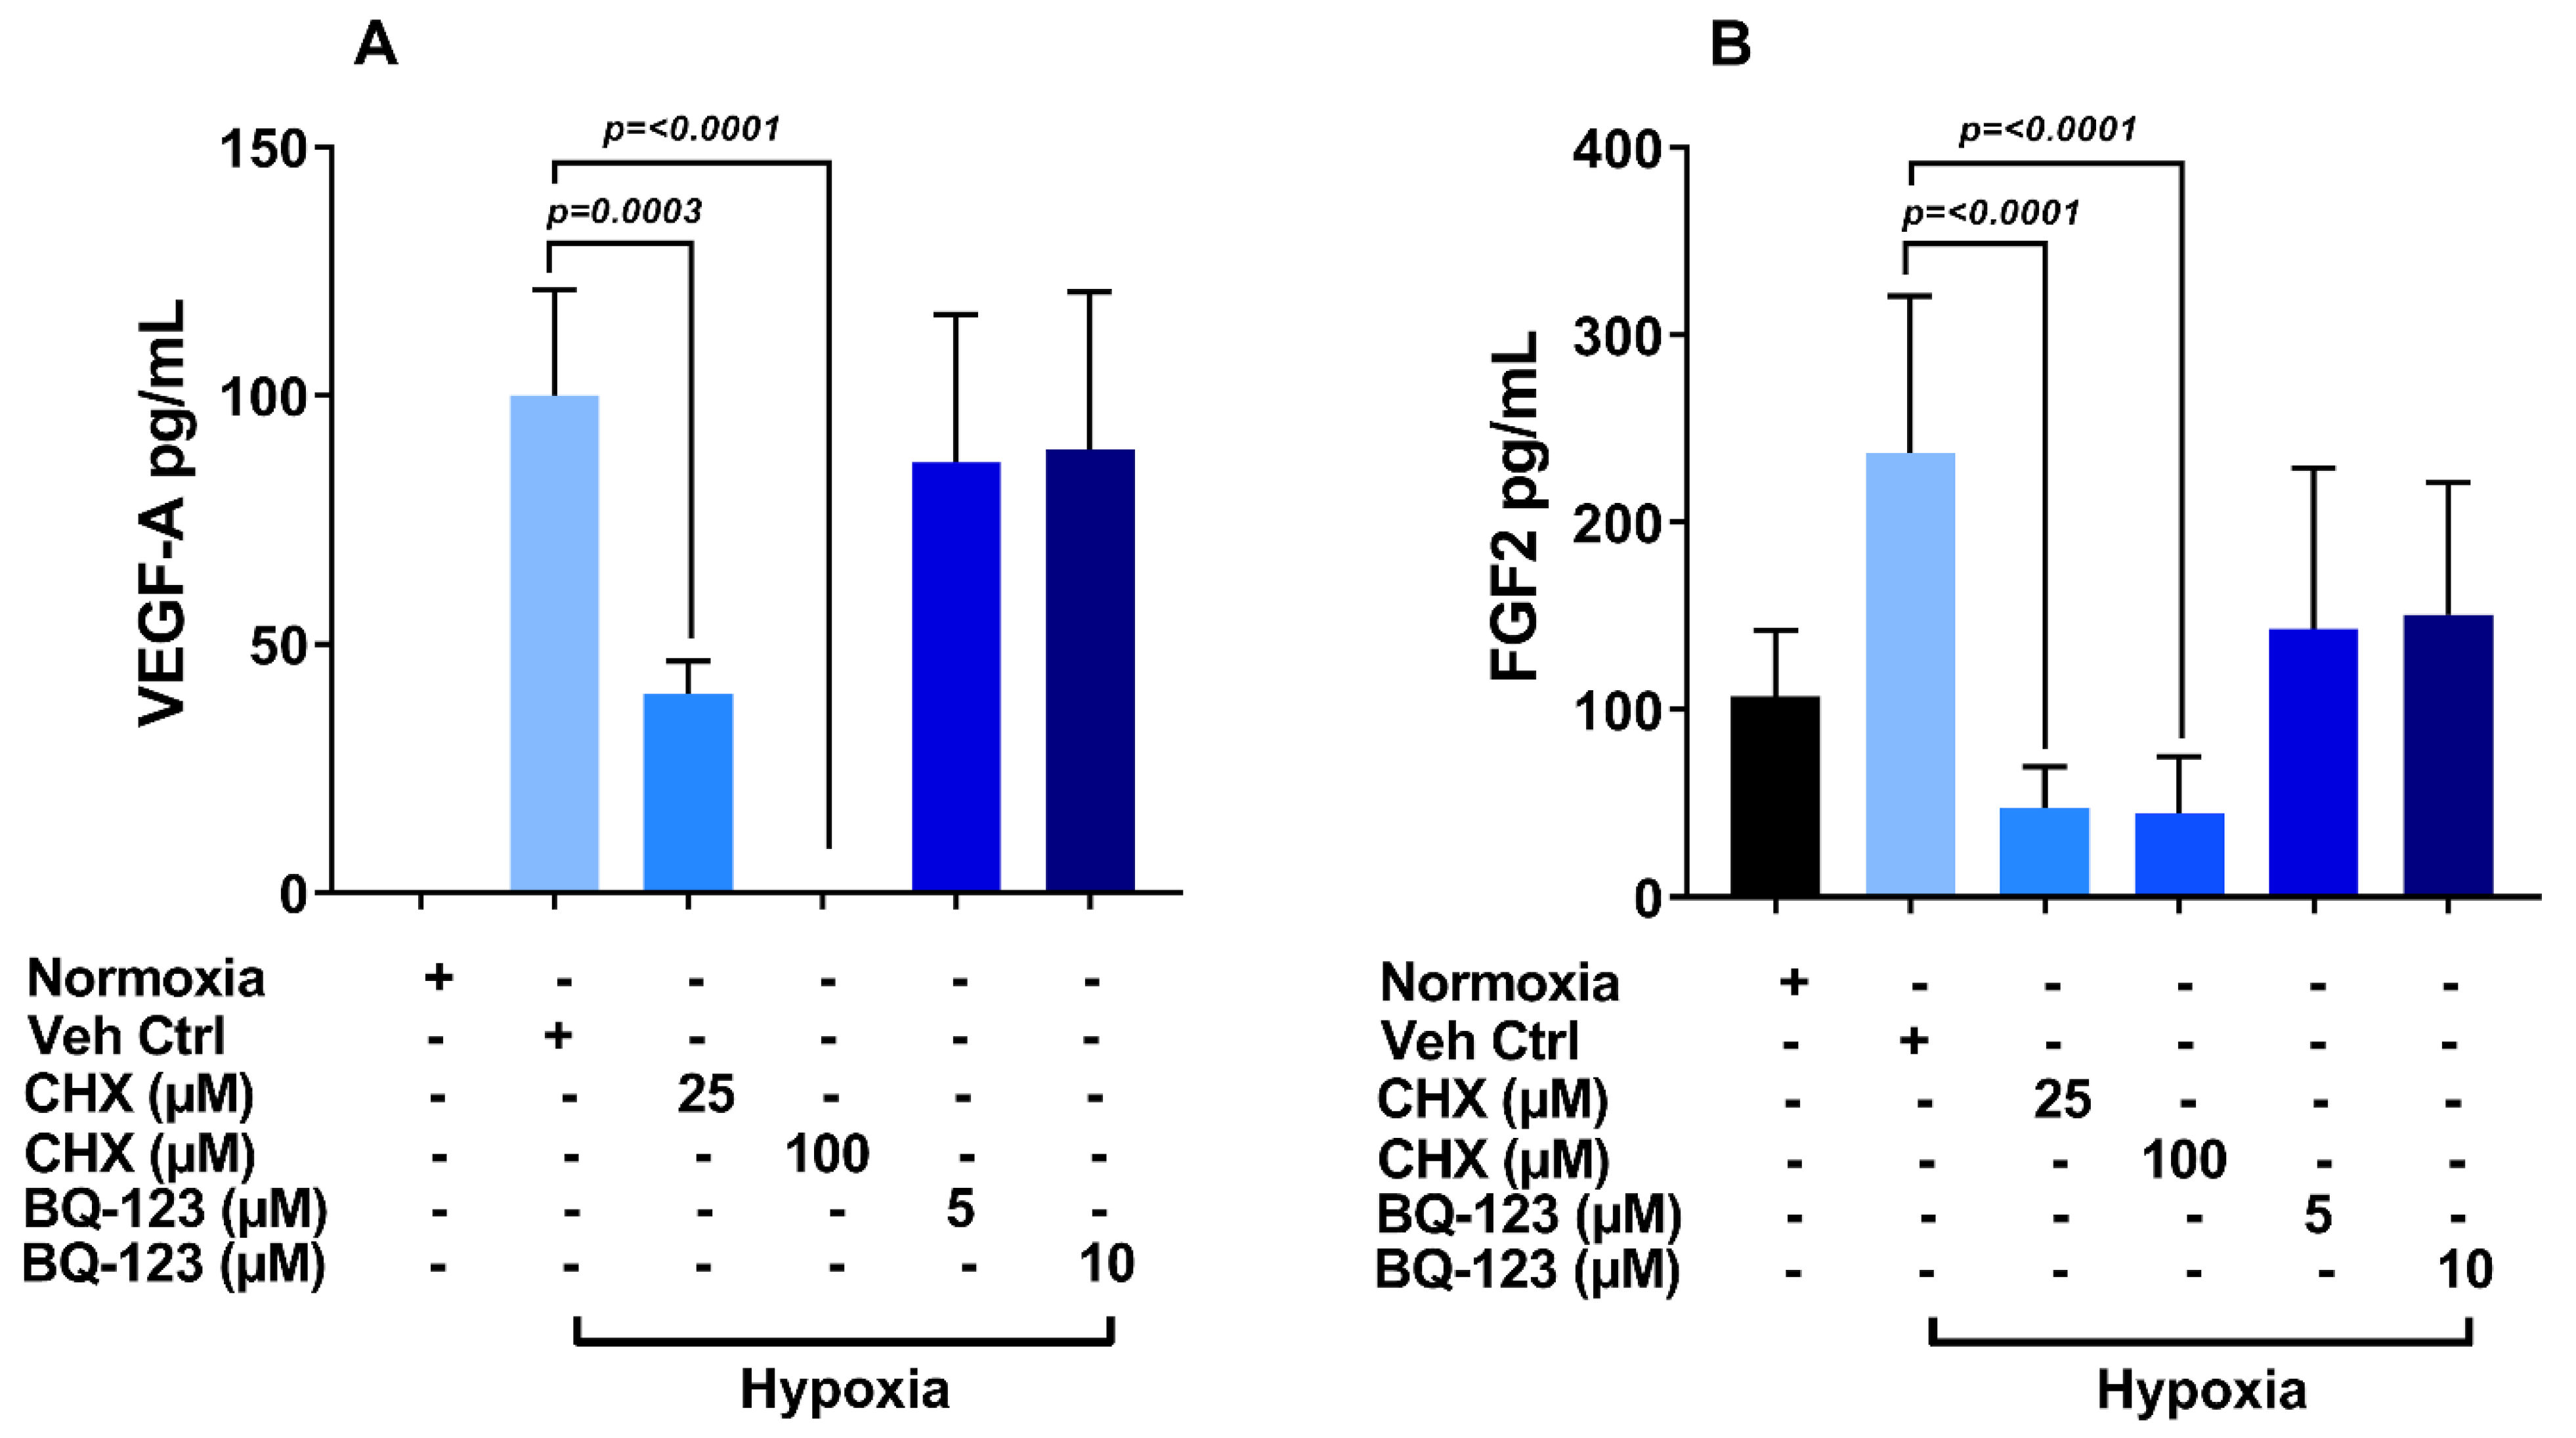
3.6. Role of Endothelin Receptor in Regulation of VEGF-A and FGF-2 Production

Previous studies have shown that endothelin receptor (ETR) regulates VEGF-A secretion from a variety of cell types under hypoxia [5,24]. As a first step to extend our understanding of VEGF-A and FGF-2 production under hypoxia from microvascular HMEC-1 cells, we blocked total protein synthesis. Treatment with cycloheximide (CHX) at 100 μM for 24 h prior to hypoxia was shown to block the production of VEGF-A (Figure 7A) and FGF-2 (Figure 7B). Next, we examined the effect of ETR antagonist, BQ123, on VEGF-A and FGF-2 production in response to hypoxia. VEGF-A levels did not change following treatment with BQ123 (Figure 7A). In contrast, FGF-2 levels declined following inhibition of ETR (Figure 7B).

4. Discussion

Hypoxia is known to induce TLRs in a variety of cell types including macrophages, dendritic cells and some cancer cells [25,26]. Numerous studies utilising macrovascular ECs have associated the role of TLRs in hypoxia-mediated angiogenic responses [27,28,29]. Our group has previously demonstrated that there are significant differences between microvascular REC and CEC, and macrovascular HUVEC [30]. In a subsequent study, we demonstrated the constitutive expression of TLRs in primary human retinal and choroidal ECs. More importantly, we established that the expression pattern and localisation of TLRs significantly differ between naïve primary microvascular (REC and CEC) and macro-vascular ECs [7]. As such, there are significant gaps in our understanding of the mechanisms of TLR stimulation in ocular vascular endothelial cells, particularly, their role in CEC survival (or apoptosis) and/or proliferation in AMD. This study provides evidence that hypoxia causes significant modulation of angiogenic growth factors (VEGF-A and FGF-2), HIF-1α, and TLRs in microvascular endothelial cells.
A central role of the TLR-signalling in the regulation of innate immune response, as well as a key regulator of hypoxia in angiogenesis, and the transcriptional effects of hypoxia on TLRs have been previously described [31]. Significantly, Basu et al. described induction of TLR4 and 2 in association with downstream signalling under hypoxia [32]. Recently, TLR3 has been reported to be protective in arterial wall endothelium [33]. Similar protection was demonstrated for synthetic TLR3 ligand (Poly I:C, especially in high doses) and thought to be mediated through anti-inflammatory cytokine, IL-10 [33,34]. Furthermore, TLR3 deficiency is reported to promote EC apoptosis and increased expression of IL-6 and ET-1, but not IL-10 [35], suggesting a dysregulation of RNA expression or sensing resulting from reduced TLR3 expression. However, these previous investigations utilised macrovascular endothelial cells, including arterial cells [33], stellate or Kupffer cells in the liver [34].
Both TLR3 and TLR4 have been implicated in DR [36] and retinopathy of prematurity (ROP) [37] through stimulation of varying cytokines. Genetic mutations in TLR4 have also been implicated in DR development [38]. Ishida et al. reported that long-term hypoxia reduced TLR stimulation of endothelial cells [39], whilst hypoxia exposure of macrophages increased TLR4 expression [25]. Some reports have suggested that the early phase of inflammatory response in ischaemia was mediated through MyD88 signalling, whilst the TRIF signalling effect was important in the late phase [40].
We investigated MyD88 and TRIF explicitly, rather than each individual TLR, as these adaptors together cover the signalling pathways of all TLRs. TLR3 utilises TRIF only, whilst TLR4 signals through MyD88 and TRIF. Inhibition of the MyD88 pathway had an insignificant effect on VEGF-A secretion in hypoxia, whilst there was only a minimal reduction in VEGF-A secretion following TRIF signalling blockage. On the other hand, inhibition of both TRIF and MyD88 signalling decreased FGF-2 production in HMEC-1, confirming that FGF-2 induction is mediated through a different mechanism from VEGF-A.
Levels of HIF-1α in HMEC-1 under hypoxia were consistent with a previous report that described HIF-1α-dependent regulation of FGF-2 in muscle cells under hypoxia [41]. Our findings have clearly demonstrated the redundant function of HIF-1α in HMEC-1 under hypoxia because blocking TLR signalling mechanisms (key regulators of HIF-1α activity in hypoxic macrovascular ECs) inhibited FGF-2 but not VEGF-A production. This warrants further characterisation or validation of HIF-1α function in microvascular ECs under hypoxia. Recent reports have indicated the specific role of endothelin receptor (ETR) in VEGF secretion from the macrovascular endothelial cells (HUVEC) and other cancer cells under hypoxia [5,24]. Additionally, a relation between elevated serum ET-1 levels and nAMD has been reported [6]. Unlike previous studies, our results demonstrated for the first time that the ETR plays a redundant role in regulation of VEGF-A in HMEC-1. Instead, FGF-2 was found to be regulated through ETR in HMEC-1.
The main limitation of this study is that it utilised HMEC-1 cells. However, the results from this study are more applicable to retinal and choroidal vasculature, which consist of microvascular endothelial cells similar to the HMEC-1 used in this study, unlike HUVEC. Further studies with human REC and CEC are required for validation. Although hypoxia has been shown to regulate TLR-mediated angiogenic growth factors, it is still unclear how TLRs are activated under hypoxia. DAMPS have been shown to activate TLRs in a variety of cell types [42]. A possibility is that hypoxia-triggered EC damage may release DAMPS with subsequent TLR activation [43]. Further studies will elucidate this intriguing phenomenon of feedback activation loop.
The findings from this study indicate that blockage of VEGF-A and FGF-2 pathways may lead to complementary effects in the modulation and treatment of retinal ischaemic diseases. This is underscored by the fact that, in clinical practice, a significant number of eyes receiving anti-VEGF therapies for retinal vascular diseases (including nAMD, and DR) show suboptimal response.

Author Contributions

Conceptualization, I.M. and W.M.A.; experimentation, R.A., H.T., R.W. and E.S.; writing—original draft preparation, R.A., I.M. and W.M.A.; writing—review and editing, I.M. and W.M.A.; funding acquisition, W.M.A. All authors have read and agreed to the published version of the manuscript.

Funding

This research was partly funded through unrestricted research grants from Novartis and Allergan International.

Institutional Review Board Statement

Not applicable.

Informed Consent Statement

Not applicable.

Data Availability Statement

Not applicable.

Acknowledgments

We would like to acknowledge the support of Alan McIntyre (University of Nottingham), especially for letting us use their Hypoxia Chamber.

Conflicts of Interest

W.M.A.: commercial relationships: acted as consultant for Abbvie, Alimera, Allergan Inc, Bayer, Novartis, Pfizer, Santen and Thrombogenics, and has undertaken research sponsored by Allergan, Bayer, Boerhinger Ingelheim, Novartis and Pfizer. He has received speaker fees and travel grants from Allergan, Bausch and Lomb, Bayer, Novartis and Pfizer. All other authors declare no conflict of interest. The funders had no role in the design of the study; in the collection, analyses, or interpretation of data; in the writing of the manuscript, or in the decision to publish the results.

References

  1. Yeo, N.J.Y.; Chan, E.J.J.; Cheung, C. Choroidal Neovascularization: Mechanisms of Endothelial Dysfunction. Front. Pharmacol. 2019, 10, 1363. [Google Scholar] [CrossRef] [PubMed] [Green Version]
  2. Wong, W.L.; Su, X.; Li, X.; Cheong, C.M.G.; Klein, R.; Cheng, C.-Y.; Wong, T.Y. Global prevalence of age-related macular degeneration and disease burden projection for 2020 and 2040: A systematic review and meta-analysis. Lancet Glob. Health 2014, 2, e106–e116. [Google Scholar] [CrossRef] [Green Version]
  3. Blasiak, J.; Petrovski, G.; Veréb, Z.; Facskó, A.; Kaarniranta, K. Oxidative stress, hypoxia, and autophagy in the neovascular processes of age-related macular degeneration. BioMed Res. Int. 2014, 2014, 768026. [Google Scholar] [CrossRef] [PubMed]
  4. Ioanna, Z.; Christian, S.; Christian, G.; Daniel, B. Plasma levels of hypoxia-regulated factors in patients with age-related macular degeneration. Graefes Arch. Clin. Exp. Ophthalmol. 2018, 256, 325–332. [Google Scholar] [CrossRef] [Green Version]
  5. Spinella, F.; Caprara, V.; Di Castro, V.; Rosanò, L.; Cianfrocca, R.; Natali, P.G.; Bagnato, A. Endothelin-1 induces the transactivation of vascular endothelial growth factor receptor-3 and modulates cell migration and vasculogenic mimicry in melanoma cells. J. Mol. Med. 2013, 91, 395–405. [Google Scholar] [CrossRef]
  6. Totan, Y.; Koca, C.; Erdurmus, M.; Keskin, U.; Yigitoglu, R. Endothelin-1 and Nitric Oxide Levels in Exudative Age-Related Macular Degeneration. J. Ophthalmic Vis. Res. 2015, 10, 151–154. [Google Scholar]
  7. Stewart, E.A.; Wei, R.; Branch, M.J.; Sidney, L.E.; Amoaku, W.M. Expression of Toll-like receptors in human retinal and choroidal vascular endothelial cells. Exp. Eye Res. 2015, 138, 114–123. [Google Scholar] [CrossRef]
  8. Yi, H.; Patel, A.K.; Sodhi, C.P.; Hackam, D.J.; Hackam, A.S. Novel role for the innate immune receptor Toll-like receptor 4 (TLR4) in the regulation of the Wnt signaling pathway and photoreceptor apoptosis. PLoS ONE 2012, 7, e36560. [Google Scholar] [CrossRef] [Green Version]
  9. Zhu, Y.; Liang, L.; Qian, D.; Yu, H.; Yang, P.; Lei, B. Increase in peripheral blood mononuclear cell Toll-like receptor 2/3 expression and reactivity to their ligands in a cohort of patients with wet age-related macular degeneration. Mol. Vis. 2013, 19, 1826. [Google Scholar]
  10. Kumar, M.V.; Nagineni, C.N.; Chin, M.S.; Hooks, J.J.; Detrick, B. Innate immunity in the retina: Toll-like receptor (TLR) signaling in human retinal pigment epithelial cells. J. Neuroimmunol. 2004, 153, 7–15. [Google Scholar] [CrossRef]
  11. Klettner, A.; Koinzer, S.; Meyer, T.; Roider, J. Toll-like receptor 3 activation in retinal pigment epithelium cells—Mitogen-activated protein kinase pathways of cell death and vascular endothelial growth factor secretion. Acta Ophthalmol. 2013, 91, e211–e218. [Google Scholar] [CrossRef] [PubMed]
  12. Cho, W.G.; Albuquerque, R.J.; Kleinman, M.E.; Tarallo, V.; Greco, A.; Nozaki, M.; Green, M.G.; Baffi, J.Z.; Ambati, B.K.; De Falco, M.; et al. Small interfering RNA-induced TLR3 activation inhibits blood and lymphatic vessel growth. Proc. Natl. Acad. Sci. USA 2009, 106, 7137–7142. [Google Scholar] [CrossRef] [PubMed] [Green Version]
  13. Kleinman, M.E.; Yamada, K.; Takeda, A.; Chandrasekaran, V.; Nozaki, M.; Baffi, J.Z.; Albuquerque, R.J.; Yamasaki, S.; Itaya, M.; Pan, Y.; et al. Sequence- and target-independent angiogenesis suppression by siRNA via TLR3. Nature 2008, 452, 591–597. [Google Scholar] [CrossRef] [Green Version]
  14. Patel, A.K.; Hackam, A.S. Toll-like receptor 3 (TLR3) protects retinal pigmented epithelium (RPE) cells from oxidative stress through a STAT3-dependent mechanism. Mol. Immunol. 2013, 54, 122–131. [Google Scholar] [CrossRef] [PubMed] [Green Version]
  15. Yang, Z.; Stratton, C.; Francis, P.J.; Kleinman, M.E.; Tan, P.L.; Gibbs, D.; Tong, Z.; Chen, H.; Constantine, R.; Yang, X.; et al. Toll-like receptor 3 and geographic atrophy in age-related macular degeneration. N. Engl. J. Med. 2008, 359, 1456–1463. [Google Scholar] [CrossRef] [PubMed]
  16. Cheng, Z.; Taylor, B.; Ourthiague, D.R.; Hoffmann, A. Distinct single-cell signaling characteristics are conferred by the MyD88 and TRIF pathways during TLR4 activation. Sci. Signal 2015, 8, ra69. [Google Scholar] [CrossRef] [Green Version]
  17. Dvoriantchikova, G.; Barakat, D.J.; Hernandez, E.; Shestopalov, V.I.; Ivanov, D. Toll-like receptor 4 contributes to retinal ischemia/reperfusion injury. Mol. Vis. 2010, 16, 1907–1912. [Google Scholar]
  18. Xu, W.Q.; Wang, Y.S. The role of Toll-like receptors in retinal ischemic diseases. Int. J. Ophthalmol. 2016, 9, 1343–1351. [Google Scholar]
  19. Kindzelskii, A.L.; Elner, V.M.; Elner, S.G.; Yang, D.; Hughes, B.A.; Petty, H.R. Toll-like receptor 4 (TLR4) of retinal pigment epithelial cells participates in transmembrane signaling in response to photoreceptor outer segments. J. Gen. Physiol. 2004, 124, 139–149. [Google Scholar] [CrossRef]
  20. Zareparsi, S.; Buraczynska, M.; Branham, K.E.; Shah, S.; Eng, D.; Li, M.; Pawar, H.; Yashar, B.M.; Moroi, S.E.; Lichter, P.R.; et al. Toll-like receptor 4 variant D299G is associated with susceptibility to age-related macular degeneration. Hum. Mol. Genet. 2005, 14, 1449–1455. [Google Scholar]
  21. Dua, H.S.; Otri, A.M.; Hopkinson, A.; Mohammed, I. In vitro studies on the antimicrobial peptide human beta-defensin 9 (HBD9): Signalling pathways and pathogen-related response (an American Ophthalmological Society thesis). Trans. Am. Ophthalmol. Soc. 2014, 112, 50–73. [Google Scholar] [PubMed]
  22. Mohammed, I.; Kulkarni, B.; Faraj, L.A.; Abbas, A.; Dua, H.S.; King, A.J. Profiling ocular surface responses to preserved and non-preserved topical glaucoma medications: A 2-year randomized evaluation study. Clin. Exp. Ophthalmol. 2020, 48, 973–982. [Google Scholar] [CrossRef] [PubMed]
  23. Mohammed, I.; Yeung, A.; Abedin, A.; Hopkinson, A.; Dua, H.S. Signalling pathways involved in ribonuclease-7 expression. Cell. Mol. Life Sci. 2011, 68, 1941–1952. [Google Scholar] [CrossRef]
  24. Spinella, F.; Caprara, V.; Cianfrocca, R.; Rosanò, L.; Di Castro, V.; Garrafa, E.; Natali, P.G.; Bagnato, A. The interplay between hypoxia, endothelial and melanoma cells regulates vascularization and cell motility through endothelin-1 and vascular endothelial growth factor. Carcinogenesis 2014, 35, 840–848. [Google Scholar] [CrossRef] [Green Version]
  25. Kim, S.Y.; Choi, Y.J.; Joung, S.M.; Lee, B.H.; Jung, Y.S.; Lee, J.Y. Hypoxic stress up-regulates the expression of Toll-like receptor 4 in macrophages via hypoxia-inducible factor. Immunology 2010, 129, 516–524. [Google Scholar] [CrossRef]
  26. Crifo, B.; Taylor, C.T. Crosstalk between toll-like receptors and hypoxia-dependent pathways in health and disease. J. Investig. Med. 2016, 64, 369–375. [Google Scholar] [CrossRef] [PubMed] [Green Version]
  27. Spirig, R.; Djafarzadeh, S.; Regueira, T.; Shaw, S.G.; von Garnier, C.; Takala, J.; Jakob, S.M.; Rieben, R.; Lepper, P.M. Effects of TLR agonists on the hypoxia-regulated transcription factor HIF-1alpha and dendritic cell maturation under normoxic conditions. PLoS ONE 2010, 5, e0010983. [Google Scholar] [CrossRef] [PubMed] [Green Version]
  28. Paone, A.; Galli, R.; Gabellini, C.; Lukashev, D.; Starace, D.; Gorlach, A.; De Cesaris, P.; Ziparo, E.; Del Bufalo, D.; Sitkovsky, M.V.; et al. Toll-like receptor 3 regulates angiogenesis and apoptosis in prostate cancer cell lines through hypoxia-inducible factor 1 alpha. Neoplasia 2010, 12, 539–549. [Google Scholar] [CrossRef] [PubMed] [Green Version]
  29. Nishi, K.; Oda, T.; Takabuchi, S.; Oda, S.; Fukuda, K.; Adachi, T.; Semenza, G.L.; Shingu, K.; Hirota, K. LPS induces hypoxia-inducible factor 1 activation in macrophage-differentiated cells in a reactive oxygen species-dependent manner. Antioxid. Redox Signal 2008, 10, 983–995. [Google Scholar] [CrossRef]
  30. Browning, A.C.; Halligan, E.P.; Stewart, E.A.; Swan, D.C.; Dove, R.; Samaranayake, G.J.; Amoaku, W.M. Comparative gene expression profiling of human umbilical vein endothelial cells and ocular vascular endothelial cells. Br. J. Ophthalmol. 2012, 96, 128–132. [Google Scholar] [CrossRef]
  31. Trinchieri, G.; Sher, A. Cooperation of Toll-like receptor signals in innate immune defence. Nat. Rev. Immunol. 2007, 7, 179–190. [Google Scholar] [CrossRef] [PubMed]
  32. Basu, M.; Paichha, M.; Lenka, S.S.; Chakrabarty, R.; Samanta, M. Hypoxic stress: Impact on the modulation of TLR2, TLR4, NOD1 and NOD2 receptor and their down-stream signalling genes expression in catla (Catla catla). Mol. Biol. Rep. 2016, 43, 1–9. [Google Scholar] [CrossRef]
  33. Cole, J.E.; Navin, T.J.; Cross, A.J.; Goddard, M.E.; Alexopoulou, L.; Mitra, A.T.; Davies, A.H.; Flavell, R.A.; Feldmann, M.; Monaco, C. Unexpected protective role for Toll-like receptor 3 in the arterial wall. Proc. Natl. Acad. Sci. USA 2011, 108, 2372–2377. [Google Scholar] [CrossRef] [PubMed] [Green Version]
  34. Byun, J.S.; Suh, Y.G.; Yi, H.S.; Lee, Y.S.; Jeong, W.I. Activation of toll-like receptor 3 attenuates alcoholic liver injury by stimulating Kupffer cells and stellate cells to produce interleukin-10 in mice. J. Hepatol. 2013, 58, 342–349. [Google Scholar] [CrossRef] [PubMed]
  35. Farkas, D.; Thompson, A.A.R.; Bhagwani, A.R.; Hultman, S.; Ji, H.; Kotha, N.; Farr, G.; Arnold, N.D.; Braithwaite, A.; Casbolt, H. Toll-like Receptor 3 Is a Therapeutic Target. for Pulmonary Hypertension. Am. J. Respir. Crit. Care Med. 2019, 199, 199–210. [Google Scholar] [CrossRef] [PubMed]
  36. Wang, H.; Shi, H.; Zhang, J.; Wang, G.; Zhang, J.; Jiang, F.; Xiao, Q. Toll-like receptor 4 in bone marrow-derived cells contributes to the progression of diabetic retinopathy. Mediat. Inflamm. 2014, 2014, 858763. [Google Scholar] [CrossRef]
  37. Cai, M.; Zhang, X.; Li, Y.; Xu, H. Toll-like receptor 3 activation drives the inflammatory response in oxygen-induced retinopathy in rats. Br. J. Ophthalmol. 2015, 99, 125–132. [Google Scholar] [CrossRef]
  38. Singh, K.; Kant, S.; Singh, V.K.; Agrawal, N.K.; Gupta, S.K.; Singh, K. Toll-like receptor 4 polymorphisms and their haplotypes modulate the risk of developing diabetic retinopathy in type 2 diabetes patients. Mol. Vis. 2014, 20, 704–713. [Google Scholar]
  39. Ishida, I.; Kubo, H.; Suzuki, S.; Suzuki, T.; Akashi, S.; Inoue, K.; Maeda, S.; Kikuchi, H.; Sasaki, H.; Kondo, T. Hypoxia diminishes toll-like receptor 4 expression through reactive oxygen species generated by mitochondria in endothelial cells. J. Immunol. 2002, 169, 2069–2075. [Google Scholar] [CrossRef] [Green Version]
  40. Li, X.Q.; Lv, H.W.; Tan, W.F.; Fang, B.; Wang, H.; Ma, H. Role of the TLR4 pathway in blood-spinal cord barrier dysfunction during the bimodal stage after ischemia/reperfusion injury in rats. J. Neuroinflamm. 2014, 11, 62. [Google Scholar] [CrossRef] [Green Version]
  41. Egger, M.; Schgoer, W.; Beer, A.G.; Jeschke, J.; Leierer, J.; Theurl, M.; Frauscher, S.; Tepper, O.M.; Niederwanger, A.; Ritsch, A.; et al. Hypoxia up-regulates the angiogenic cytokine secretoneurin via an HIF-1alpha- and basic FGF-dependent pathway in muscle cells. FASEB J. 2007, 21, 2906–2917. [Google Scholar] [CrossRef] [PubMed] [Green Version]
  42. Tang, D.; Kang, R.; Coyne, C.B.; Zeh, H.J.; Lotze, M.T. PAMPs and DAMPs: Signal 0s that spur autophagy and immunity. Immunol. Rev. 2012, 249, 158–175. [Google Scholar] [CrossRef] [PubMed]
  43. Schlueter, C.; Weber, H.; Meyer, B.; Rogalla, P.; Röser, K.; Hauke, S.; Bullerdiek, J. Angiogenetic signaling through hypoxia: HMGB1: An angiogenetic switch molecule. Am. J. Pathol. 2005, 166, 1259–1263. [Google Scholar] [CrossRef]
Figure 1. Viability of HMEC-1 in normoxic and hypoxic conditions. HMEC-1 was treated under normoxia and hypoxia conditions for 24 h and 48 h, respectively. Cell viability was assessed using CCK-8 kit. Results were presented as percentage (%) viability, and all data were quantified from two biological replicates from n = 3 independent experiments.
Ijtm 01 00003 g001
Figure 2. Profile of mRNA expression of growth factors, toll-like receptors, cytokines and HIF1-α. HMEC-1 incubated in normoxic and hypoxic conditions for different durations (2, 6, 24, and 48 h) was processed for gene expression analysis by qPCR. VEGF-A (A), FGF-2 (B), HIF1-α (C), TLR-3 (D), and TLR-4 (E). All data represented as mean ± SD of six biological replicates from two independent experiments.
Ijtm 01 00003 g002
Figure 3. Hypoxic stress increases VEGF-A and FGF-2 secretion from HMEC-1 cells. Levels of VEGF-A (A) and FGF-2 (B) are measured in supernatants of HMEC-1 incubated under hypoxia and normoxia for different durations. All data represented as mean ± SD of six biological replicates from two independent experiments.
Ijtm 01 00003 g003
Figure 4. Increased expression of TLR3 and TLR4 in HMEC-1 cells under hypoxia. Intracellular levels of TLR3 (A,B) and TLR4 (C,D) in HMEC-1 under hypoxia and normoxia for 24 and 48 h, respectively, was analysed by flow cytometry. Green: Isotype control Ab staining; blue: TLR Ab staining of normoxic cells; red: TLR Ab staining of hypoxic cells. Note: magenta colour was a result of overlapping histogram of normoxia (red) and hypoxia (blue). All data are representative of three independent experiments.
Ijtm 01 00003 g004
Figure 5. Accumulation of HIF1-α in HMEC-1 under hypoxia condition. (A) Monoclonal antibodies against human HIF1-α and human β-actin was utilised to determine the expression of HIF1-α and actin in HMEC-1 under hypoxia and normoxia for different durations. (B) The signal intensity was semi-quantitatively normalised against actin using ImageJ software (NIH). All data represented as mean ± SD of three independent experiments. The corresponding strips have been cropped in order to improve the clarity and conciseness of presentation.
Ijtm 01 00003 g005
Figure 6. Role of MyD88 and TRIF in induction of VEGF-A and FGF-2 under hypoxia. HMEC-1 cells were treated with Pepinh-MYD (40 μM) and Pepinh-TRIF (30 μM) for 6 h prior to hypoxia challenge for 48 h. Levels of VEGF-A (A) and FGF-2 (B) in supernatant was measured by ELISA. All data represented as mean ± SD of six biological replicates from two independent experiments.
Ijtm 01 00003 g006
Figure 7. Endothelin receptor (ETR) is not involved in VEGF-A secretion from HMEC-1 under hypoxia. HMEC-1 cells were treated with Cycloheximide (25 and 100 μM) and BQ123 (5 and 10 μM) for 24 h prior to hypoxia challenge for 48 h. Levels of VEGF-A (A) and FGF-2 (B) in supernatant was measured by ELISA. Protein expression levels were measured through ELISA assay. All data represented as mean ± SD of six biological replicates from two independent experiments.
Ijtm 01 00003 g007
Table 1. TaqMan probes utilised for qPCR analysis.
Gene NameAssay IDGene Symbol
Vascular Endothelial Growth Factor AHs00900055_m1VEGFA
Fibroblast Growth Factor 2Hs00266645_m1FGF2
Hypoxia Inducible Factor 1 alpha Hs00153153_m1 HIF1A
Toll Like Receptor 3 Hs01551079_g1 TLR3
Toll Like Receptor 4 Hs00152939_m1 TLR4
Hypoxanthine phosphoribosyl transferase 1 Hs99999909_m1 HPRT1
Publisher’s Note: MDPI stays neutral with regard to jurisdictional claims in published maps and institutional affiliations.

