
Modeling and Thermodynamic Analysis of the Water Sorption Isotherms of Cottonseed Products


Southern Regional Research Center, USDA Agricultural Research Service, 1100 Robert E. Lee Blvd., New Orleans, LA 70124, USA
*
Author to whom correspondence should be addressed.
Foundations 2021, 1(1), 32-44; https://0-doi-org.brum.beds.ac.uk/10.3390/foundations1010005
Submission received: 13 May 2021
/
Revised: 7 July 2021
/
Accepted: 8 July 2021
/
Published: 12 July 2021
(This article belongs to the Section Biological Sciences and Engineering)
Abstract
:Due to their hygroscopic characteristics, equilibrium moisture contents of agricultural products and byproducts are important factors of their quality. Defatted cottonseed meal (CSM), washed cottonseed meal (WCSM) and cottonseed protein isolate (CSPI) can be used as energy and protein sources of animal feedstuff or industrial raw materials. Information on their moisture adsorption behaviors is needed for their storage conditions and quality control. Thus, this work measured the equilibrium moisture sorption isotherms of CSM, WCSM and CSPI, at 15, 25, 35 and 45 °C. When the moisture contents of the samples were compared at a constant temperature, the general trend of decreasing moisture content was in the order of CSPI < WCSM < CSM for water activity <0.6, but the trend reversed to the order of CSM < WCSM < CSPI for water activity >0.6. Relevant sorption isotherm equations were tested for accurate fit to the moisture adsorption data. Modelling results indicated that the G.A.B. (Guggenheim-Anderson-de Boer) model was a consistently good fit for the data among all sample types and all temperatures. This work provides some insight on designing or selecting appropriate procedures for the handling, aeration, storage and processing of these cottonseed meal products. In particular, it suggests that moisture content should be kept at around 8% for safe storage of these products at room temperature (around 25 °C) but below 5% when they are exposed to higher temperature conditions (e.g., >45 °C).
1. Introduction
Cotton (Gossypium hirsutum L.) is a major crop grown in the USA [1,2] and worldwide [3,4,5,6]. Cotton crop is mainly harvested for the cotton bolls for their fiber while other biomass is left or burnt in the field [7,8,9]. Cottonseed is the by-product of cotton bolls left after ginning (i.e., fiber-removing) [10,11,12]. Cottonseed has both high oil and protein content. Cottonseed oil is used for cooking, salads, and as shortenings by the food industry as a premium oil [10,13,14]. After oil extraction, the protein-rich defatted cottonseed meal (CSM) can be used as an energy and protein source for animal feedstuff or industrial raw materials [10,14,15,16].
Due to their hygroscopic characteristics, equilibrium moisture contents of agricultural products and byproducts are very important for their quality [17,18,19,20,21,22]. Excessive critical moisture content would promote hydrolytic/enzymatic cleavage of macromolecules in these natural products. Adverse conditions during storage (i.e., high temperatures) may further accelerate this process. Thus, it is necessary to determine their thermodynamic properties as a function of moisture content to design equipment for handling, aeration, storage and processing [13,23,24]. One way for presenting moisture characteristics is through sorption isotherms [25], as the isotherms represent the relationship between the water adsorbed or desorbed within the product and its water activity, at a constant temperature under equilibrium conditions. In addition, thermodynamic properties (e.g., the isosteric heats of sorption) can also be estimated from sorption isotherms and used for analysis and design of appropriate bioproduct processing and for studying moisture–solid interactions [26]. For this purpose, Tunc and Duman [13] measured the moisture adsorption isotherms of fuzzy cottonseed, delinted cottonseed, whole cottonseed kernel, blended cottonseed kernel and its protein isolate at 15, 25, 35 and 45 °C. The moisture adsorption isotherms obtained were type II sigmoidal. Using the Clausius–Clapeyron equation, they calculated the differential enthalpy and entropy from these moisture adsorption data. As the net isosteric heat of adsorption and differential entropy values of these samples decreased with increasing moisture content, the authors found that the moisture adsorption of fuzzy cottonseed, black cottonseed and whole or blended cottonseed kernel was an enthalpy-controlled process.
Defatted cottonseed meal (CSM), its water washed product (washed cottonseed meal -WCSM), and protein isolate (CSPI) have shown promise in enhanced utilization as renewable and green industrial raw materials, especially as wood adhesives [27,28,29,30,31,32]. While the pilot-scale production of relevant products is reported [33], information on their moisture adsorption behaviors is needed to design or select appropriate equipment for their handling, aeration, storage and processing, even though numerous similar studies have been conducted with various agricultural products and byproducts [34,35,36]. Thus, the purposes of this work were to (1) obtain equilibrium moisture sorption isotherms of CSM, WCSM and cottonseed protein isolate (CSPI, as a control) at 15, 25, 35 and 45 °C; (2) test 13 mathematical equations to fit the experimental sorption behaviors; and (3) calculate the relevant thermodynamic parameters from these adsorption isotherms. The biggest difference between the three defatted cottonseed products and those four undefatted products studied by Tunc and Duman [13] was the oil content (i.e., <2.5% vs. 17.1–41.7%) [13,14]. Thus, this work will not only provide novel insight on the effect of the composition difference on the moisture behaviors of cottonseed products, but also shed light on the impacts of oil content on moisture thermodynamics of seed products from a more general scope.
2. Materials and Methods
2.1. Materials
Mill-scale produced CSM was provided by Cotton, Inc. (Cary, NC, USA). WCSM and CSPI were obtained previously in a pilot-scale production with CSM as the starting material [33]. These products were freeze-dried and ground to pass a 0.5-mm screen and stored in a freezer (−22 °C) until use. Selective properties of the three products are listed in Table 1.
All chemicals were of reagent grade. Eight chemicals [LiCl, MgCl2, K2CO3, Mg(NO3)2, KI, NaCl, (NH4)2SO4, KCl] were used to obtain constant water activity environments. Distilled water was used to make the saturated salt solutions.
2.2. Sorption Isotherms
Sorption isotherms of CSM, WCSM and CSPI were determined at four working temperatures at 15, 25, 35 and 45 °C were determined through the static gravimetric method (i.e., weight increase after moisture adsorption equilibrium under the designated experimental conditions) [13,17,25]. Before the moisture adsorption isotherm experiments, samples were dried in a vacuum oven at 60 °C for three days. Glass desiccating jars placed in a conditioning incubator were used to create a closed environment with the desired temperature and relative humidity. A beaker with a saturated salt solution with known water activities (aw, Table S1) was placed in a jar to create the required relative humidity in that jar. Samples (about 0.8 g) were weighed into small plastic weighing boats and placed into the jars. Thymol in small cups was placed in the jars with aw > 0.7 to prevent microbial growth [20,25]. Closed jars were maintained in the incubator at 15, 25, 35 or 45 °C for the equilibration of samples up to 24 days (Figure S1). The weights of the sample tubes were measured before and after sample loading. These sample tubes were then placed in the jars. The weight increases over the moisture equilibrium were checked twice or trice during the period to make sure the equilibrium moisture content was reached. The difference between the two consecutive weigh-increase measurements was ≤0.1%. The moisture contents were presented as the relative increase (%) of the samples after the moisture equilibrium. The experiments were conducted in duplicates.
2.3. Mathematical Modelling
Analysis and the representation of the experimental data of equilibrium moisture content and water activity at different temperatures were performed using sorption isotherm equations (B.E.T., Bradley, Caurie, Freundlich, G.A.B., Halsey, Harkins and Jura, Henderson, Iglesias and Chirife, Langmuir, Mizrahi, Oswin, and Smith) [13]. G.A.B. (Guggenheim-Anderson-de Boer), B.E.T. (Brunauer–Emmett–Teller) and Caurie models are considered to have parameters based on physicochemical phenomena [25]. The G.A.B model, which has three parameters, was rearranged into a second-degree polynomial and analyzed using multiple linear regression. The other equations, which all have two parameters, were linearized and analyzed using simple linear regression. Regression analysis was done using the statistical programming language R.
Three criteria, the regression coefficient (R2), mean relative deviation modulus (P) and standard error of estimate (SE), were considered to determine an equation’s goodness-of-fit to the data.
Mobs is the observed equilibrium moisture content for a given water activity and temperature and Mpred is the predicted moisture content for the same water activity and temperature according to the model. N is the number of observations and n is the number of parameters in the model.
Models with a P value less than 10 percent were considered acceptable [37]. High R2 values and low SE values indicated that a model fitted the data well.
3. Results and Discussion
3.1. Experimental Moisture Sorption Isotherms
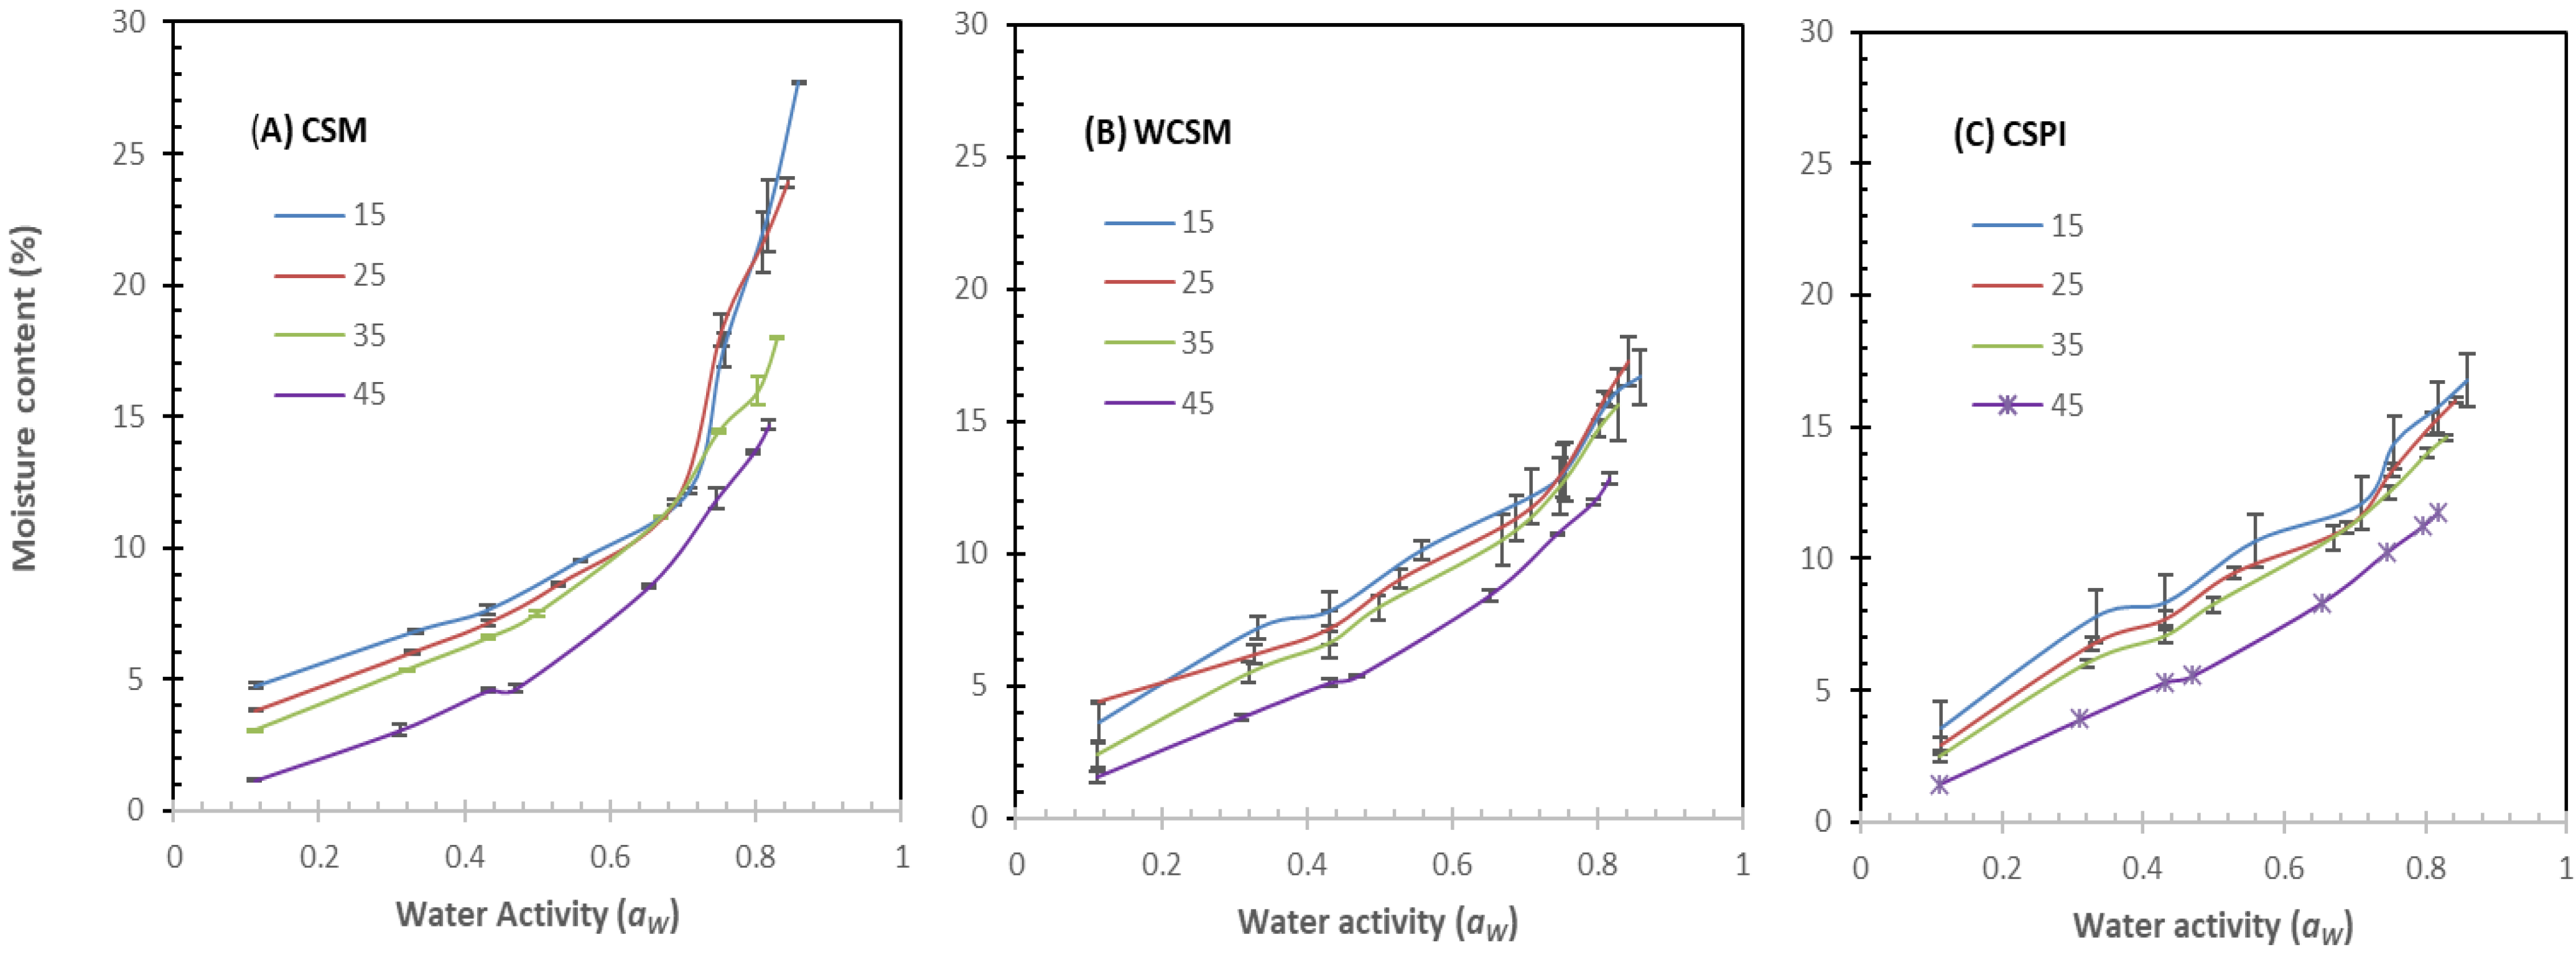
The moisture adsorption isotherms of the three cottonseed products at four working temperatures (15, 25, 35 and 45 °C) are shown in Figure 1. It is noticeable that some error bars were greater than the differences between the corresponding datapoints. This phenomenon was not only observed in this work, but also reported previously [38,39]. Thus, two-factor ANOVA with replicates was applied to evaluate the significance of the impacts of the temperature and saturated salt solution (i. e., aw). The results (Table S2) indicated that both factors impacted significantly (P < 0.001) the water contents of the three tested samples. However, the interaction of the two factors was not statistically significant (P > 0.05) with WCSM samples. Generally, the moisture content features of cottonseed products were consistent with those of agricultural products and byproducts (e.g., cottonseed, almond and bloodmeal) in literature [13,20,40]. Visually, the adsorption isotherm of CSM increased slowly initially at low water activity values, which was then followed by a steep rise at higher water activity values (Figure 1a). This trend was more obvious with the low temperature (15 °C). These moisture adsorption isotherms were sigmoid in shape, a characteristic typical of amorphous, hydrophilic polymers [40,41]. The sigmoid feature generally described a gradual increase in moisture content at low water activities and then a rapid increase at higher water activities. This is likely caused by exposure of more polar hydroxyl groups as molecular mobility and free volume increase with increasing moisture content [40]. A similar increasing feature with smaller slopes was observed with the other two products, WCSM and CSPI (Figure 1b,c). The less typical sigmoid shapes of the adsorption isotherms of the two products was apparently due to their less amorphous and less hydrophilic properties as shown previously by surface imaging and fluorescence analysis [42,43].
The moisture content of all three products generally increased as the temperature decreased from 45 to 15 °C. The biggest difference was from 35 °C to 45 °C. Tunc and Duman [13] explained this trend with the mechanism of excitation states of molecules. In other words, increased temperatures decreased the attractive forces between molecules due to an increase in kinetic energy of water molecules, leading to an increase in their distance apart from each other. Therefore, water molecules with slow motion at low temperatures bound more easily to suitable binding sides on the surface. This explanation suggested that, in our work, the defatted cottonseed products became less hygroscopic as the temperature increased. Because water molecules become more active at higher temperatures, they easily dissociate from the water-binding sites in the cottonseed meal (more carbohydrates) or protein surface.
When the moisture contents of the samples were compared at a constant temperature, the general trend of decreasing moisture content was in the order of CSPI < WCSM < CSM for water activity <0.6, but the trend reversed to the order of CSM < WCSM < CSPI for water activity >0.6. Taitano et al. [20] reported that raw almonds with brown skin reversed the order and had higher moisture content than blanched almonds when water activity was above 0.30. The order changes were also observed with water/sorbitol-plasticized composite biopolymer of caseinate-pullulan bilayers and blends [41]. They found that the isotherms of the samples plasticized with 25 and 15% sorbitol swung upwards and crossed over those of the free-polyol samples at water activity higher than 0.53. They attributed the drastic increase in water sorption by the sorbitol itself in the region of water activity >0.53. While we could not figure out the exact cause of our observation, Tunc and Duman [13] did not report a similar observation with their cottonseed samples. In contrast, they observed the same trend of decreasing moisture content in all ranges of water activity in the order of fuzzy cottonseed > black cottonseed > cottonseed protein isolate > whole cottonseed kernel ≈ blended cottonseed kernel. However, there were significant amounts of lipid (17–40%) in their products. In contrast, lipid was a minor component in our products, accounting for only 0.2, 1.0 and 2.5% of CSPI, WCSM and CSM, respectively (Table 1). The hydrophobic character of lipids might lead to a decrease in the water uptake of cottonseed kernel and provide the lower value in the moisture content. They proposed that linters, which are composed of mainly cellulose with hydrophilic characters, may cause an increase in the water adsorption of their fuzzy cottonseed samples. We could reasonably assume that in our samples, the cellulose content played a major role in the differences in the moisture content between CSM, WCSM and CSPI under the same water activity conditions.
3.2. Modeling Adsorption Isotherms
It is a common practice that multiple isotherms are tested and compared for this type of modelling study. While over 200 mathematical equations have been proposed to represent the hygroscopic equilibrium phenomenon of agricultural products [44,45], the number (e.g., 1, 3, 8, 11 and 14) of modelling equations selected for testing seems to be an option for research groups [13,17,25,46]. In particular, Tunc and Duman [13] tested 14 models for their four cottonseed products. In order to facilitate data comparison, in this current work, we tested 13 sorption isotherm equations out of the 14 equations tested by Tunc and Duman [13] (i.e., without the Chung and Pfost equation). Among them, six sorption isotherm models are, more or less, relatively good fits for the experimental data (Table S3).
Specifically, for CSM, the G.A.B. model was found to be the best fit with the lowest average P and SE values and relatively high R2 value across all temperatures (Table 2). No other model had satisfactory P values for all temperatures, but the Halsey and B.E.T. models did have P values < 10% for three out of four temperatures. These observations were consistent with reports that the G.A.B model demonstrates greater universality in the description of the surface absorption of moisture than the B.E.T equation [13,47] while the BET isotherm equation gives good fit for a variety of foods over the region 0.05 < aw < 0.45 [36]. For WCSM, the G.A.B. model fitted the data the best with the lowest average P and SE values across all temperatures. The Henderson and Oswin models also had good statistical values, indicating a fairly good fit. For CSPI, the G.A.B model gave the best fit with the lowest average P value and second lowest average SE value across all temperatures. The Bradley and Henderson models had the highest regression coefficients while also having very satisfactory P and SE values. Therefore, among all cottonseed types and all temperatures, it is only the G.A.B. model that provides a consistently good fit for the data. This is not unexpected because the third parameter adds an additional degree of freedom to the model which gives it greater versatility [48]. Practically, the G.A.B. model is a semi-theoretical, multi-molecular, localized homogenous adsorption model and is considered to be the most versatile sorption model [49,50].
3.3. Monolayer Moisture Content and Specific Surface Area of Sorption
The monolayer moisture content (Mo) given by the G.A.B. equations was in the range 3.87–7.66 kg H2O 100 kg−1 of dry solid (Table 2). The Mo values have been reported in a range between 1.39 and 7.4 3.87–7.66 kg H2O 100 kg−1 in legume protein isolates (e.g., soy protein, cowpea and faba bean) [17]. The Mo values of the cottonseed products were roughly at the high end of the protein products. The Mo values increased in the order of CSPI > WCSM > CSM at each temperature tested. Apparently, the chemical compositions and structures of these cottonseed products affected their Mo values. Tunc and Duman [13] reported that the hydrophobic oil component was a factor in decreasing Mo values as its content varied from 17.4% to 41.7% in their cottonseed products. The lipid (oil) content in our samples was quite low (Table 1); the differences in M0 values between CSM, WCSM and CSPI seemed due to the different protein contents. Differences in morphological characteristics might also have contributed to the Mo values [42].
Unlike the cottonseed products with high oil contents [13], we did not observe a downward trend of Mo values with temperature increases. In contrast, the Mo values of all three products CSM, WCSM and CSPI fluctuated consistently in the order of 15 °C > 25 °C < 35 °C > 45 °C. Bajpai and Pradeep [50] observed the same trend with red algae-extracted sulphonated galacan product. The lower Mo values at higher temperatures could be attributed to the fact that water molecules are activated to a higher energy level at higher temperatures, which makes the water molecules less stable, thereby favoring their break away from the binding sites of the testing materials. In the meantime, Bajpai and Pradeep [50] assumed that the increased Mo values from 10 to 20 °C were due to the fact that increase in temperature from 10 to 20 °C causes opening of new binding sites, thus allowing more and more water vapor molecules to bind, finally resulting in enhanced equilibrium moisture content. The increasing Mo values of CSM, WCSM and CSPI from 25 °C to 35 °C could be explained via the same mechanism.
The parameter C in the G.A.B. and B.E.T. models was related to the heat of adsorption of water. The physical meaning of the parameter might reflect the trend that strong adsorbent-adsorbate interactions are favored at lower temperatures, resulting in an increase in C values with increasing temperature [17]. However, we also observed three negative values of C (one G.A.B. case and two B.E.T. cases) with defatted cottonseed meal samples. Previously, Miranda et al. [25] reported negative values of C in their B.E.T. model for the sorption behavior of quinoa without elaboration. Thus, it is possible that C lacks any physical meaning being the result of mathematical compensation among parameters during the curve-fitting process [17]. On the other hand, the K values provide a measure of the interaction between the molecules in multi layers with absorbent. K << 1 indicates a structured state of the adsorbate in the adjacent layers to the monolayer while K equal to 1 indicates the multilayer has the properties of bulk water [17,50]. Alpizar-Reyes [17] reported K values ranged from 0.71 to 0.74 for their faba bean protein, thus believing that there were fewer interactions between water molecules and the faba bean protein in the multilayer. K values were 0.94–0.98 for CSM, 0.72–0.83 for WCSM and 0.66–0.68 for CSPI, respectively (Table 2). These data indicated that the interaction of CSPI and WCSM with water were similar to that of faba bean protein, but the multilayer of water adsorbed on CSM possessed the properties of bulk water. This observation seems reasonable as WCSM was a product of CSM (after washing out the water soluble components) and CSPI was an extracted product of CSM [51].
N is Avogadro’s number (6.02 × 10²³ molecules mol−1), AH2O is the area of a water molecule (10.6 × 10⁻²⁰ m2), and MH2O is the molecular weight of water (18 g mol−1).
The influence of temperature on S0 values of the three cottonseed products was similar to that of M0 as the specific surface area was straightforwardly calculated from the estimated M0 of their sorption isotherms. The S0 values of samples were between 137 and 158 m2 g−1 for CSM, 161 and 234 m2 g−1 for WCSM and 229 and 275 m2 g−1 for CSPI, respectively (Table 3). These values were higher than the range of 100–150 m2 g−1 for oil-rich cottonseed products [13], but similar to those of texturized soy protein with the values between 163 and 260 m2 g−1 at 10 and 40 °C [52]. As a large surface area of some biopolymers is due to the existence of intrinsic micro porous structures in the material [50], our cottonseed products were probably similar with a higher porosity than those oil-rich cottonseed products [13].
3.4. Thermodynamic Properties
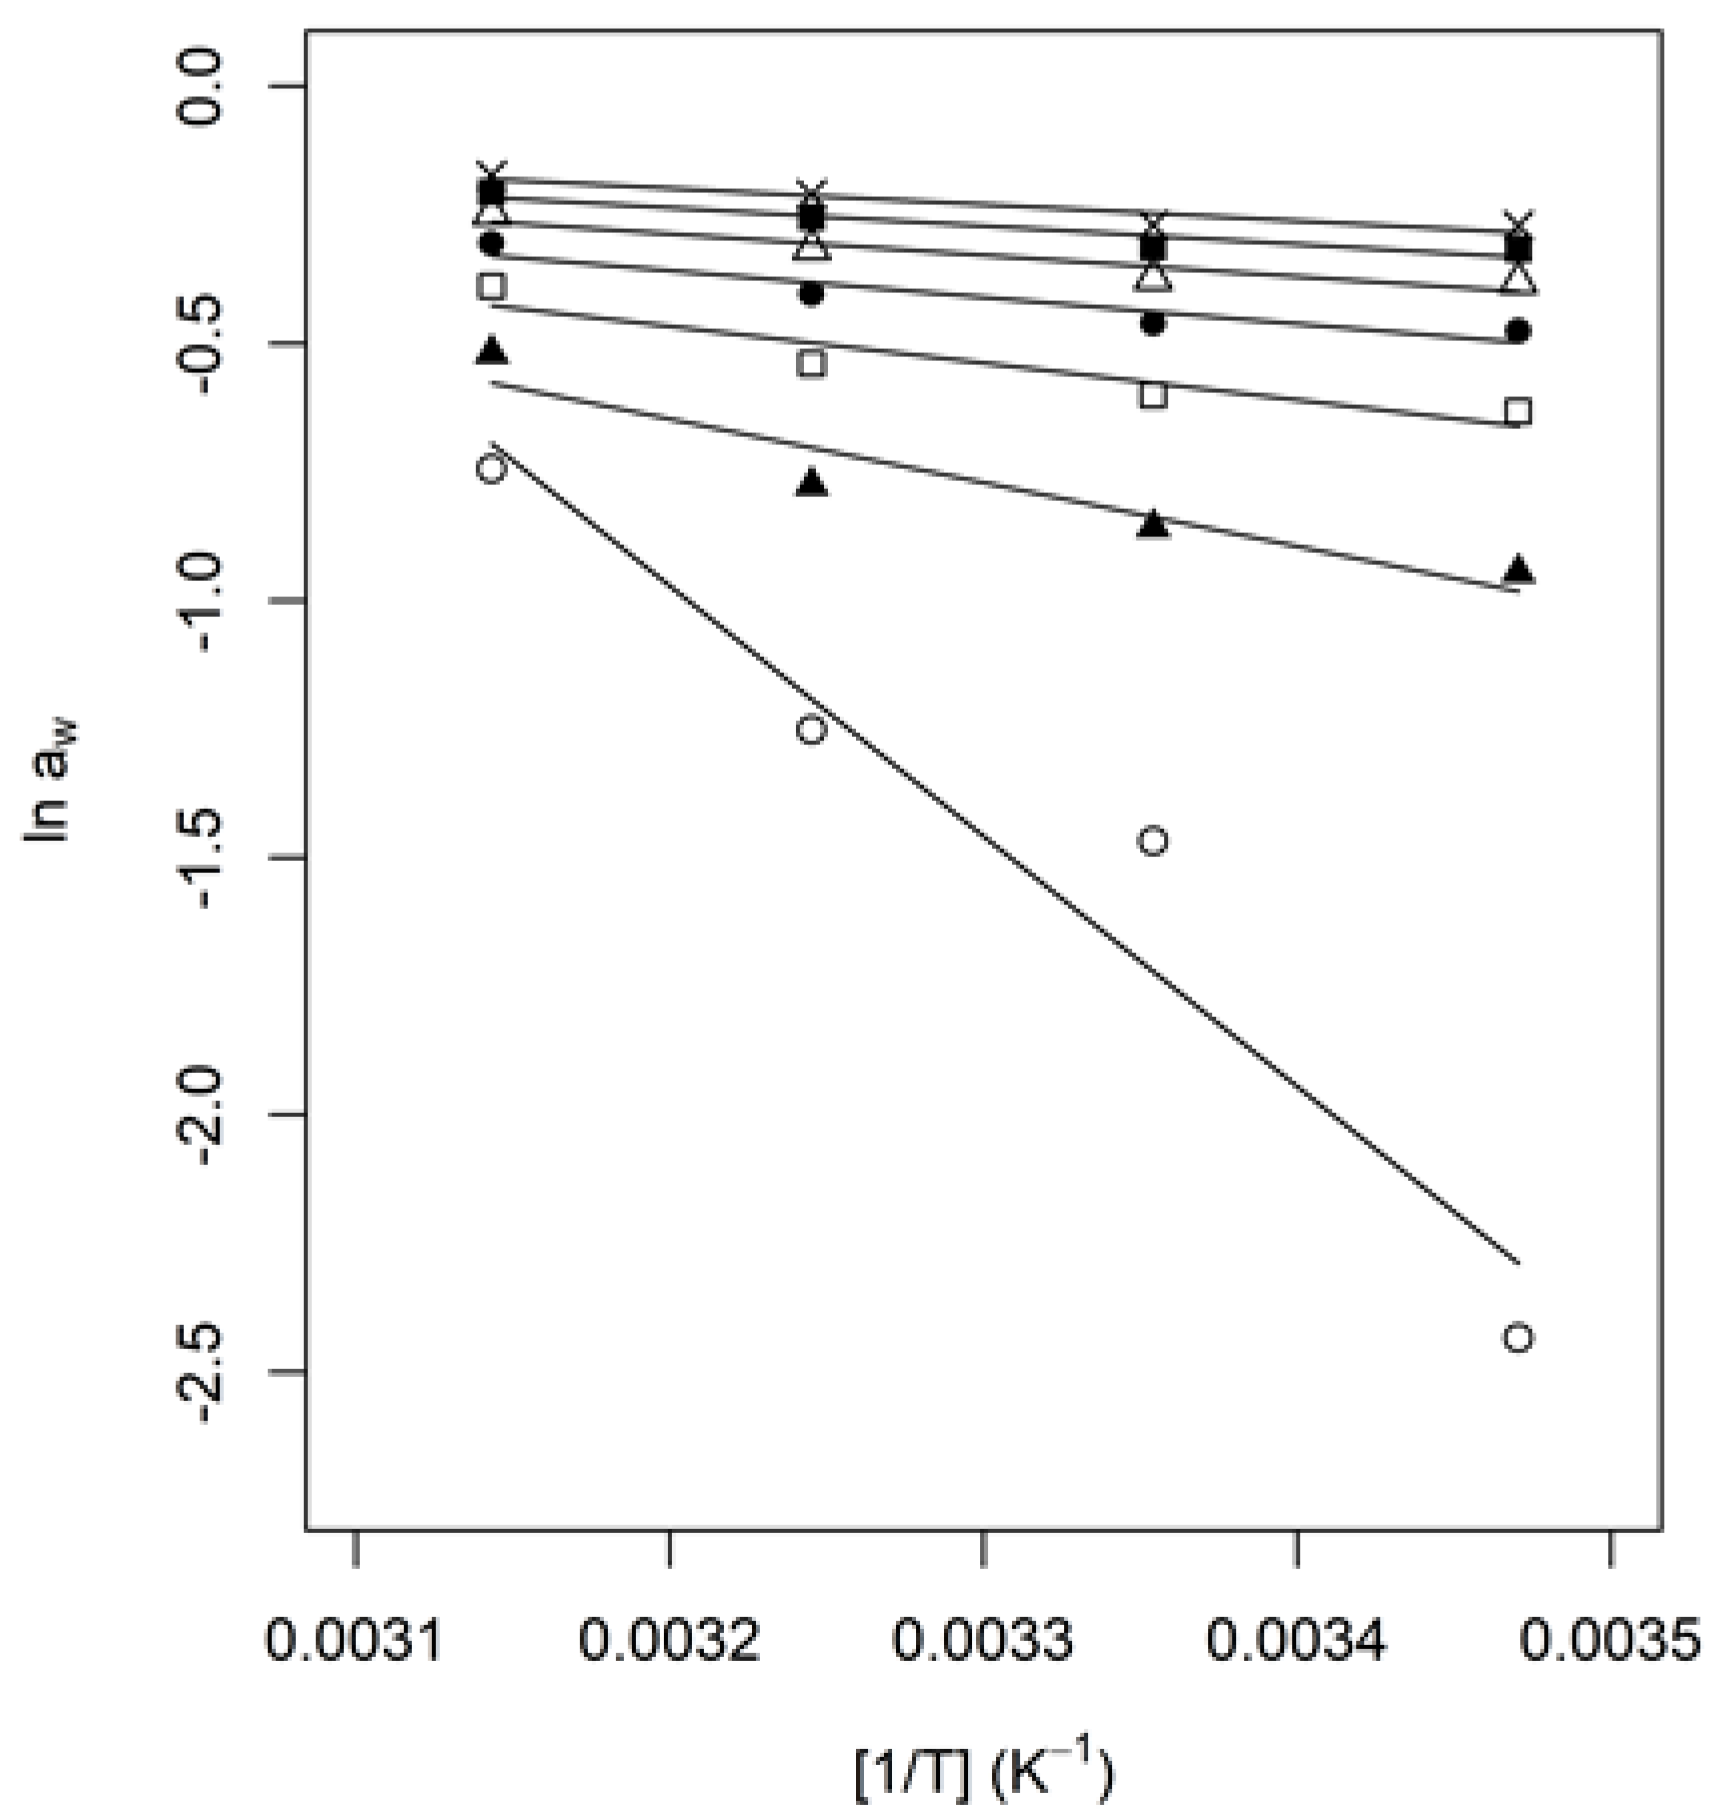
Knowledge of the magnitude of the heat of sorption, at a specific moisture content, provides an indication of the state of the sorbed water and, hence, a measure of the physical, chemical and microbiological stability of the biomaterial under given storage conditions [13]. Thus, the aw data generated using the G.A.B. model was used to calculate the isosteric heat of sorption and sorption entropy. The net isosteric heat of adsorption, qst (defined as qst = Qst − ΔHvap, where Qst is the isosteric heat of adsorption and ΔHvap is the heat of water vaporization), can be calculated using the Clausius-Clapeyron equation [53], which is able to predict the effect of T on aw once qst is known [44,54]:
where T is the temperature and R is the universal gas constant.
Hereby, the values of for moisture contents 5–17% were calculated using the G.A.B. model determined from the data fitting. Then, the values of qst were obtained by plotting ln aw against 1/T (Figure 2). From the ln aw and 1/T plot, the differential entropy (Sd) was determined using the following equation:
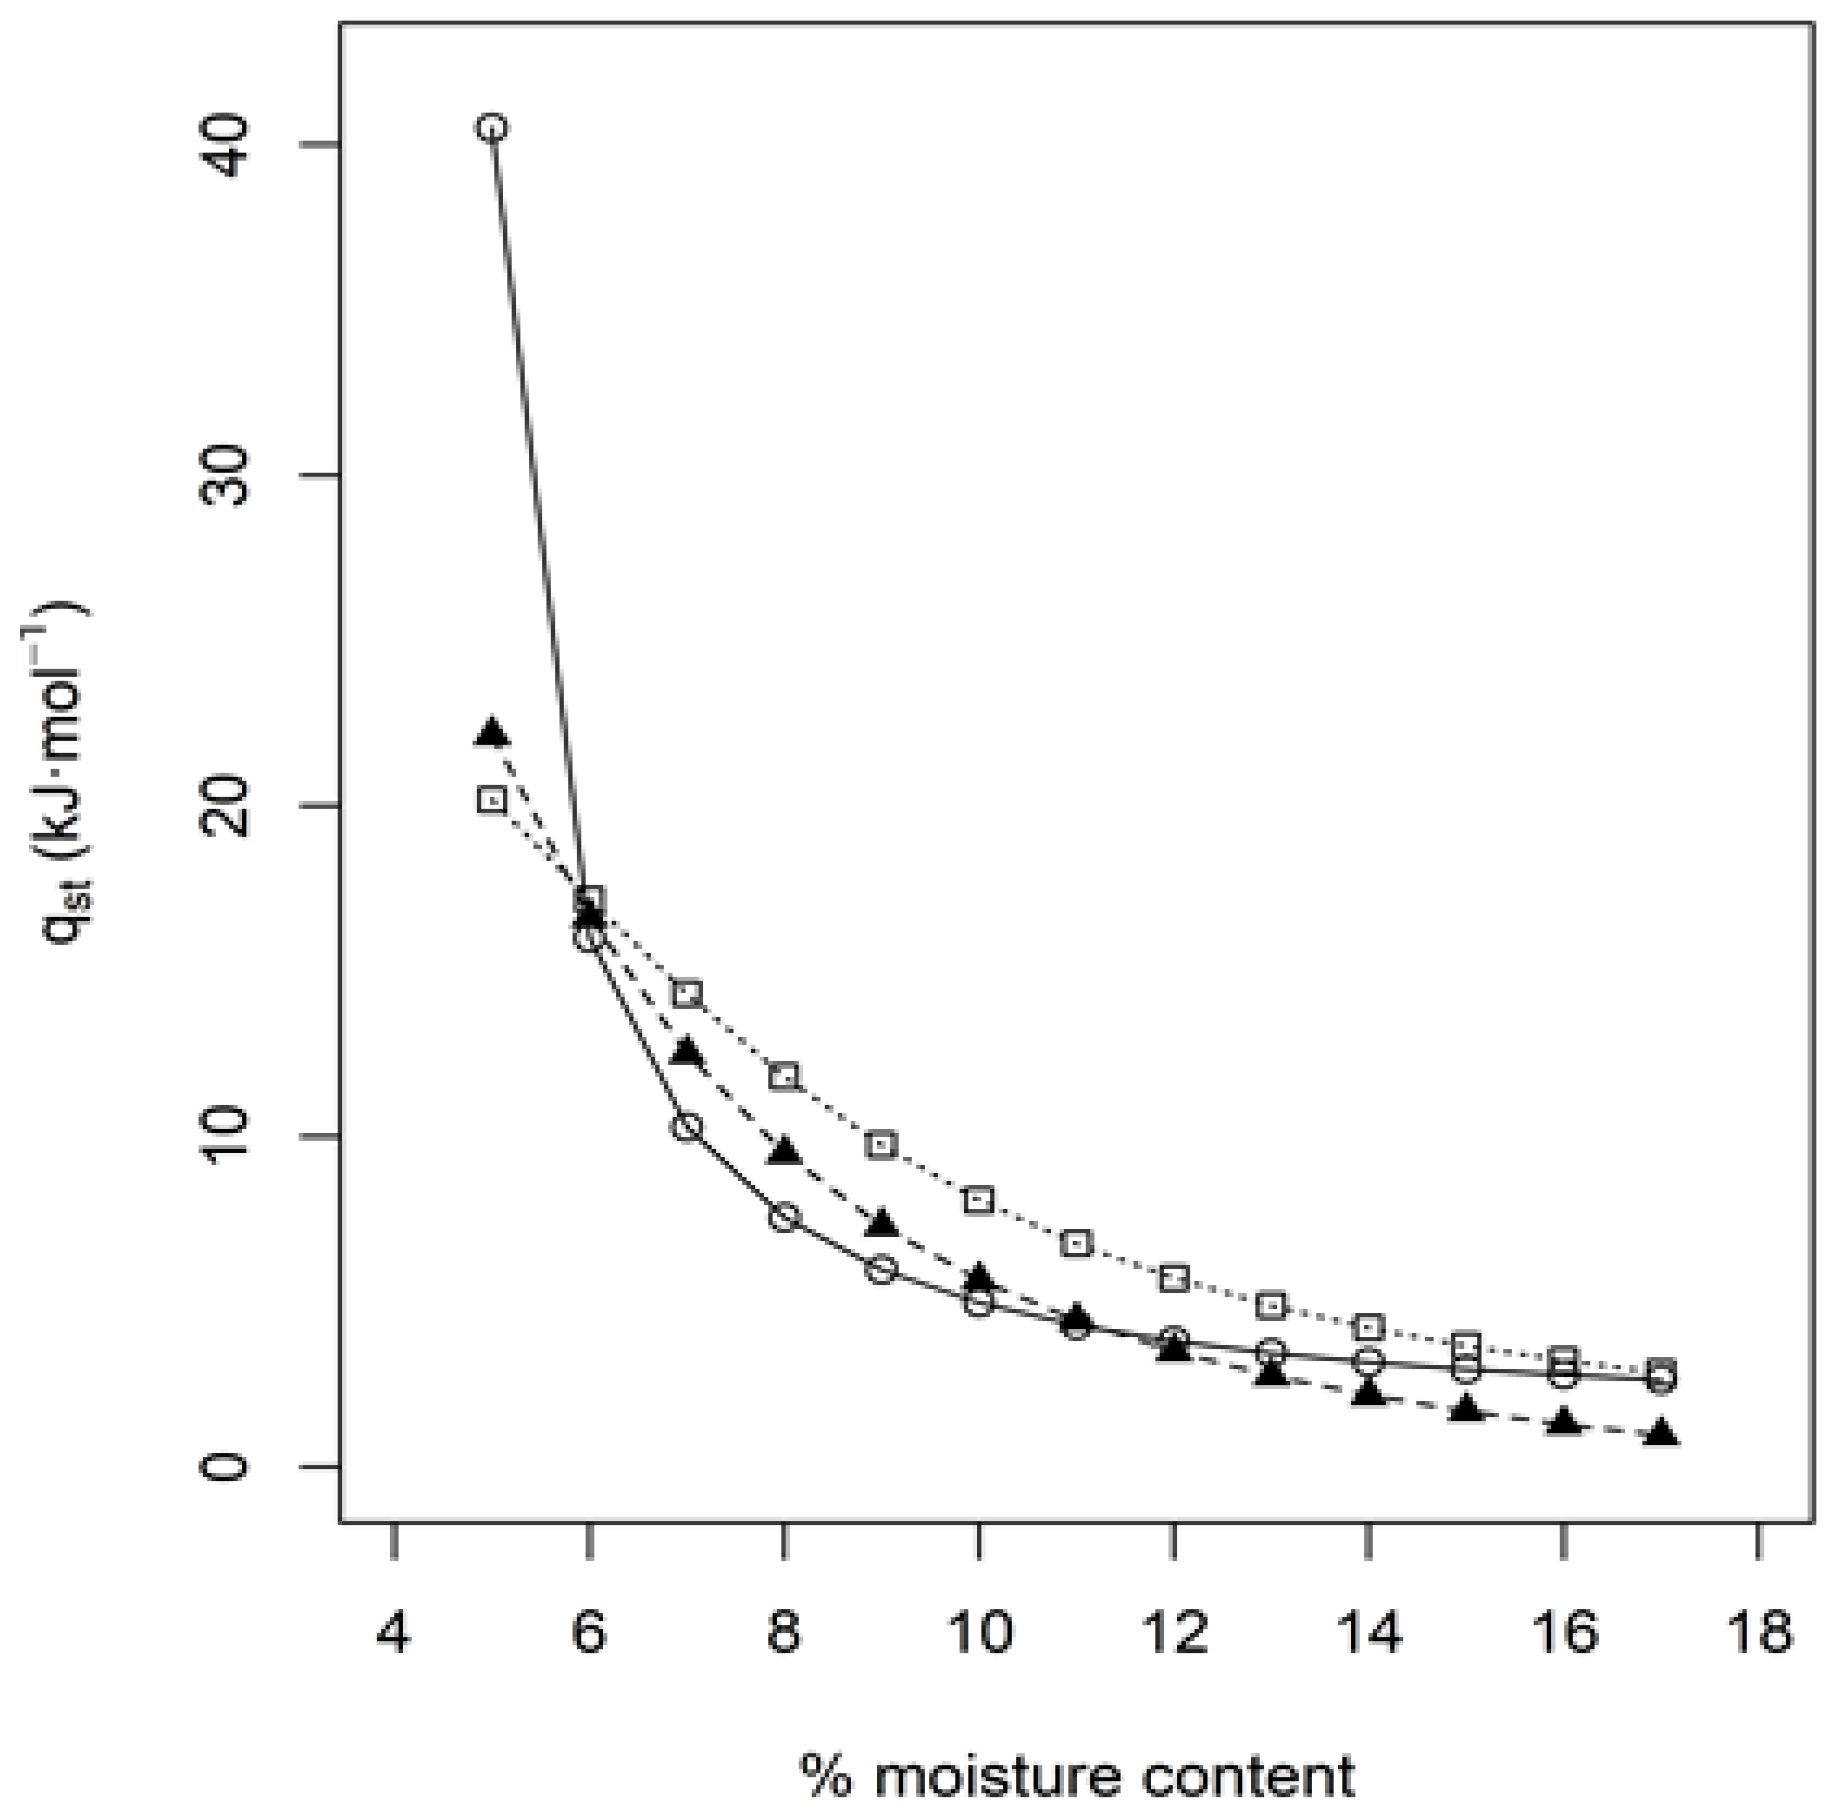
Figure 3 shows the variation in net isosteric heat of sorption qst with moisture contents. It is obvious that net isosteric heat of sorption shows a negative dependence on moisture content in all three products. The net isosteric heat of adsorption decreased with increasing moisture content, initially rapidly, then continued to decrease slowly, and gradually reached near to a constant level. Indeed, the change trends of the curves in Figure 3 were similar to those of oil-rich cottonseed products in literature [13]. The high net isosteric heat of adsorption values at low moisture contents should be an indicator of strong water–surface interactions in those cottonseed products independent of oil content. In other words, in the early stages of adsorption, many polar active sites exist on these cottonseed product surfaces, and as water molecules were attached to these sites as a monolayer, the energy required for removing water was very high. However, with increased moisture content the affinity of the molecules for the sample was reduced so that the sorption isosteric heat was decreased [19]. Furthermore, because the isosteric heat of sorption nearly reached zero, the influence of the adsorbent on the adsorbed molecules should be considered negligible. In such a case, additional sorbed water molecules represent those ‘free water’ molecules available for microbial organisms [50].
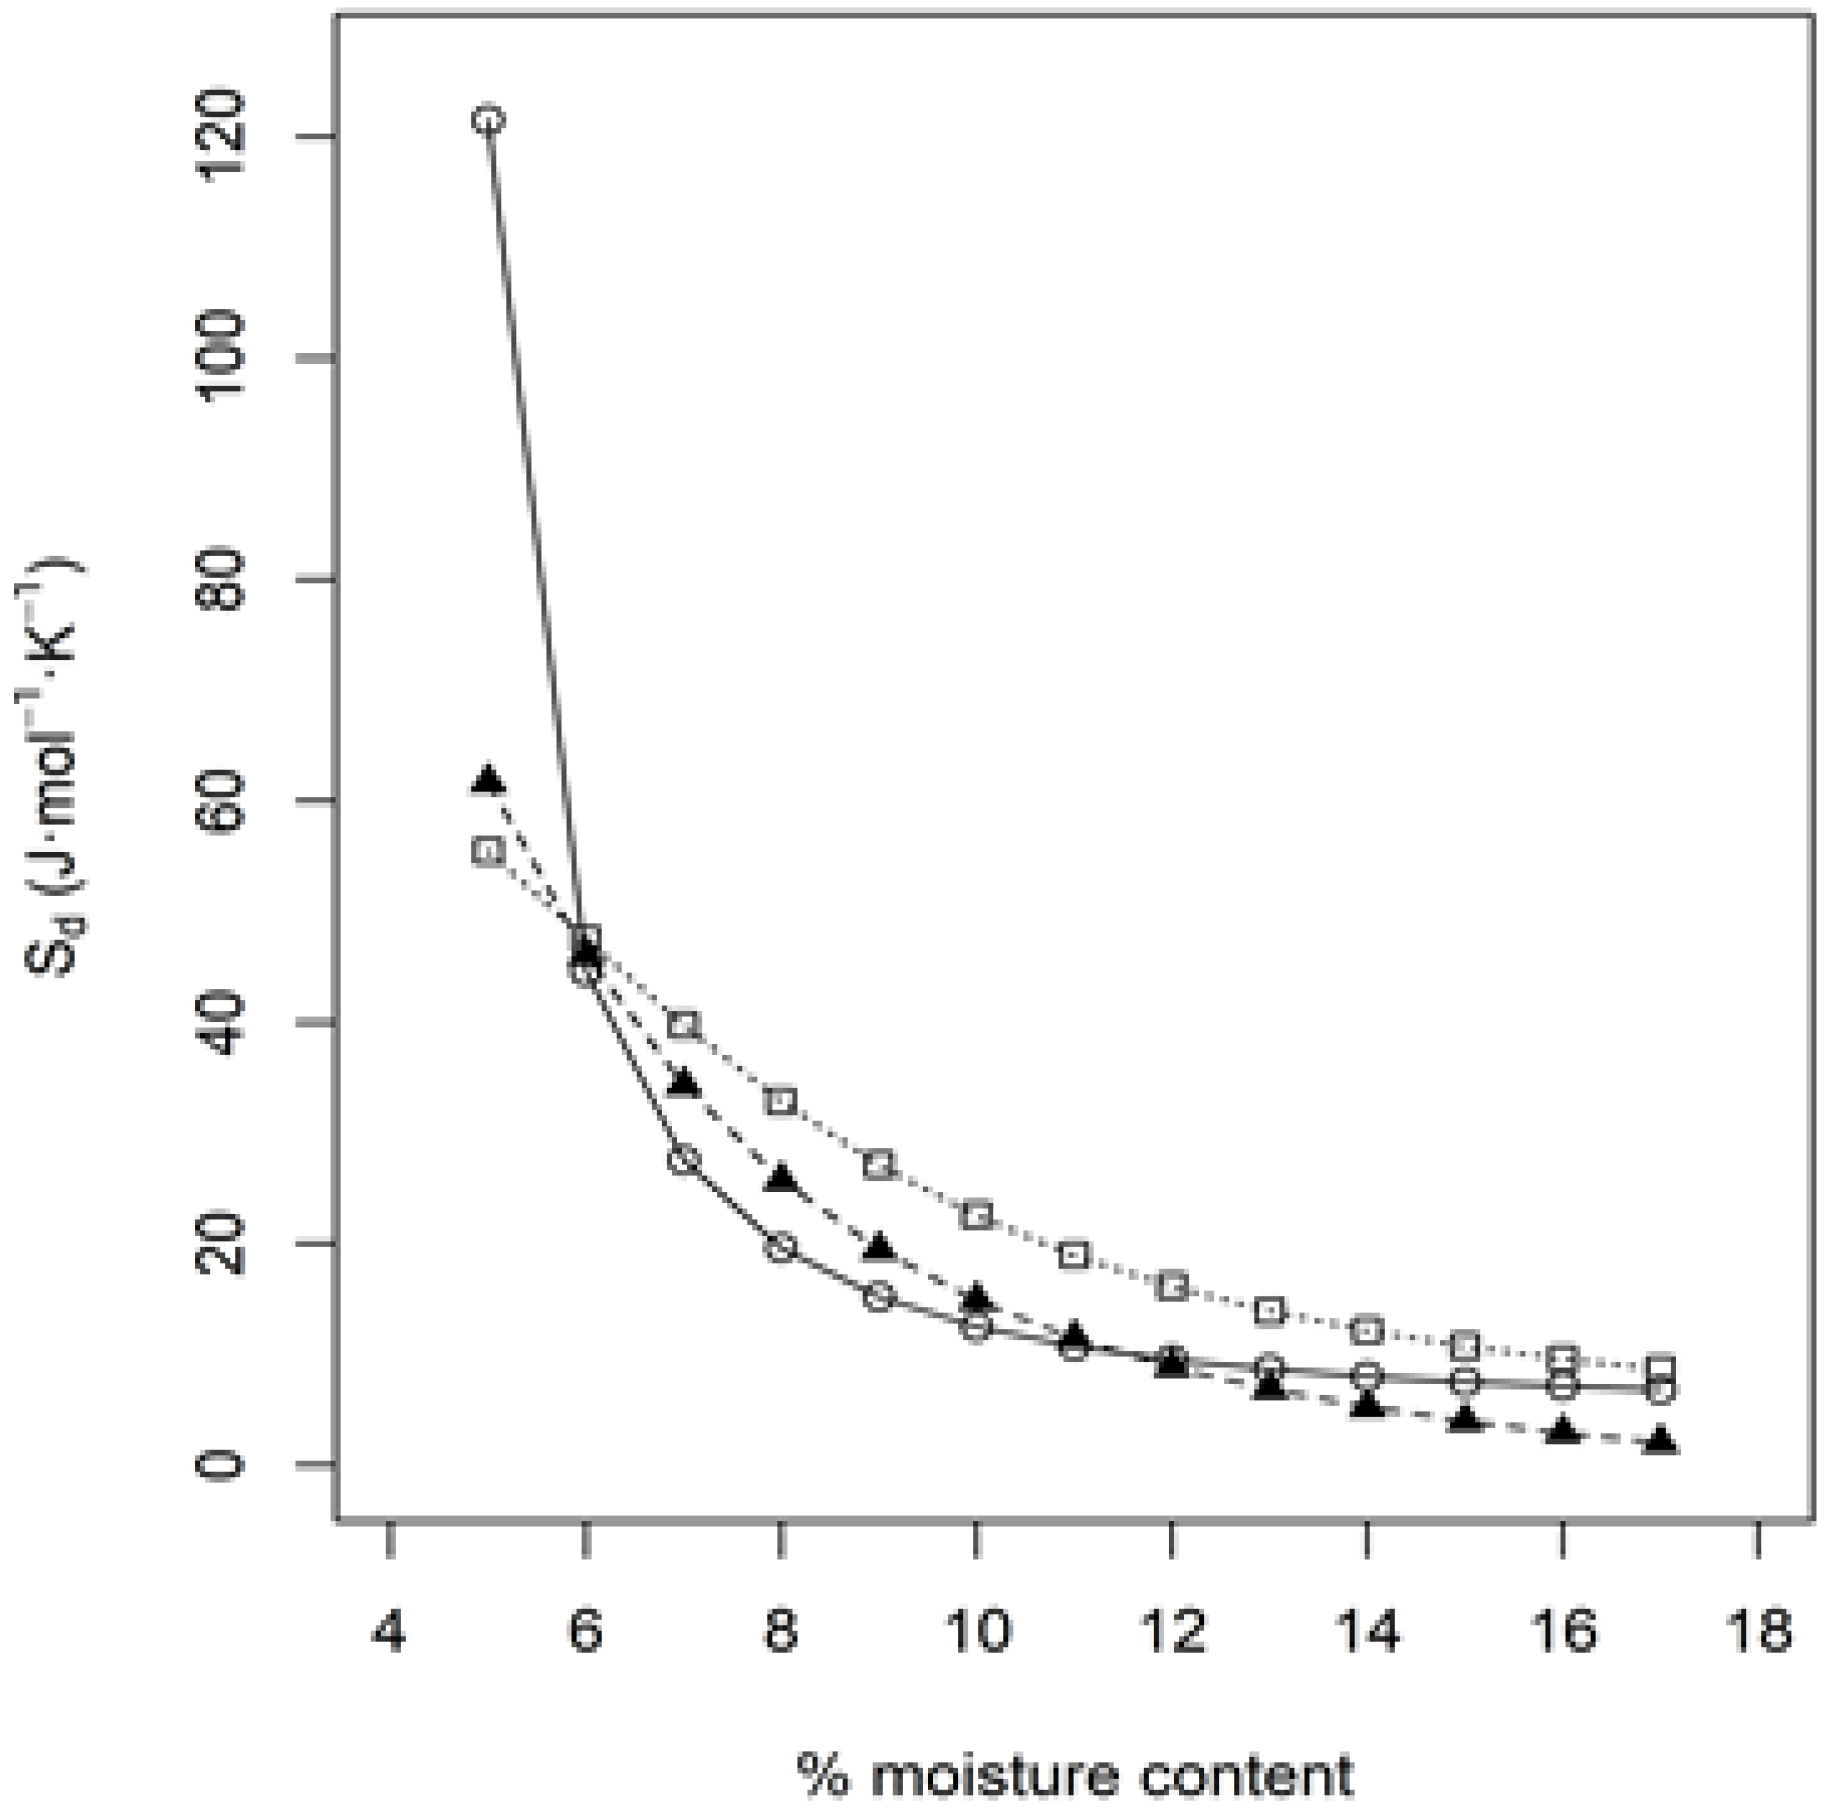
Finally, the entropy values obtained at the four experimental temperatures were plotted against the respective moisture content of CSM, WCSM and CSPI (Figure 4). The results show that entropy was also strongly dependent on the moisture content. Similar trends in sorption entropy have been previously reported in other natural products [19,46]. However, the altered entropy trend of non-defatted whole cottonseed kernel and protein isolate was in an increasing mode at the lower moisture contents (6%) [13].
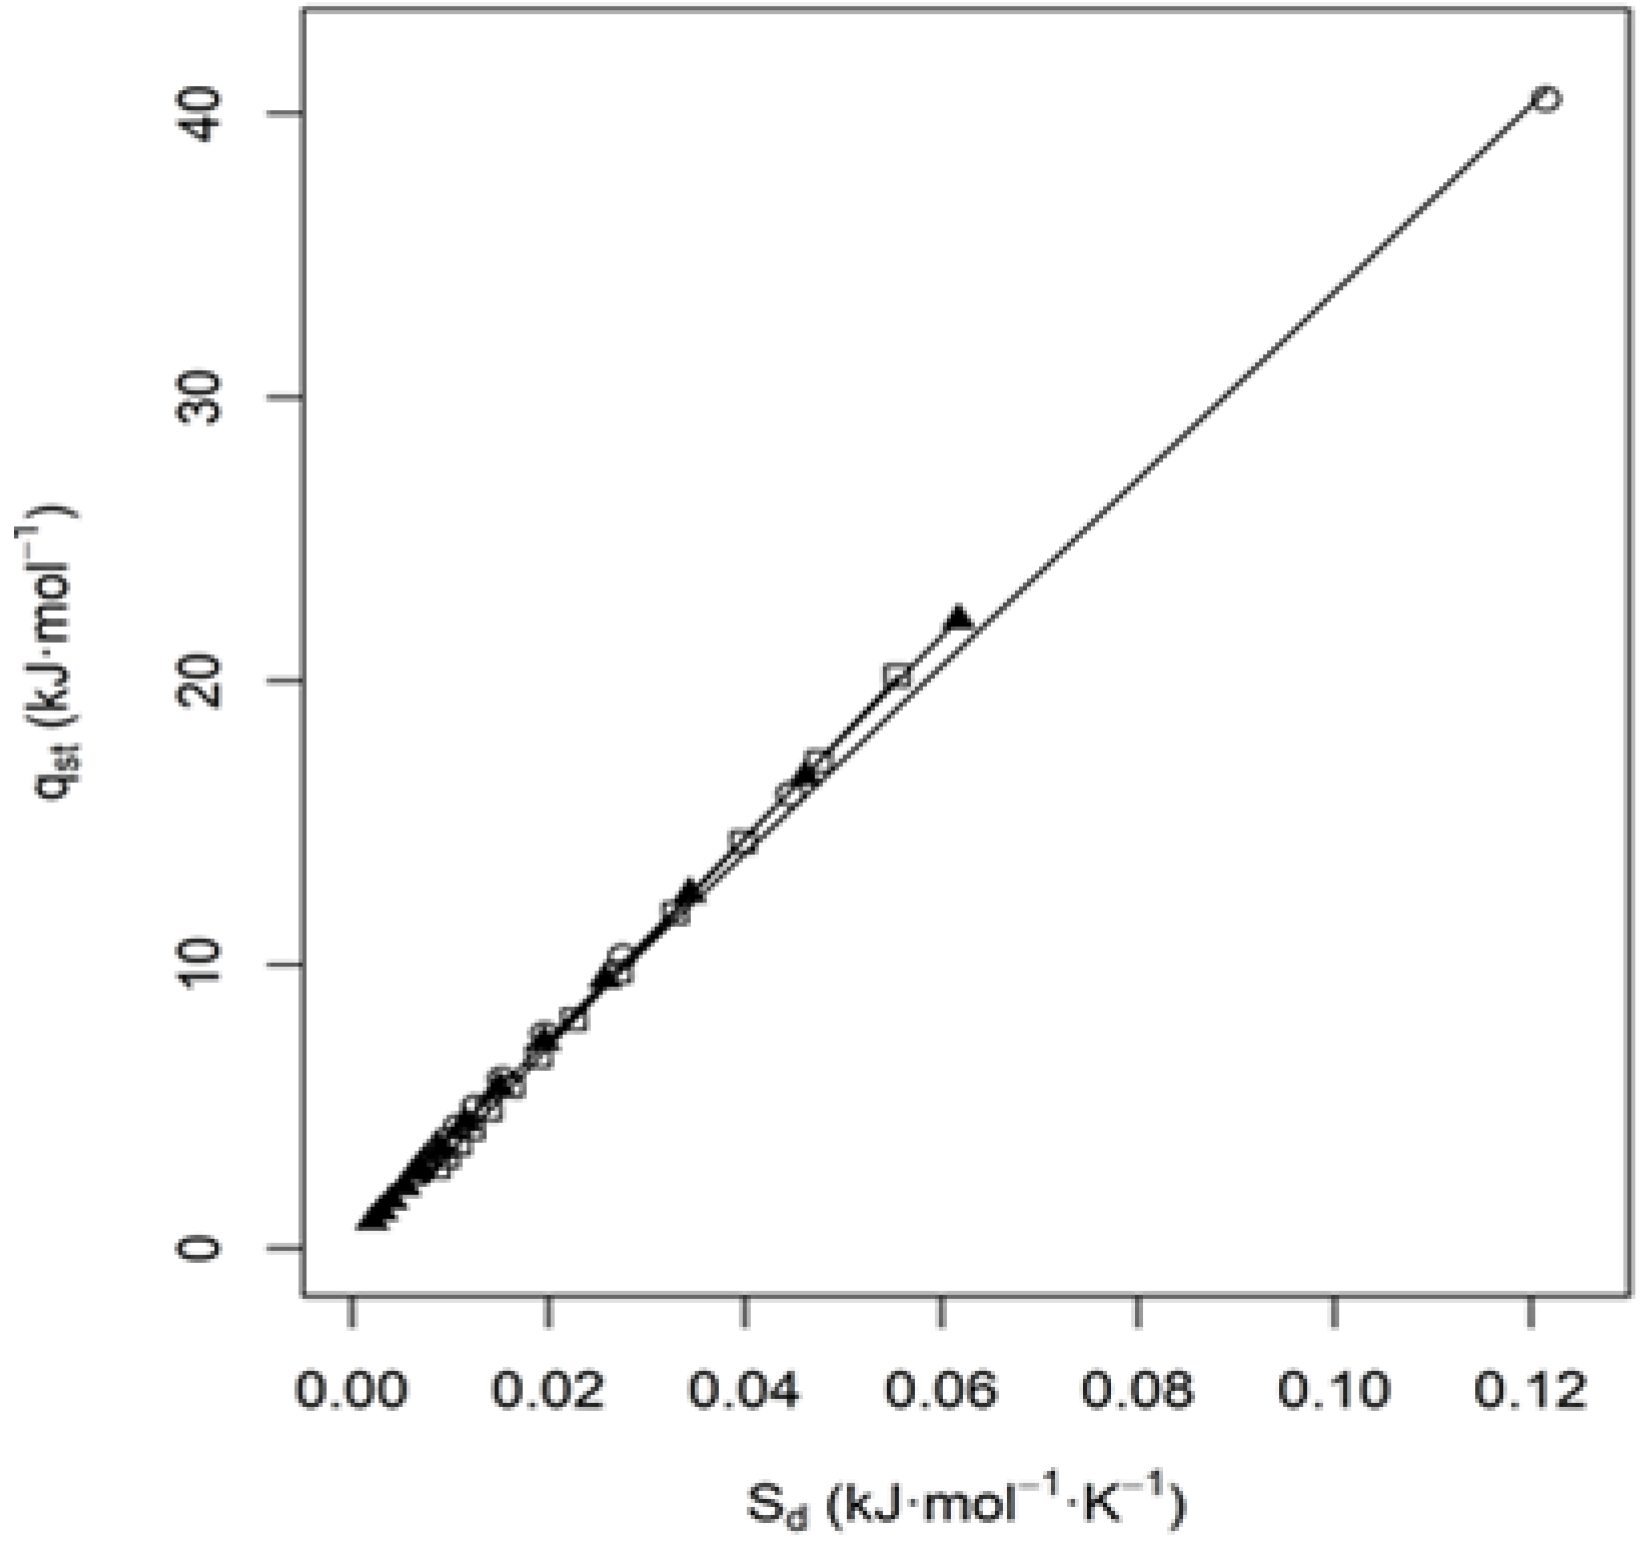
3.5. Entropy—Enthalpy Compensation Theory
The enthalpy—entropy compensation theory is described by the linear equation [55,56]:
where is the isokinetic temperature with an important physical meaning as it represents the temperature at which all reactions in the series proceed at the same rate and α is a constant [13]. McMinn et al. [55] reported that the moisture sorption phenomena of starchy materials are enthalpy-controlled (isokinetic temperature (Tβ) > harmonic mean temperature (Thm)) and spontaneous (−ΔG). The qst and Sd values of three cottonseed types from Figure 3 and Figure 4 were plotted against each other to confirm the compensation theory. The plot showed a linear relationship between enthalpy and entropy for all three cottonseed types (Figure 5) with high R square values > 0.999, thus indicating suitability of the compensation theory. From these plots, the isokinetic temperature (Tβ) and constant α were determined (Table 4) [50]. The values of Tβ were 329.7, 354.2 and 368.0 K for CSM, WCSM and CSPI, respectively. This value was compared to the harmonic mean temperature (Thm) to test for true compensation. With the tested four temperatures, Thm was calculated as 302.7 K [13]. As Thm was remarkably different from the value of Tβ, the isokinetic theory is suitable for water adsorption of these defatted cottonseed products.
As all three Tβ values were greater than Thm, the moisture sorptions of cottonseed meal, washed cottonseed meal and cottonseed protein isolate were considered as the enthalpy driven processes. However, the Tβ values of our defatted cottonseed products were lower than those of un-defatted whole cottonseed, its kernel and protein products reported by Tunc and Duman [13]. Apparently, the oil components contributed to the difference [57].
4. Conclusions
The adsorption isotherms of defatted cottonseed meal (CSM), water washed cottonseed meal (WCSM) and protein isolate (CSPI) were determined and the data were analyzed using the 13 models. It was found that the G.A.B. model was most suitable for all three products in describing the adsorption isotherms in the temperature range of 15–45 °C. When the moisture contents of the samples were compared at a constant temperature, the general trend of decreasing moisture content was in the order of CSPI < WCSM < CSM for water activity <0.6, but the trend reversed to the order of CSM < WCSM < CSPI for water activity >0.6. In general, biochemical and microbiological reactions in a food system can be inhibited and the deterioration of the product prevented when water activity is <0.6, and an increase in aw equivalent to an increase of Mo by 0.1 units decreases the shelf life of a food product by a factor of 2–3 [46]. Thus, safe storage moisture content of around 8% could be suggested for these products at room temperatures (around 25 °C), but the moisture content should be kept below 5% when exposed to 45 °C conditions, to have a final aw below 0.60 to ensure their safety and quality.
There were fewer interactions between water molecules and CSPI or WCSM, but the multilayer of water adsorbed on CSM possessed the properties of bulk water. The moisture adsorption of all three products was an enthalpy-controlled process, rather than entropy. These data indicated that the energy/heating balance for storage facility designs should be taken in consideration differently for the three products.
Supplementary Materials
The following are available online at https://0-www-mdpi-com.brum.beds.ac.uk/article/10.3390/foundations1010005/s1, Figure S1: Apparatus illustration for the sorption isotherm measurement., Table S1: Salts and the water activities (aw) of their saturated salt solutions at different temperatures, Table S2: The results of two-factor ANOVA with replication (n = 2), Table S3: The six sorption isotherm models better fitting the experimental data of defatted cottonseed products.
Author Contributions
Project conceptualization, Z.H.; methodology and investigation, Z.H., D.Z., H.N.C.; writing—original draft preparation, Z.H.; writing—review and editing, Z.H., D.Z., H.N.C. All authors have read and agreed to the published version of the manuscript.
Funding
This research received no external funding.
Institutional Review Board Statement
Not applicable.
Informed Consent Statement
Not applicable.
Data Availability Statement
The data presented in this study are available upon request from the corresponding author.
Acknowledgments
This research was funded internally by USDA-ARS NP 306 Product Quality and New Uses project “Development of Novel Cottonseed Products and Processes”. DH was supported by USDA-ARS Summer Student Program. Mention of trade names or commercial products in this publication is solely for the purpose of providing specific information and does not imply recommendation or endorsement by the U.S. Department of Agriculture. USDA is an equal opportunity provider and employer.
Conflicts of Interest
The authors declare no conflict of interest.
References
- He, Z.; Zhang, H.; Fang, D.D.; Zeng, L.; Jenkins, J.N.; McCarty, J.C. Effects of inter-species chromosome substitution on cottonseed mineral and protein nutrition profiles. Agron. J. 2020, 112, 3963–3974. [Google Scholar] [CrossRef]
- Tewolde, H.; Shankle, M.W.; Way, T.R.; Pote, D.H.; Sistani, K.R.; He, Z. Poultry litter band placement affects accessibility and conservation of nutrients and cotton yield. Agron. J. 2018, 110, 675–684. [Google Scholar] [CrossRef]
- Amin, A.; Nasim, W.; Mubeen, M.; Ahmad, A.; Nadeem, M.; Urich, P.; Fahad, S.; Ahmad, S.; Wajid, A.; Tabassum, F. Simulated csm-cropgro-cotton yield under projected future climate by simclim for southern punjab, pakistan. Agric. Syst. 2018, 167, 213–222. [Google Scholar] [CrossRef]
- Basal, H.; Karademir, E.; Goren, H.K.; Sezener, V.; Dogan, M.N.; Gencsoylu, I.; Erdogan, O. Cotton production in turkey and europe. In Cotton Production; Jabran, K., Chauhan, B.S., Eds.; John Wiley & Son, Inc.: New York, NY, USA, 2019; pp. 297–321. [Google Scholar]
- Zhang, G.; Zhang, W.; Pu, X.; Zhang, P.; Ou, Y. Influence of stalk residue retention and fertilization on the rhizospheric effect with drip-irrigated cotton. Agron. J. 2019, 111, 1028–1038. [Google Scholar] [CrossRef]
- He, Z.; Mattison, C.P.; Zhang, D.; Grimm, C.C. Vicilin and legumin storage proteins are abundant in water and alkali soluble protein fractions of glandless cottonseed. Sci. Rep. 2021, 11, 9209. [Google Scholar] [CrossRef]
- Windeatt, J.H.; Ross, A.B.; Williams, P.T.; Forster, P.M.; Nahil, M.A.; Singh, S. Characteristics of biochars from crop residues: Potential for carbon sequestration and soil amendment. J. Environ. Manag. 2014, 146, 189–197. [Google Scholar] [CrossRef]
- He, Z.; Uchimiya, S.M.; Guo, M. Production and characterization of biochar from agricultural by-products: Overview and use of cotton biomass residues. In Agricultural and Environmental Applications of Biochar: Advances and Barriers; Guo, M., He, Z., Uchimiya, S.M., Eds.; Soil Science Society of America, Inc.: Madison, WI, USA, 2016; pp. 63–86. [Google Scholar]
- Al Afif, R.; Anayah, S.S.; Pfeifer, C. Batch pyrolysis of cotton stalks for evaluation of biochar energy potential. Renew. Energy 2020, 147, 2250–2258. [Google Scholar] [CrossRef] [Green Version]
- Cheng, H.N.; He, Z.; Ford, C.; Wyckoff, W.; Wu, Q. A review of cottonseed protein chemistry and non-food applications. Sustain. Chem. 2020, 1, 17. [Google Scholar] [CrossRef]
- He, Z.; Olk, D.C.; Tewolde, H.; Zhang, H.; Shankle, M. Carbohydrate and amino acid profiles of cotton plant biomass products. Agriculture 2020, 10, 2. [Google Scholar] [CrossRef] [Green Version]
- Rojo-Gutiérrez, E.; Buenrostro-Figueroa, J.; López-Martínez, L.; Sepúlveda, D.; Baeza-Jiménez, R. Biotechnological potential of cottonseed, a by-product of cotton production. In Valorisation of Agro-Industrial Residues–Volume II: Non-Biological Approaches; Springer: Berlin, Germany, 2020; pp. 63–82. [Google Scholar]
- Tunc, S.; Duman, O. Thermodynamic properties and moisture adsorption isotherms of cottonseed protein isolate and different forms of cottonseed samples. J. Food Eng. 2007, 81, 133–143. [Google Scholar] [CrossRef]
- He, Z.; Cheng, H.N. Preparation and utilization of water washed cottonseed meal as wood adhesives. In Bio-Based Wood Adhesives: Preparation, Characterization and Testing; He, Z., Ed.; CRC Press: Boca Raton, FL, USA, 2017; pp. 156–178. [Google Scholar]
- Swiatkiewicz, S.; Arczewska-Wlosek, A.; Jozefia, D. The use of cottonseed meal as a protein source for poultry: An updated review. World Poult. Sci. J. 2016, 72, 473–484. [Google Scholar] [CrossRef]
- Kumar, M.; Tomar, M.; Punia, S.; Grasso, S.; Arrutia, F.; Choudhary, J.; Singh, S.; Verma, P.; Mahapatra, A.; Patil, S. Cottonseed: A sustainable contributor to global protein requirements. Trends Food Sci. Technol. 2021, 111, 100–113. [Google Scholar] [CrossRef]
- Alpizar-Reyes, E.; Castaño, J.; Carrillo-Navas, H.; Alvarez-Ramírez, J.; Gallardo-Rivera, R.; Pérez-Alonso, C.; Guadarrama-Lezama, A. Thermodynamic sorption analysis and glass transition temperature of faba bean (Vicia faba L.) protein. J. Food Sci. Technol. 2018, 55, 935–943. [Google Scholar] [CrossRef]
- Jian, F.; Jayas, D.S.; Fields, P.G.; White, N.D. Water sorption and cooking time of red kidney beans (Phaseolus vulgaris L.): Part ii–mathematical models of water sorption. Int. J. Food Sci. Technol. 2017, 52, 2412–2421. [Google Scholar] [CrossRef]
- Soleimanifard, S.; Hamdami, N. Modelling of the sorption isotherms and determination of the isosteric heat of split pistachios, pistachio kernels and shells. Czech J. Food Sci. 2018, 36, 268–275. [Google Scholar] [CrossRef]
- Taitano, L.; Singh, R.; Lee, J.; Kong, F. Thermodynamic analysis of moisture adsorption isotherms of raw and blanched almonds. J. Food Process Eng. 2012, 35, 840–850. [Google Scholar] [CrossRef]
- Arslan-Tontul, S. Moisture sorption isotherm, isosteric heat and adsorption surface area of whole chia seeds. LWT 2020, 119, 108859. [Google Scholar] [CrossRef]
- Moussaoui, H.; Kouhila, M.; Lamsyehe, H.; Idlimam, A.; Lamharrar, A. Moisture sorption measurements and thermophysical characterization of the taraxacum officinale leaves and root. Heat Mass Transfer 2020, 56, 2065–2077. [Google Scholar] [CrossRef]
- Abdenouri, N.; Idlimam, A.; Kouhila, M. Sorption isotherms and thermodynamic properties of powdered milk. Chem. Eng. Comm. 2010, 197, 1109–1125. [Google Scholar] [CrossRef]
- Hssaini, L.; Ouaabou, R.; Charafi, J.; Idlimam, A.; Lamharrar, A.; Razouk, R.; Hanine, H. Hygroscopic proprieties of fig (Ficus carica L.): Mathematical modelling of moisture sorption isotherms and isosteric heat kinetics. South Afr. J. Bot. 2020, in press. [Google Scholar] [CrossRef]
- Miranda, M.; Vega-Galvez, A.; Sanders, M.; Lopez, J.; Lemus-Mondaca, R.; Martinez, E.; Di Scala, K. Modelling the water sorption isotherms of quinoa seeds (Chenopodium quinoa willd.) and determination of sorption heats. Food Bioprocess Technol. 2012, 5, 1686–1693. [Google Scholar] [CrossRef]
- Boudhrioua, N.; Bahloul, N.; Kouhila, M.; Kechaou, N. Sorption isotherms and isosteric heats of sorption of olive leaves (Chemlali variety): Experimental and mathematical investigations. Food Bioprod. Process. 2008, 86, 165–167. [Google Scholar]
- Chen, N.; Huang, J.; Li, K. Investigation of a formaldehyde-free cottonseed flour-based adhesive for interior plywood. BioResources 2020, 15, 5546–5557. [Google Scholar]
- Li, J.; Pradyawong, S.; He, Z.; Sun, X.S.; Wang, D.; Cheng, H.N.; Zhong, J. Assessment and application of phosphorus/calcium-cottonseed protein adhesive for plywood production. J. Clean. Prod. 2019, 229, 454–462. [Google Scholar] [CrossRef]
- Liu, M.; Wang, Y.; Wu, Y.; He, Z.; Wan, H. “Greener” adhesives composed of urea-formaldehyde resin and cottonseed meal for wood-based composites. J. Clean. Prod. 2018, 187, 361–371. [Google Scholar] [CrossRef]
- He, Z.; Chiozza, F. Adhesive strength of pilot-scale-produced water-washed cottonseed meal in comparison with a synthetic glue for non-structural interior application. J. Mater. Sci. Res. 2017, 6, 20–26. [Google Scholar] [CrossRef] [Green Version]
- He, Z.; Chapital, D.C.; Cheng, H.N.; Klasson, K.T.; Olanya, M.O.; Uknalis, J. Application of tung oil to improve adhesion strength and water resistance of cottonseed meal and protein adhesives on maple veneer. Ind. Crop. Prod. 2014, 61, 398–402. [Google Scholar] [CrossRef]
- Li, J.; Pradyawong, S.; Sun, X.S.; Wang, D.; He, Z.; Zhong, J.; Cheng, H.N. Improving adhesion performance of cottonseed protein by the synergy of phosphoric acid and water soluble calcium salts. Int. J. Adhes. Adhes. 2021, 108, 102867. [Google Scholar] [CrossRef]
- He, Z.; Klasson, K.T.; Wang, D.; Li, N.; Zhang, H.; Zhang, D.; Wedegaertner, T.C. Pilot-scale production of washed cottonseed meal and co-products. Mod. Appl. Sci. 2016, 10, 25–33. [Google Scholar] [CrossRef] [Green Version]
- Aviara, N.A. Moisture sorption isotherms and isotherm model performance evaluation for food and agricultural products. In Sorption in 2020s; IntechOpen: London, UK, 2020; p. 145. [Google Scholar]
- Bakhtavar, M.A.; Afzal, I.; Basra, S.M.A. Moisture adsorption isotherms and quality of seeds stored in conventional packaging materials and hermetic super bag. PLoS ONE 2019, 14, e0207569. [Google Scholar] [CrossRef] [Green Version]
- Basu, S.; Shivhare, U.; Mujumdar, A. Models for sorption isotherms for foods: A review. Dry. Technol. 2006, 24, 917–930. [Google Scholar] [CrossRef]
- Kaya, S.; Kahyaoglu, T. Thermodynamic properties and sorption equilibrium of pestil. J. Food Eng. 2005, 71, 200–207. [Google Scholar] [CrossRef]
- Mallek-Ayadi, S.; Bahloul, N.; Kechaou, N. Mathematical modelling of water sorption isotherms and thermodynamic properties of cucumis melo l. Seeds. LWT 2020, 131, 109727. [Google Scholar] [CrossRef]
- Sharma, P.; Singh, R.; Singh, A.; Patel, A.; Patil, G. Sorption isotherms and thermodynamics of water sorption of ready-to-use basundi mix. LWT 2009, 42, 441–445. [Google Scholar] [CrossRef]
- Verbeek, C.J.; Koppel, N.J. Moisture sorption and plasticization of bloodmeal-based thermoplastics. J. Mater. Sci. 2012, 47, 1187–1195. [Google Scholar] [CrossRef]
- Kristo, E.; Biliaderis, C.G. Water sorption and thermo-mechanical properties of water/sorbitol-plasticized composite biopolymer films: Caseinate–pullulan bilayers and blends. Food Hydrocoll. 2006, 20, 1057–1071. [Google Scholar] [CrossRef]
- He, Z.; Cheng, H.N.; Olanya, O.M.; Uknalis, J.; Zhang, X.; Koplitz, B.D.; He, J. Surface characterization of cottonseed meal products by sem, sem-eds, xrd and xps analysis. J. Mater. Sci. Res. 2018, 7, 28–40. [Google Scholar] [CrossRef] [Green Version]
- He, Z.; Uchimiya, M.; Cao, H. Intrinsic fluorescence excitation-emission matrix spectral features of cottonseed protein fractions and the effects of denaturants. J. Am. Oil Chem. Soc. 2014, 91, 1489–1497. [Google Scholar] [CrossRef]
- Corrêa, P.; Goneli, A.; Jaren, C.; Ribeiro, D.; Resende, O. Sorption isotherms and isosteric heat of peanut pods, kernels and hulls. Food Sci. Technol. Int. 2007, 13, 231–238. [Google Scholar] [CrossRef]
- Furmaniak, S.; Terzyk, A.P.; Gołembiewski, R.; Gauden, P.A.; Czepirski, L. Searching the most optimal model of water sorption on foodstuffs in the whole range of relative humidity. Food Res. Int. 2009, 42, 1203–1214. [Google Scholar] [CrossRef]
- Yogendrarajah, P.; Samapundo, S.; Devlieghere, F.; De Saeger, S.; De Meulenaer, B. Moisture sorption isotherms and thermodynamic properties of whole black peppercorns (Piper nigrum L.). LWT 2015, 64, 177–188. [Google Scholar] [CrossRef] [Green Version]
- Ocieczek, A.; Skotnicka, M.; Baranowska, K. Sorptive properties of modified maize starch as indicators of their quality. Int. Agrophys. 2017, 31, 383–392. [Google Scholar] [CrossRef] [Green Version]
- Timmermann, E.O.; Chirife, J.; Iglesias, H.A. Water sorption isotherms of foods and foodstuffs: Bet and gab parameters. J. Food Eng. 2001, 48, 19–31. [Google Scholar] [CrossRef]
- Ariahu, C.C.; Kaze, S.A.; Achem, C.D. Moisture sorption characteristics of tropical fresh water crayfish (Procam barus clarkia). J. Food Eng. 2005, 75, 355–363. [Google Scholar] [CrossRef]
- Bajpai, S.; Pradeep, T. Studies on equilibrium moisture absorption of kappa carrageenan. Int. Food Res. J. 2013, 20, 2183. [Google Scholar]
- He, Z.; Cheng, H.N.; Chapital, D.C.; Dowd, M.K. Sequential fractionation of cottonseed meal to improve its wood adhesive properties. J. Am. Oil Chem. Soc. 2014, 91, 151–158. [Google Scholar] [CrossRef]
- Cassini, A.S.; Marczak, L.D.F.; Norena, C.P.Z. Water adsorption isotherms of texturized soy protein. J. Food Eng. 2006, 77, 194–199. [Google Scholar] [CrossRef]
- Labuza, T.P. Sorption phenomena in foods. Food Technol. 1968, 22, 263–272. [Google Scholar]
- Labuza, T.; Kaanane, A.; Chen, J. Effect of temperature on the moisture sorption isotherms and water activity shift of two dehydrated foods. J. Food Sci. 1985, 50, 385–392. [Google Scholar] [CrossRef]
- McMinn, W.; Al-Muhtaseb, A.; Magee, T. Enthalpy–entropy compensation in sorption phenomena of starch materials. Food Res. Int. 2005, 38, 505–510. [Google Scholar] [CrossRef]
- Olsson, T.S.; Ladbury, J.E.; Pitt, W.R.; Williams, M.A. Extent of enthalpy–entropy compensation in protein–ligand interactions. Protein Sci. 2011, 20, 1607–1618. [Google Scholar] [CrossRef] [Green Version]
- Bastıoğlu, A.Z.; Koç, M.; Ertekin, F.K. Moisture sorption isotherm of microencapsulated extra virgin olive oil by spray drying. J. Food Measur. Character. 2017, 11, 1295–1305. [Google Scholar] [CrossRef]
Figure 1.
Moisture adsorption isotherms for (A) defatted cottonseed meal (CSM), (B)water washed defatted cottonseed meal (WCSM) and (C)cottonseed protein isolate (CSPI) at 15 °C, 25 °C, 35 °C and 45 °C, respectively. Data are presented in the format of average and standard error (n = 2).
Figure 1.
Moisture adsorption isotherms for (A) defatted cottonseed meal (CSM), (B)water washed defatted cottonseed meal (WCSM) and (C)cottonseed protein isolate (CSPI) at 15 °C, 25 °C, 35 °C and 45 °C, respectively. Data are presented in the format of average and standard error (n = 2).

Figure 2.
The ln aw versus 1/T plots for evaluation of the net isosteric heat of adsorption (qst). Moisture content: 5% (○), 7% (▲), 9% (□), 11% (●), 13% (△), 15% (■) and 17% (☓).
Figure 2.
The ln aw versus 1/T plots for evaluation of the net isosteric heat of adsorption (qst). Moisture content: 5% (○), 7% (▲), 9% (□), 11% (●), 13% (△), 15% (■) and 17% (☓).

Figure 3.
The variation in the net isosteric heat of sorption (qst) with moisture contents (Mo). Sample: defatted cottonseed meal (○), washed defatted cottonseed meal (▲) and cottonseed protein isolate (□).
Figure 3.
The variation in the net isosteric heat of sorption (qst) with moisture contents (Mo). Sample: defatted cottonseed meal (○), washed defatted cottonseed meal (▲) and cottonseed protein isolate (□).

Figure 4.
Entropy (Sd) versus moisture content (Mo) at 5–17% for defatted cottonseed meal (○), washed defatted cottonseed meal (▲) and cottonseed protein isolate (□).
Figure 4.
Entropy (Sd) versus moisture content (Mo) at 5–17% for defatted cottonseed meal (○), washed defatted cottonseed meal (▲) and cottonseed protein isolate (□).

Figure 5.
The plots of qst versus Sd at corresponding moisture contents at 5–17% for defatted cottonseed meal (○), washed defatted cottonseed meal (▲) and cottonseed protein isolate (□).
Figure 5.
The plots of qst versus Sd at corresponding moisture contents at 5–17% for defatted cottonseed meal (○), washed defatted cottonseed meal (▲) and cottonseed protein isolate (□).

Table 1.
Selected organic and mineral components of defatted cottonseed meal (CSM), water washed defatted cottonseed meal (WCSM) and cottonseed protein isolate (CSPI). Adapted from [33].
Table 1.
Selected organic and mineral components of defatted cottonseed meal (CSM), water washed defatted cottonseed meal (WCSM) and cottonseed protein isolate (CSPI). Adapted from [33].
| Protein | Oil | Cellulose | Ash | P | Ca | K | Mg | Na | S | |
|---|---|---|---|---|---|---|---|---|---|---|
| % of product weight | ||||||||||
| CSM | 34.1 | 2.5 | 13.6 | 7.2 | 1.5 | 0.3 | 1.8 | 0.7 | 0.2 | 0.5 |
| WCSM | 46.3 | 1 | 17.6 | 5.2 | 1.2 | 0.3 | 1 | 0.7 | 0.1 | 0.5 |
| CSPI | 94.8 | 0.2 | 0.6 | 2.2 | 0.5 | <0.1 | 0.3 | 0.1 | 0.2 | 0.7 |
Table 2.
Parameters of relevant models, R2 (regression coefficient), mean relative deviation modulus (P) and standard error of estimate (SE) for isotherms of three cottonseed products at 15, 25, 35 and 45 °C. Water content parameters (i.e., Mo and Mm) are expressed as g water/100 g of solid.
Table 2.
Parameters of relevant models, R2 (regression coefficient), mean relative deviation modulus (P) and standard error of estimate (SE) for isotherms of three cottonseed products at 15, 25, 35 and 45 °C. Water content parameters (i.e., Mo and Mm) are expressed as g water/100 g of solid.
| Cottonseed Meal. | |||||||||||||||||||
|---|---|---|---|---|---|---|---|---|---|---|---|---|---|---|---|---|---|---|---|
| G.A.B. | B.E.T. | Halsey | |||||||||||||||||
| Temp (°C) | Mo | C | K | R2 | P | SE | Mm | C | R2 | P | SE | a’’ | r | R2 | P | SE | |||
| 15 | 4.302 | −180.9 | 0.9779 | 0.9312 | 5.419 | 1.173 | 3.961 | −30.46 | 0.9736 | 8.390 | 1.079 | 19.04 | 1.494 | 0.9733 | 8.224 | 1.637 | |||
| 25 | 4.227 | 36.03 | 0.9868 | 0.9422 | 4.380 | 1.233 | 4.008 | 143.3 | 0.9660 | 6.193 | 1.231 | 12.41 | 1.349 | 0.9874 | 5.532 | 1.138 | |||
| 35 | 4.443 | 13.65 | 0.9190 | 0.9863 | 1.590 | 0.3967 | 3.334 | −31.78 | 0.9617 | 13.93 | 1.294 | 11.36 | 1.400 | 0.9953 | 3.712 | 0.5454 | |||
| 45 | 3.866 | 3.114 | 0.9399 | 0.9779 | 2.731 | 0.3870 | 3.037 | 4.989 | 0.9511 | 6.052 | 0.6915 | 3.180 | 0.9773 | 0.9760 | 11.52 | 1.107 | |||
| Washed Cottonseed Meal. | |||||||||||||||||||
| G.A.B. | Henderson | Oswin | |||||||||||||||||
| Temp (°C) | Mo | C | K | R2 | P | SE | k | n | R2 | P | SE | a | n | R2 | P | SE | |||
| 15 | 6.591 | 11.92 | 0.7231 | 0.9589 | 3.010 | 0.4485 | 0.01137 | 1.848 | 0.9939 | 3.262 | 0.5126 | 19.04 | 1.494 | 0.9733 | 8.224 | 1.637 | |||
| 25 | 4.829 | 42.36 | 0.8564 | 0.9812 | 2.112 | 0.3119 | 0.008515 | 1.979 | 0.9427 | 9.508 | 1.266 | 12.41 | 1.349 | 0.9874 | 5.532 | 1.138 | |||
| 35 | 5.899 | 6.404 | 0.7812 | 0.9502 | 2.101 | 0.2642 | 0.03287 | 1.467 | 0.9973 | 2.636 | 0.3800 | 11.36 | 1.400 | 0.9953 | 3.712 | 0.5454 | |||
| 45 | 4.542 | 4.486 | 0.8334 | 0.9719 | 1.403 | 0.1518 | 0.06921 | 1.268 | 0.9978 | 2.689 | 0.2601 | 3.180 | 0.9773 | 0.9760 | 11.52 | 1.107 | |||
| Cottonseed Protein Isolate. | |||||||||||||||||||
| G.A.B. | Bradley | Henderson | |||||||||||||||||
| Temp (°C) | Mo | C | K | R2 | P | SE | K1 | K2 | R2 | P | SE | k | n | R2 | P | SE | |||
| 15 | 7.755 | 9.812 | 0.6590 | 0.9254 | 3.584 | 0.5635 | 0.8151 | 4.832 | 0.9888 | 4.248 | 0.5108 | 0.01066 | 1.849 | 0.9906 | 3.551 | 0.5296 | |||
| 25 | 7.338 | 7.384 | 0.6816 | 0.9107 | 2.927 | 0.4585 | 0.8201 | 3.983 | 0.9938 | 2.706 | 0.3784 | 0.01883 | 1.659 | 0.9940 | 3.002 | 0.4242 | |||
| 35 | 7.451 | 5.595 | 0.6648 | 0.9370 | 1.745 | 0.2017 | 0.8165 | 3.647 | 0.9989 | 1.592 | 0.1547 | 0.02776 | 1.540 | 0.9960 | 2.491 | 0.2517 | |||
| 45 | 6.474 | 3.178 | 0.6834 | 0.9272 | 1.286 | 0.1161 | 0.7975 | 2.857 | 0.9975 | 3.986 | 0.2022 | 0.06995 | 1.281 | 0.9978 | 2.482 | 0.2027 | |||
Parameters, R2, P, and SE from the best fitting equations for cottonseed meal, washed cottonseed mean, and cottonseed protein isolate at 15 °C, 25 °C, 35 °C, and 45 °C.
Table 3.
The sorption surface area values of three cottonseed products at 15, 25, 35 and 45 °C.
| Sample | Temp (°C) | S0 (m2g−1) |
|---|---|---|
| Cottonseed meal | 15 | 152.5 |
| 25 | 149.9 | |
| 35 | 157.5 | |
| 45 | 137.0 | |
| Washed cottonseed meal | 15 | 233.7 |
| 25 | 171.2 | |
| 35 | 209.1 | |
| 45 | 161.0 | |
| Cottonseed protein isolate | 15 | 274.9 |
| 25 | 260.1 | |
| 35 | 264.1 | |
| 45 | 229.5 |
Table 4.
Characteristic parameters and regression coefficients for qst versus Sd relationship.
| Sample | Tβ (K) | α (kJ∙mol−1) | R2 |
|---|---|---|---|
| Cottonseed Meal | 329.7 | 0.7418 | 0.9991 |
| Washed Cottonseed Meal | 354.2 | 0.3279 | 0.9999 |
| Cottonseed Protein Isolate | 368.0 | −0.2692 | 0.9999 |
Publisher’s Note: MDPI stays neutral with regard to jurisdictional claims in published maps and institutional affiliations. |
© 2021 by the authors. Licensee MDPI, Basel, Switzerland. This article is an open access article distributed under the terms and conditions of the Creative Commons Attribution (CC BY) license (https://creativecommons.org/licenses/by/4.0/).
Share and Cite
MDPI and ACS Style
He, Z.; Zhang, D.; Cheng, H.N. Modeling and Thermodynamic Analysis of the Water Sorption Isotherms of Cottonseed Products. Foundations 2021, 1, 32-44. https://0-doi-org.brum.beds.ac.uk/10.3390/foundations1010005
AMA Style
He Z, Zhang D, Cheng HN. Modeling and Thermodynamic Analysis of the Water Sorption Isotherms of Cottonseed Products. Foundations. 2021; 1(1):32-44. https://0-doi-org.brum.beds.ac.uk/10.3390/foundations1010005
Chicago/Turabian StyleHe, Zhongqi, David Zhang, and Huai N. Cheng. 2021. "Modeling and Thermodynamic Analysis of the Water Sorption Isotherms of Cottonseed Products" Foundations 1, no. 1: 32-44. https://0-doi-org.brum.beds.ac.uk/10.3390/foundations1010005