
Are Shell Strength Phenotypic Traits in Mussels Associated with Species Alone?

 , , , and
Abstract
:1. Introduction
2. Materials and Methods
2.1. Sample Sourcing
2.2. DNA Extraction and Quantification
2.3. Kompetitive Allele Specific PCR (KASP) Assay
2.4. Micro-Indentation
2.5. Shell Thickness and Material Properties
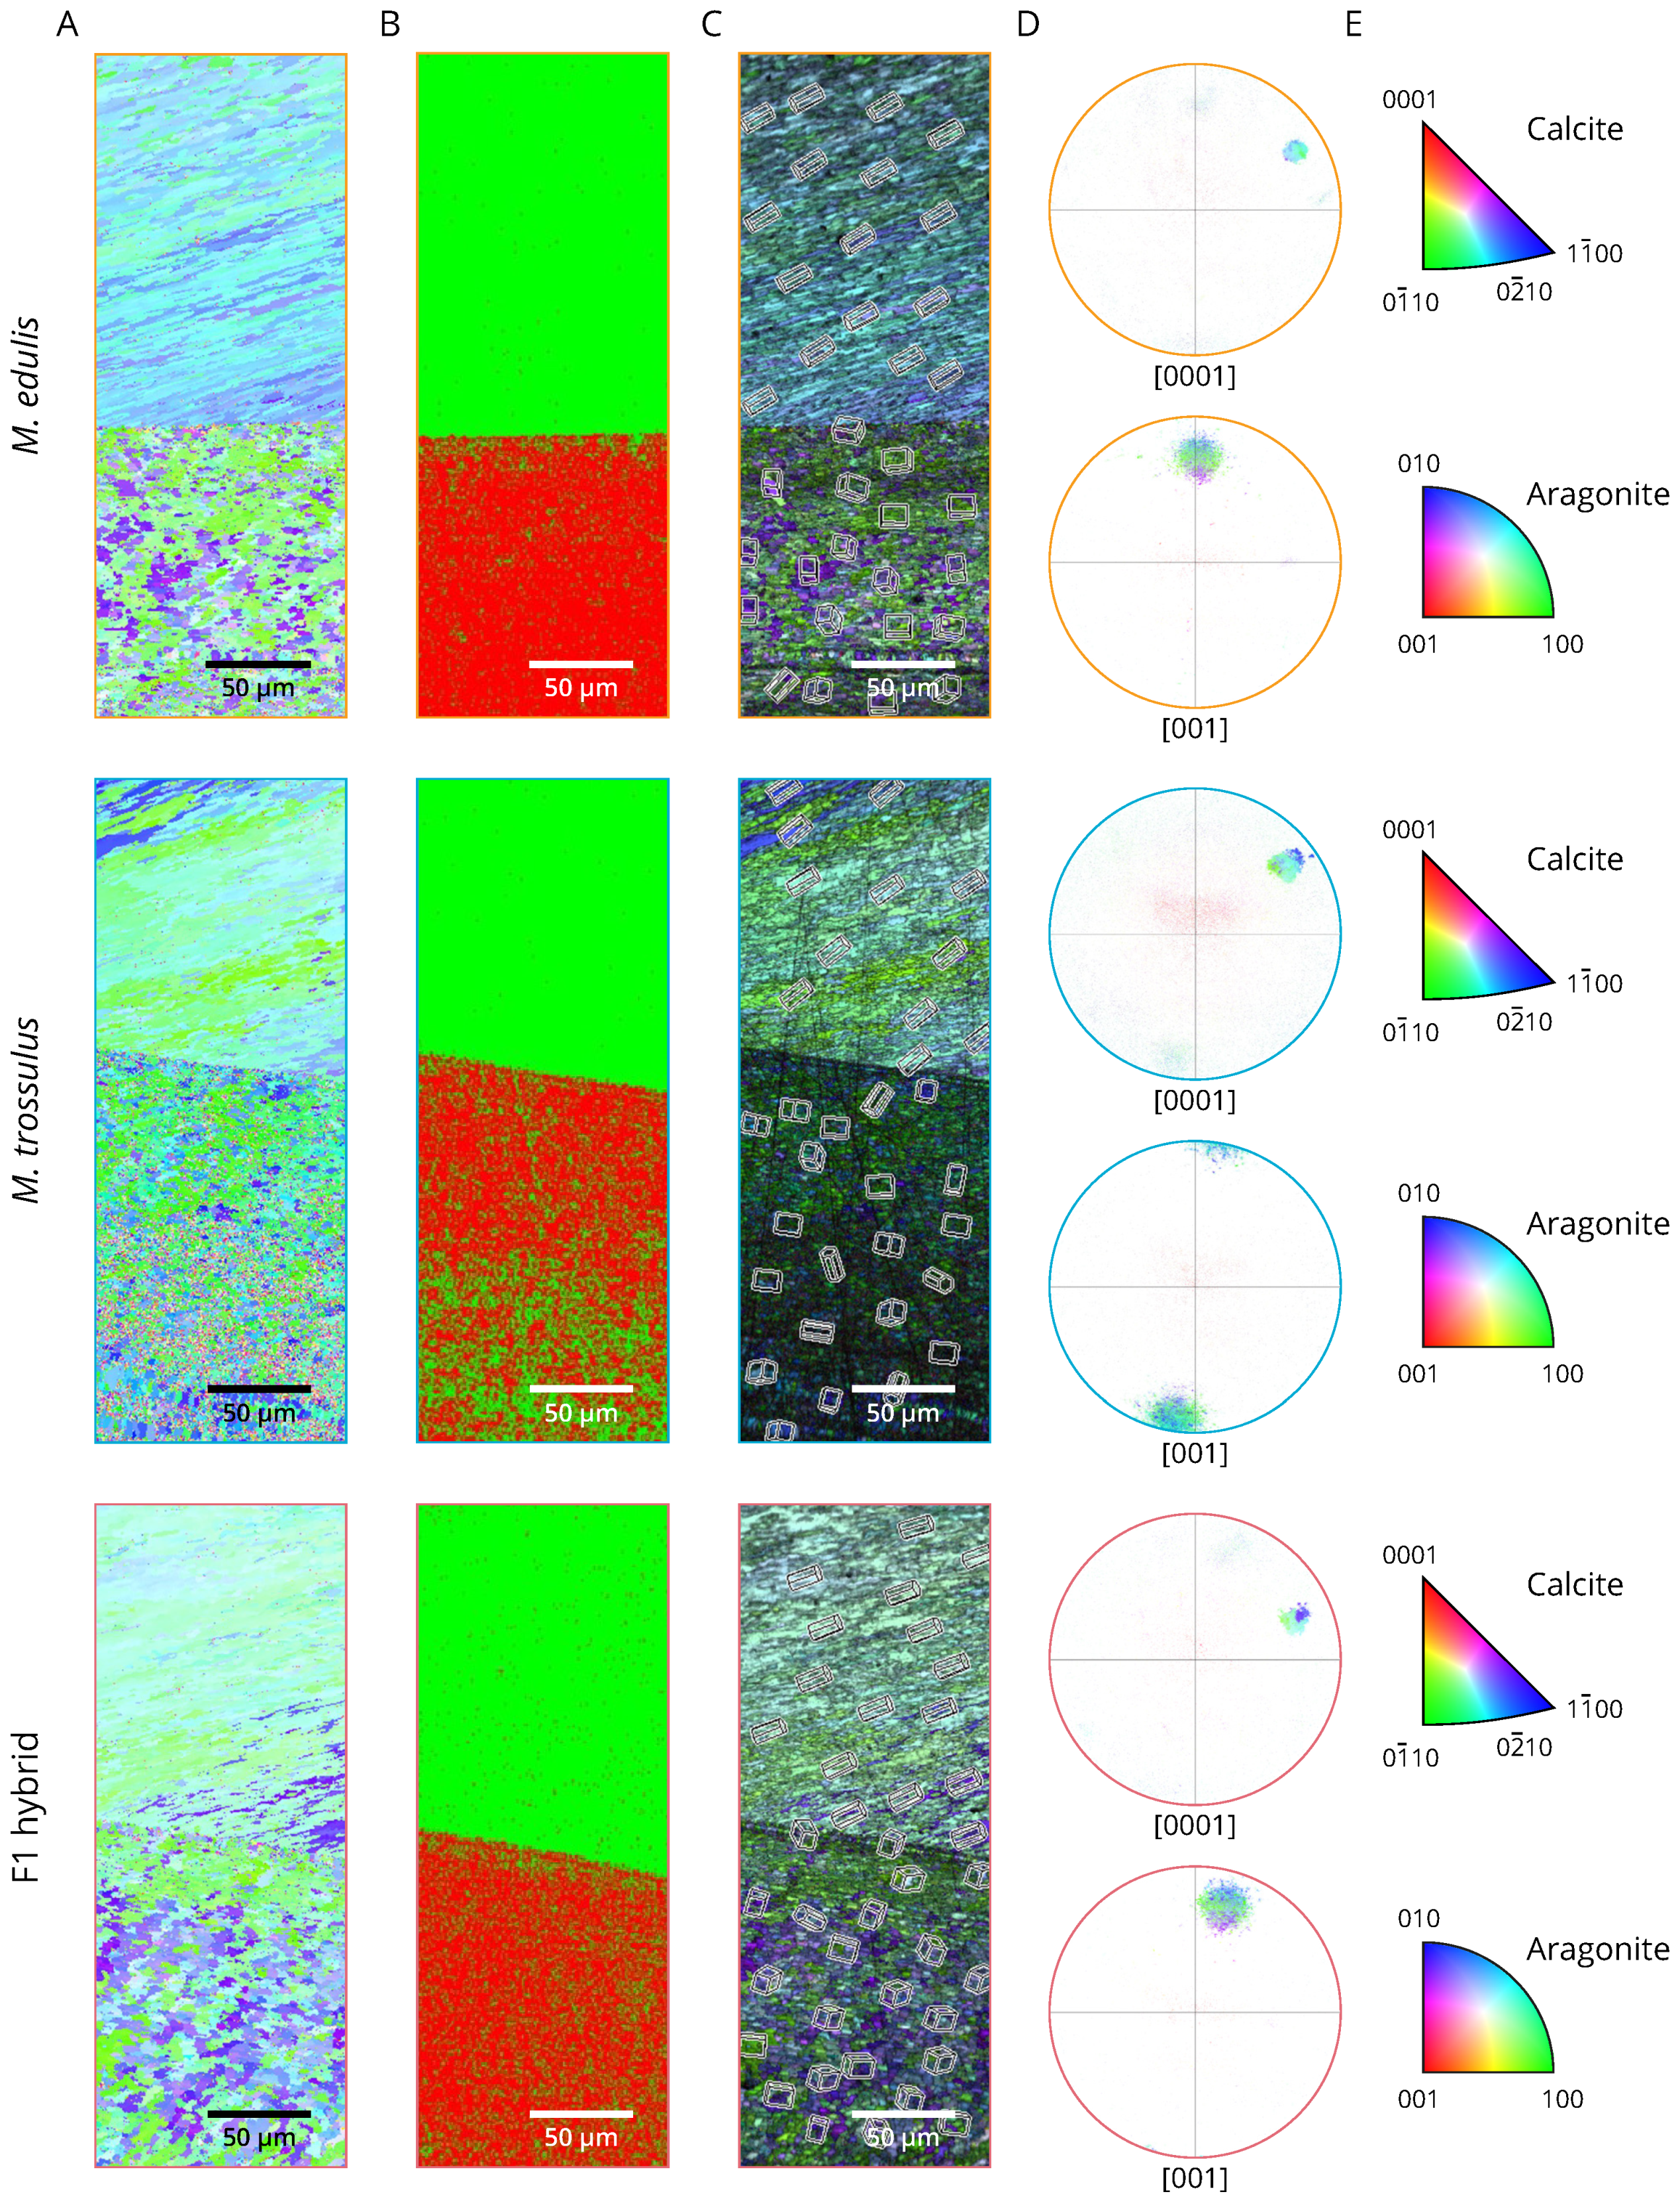
2.6. Aragonite and Calcite Crystallographic Orientation
2.7. Statistics
3. Results
3.1. Genotyping
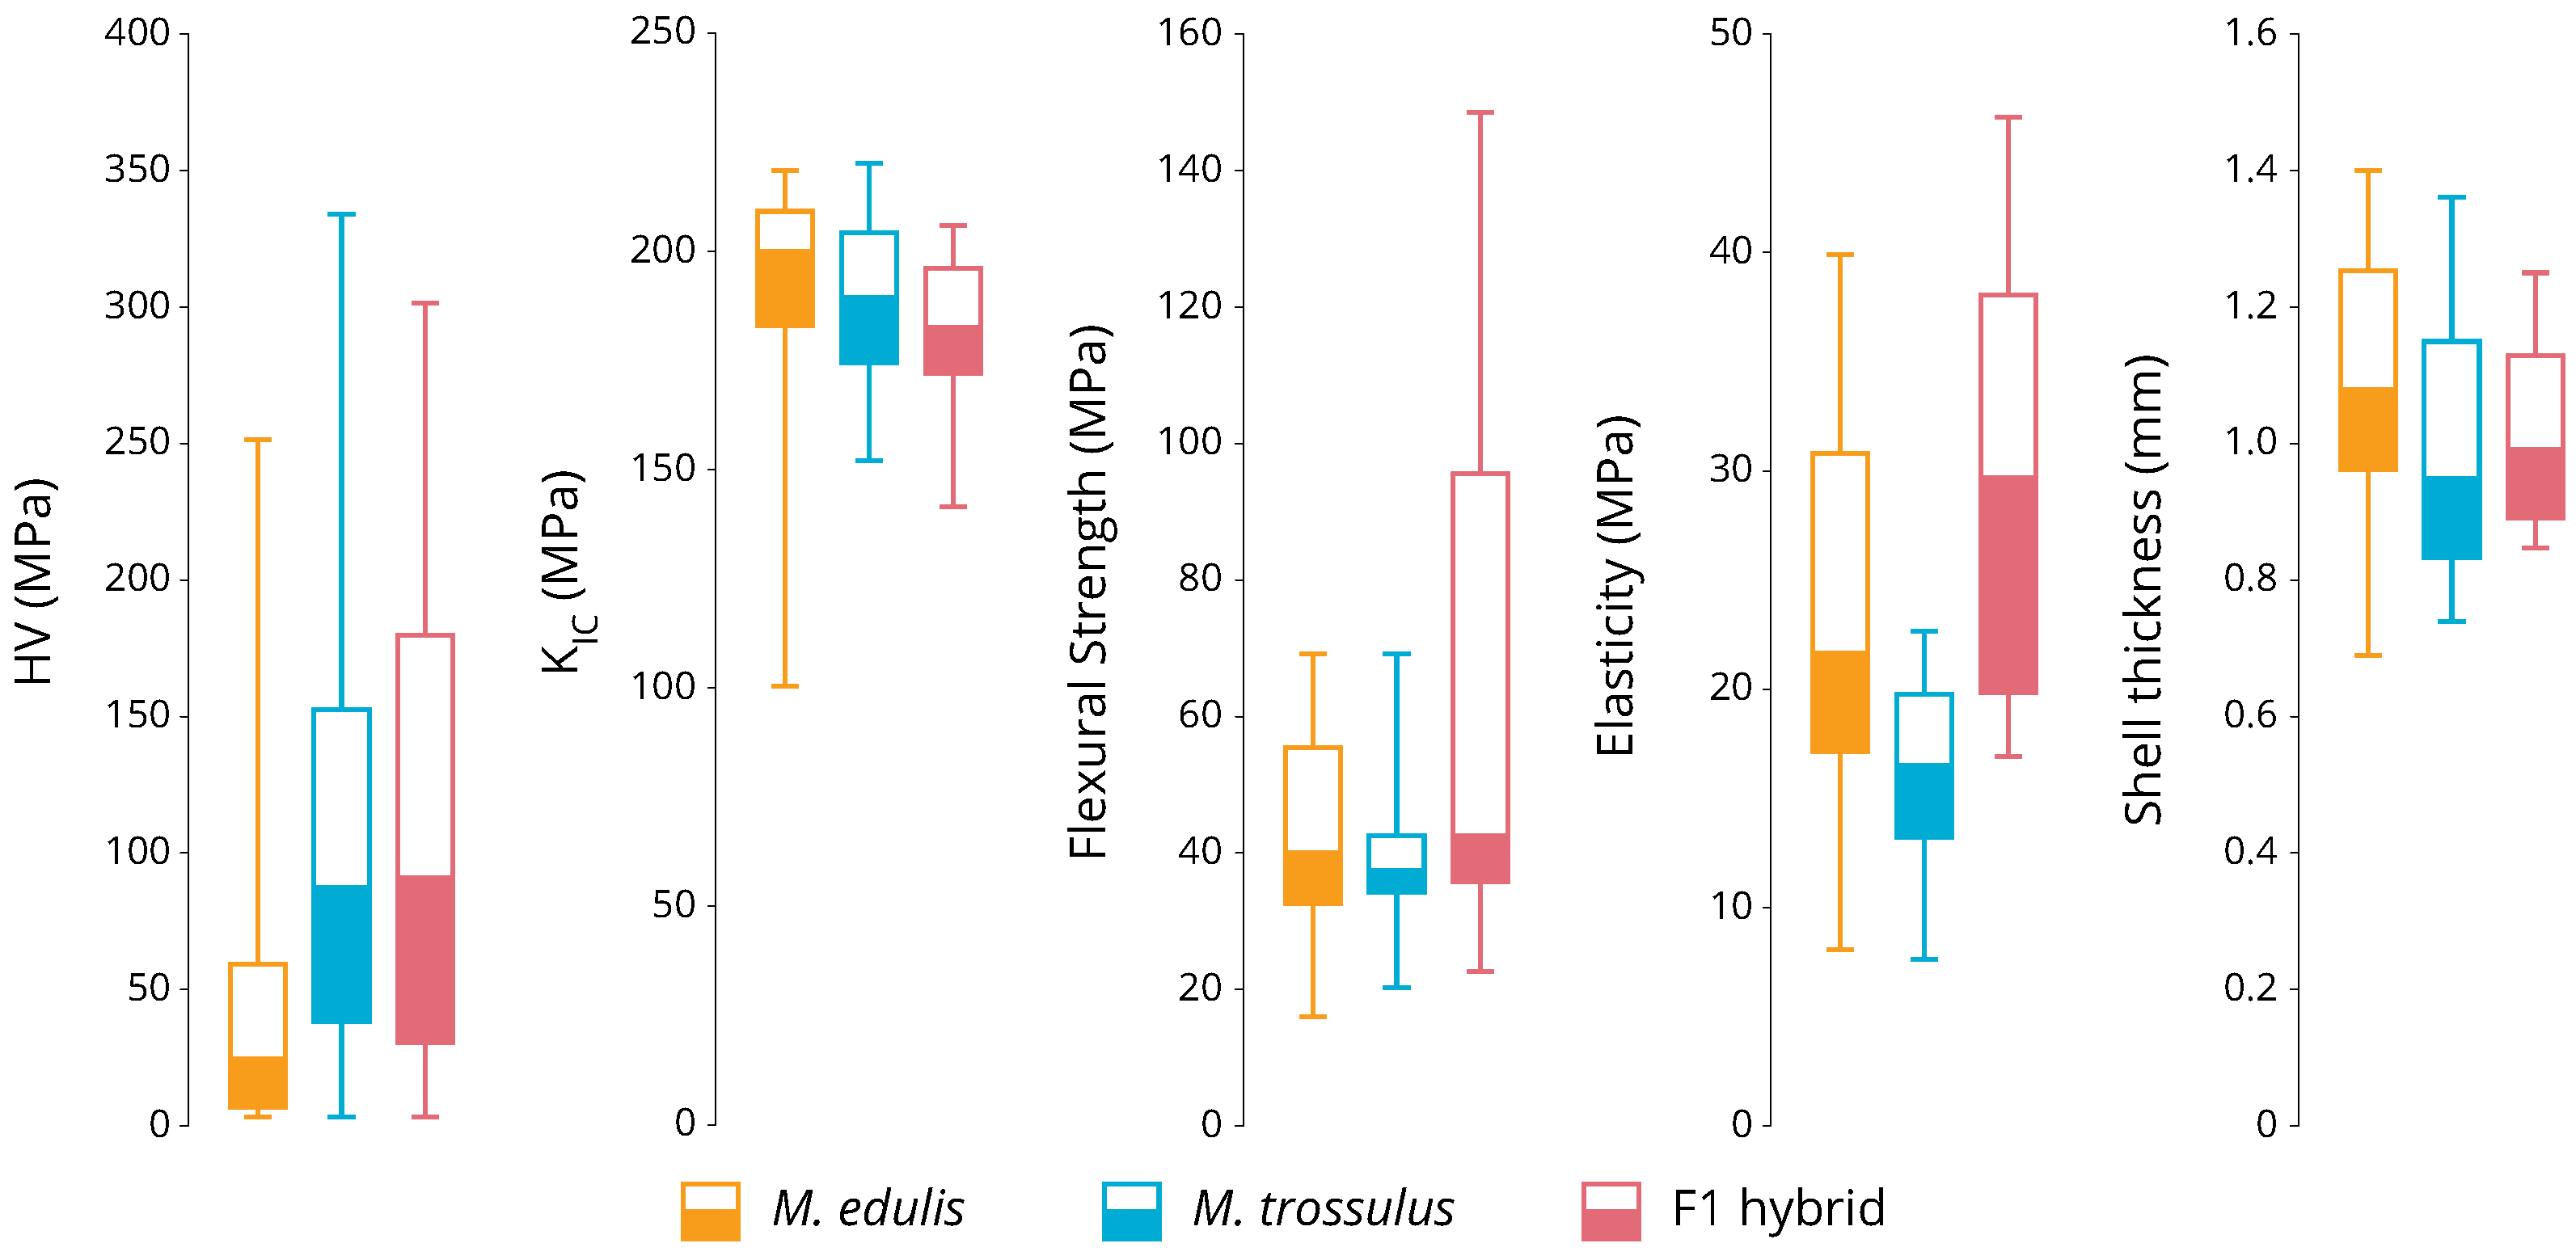
3.2. Phenotyping
4. Discussion
5. Conclusions
Author Contributions
Funding
Institutional Review Board Statement
Informed Consent Statement
Data Availability Statement
Acknowledgments
Conflicts of Interest
References
- Riginos, C.; Cunningham, C.W. Local adaptation and species segregation in two mussel (Mytilus edulis × Mytilus trossulus) hybrid zones. Mol. Ecol. 2005, 14, 381–400. [Google Scholar] [CrossRef]
- Gosling, E. Systematics and geographic distribution of Mytilus. In The Mussel Mytilus: Ecology, Physiology, Genetic and Culture; Number 25 in Developments in Aquaculture and Fisheries Science; Elsevier: Amsterdam, The Netherlands; New York, NY, USA, 1992. [Google Scholar]
- Wilson, J.; Matejusova, I.; McIntosh, R.E.; Carboni, S.; Bekaert, M. New diagnostic SNP molecular markers for the Mytilus species complex. PLoS ONE 2018, 13, e0200654. [Google Scholar] [CrossRef] [PubMed]
- Penney, R.W.; Hart, M.J.; Templeman, N.D. Shell strength and appearance in cultured blue mussels Mytilus edulis, M. trossulus, and M. edulis × M. trossulus hybrids. N. Am. J. Aquac. 2007, 69, 281–295. [Google Scholar] [CrossRef]
- Beaumont, A.R.; Hawkins, M.P.; Doig, F.L.; Davies, I.M.; Snow, M. Three species of Mytilus and their hybrids identified in a scottish loch: Natives, relicts and invaders? J. Exp. Mar. Biol. Ecol. 2008, 367, 100–110. [Google Scholar] [CrossRef]
- Dias, P.J.; Malgrange, B.; Snow, M.; Davies, I.M. Performance of mussels, Mytilus edulis, Mytilus trossulus, and their hybrids in cultivation at three scottish lochs. J. World Aquac. Soc. 2011, 42, 111–121. [Google Scholar] [CrossRef]
- Michalek, K.; Ventura, A.; Sanders, T. Mytilus hybridisation and impact on aquaculture: A minireview. Mar. Genom. 2016, 27, 3–7. [Google Scholar] [CrossRef]
- Wheelhouse, P. The aquaculture and fisheries (Scotland) act 2013 (specification of commercially damaging species) order 2014. Scott. Statut. Instrum. 2014, 176. Available online: https://www.legislation.gov.uk/ssi/2014/176/contents/made (accessed on 23 July 2021).
- Dias, P.J.; Bland, M.; Shanks, A.M.; Beaumont, A.; Piertney, S.B.; Davies, I.M.; Snow, M. Mytilus species under rope culture in Scotland: Implications for management. Aquac. Int. 2009, 17, 437–448. [Google Scholar] [CrossRef]
- Gosling, E.; Doherty, S.; Howley, N. Genetic characterization of hybrid mussel (Mytilus) populations on irish coasts. J. Mar. Biol. Assoc. U. K. 2008, 88, 341–346. [Google Scholar] [CrossRef]
- Larrain, M.A.; Diaz, N.F.; Lamas, C.; Vargas, C.; Araneda, C. Genetic composition of Mytilus species in mussel populations from southern Chile. Fac. Am. J. Aquat. Res. 2012, 40, 1077–1084. [Google Scholar] [CrossRef]
- Telesca, L.; Michalek, K.; Sanders, T.; Peck, L.S.; Thyrring, J.; Harper, E.M. Blue mussel shell shape plasticity and natural environments: A quantitative approach. Sci. Rep. 2018, 8, 2865. [Google Scholar] [CrossRef] [Green Version]
- Fitzer, S.C.; Zhu, W.; Tanner, K.E.; Phoenix, V.R.; Kamenos, N.A.; Cusack, M. Ocean acidification alters the material properties of Mytilus edulis shells. J. R. Soc. Interface 2015, 12, 20141227. [Google Scholar] [CrossRef] [Green Version]
- Lawn, B.R.; Evans, A.G.; Marshall, D.B. Elastic/plastic indentation damage in ceramics: The median/radial crack system. J. Am. Ceram Soc. 1980, 63, 574–581. [Google Scholar] [CrossRef]
- Kamal, B.; Russell, D.; Payne, A.; Constante, D.; Tanner, K.E.; Isaksson, H.; Mathavan, N.; Cobb, S.R. Biomechanical properties of bone in a mouse model of Rett syndrome. Bone 2015, 71, 106–114. [Google Scholar] [CrossRef] [PubMed] [Green Version]
- Pérez-Huerta, A.; Cusack, M. Optimizing electron backscatter diffraction of carbonate biominerals-resin type and carbon coating. Microsc. Microanal. 2009, 15, 197–203. [Google Scholar] [CrossRef] [Green Version]
- Fitzer, S.C.; Cusack, M.; Phoenix, V.R.; Kamenos, N.A. Ocean acidification reduces the crystallographic control in juvenile mussel shells. J. Struct. Biol. 2014, 188, 39–45. [Google Scholar] [CrossRef] [Green Version]
- Griesshaber, E.; Schmahl, W.W.; Ubhi, H.S.; Huber, J.; Nindiyasari, F.; Maier, B.; Ziegler, A. Homoepitaxial meso- and microscale crystal co-orientation and organic matrix network structure in Mytilus edulis nacre and calcite. Acta Biomater. 2013, 9, 9492–9502. [Google Scholar] [CrossRef] [PubMed]
- Fitzer, S.C.; Torres Gabarda, S.; Daly, L.; Hughes, B.; Dove, M.; O’Connor, W.; Potts, J.; Scanes, P.; Byrne, M. Coastal acidification impacts on shell mineral structure of bivalve mollusks. Ecol. Evol. 2018, 8, 8973–8984. [Google Scholar] [CrossRef]
- Gazeau, F.; Quiblier, C.; Jansen, J.M.; Gattuso, J.P.; Middelburg, J.J.; Heip, C.H.R. Impact of elevated CO2 on shellfish calcification. Geophys. Res. Lett. 2007, 34, L07603. [Google Scholar] [CrossRef] [Green Version]
- Beniash, E.; Ivanina, A.; Lieb, N.; Kurochkin, I.; Sokolova, I. Elevated level of carbon dioxide affects metabolism and shell formation in oysters Crassostrea virginica. Mar. Ecol. Prog. Ser. 2010, 419, 95–108. [Google Scholar] [CrossRef]
- Dickinson, G.H.; Ivanina, A.V.; Matoo, O.B.; Pörtner, H.O.; Lannig, G.; Bock, C.; Beniash, E.; Sokolova, I.M. Interactive effects of salinity and elevated CO2 levels on juvenile eastern oysters, Crassostrea virginica. J. Exp. Biol. 2012, 215, 29–43. [Google Scholar] [CrossRef] [PubMed] [Green Version]
- Fitzer, S.C.; Phoenix, V.R.; Cusack, M.; Kamenos, N.A. Ocean acidification impacts mussel control on biomineralisation. Sci. Rep. 2015, 4, 6218. [Google Scholar] [CrossRef] [PubMed]
- SEPA. Scottish Environment Protection Agency Database; SEPA: Stirling, UK, 2020. [Google Scholar]
- Michalek, K.; Vendrami, D.L.; Bekaert, M.; Green, D.H.; Last, K.S.; Telesca, L.; Wilding, T.A.; Hoffman, J.I. Mytilus trossulus introgression and consequences for shell traits in longline cultivated mussels. Evol. Appl. 2021. [Google Scholar] [CrossRef]


| Species | Sample ID | E1 | E2 | E3 | T1 | T2 | T3 | TT | M | S |
|---|---|---|---|---|---|---|---|---|---|---|
| M. edulis | 72 | GG | TT | AA | AA | TT | CC | - | Yes | Yes |
| M. edulis | 75 | GG | TT | AA | AA | TT | CC | - | Yes | - |
| M. edulis | 77 | GG | TT | AA | AA | TT | CC | Yes | - | - |
| M. edulis | 78 | GG | TT | AA | AA | TT | CC | Yes | - | - |
| M. edulis | 81 | GG | TT | AA | AA | TT | CC | - | Yes | Yes |
| M. edulis | 87 | GG | TT | AA | AA | TT | CC | - | Yes | - |
| M. edulis | 91 | GG | TT | AA | AA | TT | CC | Yes | - | - |
| M. edulis | 95 | GG | TT | AA | AA | TT | CC | - | Yes | - |
| M. edulis | 96 | GG | TT | AA | AA | TT | CC | Yes | - | - |
| M. edulis | 107 | GG | TT | AA | AA | TT | CC | Yes | Yes | - |
| M. edulis | 108 | GG | TT | AA | AA | TT | CC | Yes | - | - |
| M. edulis | 109 | GG | TT | AA | AA | TT | CC | Yes | - | - |
| M. edulis | 122 | GG | TT | AA | AA | TT | CC | - | Yes | - |
| M. edulis | 123 | GG | TT | AA | AA | TT | CC | Yes | - | - |
| M. edulis | 126 | GG | TT | AA | AA | TT | CC | - | Yes | - |
| M. edulis | 128 | GG | TT | AA | AA | TT | CC | Yes | - | - |
| M. edulis | 129 | GG | TT | AA | AA | TT | CC | Yes | - | - |
| M. edulis | 132 | GG | TT | AA | AA | TT | CC | Yes | - | - |
| M. edulis | 138 | GG | TT | AA | AA | TT | CC | Yes | - | - |
| M. edulis | 144 | GG | TT | AA | AA | TT | CC | - | Yes | - |
| M. edulis | 153 | GG | TT | AA | AA | TT | CC | Yes | - | - |
| M. edulis | 154 | GG | TT | AA | AA | TT | CC | - | Yes | Yes |
| M. edulis | 159 | GG | TT | AA | AA | TT | CC | Yes | - | - |
| M. edulis | 161 | GG | TT | AA | AA | TT | CC | Yes | - | - |
| M. edulis | 166 | GG | TT | AA | AA | TT | CC | Yes | - | - |
| M. edulis | 172 | GG | TT | AA | AA | TT | CC | Yes | - | - |
| M. edulis | 178 | GG | TT | AA | AA | TT | CC | Yes | - | - |
| M. edulis | 183 | GG | TT | AA | AA | TT | CC | - | Yes | - |
| F1 | 83 | AG | GT | AT | AG | GT | CT | Yes | Yes | Yes |
| F1 | 168 | AG | GT | AT | AG | GT | CT | Yes | - | Yes |
| F1 | 14 | AG | GT | AT | AG | GT | CT | - | Yes | Yes |
| M. trossulus | 1 | AA | GG | AT | GG | GG | TT | - | Yes | - |
| M. trossulus | 3 | AA | GG | TT | GG | GG | TT | - | Yes | - |
| M. trossulus | 6 | AA | GG | TT | GG | GG | TT | - | Yes | - |
| M. trossulus | 8 | AA | GG | TT | GG | GG | TT | - | Yes | - |
| M. trossulus | 44 | AA | GG | TT | GG | GG | TT | - | Yes | - |
| M. trossulus | 82 | AA | GG | TT | GG | GG | TT | Yes | Yes | Yes |
| M. trossulus | 112 | AG | GG | AT | GG | GG | TT | Yes | Yes | Yes |
| M. trossulus | 125 | AA | GG | TT | GG | GG | TT | - | - | Yes |
| Vickers | Fracture | ||
|---|---|---|---|
| Species | Sample ID | Hardness (MPa) | Toughness/K (MPa) |
| M. edulis | 72 | 214.90 ± 21.37 | 27.79 ± 17.28 |
| M. edulis | 75 | 165.45 ± 25.48 | 23.20 ± 19.45 |
| M. edulis | 81 | 215.83 ± 13.08 | 63.13 ± 59.77 |
| M. edulis | 87 | 192.20 ± 26.38 | 16.63 ± 13.51 |
| M. edulis | 95 | 206.59 ± 11.31 | 8.95 ± 6.92 |
| M. edulis | 107 | 154.65 ± 37.12 | 16.63 ± 13.51 |
| M. edulis | 122 | 202.31 ± 5.48 | 66.09 ± 22.50 |
| M. edulis | 126 | 199.04 ± 21.41 | 79.94 ± 72.84 |
| M. edulis | 144 | 199.04 ± 21.41 | 95.54 ± 63.11 |
| M. edulis | 154 | 199.93 ± 6.48 | 75.38 ± 37.65 |
| M. edulis | 183 | 186.92 ± 16.56 | 36.75 ± 20.04 |
| F1 | 83 | 175.73 ± 11.97 | 92.36 ± 63.61 |
| F1 | 14 | 203.00 ± 10.08 | 38.37 ± 39.70 |
| M. trossulus | 1 | 206.38 ± 18.47 | 28.00 ± 20.85 |
| M. trossulus | 3 | 208.62 ± 8.11 | 55.40 ± 36.03 |
| M. trossulus | 6 | 234.98 ± 17.22 | 62.22 ± 29.48 |
| M. trossulus | 8 | 190.40 ± 13.28 | 26.39 ± 19.73 |
| M. trossulus | 44 | 203.11 ± 16.46 | 86.64 ± 70.53 |
| M. trossulus | 82 | 190.66 ± 13.97 | 54.73 ± 25.57 |
| Flexural | ||||
|---|---|---|---|---|
| Species | Sample ID | Strength (MPa) | Elasticity (MPa) | Thickness (mm) |
| M. edulis | 77 | 31.28 ± 3.97 | 13.39 ± 3.85 | 1.22 ± 0.08 |
| M. edulis | 78 | 36.05 ± 6.31 | 26.61 ± 9.36 | 1.18 ± 020 |
| M. edulis | 91 | 47.66 ± 7.43 | 27.86 ± 10.85 | 1.30 ± 0.12 |
| M. edulis | 96 | 56.43 ± 2.14 | 22.88 ± 8.77 | 0.78 ± 0.02 |
| M. edulis | 107 | 48.36 ± 14.44 | 19.97 ± 5.07 | 1.17 ± 0.18 |
| M. edulis | 108 | 66.11 ± 18.83 | 33.04 ± 6.06 | 1.01 ± 0.14 |
| M. edulis | 109 | 64.54 ± 19.33 | 39.69 ± 8.28 | 0.98 ± 0.05 |
| M. edulis | 123 | 33.98 ± 4.73 | 21.40 ± 5.70 | 0.83 ± 0.14 |
| M. edulis | 128 | 19.32 ± 4.47 | 14.31 ± 0.81 | 1.18 ± 0.14 |
| M. edulis | 129 | 35.81 ± 10.59 | 22.02 ± 6.09 | 1.33 ± 0.30 |
| M. edulis | 132 | 60.31 ± 6.86 | 21.54 ± 5.38 | 0.89 ± 0.12 |
| M. edulis | 138 | 52.67 ± 17.05 | 30.89 ± 10.29 | 1.05 ± 0.32 |
| M. edulis | 153 | 27.25 ± 7.31 | 11.23 ± 1.24 | 1.24 ± 0.23 |
| M. edulis | 159 | 55.47 ± 17.27 | 22.65 ± 3.60 | 1.09 ± 0.07 |
| M. edulis | 161 | 38.12 ± 10.28 | 19.80 ± 0.56 | 1.06 ± 0.06 |
| M. edulis | 166 | 65.47 ± 17.02 | 31.82 ± 5.67 | 0.92 ± 0.04 |
| M. edulis | 172 | 40.99 ± 11.79 | 29.84 ± 6.80 | 1.36 ± 0.29 |
| M. edulis | 178 | 29.42 ± 6.94 | 13.19 ± 4.59 | 1.11 ± 0.26 |
| F1 | 83 | 31.90 ± 8.55 | 25.71 ± 14.39 | 1.09 ± 0.20 |
| F1 | 168 | 91.13 ± 38.45 | 32.67 ± 7.54 | 0.97 ± 0.15 |
| M. trossulus | 82 | 42.83 ± 8.92 | 16.88 ± 4.55 | 0.80 ± 0.06 |
| M. trossulus | 112 | 31.86 ± 10.17 | 21.38 ± 4.46 | 1.22 ± 0.17 |
| M. trossulus | 125 | 52.76 ± 26.18 | 27.21 ± 12.42 | 1.01 ± 0.33 |
Publisher’s Note: MDPI stays neutral with regard to jurisdictional claims in published maps and institutional affiliations. |
© 2021 by the authors. Licensee MDPI, Basel, Switzerland. This article is an open access article distributed under the terms and conditions of the Creative Commons Attribution (CC BY) license (https://creativecommons.org/licenses/by/4.0/).
Share and Cite
Carboni, S.; Evans, S.; Tanner, K.E.; Davie, A.; Bekaert, M.; Fitzer, S.C. Are Shell Strength Phenotypic Traits in Mussels Associated with Species Alone? Aquac. J. 2021, 1, 3-13. https://0-doi-org.brum.beds.ac.uk/10.3390/aquacj1010002
Carboni S, Evans S, Tanner KE, Davie A, Bekaert M, Fitzer SC. Are Shell Strength Phenotypic Traits in Mussels Associated with Species Alone? Aquaculture Journal. 2021; 1(1):3-13. https://0-doi-org.brum.beds.ac.uk/10.3390/aquacj1010002
Chicago/Turabian StyleCarboni, Stefano, Sarah Evans, K. Elizabeth Tanner, Andrew Davie, Michaël Bekaert, and Susan C. Fitzer. 2021. "Are Shell Strength Phenotypic Traits in Mussels Associated with Species Alone?" Aquaculture Journal 1, no. 1: 3-13. https://0-doi-org.brum.beds.ac.uk/10.3390/aquacj1010002