Article

A Search Methodology Based on Industrial Ontology and Machine Learning to Analyze Georeferenced Italian Districts

by
Alessandro Massaro
1,2,*,
Gabriele Cosoli
1,
Nicola Magaletti
1 and
Alberto Costantiello
2
1
LUM Enterprise Srl, S.S. 100—Km 18, 70010 Bari, Italy
2
Università LUM “Giuseppe Degennaro”, S.S. 100—Km 18, 70010 Bari, Italy
*
Author to whom correspondence should be addressed.
Submission received: 23 March 2022 / Revised: 6 May 2022 / Accepted: 9 May 2022 / Published: 14 May 2022

Abstract

:
The subject of the proposed study is a method implementable for a search engine able to provide supply chain information, gaining the company’s knowledge base. The method is based on the construction of specific supply chain ontologies to enrich Machine Learning (ML) algorithm results able to filter and refine the searching process. The search engine is structured into two main search levels. The first one provides a preliminary filter of supply chain attributes based on the hierarchical clustering approach. The second one improves and refines the research by means of an ML classification and web scraping. The goal of the searching method is to identify a georeferenced supply chain district, finalized to optimize production and planning production strategies. Different technologies are proposed as candidates for the implementation of each part of the search engine. A preliminary prototype with limited functions is realized by means of Graphical User Interfaces (GUIs). Finally, a case study of the ice cream supply chain is discussed to explain how the proposed method can be applied to construct a basic ontology model. The results are performed within the framework of the project “Smart District 4.0”.

1. Introduction

In a competitive industrial scenario, searching for information to optimize production is fundamental. Supply Chain Ontology (SCO) [1] is surely a tool suitable for information systems interoperability [1,2] and for supply chain decision-making situations [3]. Supply chains are usually complex and dynamic networks requiring a lot of actors and a correct management process. In this direction, SCO could support supply chain management (SCM) [3] if combined with a powerful web search engine providing information to optimize production. Intelligent semantic web search engines [4] are suitable for retrieving meaningful information intelligently, thus supporting the planning for the best supply chain network. Web User Experience (UX) [5] can be a solution to facilitate the search for useful elements and information, thus suggesting a system based on the self-learning of keywords used by the user for a specific searching process. Furthermore, web scraping techniques [6,7] are useful for searching online prices [6], and web mining approaches are able to activate business intelligence [8] also for processing social data [9]. Machine Learning (ML) Natural Language Processing (NLP)-based algorithms are good candidates for classifying and extract keywords from a text [10,11,12] by adopting the self-learning approach [13]. The company knowledge gain can be achieved by association rules implementing logical conditions [14]. Association rules are useful for the refinement of the searching process by allowing the searching optimization concerning a product or a sub-product: the combination of different logic conditions applied to keywords improves the research by eliminating confused and entropic information. Further, socio-economic indicators can be associated with a complete georeferenced system [15], thus further gaining the information associated with the territory characteristics and allowing strategic choices for supply chain optimization. A basic example is to use geolocalization for the choice of suppliers placed near the main production company [9] or for the choice of sites near infrastructure, such as roads, railways, ports and airports, thus supporting and improving logistics. Until today, the above-cited technologies have never been used to ideate an innovative search engine following industry research topics [16]. The innovative idea is to use a cross-platform, such as Smart District 4.0 (SD 4.0) [17,18] (project funded by the Italian Ministry of Economic Development that has been developed by the research activity discussed in this paper), to gain the knowledge base of companies and support the strategic plan of business models. The platform is able to contain supply chain data and structure it by frontend interfaces, data models such as Business Processing Modeling Notation (BPMN) workflows and algorithm data flows. The work is structured to describe the approach to realize an innovative search engine based on the ontology supply chain. In order to describe the approach some engine functionalities are tested. Finally, a specific case study of the ice cream production district is analyzed to describe how the proposed approach can be applied by constructing an ontology model. The main goal of the paper is to provide a proof of concept of an innovative search engine for supply chain optimization based on the gain of the company’s knowledge base. The work is structured as follows:
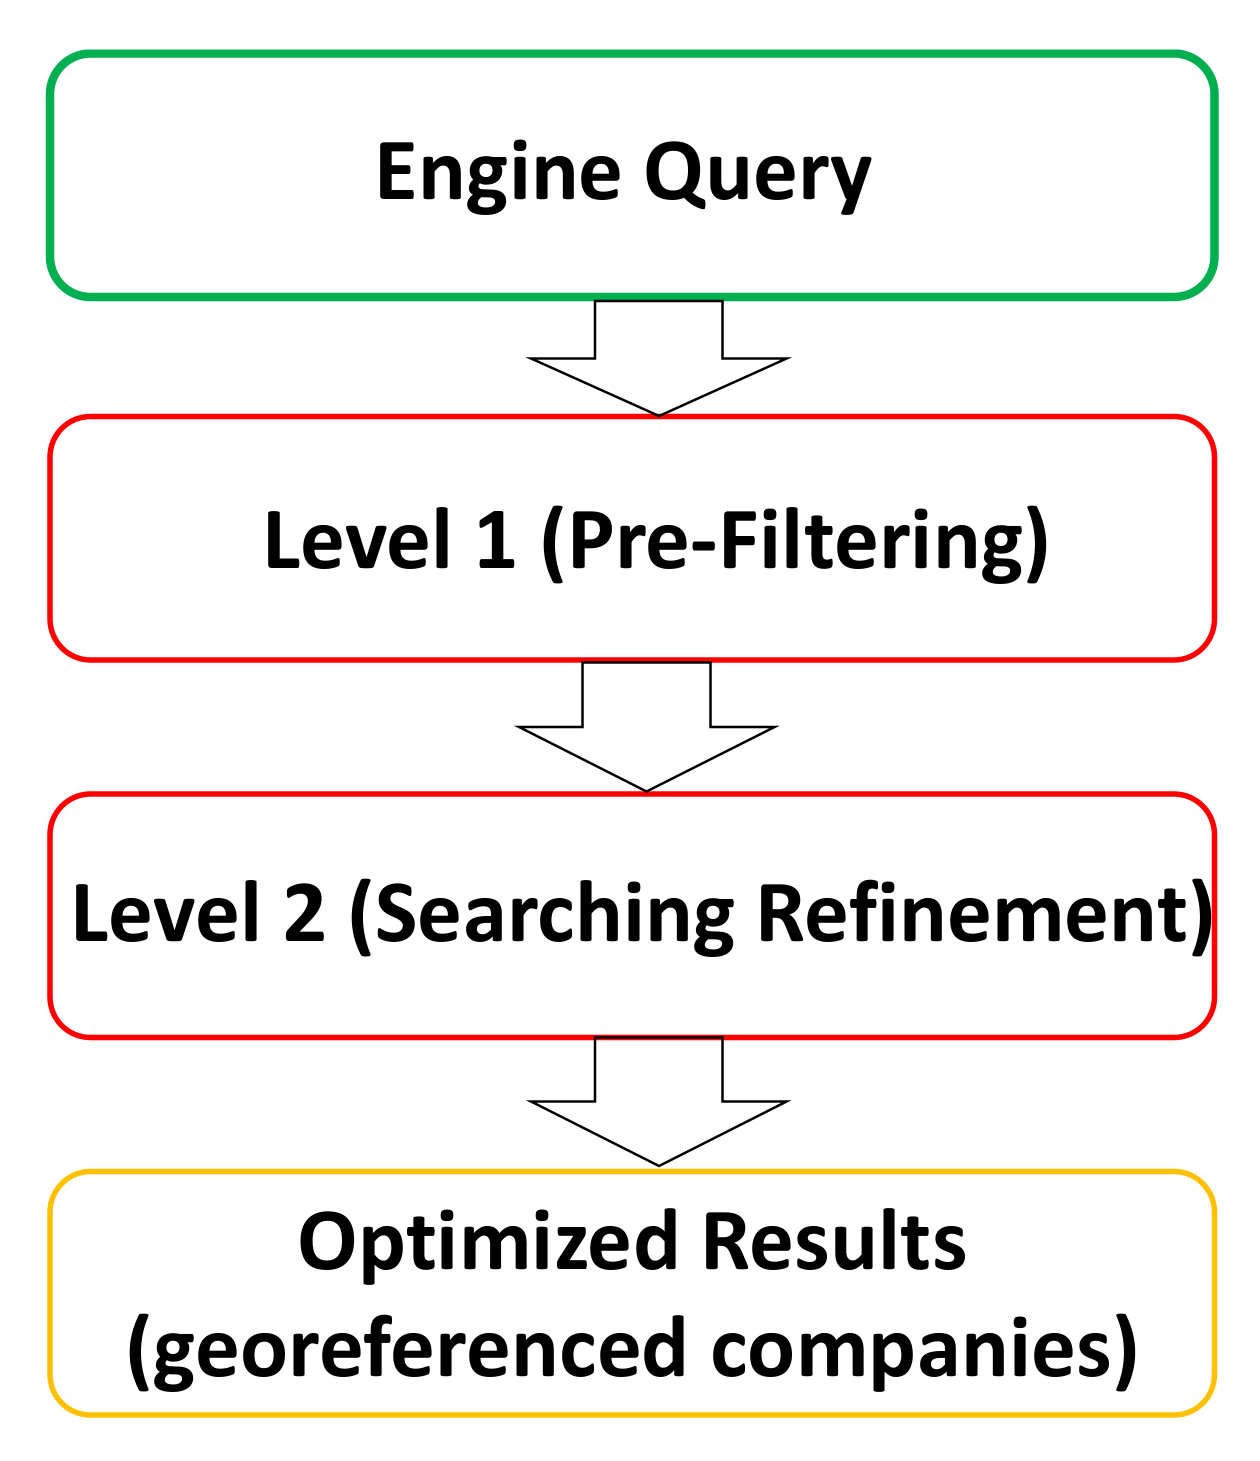
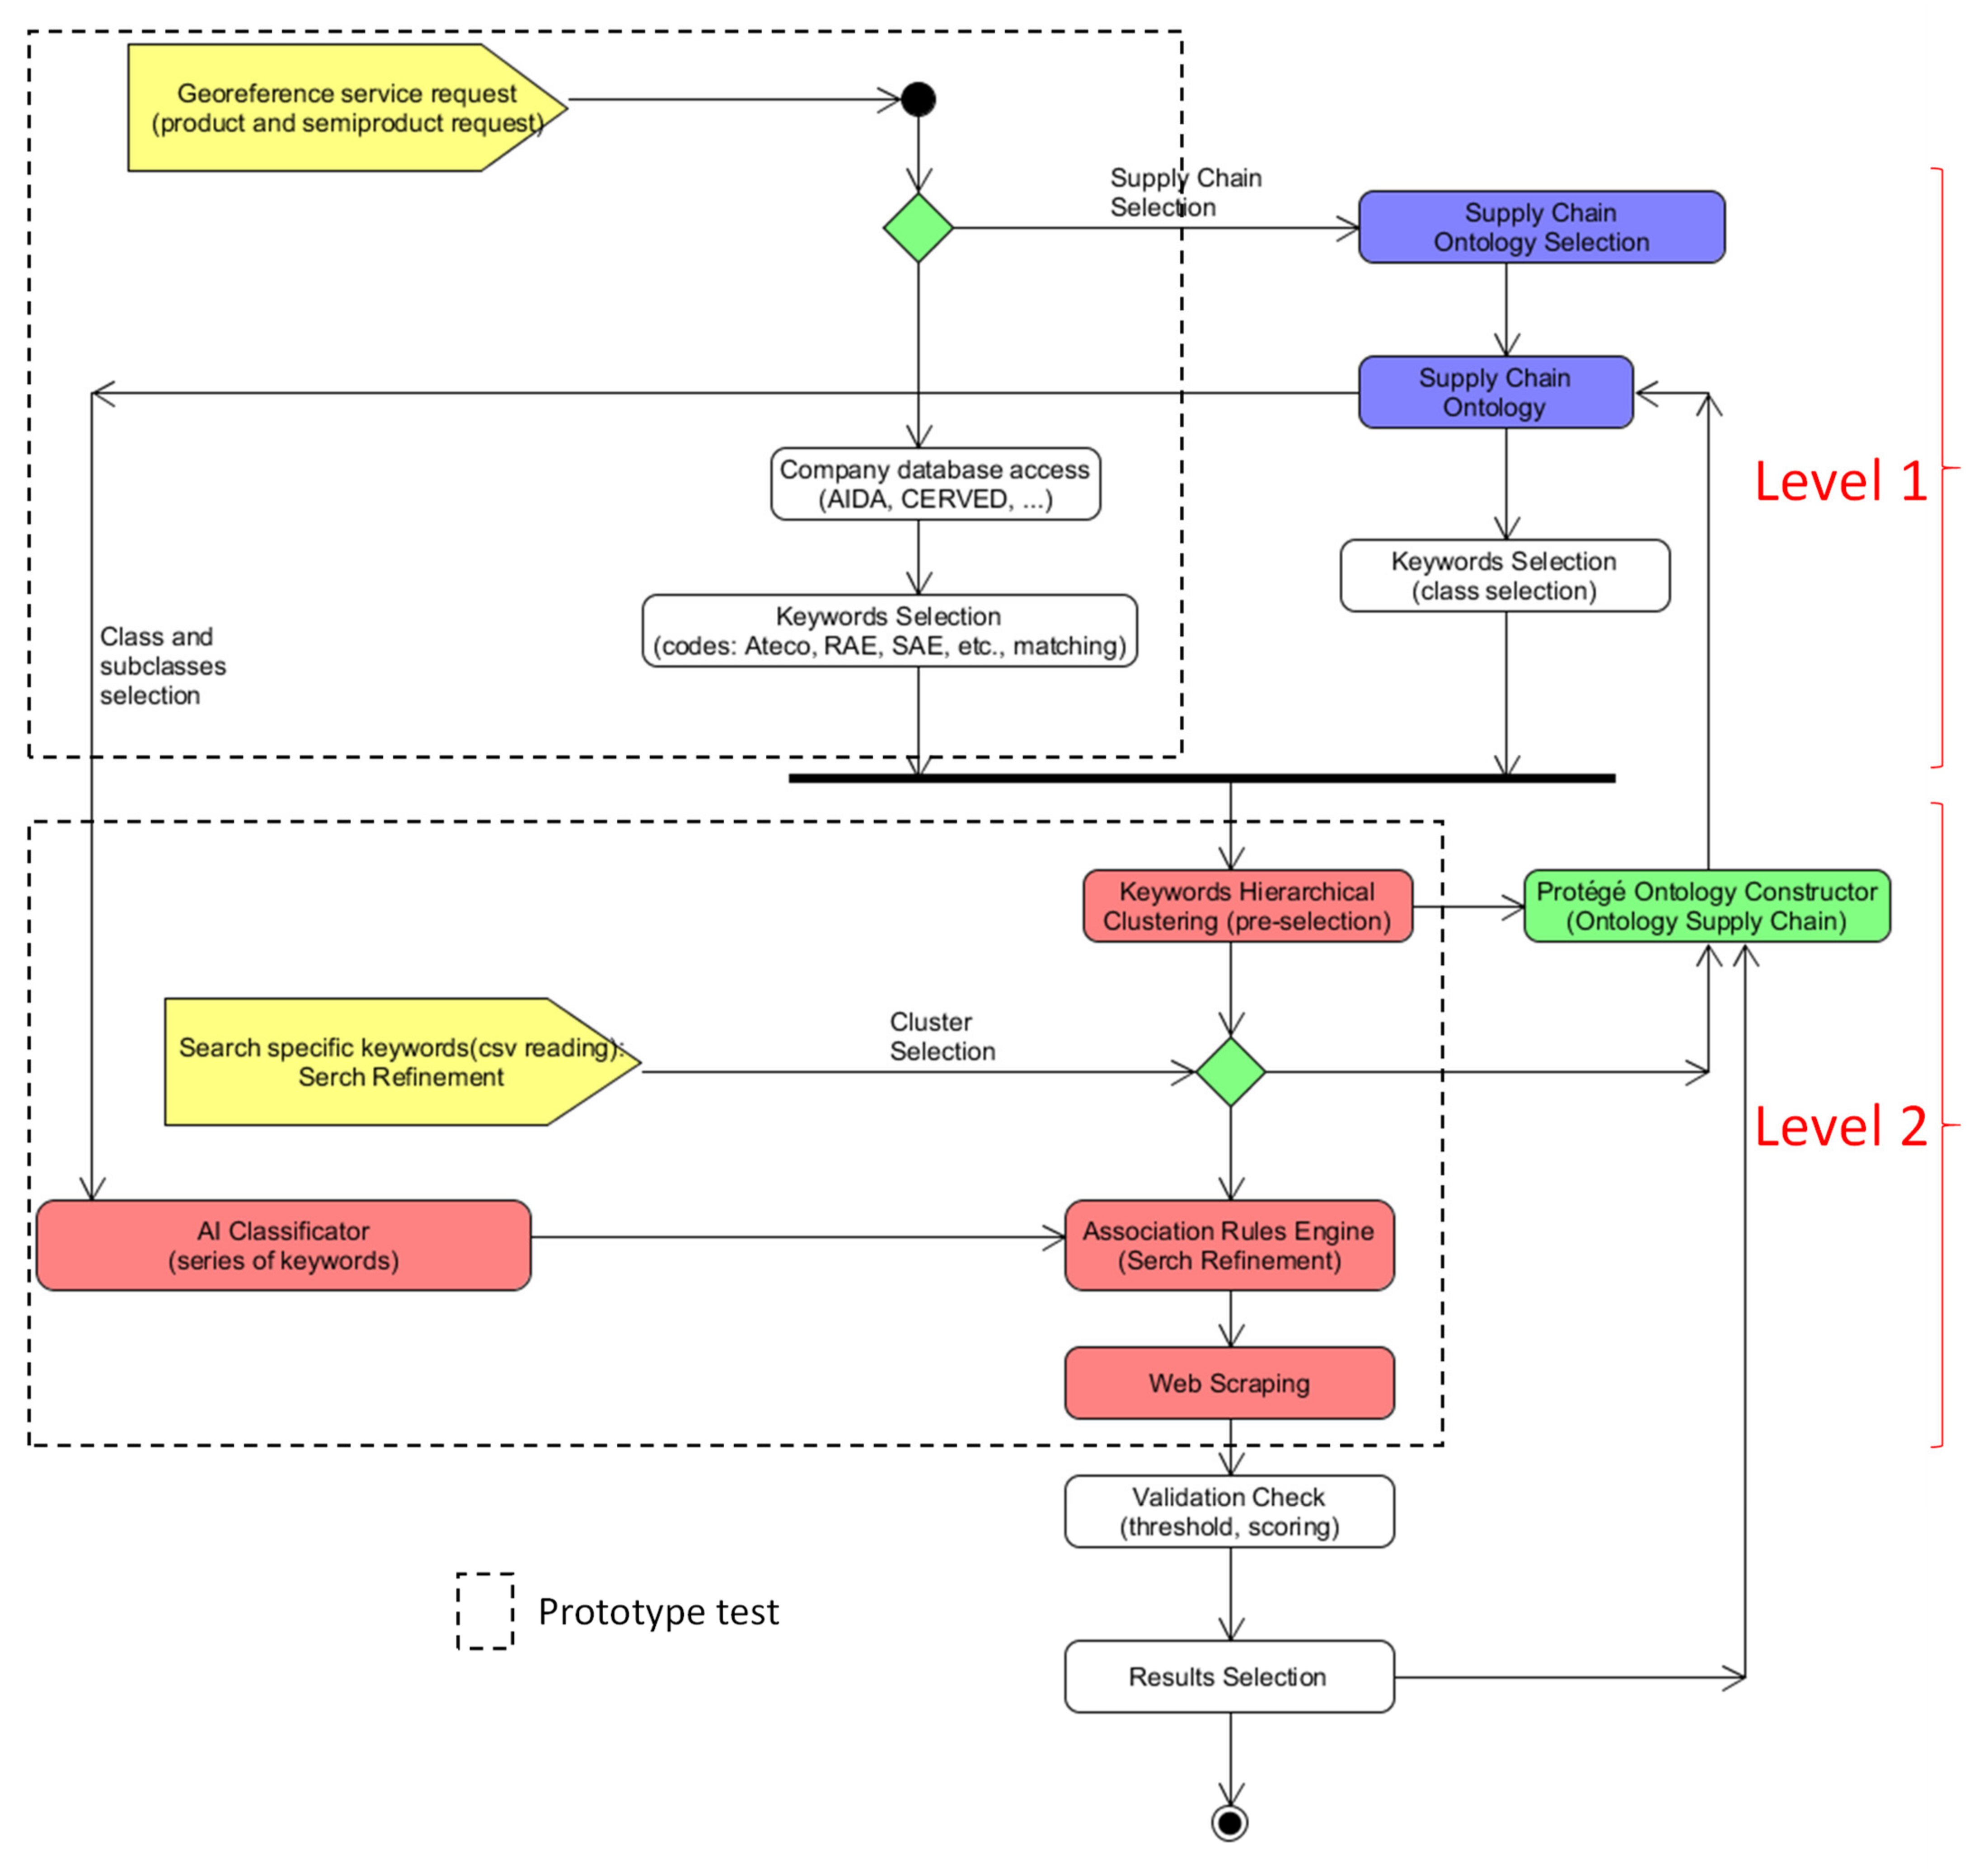
  • A description of the searching approach by means of a Unified Modeling Language (UML) Activity Diagram (AD), defining the two-level searching approach useful to gain the knowledge base of the supply chain and providing the ontology construction mechanism;
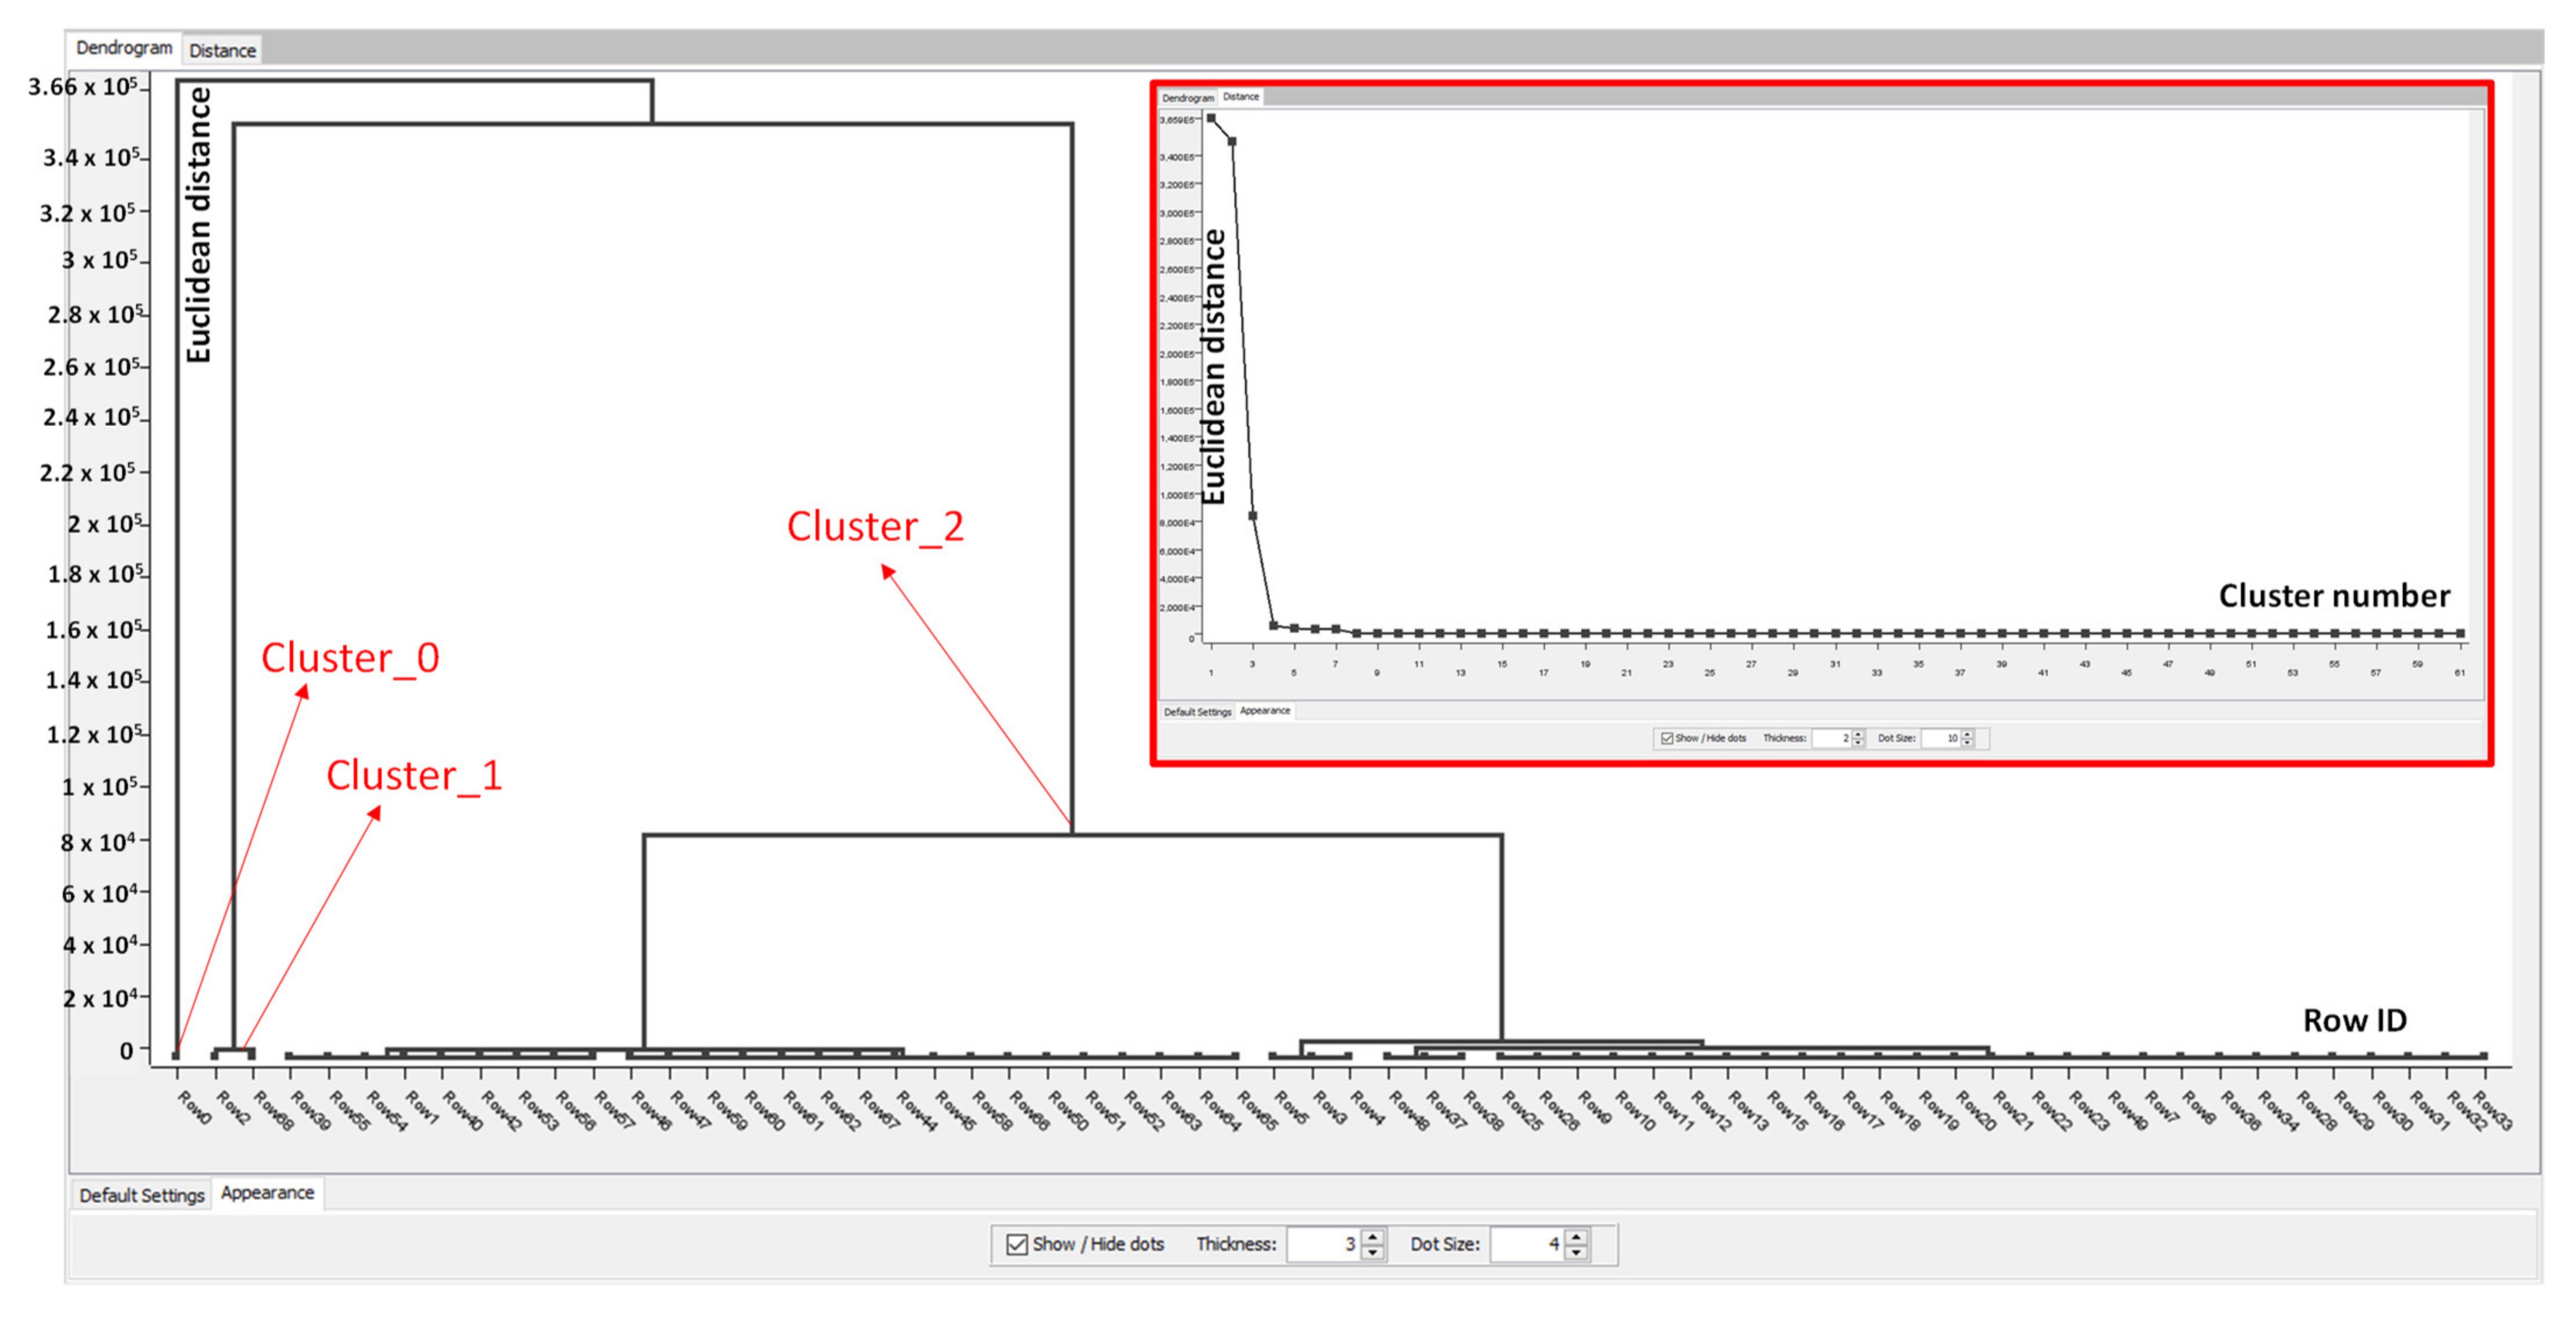
  • The results of the preliminary Smart District 4.0 project [18] from a prototypal search engine, highlighting the main functions of refinement research, such as hierarchical clustering and web scraping;
  • A discussion focused on web scraping logic, a full list of possible technologies usable to implement the whole supply chain searching engine;
  • A case study of a pilot industry based on the two-level searching process and constructing a sub-ontology.

2. Methodology

2.1. Architecture of the Innovative Supply Chain Two-Level Searching Method

The main functions of the search engine applying the proposed approach are indicated in Figure 1. The engine input is a query concerning a product or a semi-product to optimize the related production or marketing. The engine is structured into two main searching levels: the first one (Level 1) provides pre-filtered results of keywords and information about the input query; the second level (Level 2) mainly addresses the searching refinement, thus optimizing the results on possible companies supporting or creating the product supply chain.
Specifically, the proposed approach is based on the automatic searching of codes and keywords found simultaneously in databases indexing companies, digital texts, input requests of the user, a series of keywords suggested by ML, as well as information extracted automatically from the web. The main functions of the search engine are detailed in the UML-AD of Figure 2. The process starts with a query (service request) containing product or semi-product indications. The information is adopted to select the specific supply chain ontology, and to activate, after authorized access, the searching for further information in different portals collecting Italian company indices (see Table 1).
The keywords matched with the specific supply chain ontology and with the company indices/codes of the external databases (completion of the Level 1 of the exploration), are then structured into a hierarchical clustering dendrogram (tree graph used to visualize the similarity in the “grouping” process) performed by an unsupervised ML algorithm. The data clustering represents a more structured data configuration enabling a pre-selection of the required information, and it is the first stage of the second level (Level 2) of the search engine. The dendrogram allows the selection of specified sub-areas of the product supply chain (logistics, marketing, raw material supply, raw material processing, machine processing, sub-product supply, etc.). The hierarchical clustering results are used to construct the new classes of the specific supply chain ontology, which is automatically updated by means of an ontology constructor. The hierarchically clustering algorithm operates as an agglomerative clustering: the algorithm starts considering every data point as one single cluster and combines the most similar ones into super-clusters until it ends up in one main cluster embedding all sub-clusters. The distance between two points is estimated by the Euclidean distance. The number of clusters is preliminarily established according to the depth of analysis performed. The next step of the proposed approach is to refine the searching process, and the information contained in a part of the dendrograms (selected clusters) by means of association rules (AND and OR logic Boolean conditions) applied to a series of keywords, which can be, in part, suggested by Artificial Intelligence (AI) classifiers, and, in part, required as a further input of the engine (further user queries). For example, an input of the refinement research can be keywords contained in a csv file. The searching queries could ask the proximity to infrastructure (highways, railways, ports, airports, etc.) which is useful for logistics purposes, the geographical and socio-economic condition of the reference region, local marketing trends, etc. The last requirements are found on the web by means of a web scraping tool providing different results with a score validating the final exploration process. The score can be obtained by empirical indicators properly defined for the matching between the search goals and obtained results. The user’s final check is fundamental for the self-learning approach of the search engine according to the feedback systems of Figure 2. The approved results are finally adopted to update the supply chain ontology.

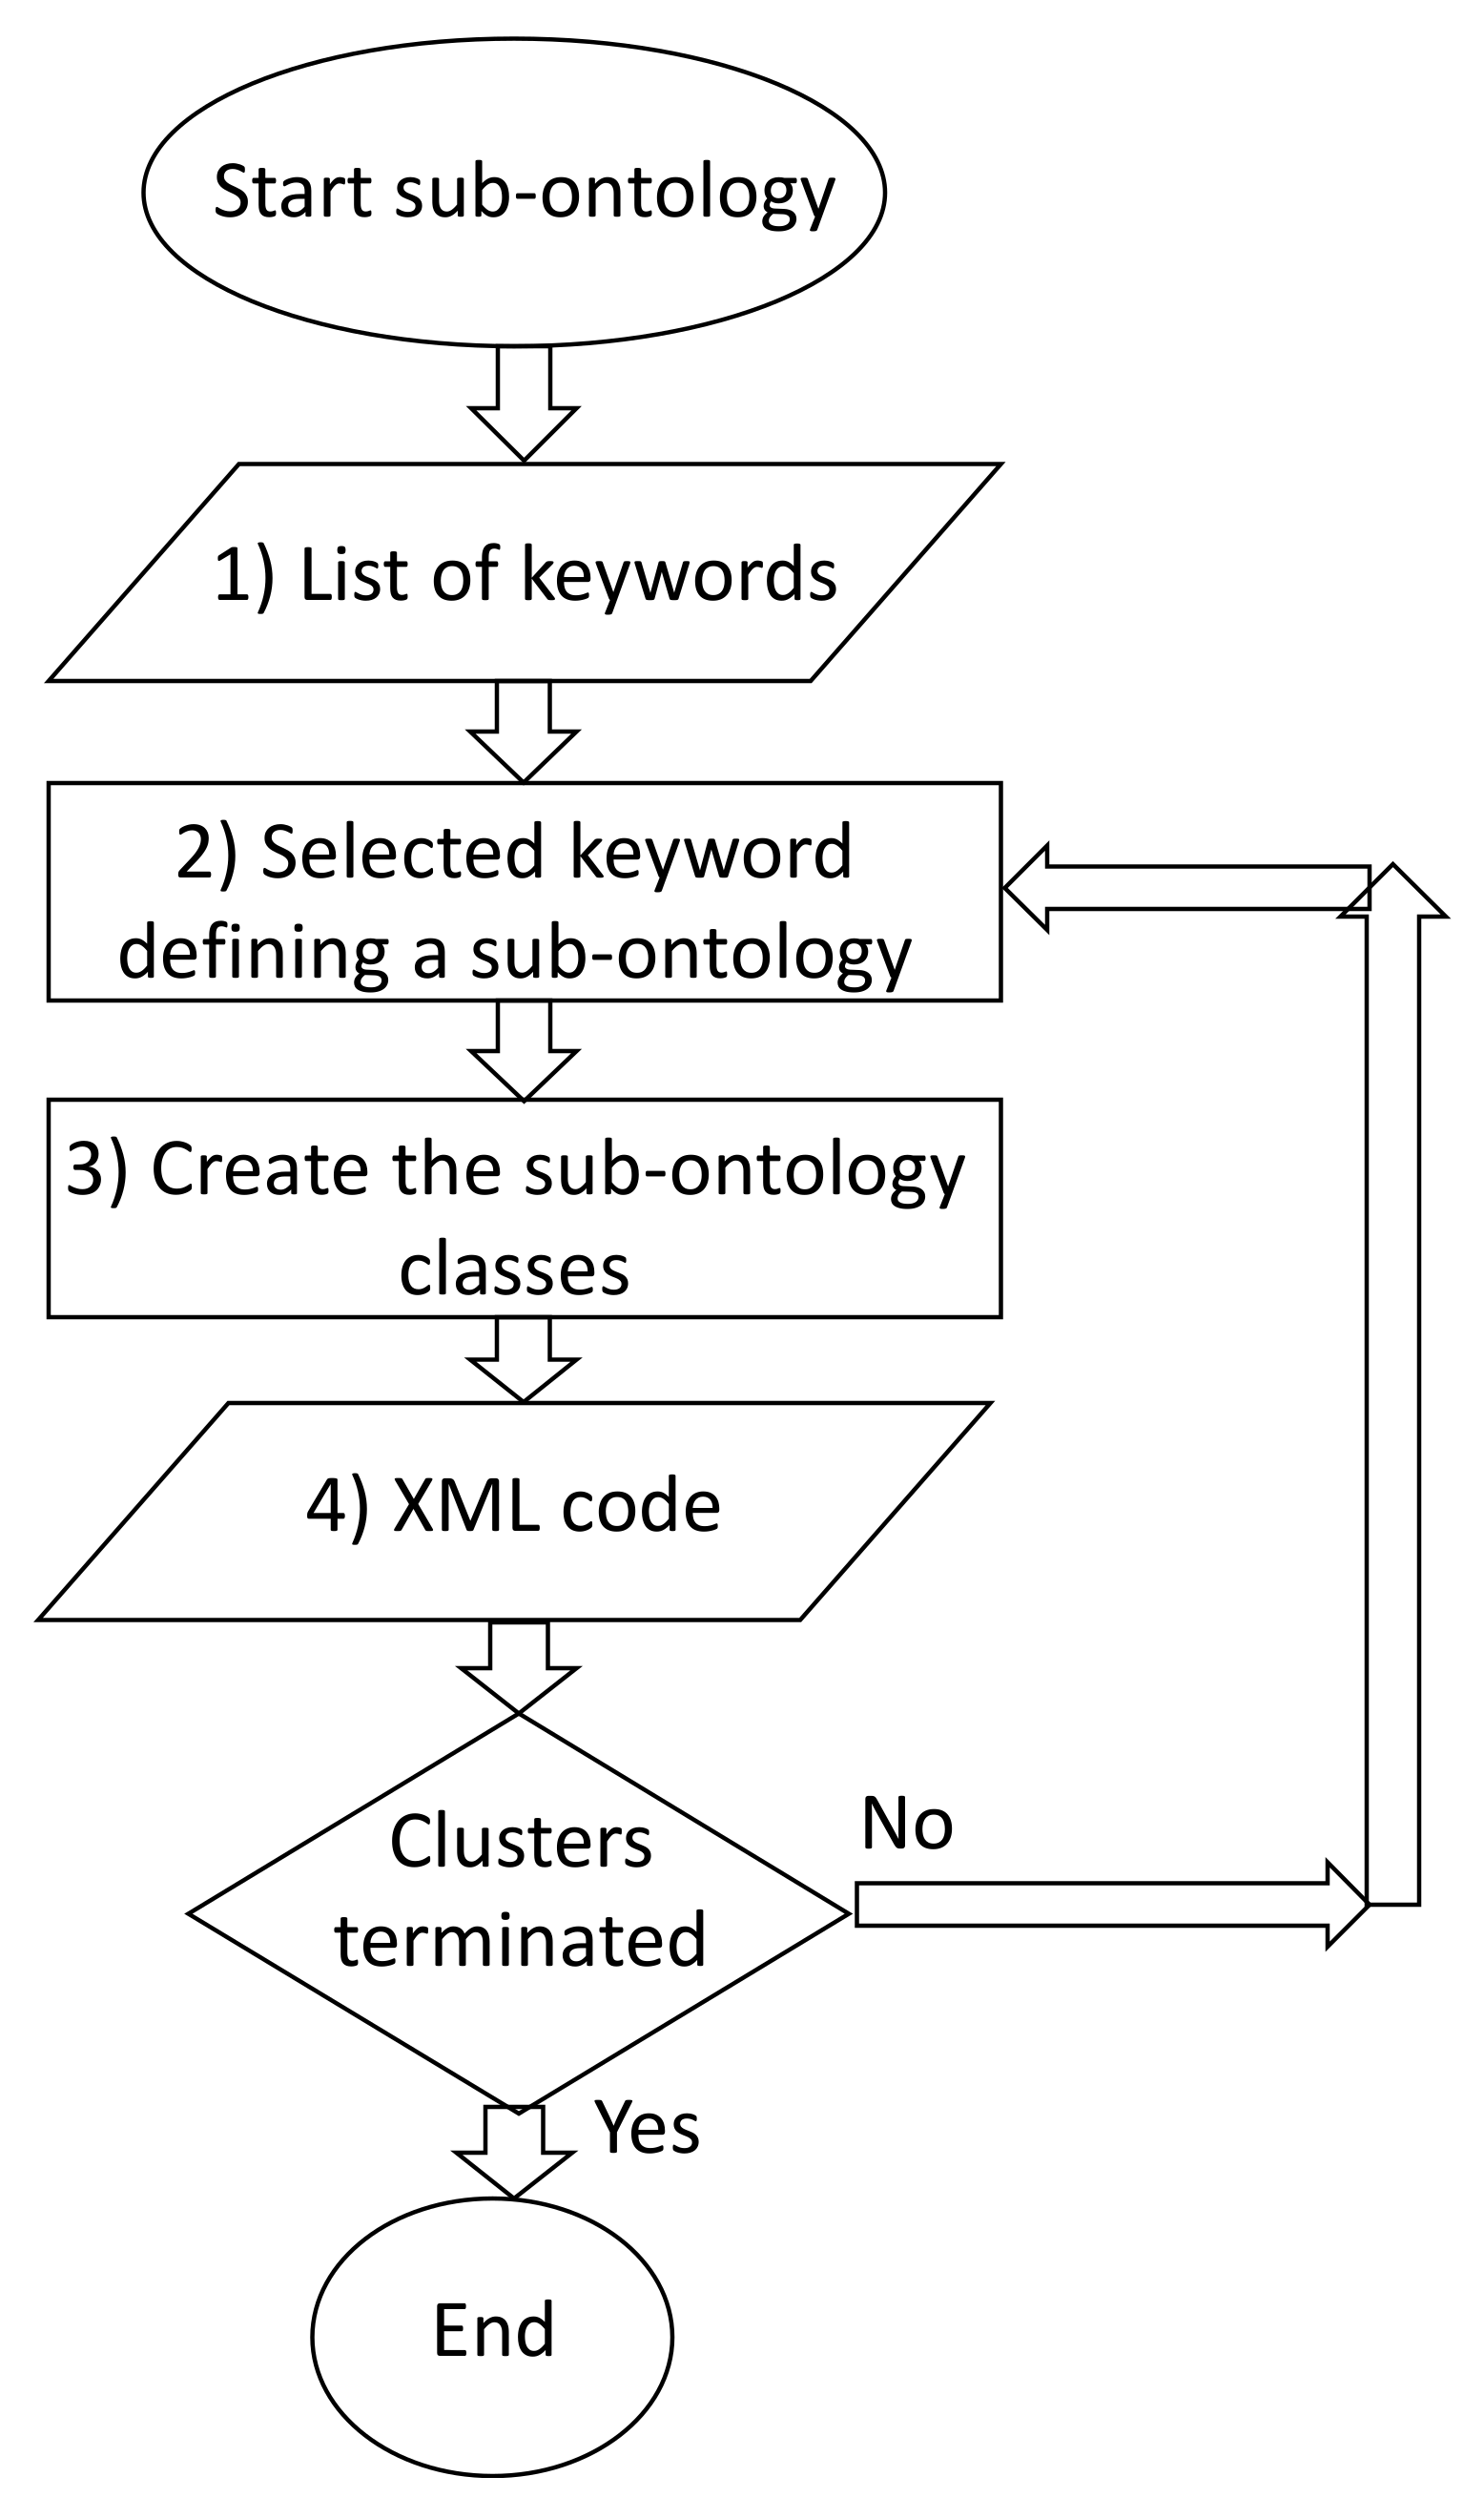
2.2. Automatisms Constructing SCO

The hierarchical clustering output starts the creation of sub-ontologies. All the created sub-ontologies will construct the whole SCO. The automatic update of the SCO is performed by executing the following pseudocode procedure:
Update procedure of a sub-ontology:
(1) 
Hierarchical clustering output: list of keywords (marketing, logistics, raw materials, etc.);
(2) 
Create the sub-ontology referring to a specific selected keyword;
(3) 
Create sub-ontology classes characterized by different features;
(4) 
Translate the cluster’s information into an XML structured code;
(5) 
Repeat for each sub-ontology (repeat from Step 2 until the clusters have ended);
(6) 
End of the procedure (clusters are terminated).
Figure 3 illustrates all the listed pseudocode steps.

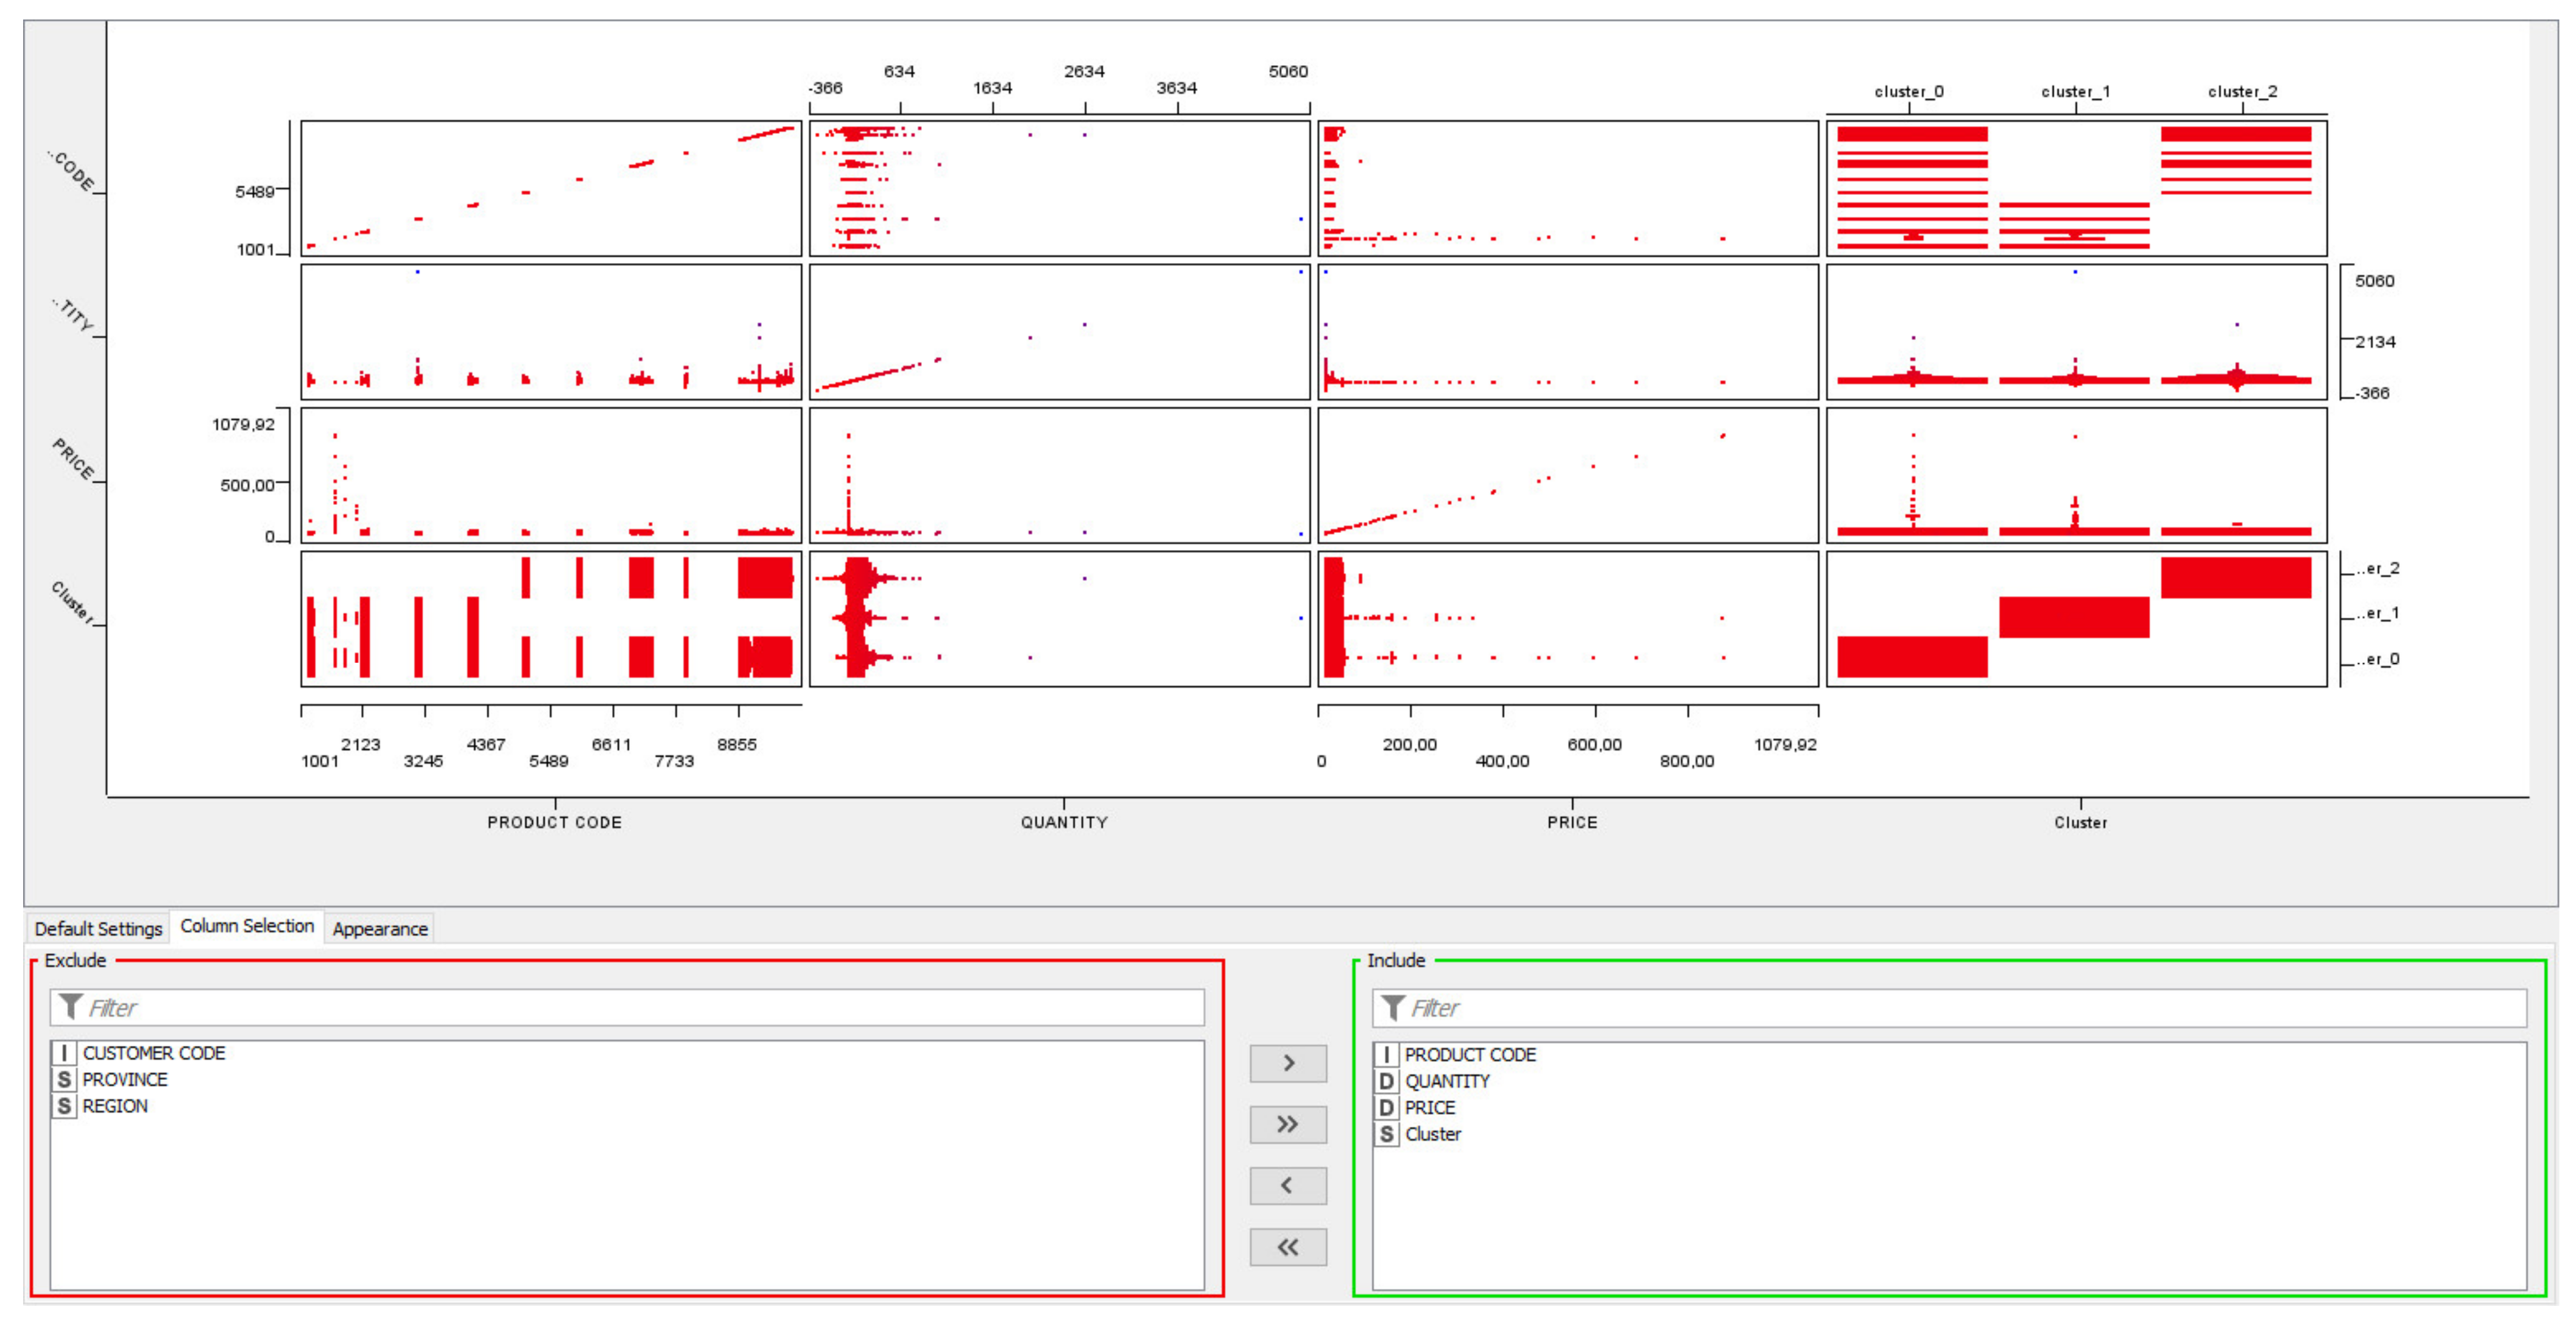
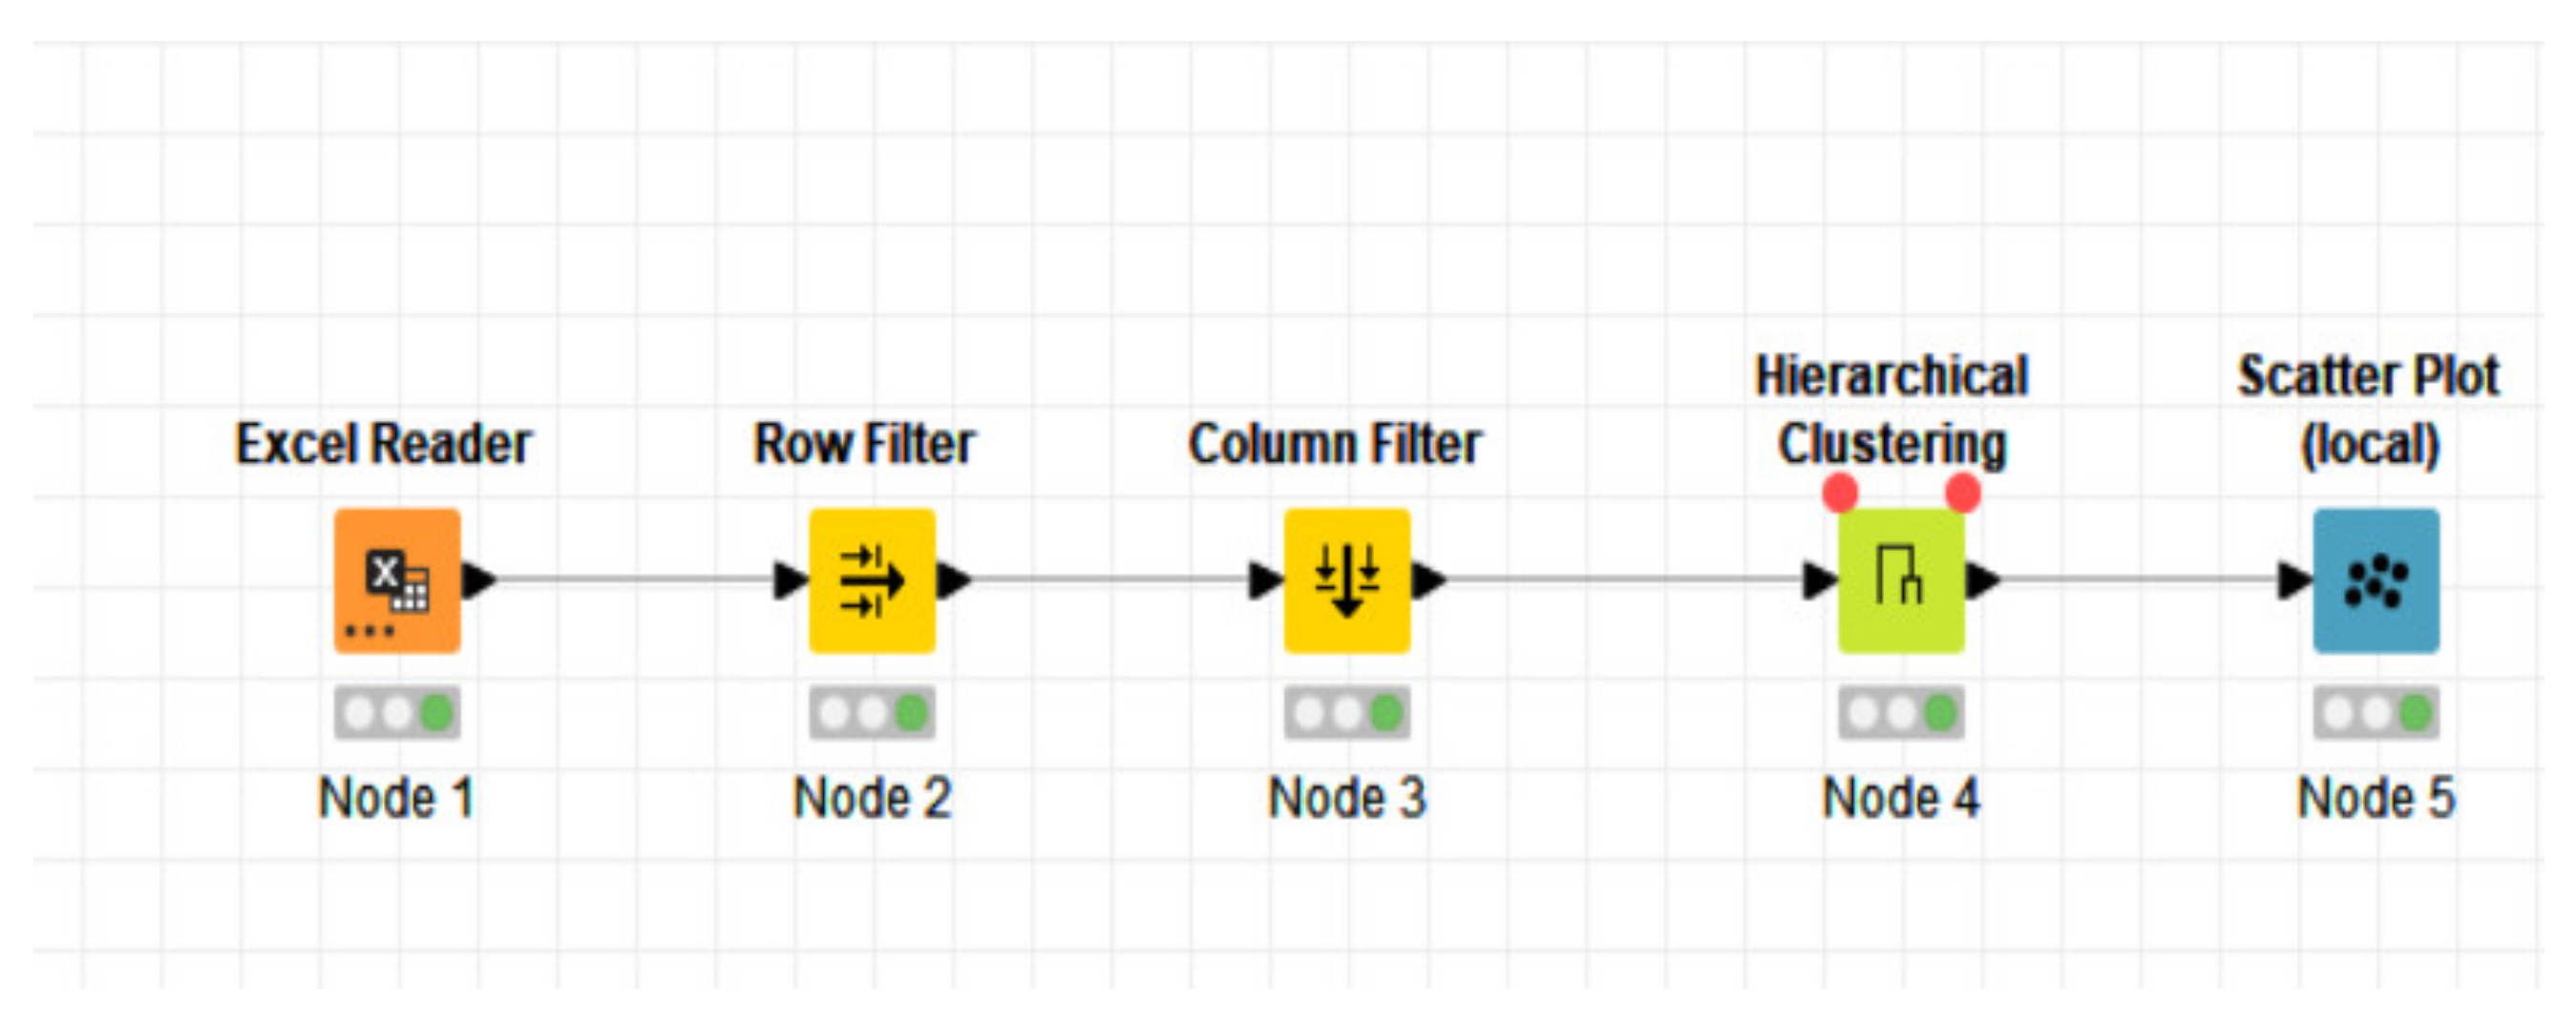
2.3. Examples of Preliminary Interfaces and Possible Technologies

For a preliminary check of the search engine, feasibilities are proposed as preliminary interfaces adopted mainly for Level 2 development. The first Graphical User Interface (GUI) is the Konstanz Information Miner (KNIME) workflow of Figure 4, implementing hierarchical clustering. The workflow is structured with linked objects. Specifically, the objects are:
-
Node 1 (Excel reader): object collecting local data to process (results of Level 1);
-
Node 2 (Row Filter): object selecting the specific row of the dataset to process;
-
Node 3 (Column Filter): object deleting some columns of the dataset to process by cleaning the dataset of unnecessary information (columns with useless data or information to process);
-
Node 4 (Hierarchical Clustering): object implementing the clustering algorithm;
-
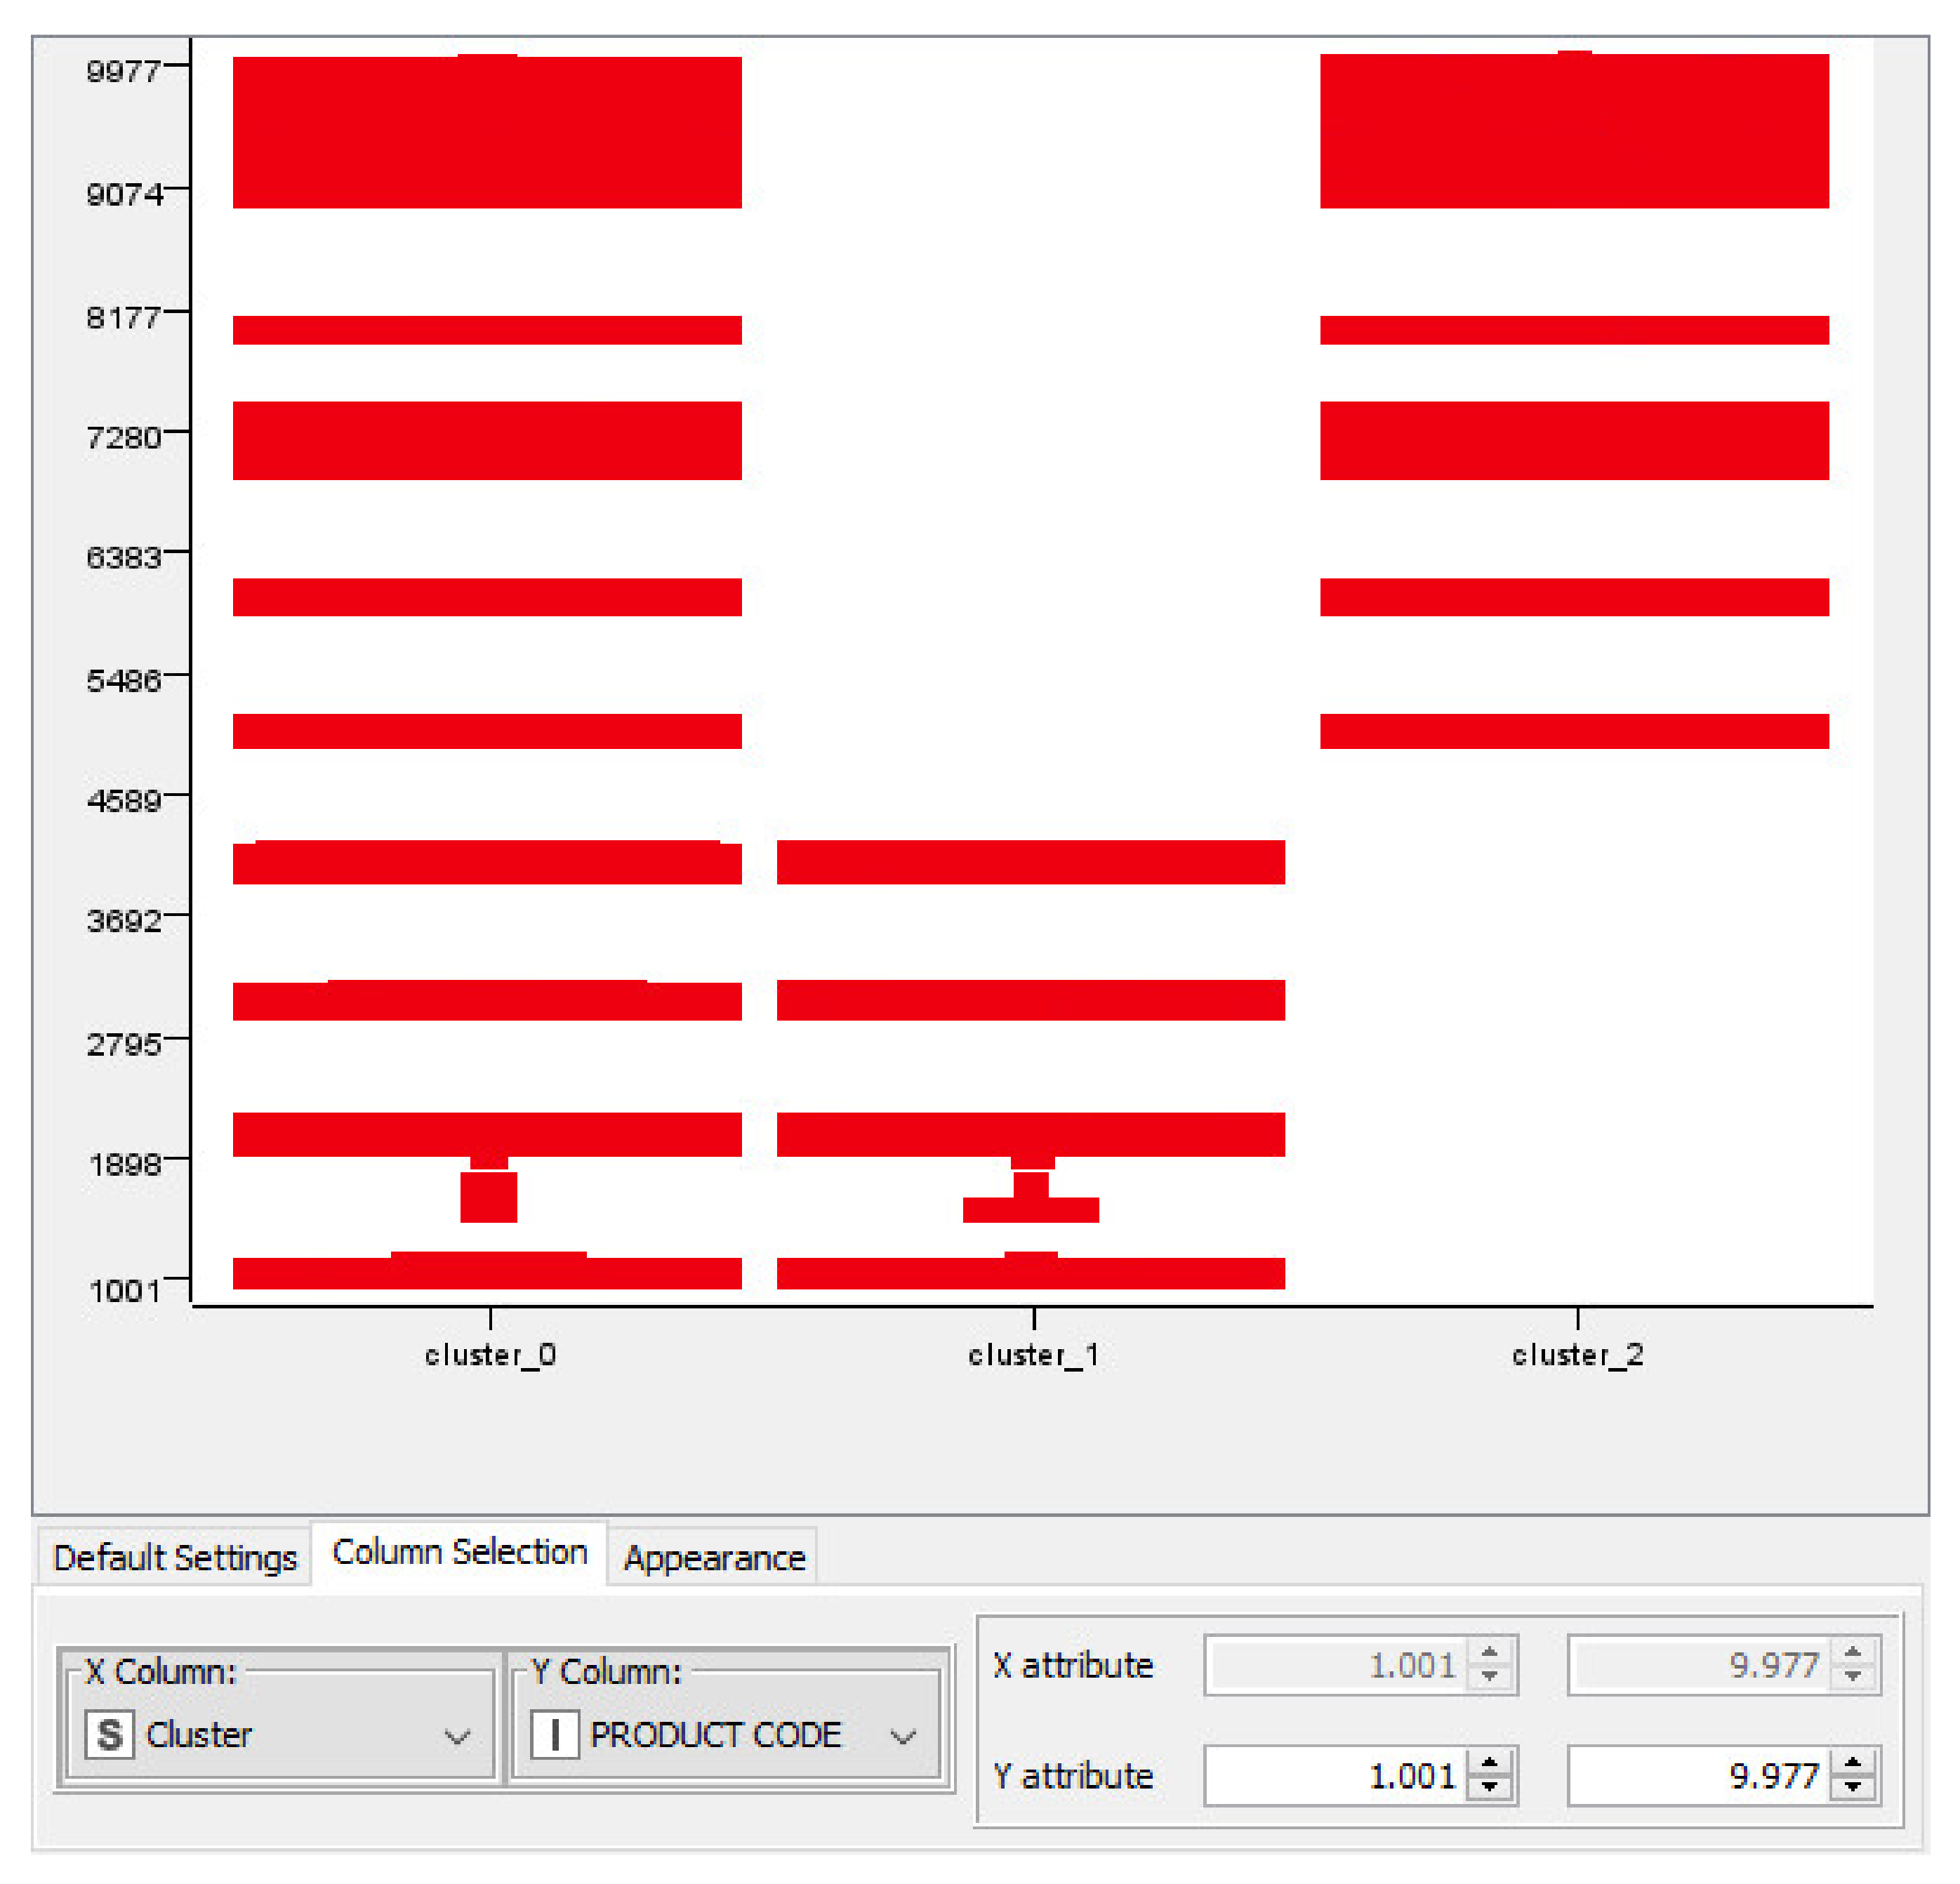
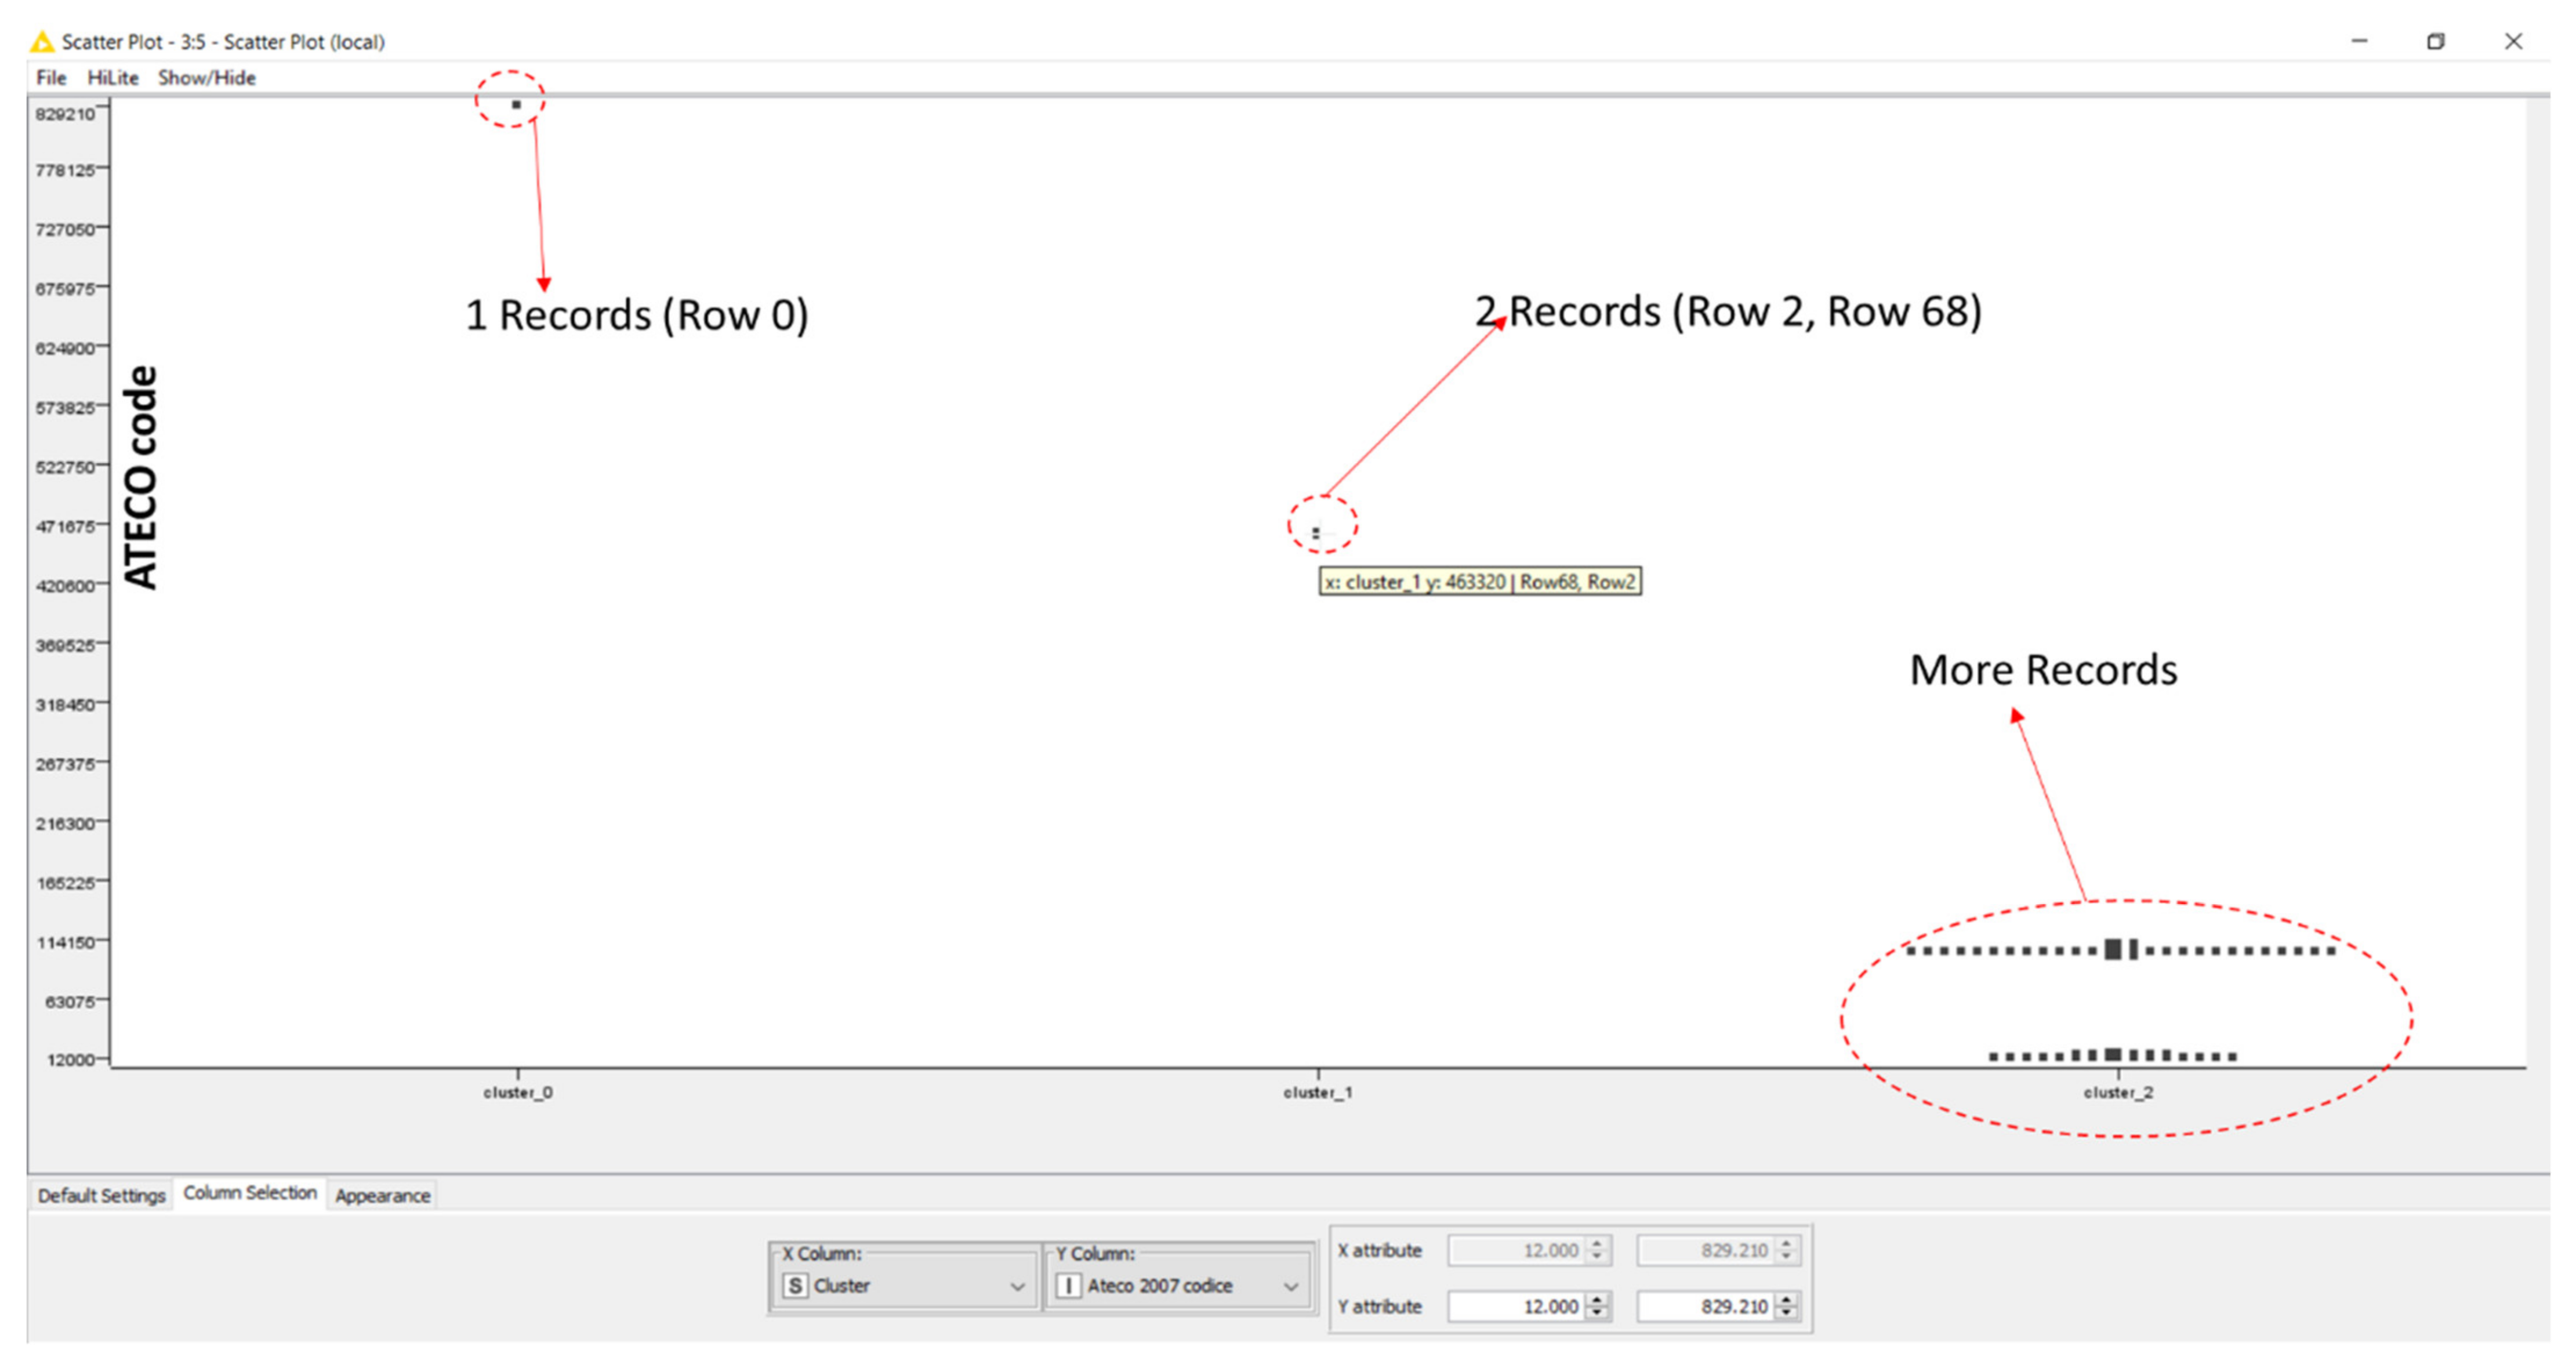
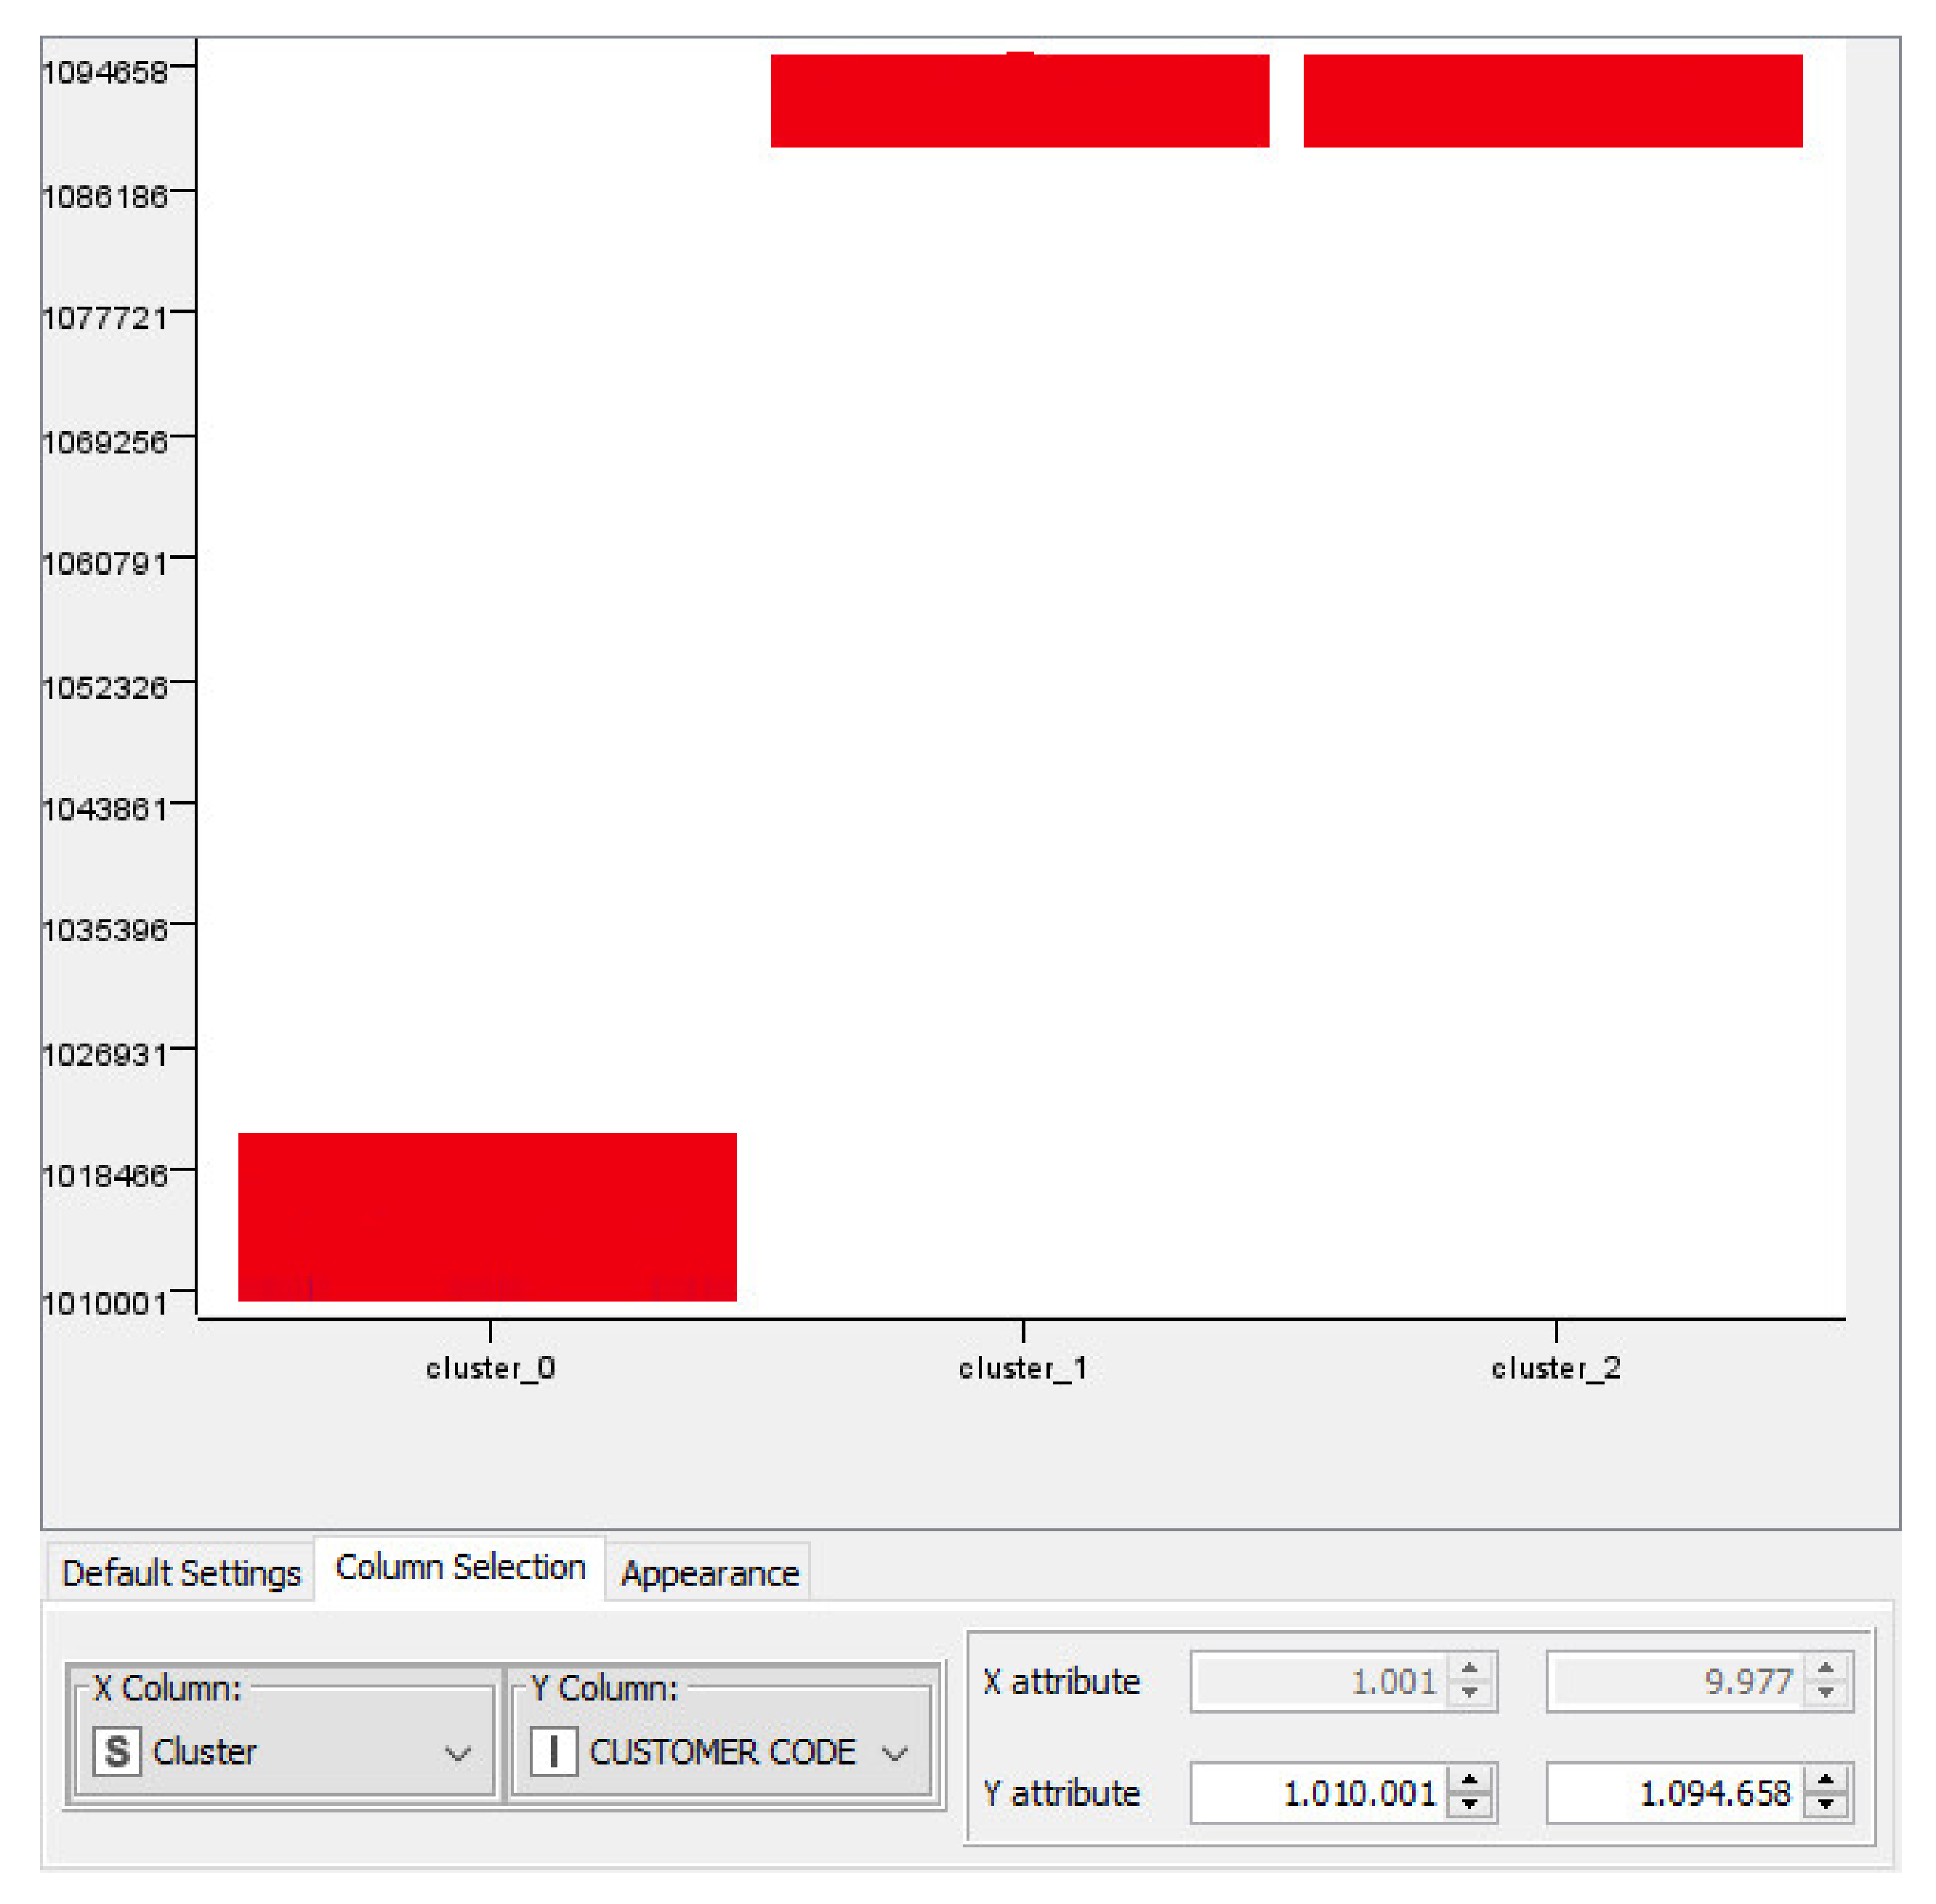
Node 5 (Scatter Plot): object providing graphical dashboards of the obtained results.
The dataset analyzed in the first preliminary results is composed of the following attributes:
-
Name;
-
Website;
-
VAT (number);
-
RAE (description);
-
NACE (description);
-
Legal form;
-
Address;
-
Province.
The analyzed dataset has been extracted as a result of the Level 1 searching process and is related to oil production and sales of cooperatives in the Apulia region. A table of 70 records of companies is processed by the hierarchical clustering algorithm providing refined information for a fixed number of clusters (k = 3 clusters exhibiting good performance in terms of cluster identification). The dendrogram of Figure 5 is the output of the hierarchical clustering algorithm indicating three estimated clusters and the related hierarchy: Figure 5 shows the clustering process grouping data by agglomerative approach (output of the KNIME workflow) by clearly identifying the tree clusters, where a cluster is characterized by a lot of records (Cluster_2). The inset plot of Figure 5 proves the correct choice of k = 3 as the best number of clusters for the data processing (good distances as thresholds to better distinguish the clusters being the distance marked). The results of Figure 5 are related to the search process of the oil cooperatives in the Italian Apulia region.
The closest dots are the data points appertaining to a specific cluster. The dendrogram scale of the y-scale represents the Euclidean distance between the analyzed clusters. The x-axis displays each data point identified by a row IDentification number (ID) associated to a dataset record.
By considering the second cluster (cluster_1), it is observed by the scattering plot of Figure 6 that there are only two records characterizing this cluster. These two records have the following meaning of the related ATECO codes: generic wholesale and marketing intermediaries (Row 2); wholesale of edible oils and fats (Row 68). At this step, the exploration can be refined by selecting the most specific field for oil marketing provided by the wholesale of eatable oils and fats.
The web scraping GUI used for the preliminary test is illustrated in Figure 7. In the proposed screenshot, it is possible to identify the whole field of the searching interface, including inputs and outputs.

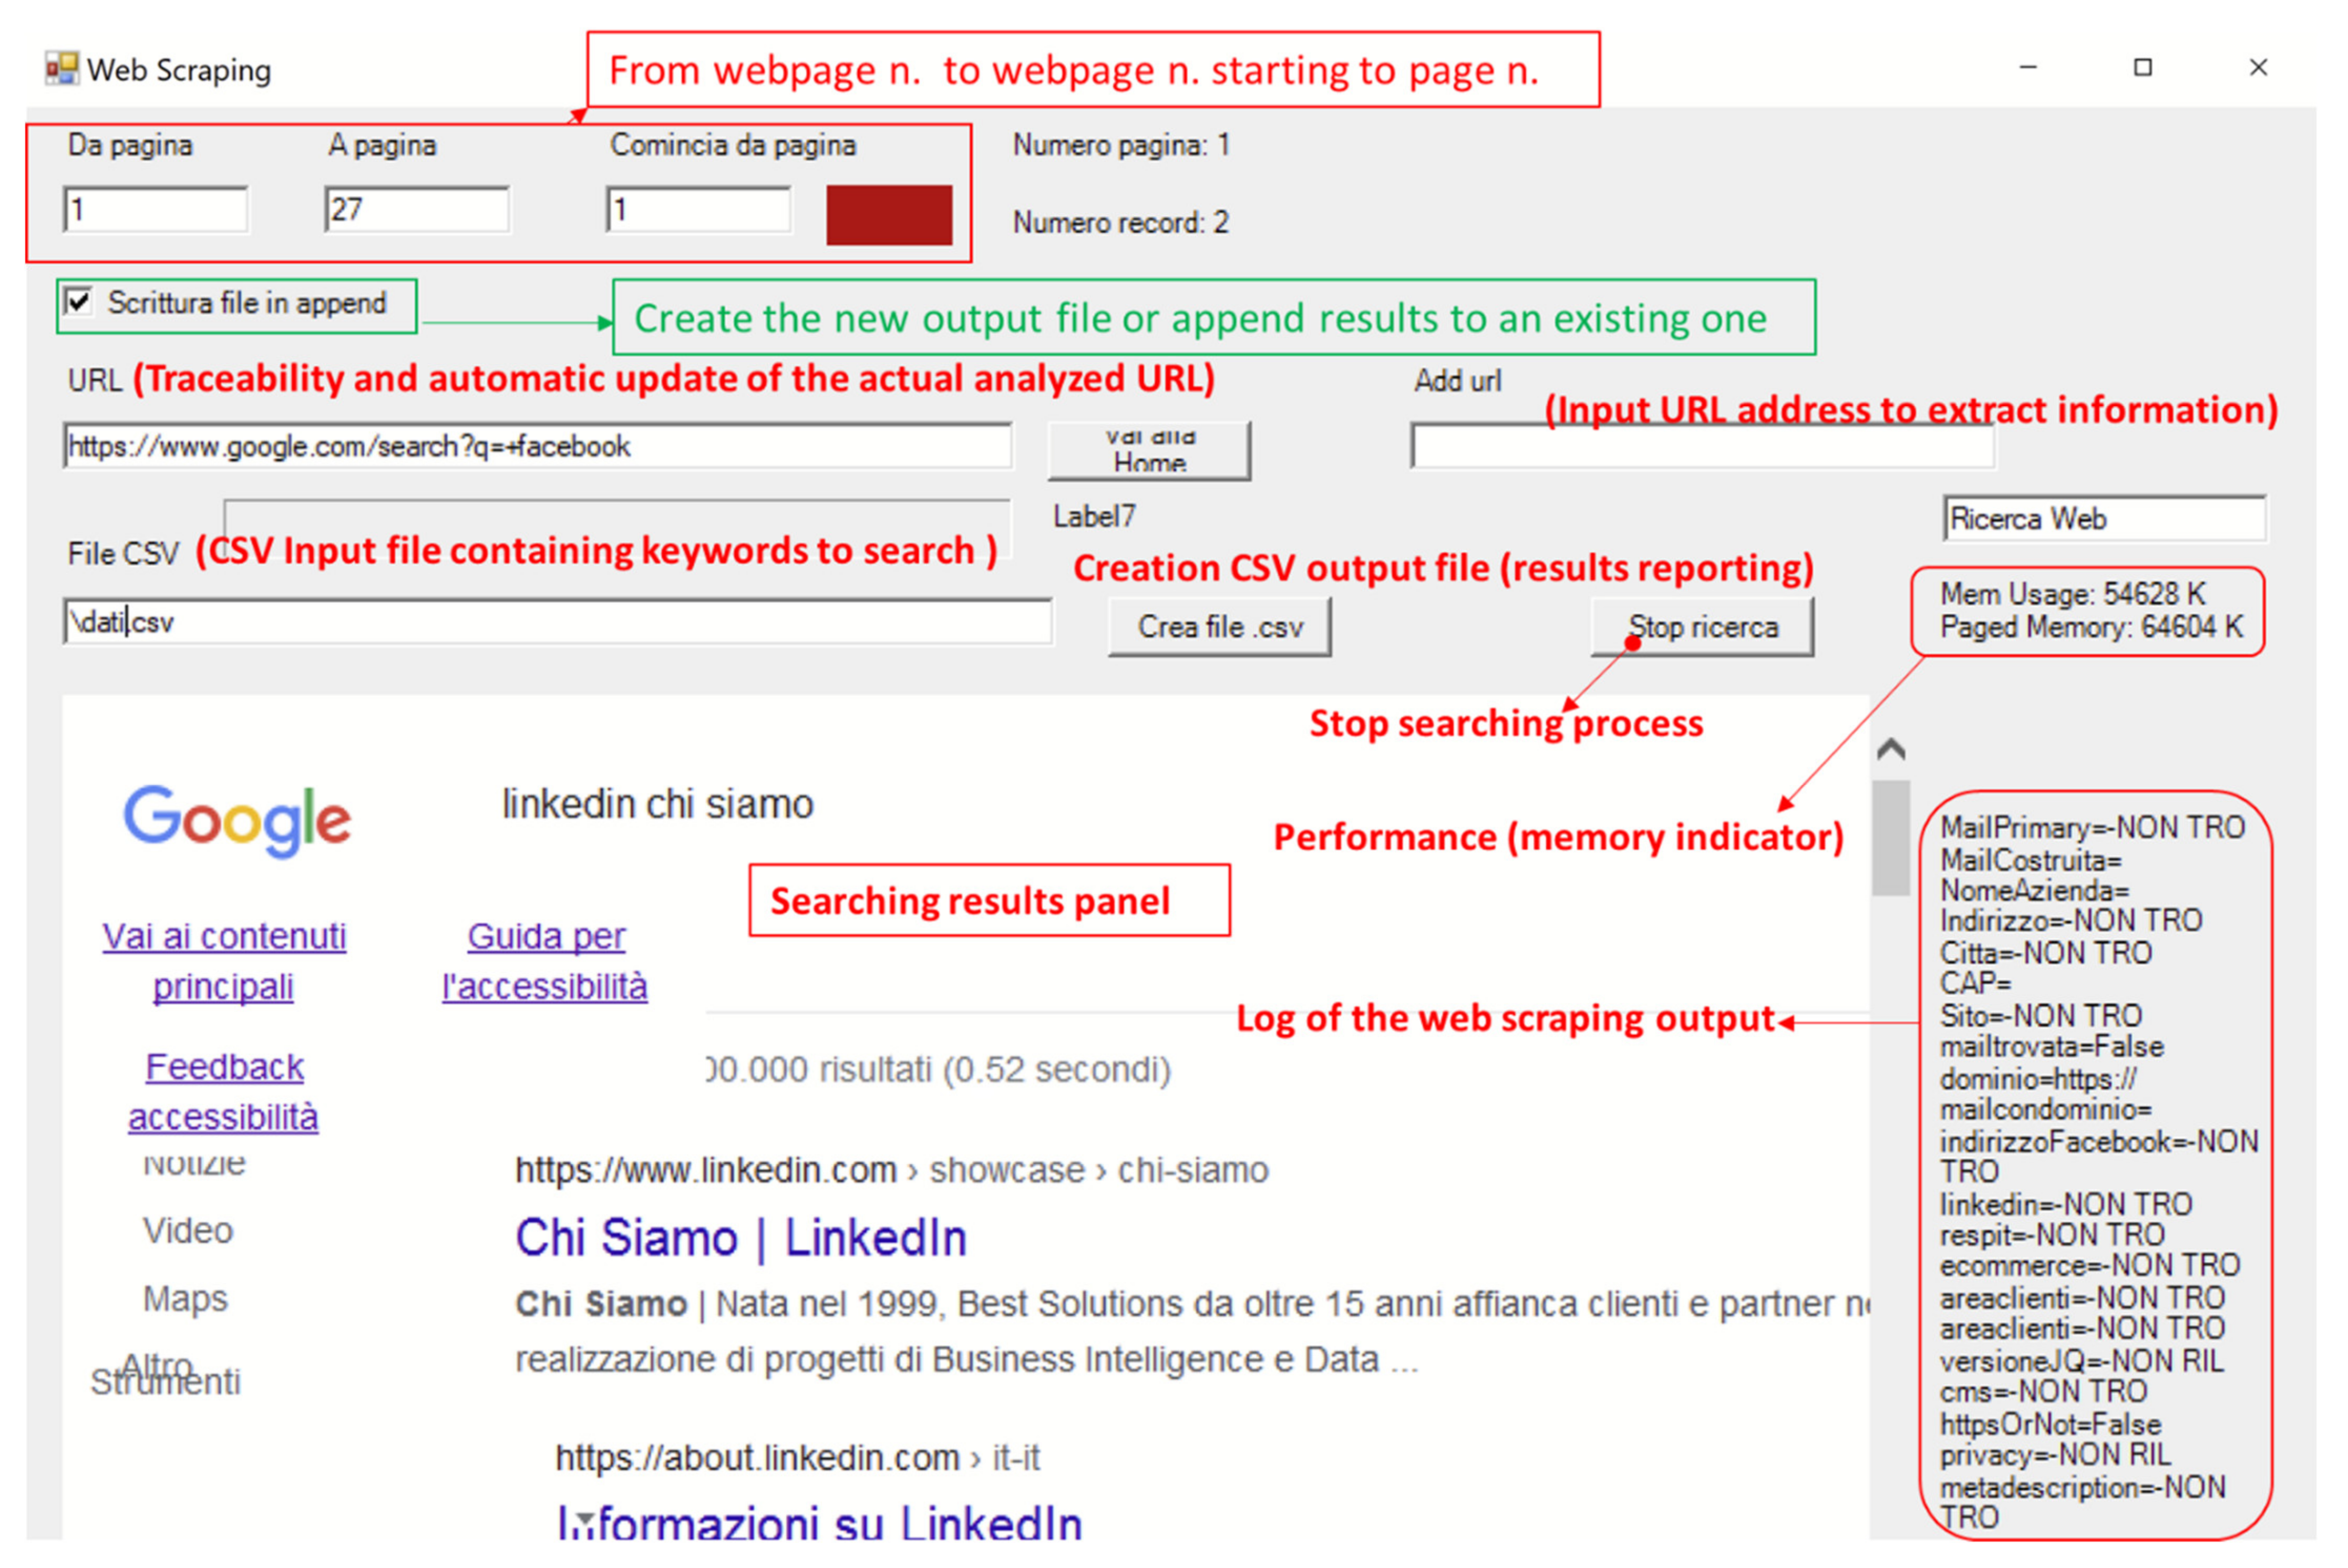
2.4. Web Scraping Approach

The core of the web scraping engine is the implementation of the association rules able to filter the research. An example of association rules is reported by the code below (Visual Studio code), where it is possible to distinguish a logic OR condition applied to the keywords “oil” or “oil crusher”, providing the exploration filtering (search refinement process).
If InStr(1, stringHTML, “oil”, CompareMethod.Text) > 0 Or InStr(1, stringHTML, “oil crusher”, CompareMethod.Text) > 0 Then District_relevance = “MATCHING”
End If
The output of the proposed query is indicated in the Log field of the web scraping interface layout (see Figure 7) and is stored in a CSV file summarizing the exploration results as “Keyword Found” and “Keyword not found”. The web scraping algorithm follows these functions sequentially by providing an automatic report:
(1) Inputs (keywords contained in the input CSV file);
(2) Inspects the webpage source (HTML protocol) of the search engine response and finds the specific tags (keywords);
(3) Searches if the present information box for the website of the searched company opens the site to search for additional keywords;
(4) Creates the csv output reporting file or adds (append function) a line to an existing one with the contents extracted by the scraping process.

2.5. Possible Technologies to Implement

Different technologies and tools can be integrated to implement the designed search engine in Figure 2. In Table 2, some technological solutions are listed; they are also open source.
An important aspect of the integration of different technologies is to create a framework as a “universal packaging” approach that bundles up all application dependencies inside a container, which is then run on an engine (for example, Docker Engine). In this way, it is possible to adopt different technologies into a unique container (deployment in a container) by simply setting input and output “ports”. The container enables containerized applications to run anywhere, consistently, on any computer infrastructure. The AI classifiers can also be adopted to suggest complementary keywords contained in a digital text related to a specific supply chain: the classification is able to associate phrases containing initial keywords with similar, new ones. In this case, the AI algorithms could suggest a series of keywords where one part is defined by the user and the other part is suggested by the AI engine. Supply chain ontology (SCONTO) is a good alternative to construct the supply chain ontology. It is organized into three complementary sub-ontologies: SC processes (SCOPRO), performance evaluation (SCOBE) and benchmarking (SCOME) [46]. The text mining can be improved by means of semantic search engines suitable for the supply chain [46,47,48,49].

3. Partial Results of a Case Study and Discussion

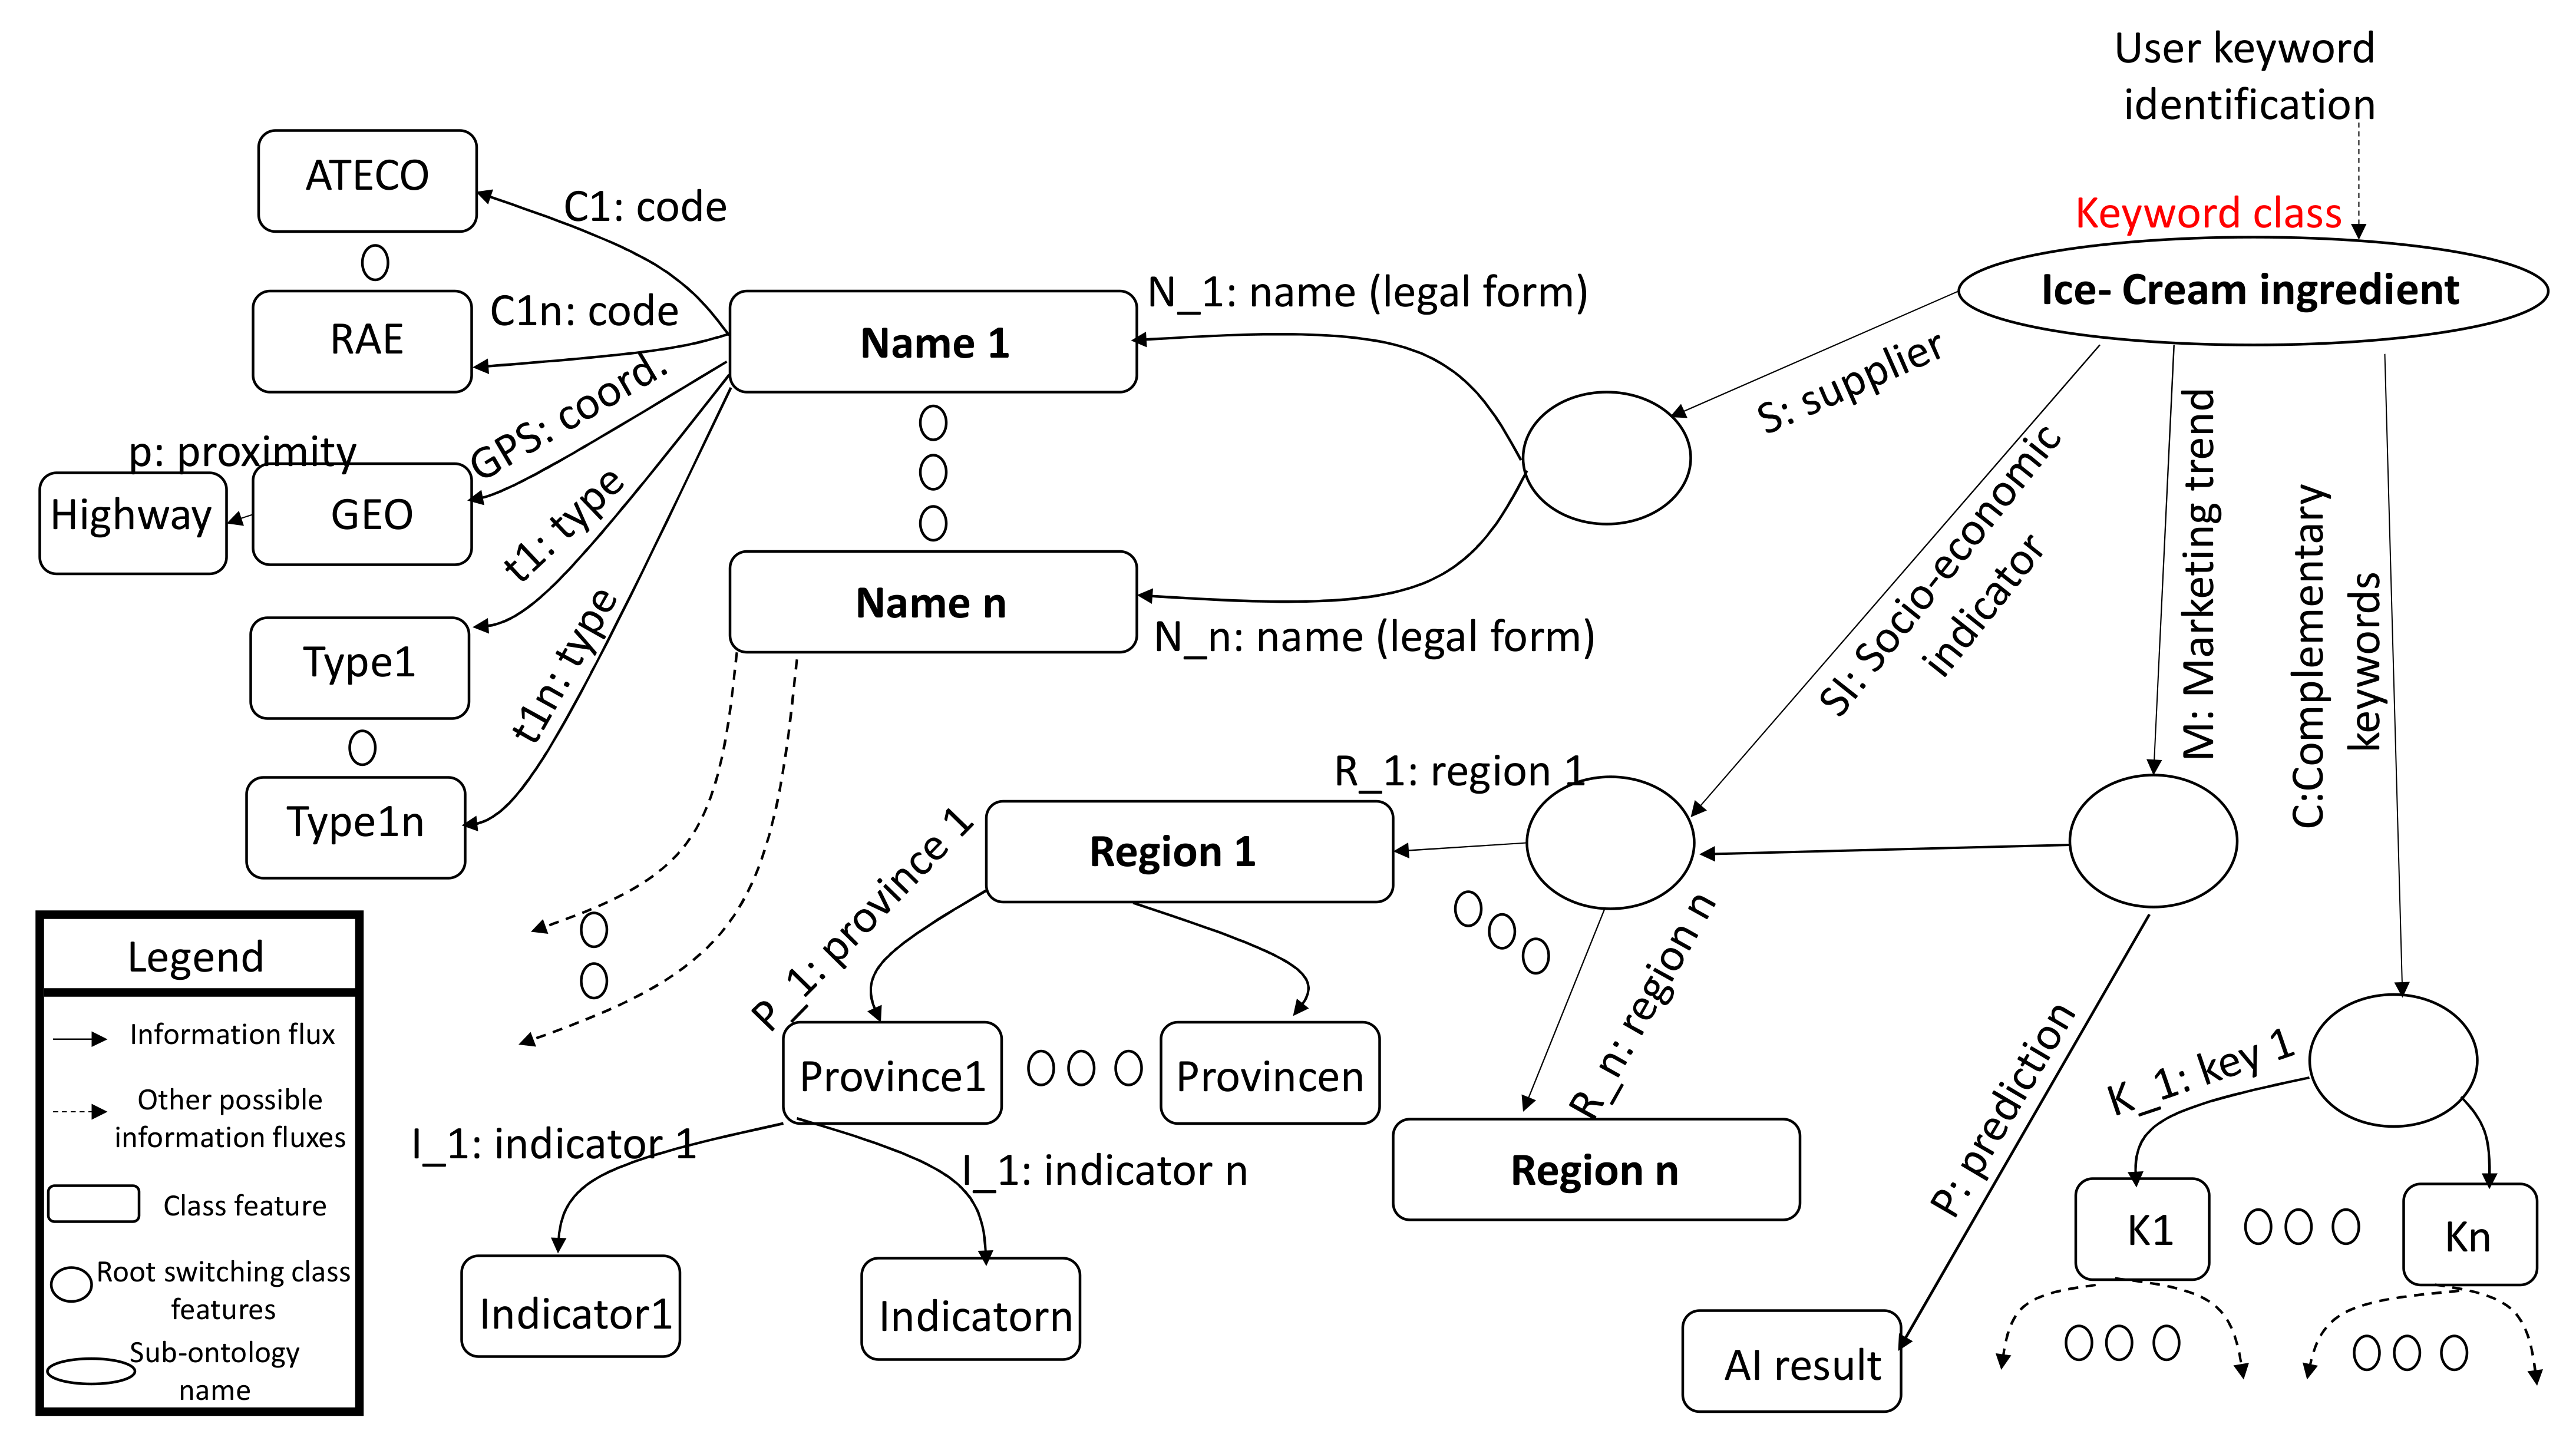
3.1. Example of Procedures to Apply to Construct an Ontology: The Case of the Ice Cream Supply Chain

The agri-food sector is much more oriented to the quality of the raw materials used to produce the products, as consumers are more sensitive and seek high-quality products. We have analyzed the specific case of an Italian company that produces ice cream. Together we have identified a need in the world ice cream sector, working on products that respond to these needs, but that mainly started with high-quality and careful selection of materials.
In order to better comprehend the procedures to follow in order to define the correct keywords to search, provided in this section is an application example concerning an Italian case study of the ice cream supply chain. The survey is oriented by the definition of the keywords that will be considered useful for the specific exploration. In Table 3, all the queries suitable for the Levels 1 and 2 searching processes inherent in the case study are listed. The queries in Table 3 facilitate the construction of the ontology model. In Figure 8, an example of an ontology graph model related to the specific case study is shown. The main graph of Figure 8 indicates an augmented sub-SCO model taking into account many key classes, such as suppliers, socio-economic indicators, marketing trends and other complementary ones according to the case study (requirements of the company producing ice creams involved in the project). The hierarchical clustering is mainly indicated to group suppliers about activities, geolocalizations and other characteristics by extracting information from ATECO and NACE attributes.
The queries in Table 3 supporting the searching process are ordered following the approach shown in Figure 2, where they are identified in two main stages: “Queries level 1” as preliminary indications about the application field mainly, and “Queries level 2” concerning searching refinement following a question proposed to the CEO of the pilot company involved in the study.
More complex graphs can be obtained by refining the searching process in different steps, and by enriching the classes of the keywords and the related relationships at the same time.

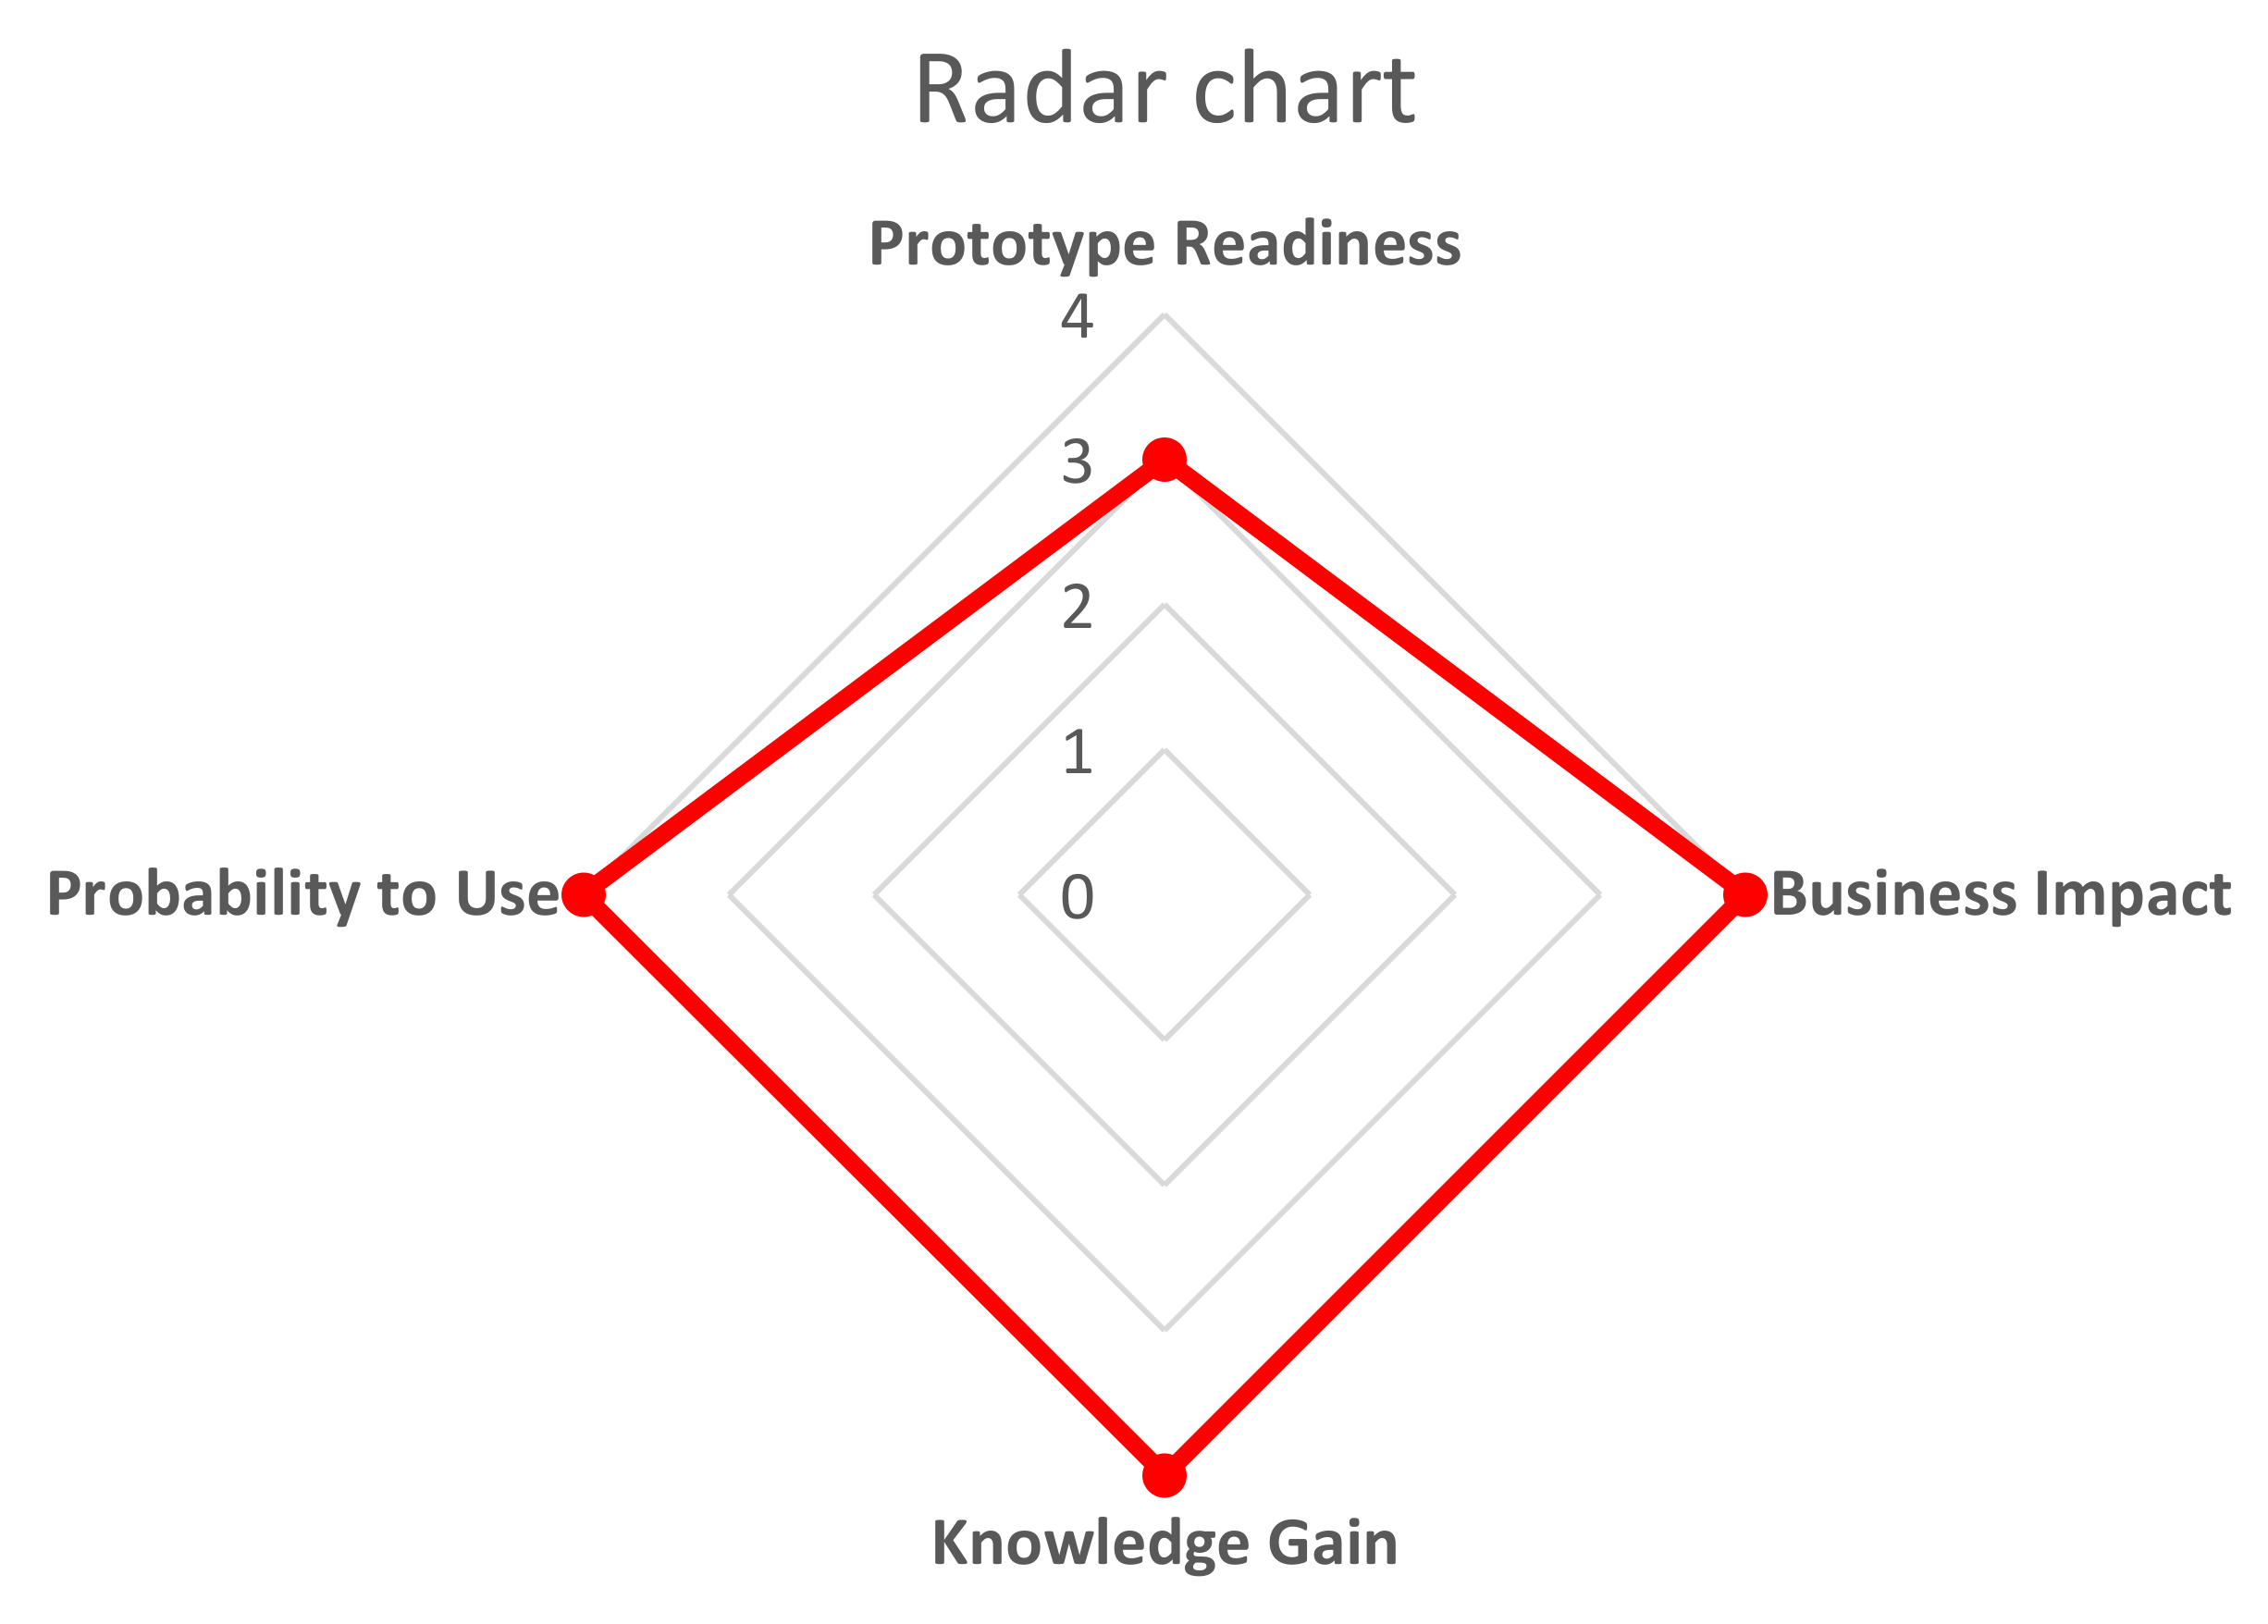
3.2. Originality, Performance and Advantages of the Proposed Solution

The proposed multi-level searching approach allows a pre-screening of the supply chain data useful to optimize business and production. The creation of a precise supply chain ontology due to the pre-screening process allows the computational cost for the execution of ML algorithms to decrease, optimizing the outputs. The use of only Level 1 (information searching by codes) could provide a high percentage of useless information, while the results obtained at the output of Level 2 always reaches an efficiency of 100%. Moreover, ML has never been integrated in a structured way as in the proposed model. In order to highlight the importance of ML in information selection and classification, an example of the case study of the ice cream supply chain is discussed in Appendix A, where the ML k-Means algorithm provides an important classification useful for constructing the supply chain ontology (association between ingredients, grouping of ingredients constituting a semi-product and the geolocalization of actors processing ice-cream semi-products). The application stage of ML indicated in Figure 2 is explained in Appendix A. The geolocalization of suppliers and of other actors supports the strategies to be applied to the whole supply chain, providing the best district areas (regions, provinces and cities) and supporting production and marketing. Furthermore, the analysis of the district area provides new useful economic indicators classifying district areas for a specific supply chain, such as:
I = (turnover of companies of the selected area/total turnover of the district area) × (index of consumption of the specified product/100).
The main advantage of the proposed approach is the possibility of constructing not a generic supply chain ontology but a precise one based on the refinement of sub-ontologies structures. By means of the refinement of knowledge, it is possible to eliminate redundant information that could suggest the wrong decision for the company’s business and strategies. The integration of each precise sub-ontology into a unique information system provides an efficient full scenario of the specific supply chain and a well-structured knowledge base. Moreover, a lot of web information is hidden, and the proposed search system is used to extract this information through the web scraping approach, providing a digital report of web search results (see Appendix B, where an example of the output report suggesting ingredient producers in a specific region is indicated) and supporting the knowledge base construction. Finally, the data clustering is performed more efficiently after a pre-screening of preliminary keywords. The SD 4.0 developed project [18] proves that for different pilot case studies, a search engine is a useful tool for efficient business models. Specifically, concerning the case of the ice cream supply chain, the validation criteria described in [50] provide the radar chart of Figure 9, denoting a good perspective about the use and business impact supported by the knowledge gain. Concerning the prototype readiness, the full integration of all the technologies described in the technology matrix of Table 2 is in progress, with the goal of realizing a complete search engine made with a unique user interface. The adoption of KNIME GUIs moves the research precisely toward an easier use of these technologies for entrepreneurs (final user of the searching engine).
In Table 4, the main advantages and disadvantages of the research element of the proposed approach are summarized.

4. Conclusions

The work discusses a methodological approach for finding structured information about a specific supply chain. Starting with the searching of keywords related to a specific product or sub-product, the proposed method can be developed by means of different technologies, including supply chain ontology models, ML algorithms and the web scraping approach. Some of these technologies have been tested to prove the feasibility of the method development. The simultaneous use of different technologies provides a new concept of search engine for industries, which can also be applied to international production districts by integrating open data sources and analyzing other web portals. The proposed approach is suitable for innovative consulting services for industries or for the realization of a new software product containing libraries from different company supply chain ontologies. The automation and the AI self-learning approach allow the potential to optimize the ontologies by exploiting the user keyword requests and other digital information. Finally, an example of user request defining keywords of the ice cream supply chain is provided, which is suitable to comprehend how to optimize the exploration and to understand the mechanisms of the ontology model construction. In summary, the work focuses on the supply chain searching approach based on two information classification levels addressed to construct an SCO. Different examples are proposed to explain ontology construction mechanisms, including hierarchical clustering, web scraping and sub-ontology construction related to a pilot case study of a ministerial project of Smart District 4.0. In order to highlight the importance of the ML classification, an application example about the K-Means algorithm defining the supply chain district area and supporting the ontology construction and the formulation of new indicators based on the geolocalization concept is provided.
Future work will concern the full implementation of the proposed model developing the technologies described in the work. The implementation of the ML classification algorithm directly in the web scraping tool is under testing (see Appendix C).

Author Contributions

Conceptualization, A.M., G.C. and N.M.; methodology, A.M.; software, G.C. and A.M.; validation, A.M. and A.C.; formal analysis, N.M.; investigation, A.M., G.C. and N.M.; resources, N.M.; data curation, G.C. and N.M.; writing—original draft preparation, A.M.; writing—review and editing, A.M.; visualization, G.C., A.M. and N.M.; supervision, N.M.; project administration, N.M.; funding acquisition, N.M. All authors have read and agreed to the published version of the manuscript.

Funding

All the applications have been deployed by a unique IT collaborative framework developed within the Smart District 4.0 Project: the italian Fondo per la Crescita Sostenibile, Bando “Agenda Digitale”, D.M. 15 October 2014, funded by “Ministero dello Sviluppo Economico”. This is an initiative funded by the contribution of the Italian Ministry of Economic Development aiming to sustain the digitization process of the Italian SMEs.

Data Availability Statement

Not applicable.

Acknowledgments

The authors thank the partner Noovle for the collaboration provided during the work development. The authors thank the collaboration of FEPA srl company (ice cream supply chain). The authors thank thesis author Gianluca Scisci for his contribution: “Data-Driven Business Model e innovazione digitale: il caso LUM Enterprise” (“Data-Driven Business Model and digital innovation: the LUM Enterprise case study”).

Conflicts of Interest

The authors declare no conflict of interest.

Appendix A. ML K-Means Data Processing: Classification of Ice Cream Ingredients Matching with Regions and Provinces of Supply Chain District

The analyzed dataset is constituted by 1.011.422 records of the pilot company characterized by the following attributes: Product code (ice cream semi-product characterized by different ingredients), Customer code (customer working to transform the semi-product in final ice cream product), City (city of the customer), Province, Region, Quantity and Price.
Data are extracted from the Enterprise Resource planning (ERP) of the pilot company (experimental dataset). The K-Means approach is suitable as the ML algorithm to group ice cream ingredient features with geolocalized characteristics of the actors of the supply chain (customers, such as shops and restaurants, processing ice cream ingredients to offer the final product). In Figure A2 the scattering matrix output of the K-Means KNIME workflow of Figure A1 is shown. Figure A3 and Figure A4 are extracted from Figure A2 and illustrate the grouping of semi-products and the customers versus three clusters (group of ingredients), respectively: the semi-products identified by codes are composed of different ingredients, which can be combined into semi-product clusters (classification of groups of ingredients), and the same clusters are correlated with customers processing ingredients that are localized into the territory (specifically in data processing the ingredients are associated to customers of the Piemonte region and of the province of Torino). In conclusion, the processed data provide a classification of the ice cream ingredients corresponding to a specific region, province and city of Italy, as for the scheme of Figure 8. The new indicators that can be defined are related to the identification of the best group of ingredients sold in a specific district area. Due to the data pre-screening, only 3 s are necessary to process the 1.011.422 records by a laptop PC (Intel Core i5; 2.40 GHz; 8 GB, 64-bit system). An example of the association between product code and ingredients is illustrated in Figure A5. AI classification can be performed by other ML supervised or unsupervised classification algorithms.
Figure A1. K-Means KNIME workflow (left) classifying semi-product’s features and related functions of the workflow of Figure 2 (right). The KNIME workflow is an example of the improvement of the refinement searching process.
Knowledge 02 00015 g0a1
Figure A2. KNIME scattering matrix output of the workflow of Figure A1. The analyzed variables are: product code, quantity, price and cluster number (cluster_0, cluster_1, cluster_2).
Knowledge 02 00015 g0a2
Figure A3. Data extracted from Figure A2: product codes grouped into 3 clusters (k = 3).
Knowledge 02 00015 g0a3
Figure A4. Data extracted from Figure A2: customer codes grouped into 3 clusters (k = 3).
Knowledge 02 00015 g0a4
Figure A5. Screenshot of the cream (“panna”) semi-product datasheet (code 5043 appertaining to the district area of the province of Torino) appertaining to cluster 0 and cluster 2 (each semi-product is composed of different ingredients). The red highlighted parts indicate information about the product code and ingredients type.
Knowledge 02 00015 g0a5

Appendix B. Example of Web Scraping Outputs

Below some examples are reported of web scraping digital translated reports:
  • Semi-finished products for ice cream
These companies were obtained following a search carried out on the web with the keywords “Region A ice cream preparations”.
  • Wholesale fruit
These companies were obtained, in part, by filtering with the following codes and checking the websites of individual companies:
Ateco 2007Ateco 2002RAE
463100
463110
513100617
The remaining companies are the result of a search conducted on the web with the keywords “wholesale fruit in Region A”.
  • Milk suppliers
These companies were obtained following a search carried out on the web with the keywords “Region A milk producers”.
Table A1. Example of Web Scraping output.
N.Company CategoryAteco 2007Ateco 2002RAEWebsitesWeb SearchWeb Keywords
1Semi-finished products for ice cream YESYESRegion A ice cream preparations
2Wholesale fruit in Region A463100
463110
513100617YESYESwholesale fruit in Region A
3Region A milk producers YESYESRegion A milk producers

Appendix C. Artificial Neural Network (ANN) Visual Basic Code Integrated in the Web Scraping Tool

Class Dendrite
Public Class Dndr
 Dim _weight As Double
 Property Weight As Double
   Get
   Return _weight
  End Get
  Set(value As Double)
   _weight = value
  End Set
End Property
Public Sub New()
  Me.Weight = r.NextDouble()
End Sub
End Class
Class Neuron
Public Class Nrn
Dim _Dndrs As New List(Of Dndr)
Dim _DndrCount As Integer
Dim _bias As Double
Dim _value As Double
Dim _delta As Double
Public Property Dndrs As List(Of Dndr)
  Get
   Return _Dndrs
  End Get
  Set(value As List(Of Dndr))
   _Dndrs = value
  End Set
End Property
Public Property Bias As Double
  Get
   Return _bias
  End Get
  Set(value As Double)
   _bias = value
  End Set
End Property
Public Property Value As Double
  Get
   Return _value
  End Get
  Set(value As Double)
   _value = value
  End Set
End Property
Public Property Delta As Double
  Get
   Return _delta
  End Get
  Set(value As Double)
   _delta = value
  End Set
End Property
Public ReadOnly Property DndrCount As Integer
  Get
   Return _Dndrs.Count
  End Get
End Property
Public Sub New()
  Me.Bias = r.NextDouble()
End Sub
End Class
Class Layer
Public Class Lyr
Dim _Nrns As New List(Of Nrn)
Dim _NrnCount As Integer
Public Property Nrns As List(Of Nrn)
  Get
   Return _Nrns
  End Get
  Set(value As List(Of Nrn))
   _Nrns = value
  End Set
End Property
Public ReadOnly Property NrnCount As Integer
  Get
   Return _Nrns.Count
  End Get
End Property
Public Sub New(NrnNum As Integer)
  _NrnCount = NrnNum
End Sub
End Class
Class NeuralNetwork
Public Class NrnNtw
Dim _Lyrs As New List(Of Lyr)
Dim _learningRate As Double
Public Property Lyrs As List(Of Lyr)
   Get
   Return _Lyrs
  End Get
  Set(value As List(Of Lyr))
   _Lyrs = value
  End Set
End Property
Public Property LearningRate As Double
  Get
   Return _learningRate
  End Get
  Set(value As Double)
   _learningRate = value
  End Set
End Property
Public ReadOnly Property LyrCount As Integer
  Get
   Return _Lyrs.Count
  End Get
End Property
Sub New(LearningRate As Double, nLyrs As List(Of Integer))
  If nLyrs.Count < 2 Then Exit Sub
  Me.LearningRate = LearningRate
  For ii As Integer = 0 To nLyrs.Count − 1
   Dim l As Lyr = New Lyr(nLyrs(ii) − 1)
   Me.Lyrs.Add(l)
   For jj As Integer = 0 To nLyrs(ii) − 1
    l.Nrns.Add(New Nrn())
   Next
   For Each n As Nrn In l.Nrns
    If ii = 0 Then n.Bias = 0
    If ii > 0 Then
     For k As Integer = 0 To nLyrs(ii − 1) − 1
      n.Dndrs.Add(New Dndr)
     Next
    End If
   Next
  Next
End Sub
Function Execute(inputs As List(Of Double)) As List(Of Double)
  If inputs.Count <> Me.Lyrs(0).NrnCount Then
   Return Nothing
  End If
  For ii As Integer = 0 To Me.LyrCount − 1
   Dim curLyr As Lyr = Me.Lyrs(ii)
   For jj As Integer = 0 To curLyr.NrnCount − 1
    Dim curNrn As Nrn = curLyr.Nrns(jj)
    If ii = 0 Then
     curNrn.Value = inputs(jj)
    Else
     curNrn.Value = 0
     For k = 0 To Me.Lyrs(ii − 1).NrnCount − 1
      curNrn.Value = curNrn.Value + Me.Lyrs(ii − 1).Nrns(k).Value * curNrn.Dndrs(k).Weight
     Next k
     curNrn.Value = Sigmoid(curNrn.Value + curNrn.Bias)
    End If
   Next
  Next
  Dim outputs As New List(Of Double)
  Dim la As Lyr = Me.Lyrs(Me.LyrCount − 1)
  For ii As Integer = 0 To la.NrnCount − 1
   outputs.Add(la.Nrns(ii).Value)
  Next
  Return outputs
End Function
Public Function Train(inputs As List(Of Double), outputs As List(Of Double)) As Boolean
  If inputs.Count <> Me.Lyrs(0).NrnCount Or outputs.Count <> Me.Lyrs(Me.LyrCount − 1).NrnCount Then
   Return False
  End If
  Execute(inputs)
  For ii = 0 To Me.Lyrs(Me.LyrCount − 1).NrnCount − 1
   Dim curNrn As Nrn = Me.Lyrs(Me.LyrCount − 1).Nrns(ii)
   curNrn.Delta = curNrn.Value * (1 − curNrn.Value) * (outputs(ii) − curNrn.Value)
   For jj = Me.LyrCount − 2 To 1 Step − 1
    For kk = 0 To Me.Lyrs(jj).NrnCount − 1
     Dim iNrn As Nrn = Me.Lyrs(jj).Nrns(kk)
     iNrn.Delta = iNrn.Value *
         (1 − iNrn.Value) * Me.Lyrs(jj + 1).Nrns(ii).Dndrs(kk).Weight *
         Me.Lyrs(jj + 1).Nrns(ii).Delta
    Next kk
   Next jj
  Next ii
  For ii = Me.LyrCount − 1 To 0 Step − 1
   For jj = 0 To Me.Lyrs(ii).NrnCount − 1
    Dim iNrn As Nrn = Me.Lyrs(ii).Nrns(jj)
    iNrn.Bias = iNrn.Bias + (Me.LearningRate * iNrn.Delta)
    For kk = 0 To iNrn.DndrCount − 1
     iNrn.Dndrs(kk).Weight = iNrn.Dndrs(kk).Weight + (Me.LearningRate * Me.Lyrs(ii − 1).Nrns(kk).Value * iNrn.Delta)
    Next kk
   Next jj
  Next ii
  Return True
End Function
End Class
Method New()
Sub New(LearningRate As Double, nLyrs As List(Of Integer))
If nLyrs.Count < 2 Then Exit Sub
Me.LearningRate = LearningRate
For ii As Integer = 0 To nLyrs.Count − 1
  Dim l As Lyr = New Lyr(nLyrs(ii) − 1)
  Me.Lyrs.Add(l)
  For jj As Integer = 0 To nLyrs(ii) − 1
   l.Nrns.Add(New Nrn())
  Next
  For Each n As Nrn In l.Nrns
   If ii = 0 Then n.Bias = 0
   If ii > 0 Then
    For k As Integer = 0 To nLyrs(ii − 1) − 1
     n.Dndrs.Add(New Dndr)
    Next
   End If
  Next
Next
End Sub
Function Execute()
Function Execute(inputs As List(Of Double)) As List(Of Double)
If inputs.Count <> Me.Lyrs(0).NrnCount Then
  Return Nothing
End If
For ii As Integer = 0 To Me.LyrCount − 1
  Dim curLyr As Lyr = Me.Lyrs(ii)
  For jj As Integer = 0 To curLyr.NrnCount − 1
   Dim curNrn As Nrn = curLyr.Nrns(jj)
   If ii = 0 Then
    curNrn.Value = inputs(jj)
   Else
    curNrn.Value = 0
    For k = 0 To Me.Lyrs(ii − 1).NrnCount − 1
     curNrn.Value = curNrn.Value + Me.Lyrs(ii − 1).Nrns(k).Value * curNrn.Dndrs(k).Weight
    Next k
    curNrn.Value = Sigmoid(curNrn.Value + curNrn.Bias)
   End If
  Next
Next
Dim outputs As New List(Of Double)
Dim la As Lyr = Me.Lyrs(Me.LyrCount − 1)
For ii As Integer = 0 To la.NrnCount − 1
  outputs.Add(la.Nrns(ii).Value)
Next
Return outputs
End Function
Function Train()
Public Function Train(inputs As List(Of Double), outputs As List(Of Double)) As Boolean
If inputs.Count <> Me.Lyrs(0).NrnCount Or outputs.Count <> Me.Lyrs(Me.LyrCount − 1).NrnCount Then
  Return False
End If
 Execute(inputs)
For ii = 0 To Me.Lyrs(Me.LyrCount − 1).NrnCount − 1
  Dim curNrn As Nrn = Me.Lyrs(Me.LyrCount − 1).Nrns(ii)
  curNrn.Delta = curNrn.Value * (1 − curNrn.Value) * (outputs(ii) − curNrn.Value)
  For jj = Me.LyrCount − 2 To 1 Step − 1
   For kk = 0 To Me.Lyrs(jj).NrnCount − 1
    Dim iNrn As Nrn = Me.Lyrs(jj).Nrns(kk)
    iNrn.Delta = iNrn.Value *
        (1 − iNrn.Value) * Me.Lyrs(jj + 1).Nrns(ii).Dndrs(kk).Weight *
        Me.Lyrs(jj + 1).Nrns(ii).Delta
   Next kk
  Next jj
Next ii
For ii = Me.LyrCount − 1 To 0 Step − 1
  For jj = 0 To Me.Lyrs(ii).NrnCount − 1
   Dim iNrn As Nrn = Me.Lyrs(ii).Nrns(jj)
   iNrn.Bias = iNrn.Bias + (Me.LearningRate * iNrn.Delta)
   For kk = 0 To iNrn.DndrCount − 1
    iNrn.Dndrs(kk).Weight = iNrn.Dndrs(kk).Weight + (Me.LearningRate * Me.Lyrs(ii − 1).Nrns(kk).Value * iNrn.Delta)
   Next kk
  Next jj
Next ii
Return True
End Function
Init NN
Dim network As NrnNtw
Private Sub Form1_Load(sender As Object, e As EventArgs) Handles MyBase.Load
Dim LyrList As New List(Of Integer)
With LyrList
  .Add(2)
  .Add(4)
  .Add(2)
End With
 network = New NrnNtw(21.5, LyrList)
End Sub
Execute NN
Dim inputs As New List(Of Double)
inputs.Add(txtIn01.Text)
inputs.Add(txtIn02.Text)
Dim ots As List(Of Double) = network.Execute(inputs)
txtOt01.Text = ots(0)
txtOt02.Text = ots(1)

References

  1. Grubic, T.; Fan, I.-S. Supply chain ontology: Review, analysis and synthesis. Comput. Ind. 2010, 61, 776–786. [Google Scholar] [CrossRef]
  2. Kulvatunyou, B.; Ameri, F. Modeling a supply chain reference ontology based on a top-level ontology. In Proceedings of the ASME 2019 International Design Engineering Technical Conferences & Computers and Information in Engineering Conference IDETC/CIE, Anaheim, CA, USA, 18–21 August 2019; pp. 1–13. [Google Scholar]
  3. Üreten, S.; Đlter, H.K. Supply chain management ontology: Towards an ontology-based SCM model. In Proceedings of the Fourth International Logistics and Supply Chain Congress, Izmir, Turkey, 29 November–1 December 2006; pp. 741–749. [Google Scholar]
  4. Madhu, G.; Govardhan, A.; Rajinikanth, T.V. Intelligent semantic web search engines: A brief survey. Int. J. Web Semant. Technol. 2011, 2, 34–42. [Google Scholar] [CrossRef]
  5. Massaro, A.; Giannone, D.; Birardi, V.; Galiano, A.M. An innovative approach for the evaluation of the web page impact combining user experience and neural network score. Future Internet 2021, 13, 145. [Google Scholar] [CrossRef]
  6. Hillen, J. Web scraping for food price research. Br. Food J. 2019, 121, 3350–3361. [Google Scholar] [CrossRef]
  7. Uzun, E. A novel web scraping approach using the additional information obtained from web pages. IEEE Access 2020, 8, 61726–61740. [Google Scholar] [CrossRef]
  8. Al-Azmi, A.R. Data, text, and web mining for business intelligence: A survey. Int. J. Data Min. Knowl. Manag. Process 2013, 3, 1–21. [Google Scholar] [CrossRef]
  9. Massaro, A.; Vitti, V.; Galiano, A.; Morelli, A. Business intelligence improved by data mining algorithms and big data systems: An overview of different tools applied in industrial research. Comp. Sci. Inf. Technol. 2019, 7, 1–21. [Google Scholar] [CrossRef]
  10. Khan, A.; Baharudin, B.; Lee, L.H.; Khan, K. A review of machine learning algorithms for text-documents classification. J. Adv. Inf. Technol. 2010, 1, 4–20. [Google Scholar]
  11. Liu, F.; Huang, X.; Huang, W.; Duan, S.X. Performance evaluation of keyword extraction methods and visualization for student online comments. Symmetry 2020, 12, 1923. [Google Scholar] [CrossRef]
  12. Sharma, N.; Yalla, P. Keyphrase extraction and source code similarity detection-a survey. Conf. Ser. Mater. Sci. Eng. 2021, 1074, 012027. [Google Scholar] [CrossRef]
  13. Massaro, A.A.; Maritati, V.; Galiano, A. Automated self-learning chatbot initially built as a FAQs database information retrieval system: Multi-level and intelligent universal virtual front-office implementing neural network. Inform. J. 2018, 42, 515–526. [Google Scholar] [CrossRef] [Green Version]
  14. Massaro, A.; Lisco, P.; Lombardi, A.; Galiano, A.; Savino, N. A case study of research improvements in an service industry upgrading the knowledge base of the information system and the process management: Data flow automation, association rules and data mining. Int. J. Art. Intell. Appl. 2019, 10, 25–46. [Google Scholar] [CrossRef]
  15. Leogrande, A.; Saponaro, A.; Massaro, A.; Galiano, A. A GISbased estimation of quality of life in Italian regions. Am. J. Human. Soc. Sci. Res. 2020, 4, 196–210. [Google Scholar]
  16. Frascati Manual 2015: The Measurement of Scientific, Technological and Innovation Activities Guidelines for Collecting and Reporting Data on Research and Experimental Development; OECD: Paris, France, 2015; ISBN 978-926423901-2. [CrossRef]
  17. Garzoni, A.; De Turi, I.; Secundo, G.; Del Vecchio, P. Fostering digital transformation of SMEs: A four levels approach. Manag. Decis. 2020, 8, 1543–1562. [Google Scholar] [CrossRef]
  18. Smart District 4.0. Available online: http://sd40.io/ (accessed on 2 December 2021).
  19. Aida. Italian Company Information and Business Intelligence. Available online: https://0-aida-bvdinfo-com.brum.beds.ac.uk/version-202199/Login.serv?product=aidaneo&SetLanguage=en (accessed on 2 December 2021).
  20. Cerved. Available online: https://www.cerved.com/en/ (accessed on 2 December 2021).
  21. Istat. Istituto Nazionale di Statistica. Available online: https://www.istat.it/en/ (accessed on 2 December 2021).
  22. Massaro, A.; Galiano, A.; Fanelli, G.; Bousshael, B.; Vitti, V. Web app for dynamic pricing modeling in automotive applications and data mining analytics. Int. J. Comp. Sci. Inf. Technol. 2018, 9, 4–9. Available online: http://ijcsit.com/docs/Volume%209/vol9issue1/ijcsit2018090102.pdf (accessed on 22 March 2022).
  23. Simple Python OCR. Available online: https://github.com/goncalopp/simple-ocr-opencv (accessed on 2 December 2021).
  24. Protégé. A Free, Open-Source Ontology Editor and Framework for Building Intelligent System. Available online: https://protege.stanford.edu/ (accessed on 2 December 2021).
  25. Uba, U.H.; Abubakar, B.S.; Ibrahim, M.Y. Developing model for library ontology using Protégé tool: Process, reasoning and visualization. Int. J. Adv. Sci. Technol. Res. 2019, 6, 7–14. [Google Scholar] [CrossRef]
  26. Resource Description Framework (RDF). Available online: https://www.w3.org/RDF/ (accessed on 2 December 2021).
  27. Rdflib 6.1.1. Available online: https://rdflib.readthedocs.io/en/stable/ (accessed on 11 February 2022).
  28. Visual Studio Community. Available online: https://visualstudio.microsoft.com/it/vs/community/ (accessed on 2 December 2021).
  29. Zhao, B. Web Scraping. In Encyclopedia of Big Data; Schintler, L.A., McNeely, C.L., Eds.; Springer: Berlin/Heidelberg, Germany, 2017; pp. 1–3. [Google Scholar] [CrossRef]
  30. Google Maps Platform. Available online: https://developers.google.com/maps (accessed on 2 December 2021).
  31. Agglomerative Clustering. Available online: https://docs.rapidminer.com/latest/studio/operators/modeling/segmentation/agglomerative_clustering.html (accessed on 2 December 2021).
  32. Hierarchical Clustering. Available online: https://hub.knime.com/knime/extensions/org.knime.features.base/latest/org.knime.base.node.mine.cluster.hierarchical.HierarchicalClusterNodeFactory (accessed on 2 December 2021).
  33. Hierarchical Clustering. Available online: https://orange3.readthedocs.io/projects/orange-visual-programming/en/latest/widgets/unsupervised/hierarchicalclustering.html (accessed on 2 December 2021).
  34. Rapidminer. Available online: https://rapidminer.com/ (accessed on 2 December 2021).
  35. Orange. Available online: https://orangedatamining.com/ (accessed on 2 December 2021).
  36. Knime. Available online: https://www.knime.com/ (accessed on 2 December 2021).
  37. Massaro, A. Electronic in Advanced Research Industry: From Industry 4.0 to Industry 5.0 Advances, 1st ed.; Wiley: Hoboken, NJ, USA, 2021; ISBN 9781119716877. [Google Scholar] [CrossRef]
  38. Tensor Flow. Available online: https://www.tensorflow.org/ (accessed on 2 December 2021).
  39. Keras. Available online: https://keras.io/ (accessed on 2 December 2021).
  40. KNIME Textprocessing. Available online: https://hub.knime.com/knime/extensions/org.knime.features.ext.textprocessing/latest (accessed on 2 December 2021).
  41. Anaconda. Available online: https://www.anaconda.com/ (accessed on 2 December 2021).
  42. Docker. The Industry-Leading Container Runtime. Available online: https://www.docker.com/products/container-runtime (accessed on 2 December 2021).
  43. Rad, B.B.; Bhatti, H.J.; Ahmadi, M. An introduction to Docker and analysis of its performance. Int. J. Comp. Sci. Netw. Secur. 2017, 17, 228–235. [Google Scholar]
  44. Kubernetes. Available online: https://kubernetes.io/it/docs/concepts/overview/what-is-kubernetes/ (accessed on 2 December 2021).
  45. Red Hat. Virtualizzazione. La Tecnologia KVM. Available online: https://www.redhat.com/it/topics/virtualization/what-is-KVM (accessed on 2 December 2021).
  46. Vegetti, M.M.; Böhm, A.; Leone, H.L.; Henning, G.P. SCONTO: A modular ontology for supply chain representation. In Proceedings of the ESWC 2021 Workshop DORIC-MM, Online, 7 June 2021; pp. 40–55. [Google Scholar]
  47. Formica, A.; Pourabbas, E.; Taglino, F. Semantic Search Enhanced with Rating Scores. Future Internet 2020, 12, 67. [Google Scholar] [CrossRef] [Green Version]
  48. Koutsomitropoulos, D.; Likothanassis, S.; Kalnis, P. Semantics in the Deep: Semantic Analytics for Big Data. Data 2019, 4, 63. [Google Scholar] [CrossRef] [Green Version]
  49. Yahya, M.; Breslin, J.G.; Ali, M.I. Semantic Web and Knowledge Graphs for Industry 4.0. Appl. Sci. 2021, 11, 5110. [Google Scholar] [CrossRef]
  50. Massaro, A.; Magaletti, N.; Cosoli, G. Project management: Radargram plot to validate stakeholder technology implemented in a research project. Zenodo 2022. [Google Scholar] [CrossRef]
Figure 1. Main phases of the search engine based on a multi-level approach: level 1 is the pre-filtering of the supply chain attributes, and level 2 represents the refinement phase, finding new specific attributes.
Knowledge 02 00015 g001
Figure 2. UML-AD describing the flow chart of the proposed method and indicating the two levels of the search engine in Figure 1. The diagram indicates the data flow of the whole search engine structured in two levels constructing the supply chain ontology.
Knowledge 02 00015 g002
Figure 3. Flowchart of the ontology update process constructing sub-ontologies (the iterative process defines the classes characterized by specific features).
Knowledge 02 00015 g003
Figure 4. KNIME workflow implementing the hierarchical clustering technique. The workflow provides the output of Figure 5.
Knowledge 02 00015 g004
Figure 5. Example of the dendrogram obtained as a result of the workflow of Figure 2 (row number versus cluster distance). The dendrogram defines three cluster results. Inset: cluster Euclidean distance plot versus the cluster number, selecting the cluster number.
Knowledge 02 00015 g005
Figure 6. Clusters (cluster_0, cluster_1, cluster_2) grouped versus ATECO identification code (1 record, 2 records and more records are found for cluster_0, cluster_1 and cluster_2, respectively).
Knowledge 02 00015 g006
Figure 7. Web scraping Graphical User Interface (GUI): web scraping frontend. The interface shows the following searching fields: webpage number, URL to extract information, CSV file containing the keywords to find in the webpage, output results.
Knowledge 02 00015 g007
Figure 8. Example of an ontology graph constructed by the queries of Table 3. The example is focused on the ontology referring to a particular ice cream ingredient.
Knowledge 02 00015 g008
Figure 9. Radar chart of the proposed search engine applied to the pilot case study of an ice cream company. The chart highlights the high impact of the prototypal platform concerning the improvement of the company’s knowledge base. The scale of the impact is ranging from 0 to 4.
Knowledge 02 00015 g009
Table 1. Some indices and codes identifying an Italian company.
Index/Code TypeDescription
ATtività ECOnomiche (ATECO)A type of classification adopted by the Italian National Statistical Institute (ISTAT) for national economic statistical surveys.
Ramo di Attività Economica (RAE)It provides a representation of every economic activity active in Italy.
Settori o Sottogruppi di Attività Economica (SAE)It specifies the business activity according to the European System of Economic Accounts (SEC 2010) classification.
Nomenclatura delle Attività economiche nella Comunità Europea (NACE)Code with the aim of standardizing the classification of all economic activities in Europe.
Table 2. “Technology matrix”: tools integrable into a unique platform.
TechnologyData Flow Phase of Figure 2 and Main Function DescriptionReferences
PDF documentsKeyword selection: ATECO, RAE, SAE, NACE indexes, etc.AIDA [19], CERVED [20], ISTAT * [21] (socio-economic indicators)
Optical Character Recognition (OCR)Keyword selection: keyword extraction from the analyzed pdf documentsOpenCV * [22,23]
OntologySupply Chain Ontology (SCO); ontology constructor; graphical interface to construct ontology graph modelsPROTÉGÉ * (ontology constructor platform) [24,25]
RDF protocol (XML-based protocol)Ontology constructor: extraction of the classes (keywords) from the ontology and ontology update. The ontology construction can be performed by programming subroutines using RDF Python packages, such as RDFLib[26,27]
Languages: VB.NET, C++, C#Web scraping graphical user interfaceVisual Studio Community Edition 2019 * [28]
HTML source code (HTTP protocol)Web scraping: extracting tags (keywords) from the analyzed webpage[29]
Google maps API * (GPS geolocalization)Search refinement (supplier and company information about their geolocalization)[30]
ML unsupervised algorithmPre-selection: hierarchical clustering and graphical dashboardsRapidMiner * agglomerative clustering [31], KNIME * hierarchical clustering [32], Orange Canvas * hierarchical clustering [33]
AI classifiers (platforms): supervised algorithms as classifiers (ANN, LSTM, CNN, Decision Tree, XG Boost, etc.)Association rules suggestion and graphical dashboards. Extraction of complementary keywords for the construction of new keyword seriesRapidMiner * platform [34], Orange Canvas * platform [35], KNIME * platform [36,37], TensorFlow * [38], Keras * [39]
Text miningImprovement of the web scraping process (classification of complementary keywords after the word extraction process by OCR)KNIME * text processing [40]
Python platform frameworkAI classifier and hierarchical clustering algorithms integration (use of Pandas, Keras, and TensorFlow libraries)Anaconda * platform [41]
Container and virtualization engineEach data processing phase: tool integrationDocker * [42,43] Kubernetes * [44], KVM (Red Hat operating system useful for customization) [45]
* Open source.
Table 3. Queries of the specific case study (ice cream supply chain).
Query ExampleSearching LevelResponse
What kind of product or sub-product do you want to search for?Level 1Ice cream, dessert, milk, raw material (semi-product/ice cream ingredients)
Would you like to consider suppliers (pre-screening by consulting the company database)Level 1ATECO 2007 (463890108909, 107000, 105200, 108200 (ice cream semi-product); 105110
463310 (milk supplier); 16300, 12100, 463110, 463100, 463100, 103900 (fruit ingredients))
Which specific keywords would you associate with the product or sub-product?Level 2Italian ice cream, ice cream dessert, high quality
Are there consumers, such as bars, restaurants and ice cream shops, capable of processing specific ingredients or groups of ingredients?Level 2Hierarchical clustering provides possible supply chain district areas located in a region, province and city. By processing Enterprise Resource planning (ERP) data, it is possible to associate the high quantity of ingredients sold within a district area.
Would you like to refine the suppliers list? (search refinement based on the response of the previous query)Level 2Product certification and quality certification (Hazard Analysis and Critical Control Point (HACCP), biological, gluten free, lactose free, presence of allergens), chemical composition and ingredient combination, nutritional values
Is there a geolocalization request?Level 2Near district useful for logistics, kilometer 0 (supplier in the same area), proximity of highway
Is there a socio-economic indicator to consider?Level 2Tourism, tourist attractiveness rate, cultural attractivity (gastronomics), logistics/transportation, analysis of the demand associated with ice cream taste, analysis of consumer ice cream taste, income level of citizens, price of subsequent goods
Are the results are matching with the initial queries?Level 2 (results validation)If yes, the research is concluded and the training model is optimized (ontology classification optimization). If no, the keyword research restarts at Level 1
Table 4. Advantages and disadvantages of the adopted research methods.
Level of KnowledgeResearch MethodAdvantagesDisadvantages
Level 1 *Initial queryStarts the sub-ontology constructionOnly a query is insufficient to construct the supply chain ontology
Level 1 *Indices and codes identifying an Italian company (Table 1)High number of outputsNot all the companies carry out the activities for which the research is carried out
Level 2 **Precise keywordsThe outputs are correctly representative of companies operating in the indicated sectorNothing
Level 2 **Adding queries and information classification by MLOptimizes the useful information by eliminating redundant informationNothing
Level 2 **ML applicationCreation of new smart district area indicatorsNothing
* Traditional approach (preparatory to level 2); ** innovative approach.
Publisher’s Note: MDPI stays neutral with regard to jurisdictional claims in published maps and institutional affiliations.

