Molecular Modeling Studies on 11H-Dibenz[b,e]azepine and Dibenz[b,f][1,4]oxazepine Derivatives as Potent Agonists of the Human TRPA1 Receptor

Abstract
:1. Introduction
2. Results and Discussion
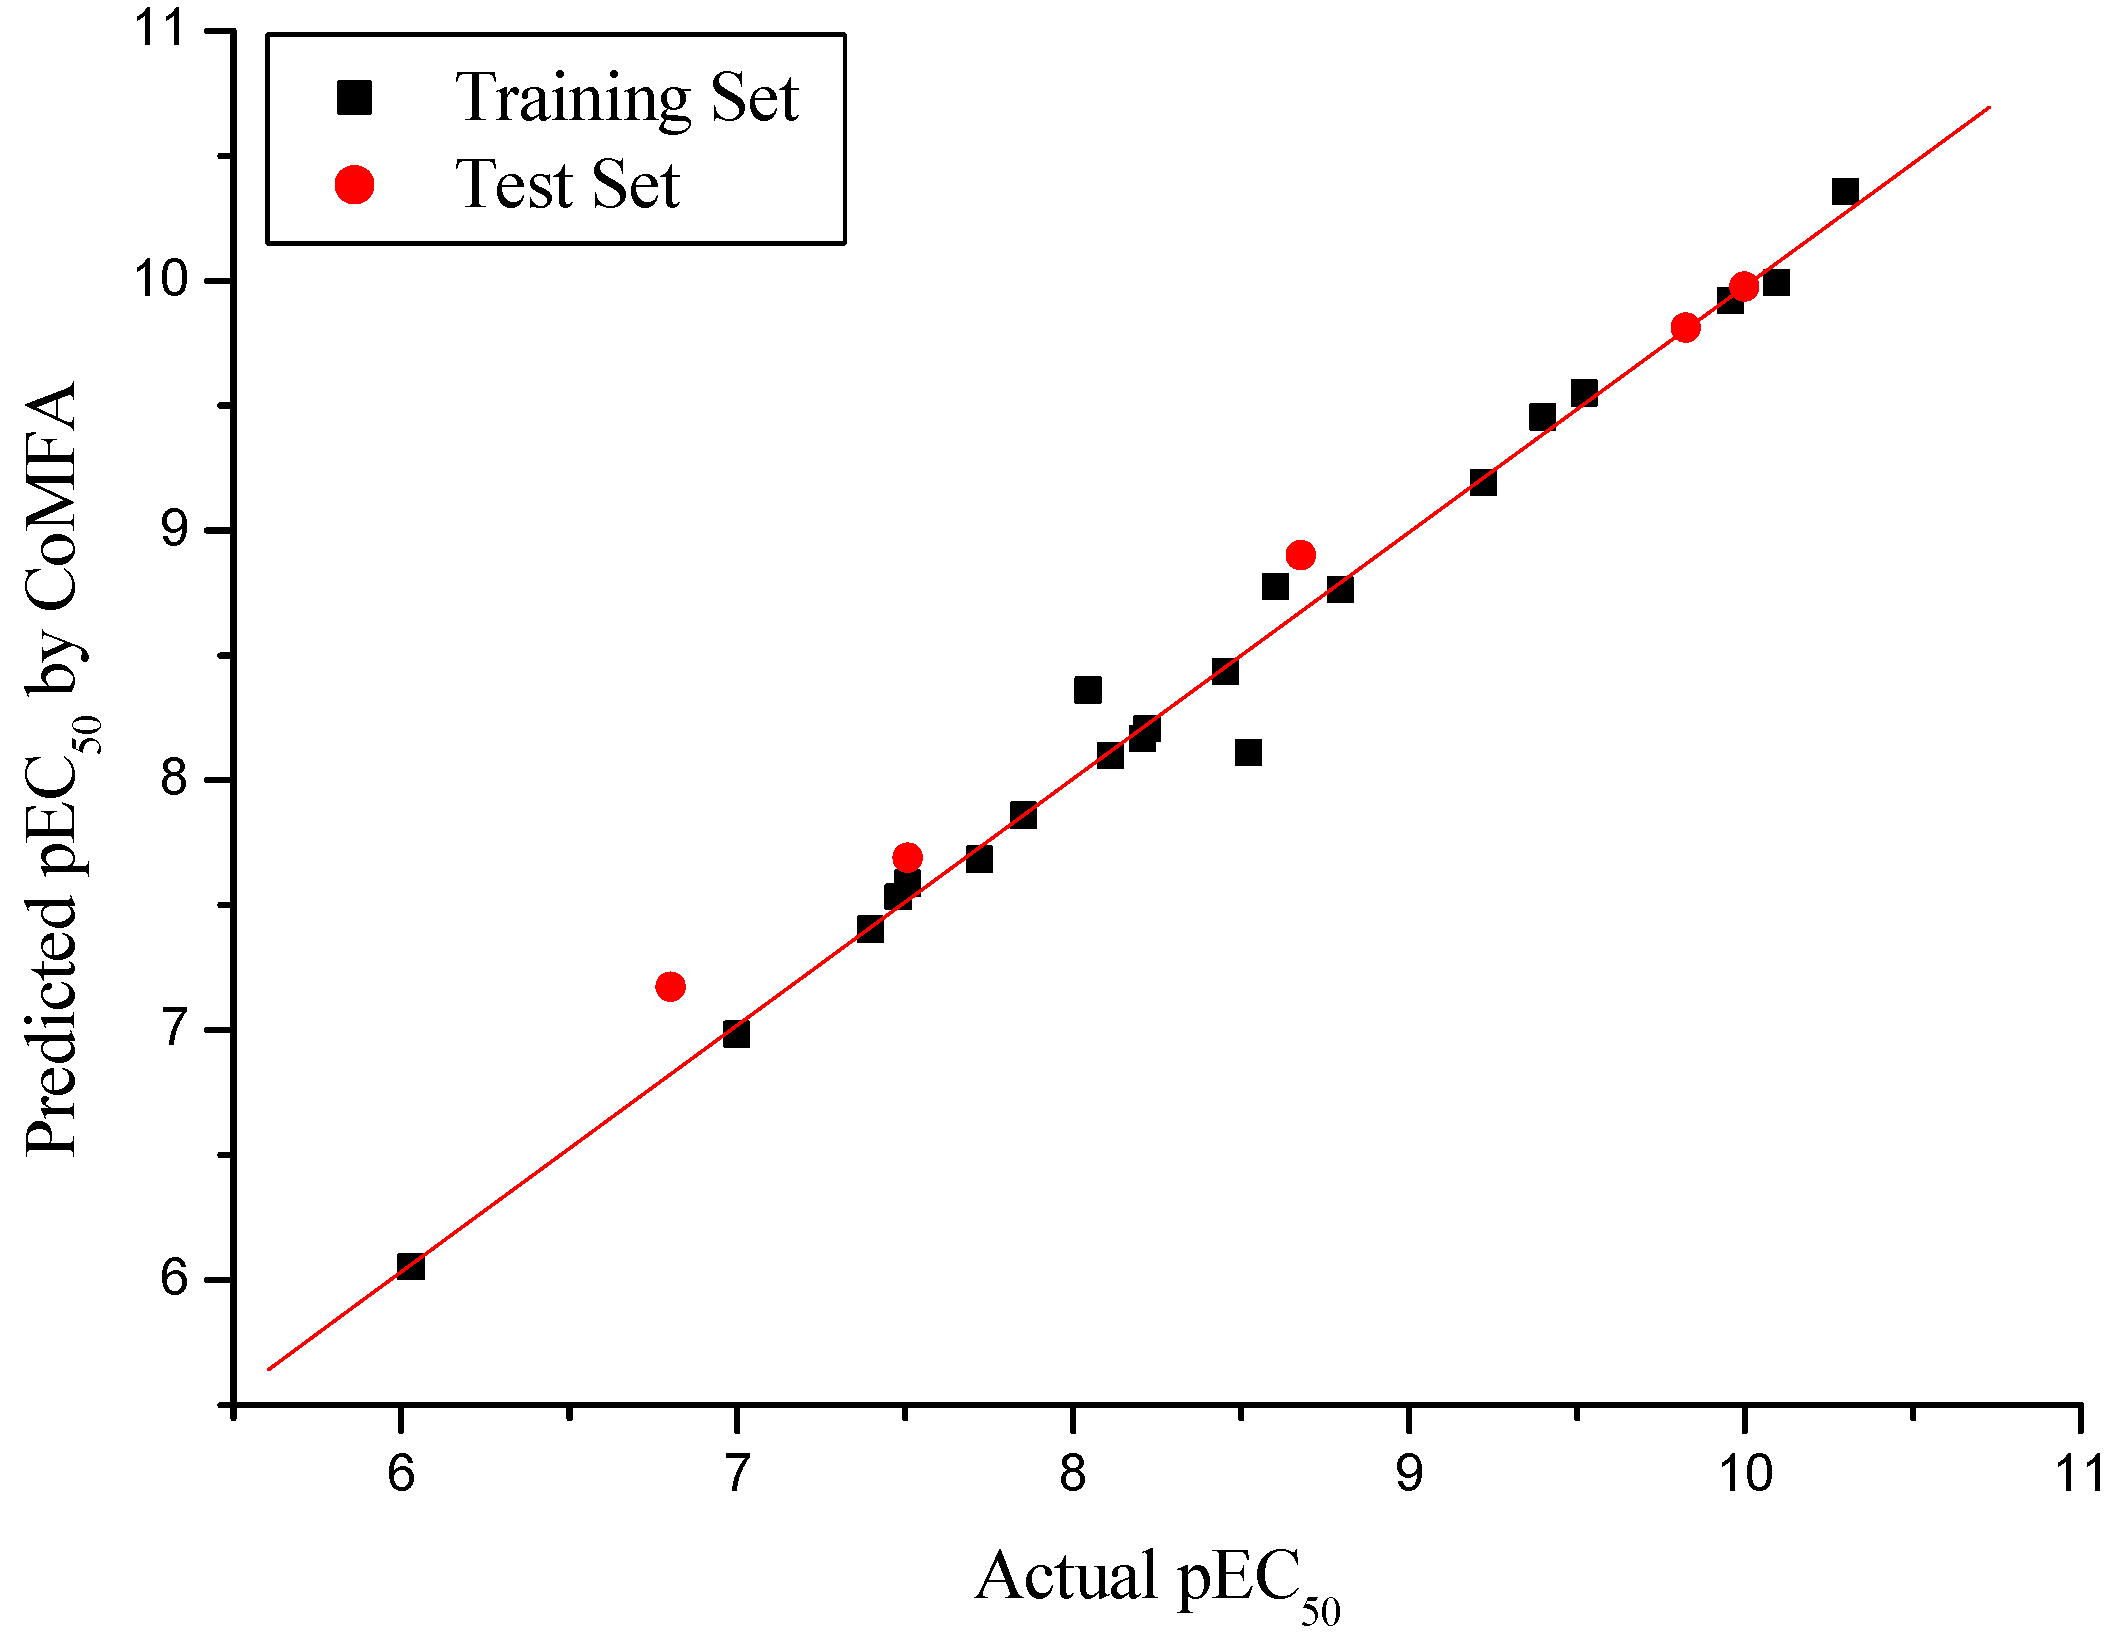
2.1. CoMFA PLS Analysis


| Compd.No. | Substituent | |
|---|---|---|
| R | A | |
| 1 | H | O |
| 2 | H | CH2 |
| 3 | 1-COOMe | CH2 |
| 4 | 2-COOMe | CH2 |
| 5 | 3-COOMe | CH2 |
| 6 | 4-COOMe | CH2 |
| 7 | 7-COOMe | CH2 |
| 8 | 8-COOMe2 | CH2 |
| 9 | 9-COOMe | O |
| 10 | 10-COOMe | O |
| 11 | 8-Br | CH2 |
| 12 | 10-Br | CH2 |
| 13 | 8-CN | CH2 |
| 14 | 10-CN | CH2 |
| 15 | 10-CN | O |
| 16 | 1-CN | O |
| 17 | 10-CONH2 | CH2 |
| 18 | 10-CONH2 | O |
| 19 | 1-CONH2 | O |
| 20 | 8-COO iPr | CH2 |
| 21 | 10-COOnBu | CH2 |
| 22 | 10-CONH(CH2)3OMe | CH2 |
| 23 | 10-CONEt2 | CH2 |
| 24 | 9-OMe | O |
| 25 | 9-OH | O |
| 26 | H | S |
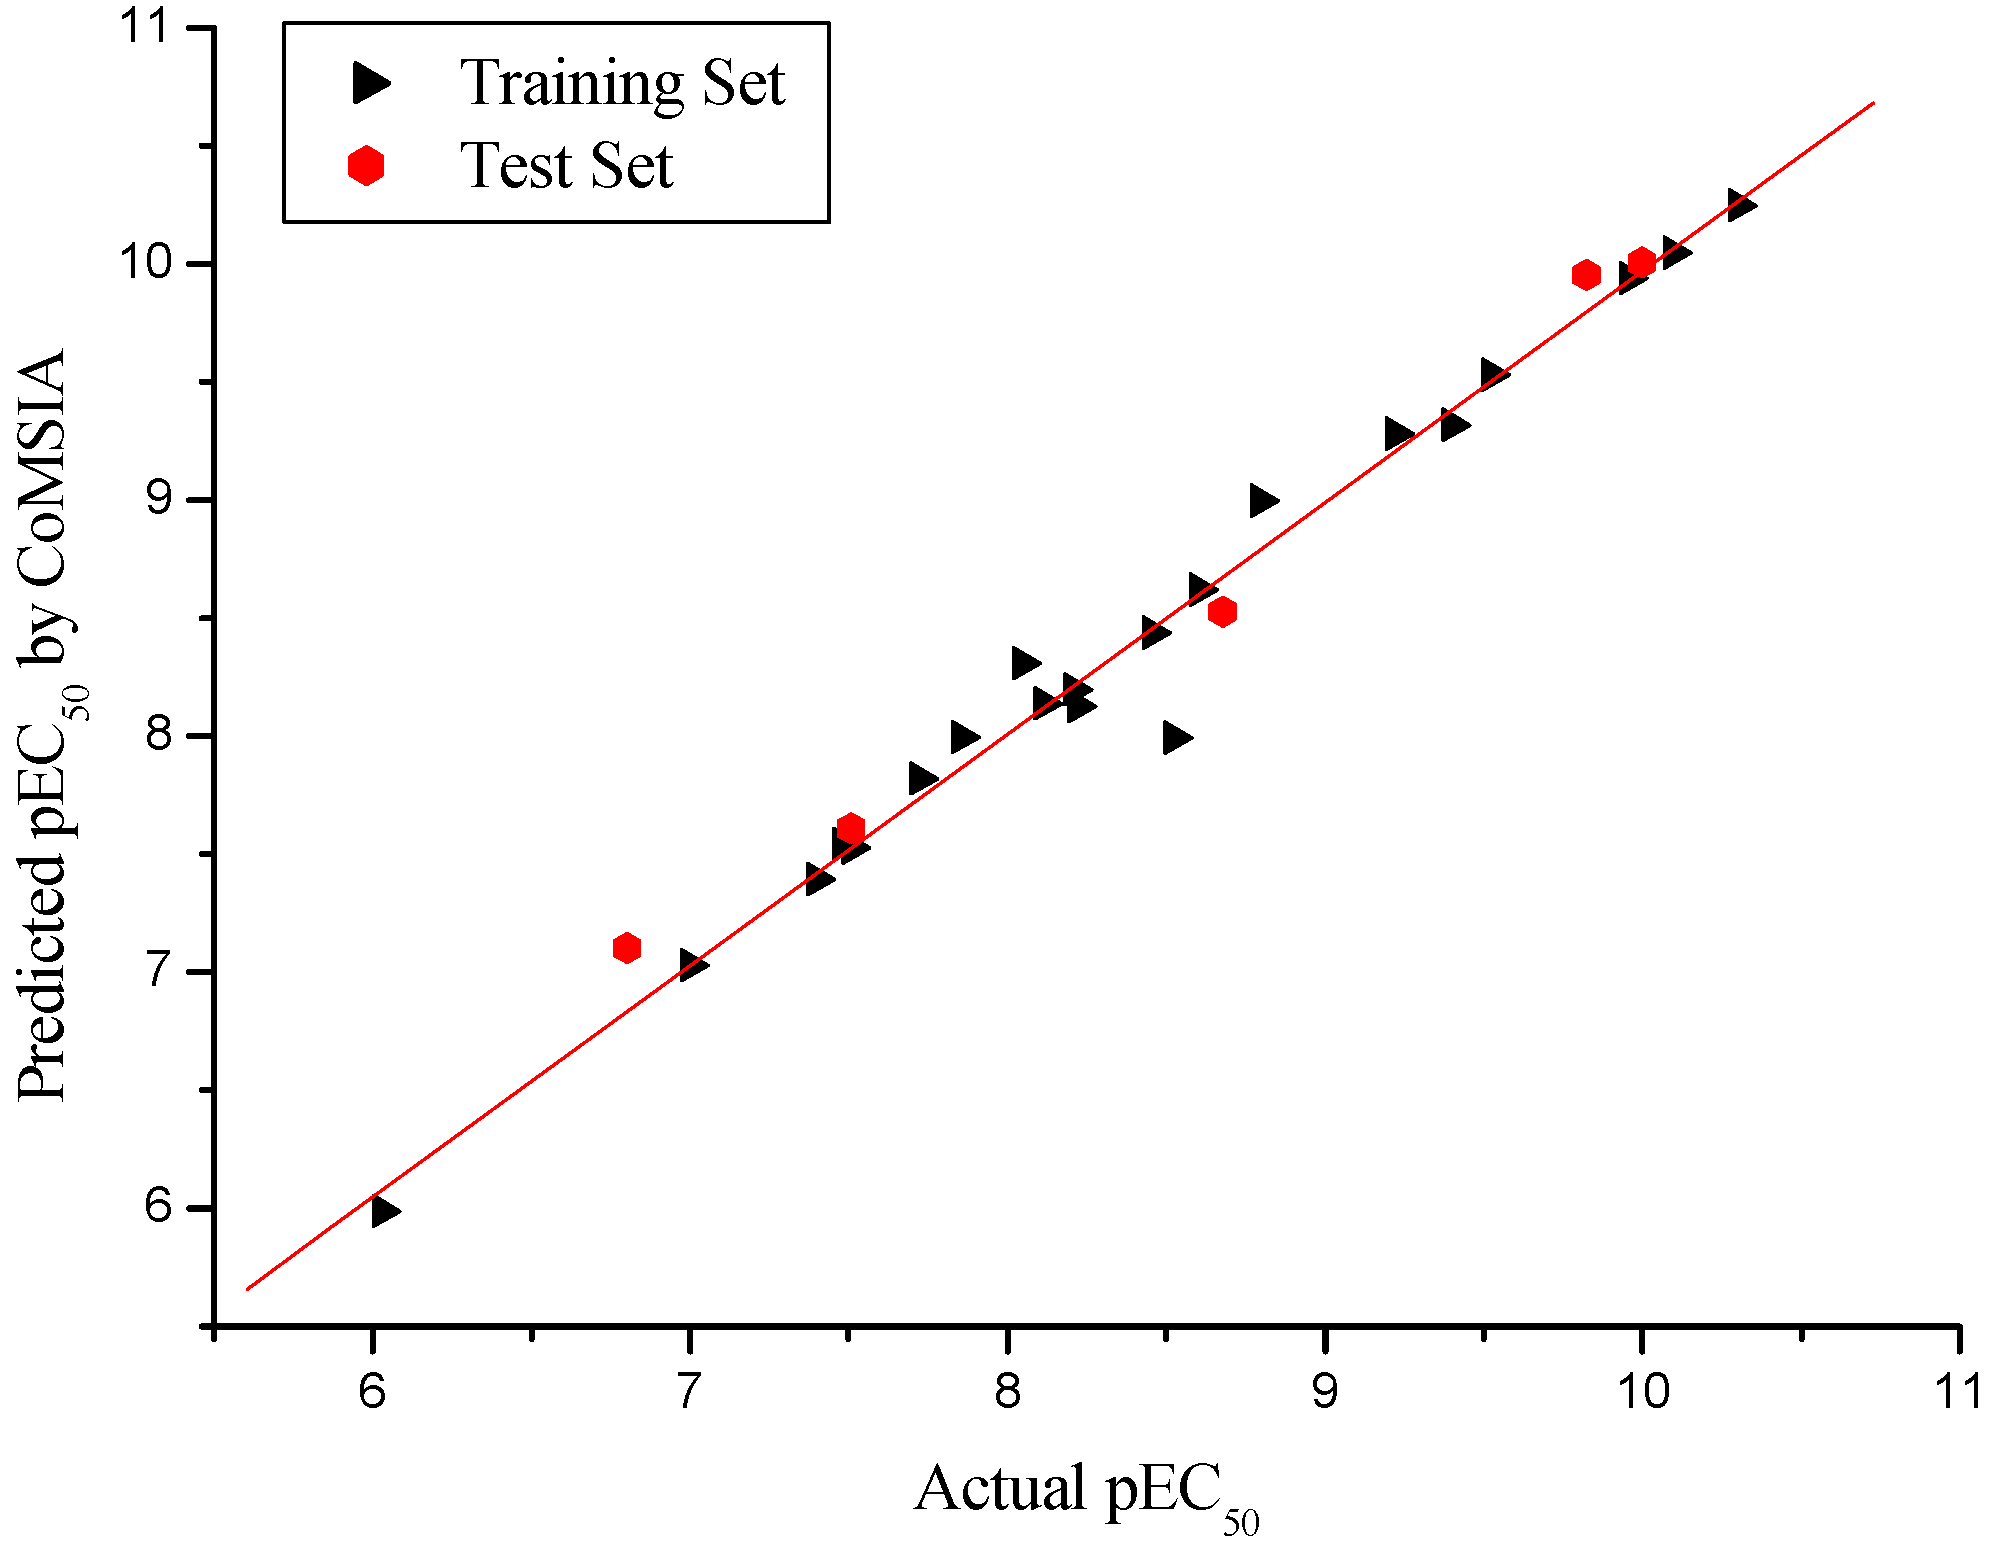
| Compd.No. | pEC50 | CoMFA | CoMSIA | ||
|---|---|---|---|---|---|
| Actual | Pred. | Res. | Pred. | Res. | |
| 1 | 9.523 | 9.548 | −0.025 | 9.53 | −0.007 |
| 2 | 8.523 | 8.111 | 0.412 | 7.991 | 0.532 |
| 3 | 9.222 | 9.191 | 0.031 | 9.279 | −0.057 |
| 4 | 9.398 | 9.454 | −0.056 | 9.317 | 0.081 |
| 5 | 7.721 | 7.683 | 0.038 | 7.82 | −0.099 |
| 6 | 7.509 | 7.587 | −0.078 | 7.526 | −0.017 |
| 7* | 7.509 | 7.688 | −0.179 | 7.608 | −0.099 |
| 8 | 7.000 | 6.982 | 0.018 | 7.028 | −0.028 |
| 9 | 8.222 | 8.205 | 0.017 | 8.124 | 0.098 |
| 10 | 10.301 | 10.355 | −0.054 | 10.248 | 0.053 |
| 11 | 7.482 | 7.532 | −0.051 | 7.541 | −0.060 |
| 12 | 8.456 | 8.433 | 0.023 | 8.438 | 0.018 |
| 13* | 6.801 | 7.173 | −0.372 | 7.102 | −0.301 |
| 14 | 8.796 | 8.762 | 0.034 | 8.997 | −0.201 |
| 15* | 9.824 | 9.811 | 0.013 | 9.953 | −0.129 |
| 16* | 10.000 | 9.975 | 0.025 | 10.006 | −0.006 |
| 17 | 8.602 | 8.774 | −0.172 | 8.619 | −0.017 |
| 18 | 10.097 | 9.989 | 0.108 | 10.045 | 0.052 |
| 19 | 9.959 | 9.92 | 0.039 | 9.939 | 0.020 |
| 20 | 6.030 | 6.054 | −0.024 | 5.987 | 0.043 |
| 21 | 8.208 | 8.164 | 0.044 | 8.195 | 0.013 |
| 22 | 8.114 | 8.096 | 0.018 | 8.138 | −0.025 |
| 23 | 7.398 | 7.401 | −0.003 | 7.394 | 0.004 |
| 24 | 7.854 | 7.858 | −0.004 | 7.995 | −0.141 |
| 25* | 8.678 | 8.9 | −0.222 | 8.527 | 0.151 |
| 26 | 8.046 | 8.36 | −0.314 | 8.306 | −0.260 |
| PLS Statistics | CoMFA | CoMSIA |
|---|---|---|
| r2cva | 0.631 | 0.542 |
| r2b | 0.986 | 0.981 |
| ONCc | 6 | 6 |
| SEEd | 0.154 | 0.180 |
| F valuee | 160.559 | 117.466 |
| Field contribution | ||
| Steric | 0.541 | 0.146 |
| Electrostatic | 0.459 | 0.403 |
| Hydrophobic | - | 0.160 |
| H-bond Donor | - | 0.075 |
| H-bond Acceptor | - | 0.215 |

2.2. CoMSIA PLS Analysis

2.3. External Validation Analysis for the CoMFA and CoMSIA
| Parameters (Testing set) | CoMFA | CoMSIA |
|---|---|---|
| r2pred | 0.967 | 0.981 |
| Slope k | 0.984 | 0.988 |
| r02 | 0.984 | 0.988 |
| rm2 | 0.942 | 0.899 |
| [(r2-r02)/r2] | 0.002 | -0.007 |
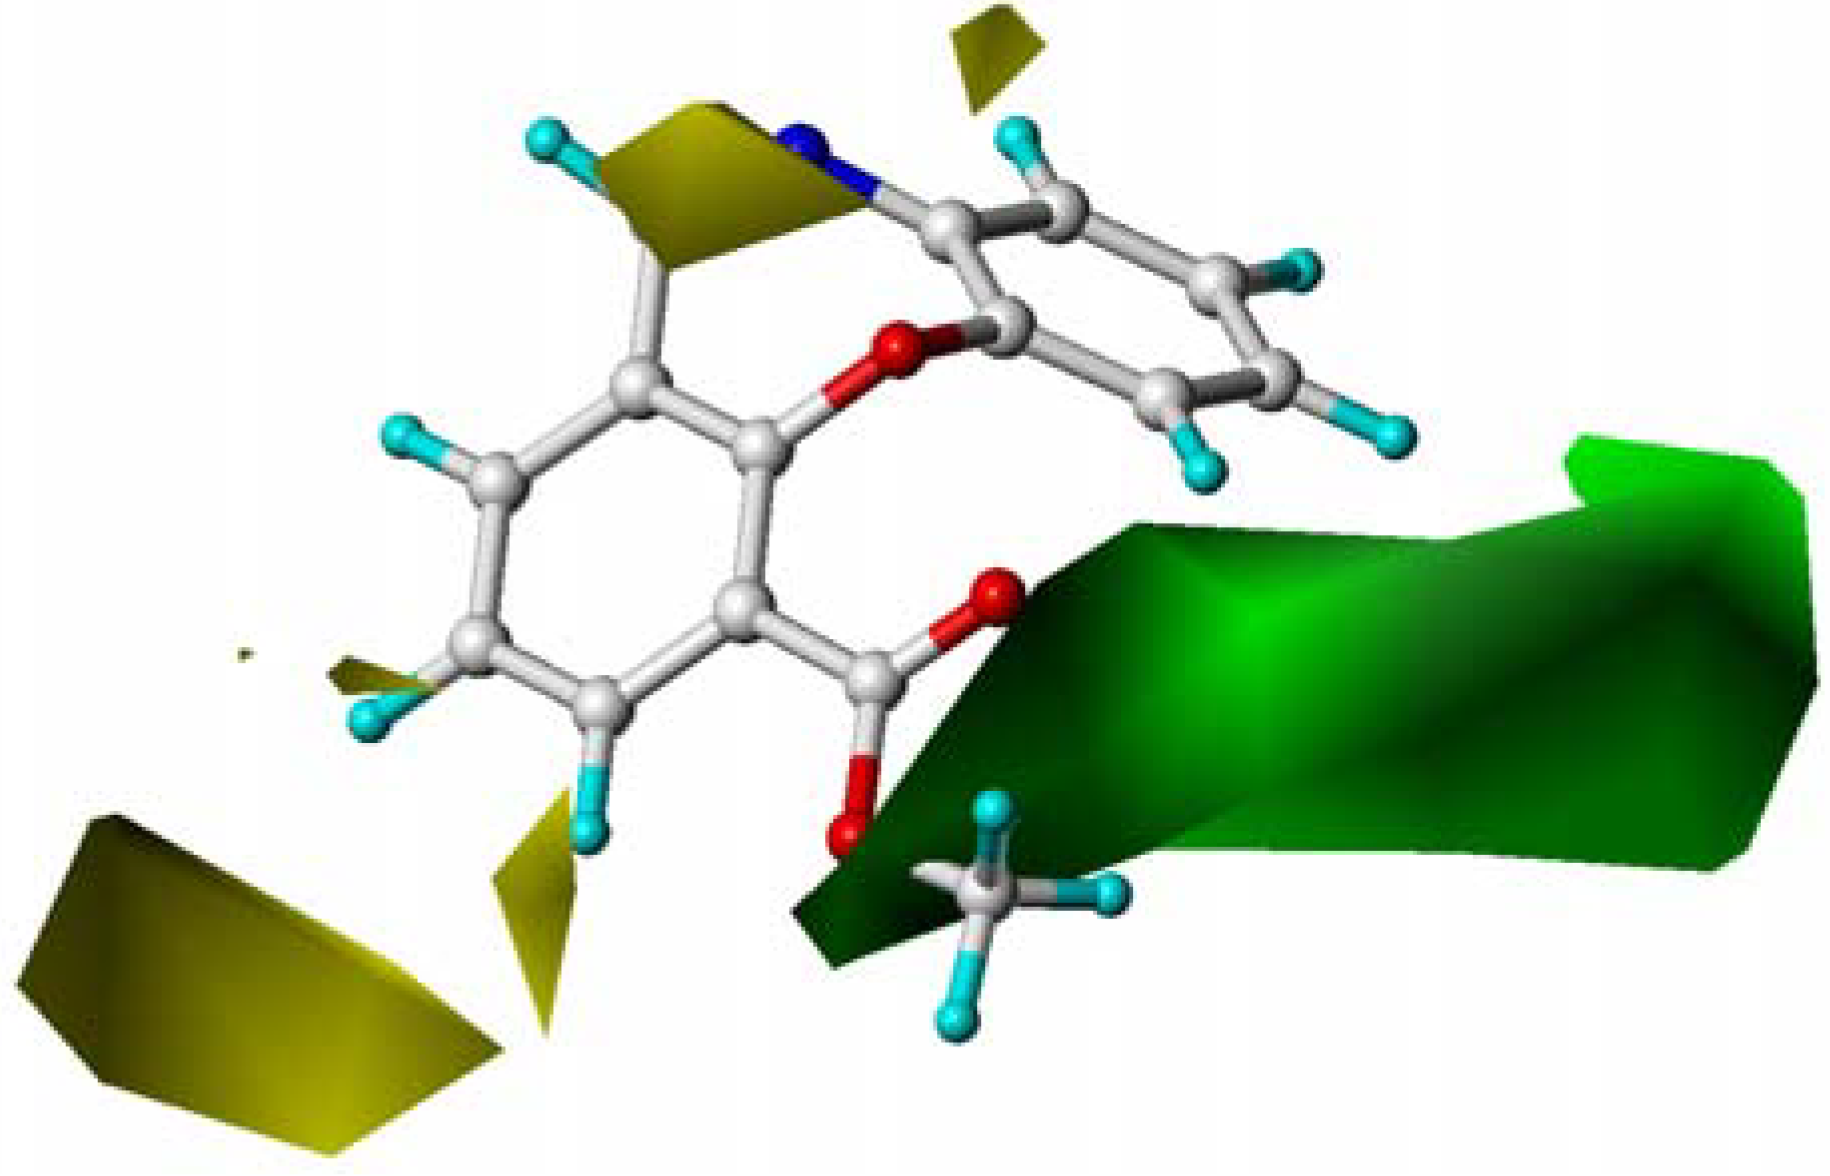
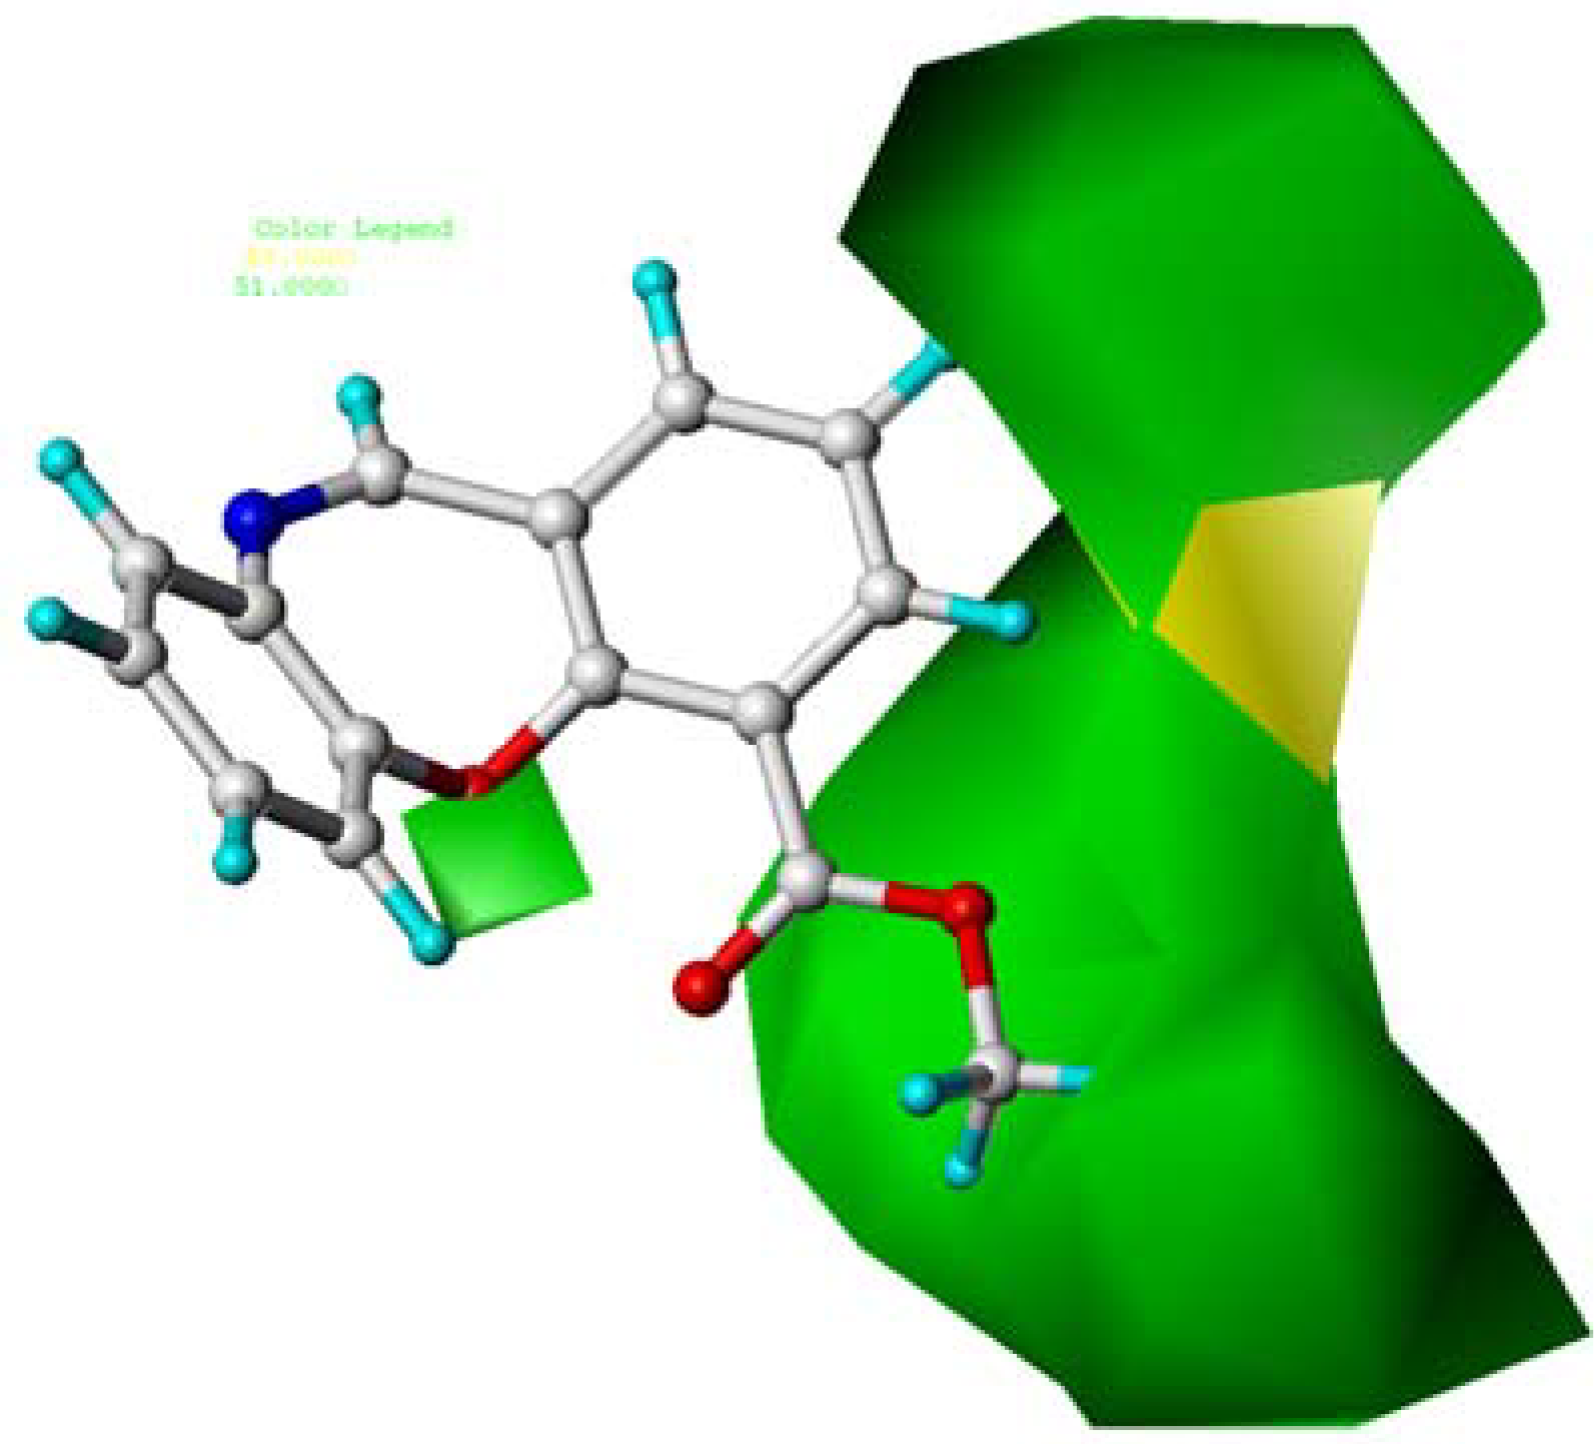
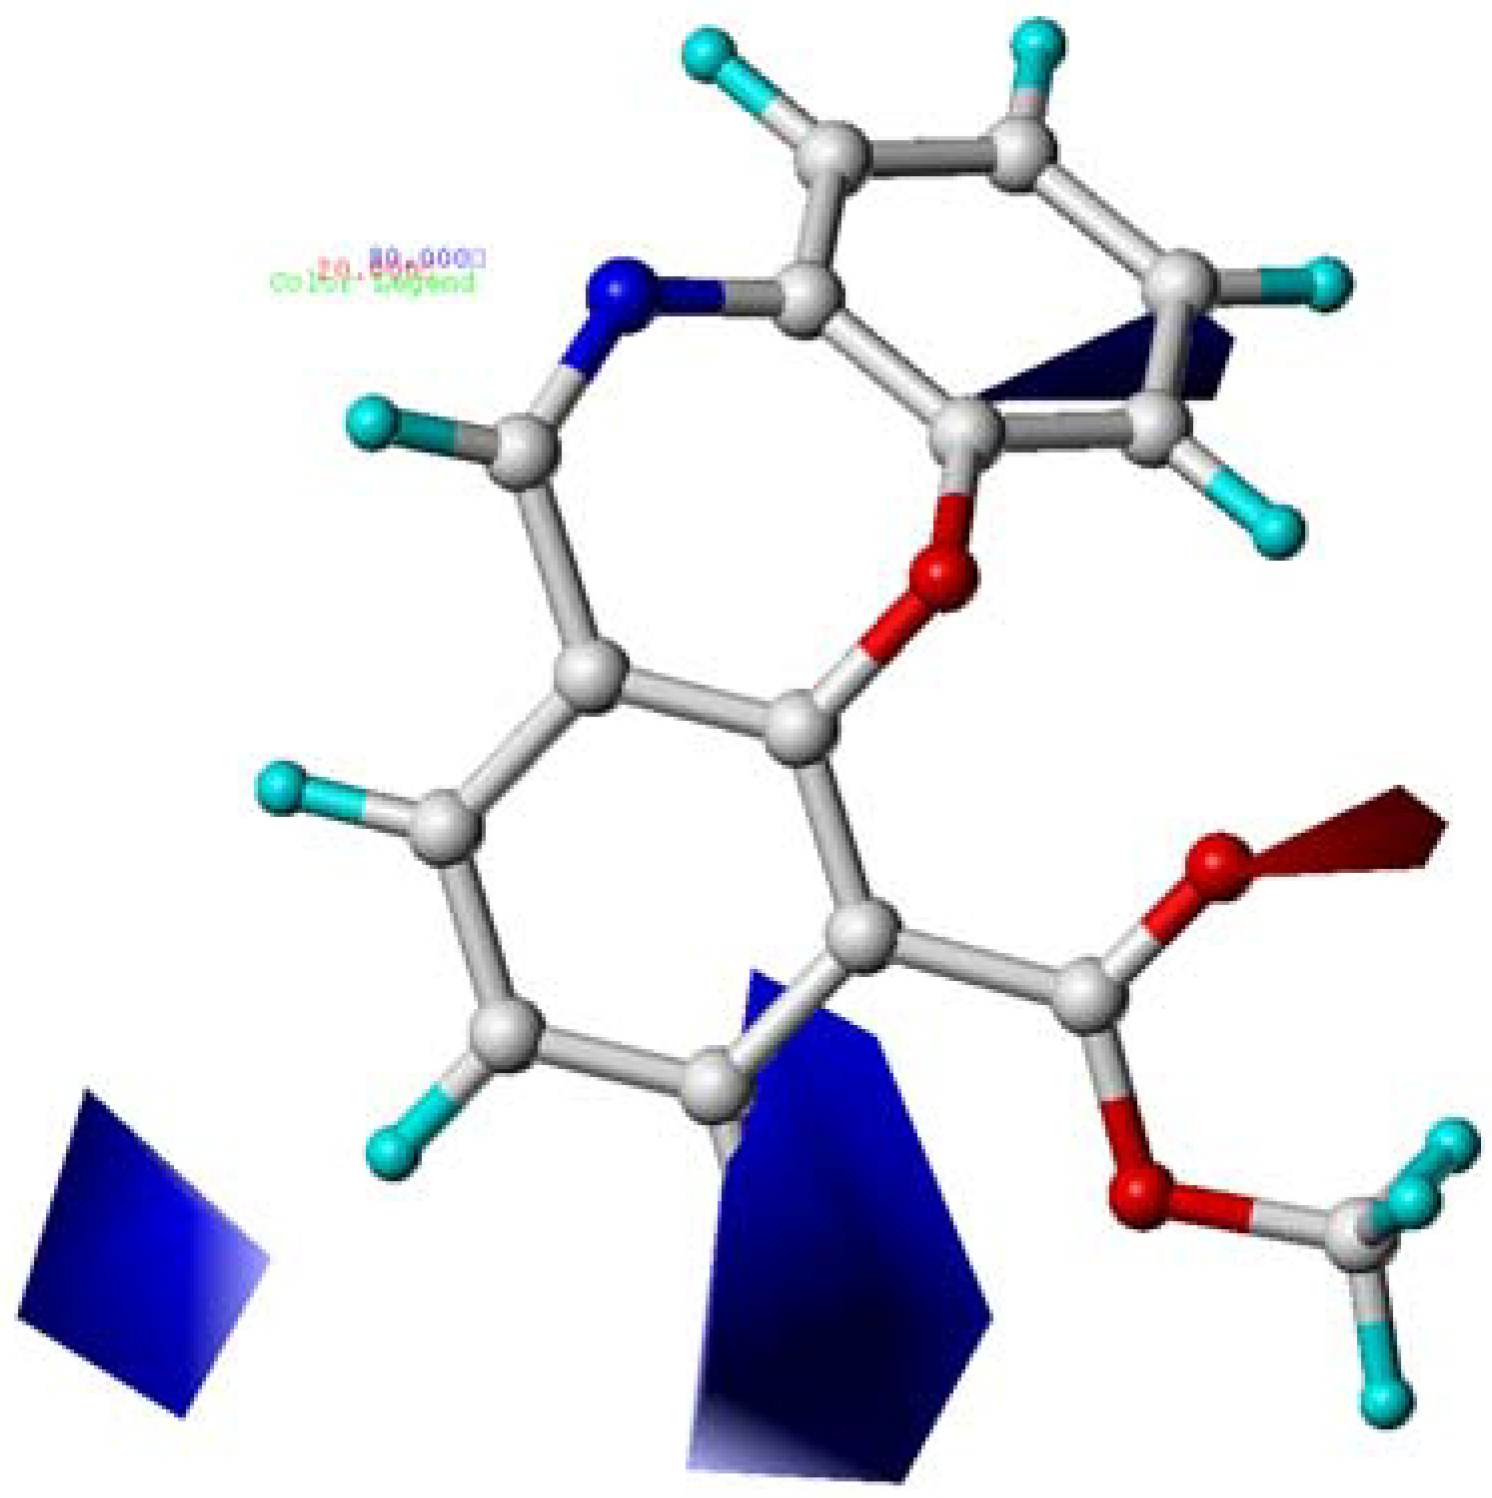
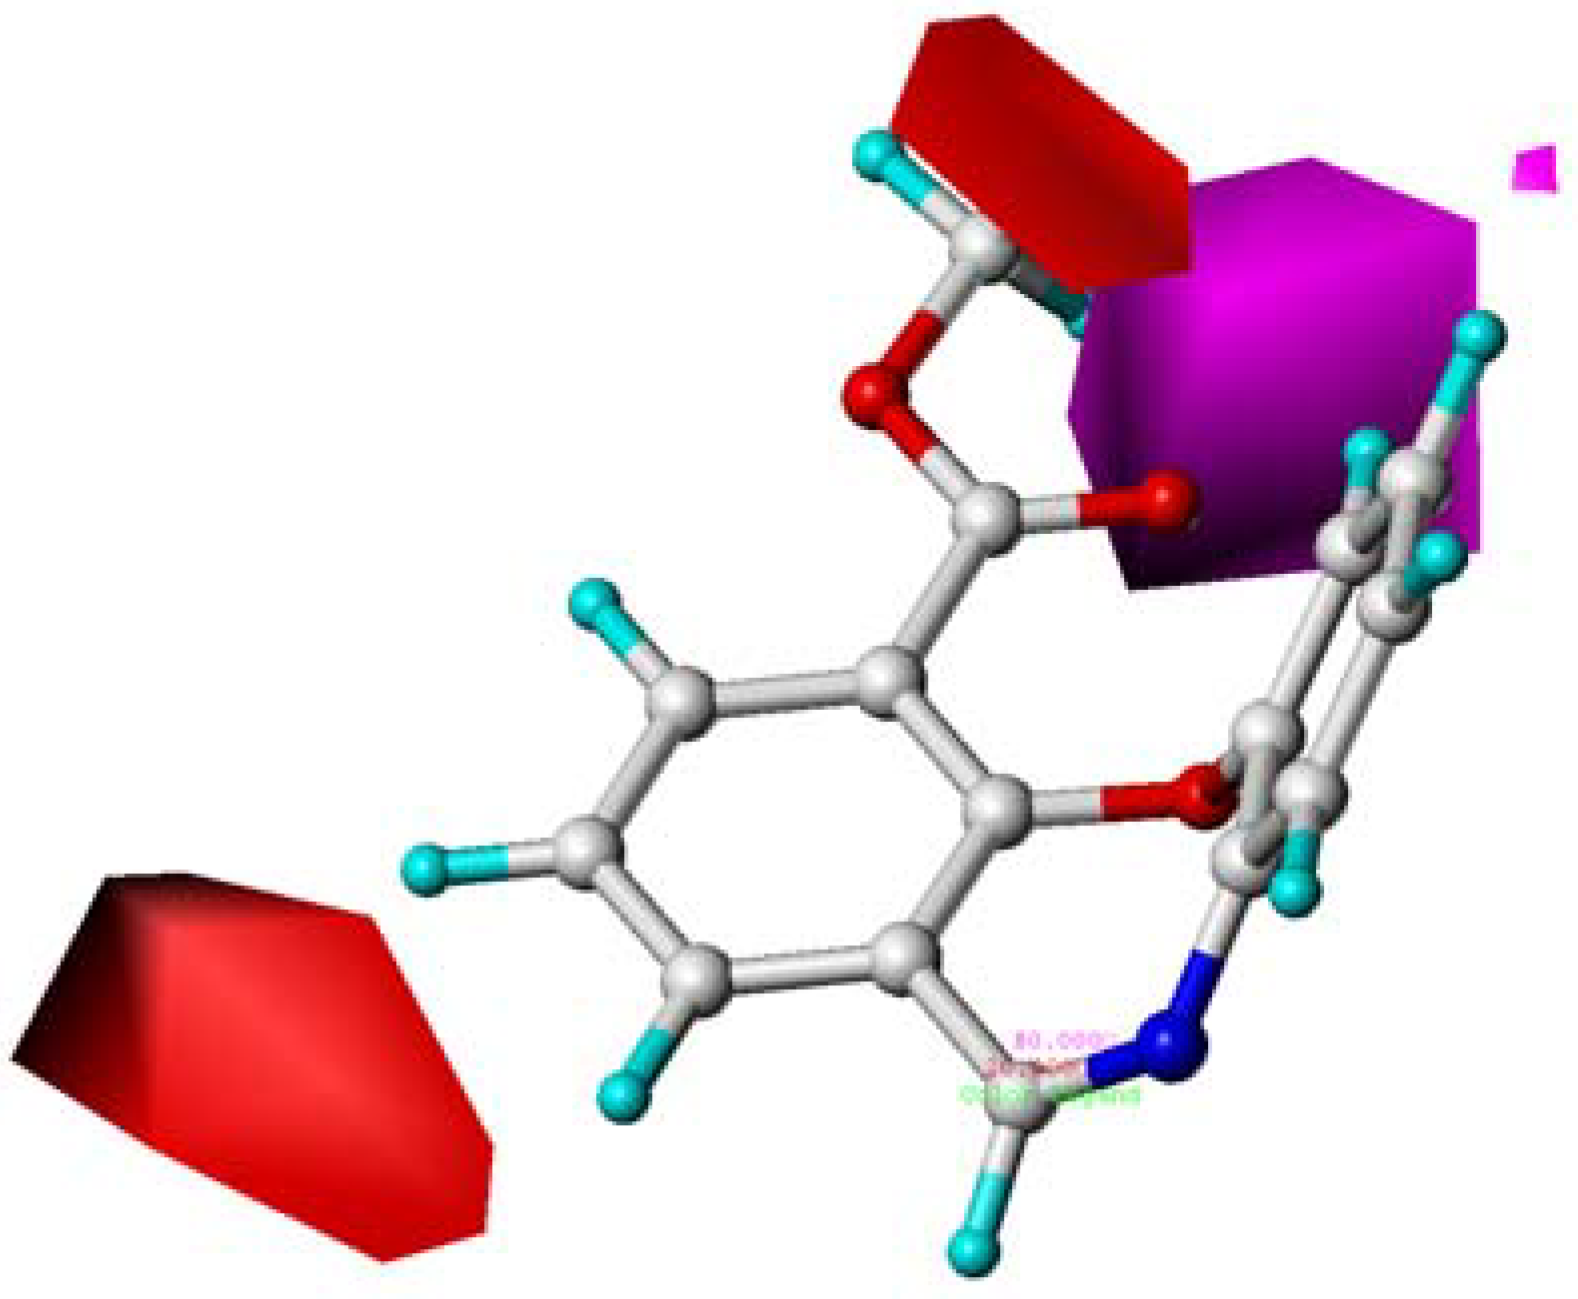
2.4. CoMFA Contour Maps Analysis


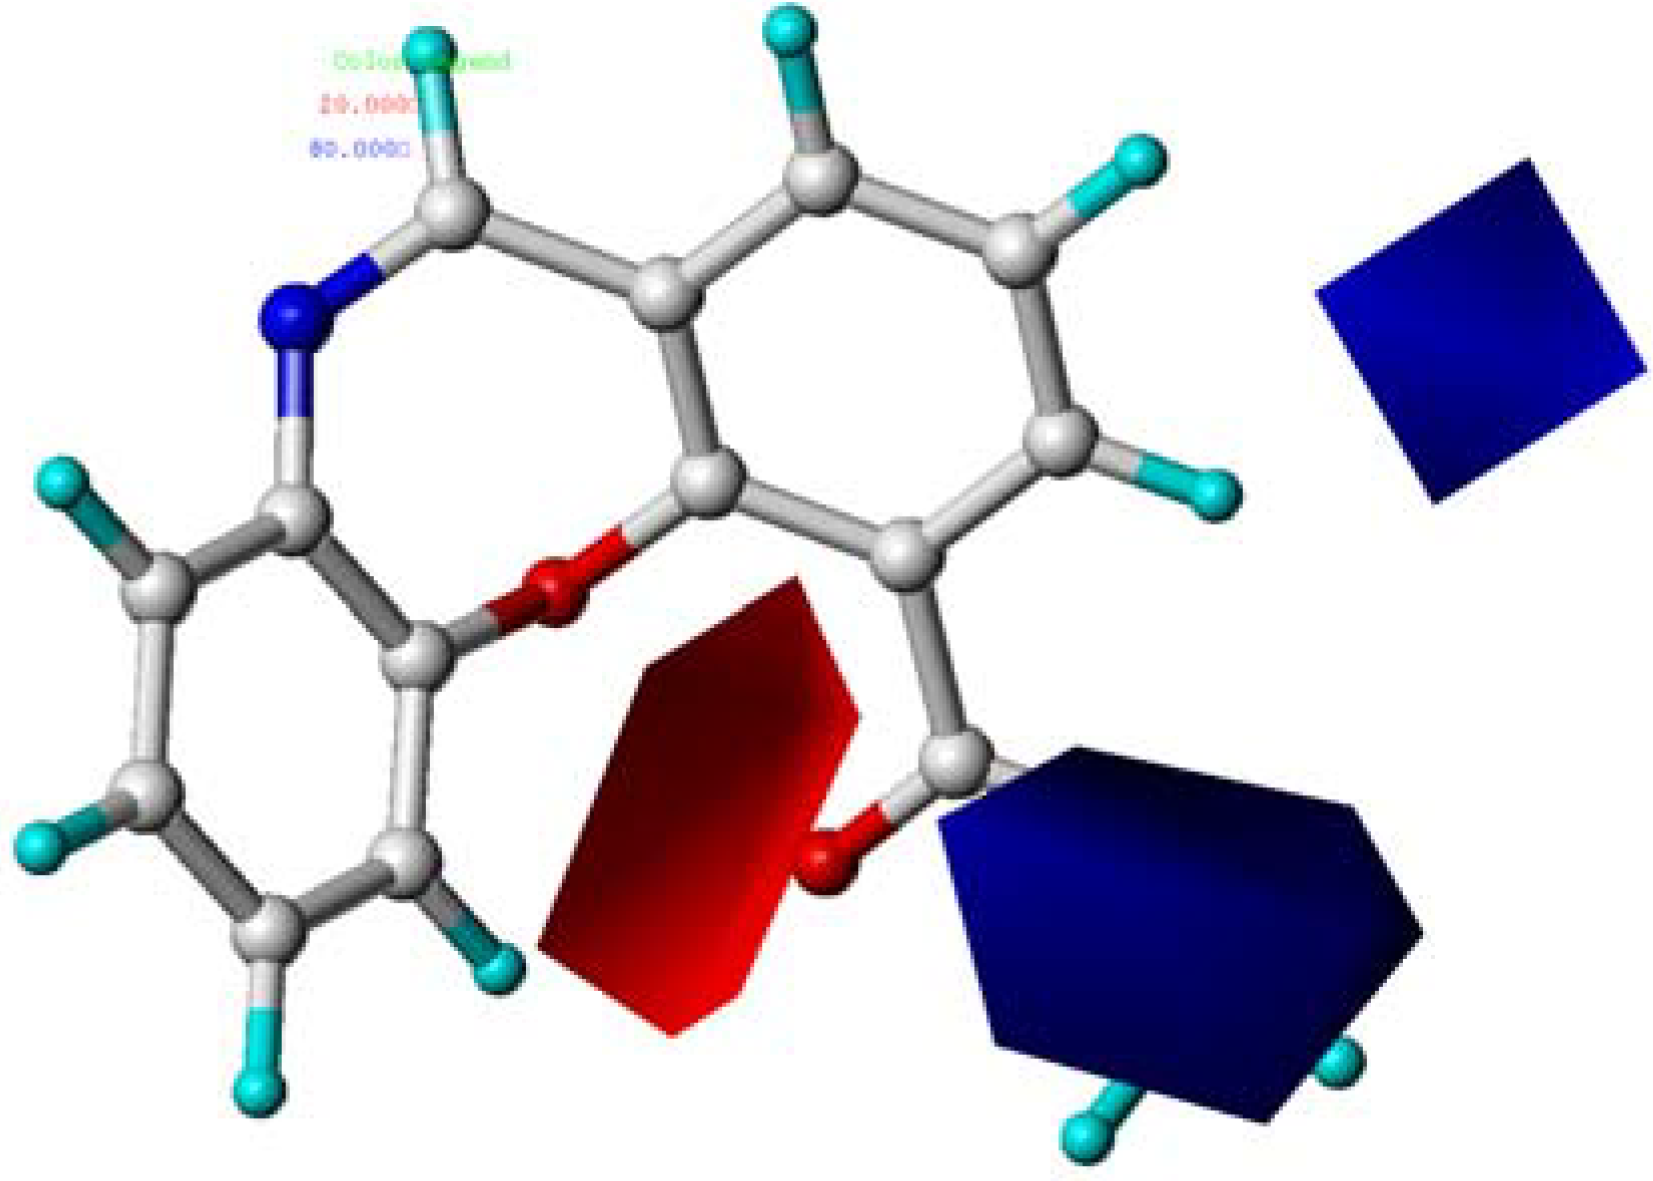
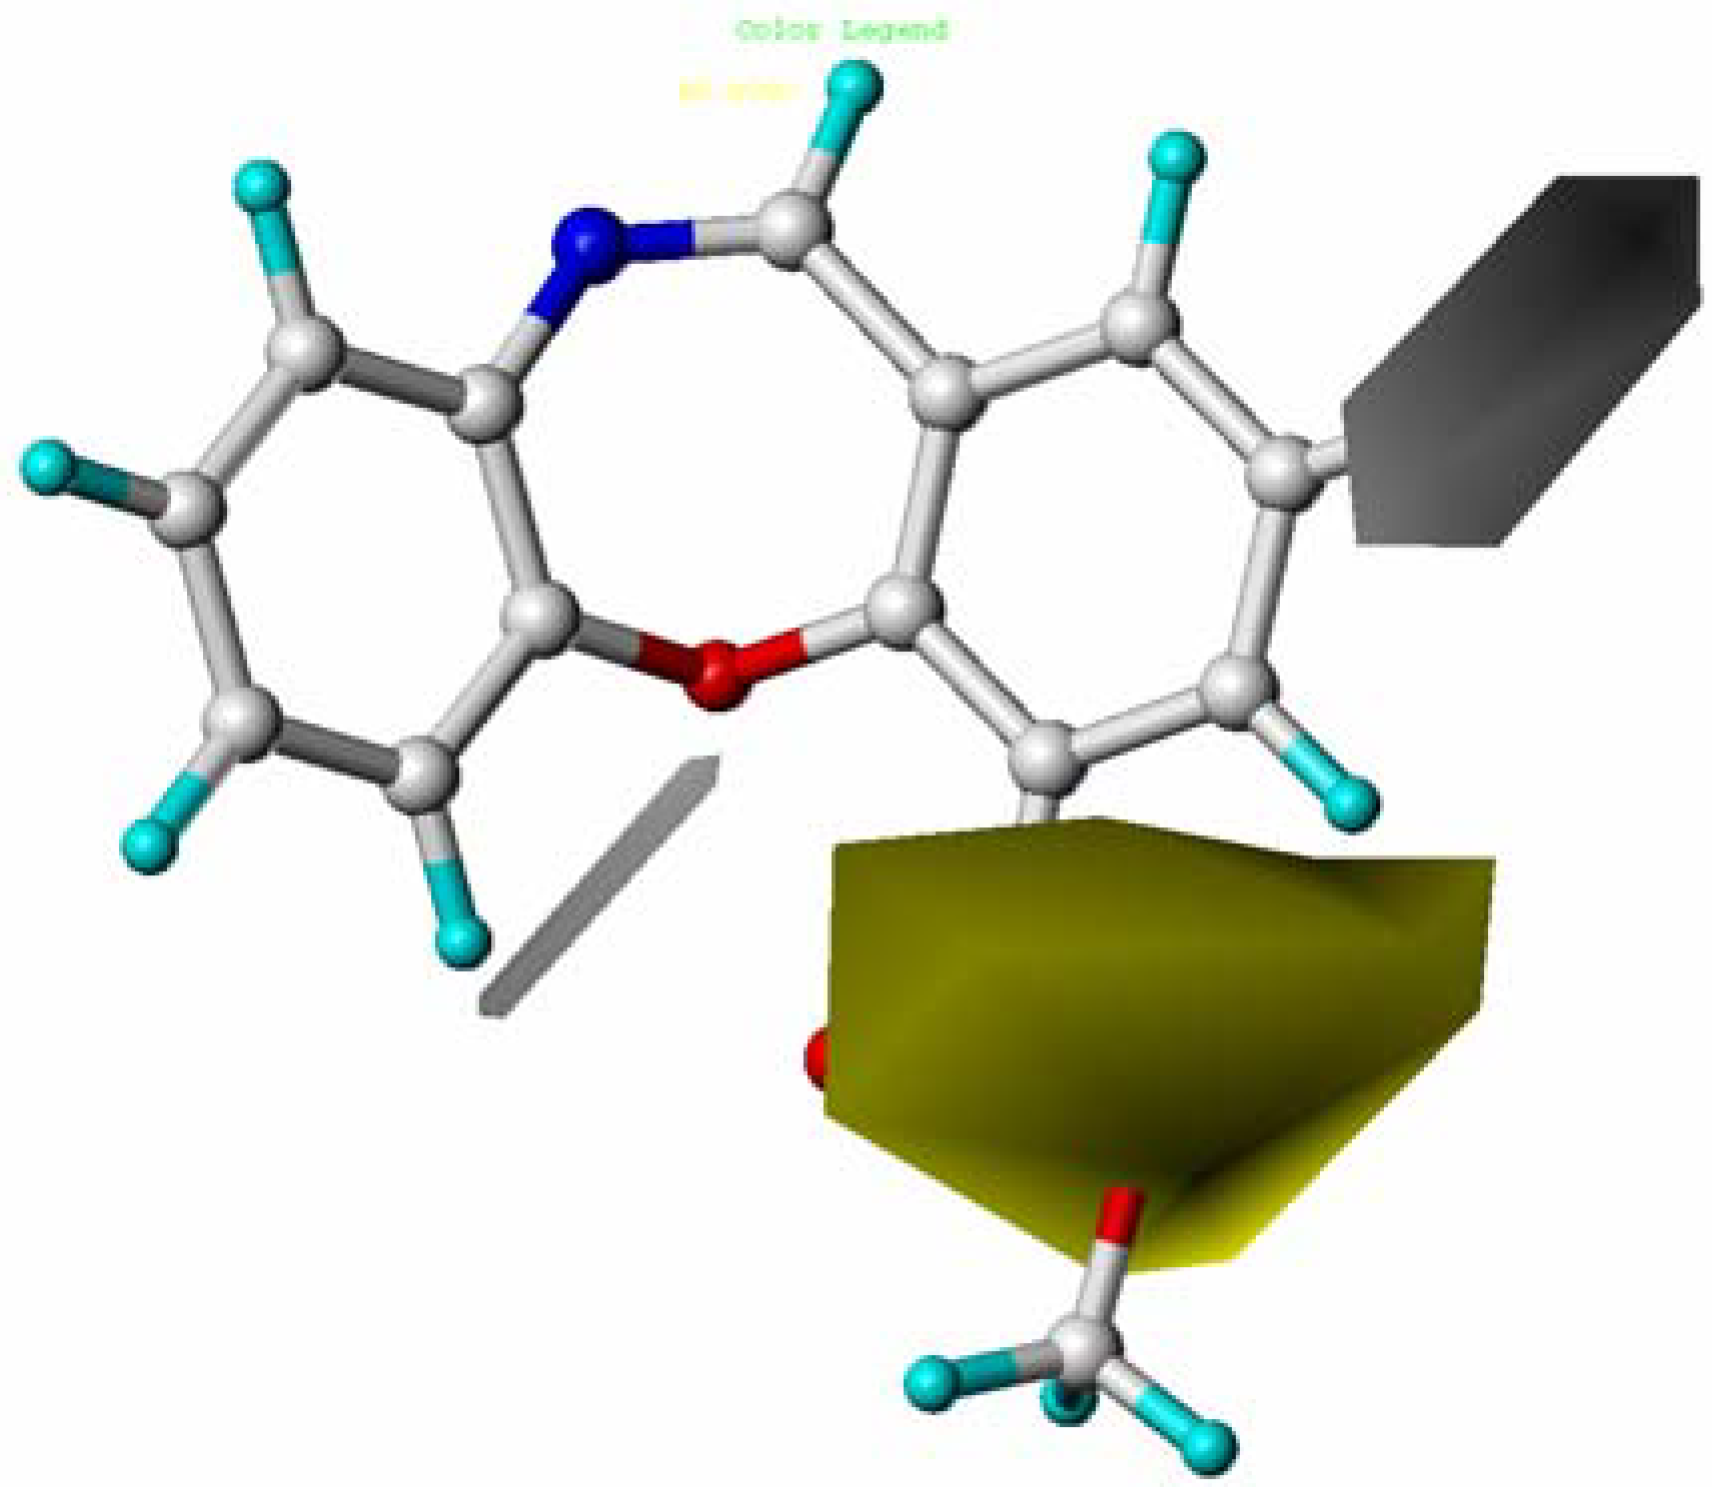
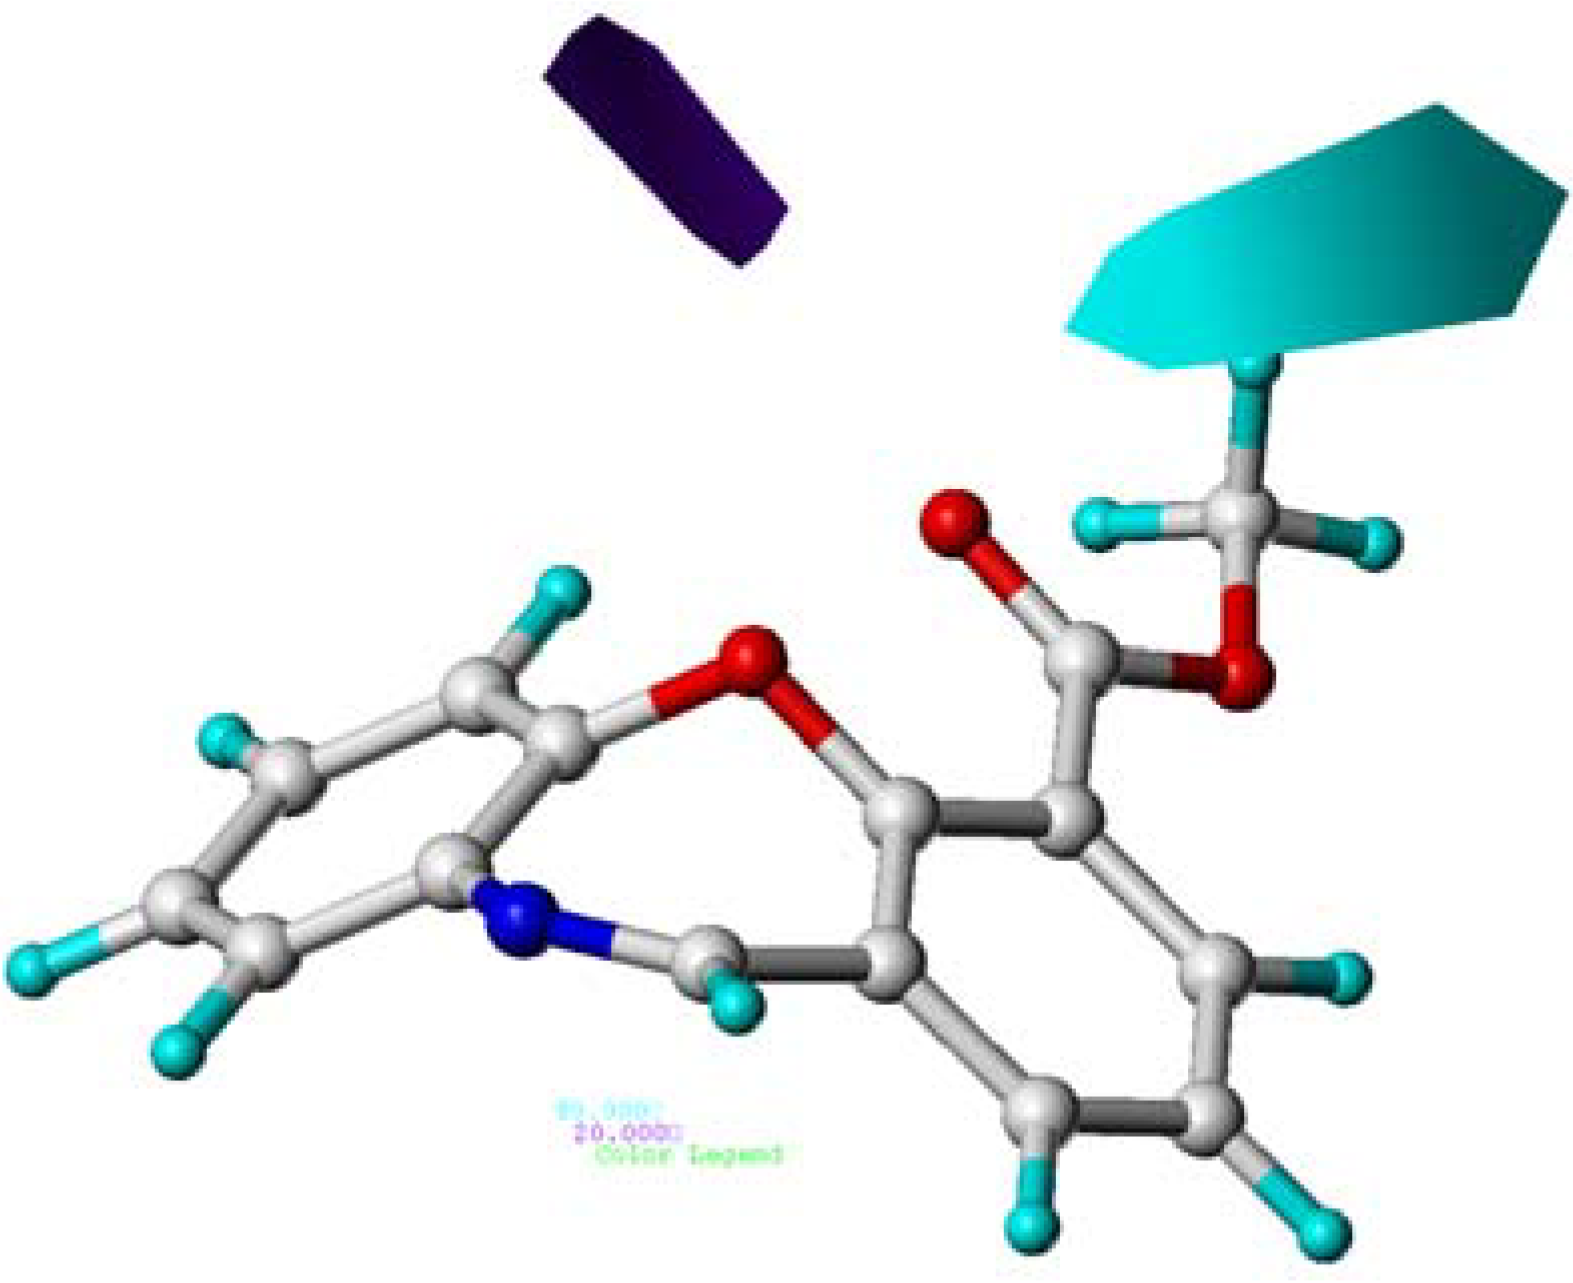
2.5. CoMSIA Contour Maps


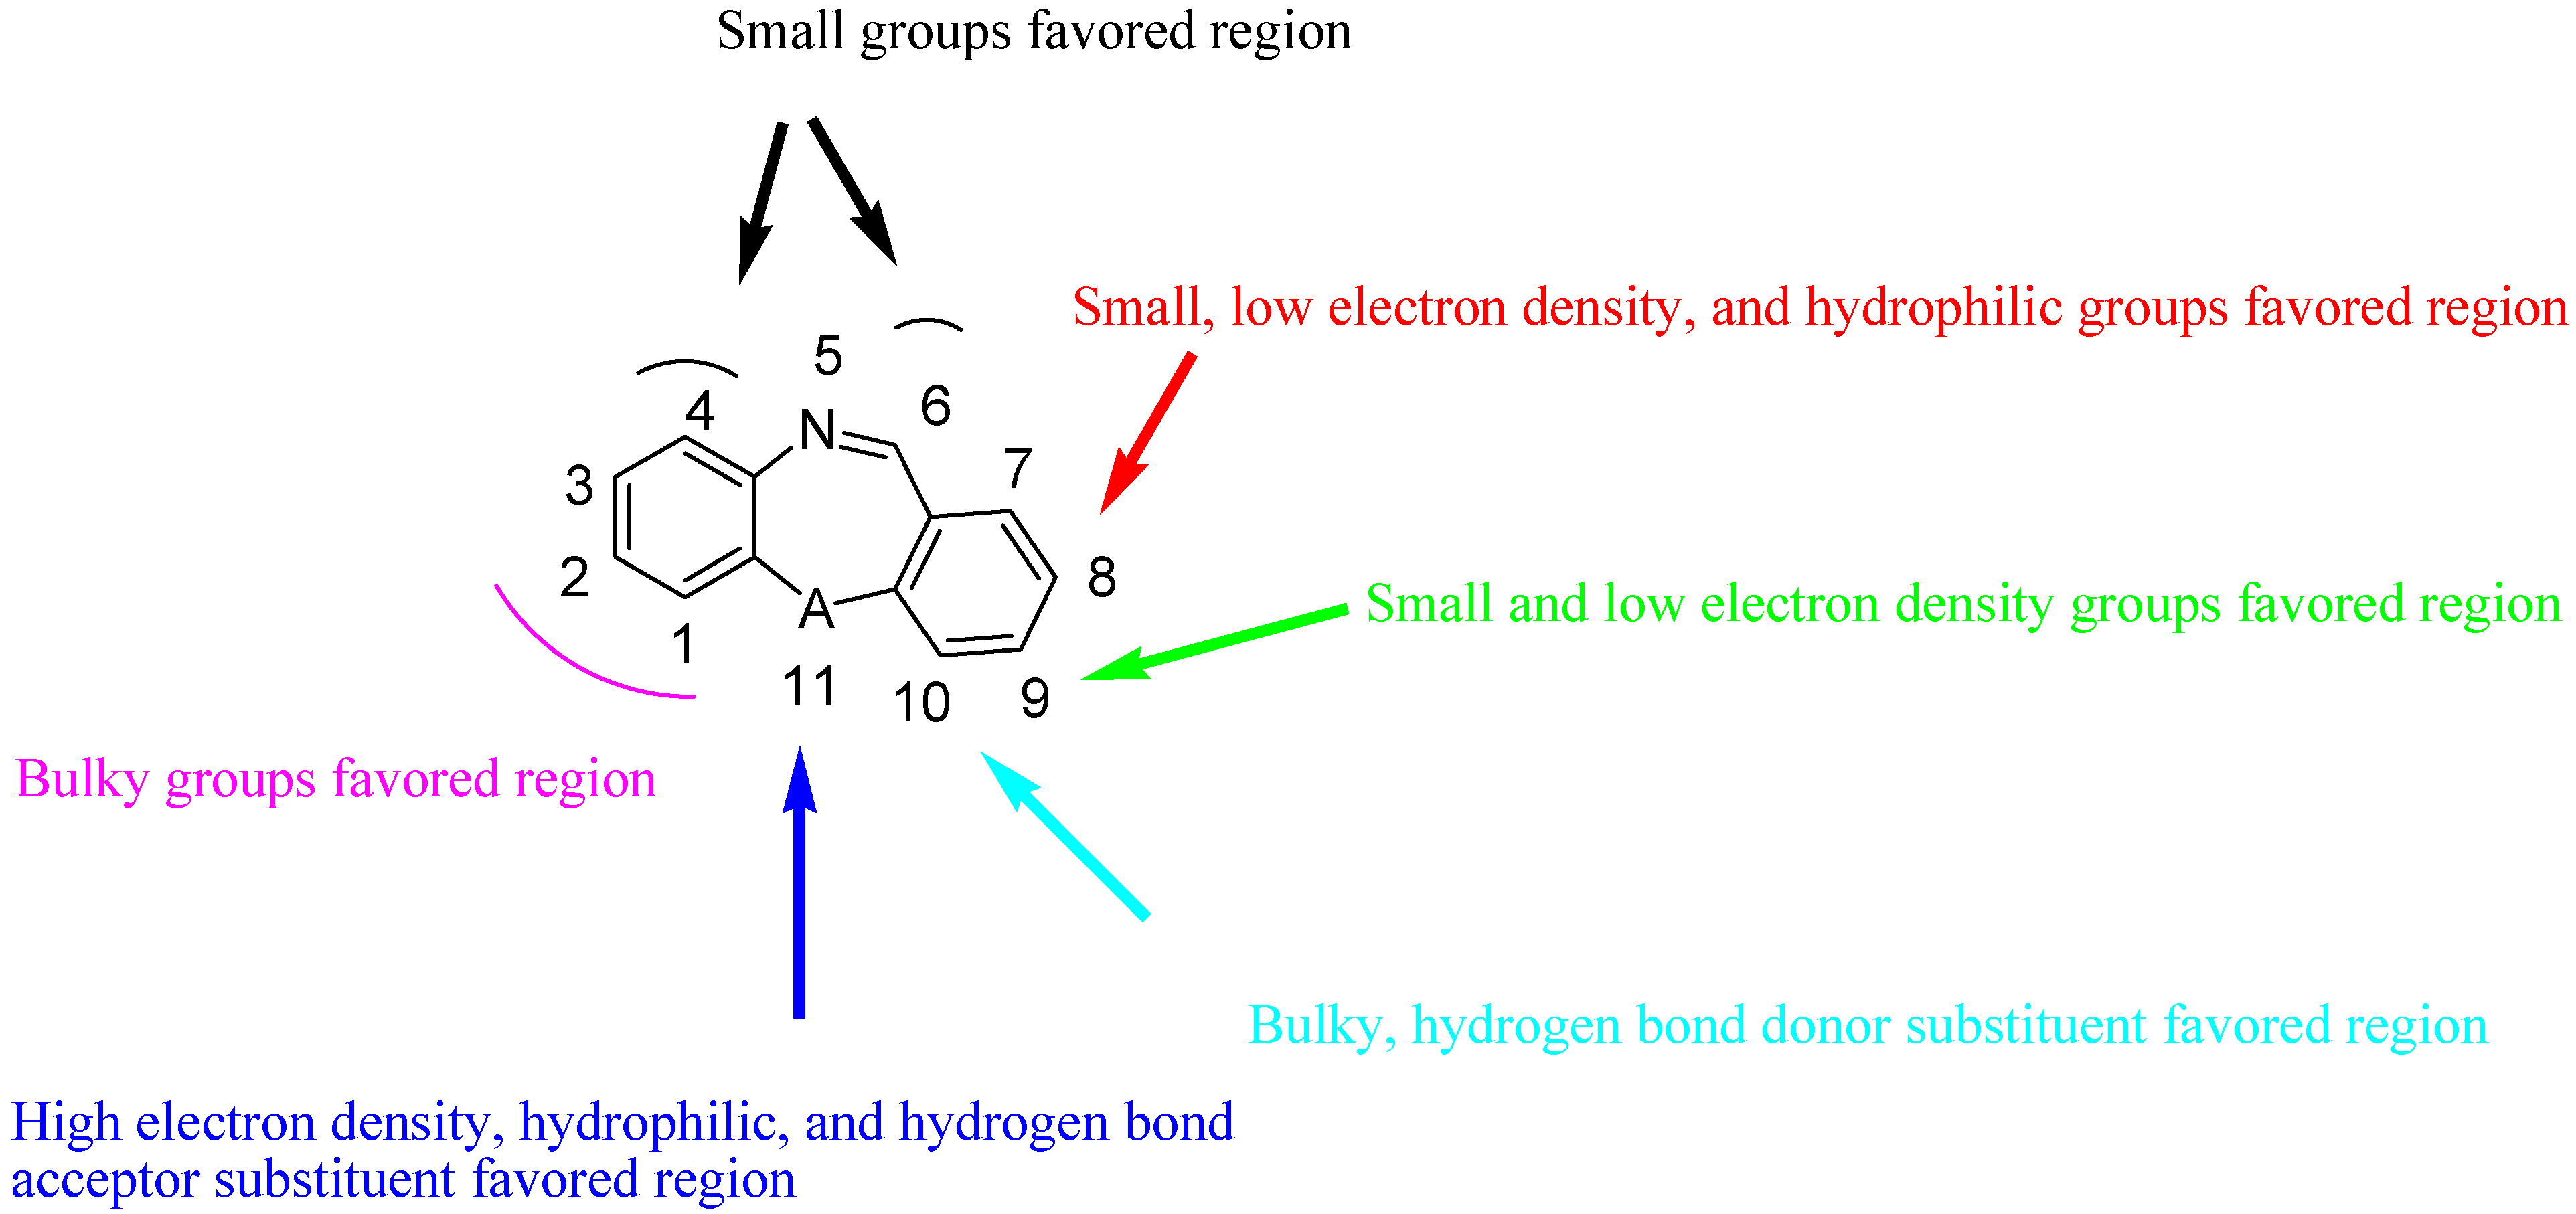
2.6. Summary of the Structure-Activity Relationship Based on CoMFA and CoMSIA Models

3. Materials and Methods
3.1. Data Sets
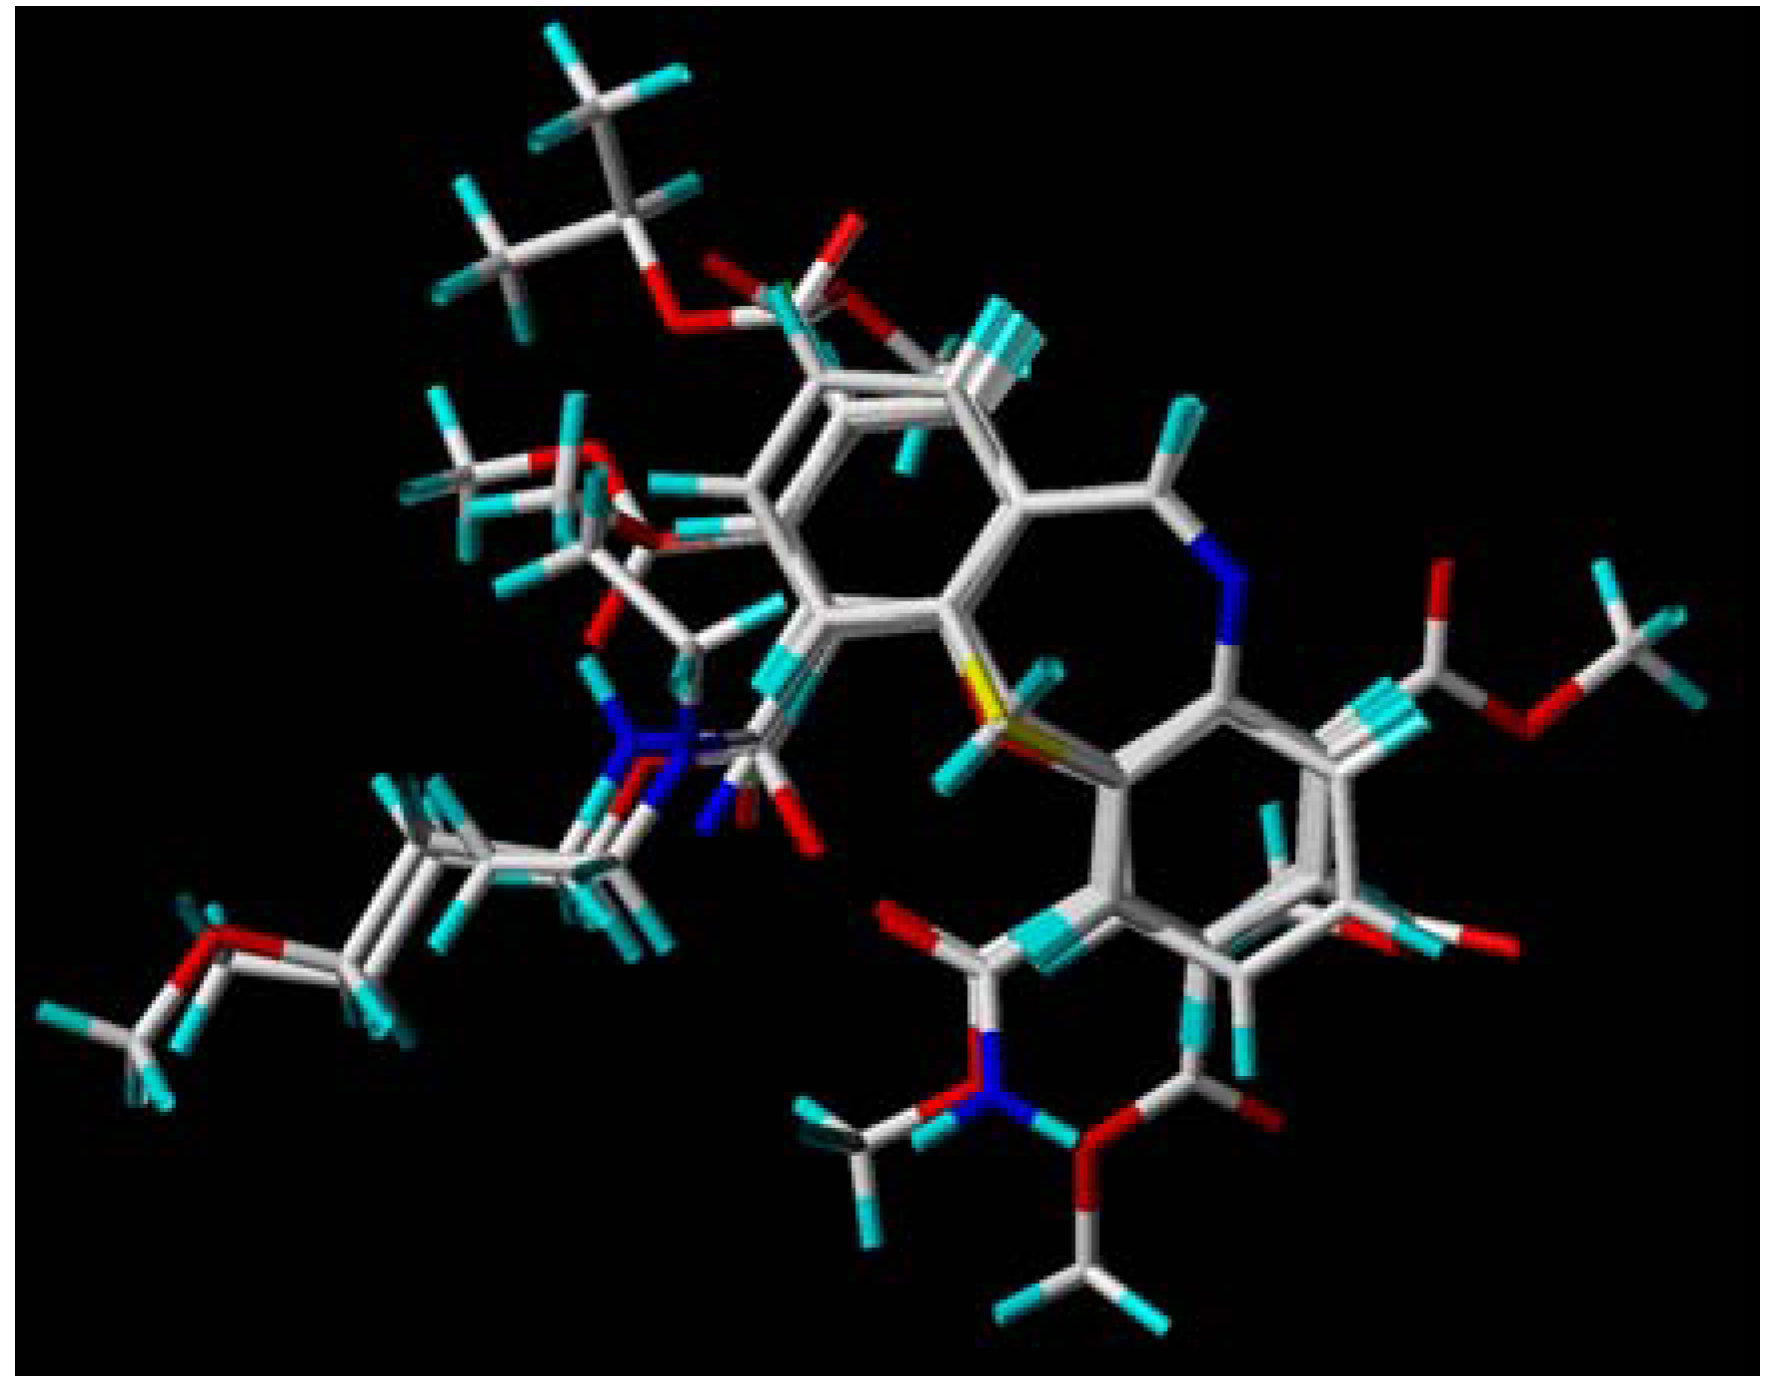
3.2. Molecular Modeling and Database Alignment


3.3. CoMFA Modeling
3.4. CoMSIA Modeling
3.5. PLS Analysis
3.6. Models Validation-Predictive Correlation Co-Efficient (r2pred)
3.7. Models Validation-External Validation
4. Conclusions
Acknowledgements
References
- McMahon, S.B.; Wood, J.N. Increasingly irritable and close to tears: TRPA1 in inflammatory pain. Cell 2006, 124, 1123–1125. [Google Scholar] [CrossRef]
- Karashima, Y.; Prenen, J.; Meseguer, V.; Owsianik, G.; Voets, T.; Nilius, B. Modulation of the transient receptor potential channel TRPA1 by phosphatidylinositol 4,5-biphosphate manipulators. Eur. J. Physiol. 2008, 457, 77–89. [Google Scholar] [CrossRef]
- Bandell, M.; Story, G.M.; Hwang, S.W.; Viswanath, V.; Eid, S.R.; Petrus, M.J.; Earley, T.J.; Patapoutian, A. Noxious cold ion channel TRPA1 is activated by pungent compounds and bradykinin. Neuron 2004, 41, 849–857. [Google Scholar] [CrossRef]
- Corey, D.P.; Garcia-Anoveros, J.; Holt, J.R.; Kwan, K.Y.; Lin, S.Y.; Vollrath, M.A.; Amalfitano, A.; Cheung, E.L.; Derfler, B.H.; Duggan, A.; Geleoc, GS.; Gray, P.A.; Hoffman, M.P.; Rehm, H.L.; Tamasauskas, D.; Zhang, D.S. TRPA1 is a candidate for the mechanosensitive transduction channel of vertebrate hair cells. Nature 2004, 432, 723–730. [Google Scholar]
- Gijsen, H.J.M.; Berthelot, D.; Zaja, M.; Brône, B.; Geuens, I.; Mercken, M. Analogues of morphanthridine and the Tear Gas dibenz[b,f][1,4]oxazepine (CR) as extremely potent activators of the human Transient Receptor Potential Ankyrin 1 (TRPA1) channel. J. Med. Chem. 2010, 53, 7011–7020. [Google Scholar] [CrossRef]
- Everaerts, W.; Gevaert, T.; Nilius, B.; De Ridder, D. On the origin of bladder sensing: Tr(i)ps in urology. Neurourol. Urodyn. 2008, 27, 264–273. [Google Scholar] [CrossRef] [Green Version]
- Cai, X. Anew tr(i)p to sense pain:TRPA1channel as a target for novel analgesics. Expert Rev. Neurother. 2008, 8, 1675–1681. [Google Scholar] [CrossRef]
- Bessac, B.F.; Jordt, S.E. Breathtaking TRP channels: TRPA1 and TRPV1 in airway chemosensation and reflex control. Physiology 2008, 23, 360–370. [Google Scholar] [CrossRef]
- Jordt, S.E.; Bautista, D.M.; Chuang, H.H.; McKemy, D.D.; Zygmunt, P.M.; Hogestatt, E.D.; Meng, I.D.; Julius, D. Mustard oils and cannabinoids excite sensory nerve fibres through the TRP channel ANKTM1. Nature 2004, 427, 260–265. [Google Scholar]
- Bautista, D.M.; Jordt, S.E.; Nikai, T.; Tsuruda, P.R.; Read, A.J.; Poblete, J.; Yamoah, E.N.; Basbaum, A.I.; Julius, D. TRPA1 mediates the inflammatory actions of environmental irritants and proalgesic agents. Cell 2006, 124, 1269–1282. [Google Scholar] [CrossRef]
- Brône, B.; Peeters, P.J.; Marrannes, R.; Mercken, M.; Nuydens, R.; Meert, T.; Gijsen, H.J.M. Tear gasses CN, CR, and CS are potent activators of the human TRPA1 receptor. Toxicol. Appl. Pharmacol. 2008, 231, 150–156. [Google Scholar] [CrossRef]
- Sybyl 8.1; Tripos Inc.: St. Louis, MO, USA, 2008. Available online: http://www.tripos.com.
- Ai, Y.; Wang, S.T.; Sun, P.H.; Song, F.J. Molecular modeling studies of 4,5-Dihydro-1H- pyrazolo[4,3-h]quinazoline derivatives as potent CDK2/Cyclin A inhibitors using 3D-QSAR and docking. Int. J. Mol. Sci. 2010, 11, 3705–3724. [Google Scholar] [CrossRef]
- Xiong, X.Q.; Zhao, D.M.; Bu, P.F.; Liu, Y.; Ren, J.H.; Wang, J.; Cheng, M.S. CoMFA, CoMSIA and eigenvalue analysis on dibenzodioxepinone and dibenzodioxocinone derivatives as cholesteryl ester transfer protein inhibitors. Molecules 2008, 13, 1822–1839. [Google Scholar] [CrossRef]
- Benabadji, H.S.; Chen, H.F. 3D-QSAR study on diindolylmethane and its analogues with comparative molecular field analysis (CoMFA). Chin. J. Chem. 2003, 21, 20–24. [Google Scholar]
- Wellsow, J.; Machullab, H.J.; Kovar, K.A. 3D QSAR of serotonin transporter ligands: CoMFA and CoMSIA studies. Quant. Struct-Act. Relatsh. 2002, 21, 577–589. [Google Scholar] [CrossRef]
- Liu, H.Y.; Liu, S.S.; Qin, L.T.; M, L.Y. CoMFA and CoMSIA analysis of 2,4-thiazolidinediones derivatives as aldose reductase inhibitors. J. Mol. Model. 2009, 15, 837–845. [Google Scholar] [CrossRef]
- Yang, Z.Q.; Sun, P.H. 3D-QSAR study of potent inhibitors of phosphodiesterase-4 using a CoMFA approach. Int. J. Mol. Sci. 2007, 8, 714–722. [Google Scholar] [CrossRef]
- Lan, P.; Chen, W.N.; Xiao, G.K.; Sun, P.H.; Chen, W.M. 3D-QSAR and docking studies on pyrazolo[4,3-h]quinazoline-3-carboxamides as cyclin-dependent kinase 2 (CDK2) inhibitors. Bioorg. Med. Chem. Lett. 2010, 20, 6764–6772. [Google Scholar] [CrossRef]
- Politi, A.; Durdagi, S.; Moutevelis-Minakakis, P.; Kokotos, G.; Papadopoulos, M.G.; Mavromoustakos, T. Application of 3D QSAR CoMFA/CoMSIA and in silico docking studies on novel renin inhibitors against cardiovascular diseases. Eur. J. Med. Chem. 2009, 44, 3703–3711. [Google Scholar] [CrossRef]
- Cichero, E.; Cesarini, S.; Spallarossa, A.; Mosti, L.; Fossa, P. Acylthiocarbamates as non-nucleoside HIV-1 reverse transcriptase inhibitors: dockinig studies and ligand-based CoMFA and CoMSIA analyses. J. Mol. Model. 2009, 15, 871–884. [Google Scholar] [CrossRef]
- Cichero, E.; Cesarini, S.; Fossa, P.; Spallarossa, A.; Mosti, L. Thiocarbamates as non-nucleoside HIV-1 reverse transcriptase inhibitors: Docking-based CoMFA and CoMSIA analyses. Eur. J. Med. Chem. 2009, 44, 2059–2070. [Google Scholar] [CrossRef]
- Cichero, E.; Cesarini, S.; Mosti, L.; Fossa, P. CoMFA and CoMSIA analyses on 4-oxo-1,4-dihydroquinoline and 4-oxo-1,4-dihydro-1,5-,-1,6- and -1,8-naphthyridine derivatives as selective CB2 receptor agonists. J. Mol. Model. 2010, 16, 677–691. [Google Scholar] [CrossRef]
- Lan, P.; Xie, M.Q.; Yao, Y.M.; Chen, W.N.; Chen, W.M. 3D-QSAR studies and molecular docking on [5-(4-Amino-1H-benzoimidazol-2-yl)-furan-2-yl]-phosphonic acid derivatives as fructose-1, 6-biphophatase inhibitors. J. Comput. Aided Mol. Des. 2010, 24, 993–1008. [Google Scholar] [CrossRef]
- Aher, Y.D.; Agrawal, A.; Bharatam, P.V.; Garg, P. 3D-QSAR studies of substituted 1-(3,3-diphenylpropyl) -piperidinyl amides and ureas as CCR5 receptor antagonists. J. Mol. Model. 2007, 13, 519–529. [Google Scholar] [CrossRef]
- Lan, P.; Huang, Z.J. 3D-QSAR and molecular docking studies on fused pyrazoles as p38a mitogen-activated protein kinase inhibitors. Int. J. Mol. Sci. 2010, 11, 3357–3374. [Google Scholar] [CrossRef]
- Roy, P.P.; Roy, K. On some aspects of variable selection for partial least squares regressionmodels. QSAR Comb. Sci. 2008, 27, 302–313. [Google Scholar] [CrossRef]
- Basu, A.; Jasu, K.; Jayaprakash, V.; Mishra, N.; Ojha, P.; Bhattacharya, S. Development of CoMFA and CoMSIA models of cytotoxicity data of anti-HIV-1-phenylamino-1H-imidazole derivatives. Eur. J. Med. Chem. 2009, 44, 2400–2407. [Google Scholar] [CrossRef]
- Lu, P.; Wei, X.; Zhang, R. CoMFA and CoMSIA 3D-QSAR studies on quionolone caroxylic acid derivatives inhibitors of HIV-1 integrase. Eur. J. Med. Chem. 2010, 44, 3413–3419. [Google Scholar]
- Golbraikh, A.; Tropsha, A. Beware of q2! J. Mol. Graph. Model. 2002, 20, 269–276. [Google Scholar] [CrossRef]
© 2010 by the authors; licensee MDPI, Basel, Switzerland. This article is an open access article distributed under the terms and conditions of the Creative Commons Attribution license (http://creativecommons.org/licenses/by/3.0/).
Share and Cite
Ai, Y.; Song, F.-J.; Wang, S.-T.; Sun, Q.; Sun, P.-H. Molecular Modeling Studies on 11H-Dibenz[b,e]azepine and Dibenz[b,f][1,4]oxazepine Derivatives as Potent Agonists of the Human TRPA1 Receptor. Molecules 2010, 15, 9364-9379. https://0-doi-org.brum.beds.ac.uk/10.3390/molecules15129364
Ai Y, Song F-J, Wang S-T, Sun Q, Sun P-H. Molecular Modeling Studies on 11H-Dibenz[b,e]azepine and Dibenz[b,f][1,4]oxazepine Derivatives as Potent Agonists of the Human TRPA1 Receptor. Molecules. 2010; 15(12):9364-9379. https://0-doi-org.brum.beds.ac.uk/10.3390/molecules15129364
Chicago/Turabian StyleAi, Yong, Fa-Jun Song, Shao-Teng Wang, Qiang Sun, and Ping-Hua Sun. 2010. "Molecular Modeling Studies on 11H-Dibenz[b,e]azepine and Dibenz[b,f][1,4]oxazepine Derivatives as Potent Agonists of the Human TRPA1 Receptor" Molecules 15, no. 12: 9364-9379. https://0-doi-org.brum.beds.ac.uk/10.3390/molecules15129364