Efficiency of Osmotic Dehydration of Apples in Polyols Solutions

Department of Food Engineering and Process Management, Warsaw University of Life Sciences, Nowoursynowska 166, 02-787 Warszawa, Poland
*
Author to whom correspondence should be addressed.
Molecules 2018, 23(2), 446; https://0-doi-org.brum.beds.ac.uk/10.3390/molecules23020446
Submission received: 26 January 2018
/
Revised: 12 February 2018
/
Accepted: 14 February 2018
/
Published: 17 February 2018
Abstract
:The present study aimed to evaluate the influence of selected compounds from the polyol group, as well as other saccharides, on the osmotic dehydration process of apples. The following alternative solutions were examined: erythritol, xylitol, maltitol, inulin and oligofructose. Efficiency of the osmotic dehydration process was evaluated based on the kinetics of the process, and through comparison of the results obtained during the application of a sucrose solution. This innovative research utilizes alternative solutions in osmotic pretreatment, which until now, have not been commonly used in fruit processing by researchers worldwide. Results indicate that erythritol and xylitol show stronger or similar efficiency to sucrose; however, the use of inulin, as well as oligofructose, was not satisfactory due to the insufficient, small osmotic driving forces of the process, and the low values of mass transfer parameters.
1. Introduction
Osmotic dehydration (OD), as pre-treatment before drying, is commonly used to preserve food, and allows modification of the composition and properties of the products, as well as an opportunity to create new food products and innovative technologies. Nowadays, OD receives a lot of attention in the field of fruit preservation, as it allows for improvements in food product quality and reduces energy consumption. Efficiency of OD depends on many factors, such as duration of the process, temperature, solution concentration and type [1], the material structure (porosity), the sample geometry (size, shape, and surface area), and the ratio of the mass of the food to the mass of the solution [2]. A number of osmotic agents can be used in OD. The osmotic agent must be effective, convenient, non-toxic, taste good, and should be readily dissolvable to form a high-concentrated solution [3]. In order to select the appropriate substance, it is necessary to take its molecular weight into account. During osmosis, the kinetic parameters are strongly affected by the kind of osmotic agent used, including its molecular weight and ionic behavior [4]. The osmotic pressure of solutions depends on the concentration of low-molecular-weight substances [5]. High-molecular-weight substances produce a lower osmotic pressure, resulting in lower kinetic parameters, and less penetration of the high-molecular-substances into the material [6]. Various substances can be used for the preparation of such solutions: glucose, sucrose, glycerol, sorbitol, corn syrup, glucose syrup, and fructooligosaccharide are most commonly used [7]. Most of the papers dealing with osmotic treatment of foodstuffs have mainly focused on dehydration in quite popular solutions. Researcher have reported the influence of OD on process kinetics in, for example, sucrose [8,9,10], glucose, fructose [11] and trehalose [12,13]. Fewer studies are concerned with the effects of using an alternative solution to sucrose substances, such as sorbitol [14,15,16], maltose [17], oligofructose [16,18] and maltodextrin [15,18]. Researchers have also utilized non-conventional osmotic agents, including maltitol [13,19], glycerol [15,20], polydextrose [15], galaktosorbitol [16], and tagatose [21].
In this study, selected compounds from the polyol group, as well as other alternative saccharides, were used for pre-treatment. The present study aimed to evaluate the influence of erythritol, xylitol, maltitol and oligofructose in pre-treatment, on the OD of apples, as alternatives to sucrose. Observation of the kinetic parameters during the process is essential for the selection of the optimal processing condition.
2. Results and Discussion
2.1. Water Content (WC)
The values of WC decreased with the prolongation of the dehydration process. Table 1 and Table 2 shows the changes in the WC during the experiments. The raw material was characterized by a WC of 7.31 ± 0.01 g/g d.m. In all cases, an increase in the osmotic solution concentration resulted in a greater degree of dehydration of the apples. The highest degree of dehydration was achieved using a 40% solution concentration of xylitol and erythritol–WC was reduced to about 1.60 g/g d.m.; therefore, these alternative solutions are more effective compared to the 50% solution concentration of sucrose. A 40% solution concentration of maltitol, and a 30% solution concentration of erythritol showed similar efficiency to sucrose. The use of solutions containing inulin and oligofructose, as well as a 20% solution of maltitol, were found to be ineffective. Even though statistical analysis indicated an influence of the type of osmotic agent (Table 3), one-way ANOVA did not show any significant influences of time or concentration on WC values, when inulin and oligofructose solutions were used. The larger osmotic effect noted with xylitol and erythritol solutions, compared with sucrose, has been attributed to the higher (almost double) molecular weight of sucrose and the resultant lower osmotic pressure, compared to the alternative solutions.
In recent research, Rodriguez et al. [22] dehydrated nectarines for 2 h (with an initial WC of 4.602 g/g d.m.), in a 60% solution concentration of sorbitol to achieve a reduction of WC to a value of 1.903 ± 0.779 g/g d.m., whereas a 40% solution concentration of glucose resulted in poor reduction of WC values. Moreover, when glucose and sorbitol were used (2.52 g/g d.m. and 2.59 g/g d.m., respectively), the resulting values were similar to findings in the present study, which utilized the same conditions: a 2-h duration with a 40% solution concentration of xylitol and maltitol (Table 1). Brochier et al. [15] dehydrated yacon in a 33% concentration of alternative solutions to sucrose, namely, maltodextrin, polydextrose, sorbitol and glycerol, for 30, 60, 120, 240 and 360 min. Their results confirmed that a decrease of WC was observed during the process. The best results were achieved when glycerol and sorbitol were used. Maltodextrin did not behave like an osmotic agent in their study.
2.2. Water Loss (WL)
The WL is an important parameter of mass transfer that indicates the efficiency of OD. To evaluate the acceptability of utilizing alternative solutions, the curves of OD kinetics in the 50% sucrose solution were applied to the figures (shown below as dotted lines).
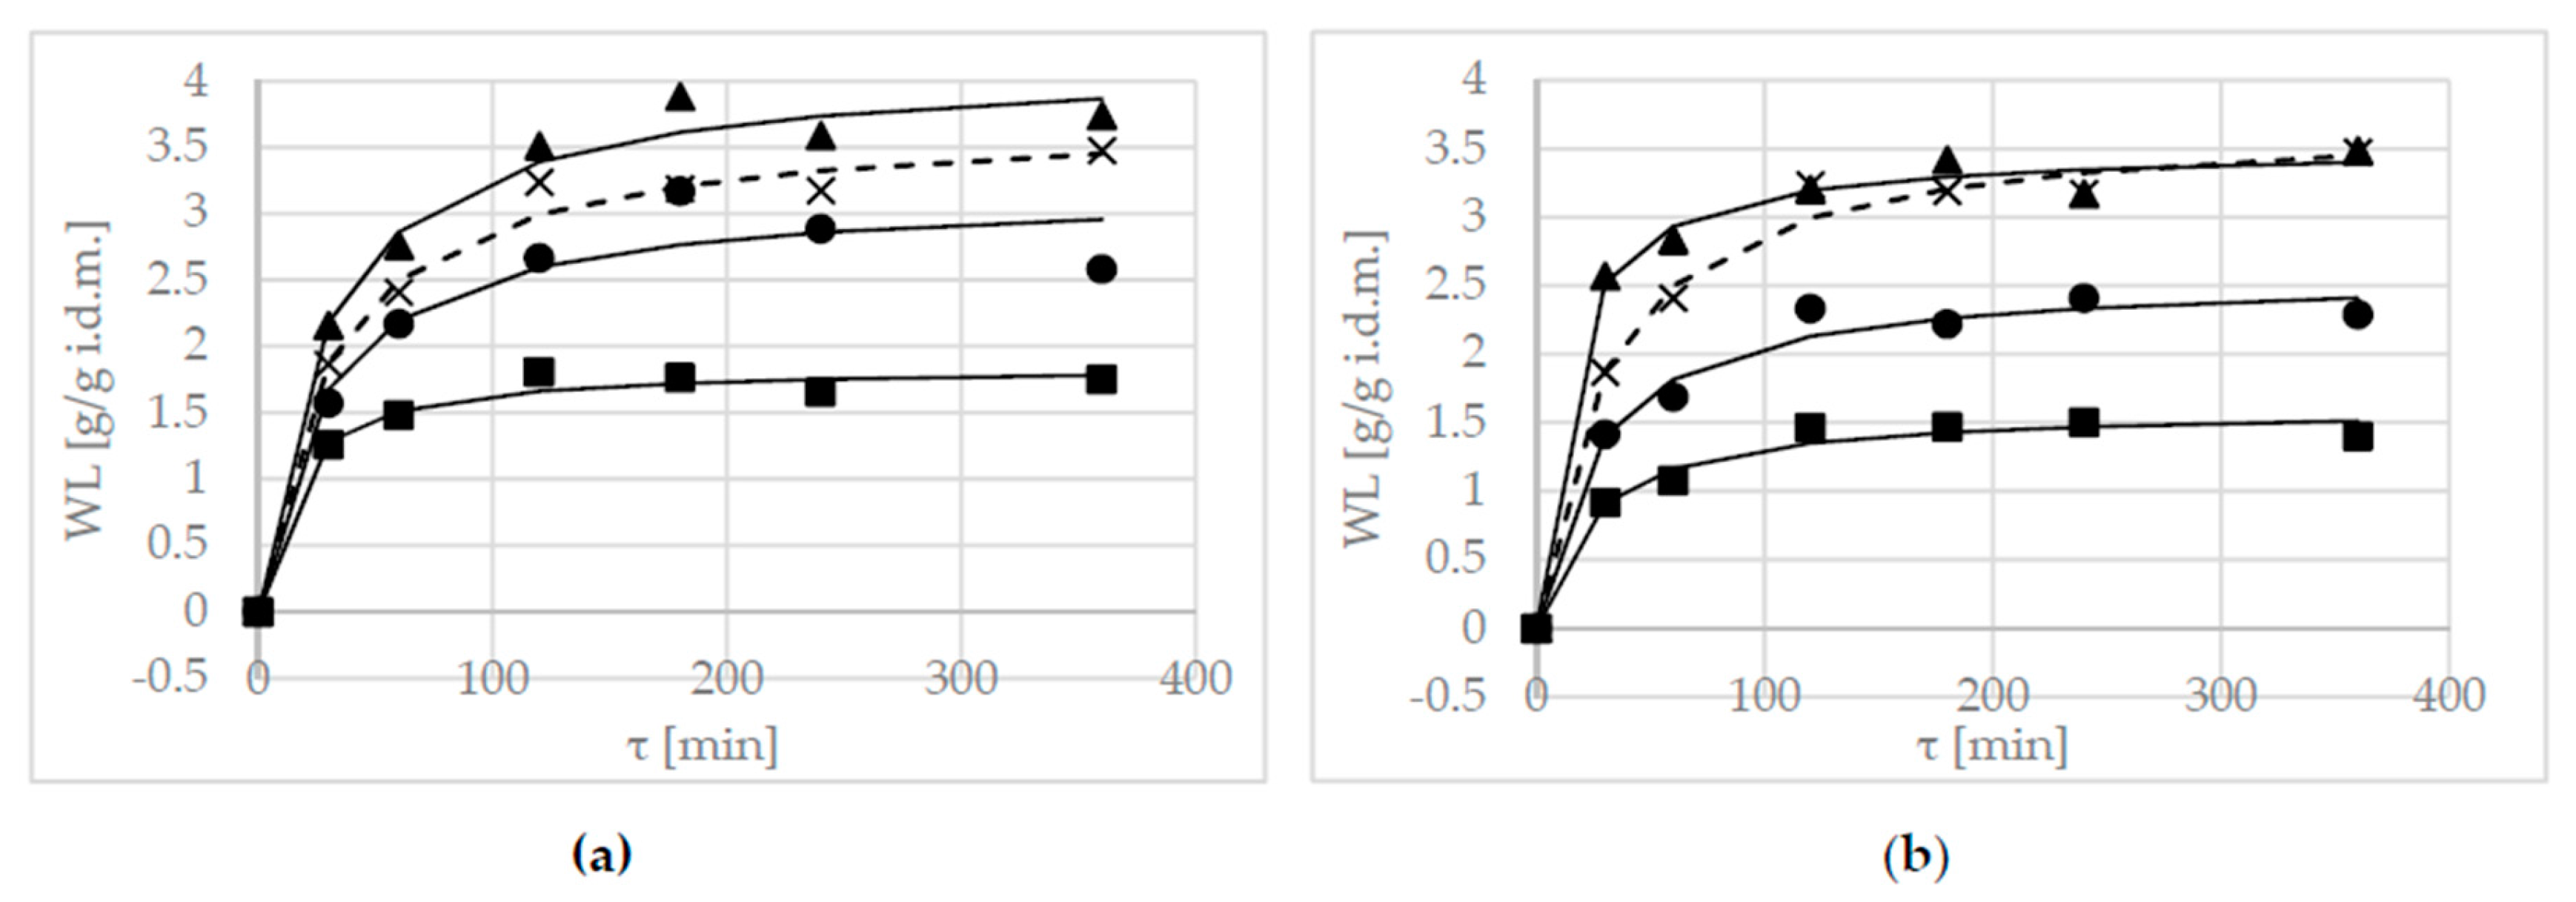
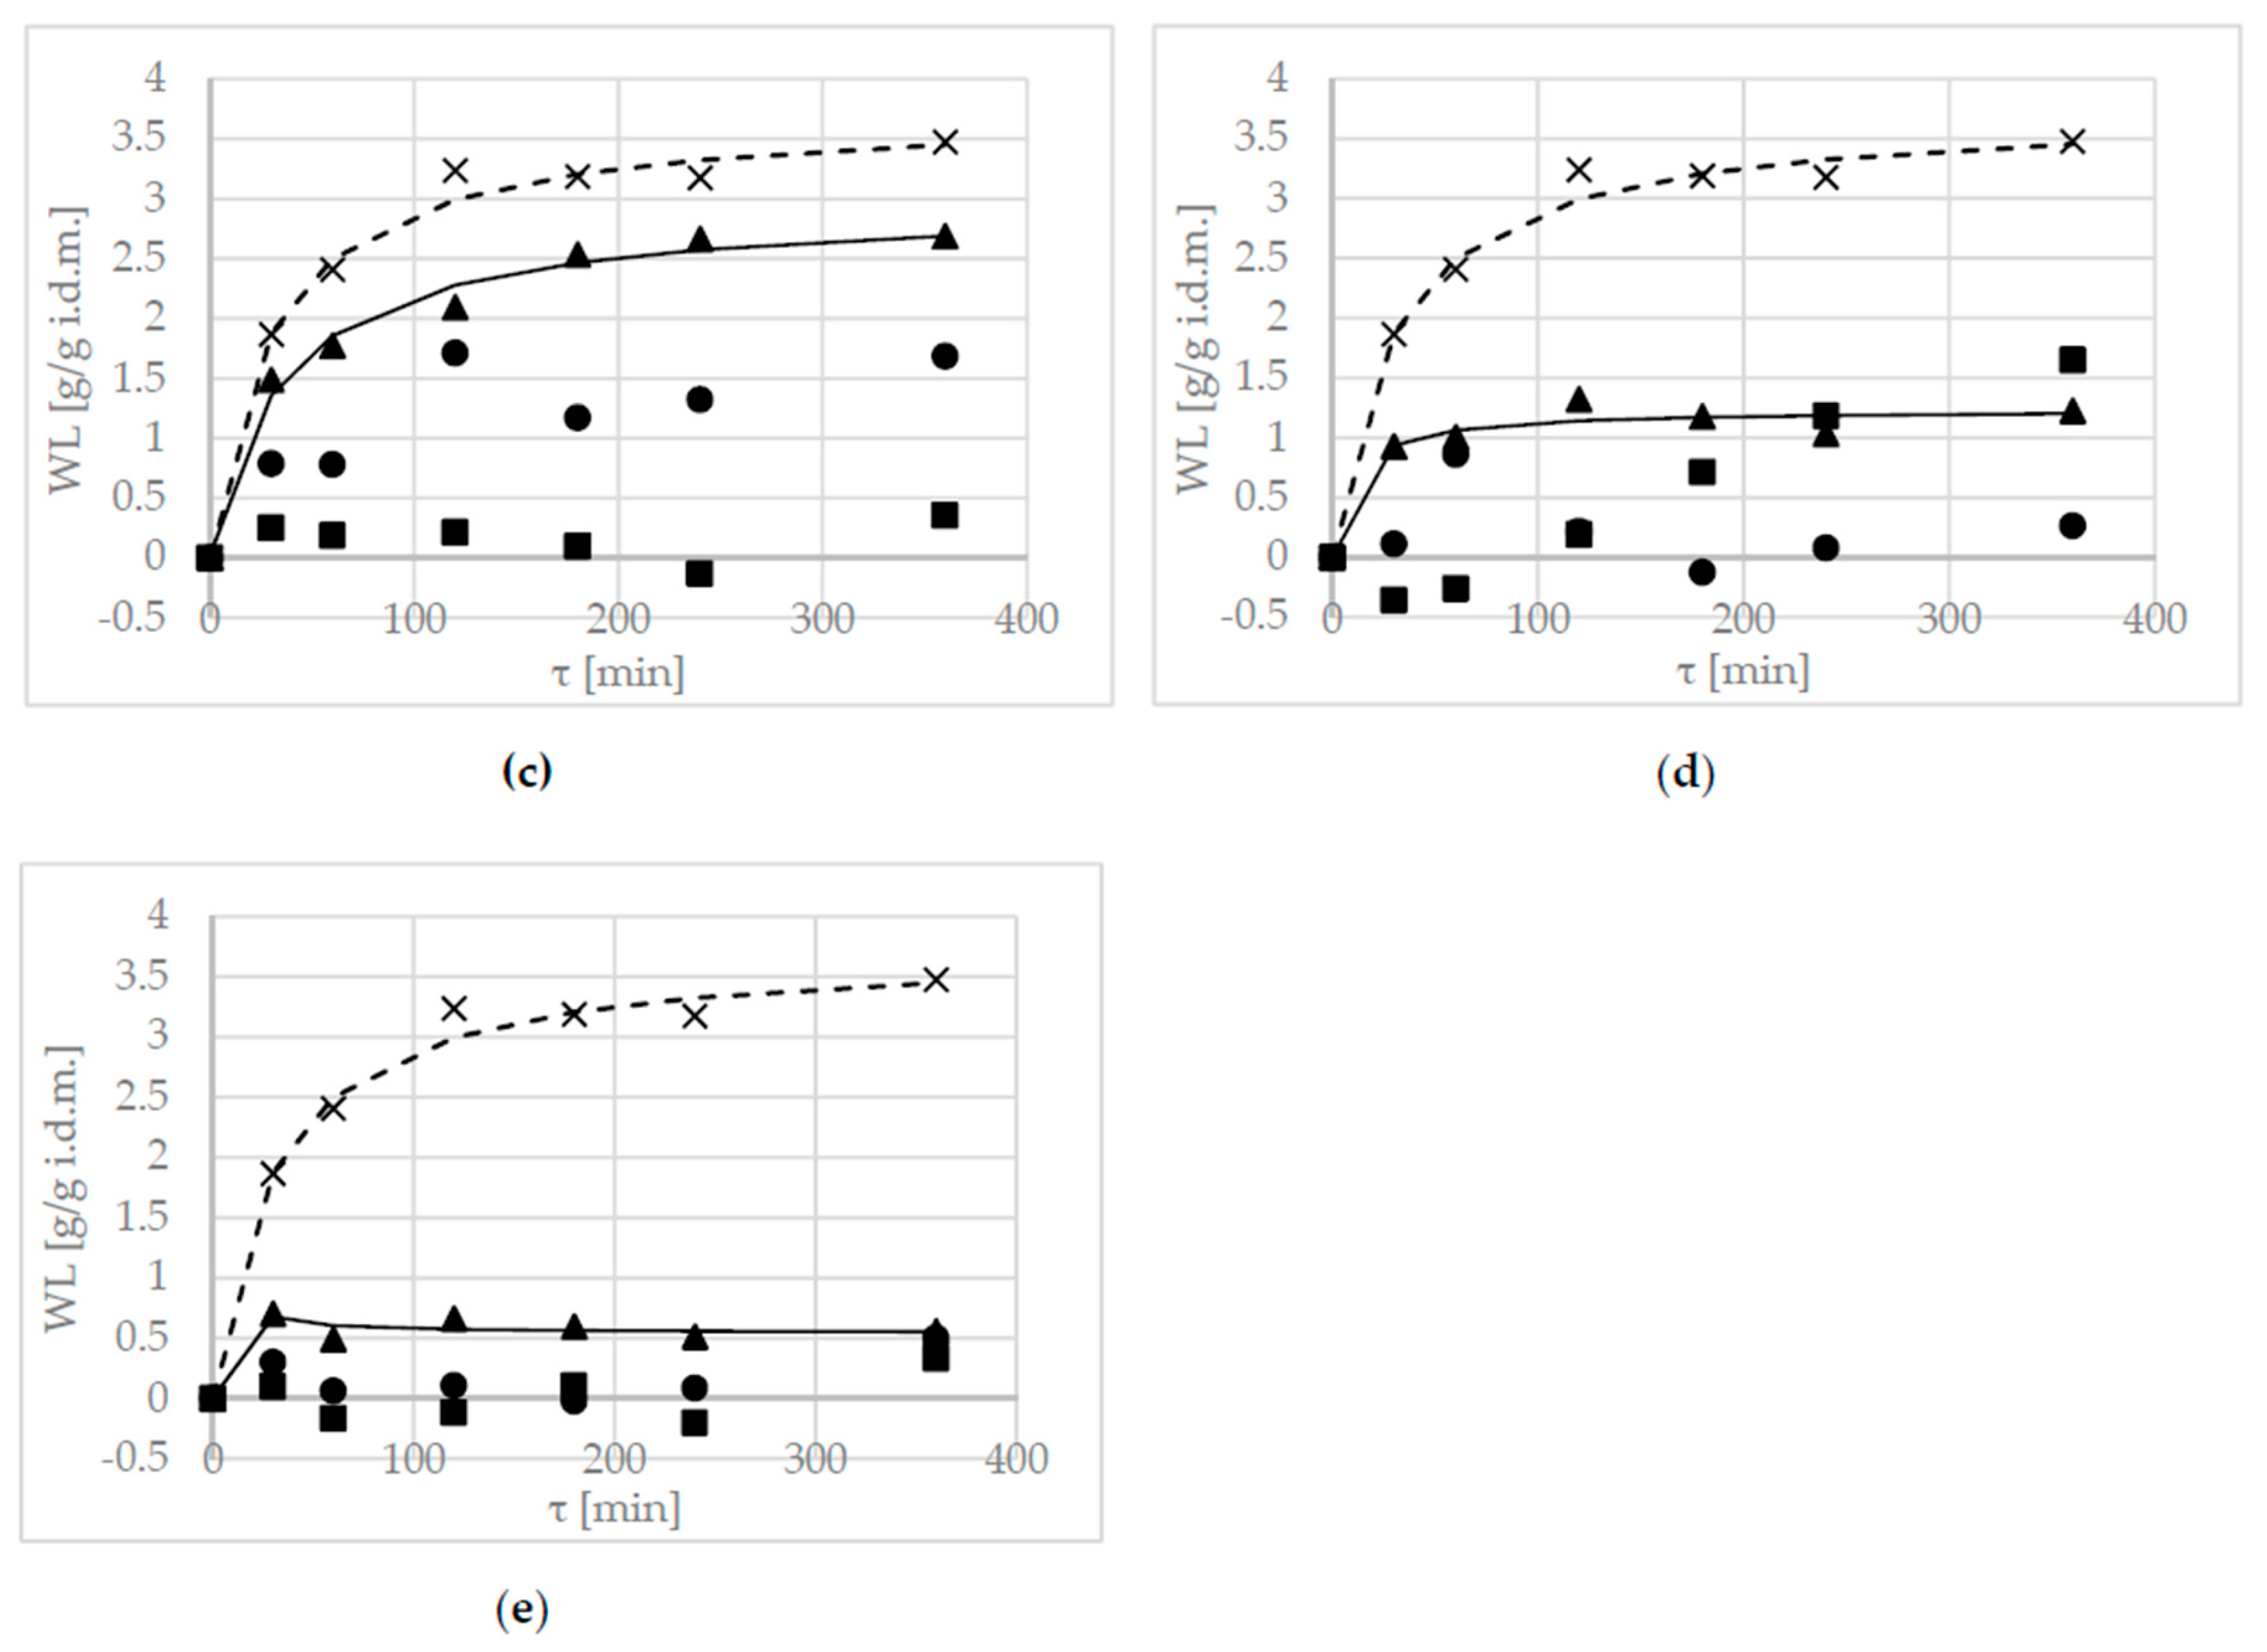
The non-linear increase of WL was observed at all concentrations during the OD process. In all cases, except for solutions with oligofructose, inulin, and maltitol, at 20% concentrations an initial rapid rate of mass transfer was observed, followed by a decrease in this rate (Figure 1). This indicates that the system was approaching the end of the osmotic process (i.e., pseudo equilibrium) [10].
This phenomenon was most pronounced for the first three hours of the process. In this study, osmotic pre-treatments for periods longer than 3 h were not effective. This relationship was the best demonstrated in the case of erythritol (Figure 1a) and xylitol (Figure 1b) solutions. This suggests that it is not necessary to dehydrate the apple slices in solutions for periods longer than 3 h. Statistical analysis also confirmed this statement—values achieved after 180 min or longer were classified into one homogeneous group (Table 5).
Brochier et al. [15] observed that the change in moisture content was no longer significant after one hour with the use of glycerol, sorbitol or polydextrose. A high rate of WL at the beginning of the process was reported in research by Moreira et al. [20] during OD of chestnut, as well as in research by Khan et al. [23] during OD of apples. This is due to the difference in osmotic pressure between the osmotic solution and the food. Subsequently, the phenomenon decreases because the concentration gradient between the solution and the food decreases over-time [2].
Rizzolo et al. [24] dehydrated strawberry slices in 60% concentrated solutions of sucrose and sorbitol for 6 h at a temperature of 30 °C. They observed that WL had constantly increased during both of the processes. Higher values were obtained when the sorbitol solution was used. This fact was due to the different molecular weights of sorbitol (182.18 g/mol) and sucrose (342.30 g/mol), which, at the same concentrations, yielded different water activities (0.87 and 0.93, respectively).
In this research, OD in a 40% solution concentration of erythritol and xylitol was more effective compared to the dehydration process in a sucrose solution (Figure 1a,b). This could also be explained by the lower molecular weight of erythritol and xylitol (122.12 g/mol and 152.15 g/mol, respectively).
The increase in solution concentration resulted in an increase of the osmotic pressure gradients and, hence, higher WL in all cases (except in solutions which contained inulin and oligofructose) (Figure 1d,e). Similar results were reported by Khan et al. [23] in the OD of apples in 40% to 60% solution concentrations, and by Djendoubi et al. [25] who carried out the OD process of pears in a sucrose solution (from 25 to 65oBrix). This is explained by an increase in the osmotic driving force between the sample and the surrounding solution. The increase in temperature decreases the viscosity of the osmotic solution, and the resistance to the mass transfer between the surface and the osmotic solution, thus facilitating the outflow of water from the sample, and the diffusion rate of solute into the sample [2]. The influence of temperature on OD was confirmed by Devic et al. [26], in the OD of apples at temperatures of 45 °C and 60 °C.
In this research, all of the concentrations (20% to 40%) of maltitol solutions were less effective compared to sucrose as the solute (Figure 1c). The higher concentration of maltitol (50%) resulted in higher values of WL and solid gain (SG), compared to sucrose [27]. In a few research studies, the Peleg’s equation has been often used to model the kinetics of WL and solute uptake during OD [10,28,29].
To evaluate the goodness of fit of the models in different solutions, parameter values of modeling WL using Peleg’s model are shown in Table 4. The use of Peleg’s modeling of OD was effective in all of the concentrations of erythritol and xylitol solutions—the goodness of fit has high R2 values, and low RMSE and χ2 values (Table 4). In the case of other solutions, modeling WL using Peleg’s model was effective only at 40% concentrations—in the other cases, values for parameter CRV were more than 20%, which indicates that the model could not be used for the prediction of WL.
The k1 relates to the dehydration rate at the very beginning of the process. The reciprocal of k1 describes the initial mass transfer rate (i.e., the lower the k1, the higher the mass transfer rate) [10]. It can be seen from the data in Table 4, that at constant temperature, k1 decreased with increased solution concentrations from 20% to 40%, which indicates an increase in the initial rate of mass transfer terms (the highest value was observed in the 40% solution concentration of xylitol).
It has been shown [30] that the k2 parameter defines the equilibrium moisture content (and soluble solids)—a value that is expected to vary with the syrup concentration. These results are not surprising. The lower the k2 parameter, the higher the water removal; the achieved values of WL in OD using erythritol and xylitol solutions, were more effective at higher concentrations (Figure 1a,b).
OD in inulin and oligofructose was ineffective—the observed values of WL were low (Figure 1d,e) and the values of the k2 parameter in Peleg’s equation were high (Table 4). Statistical analysis classified these values first into two homogeneous groups—with the lowest values (Table 5). This behavior was connected with the high molecular weight of these substances, which results in a low driving force of the process, while the changes in the hydrodynamic characteristics of the external phase modify the global mass transfer resistance. The evaluation of alternatives to sucrose substances (oligofructose, maltitol, and oligofructose/trehalose) was reported in research by Giannakourou and Taoukis [19]. Their results show that the highest WL during OD was in maltitol, which had the lowest molecular weight, although the effect of the alternative osmotic agents was not significant.
Mendonça et al. [31] observed that WL was significantly dependent on the duration of ultrasound pre-treatment, in the linear term for xylitol and sorbitol solutions. It was also reported that at the end of the treatments, WL was more pronounced in samples treated with solutions of sorbitol, erythritol and xylitol [29]. Lower values were obtained in samples treated with solutions of isomalt and maltitol, which are osmotic agents with lower molecular weights.
2.3. Solid Gain (SG)
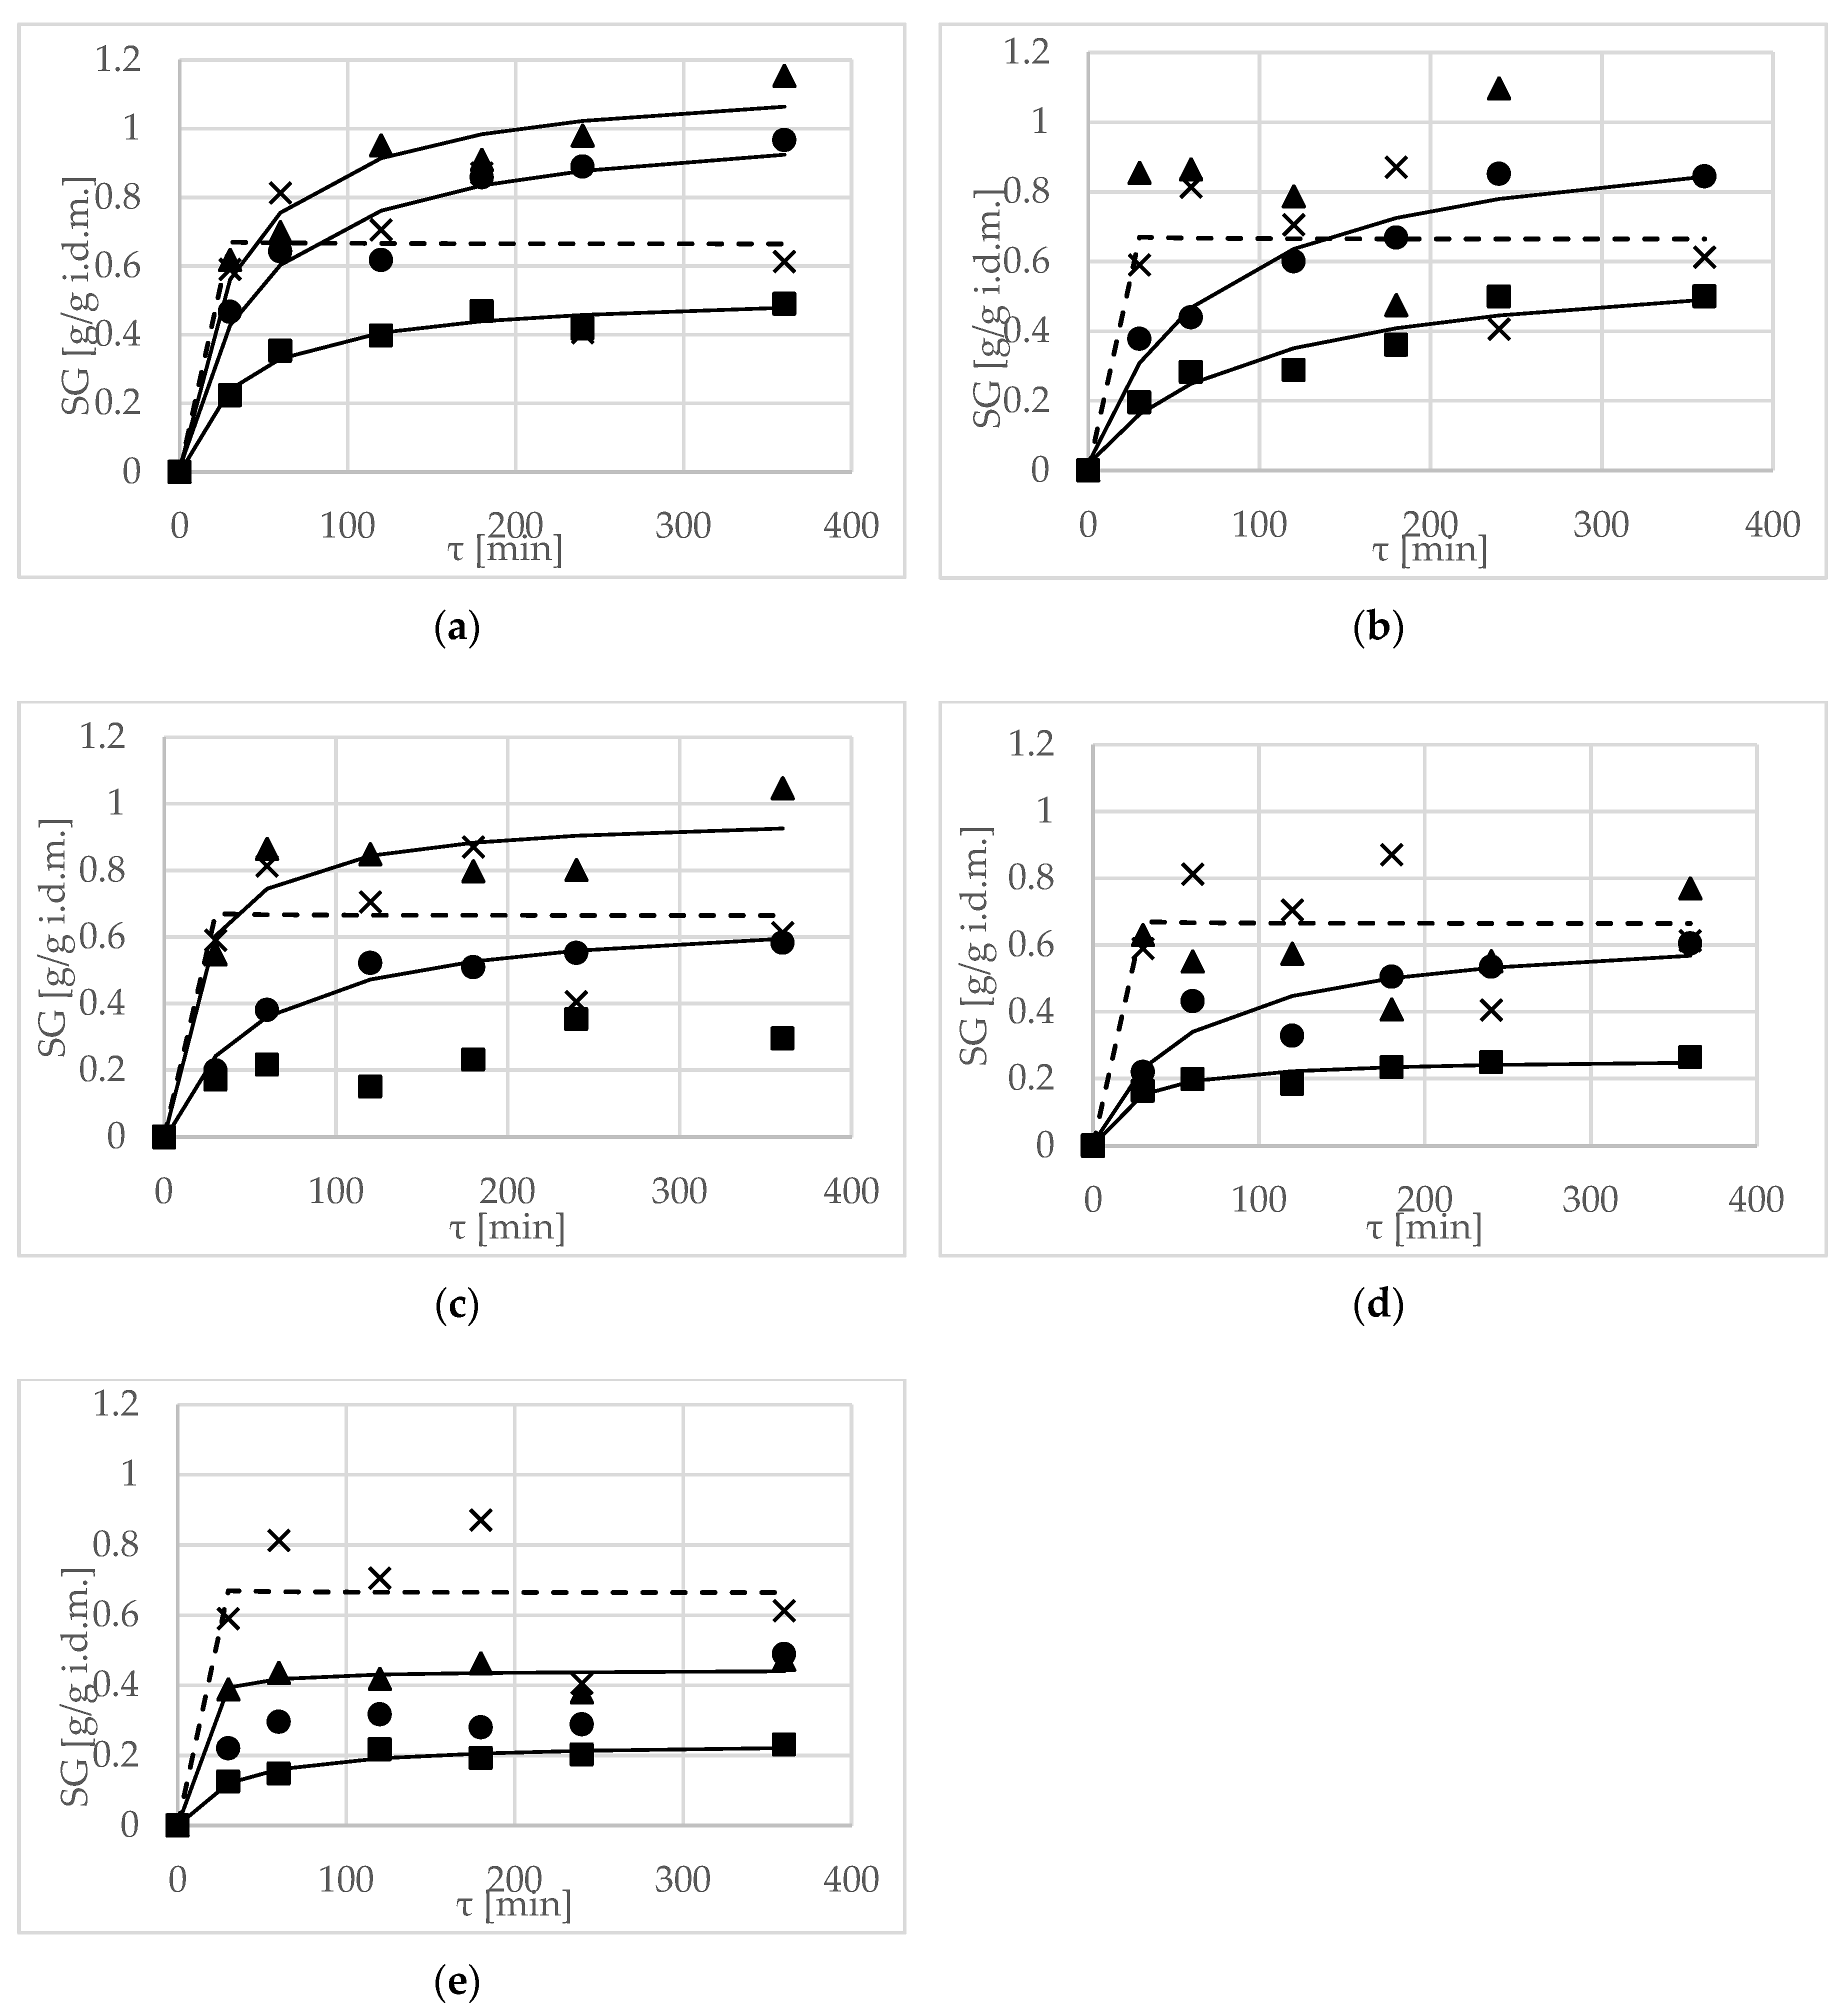
During the process of OD, the main phenomenon is water loss. SG in the material was inconsiderable, with maximum values of approximately 1 g/g i.d.m. when using 40% solution concentrations of xylitol, erythritol and maltitol, as well as 30% solution concentrations of xylitol and erythritol, in durations ranging from 4 to 6 h (Figure 2a–c). Mendonça et al. [29] observed a similar situation at the end of the process; the highest SG in yacon roots was obtained with erythritol solution.
Solution concentration had a significant influence on SG during the process (Table 7). As with the parameters discussed above, greater efficiency than sucrose was reported when 30 and 40% solutions of erythritol and xylitol, as well as a 40% solution of maltitol, were used (Figure 2a–c). Achieved values were classified into one homogeneous group. The SG in apples, at a similar level obtained using sucrose, was also achieved in the OD process of more than 3 h in 30 and 40% solutions of inulin (Figure 2d). In the case of OD in oligofructose, the increase in dry matter in the fruit was negligible (Figure 2e), which was due to the high molecular weight of this compound.
The lower the SG, the better the preservation of the original characteristics of the food [32]. Therefore, small values of SG connected with a high-rate of WL are desirable.
Brochier et al. [15] reported SG when they used sorbitol, glycerol and polydextrose solutions, although they did not observe any increase in dry matter using maltodextrin. The highest values of SG were achieved in the case of the first two solutions, namely sorbitol and glycerol. This was explained by their lower molecular weight compared to maltodextrin, which led to a higher osmotic pressure and easier penetration into the apple tissue. Moreover, they also pointed out that the increase of dry matter occurred mainly during the first two hours of the process. This is consistent with the results obtained in the current research, mainly with 30 and 40% erythritol solutions.
Values of k1, k2, R2, χ2, CRV and RMSE of modelling SG using Peleg’s model are shown in Table 6. According to the data in Table 6, the k1 for all kinetic terms of mass transfer decreased with increasing concentrations of the osmotic solution, at a constant solution temperature. High values for the k1 parameter indicated a low mass transfer rate. The k2 parameter defines the equilibrium moisture content and soluble solids—achieved values were higher compared to modeling WL using Peleg’s model (i.e., the effect of water removal was smaller). Evaluating the goodness of fit of SG using Peleg’s model was different compared to modeling WL parameters. The use of Peleg’s modeling of OD was effective in all of the concentrations only in the case of the erythritol solution. This model can also be used for the prediction of SG at 20% and 30% concentrations, using xylitol and inulin, but not at the highest concentrations. In the cases of 20% maltitol and 30% oligofructose, values of the CRV parameter were more than 20%, indicating that the model cannot be used for modeling of SG during OD.
Values of SG achieved by Mendonça et al. [31] after OD of yacon tubers in 40% xylitol solution were approximately two-times higher compared to those achieved in the same conditions in a 40% sorbitol solution. In later research by Mendonça et al. [29] the SG rate was attenuated after the first hour of osmotic treatment in the 40% solution concentrations of xylitol, maltitol, erythritol, isomalt and sorbitol.
In statistical ANOVA, there was a significant influence of time on SG (Table 7). An opposite situation was observed by Fasogbon et al. [33]; in their research, solid uptake during OD of pineapple in a sugar solution had no significant change over-time, but the most significant changes in sugar/salt solution took place in the first 3 h of the OD process. Taiwo et al. [34] also reported optimal SG at 3 h for strawberry halves.
2.4. Water Activity (aw)
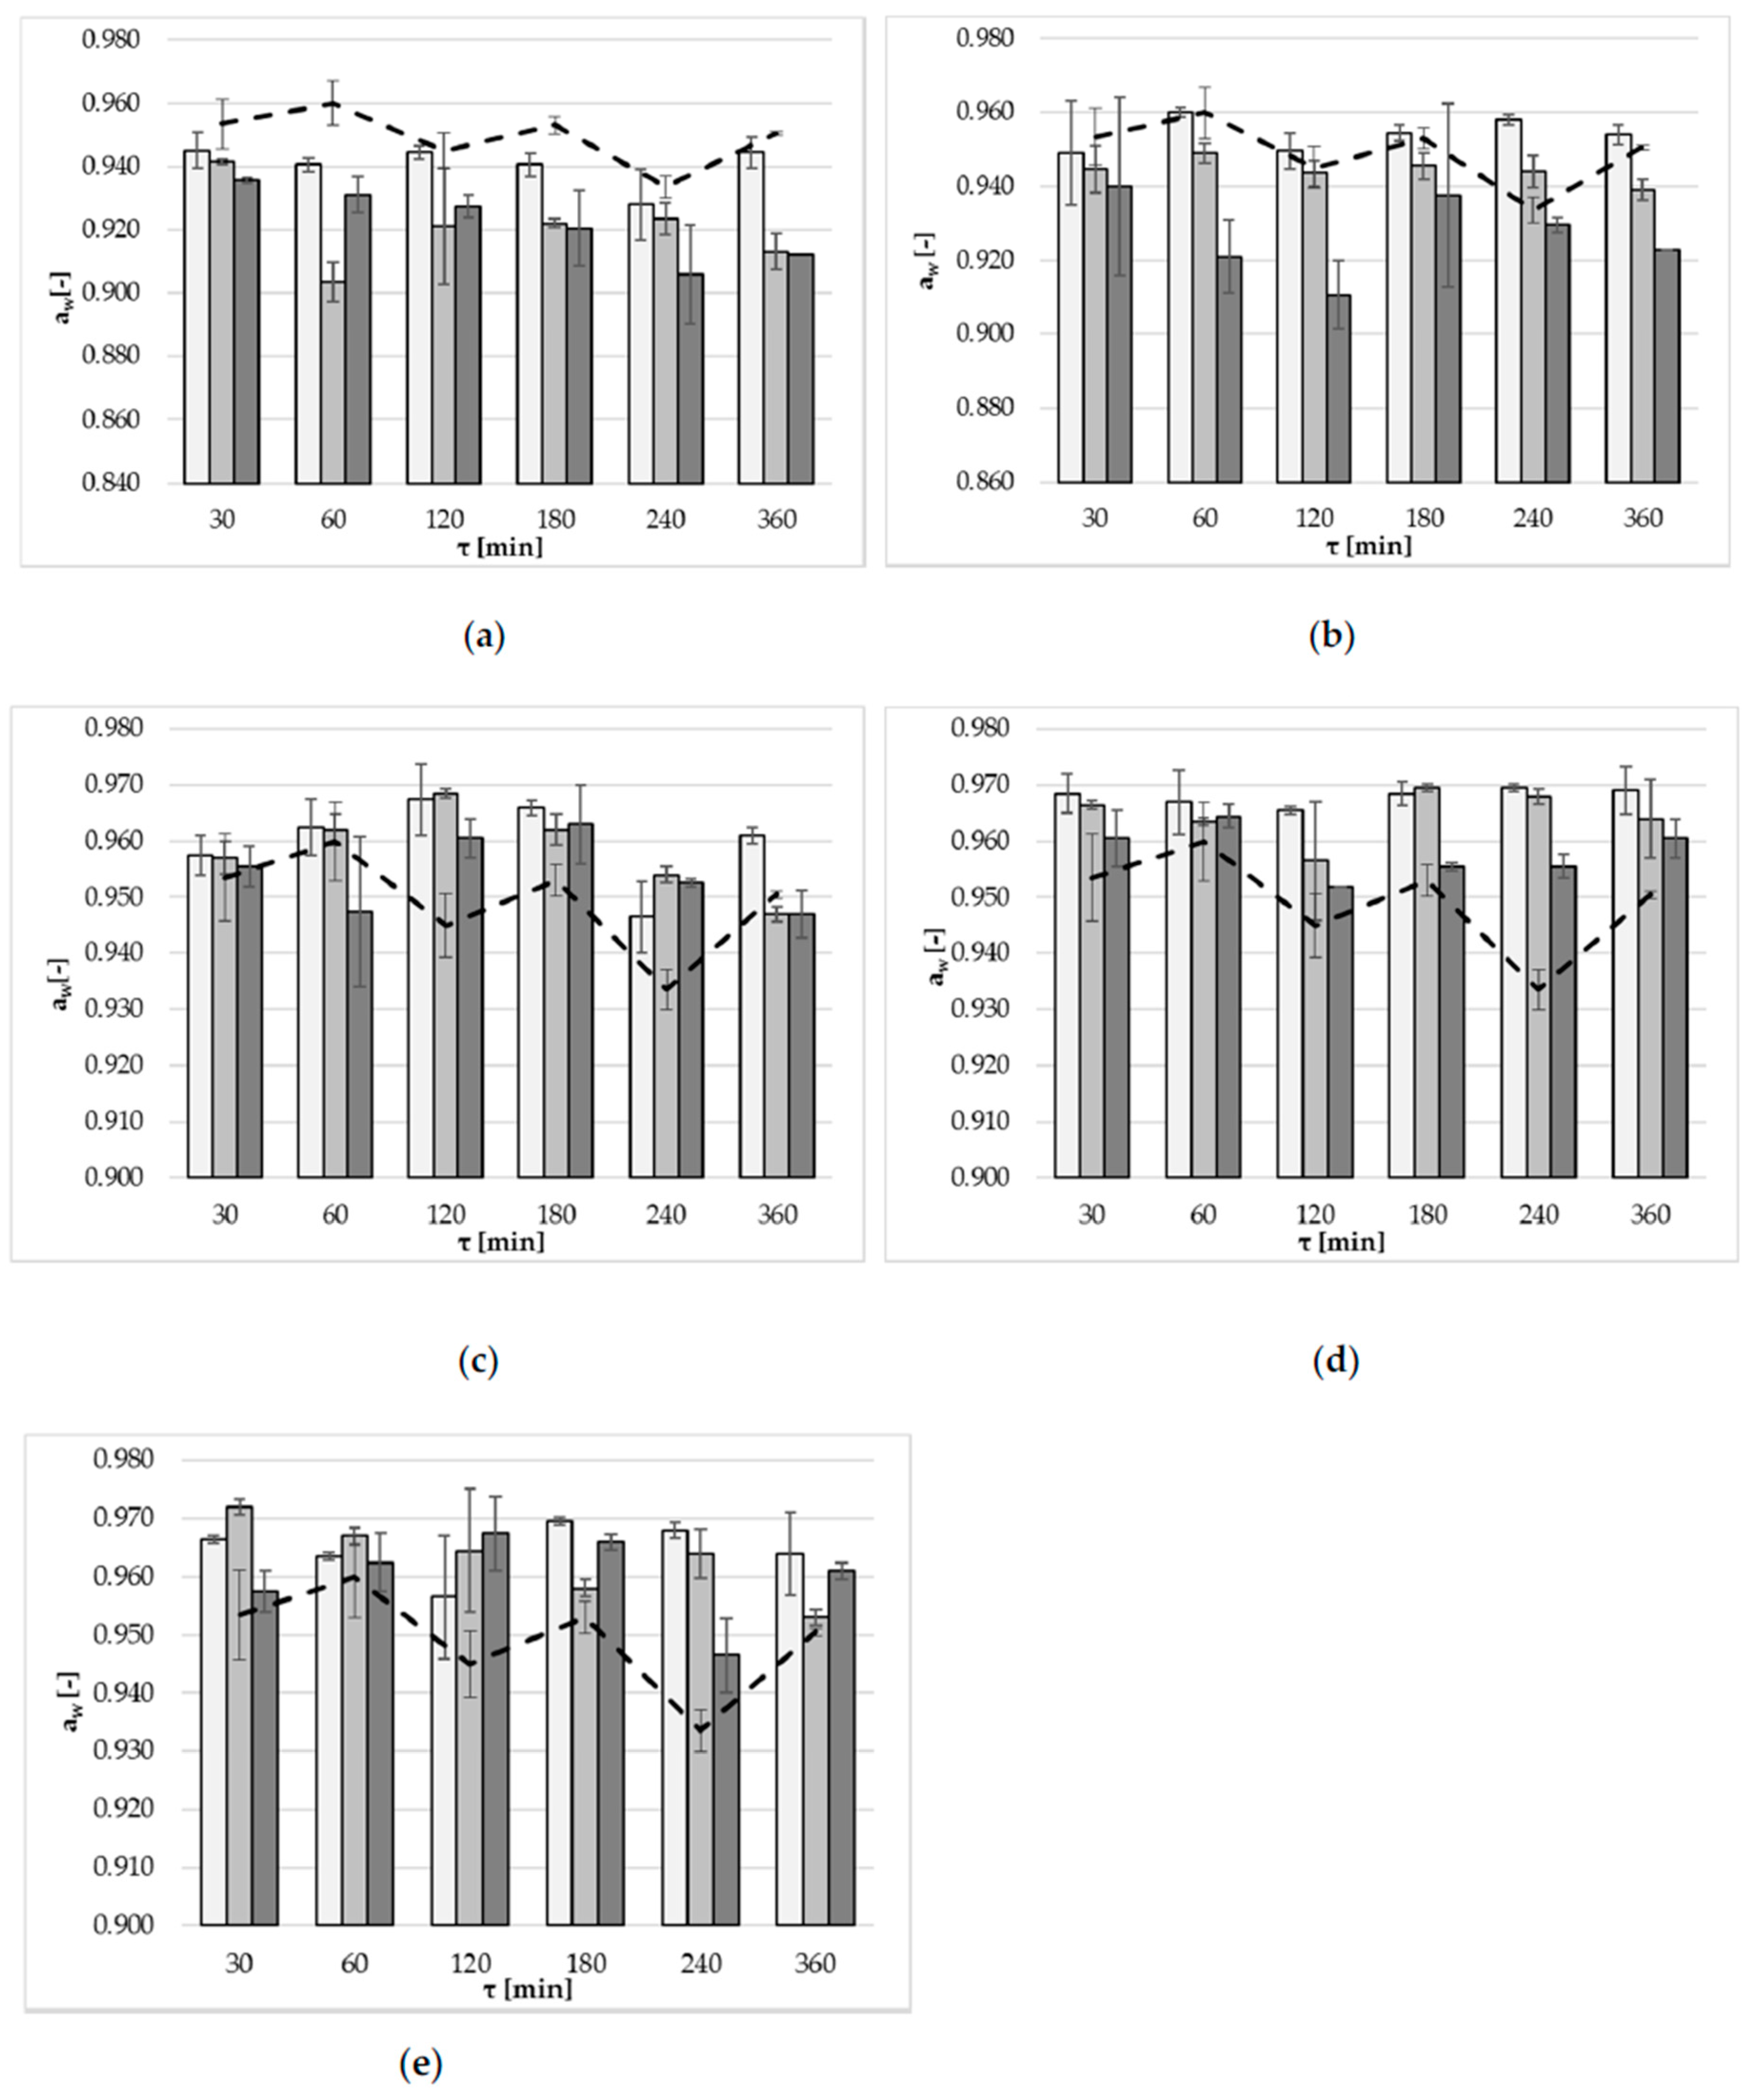
A direct relationship between the increase in solution concentration, and the decrease of water activity level, was observed mainly in the case of OD using xylitol (Figure 3b). This relationship was not observed when maltitol, inulin and oligofructose solutions were used (Figure 3c–e). Statistically significant influences (α = 0.05) of aw were observed of all the factors: type of osmotic agent, solution concentration, and time (Table 8). Important decreases in the values for aw were observed mainly at the end of the OD process. Higher concentrations of osmotic solutions resulted in lower values of this parameter. The lowest average values were obtained for erythritol (approximately 0.928), and xylitol (0.942). This is evident in the bar graphs, which are below the line graph referring to the aw of apple dehydrated in a 50% sucrose solution (Figure 3a,b). Values for aw during OD in maltitol, inulin and oligofructose solutions were classified into one homogeneous group, which means that the influence of these types of osmotic solutions, on the decrease of aw, was not significant (Table 8). Higher values of aw achieved with maltitol, inulin and oligofructose were related to small WL, compared with sucrose, as discussed above.
In the OD of yacon tubers, Mendonça et al. [31] used 40% solution concentrations of xylitol and sorbitol, and reported slightly higher values for aw after OD (0.971 and 0.975, respectively). The effect of solution concentration on aw was significant and negative in the linear and quadratic terms for samples treated with both solutions. In the first hour of treatment, the highest reductions of aw of yacon in 40% solution concentrations were observed (erythritol: 0.936; xylitol: 0.937 and sorbitol: 0.956) [29].
The Pearson’s correlation coefficient between aw and WC was calculated separately for each type of osmotic solution. In almost all cases, (except oligofructose–p-Value 0.117) a linear relationship between the variables was observed. The strongest relationship was observed for OD in xylitol solution (with a Pearson’ correlation coefficient of 0.81). In other cases, this relationship was weaker (erythritol: 0.67 (p-Value 0.000), inulin: 0.46 (p-Value 0.005), maltitol: 0.35 (p-Value 0.038)).
3. Materials and Methods
3.1. Sample Preparation
Fresh apples, of the Paula Red variety, were purchased from a local shop. The fruits were stored at 4–5 °C and at a relative humidity of 85–90% in a refrigerator until use. Before the experiment, the apples were washed, stoned and cut into triangular slices (with the peel), with each slice 0.5 cm thick.
3.2. Pre-Treatment Procedure
The slices were dehydrated by OD in a water bath (Water Bath Shaker Type 357 ELPAN, Lubawa, Poland) with continuous mixing (1 Hz amplitude). The temperature of the water bath was constant. Osmotic solutions were prepared with selected substances from the polyol group: erythritol (F8030, Brenntag, Kędzierzyn-Koźle, Poland), xylitol (Brenntag), maltitol (Brenntag), as well as inulin (Frutafit CLR, Brenntag), oligofructose (Frutalose L85, Brenntag) and distilled water. Apple samples were dipped into 20, 30 and 40% concentrated syrups. To compare the OD process kinetics, a 50% sucrose solution was used as control. OD was carried out in time-ranges between 0.5 h and 6 h, at a temperature of 40 °C (atmospheric pressure), and with an approximately 2:1 syrup-to-fruit ratio. The size of a single sample was 40 ± 2 g. Afterwards, the samples were removed from the osmotic solution and blotted with absorbent paper to remove excess osmotic liquid from their surface. Two technological repetitions were performed for each treatment.
3.3. Analytical Methods
3.3.1. Mathematical Modeling [35]
The kinetic parameters were calculated in all of the experiments: water content (WC), solids gain (SG), water loss (WL) at different times, τ according to the following equations:
The model proposed by Peleg [30] was employed to fit the experimental results. In this work, WL and SG data (Equations (2) and (3)) were fitted using this Peleg’s model:
where parameters k1 and k2 are the known Peleg’s constants [20].
Fitting of the mathematical functions (Peleg) [30] to the experimental points was done using Table Curve 2D version 5.01 (SYSTAT Software Inc., Chicago, IL, USA). The determination coefficient (R2), the reduced chi-squared statistic (χ2), the RMSE, and the CRV, were used to evaluate the goodness of fit of the model:
The high R2 values and the lower χ2 and RMSE indicated that the model fits well to the experimental data. Values of CRV less than 20% indicated that the model could be used for prediction.
3.3.2. Water Activity (aw)
Water activity is the partial vapor pressure of water in a substance, divided by the partial vapor pressure of pure water at the same temperature. Using this particular definition, pure distilled water has an aw of exactly one. Water activity is an important consideration for food product design and food safety. In this study, water activity was measured using an Aqua Lab CX-2 (Decagon Devices Inc., Pullman, Washington, USA) apparatus, in accordance with the manufacturer’s instructions. The temperature of water activity determination was constant at 25 °C. Each measurement was conducted in triplicate.
3.3.3. Statistical Analysis
The statistical software Statgraphics Plus version 5.1 (StatPoint), and Excel 2016 (Microsoft) were used for data analysis. The Pearson’s correlation coefficient between aw and WC was calculated. The influence of pre-treatment (duration of the process, concentration, and type of osmotic solution) on dependent variables, mass transfer parameters (water loss, solid gain, the WC), as well as water activity, was evaluated by means of a multifactorial ANOVA, with a significance level of α = 0.05. In the case of significant associations, post-hoc Tukey’s test was performed.
4. Conclusions
The polyols, xylitol and erythritol are suitable for use as osmotic agents in the dehydration of apples. Making these solutions provides an alternative to the use of sucrose, which is commonly used in the food industry. In the tested concentration range, maltitol solutions were too ineffective. Osmotic dehydration in solutions containing inulin and oligofructose was ineffective because of the high molecular weight of these solutions. The use of Peleg’s equation to model mass transfer kinetics during OD was effective. Increased solution concentrations from 20 to 40% indicated an increase in the initial rate of mass transfer terms and resulted in greater water removal. It is necessary to conduct further tests on the residue content of these substances in the fruit, as per the accepted limit of food content by Acceptable Daily Intake (ADI).
Author Contributions
Joanna Cichowska conceived and performed the experiments, as well as wrote the paper; Joanna Żubernik and Jakub Czyżewski analyzed the data; Hanna Kowalska and Dorota Witrowa-Rajchert were supervisors—they designed the experiments, contributed analysis tools and checked the manuscript.
Conflicts of Interest
The authors declare no conflict of interest.
Nomenclature
- OD – osmotic dehydration,
- WC – water content, (g/g d.m.)
- WL – water loss, (g/g i.d.m.)
- SG – solids gain, (g/g i.d.m.)
- m – sample mass, (g)
- s – dry solids mass of material, (g)
- τ – time of osmotic dehydration, (min)
- k1 – parameter of Equation (4), (kg/kg)
- k2 – parameter of Equation (4), (kg/kg·h)
- MRi,p – predicted dimensionless moisture ratio
- MRi,e – experimental dimensionless moisture ratio
- N – number of observation
- n – number of constants in the model equation
- Y – mean experimental value of WL, SG or WC, respectively [in Equation (6)]
- Subscripts:
- o – initial
- τ – time (min)
References
- Ahmed, I.; Qaz, I.M.; Jamal, S. Developments in osmotic dehydration technique for the preservation of fruits and vegetables. Innov. Food Sci. Emerg. Technol. 2016, 34, 29–43. [Google Scholar] [CrossRef]
- Assis, F.R.; Morais, R.M.S.C.; Morais, A.M.M.B. Mass Transfer in Osmotic Dehydration of Food Products: Comparison between Mathematical Models. Food Eng. Rev. 2016, 8, 116–133. [Google Scholar] [CrossRef]
- Yadav, A.K.; Singh, S.V. Osmotic dehydration of fruits and vegetables: A review. J. Food Sci. Technol. 2014, 51, 1654–1673. [Google Scholar] [CrossRef] [PubMed]
- Sutar, N.; Sutar, P.P. Developments in osmotic dehydration of fruits and vegetable—A review. Trends Post Harvest Technol. 2013, 1, 20–36. [Google Scholar]
- Timkin, V.A.; Lazarev, V.A. Determination of the Osmotic Pressure of Multicomponent Solutions in the Food Industry. Membrany i Membrannye Tekhnologii 2015, 5, 48–56. [Google Scholar] [CrossRef]
- Phisut, N. Factors affecting mass transfer during osmotic dehydration of fruits. Inter. Food Res. J. 2012, 19, 7–18. [Google Scholar]
- Tortoe, C. A review of osmodehydration for food industry. Afr. J. Food Sci. 2010, 4, 303–324. [Google Scholar]
- Silva, K.S.; Fernandes, M.A.; Mauro, M.A. Osmotic Dehydration of Pineapple with Impregnation of Sucrose, Calcium, and Ascorbic Acid. Food Bioprocess Technol 2014, 7, 385–397. [Google Scholar] [CrossRef]
- Porciuncula, B.D.A.; Zotarelli, M.F.; Carciofi, B.A.M.; Laurindo, J.B. Determining the effective diffusion coefficient of water in banana (Prata variety) during osmotic dehydration and its use in predictive models. J. Food Eng. 2013, 119, 490–496. [Google Scholar] [CrossRef]
- Ganjloo, A.; Rahman, R.A.; Bakar, J.; Osman, A.; Bimakr, M. Kinetics Modeling of Mass Transfer Using Peleg’s Equation During Osmotic Dehydration of Seedless Guava (Psidium guajava L.): Effect of Process Parameters. Food Bioprocess Technol. 2012, 5, 2151–2159. [Google Scholar] [CrossRef]
- Ruiz-López, I.I.; Ruiz-Espinosa, H.; Herman-Lara, E.; Zárate-Castillo, G. Modeling of kinetics, equilibrium and distribution data of osmotically dehydrated carambola (Averrhoa carambola L.) in sugar solutions. J. Food Eng. 2011, 104, 218–226. [Google Scholar] [CrossRef]
- Vicente, S.; Nieto, A.B.; Hodara, K.; Castro, M.A.; Alzamora, S.M. Changes in Structure, Rheology, and Water Mobility of Apple Tissue Induced by Osmotic Dehydration with Glucose or Trehalose. Food Bioprocess Technol. 2012, 5, 3075–3089. [Google Scholar] [CrossRef]
- Lowithun, N.; Charoenrein, S. Influence of osmodehydrofreezing with different sugars on the quality of frozen rambutan. Int. J. Food Sci. Technol. 2009, 44, 2183–2188. [Google Scholar] [CrossRef]
- Rodriguez, M.M.; Arballo, J.R.; Campañone, L.A.; Cocconi, M.B.; Pagano, A.M.; Mascheroni, R.H. Osmotic Dehydration of Nectarines: Influence of the Operating Conditions and Determination of the Effective Diffusion Coefficients. Food Bioprocess Technol. 2013, 6, 2708–2720. [Google Scholar] [CrossRef]
- Brochier, B.; Marczak, L.D.F.; Norena, C.P.Z. Use of Different Kinds of Solutes Alternative to Sucrose in Osmotic Dehydration of Yacon. Br. Arch. Biol. Technol. 2015, 58, 34–40. [Google Scholar] [CrossRef]
- Konopacka, D.; Jesionkowska, K.; Klewicki, R.; Bonazzi, C. The effect of different osmotic agents on the sensory perception of osmo-treated dried fruit. J. Hortic. Sci. Biotechnol. 2009, 84. [Google Scholar] [CrossRef]
- Nieto, A.B.; Vicente, S.; Hodara, K.; Castro, M.A.; Alzamora, S.M. Osmotic dehydration of apple: Influence of sugar and water activity on tissue structure, rheological properties and water mobility. J. Food Eng. 2013, 119, 104–114. [Google Scholar] [CrossRef]
- Dermesonlouoglou, E.K.; Giannakourou, M.; Taoukis, P.S. Kinetic study of the effect of the osmoticdehydration pre-treatment with alternative osmoticsolutes to the shelf life of frozen strawberry. Food Bioprod. Process 2016, 99, 212–221. [Google Scholar] [CrossRef]
- Giannakourou, M.C.; Taoukis, P.S. Stability of dehydrofrozen green peas pretreated with nonconventonal osmotic agents. J. Food Sci. 2003, 68, 2002–2010. [Google Scholar] [CrossRef]
- Moreira, R.; Chenlo, F.; Torres, M.D.; Vázquez, G. Effect of stirring in the osmotic dehydration of chestnut using glycerol solutions. Lebensm-Wiss Technol. 2007, 40, 1507–1514. [Google Scholar] [CrossRef]
- Rubio-Arraez, S.; Capella, J.V.; Ortola, M.D.; Castello, M.L. Modelling osmotic dehydration of lemon slices using new sweeteners. Int. J. Food Sci. Technol. 2015, 50, 2046–2051. [Google Scholar] [CrossRef]
- Rodriguez, M.M.; Mascheroni, R.H.; Quintero-Ramos, A. Mathematical Modeling of Hot-Air Drying of Osmo-dehydrated Nectarines. Int. J. Food Eng. 2015, 11, 533–545. [Google Scholar] [CrossRef]
- Khan, M.A.; Shukla, R.N.; Zaidi, S. Mass Transfer during Osmotic dehydration of Apple using Sucrose, Fructose and Maltodextrin Solution. In Proceedings of the 11th International Congress on Engineering and Food, Athens, Greece, 22–26 May 2011; pp. 967–968. [Google Scholar]
- Rizzolo, A.; Gerli, F.; Prinzivalli, C.; Buratti, S.; Torreggiani, D. Headspace volatile compounds during osmotic dehydration of strawberries (cv Camarosa): Influence of osmotic solution composition and processing time. LWT-Food Sci. Technol. 2007, 40, 529–535. [Google Scholar] [CrossRef]
- Djendoubi, M.N.; Boudhriuoa, M.N.; Kechaou, N.; Courtois, F.; Bonazzi, C. Effect of Osmo-dehydration Conditions on the Quality Attributes of Pears. J. Food Process Technol. 2013, 4, 256. [Google Scholar] [CrossRef]
- Devic, E.; Guyoi, S.; Daudin, J.; Bonazzi, C. Effect of temperature and cultivar on polyphenol retention and mass transfer during osmotic dehydration of apples. J. Agric. Food Chem. 2010, 58, 606–614. [Google Scholar] [CrossRef] [PubMed]
- Phisut, N.; Maneyam, R.; Kamonsri, A. Effect of Different Osmotic Agents on the Physical, Chemical and Sensory Properties of Osmo-Dried Cantaloupe. Chiang Mai J. Sci. 2013, 40, 427–439. [Google Scholar]
- Tappi, S.; Mauro, M.A.; Tylewicz, U.; Dellarosa, N.; Dalla Rosa, M.; Rocculi, P. Effects of calcium lactate and ascorbic acid on osmotic dehydration kinetics and metabolic profile of apples. Food Bioprod. Process 2017, 103, 1–9. [Google Scholar] [CrossRef]
- Mendonça, K.; Corrêa, J.; Junqueira, J.; Angelis-Pereira, M.; Cirillo, M. Mass Transfer Kinetics of the Osmotic Dehydration of Yacon Slices with Polyols. J. Food Process Preserv. 2017, 41, 1–8. [Google Scholar] [CrossRef]
- Peleg, M. An empirical model for the description of moisture sorption curves. J. Food Sci. 1988, 53, 1216–1218. [Google Scholar] [CrossRef]
- Mendonça, K.S.; Corrêa, J.L.G.; Junqueira, J.J.R.; Angelis Pereira, M.C.; Vilela, M.B. Optimization of osmotic dehydration of yacon slice. Dry Technol. 2016, 34, 386–394. [Google Scholar] [CrossRef]
- Corrêa, J.L.G.; Pereira, L.M.; Vieira, G.S.; Hubinger, M.D. Mass transfer kinetics of pulsed vacuum osmotic dehydration of guavas. J. Food Eng. 2010, 96, 498–504. [Google Scholar] [CrossRef]
- Fasogbon, B.M.; Gbadamosi, S.O.; Taiwo, K.A. Studies on the Osmotic Dehydration and Rehydration Characteristics of Pineapple Slices. J. Food Process Technol. 2013, 4, 220. [Google Scholar] [CrossRef]
- Taiwo, K.A.; Eshtiaghi, M.N.; Ade-Omowaye, B.I.O.; Knorr, D. Osmotic dehydration of strawberry halves: Influence of osmotic agents and pretreatment methods on mass transfer and product characteristics. Int. J. Food Sci. Technol. 2003, 38, 693–707. [Google Scholar] [CrossRef]
- Wiktor, A.; Śledź, M.; Nowacka, M.; Chudoba, T.; Witrowa-Rajchert, D. Pulsed Electric Field Pretreatment for Osmotic Dehydration of Apple Tissue: Experimental and Mathematical Modeling Studies. Dry Technol. 2014, 32, 408–417. [Google Scholar] [CrossRef]
Sample Availability: Samples of the compounds from the polyols group (erythritol, xylitol, maltitol) as well as oligofructose and inulin are available from the authors. |
Figure 1.
Water loss (WL) kinetics at several concentrations, (20 (■), 30 (●), 40 (▲) and 50 (×) g/100g) at 40 °C, in different solutions: (a) erythritol, (b) xylitol, (c) maltitol, (d) inulin, (e) oligofructose. Lines are the Peleg’s model. The dotted line is the kinetic reference (sucrose).
Figure 1.
Water loss (WL) kinetics at several concentrations, (20 (■), 30 (●), 40 (▲) and 50 (×) g/100g) at 40 °C, in different solutions: (a) erythritol, (b) xylitol, (c) maltitol, (d) inulin, (e) oligofructose. Lines are the Peleg’s model. The dotted line is the kinetic reference (sucrose).


Figure 2.
Solid gain (SG), kinetics at several concentrations, (20 (■), 30 (●), 40 (▲) and 50 (×) g/100g) at 40 °C, using different solutions: (a) erythritol, (b) xylitol, (c) maltitol, (d) inulin, (e) oligofructose. Lines are the Peleg’s model. The dotted line is the kinetic reference for sucrose.
Figure 2.
Solid gain (SG), kinetics at several concentrations, (20 (■), 30 (●), 40 (▲) and 50 (×) g/100g) at 40 °C, using different solutions: (a) erythritol, (b) xylitol, (c) maltitol, (d) inulin, (e) oligofructose. Lines are the Peleg’s model. The dotted line is the kinetic reference for sucrose.

Figure 3.
Water activity, aw, at several concentrations: 20 (light grey bars), 30 (grey bars), 40 (dark grey bars) g/100 g at 40 °C, using different solutions: (a) erythritol, (b) xylitol, (c) maltitol, (d) inulin, (e) oligofructose. The dotted line marks the values of aw in a 50% solution concentration of sucrose.


Table 1.
Water content (g/g d.m.) in apples during osmotic dehydration (OD) in different solutions.
| Solution | Xylitol 20% | Xylitol 30% | Xylitol 40% | Erythritol 20% | Erythritol30% | Erythritol 40% | Maltitol 20% | Maltitol 30% | Maltitol 40% |
|---|---|---|---|---|---|---|---|---|---|
| Time [min] | |||||||||
| 0 | 7.31 ± 0.01 | 7.31 ± 0.01 | 7.31 ± 0.01 | 7.31 ± 0.01 | 7.31 ± 0.01 | 7.31 ± 0.01 | 7.31 ± 0.01 | 7.31 ± 0.01 | 7.31 ± 0.01 |
| 30 | 5.35 ± 0.00 | 4.28 ± 0.01 | 2.56 ± 0.02 | 4.95 ± 0.00 | 3.92 ± 0.00 | 3.19 ± 0.00 | 6.03 ± 0.01 | 5.44 ± 0.00 | 3.77 ± 0.01 |
| 60 | 4.86 ± 0.01 | 3.91 ± 0.02 | 2.4 ± 0.03 | 4.31 ± 0.01 | 3.13 ± 0.00 | 2.68 ± 0.00 | 5.86 ± 0.01 | 4.73 ± 0.01 | 2.97 ± 0.02 |
| 120 | 4.54 ± 0.00 | 3.12 ± 0.00 | 2.3 ± 0.01 | 3.94 ± 0.00 | 2.87 ± 0.01 | 1.95 ± 0.00 | 6.17 ± 0.00 | 3.68 ± 0.01 | 2.82 ± 0.00 |
| 180 | 4.3 ± 0.00 | 3.05 ± 0.01 | 2.64 ± 0.11 | 3.78 ± 0.00 | 2.23 ± 0.01 | 1.8 ± 0.01 | 5.86 ± 0.00 | 4.07 ± 0.01 | 2.66 ± 0.00 |
| 240 | 3.88 ± 0.00 | 2.65 ± 0.00 | 1.97 ± 0.00 | 3.99 ± 0.01 | 2.35 ± 0.01 | 1.88 ± 0.03 | 5.5 ± 0.00 | 3.86 ± 0.00 | 2.58 ± 0.02 |
| 360 | 3.94 ± 0.00 | 2.72 ± 0.00 | 1.63 ± 0.03 | 3.74 ± 0.01 | 2.41 ± 0.00 | 1.66 ± 0.00 | 5.38 ± 0.00 | 3.56 ± 0.00 | 2.26 ± 0.01 |
Table 2.
Water content (g/g d.m.) in apples during OD in different solutions (continued).
| Solution | Inulin 20% | Inulin 30% | Inulin 40% | Oligofructose 20% | Oligofructose 30% | Oligofructose 40% | Sucrose 50% |
|---|---|---|---|---|---|---|---|
| Time [min] | |||||||
| 0 | 7.31 ± 0.01 | 7.31 ± 0.01 | 7.31 ± 0.01 | 7.31 ± 0.01 | 7.31 ± 0.01 | 7.31 ± 0.01 | 7.31 ± 0.01 |
| 30 | 6.6 ± 0.00 | 5.9 ± 0.00 | 3.92 ± 0.02 | 6.41 ± 0.01 | 5.75 ± 0.00 | 4.76 ± 0.00 | 3.42 ± 0.01 |
| 60 | 6.32 ± 0.00 | 4.51 ± 0.00 | 4.07 ± 0.01 | 6.51 ± 0.00 | 5.61 ± 0.01 | 4.75 ± 0.01 | 2.71 ± 0.00 |
| 120 | 6.01 ± 0.01 | 5.34 ± 0.01 | 3.8 ± 0.01 | 6.11 ± 0.01 | 5.47 ± 0.01 | 4.69 ± 0.00 | 2.39 ± 0.00 |
| 180 | 5.35 ± 0.00 | 4.94 ± 0.00 | 4.36 ± 0.03 | 6.04 ± 0.00 | 5.73 ± 0.00 | 4.59 ± 0.00 | 2.21 ± 0.00 |
| 240 | 4.91 ± 0.00 | 4.71 ± 0.01 | 4.05 ± 0.01 | 6.25 ± 0.00 | 5.61 ± 0.00 | 4.93 ± 0.00 | 2.95 ± 0.02 |
| 360 | 4.48 ± 0.01 | 4.39 ± 0.00 | 3.44 ± 0.01 | 5.67 ± 0.00 | 4.58 ± 0.00 | 4.59 ± 0.00 | 2.38 ± 0.01 |
Table 3.
The influence of osmotic pre-treatment in different solution types, concentrations, and times, on the water content (g/g d.m.) in fruits.
Table 3.
The influence of osmotic pre-treatment in different solution types, concentrations, and times, on the water content (g/g d.m.) in fruits.
| Factor | p-Value | Contrast | +/− Limits | Difference | |
|---|---|---|---|---|---|
| Type of osmotic substance | Erythritol a | 0.000 * | Erythritol–Inulin | 0.2799 | −1.8000 * |
| Xylitol b | Erythritol–Xylitol | 0.2799 | −0.3126 * | ||
| Maltitol c | Inulin–Maltitol | 0.2799 | 0.5527 * | ||
| Inulin d | Inulin–Xylitol | 0.2799 | 1.4874 * | ||
| Oligo-fructose e | Maltitol–Xylitol | 0.2799 | 0.9347 * | ||
| Concentration of solution (%) | 20 c | 0.000 * | 20–30 | 0.1858 | 1.0829 * |
| 30 b | 20–40 | 0.1858 | 2.0347 * | ||
| 40 a | 30–40 | 0.1858 | 0.9518 * | ||
| Time (min) | 30 d | 0.000 * | 30–60 | 0.3205 | 0.4099 * |
| 60 c | 60–120 | 0.3205 | −0.2594 | ||
| 120 bc | 120–180 | 0.3205 | 0.0765 | ||
| 180 b | 180–240 | 0.3205 | 0.1702 | ||
| 240 ab | 240–360 | 0.3205 | 0.3131 | ||
| 360 a | 360–60 | 0.3205 | −0.8191 | ||
Statistical differences between factors; a Tukey test of main effects was performed. * denotes a statistically significant difference. Means within columns, with a different lowercase letter superscript, are significantly different (p < 0.05).
Table 4.
Values of k1, k2, R2, χ2, CRV and RMSE of modeling WL using Peleg’s model.
| Solution | Concentration | k1 | k2 | R2 | χ2 | CRV (%) | RMSE |
|---|---|---|---|---|---|---|---|
| Erythritol | 20 | 7.191 | 0.541 | 0.974 | 0.007 | 5.99 | 0.070 |
| 30 | 8.298 | 0.313 | 0.952 | 0.064 | 11.80 | 0.214 | |
| 40 | 6.511 | 0.240 | 0.986 | 0.027 | 5.88 | 0.139 | |
| Xylitol | 20 | 14.245 | 0.621 | 0.954 | 0.007 | 7.54 | 0.071 |
| 30 | 9.759 | 0.387 | 0.973 | 0.016 | 7.14 | 0.107 | |
| 40 | 3.374 | 0.285 | 0.960 | 0.013 | 4.29 | 0.097 | |
| Maltitol | 20 | - | - | - | - | - | - |
| 30 | - | - | - | - | - | - | |
| 40 | 12.225 | 0.341 | 0.981 | 0.014 | 6.32 | 0.101 | |
| Inulin | 20 | - | - | - | - | - | - |
| 30 | - | - | - | - | - | - | |
| 40 | 7.724 | 0.810 | 0.874 | 0.012 | 11.42 | 0.092 | |
| Oligofructose | 20 | - | - | - | - | - | - |
| 30 | - | - | - | - | - | - | |
| 40 | −10.708 | 1.833 | 0.891 | 0.005 | 13.81 | 0.059 |
- denotes values of CRV greater than 20%, which indicates that the model cannot be used for WL prediction.
Table 5.
The influence of osmotic pre-treatment in different types, concentrations of solutions, and time on WL (g/g i.d.m.) during OD.
Table 5.
The influence of osmotic pre-treatment in different types, concentrations of solutions, and time on WL (g/g i.d.m.) during OD.
| Factor | p-Value | Contrast | +/− Limits | Difference | |
|---|---|---|---|---|---|
| Type of osmotic substance | Erythritol e | 0.000 * | Erythritol–Inulin | 0.2795 | 1.8406 * |
| Xylitol d | Erythritol–Xylitol | 0.2795 | 0.3059 * | ||
| Maltitol c | Inulin–Maltitol | 0.2795 | −0.5799 * | ||
| Inulin b | Inulin–Xylitol | 0.2795 | −1.5347 * | ||
| Oligo-fructose a | Maltitol–Xylitol | 0.2795 | −0.9548 * | ||
| Concentration of solution (%) | 20 a | 0.000 * | 20–30 | 0.1856 | −0.5202 * |
| 30 b | 20–40 | 0.1856 | −1.3377 * | ||
| 40 c | 30–40 | 0.1856 | −0.8174 * | ||
| Time (min) | 30 a | 0.000 * | 30–60 | 0.3205 | 0.1696 |
| 60 ab | 60–120 | 0.3201 | 0.3097 | ||
| 120 bc | 120–180 | 0.3201 | −0.0518 | ||
| 180 c | 180–240 | 0.3201 | 0.0275 | ||
| 240 c | 240–360 | 0.3201 | −0.1829 | ||
| 360 c | 360–60 | 0.3201 | 0.5169 * | ||
Statistical differences between factors; a Tukey test of main effects was performed. * denotes a statistically significant difference. Means within columns, with a different lowercase letter superscript, are significantly different (p < 0.05).
Table 6.
Values of k1, k2, R2, χ2, CRV and RMSE of modeling SG using Peleg’s model.
| Solution | Concentration | k1 | k2 | R2 | χ2 | CRV (%) | RMSE |
|---|---|---|---|---|---|---|---|
| Erythritol | 20 | 67.029 | 1.896 | 0.958 | 0.001 | 7.91 | 0.022 |
| 30 | 42.830 | 0.977 | 0.952 | 0.005 | 11.47 | 0.061 | |
| 40 | 28.254 | 0.868 | 0.945 | 0.005 | 8.98 | 0.058 | |
| Xylitol | 20 | 159.927 | 1.677 | 0.910 | 0.002 | 16.07 | 0.041 |
| 30 | 73.613 | 1.010 | 0.940 | 0.003 | 10.31 | 0.047 | |
| 40 | - | - | - | - | - | - | |
| Maltitol | 20 | - | - | - | - | - | - |
| 30 | 75.408 | 1.446 | 0.950 | 0.001 | 8.35 | 0.028 | |
| 40 | 18.773 | 1.025 | 0.896 | 0.010 | 14.27 | 0.084 | |
| Inulin | 20 | 83.366 | 3.830 | 0.856 | 0.000 | 10.64 | 0.017 |
| 30 | 87.141 | 1.537 | 0.881 | 0.005 | 18.52 | 0.059 | |
| 40 | - | - | - | - | - | - | |
| Oligofructose | 20 | 123.147 | 4.184 | 0.906 | 0.000 | 9.69 | 0.013 |
| 30 | - | - | - | - | - | - | |
| 40 | 8.971 | 2.250 | 0.951 | 0.001 | 9.18 | 0.028 |
- denotes values of CRV more than 20%, which indicate that the model cannot be used for prediction.
Table 7.
The influence of osmotic pre-treatment in different types, concentrations of solutions, and time on SG (g/g i.d.m.) during OD.
Table 7.
The influence of osmotic pre-treatment in different types, concentrations of solutions, and time on SG (g/g i.d.m.) during OD.
| Factor | p-Value | Contrast | +/− Limits | Difference | |
|---|---|---|---|---|---|
| Type of osmotic substance | Erythritol d | 0.000 * | Erythritol–Inulin | 0.0848 | 0.2609 * |
| Xylitol d | Erythritol–Xylitol | 0.0848 | 0.0430 | ||
| Maltitol c | Inulin–Maltitol | 0.0848 | −0.0924 * | ||
| Inulin b | Inulin–Xylitol | 0.0848 | −0.2179 * | ||
| Oligo-fructose a | Maltitol–Xylitol | 0.0848 | −0.1255 * | ||
| Concentration of solution (%) | 20 a | 0.000 * | 20–30 | 0.0563 | −0.2395 * |
| 30 b | 20–40 | 0.0563 | −0.4458 * | ||
| 40 c | 30–40 | 0.0563 | −0.2064 * | ||
| Time (min) | 30 a | 0.000 * | 30–60 | 0.0971 | −0.0936 |
| 60 ab | 60–120 | 0.0971 | 0.0267 | ||
| 120 bc | 120–180 | 0.0971 | −0.0105 | ||
| 180 bc | 180–240 | 0.0971 | −0.0859 | ||
| 240 cd | 240–360 | 0.0971 | −0.0936 | ||
| 360 d | 360–60 | 0.0971 | 0.2166 * | ||
Statistical differences between factors; a Tukey test of main effects was performed. * denotes a statistically significant difference. Means within columns, with a different lowercase letter superscript, are significantly different (p < 0.05).
Table 8.
The influence of osmotic pre-treatment in different types, concentrations of solutions, and time on aw during OD.
Table 8.
The influence of osmotic pre-treatment in different types, concentrations of solutions, and time on aw during OD.
| Factor | p-Value | Contrast | +/− Limits | Difference | |
|---|---|---|---|---|---|
| Type of osmotic substance | Erythritol a | 0.000 * | Erythritol–Inulin | 0.0060 | −0.0358 * |
| Xylitol b | Erythritol–Xylitol | 0.0060 | −0.0140 * | ||
| Maltitol c | Inulin–Maltitol | 0.0060 | 0.0059 | ||
| Inulin c | Inulin–Xylitol | 0.0060 | 0.0218 * | ||
| Oligo-fructose c | Maltitol–Xylitol | 0.0060 | 0.0159 * | ||
| Concentration of solution (%) | 20 c | 0.000 * | 20–30 | 0.0040 | 0.0073 * |
| 30 b | 20–40 | 0.0040 | 0.0132 * | ||
| 40 a | 30–40 | 0.0040 | 0.0059 * | ||
| Time (min) | 30 b | 0.014 * | 30–60 | 0.0068 | 0.0035 |
| 60 ab | 60–120 | 0.0068 | −0.0006 | ||
| 120 ab | 120–180 | 0.0068 | −0.0029 | ||
| 180 ab | 180–240 | 0.0068 | 0.0057 | ||
| 240 a | 240–360 | 0.0068 | 0.0001 | ||
| 360 a | 360-30 | 0.0068 | 0.0070 * | ||
Statistical differences between factors; a Tukey test of main effects was performed. * denotes a statistically significant difference. Means within columns with a different lowercase letter superscript, are significantly different (p < 0.05).
© 2018 by the authors. Licensee MDPI, Basel, Switzerland. This article is an open access article distributed under the terms and conditions of the Creative Commons Attribution (CC BY) license (http://creativecommons.org/licenses/by/4.0/).
Share and Cite
MDPI and ACS Style
Cichowska, J.; Żubernik, J.; Czyżewski, J.; Kowalska, H.; Witrowa-Rajchert, D. Efficiency of Osmotic Dehydration of Apples in Polyols Solutions. Molecules 2018, 23, 446. https://0-doi-org.brum.beds.ac.uk/10.3390/molecules23020446
AMA Style
Cichowska J, Żubernik J, Czyżewski J, Kowalska H, Witrowa-Rajchert D. Efficiency of Osmotic Dehydration of Apples in Polyols Solutions. Molecules. 2018; 23(2):446. https://0-doi-org.brum.beds.ac.uk/10.3390/molecules23020446
Chicago/Turabian StyleCichowska, Joanna, Joanna Żubernik, Jakub Czyżewski, Hanna Kowalska, and Dorota Witrowa-Rajchert. 2018. "Efficiency of Osmotic Dehydration of Apples in Polyols Solutions" Molecules 23, no. 2: 446. https://0-doi-org.brum.beds.ac.uk/10.3390/molecules23020446