Highly Sensitive Detection of the Antibiotic Ciprofloxacin by Means of Fiber Enhanced Raman Spectroscopy

 , and
, and
Abstract
:
1. Introduction
2. Materials and Methods
2.1. Raman Spectroscopy
2.2. Density Functional Theory Calculations
3. Results and Discussion
4. Conclusions and Outlook
Author Contributions
Funding
Conflicts of Interest
References
- Bourchard-Tuch, C. Sepsis-Gefährliches Gefecht im Körper. Pharm. Ztg. Online 2012, 4, 2012. [Google Scholar]
- Hagel, S.; Pletz, M.W.; Brunkhorst, F.M.; Seifert, H.; Kern, W.V. Bacteremia and sepsis. Internist (Berl) 2013, 54, 399–407. [Google Scholar] [CrossRef] [PubMed]
- Lipman, J.; Scribante, J.; Gous, A.G.; Hon, H.; Tshukutsoane, S. Pharmacokinetic profiles of high-dose intravenous ciprofloxacin in severe sepsis. The Baragwanath Ciprofloxacin Study Group. Antimicrob. Agents Chemother. 1998, 42, 2235–2239. [Google Scholar] [CrossRef] [PubMed] [Green Version]
- Reinhart, K.; Bauer, M.; Riedemann, N.C.; Hartog, C.S. New approaches to sepsis: Molecular diagnostics and biomarkers. Clin. Microbiol. Rev. 2012, 25, 609–634. [Google Scholar] [CrossRef] [PubMed] [Green Version]
- Kaguelidou, F.; Turner, M.A.; Choonara, I.; Jacqz-Aigrain, E. Ciprofloxacin use in neonates: A systematic review of the literature. Pediatr. Infect. Dis J. 2011, 30, e29–e37. [Google Scholar] [CrossRef] [PubMed]
- Forrest, A.; Nix, D.E.; Ballow, C.H.; Goss, T.F.; Birmingham, M.C.; Schentag, J.J. Pharmacodynamics of intravenous ciprofloxacin in seriously ill patients. Antimicrob. Agents Chemother. 1993, 37, 1073–1081. [Google Scholar] [CrossRef] [Green Version]
- Jones, E.M.; McMullin, C.M.; Hedges, A.J.; Lovering, A.M.; White, L.O.; Reeves, D.S.; MacGowan, A.P. The pharmacokinetics of intravenous ciprofloxacin 400 mg 12 hourly in patients with severe sepsis: The effect of renal function and intra-abdominal disease. J. Antimicrob. Chemother. 1997, 40, 121–124. [Google Scholar] [CrossRef] [Green Version]
- Campoli-Richards, D.M.; Monk, J.P.; Price, A.; Benfield, P.; Todd, P.A.; Ward, A. Ciprofloxacin. A review of its antibacterial activity, pharmacokinetic properties and therapeutic use. Drugs 1988, 35, 373–447. [Google Scholar] [CrossRef]
- Muchohi, S.N.; Thuo, N.; Karisa, J.; Muturi, A.; Kokwaro, G.O.; Maitland, K. Determination of ciprofloxacin in human plasma using high-performance liquid chromatography coupled with fluorescence detection: Application to a population pharmacokinetics study in children with severe malnutrition. J. Chromatogr. B Anal. Technol. Biomed. Life Sci. 2011, 879, 146–152. [Google Scholar] [CrossRef] [Green Version]
- Lettieri, J.T.; Rogge, M.C.; Kaiser, L.; Echols, R.M.; Heller, A.H. Pharmacokinetic profiles of ciprofloxacin after single intravenous and oral doses. Antimicrob. Agents Chemother. 1992, 36, 993–996. [Google Scholar] [CrossRef] [Green Version]
- Scherer, R.; Pereira, J.; Firme, J.; Lemos, M.; Lemos, M. Determination of Ciprofloxacin in Pharmaceutical Formulations Using HPLC Method with UV Detection. Indian J. Pharm. Sci. 2014, 76, 541–544. [Google Scholar] [PubMed]
- Vybiralova, Z.; Nobilis, M.; Zoulova, J.; Kvetina, J.; Petr, P. High-performance liquid chromatographic determination of ciprofloxacin in plasma samples. J. Pharm. Biomed. Anal. 2005, 37, 851–858. [Google Scholar] [CrossRef] [PubMed]
- Pecorelli, I.; Bibi, R.; Fioroni, L.; Galarini, R. Validation of a confirmatory method for the determination of sulphonamides in muscle according to the European Union regulation 2002/657/EC. J. Chromatogr. A 2004, 1032, 23–29. [Google Scholar] [CrossRef] [PubMed]
- Roberts, J.A.; Norris, R.; Paterson, D.L.; Martin, J.H. Therapeutic drug monitoring of antimicrobials. Br. J. Clin. Pharm. 2012, 73, 27–36. [Google Scholar] [CrossRef] [Green Version]
- Long, D.A. The Raman Effect; Wiley: New York, NY, USA, 2002. [Google Scholar]
- Frosch, T.; Meyer, T.; Schmitt, M.; Popp, J. Device for Raman difference spectroscopy. Anal. Chem. 2007, 79, 6159–6166. [Google Scholar] [CrossRef]
- Knebl, A.; Yan, D.; Popp, J.; Frosch, T. Fiber enhanced Raman gas spectroscopy. Trac. Trends Anal. Chem. 2018, 103, 230–238. [Google Scholar] [CrossRef]
- Jochum, T.; Michalzik, B.; Bachmann, A.; Popp, J.; Frosch, T. Microbial respiration and natural attenuation of benzene contaminated soils investigated by cavity enhanced Raman multi-gas spectroscopy. Analyst 2015, 140, 3143–3149. [Google Scholar] [CrossRef] [Green Version]
- Hanf, S.; Bogozi, T.; Keiner, R.; Frosch, T.; Popp, J. Fast and highly sensitive fiber-enhanced Raman spectroscopic monitoring of molecular H2 and CH4 for point-of-care diagnosis of malabsorption disorders in exhaled human breath. Anal. Chem. 2015, 87, 982–988. [Google Scholar] [CrossRef]
- Hanf, S.; Fischer, S.; Hartmann, H.; Keiner, R.; Trumbore, S.; Popp, J.; Frosch, T. Online investigation of respiratory quotients in Pinus sylvestris and Picea abies during drought and shading by means of cavity-enhanced Raman multi-gas spectrometry. Analyst 2015, 140, 4473–4481. [Google Scholar] [CrossRef] [Green Version]
- Bruckner, M.; Becker, K.; Popp, J.; Frosch, T. Fiber array based hyperspectral Raman imaging for chemical selective analysis of malaria-infected red blood cells. Anal. Chim. Acta 2015, 894, 76–84. [Google Scholar] [CrossRef]
- Bögözi, T.; Popp, J.; Frosch, T. Fiber-enhanced Raman multi-gas spectroscopy: What is the potential of its application to breath analysis? Future Sci. Bioanal. 2015, 7, 281–284. [Google Scholar] [CrossRef]
- Frosch, T.; Knebl, A.; Frosch, T. Recent advances in nano-photonic techniques for pharmaceutical drug monitoring with emphasis on Raman spectroscopy. Nanophotonics 2019. accepted. [Google Scholar] [CrossRef]
- Domes, C.; Domes, R.; Popp, J.; Pletz, M.W.; Frosch, T. Ultrasensitive detection of antiseptic antibiotics in aqueous media and human urine using deep UV resonance raman spectroscopy. Anal. Chem. 2017, 89, 9997–10003. [Google Scholar] [CrossRef] [PubMed]
- Domes, R.; Domes, C.; Albert, C.R.; Bringmann, G.; Popp, J.; Frosch, T. Vibrational spectroscopic characterization of arylisoquinolines by means of Raman spectroscopy and density functional theory calculations. Phys. Chem. Chem. Phys. 2017, 19, 29918–29926. [Google Scholar] [CrossRef] [PubMed]
- Frosch, T.; Popp, J. Structural analysis of the antimalarial drug halofantrine by means of Raman spectroscopy and density functional theory calculations. J. Biomed. Opt. 2010, 15, 041516. [Google Scholar] [CrossRef]
- Frosch, T.; Küstner, B.; Schlücker, S.; Szeghalmi, A.; Schmitt, M.; Kiefer, W.; Popp, J. In vitro polarization-resolved resonance Raman studies of the interaction of hematin with the antimalarial drug chloroquine. J. Raman Spectrosc. 2004, 35, 819–821. [Google Scholar] [CrossRef]
- Frosch, T.; Schmitt, M.; Schenzel, K.; Faber, J.H.; Bringmann, G.; Kiefer, W.; Popp, J. In vivo localization and identification of the antiplasmodial alkaloid dioncophylline A in the tropical liana Triphyophyllum peltatum by a combination of fluorescence, near infrared Fourier transform Raman microscopy, and density functional theory calculations. Biopolymers 2006, 82, 295–300. [Google Scholar]
- Sieburg, A.; Jochum, T.; Trumbore, S.E.; Popp, J.; Frosch, T. Onsite cavity enhanced Raman spectrometry for the investigation of gas exchange processes in the Earth’s critical zone. Analyst 2017, 142, 3360–3369. [Google Scholar] [CrossRef]
- Keiner, R.; Herrmann, M.; Kusel, K.; Popp, J.; Frosch, T. Rapid monitoring of intermediate states and mass balance of nitrogen during denitrification by means of cavity enhanced Raman multi-gas sensing. Anal. Chim. Acta 2015, 864, 39–47. [Google Scholar] [CrossRef]
- Jochum, T.; von Fischer, J.C.; Trumbore, S.; Popp, J.; Frosch, T. Multigas leakage correction in static environmental chambers using sulfur hexafluoride and Raman spectroscopy. Anal. Chem. 2015, 87, 11137–11142. [Google Scholar] [CrossRef]
- Frosch, T.; Wyrwich, E.; Yan, D.; Domes, C.; Domes, R.; Popp, J.; Frosch, T. Counterfeit and Substandard Test of the Antimalarial Tablet Riamet® by Means of Raman Hyperspectral Multicomponent Analysis. Molecules 2019, 24, 3229. [Google Scholar] [CrossRef] [Green Version]
- Knebl, A.; Domes, R.; Yan, D.; Popp, J.; Trumbore, S.; Frosch, T. Fiber-Enhanced Raman Gas Spectroscopy for (18)O-(13)C-Labeling Experiments. Anal. Chem. 2019, 91, 7562–7569. [Google Scholar] [CrossRef]
- Sieburg, A.; Schneider, S.; Yan, D.; Popp, J.; Frosch, T. Monitoring of gas composition in a laboratory biogas plant using cavity enhanced Raman spectroscopy. Analyst 2018, 143, 1358–1366. [Google Scholar] [CrossRef] [PubMed]
- Jochum, T.; Fastnacht, A.; Trumbore, S.E.; Popp, J.; Frosch, T. Direct Raman Spectroscopic Measurements of Biological Nitrogen Fixation under Natural Conditions: An Analytical Approach for Studying Nitrogenase Activity. Anal. Chem. 2017, 89, 1117–1122. [Google Scholar] [CrossRef] [Green Version]
- Jochum, T.; Rahal, L.; Suckert, R.J.; Popp, J.; Frosch, T. All-in-one: A versatile gas sensor based on fiber enhanced Raman spectroscopy for monitoring postharvest fruit conservation and ripening. Analyst 2016, 141, 2023–2029. [Google Scholar] [CrossRef] [Green Version]
- Frosch, T.; Wyrwich, E.; Yan, D.; Popp, J.; Frosch, T. Fiber-Array-Based Raman Hyperspectral Imaging for Simultaneous, Chemically-Selective Monitoring of Particle Size and Shape of Active Ingredients in Analgesic Tablets. Molecules 2019, 24, 4381. [Google Scholar] [CrossRef] [Green Version]
- Frosch, T.; Yan, D.; Popp, J. Ultrasensitive fiber enhanced UV resonance Raman sensing of drugs. Anal. Chem. 2013, 85, 6264–6271. [Google Scholar] [CrossRef]
- Knight, J.C.; Broeng, J.; Birks, T.A.; Russell, P.S.J. Photonic band gap guidance in optical fibers. Science 1998, 282, 1476–1478. [Google Scholar] [CrossRef]
- Russell, P. Photonic crystal fibers. Science 2003, 299, 358–362. [Google Scholar] [CrossRef]
- Khetani, A.; Tiwari, V.S.; Harb, A.; Anis, H. Monitoring of heparin concentration in serum by Raman spectroscopy within hollow core photonic crystal fiber. Opt. Express 2011, 19, 15244–15254. [Google Scholar] [CrossRef]
- Cregan, R.F.; Mangan, B.J.; Knight, J.C.; Birks, T.A.; Russell, P.S.; Roberts, P.J.; Allan, D.C. Single-Mode Photonic Band Gap Guidance of Light in Air. Science 1999, 285, 1537–1539. [Google Scholar] [CrossRef] [PubMed] [Green Version]
- Gu, G.; Kong, F.; Hawkins, T.W.; Jones, M.; Dong, L. Extending mode areas of single-mode all-solid photonic bandgap fibers. Opt. Express 2015, 23, 9147–9156. [Google Scholar] [CrossRef] [PubMed]
- Wang, Z.; Li, Q.; Wang, Z.; Zou, F.Z.; Bai, Y.; Feng, S.; Zhou, A.J. 255 W picosecond MOPA laser based on self-made Yb-doped very-large-mode-area photonic crystal fiber. Chin. Opt. Lett. 2016, 14, 081401. [Google Scholar] [CrossRef] [Green Version]
- Liu, Q.; Li, S.-G.; Shi, M. Fiber Sagnac interferometer based on a liquid-filled photonic crystal fiber for temperature sensing. Opt. Commun. 2016, 381, 1–6. [Google Scholar] [CrossRef]
- Schartner, E.P.; Tsiminis, G.; François, A.; Kostecki, R.; Warren-Smith, S.C.; Nguyen, L.V.; Heng, S.; Reynolds, T.; Klantsataya, E.; Rowland, K.J.; et al. Taming the Light in Microstructured Optical Fibers for Sensing. Int. J. Appl. Glass Sci. 2015, 6, 229–239. [Google Scholar] [CrossRef] [Green Version]
- Yan, D.; Domes, C.; Domes, R.; Frosch, T.; Popp, J.; Pletz, M.W.; Frosch, T. Fiber enhanced Raman spectroscopic analysis as a novel method for diagnosis and monitoring of diseases related to hyperbilirubinemia and hyperbiliverdinemia. Analyst 2016, 141, 6104–6115. [Google Scholar] [CrossRef] [Green Version]
- Sieburg, A.; Knebl, A.; Jacob, J.M.; Frosch, T. Characterization of fuel gases with fiber-enhanced Raman spectroscopy. Anal. Bioanal. Chem. 2019, 411, 7399–7408. [Google Scholar] [CrossRef]
- Markin, A.V.; Markina, N.E.; Goryacheva, I.Y. Raman spectroscopy based analysis inside photonic-crystal fibers. Trac. Trends Anal. Chem. 2017, 88, 185–197. [Google Scholar] [CrossRef]
- Eravuchira, P.; Banchelli, M.; D’Andrea, C.; De Angelis, M.; Matteini, P.; Gannot, I. Optical Fibers and Sensors for Medical Diagnostics and Treatment Applications XIX, 2019. In Fiber-Enhanced Raman Spectroscopy as a Tool for an EARLY detection of Alzheimer’s Disease Biomarkers; International Society for Optics and Photonics: San Francisco, CA, USA, 2019; p. 1087211. [Google Scholar]
- Yan, D.; Frosch, T.; Kobelke, J.; Bierlich, J.; Popp, J.; Pletz, M.W.; Frosch, T. Fiber-Enhanced Raman Sensing of Cefuroxime in Human Urine. Anal. Chem. 2018, 90, 13243–13248. [Google Scholar] [CrossRef]
- Yan, D.; Popp, J.; Pletz, M.W.; Frosch, T. Highly sensitive broadband Raman sensing of antibiotics in step-index hollow-core photonic crystal fibers. Acs Photonics 2017, 4, 138–145. [Google Scholar] [CrossRef]
- Yan, D.; Popp, J.; Pletz, M.W.; Frosch, T. Fiber enhanced Raman sensing of levofloxacin by PCF bandgap-shifting into the visible range. Anal. Methods 2018, 10, 586–592. [Google Scholar] [CrossRef]
- Khetani, A.; Riordon, J.; Tiwari, V.; Momenpour, A.; Godin, M.; Anis, H. Hollow core photonic crystal fiber as a reusable Raman biosensor. Opt. Express 2013, 21, 12340–12350. [Google Scholar] [CrossRef] [PubMed]
- Antonopoulos, G.; Benabid, F.; Birks, T.; Bird, D.; Bouwmans, G.; Knight, J.; Russell, P.S.J. Conference on Lasers and Electro-Optics. In Experimental Demonstration of Refractive Index Scaling in Photonic Bandgap Fibers; Optical Society of America: Washington, DC, USA, 2004. [Google Scholar]
- Antonopoulos, G.; Benabid, F.; Birks, T.A.; Bird, D.M.; Knight, J.C.; Russell, P.S. Experimental demonstration of the frequency shift of bandgaps in photonic crystal fibers due to refractive index scaling. Opt. Express 2006, 14, 3000–3006. [Google Scholar] [CrossRef] [PubMed]
- Cox, F.M.; Argyros, A.; Large, M.C.; Kalluri, S. Surface enhanced Raman scattering in a hollow core microstructured optical fiber. Opt. Express 2007, 15, 13675–13681. [Google Scholar] [CrossRef]
- Eftekhari, F.; Irizar, J.; Hulbert, L.; Helmy, A.S. A comparative study of Raman enhancement in capillaries. J. Appl. Phys. 2011, 109, 113104. [Google Scholar] [CrossRef]
- Han, Y.; Oo, M.K.K.; Zhu, Y.; Xiao, L.; Demohan, M.S.; Jin, W.; Du, H.H. Index-guiding liquid-core photonic crystal fiber for solution measurement using normal and surface-enhanced Raman scattering. Opt. Eng. 2008, 47, 040502. [Google Scholar] [CrossRef] [Green Version]
- Irizar, J.; Dinglasan, J.; Goh, J.B.; Khetani, A.; Anis, H.; Anderson, D.; Goh, C.; Helmy, A. Raman spectroscopy of nanoparticles using hollow-core photonic crystal fibers. IEEE J. Sel. Top. Quantum Electron. 2008, 14, 1214–1222. [Google Scholar] [CrossRef]
- Khetani, A.; Momenpour, A.; Alarcon, E.I.; Anis, H. Hollow core photonic crystal fiber for monitoring leukemia cells using surface enhanced Raman scattering (SERS). Biomed. Opt. Express 2015, 6, 4599–4609. [Google Scholar] [CrossRef] [Green Version]
- Khetani, A.; Monfared, A.M.T.; Tiwari, V.S.; Anis, H.; Riordon, J.; Godin, M. Optical Fibers and Sensors for Medical Diagnostics and Treatment Applications XIII, 2013. In Hollow Core Photonic Crystal Fiber as a Robust Raman Biosensor; International Society for Optics and Photonics: San Francisco, CA, USA, 2013; p. 85760F. [Google Scholar]
- Naji, M.; Khetani, A.; Lagali, N.; Munger, R.; Anis, H. A Novel Method of Using Hollow-Core Photonic Crystal Fiber as a Raman Biosensor; SPIE: San Jose, CA, USA, 2008; p. 68650E. [Google Scholar]
- Nielsen, K.; Noordegraaf, D.; Sørensen, T.; Bjarklev, A.; Hansen, T.P. Selective filling of photonic crystal fibres. J. Opt. A Pure Appl. Opt. 2005, 7, L13. [Google Scholar] [CrossRef]
- Shi, C.; Lu, C.; Gu, C.; Tian, L.; Newhouse, R.; Chen, S.; Zhang, J.Z. Inner wall coated hollow core waveguide sensor based on double substrate surface enhanced Raman scattering. Appl. Phys. Lett. 2008, 93, 153101. [Google Scholar] [CrossRef] [Green Version]
- Smolka, S.; Barth, M.; Benson, O. Highly efficient fluorescence sensing with hollow core photonic crystal fibers. Opt. Express 2007, 15, 12783–12791. [Google Scholar] [CrossRef] [PubMed] [Green Version]
- Smolka, S.; Barth, M.; Benson, O. Selectively coated photonic crystal fiber for highly sensitive fluorescence detection. Appl. Phys. Lett. 2007, 90, 111101. [Google Scholar] [CrossRef]
- Sun, J.; Chan, C.C.; Zhang, Y.F.; Shum, P. Analysis of hollow-core photonic bandgap fibers for evanescent wave biosensing. J. Biomed. Opt. 2008, 13, 054048. [Google Scholar] [CrossRef]
- Tiwari, V.S.; Khetani, A.; Momenpour, A.; Anis, H. Optimum size and volume of nanoparticles within hollow core photonic crystal fiber. IEEE J. Sel. Top. Quantum Electron. 2013, 20, 205–212. [Google Scholar]
- Yan, H.; Gu, C.; Yang, C.; Liu, J.; Jin, G.; Zhang, J.; Hou, L.; Yao, Y. Hollow core photonic crystal fiber surface-enhanced Raman probe. Appl. Phys. Lett. 2006, 89, 204101. [Google Scholar] [CrossRef]
- Yang, X.; Shi, C.; Newhouse, R.; Zhang, J.Z.; Gu, C. Hollow-core photonic crystal fibers for surface-enhanced Raman scattering probes. Int. J. Opt. 2011, 2011, 1–11. [Google Scholar] [CrossRef] [Green Version]
- Yang, X.; Shi, C.; Wheeler, D.; Newhouse, R.; Chen, B.; Zhang, J.Z.; Gu, C. High-sensitivity molecular sensing using hollow-core photonic crystal fiber and surface-enhanced Raman scattering. Josa A 2010, 27, 977–984. [Google Scholar] [CrossRef]
- Yang, X.; Zhang, A.Y.; Wheeler, D.A.; Bond, T.C.; Gu, C.; Li, Y. Direct molecule-specific glucose detection by Raman spectroscopy based on photonic crystal fiber. Anal. Bioanal. Chem. 2012, 402, 687–691. [Google Scholar] [CrossRef]
- Yan, D.; Popp, J.; Frosch, T. Analysis of Fiber-Enhanced Raman Gas Sensing Based on Raman Chemical Imaging. Anal. Chem. 2017, 89, 12269–12275. [Google Scholar] [CrossRef]
- Frisch, M.; Trucks, G.; Schlegel, H.; Scuseria, G.; Robb, M.; Cheeseman, J.; Scalmani, G.; Barone, V.; Mennucci, B.; Petersson, G. Gaussian 09, Revision A. 02; Gaussian. Inc.: Wallingfordct, CT, USA, 2009. [Google Scholar]
- Becke, A. Density-functional thermochemistry. II. The effect of the Perdew–Wang generalized-gradient correlation correction. J. Chem. Phys. 1992, 97, 9173–9177. [Google Scholar] [CrossRef]
- Stephens, P.; Devlin, F.; Chabalowski, C.; Frisch, M. Ab initio calculation of vibrational absorption and circular dichroism spectra using density functional force fields. J. Phys. Chem. 1994, 98, 11623–11627. [Google Scholar] [CrossRef]
- Lee, C.; Yang, W.; Parr, R. Development of the Colle-Salvetti correlation-energy formula into a functional of the electron density. Phys. Rev. B 1988, 37, 785. [Google Scholar] [CrossRef] [PubMed] [Green Version]
- Dunning, T. Gaussian basis sets for use in correlated molecular calculations. I. The atoms boron through neon and hydrogen. J. Chem. Phys. 1989, 90, 1007–1023. [Google Scholar] [CrossRef]
- Dunning, T. A road map for the calculation of molecular binding energies. J. Phys. Chem. A 2000, 104, 9062–9080. [Google Scholar] [CrossRef]
- Polavarapu, P. Ab initio vibrational Raman and Raman optical activity spectra. J. Phys. Chem. 1990, 94, 8106–8112. [Google Scholar] [CrossRef]
Sample Availability: Samples are not available from the authors. |


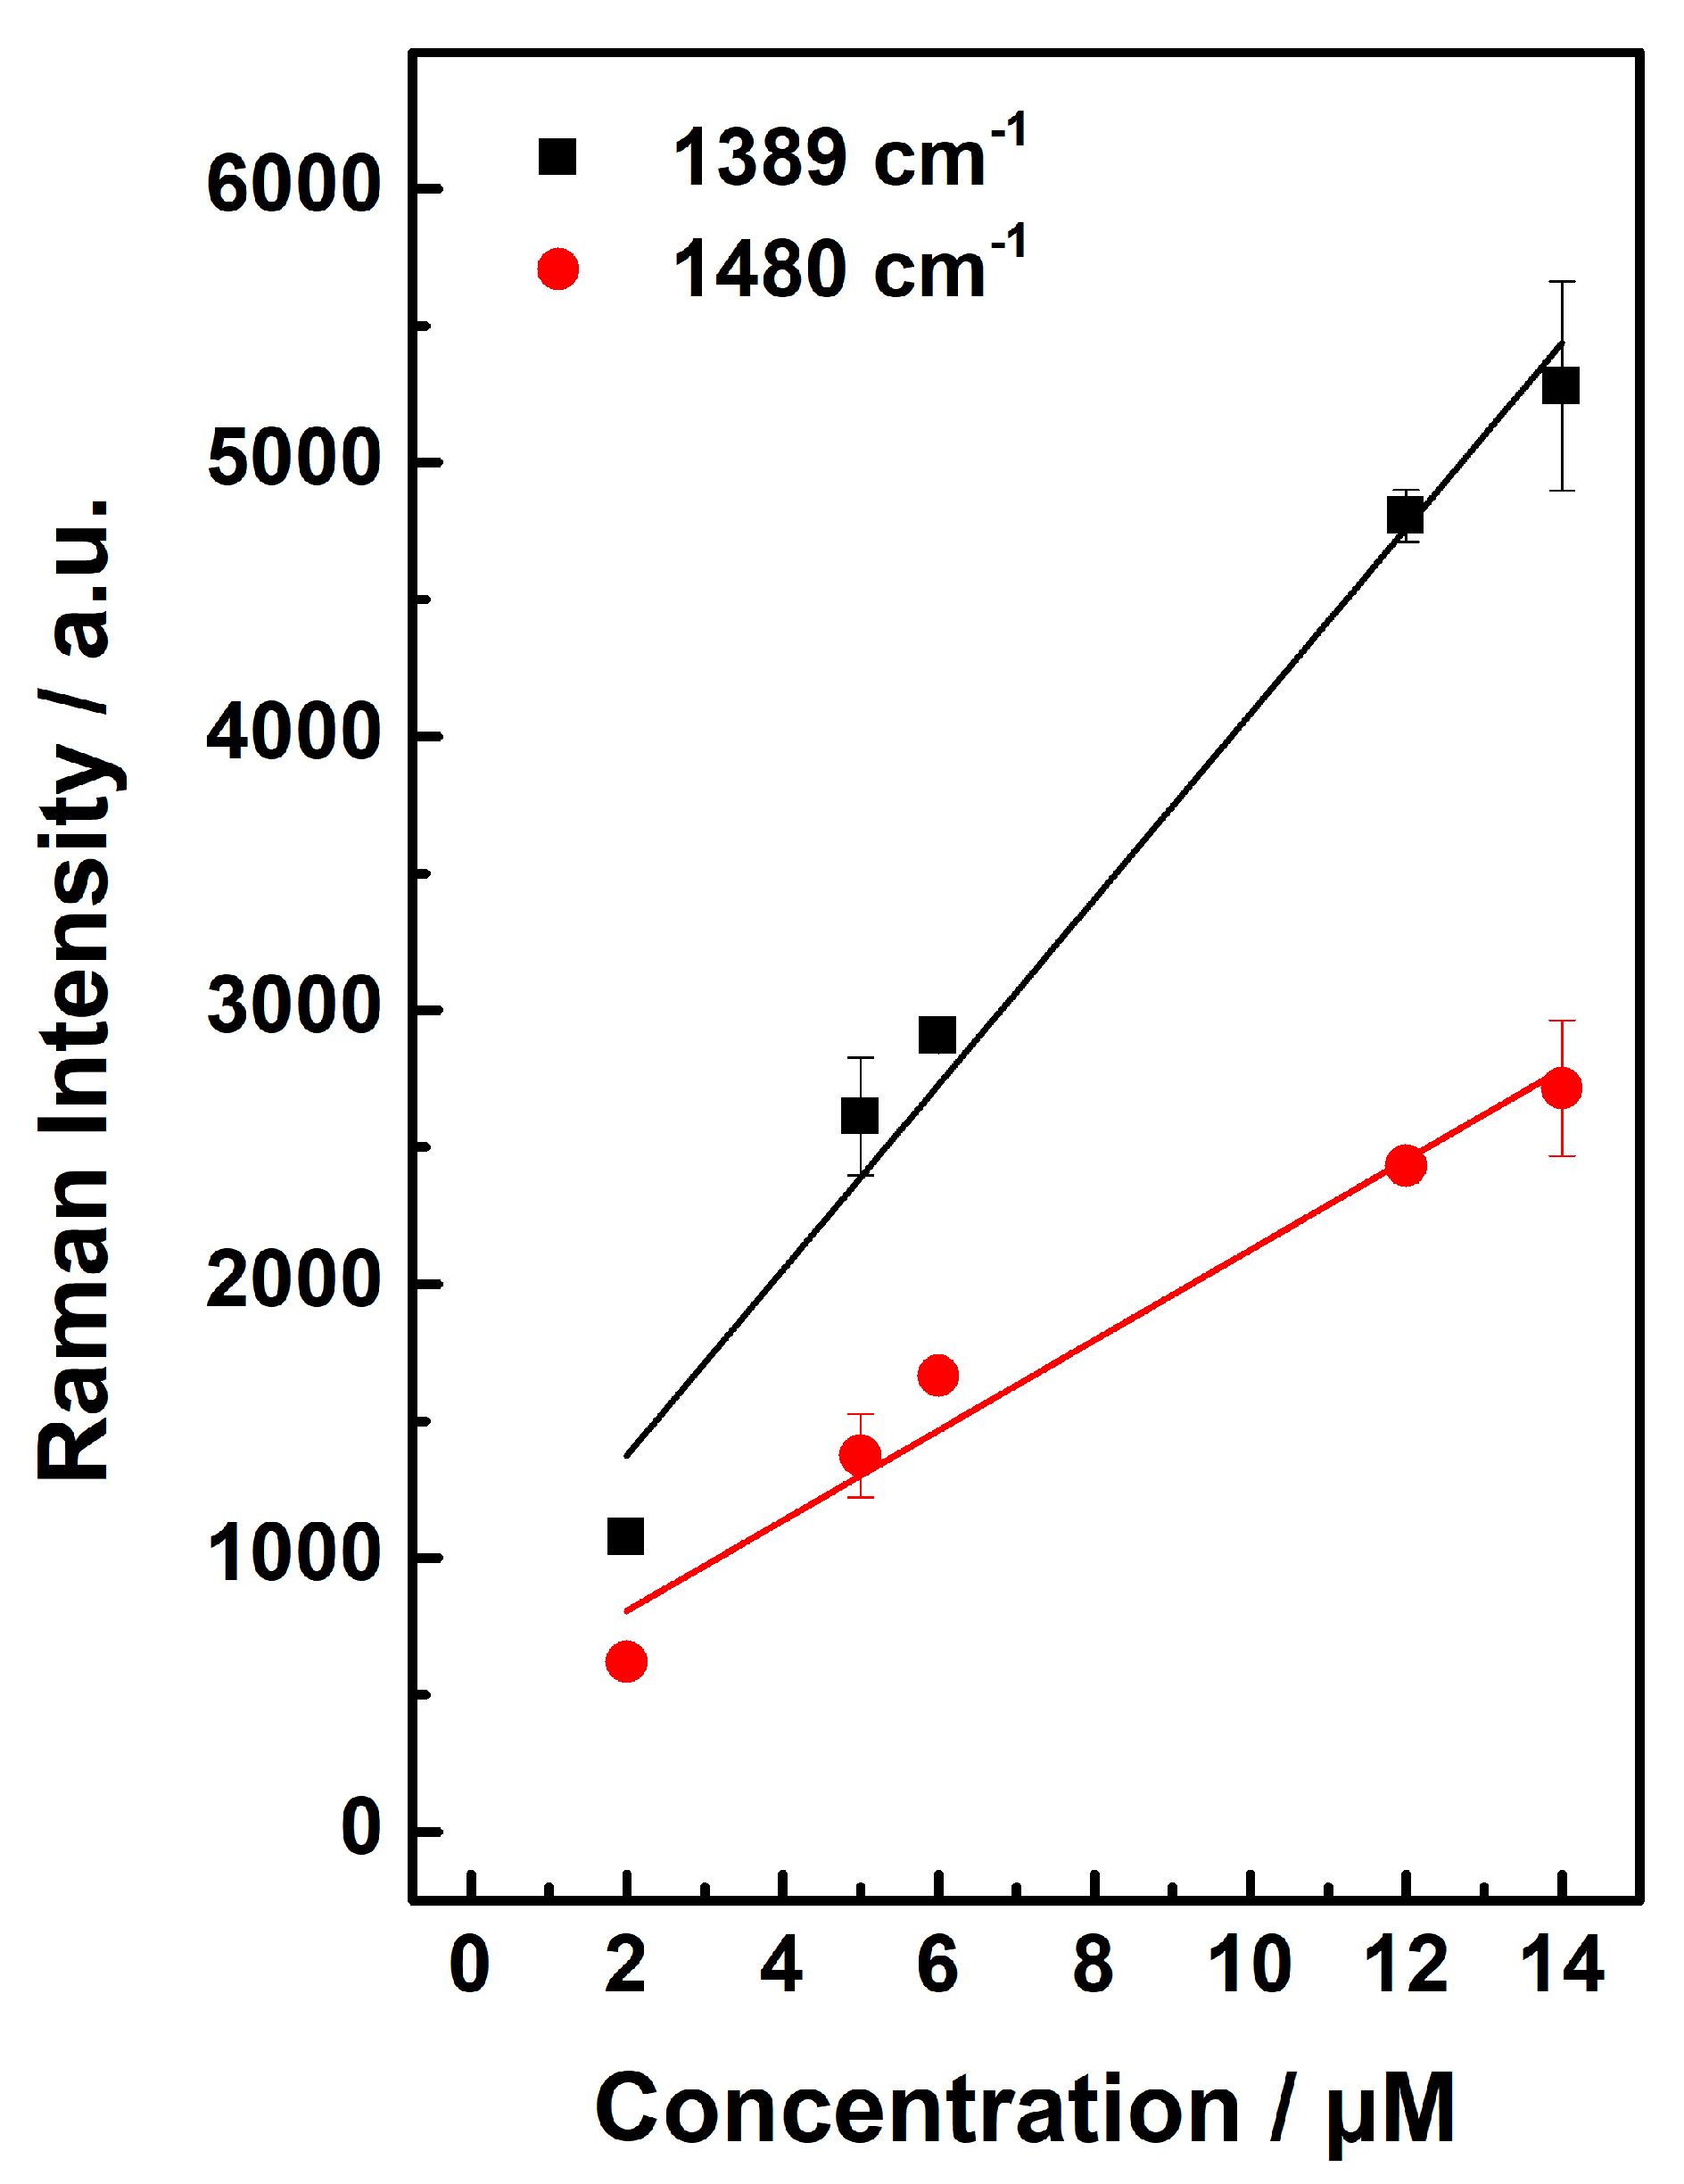
| Concentration | SNR | Concentration | SNR |
|---|---|---|---|
| 14 µM | 20.0 | 5 µM | 9.9 |
| 12 µM | 18.2 | 2 µM | 4.1 |
| 6 µM | 11.0 |
© 2019 by the authors. Licensee MDPI, Basel, Switzerland. This article is an open access article distributed under the terms and conditions of the Creative Commons Attribution (CC BY) license (http://creativecommons.org/licenses/by/4.0/).
Share and Cite
Wolf, S.; Frosch, T.; Popp, J.; Pletz, M.W.; Frosch, T. Highly Sensitive Detection of the Antibiotic Ciprofloxacin by Means of Fiber Enhanced Raman Spectroscopy. Molecules 2019, 24, 4512. https://0-doi-org.brum.beds.ac.uk/10.3390/molecules24244512
Wolf S, Frosch T, Popp J, Pletz MW, Frosch T. Highly Sensitive Detection of the Antibiotic Ciprofloxacin by Means of Fiber Enhanced Raman Spectroscopy. Molecules. 2019; 24(24):4512. https://0-doi-org.brum.beds.ac.uk/10.3390/molecules24244512
Chicago/Turabian StyleWolf, Sebastian, Timea Frosch, Juergen Popp, Mathias W. Pletz, and Torsten Frosch. 2019. "Highly Sensitive Detection of the Antibiotic Ciprofloxacin by Means of Fiber Enhanced Raman Spectroscopy" Molecules 24, no. 24: 4512. https://0-doi-org.brum.beds.ac.uk/10.3390/molecules24244512