
A Rapid and Highly Efficient Method for the Identification of Soybean Seed Varieties: Hyperspectral Images Combined with Transfer Learning

 ,
,
Abstract
:1. Introduction
2. Results and Discussion
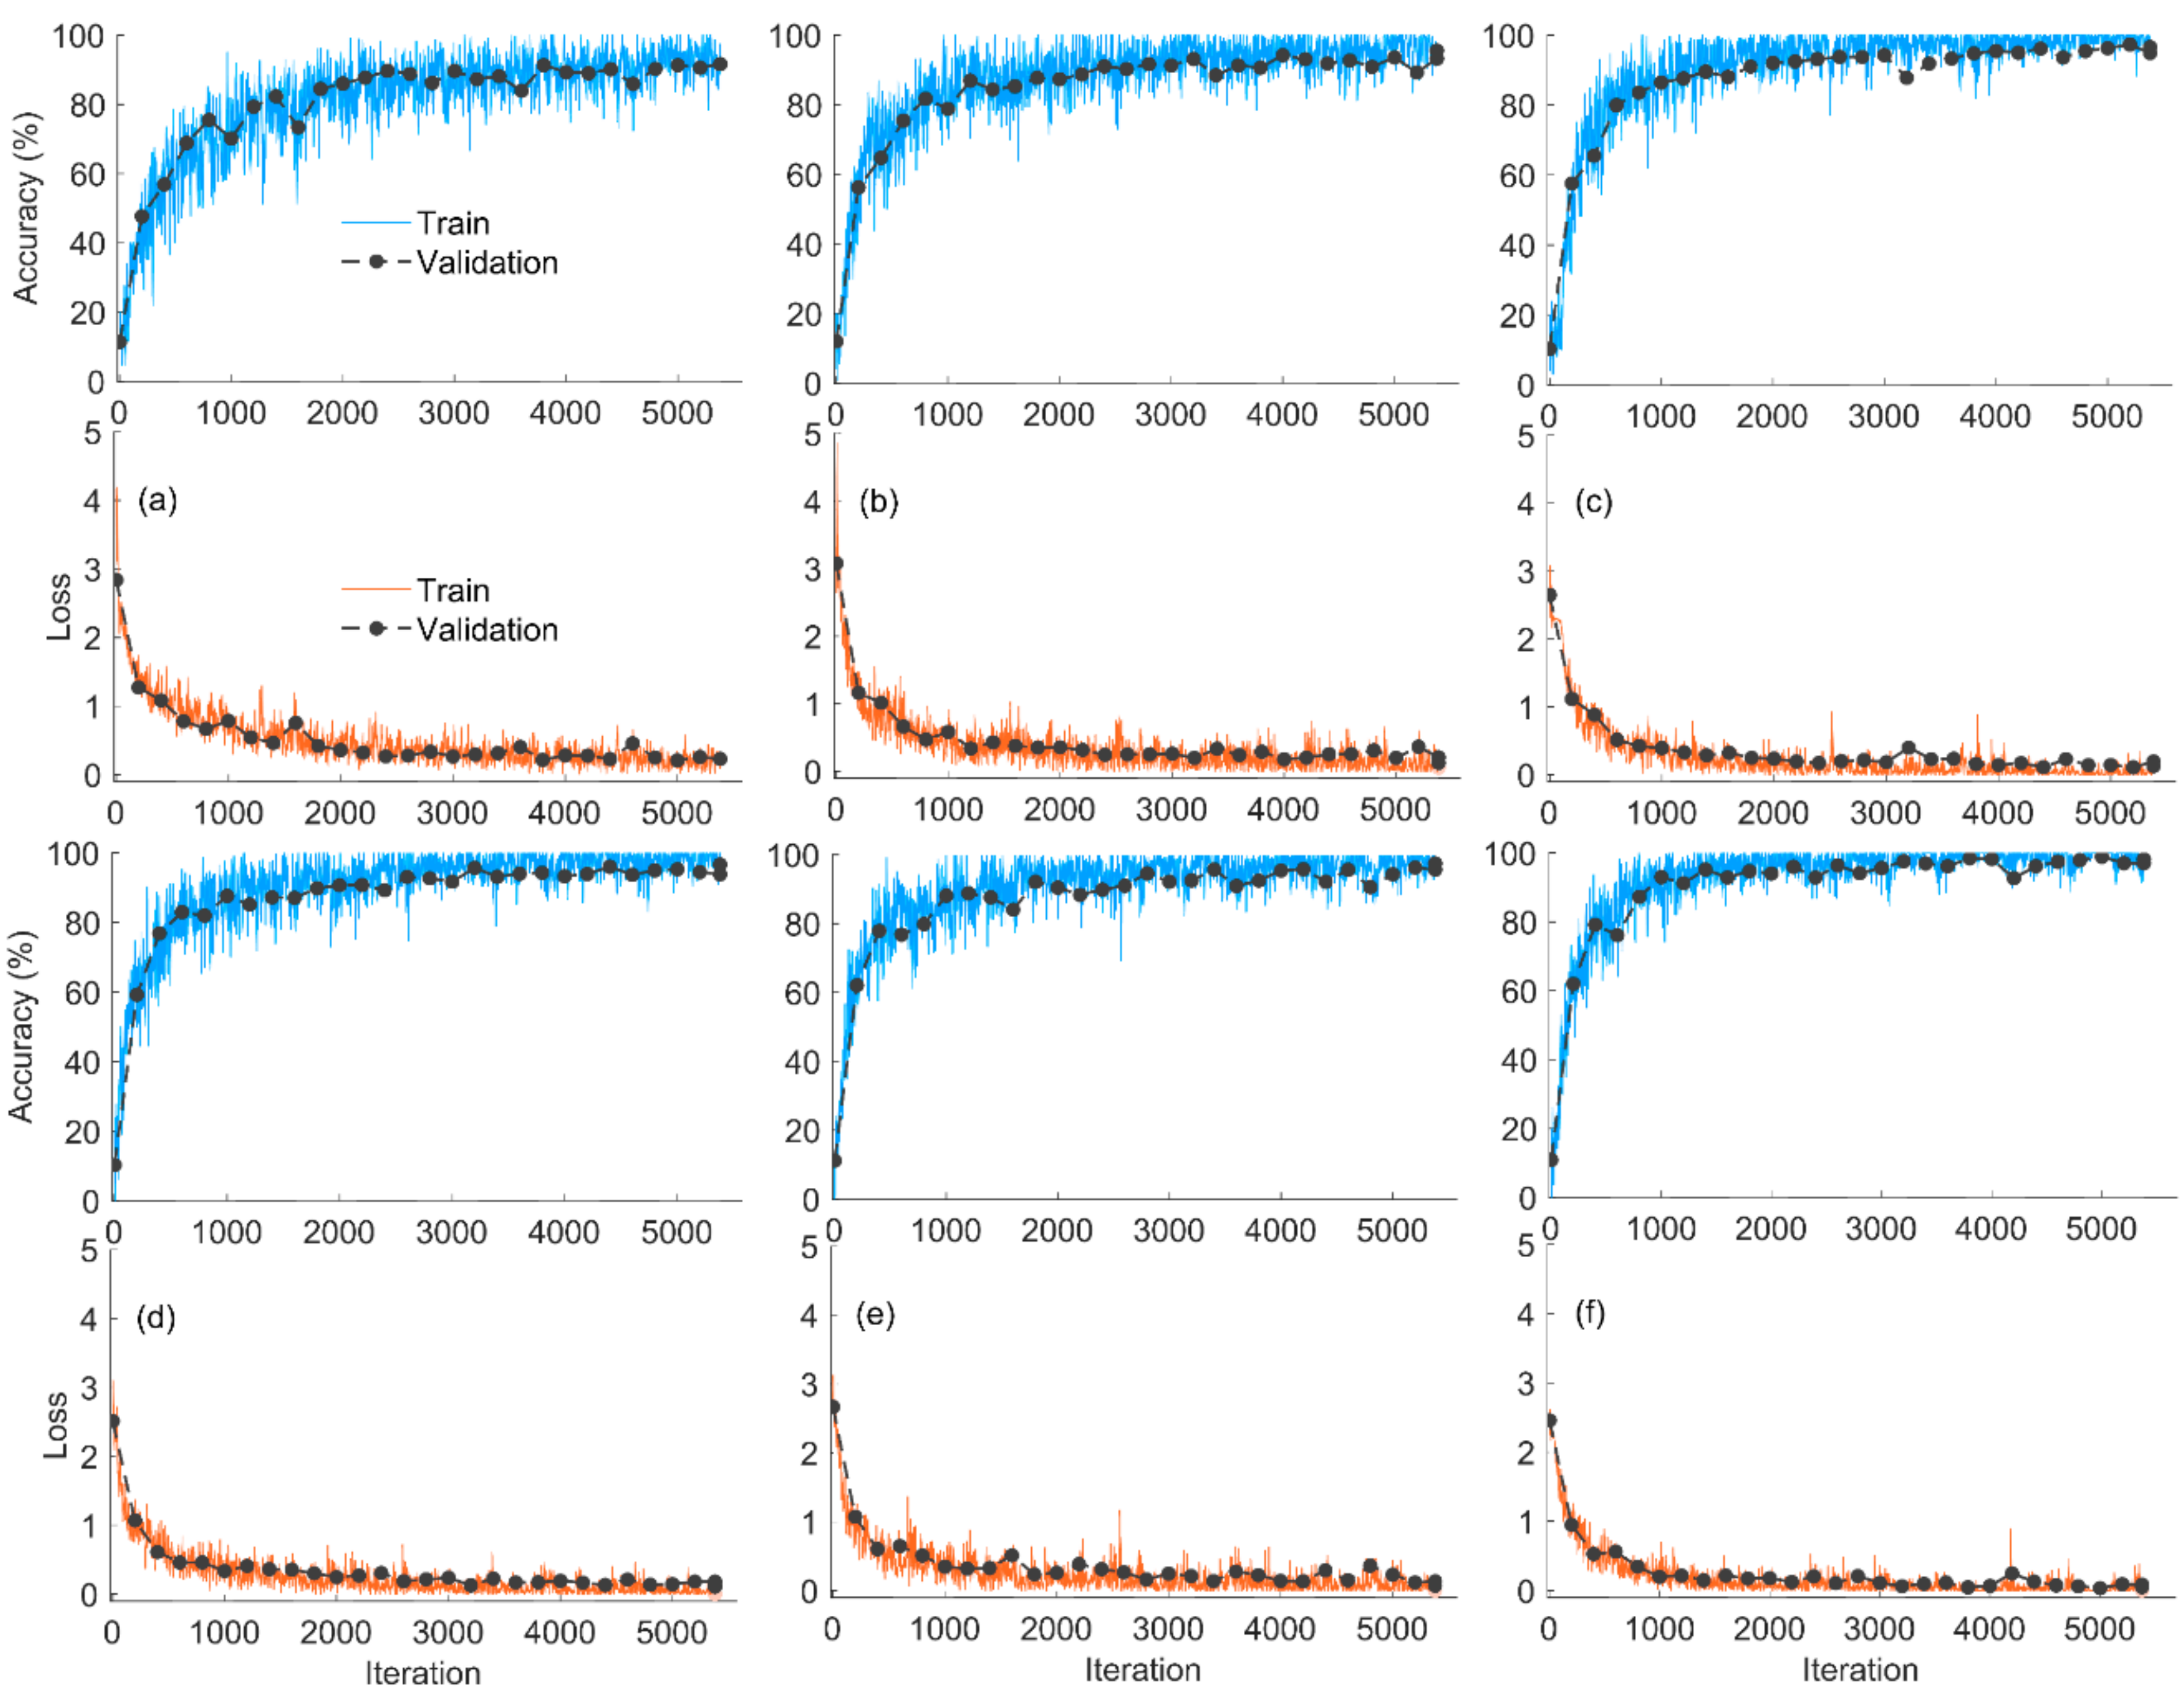
2.1. Training Progress
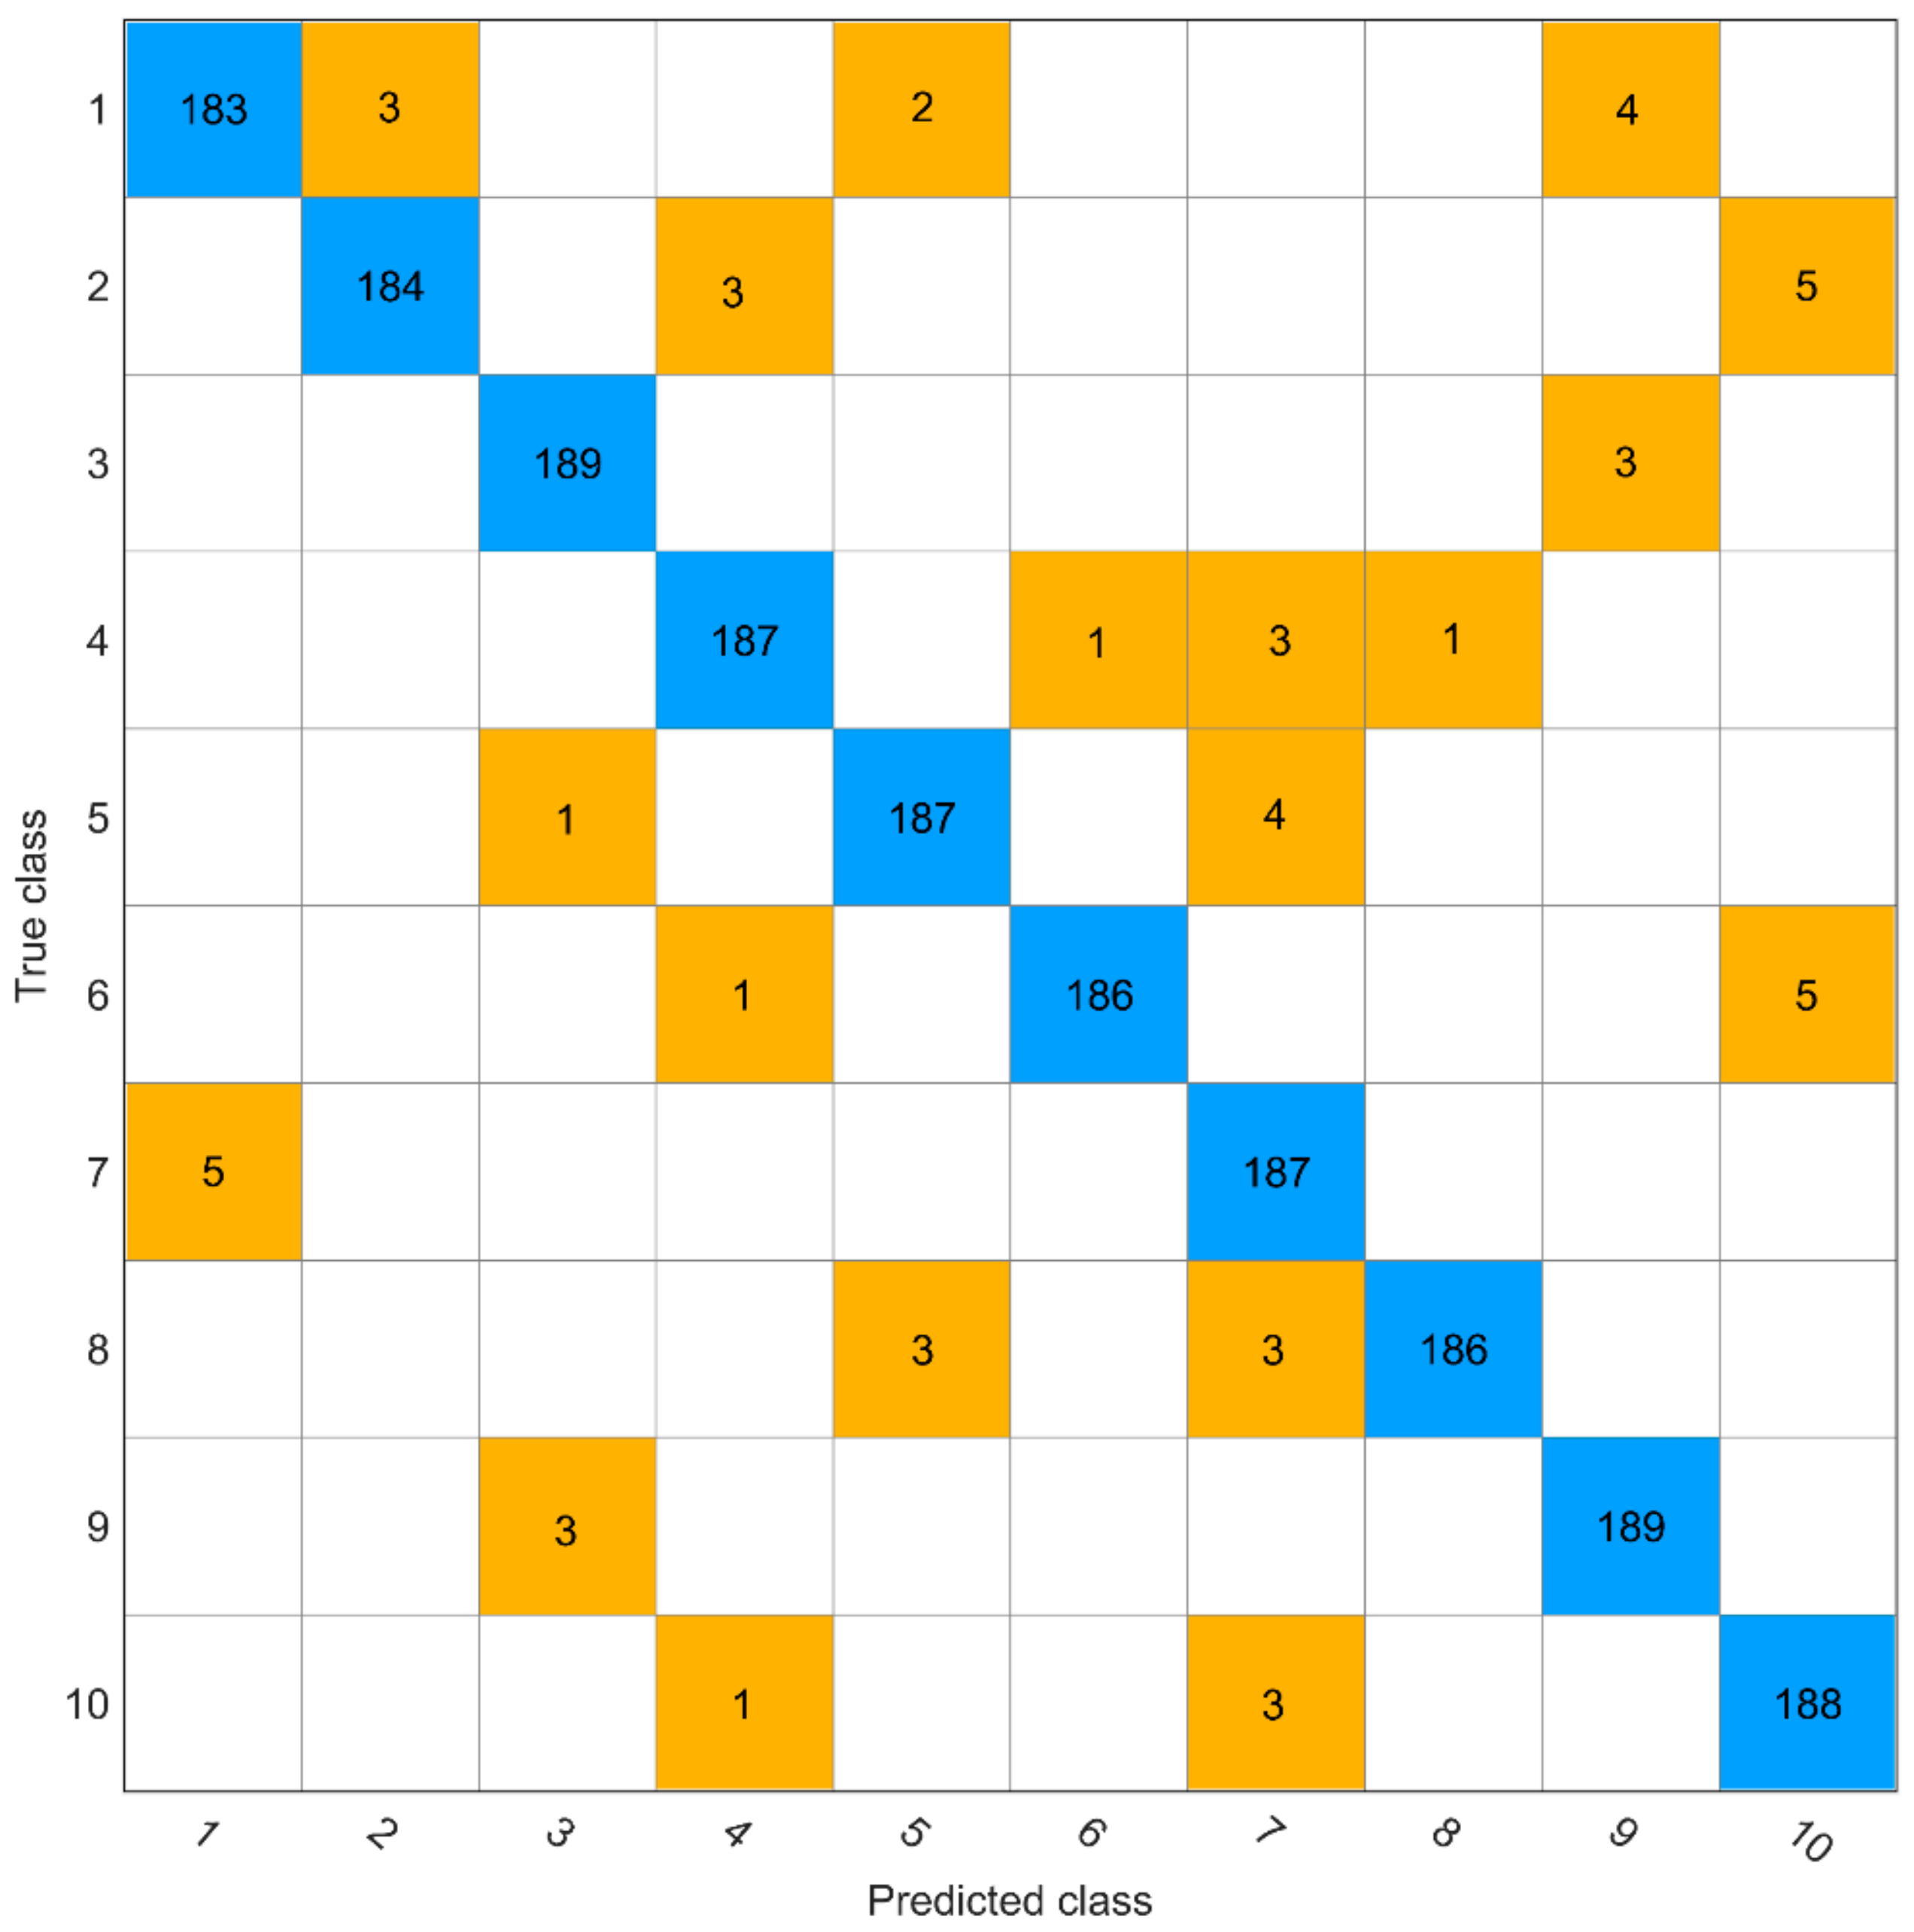
2.2. Test Results
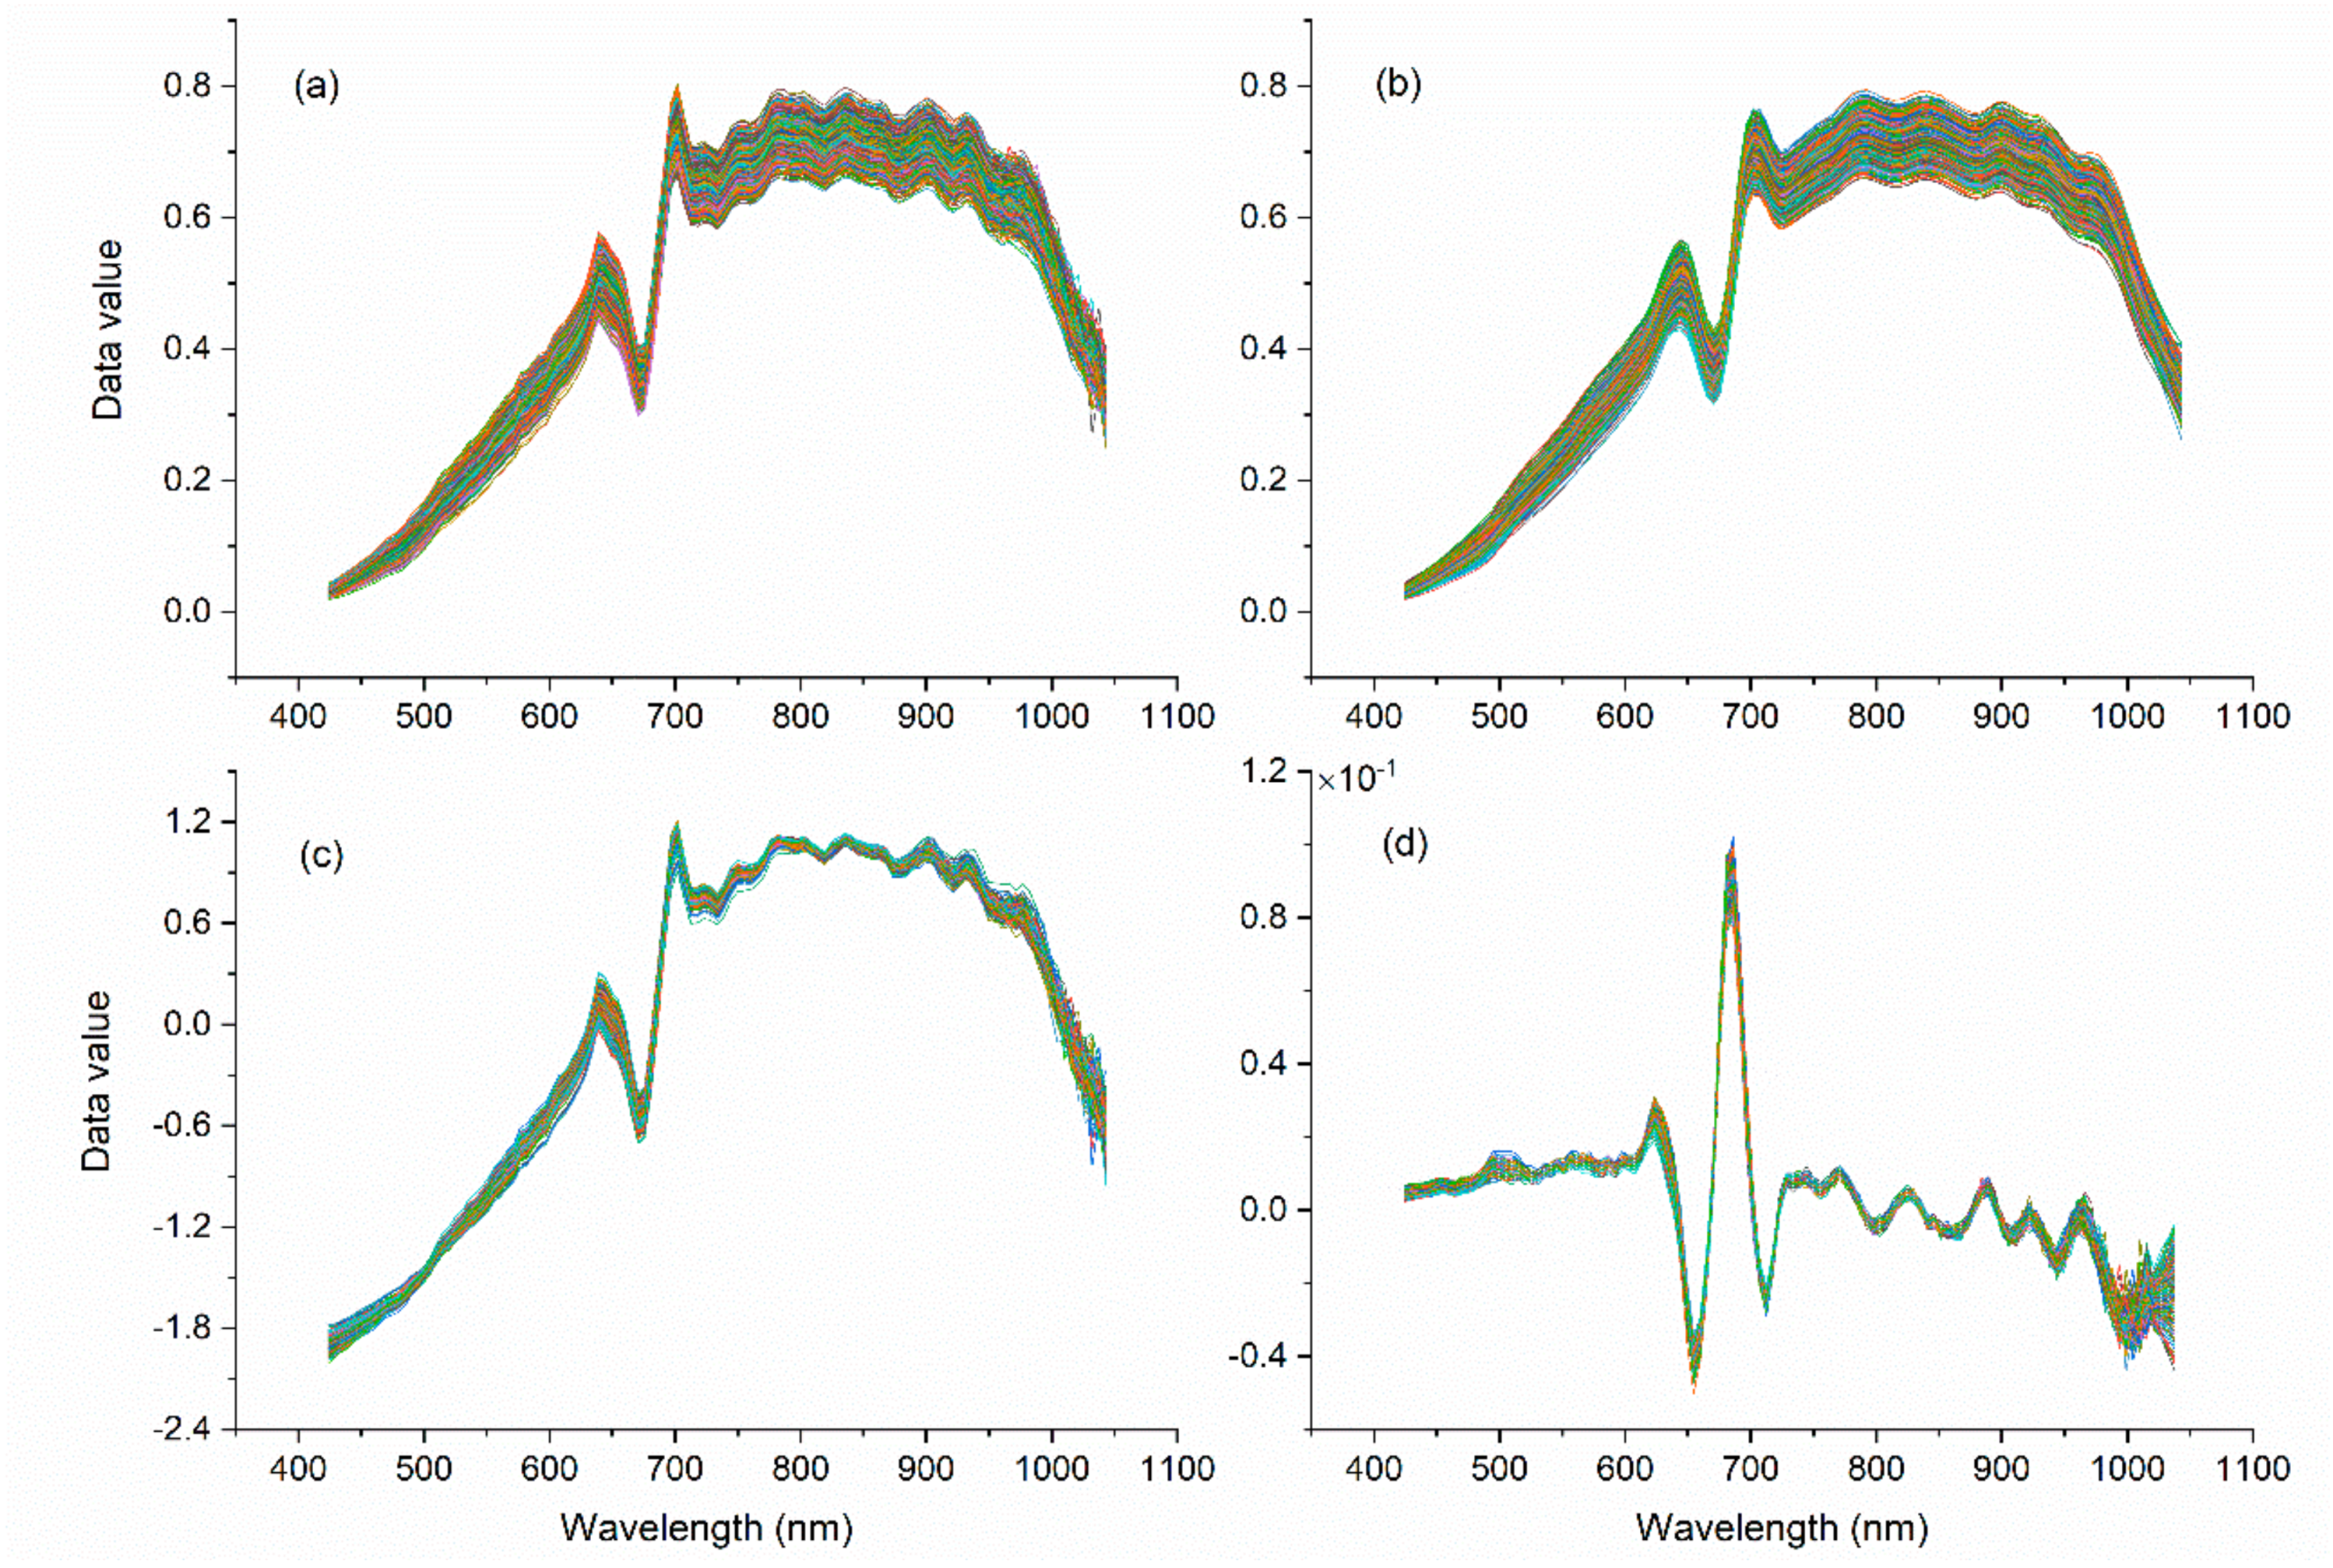
2.3. Spectral Pretreatment Process
2.4. Identification of Models Using Hyperspectral Reflectance
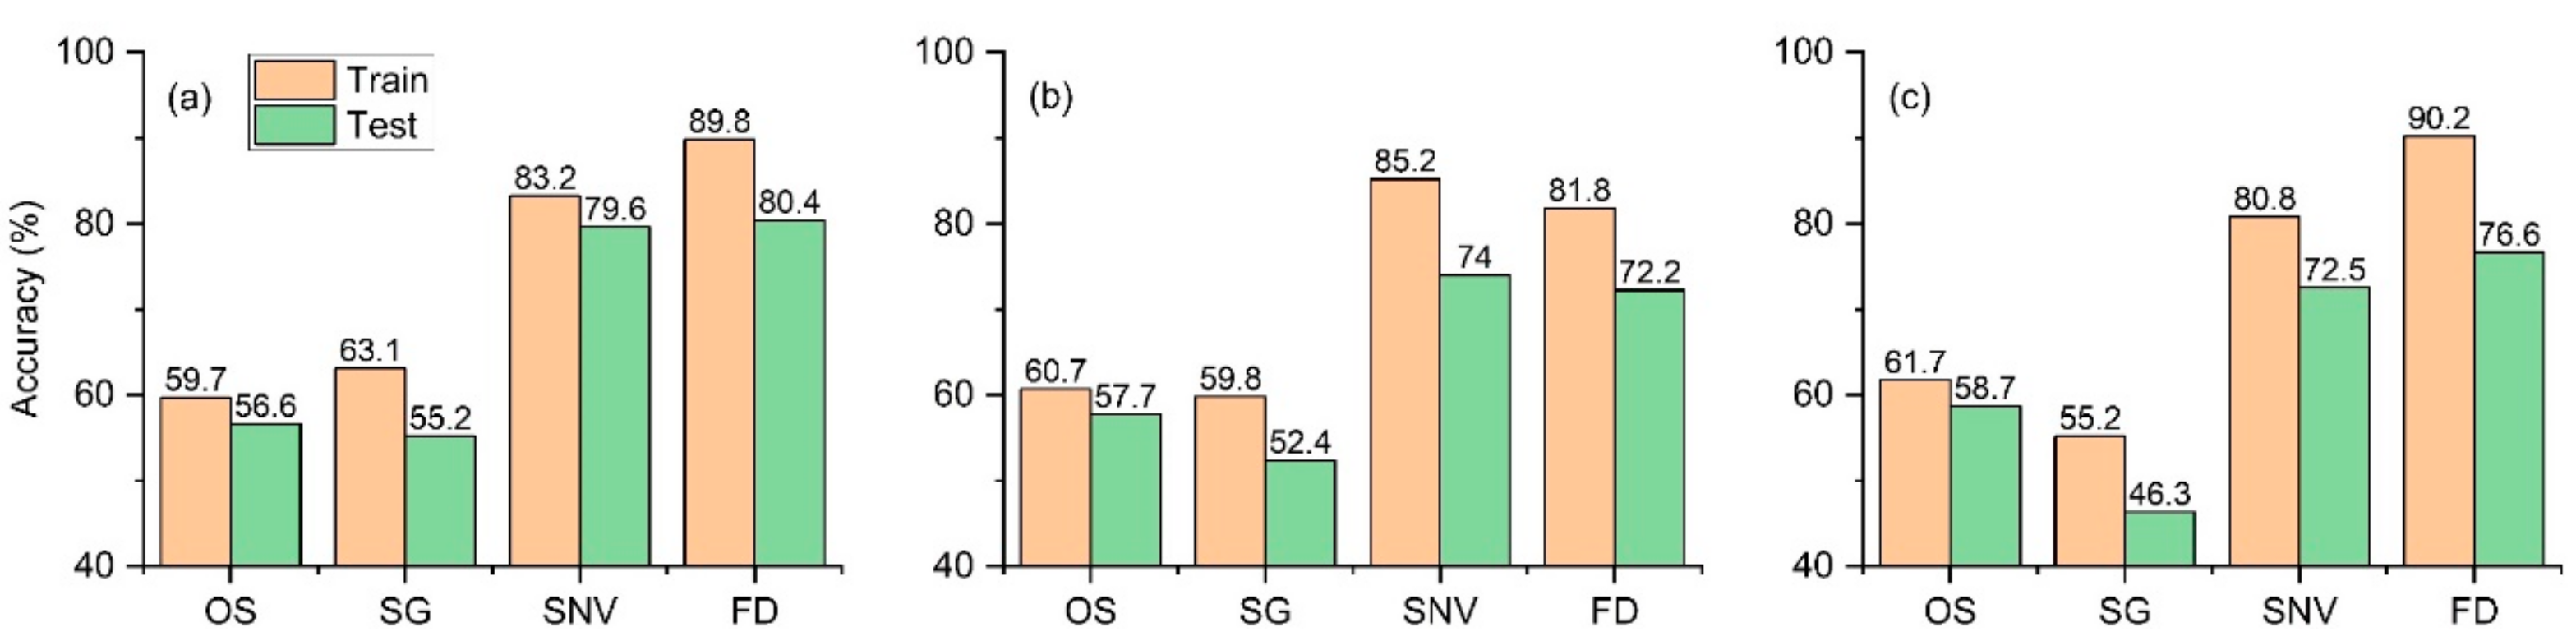
2.5. Comparison Analysis
3. Materials and Methods
3.1. Materials
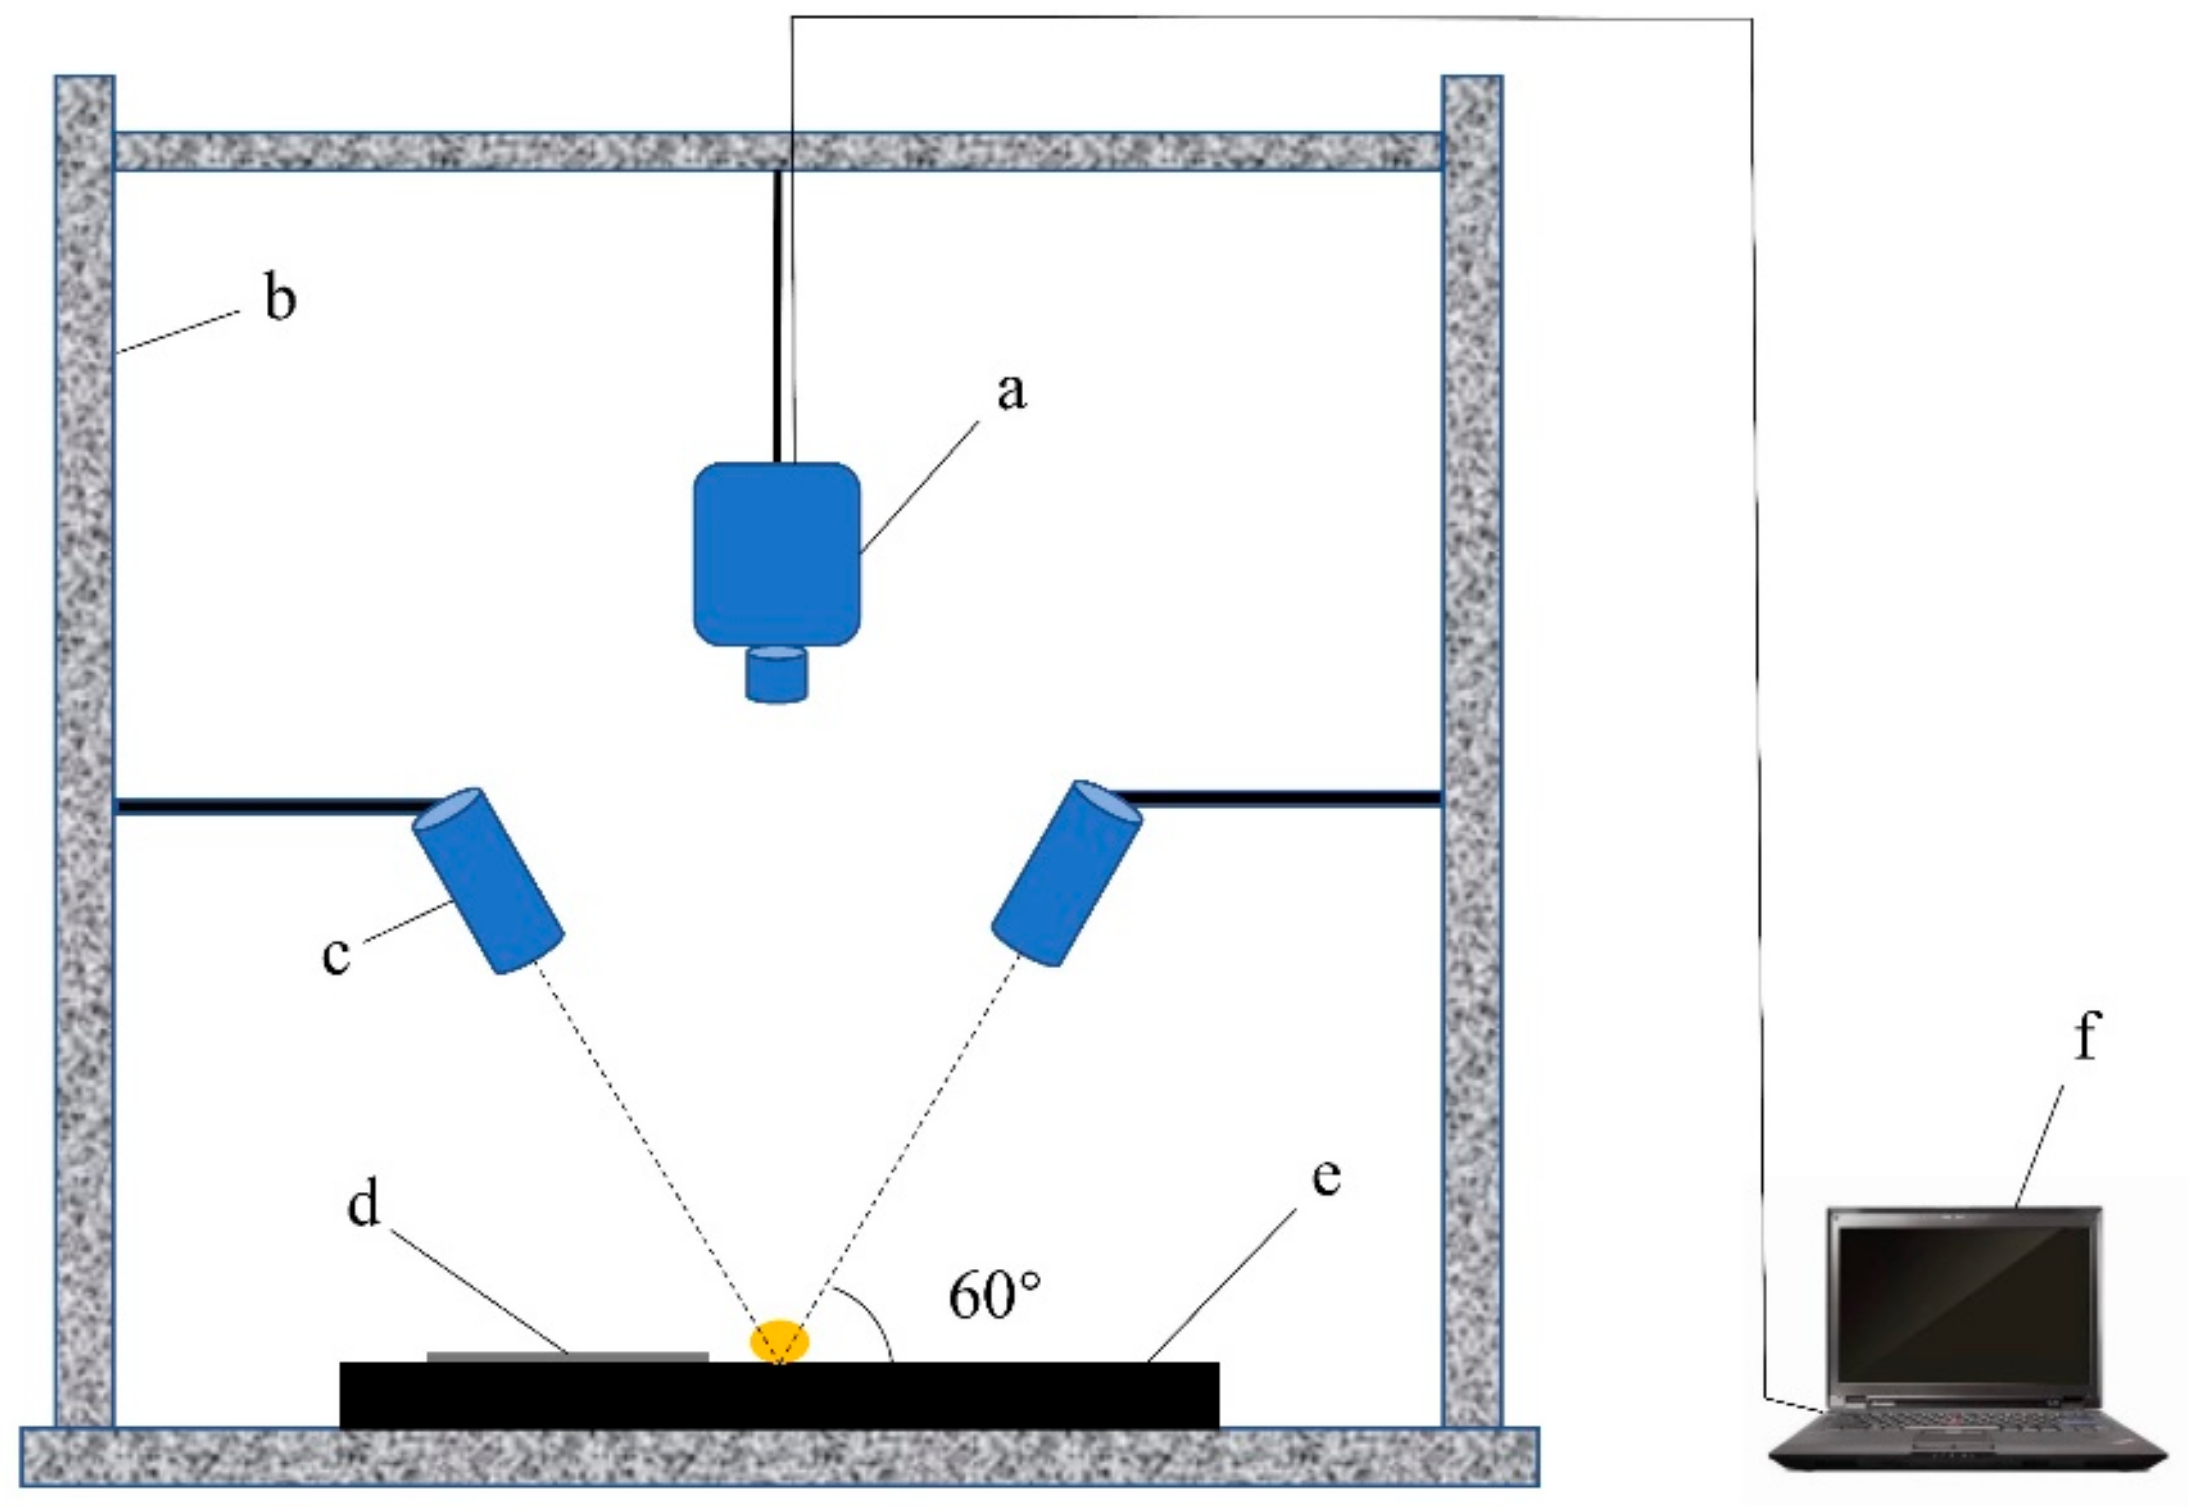
3.2. Equipment
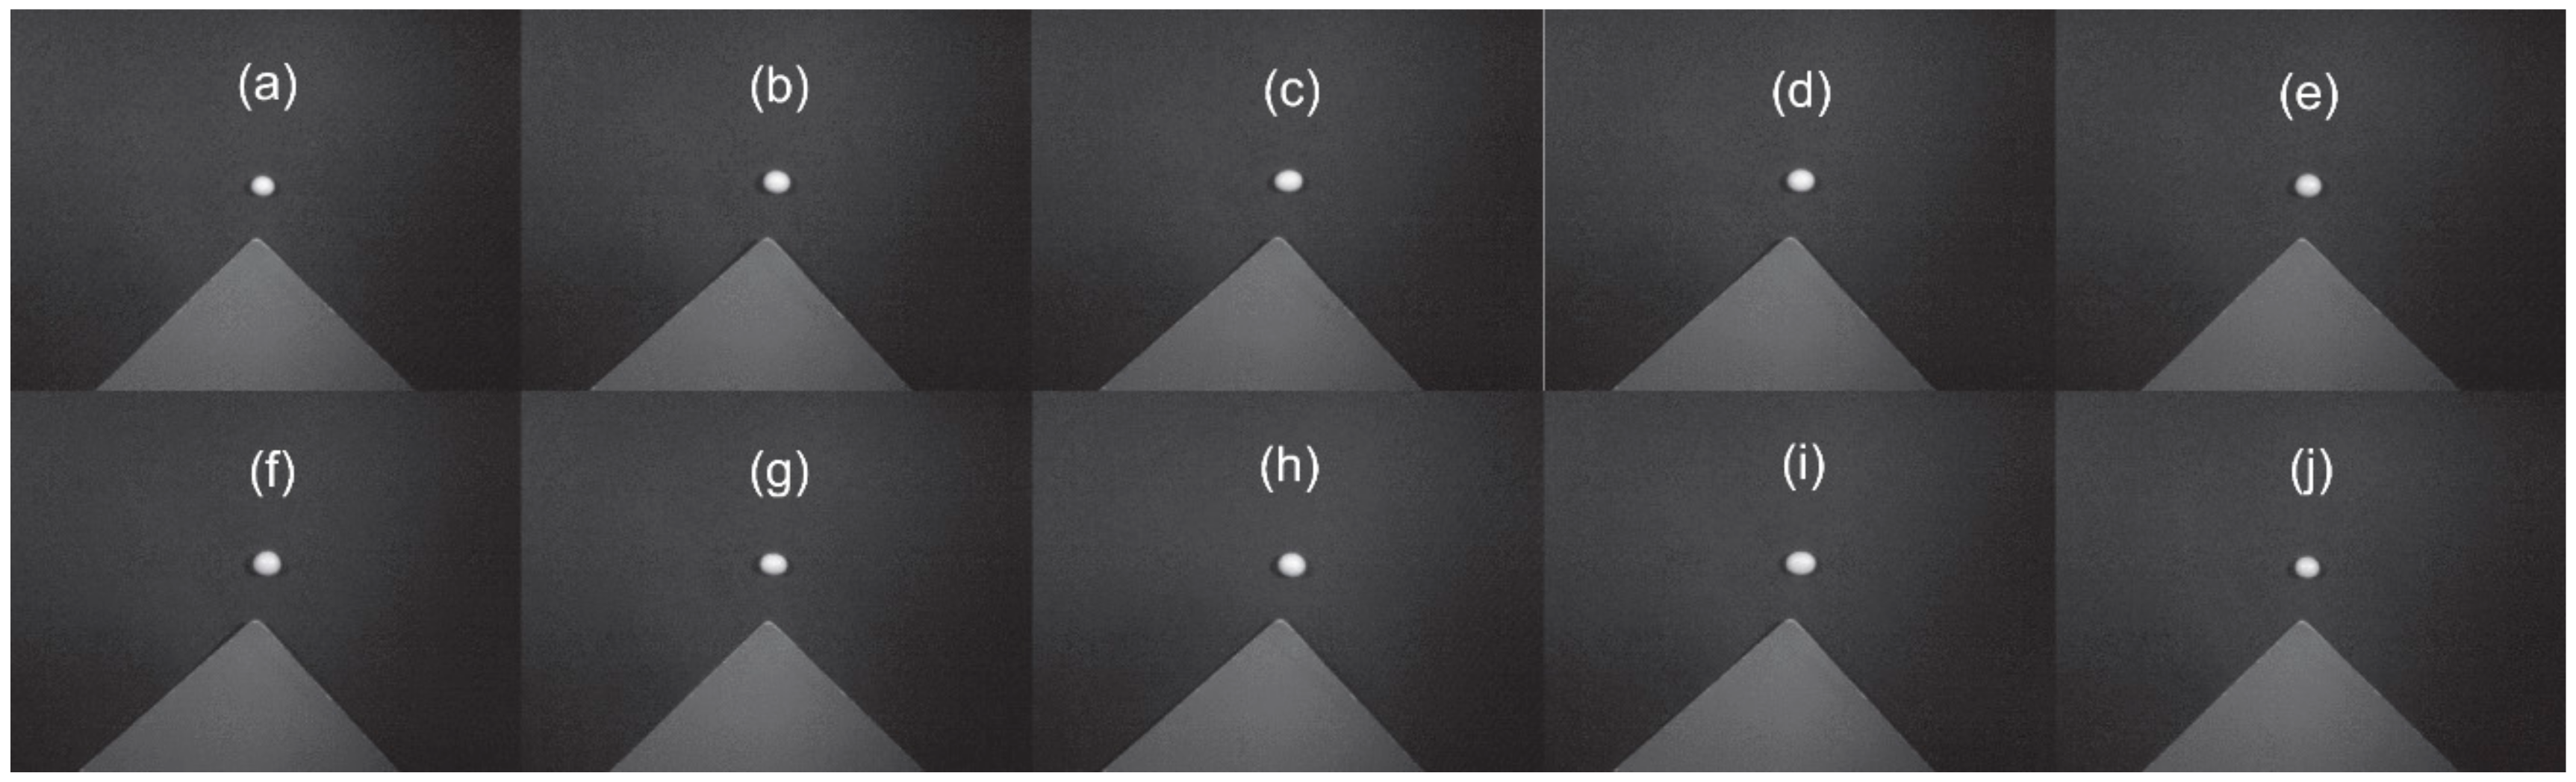
3.3. Hyperspectral Image Acquisition
3.4. Image Preprocessing
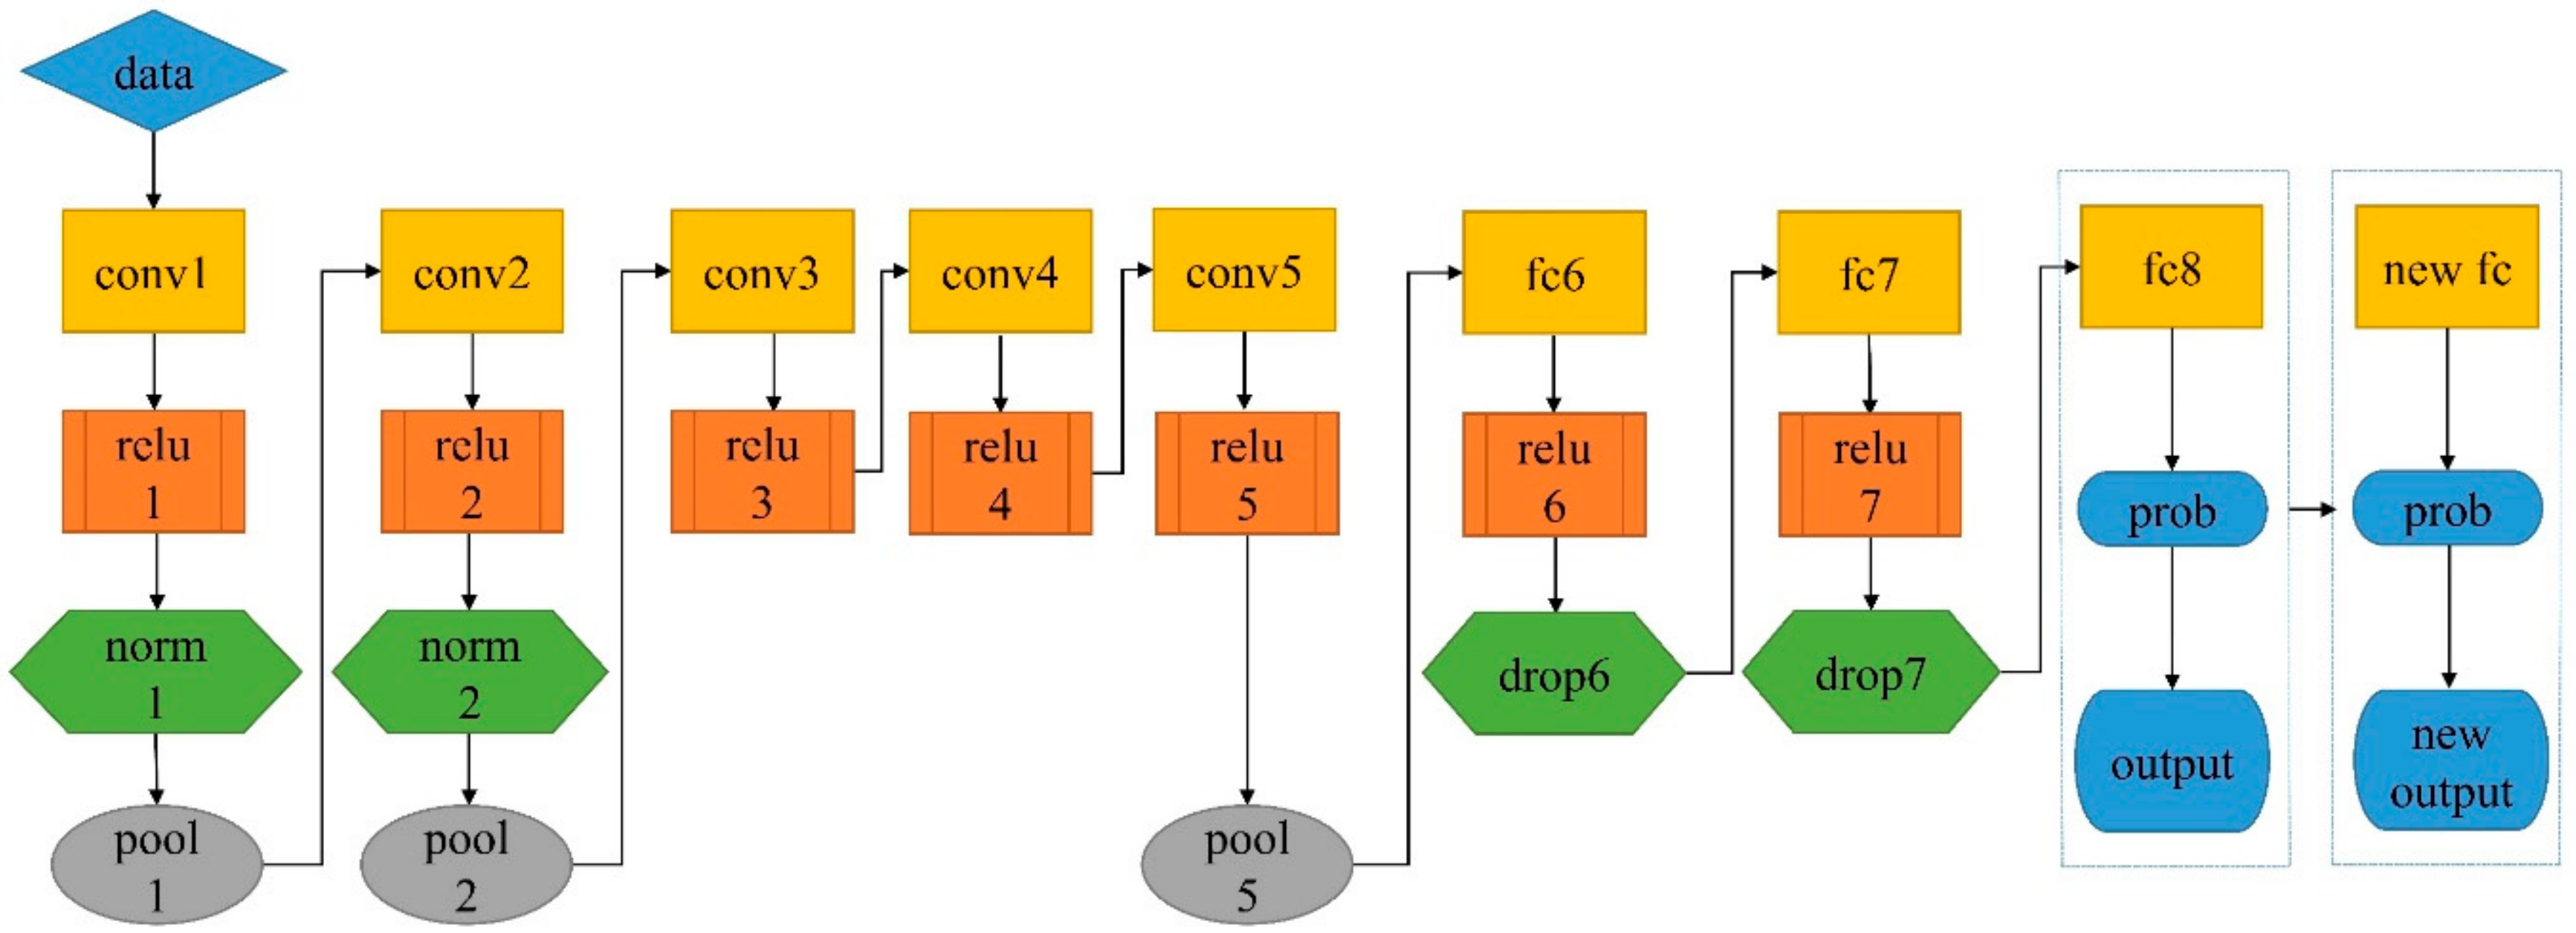
3.5. Pretrained Networks
3.6. Model Parameter Settings
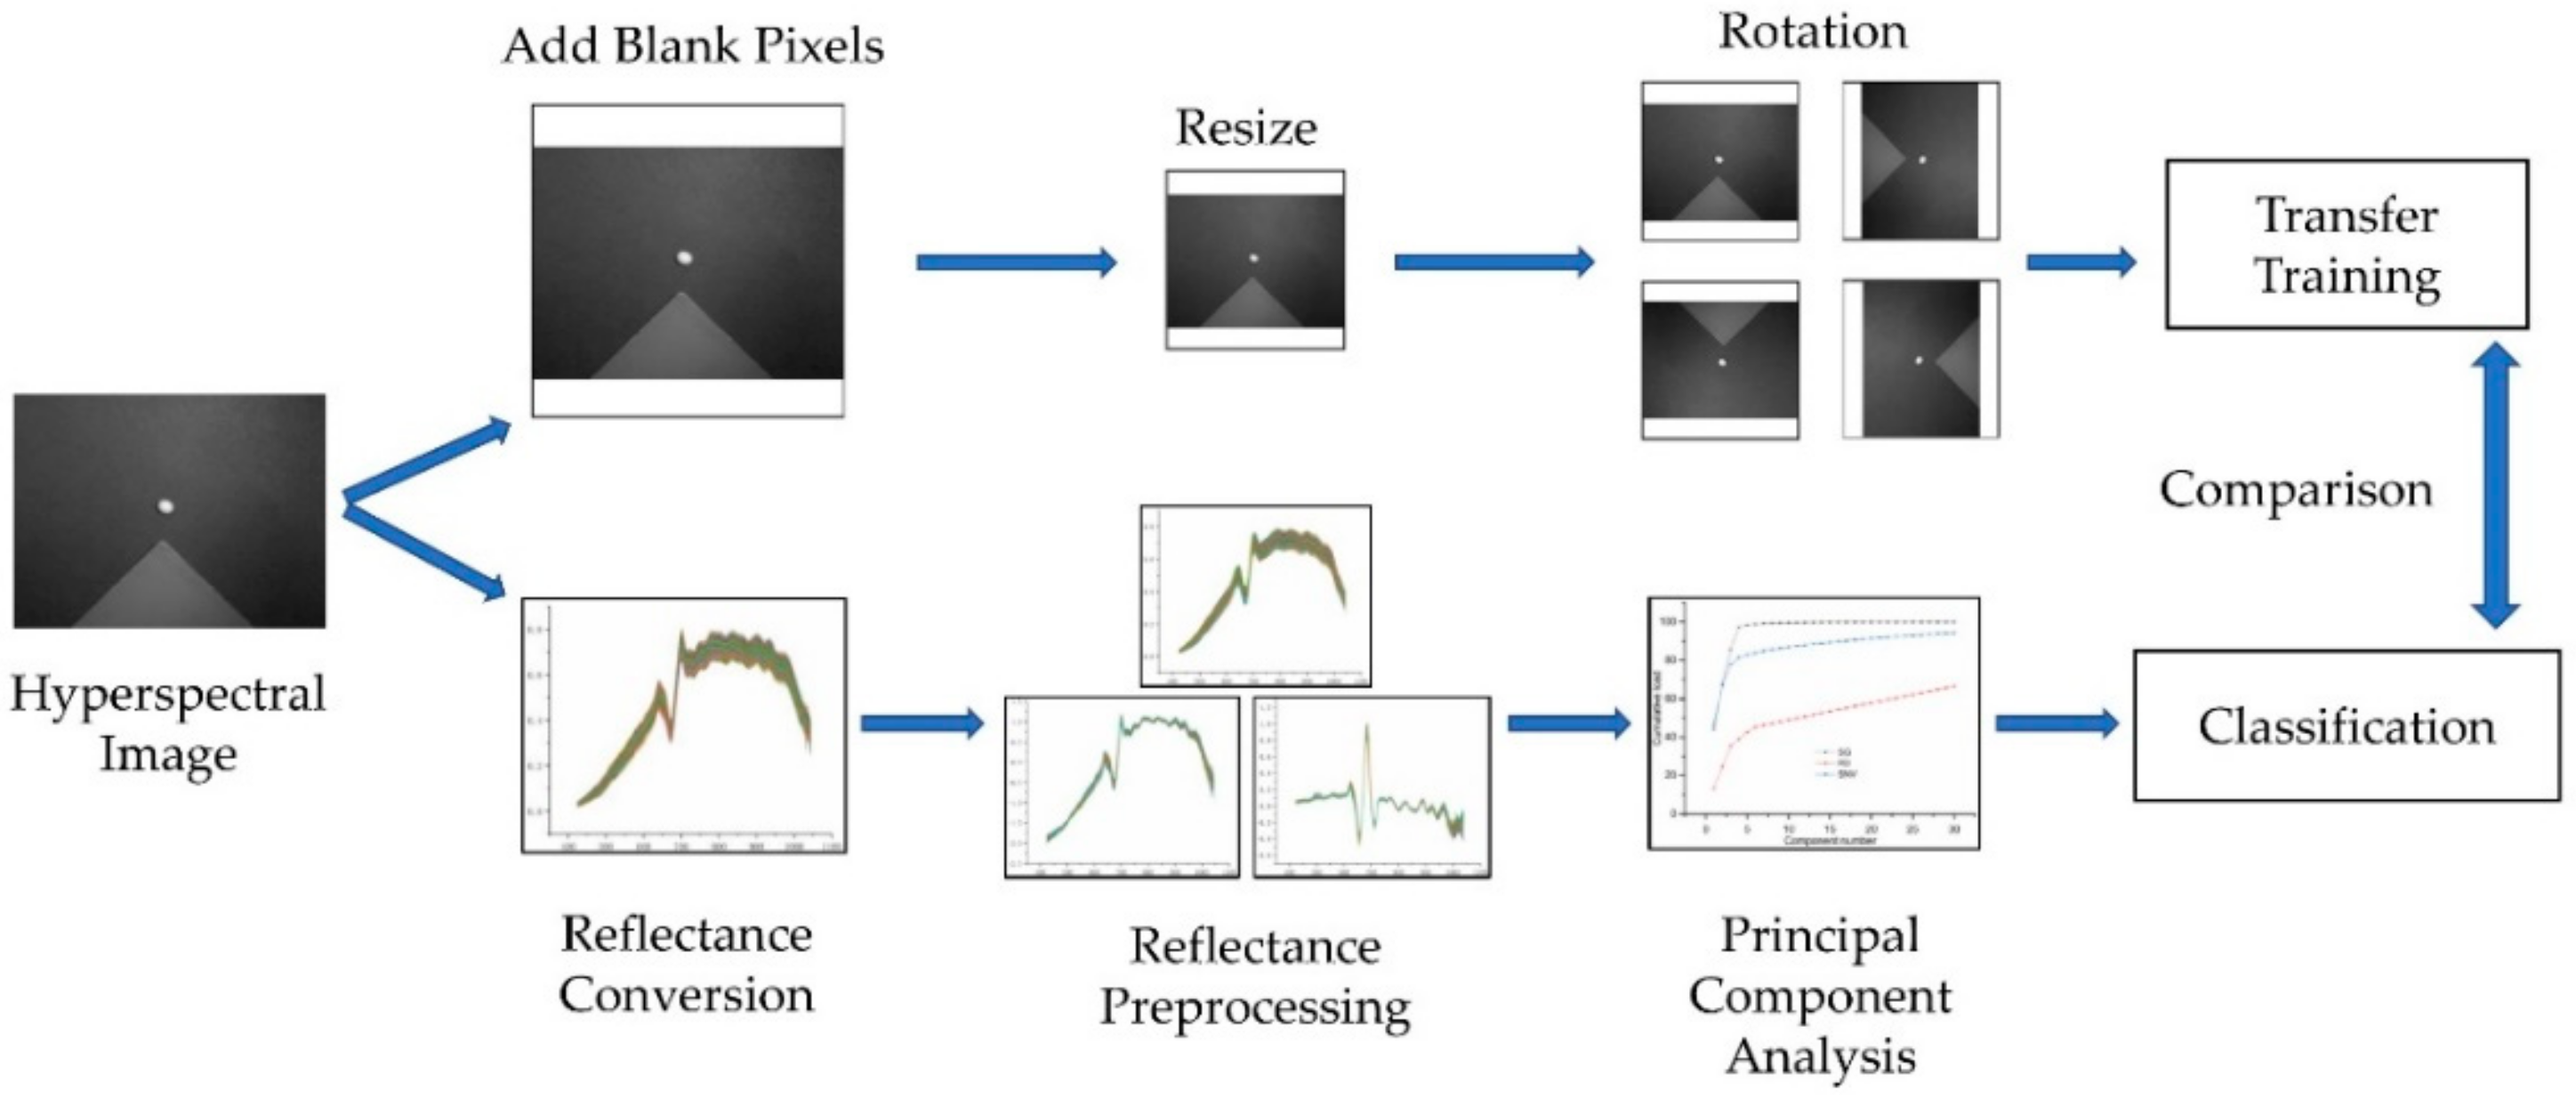
3.7. Comparative Experimental Design
3.7.1. Reflectance Conversion
3.7.2. Reflectance Preprocessing
3.7.3. Principal Component Extraction
3.7.4. Classifier Selection
3.8. Technical Route
4. Conclusions
Author Contributions
Funding
Conflicts of Interest
References
- Zhu, D.Z.; Li, Y.F.; Wang, D.C.; Wu, Q.; Zhang, D.Y.; Wang, C. The Identification of Single Soybean Seed Variety by Laser Light Backscattering Imaging. Sensor. Lett. 2012, 10, 399–404. [Google Scholar] [CrossRef]
- Zhang, C.B.; Peng, B.; Zhang, W.L.; Wang, S.M.; Sun, H.; Dong, Y.S.; Zhao, L.M. Application of ssr Markers for Purity Testing of Commercial Hybrid Soybean (Glycine max L.). J. Agr. Sci. Technol. 2014, 16, 1389–1396. [Google Scholar]
- Iqbal, A.; Sadaqat, H.A.; Khan, A.S.; Amjad, M. Identification of Sunflower (Helianthus annuus, Asteraceae) Hybrids Using Simple-Sequence Repeat Markers. Gen. Mol. Res. 2011, 10, 102–106. [Google Scholar] [CrossRef] [PubMed] [Green Version]
- Rao, P.S.; Bharathi, M.; Reddy, K.B.; Keshavulu, K.; Rao, L.V.S.; Neeraja, C.N. Varietal Identification in Rice (Oryza sativa) through Chemical Tests and Gel Electrophoresis of Soluble Seed Proteins. Indian. J. Agr. Sci. 2012, 82, 304–311. [Google Scholar]
- Livaja, M.; Steinemann, S.; Schon, C.C. Application of Denaturing High-Performance Liquid Chromatography for Rice Variety Identification and Seed Purity Assessment. Mol. Breed. 2016, 36, 1–19. [Google Scholar]
- Kong, W.W.; Zhang, C.; Liu, F.; Nie, P.C.; He, Y. Rice Seed Cultivar Identification Using Near-Infrared Hyperspectral Imaging and Multivariate Data Analysis. Sensors 2013, 13, 8916–8927. [Google Scholar] [CrossRef] [Green Version]
- Yang, X.L.; Hong, H.M.; You, Z.H.; Cheng, F. Spectral and Image Integrated Analysis of Hyperspectral Data for Waxy Corn Seed Variety Classification. Sensors 2015, 15, 15578–15594. [Google Scholar] [CrossRef] [Green Version]
- Liu, J.J.; Li, Z.; Hu, F.R.; Chen, T.; Zhu, A.J. A Thz Spectroscopy Nondestructive Identification Method for Transgenic Cotton Seed Based on Ga-Svm. Opt. Quantum Electron. 2015, 47, 313–322. [Google Scholar] [CrossRef]
- Pourreza, A.; Pourreza, H.; Abbaspour-Fard, M.H.; Sadrnia, H. Identification of Nine Iranian Wheat Seed Varieties by Textural Analysis with Image Processing. Comput. Electron. Agric. 2012, 83, 102–108. [Google Scholar] [CrossRef]
- Boelt, B.; Shrestha, S.; Salimi, Z.; Jorgensen, J.R.; Nicolaisen, M.; Carstensen, J.M. Multispectral imaging—A new tool in seed quality assessment? Seed Sci. Res. 2018, 28, 222–228. [Google Scholar] [CrossRef]
- Kandala, C.V.K.; Govindarajan, K.N.; Puppala, N.; Settaluri, V.; Reddy, R.S. Identification of Wheat Varieties with a Parallel-Plate Capacitance Sensor Using Fisher’s Linear Discriminant Analysis. J. Sens. 2014, 2014, 691898. [Google Scholar] [CrossRef]
- Yu, L.N.; Liu, W.J.; Li, W.J.; Qin, H.; Xu, J.; Zuo, M. Non-Destructive Identification of Maize Haploid Seeds Using Nonlinear Analysis Method Based on their Near-Infrared Spectra. Biosys. Eng. 2018, 172, 144–153. [Google Scholar] [CrossRef]
- Zhu, D.Z.; Wang, K.; Zhou, G.H.; Hou, R.F.; Wang, C. The Nir Spectra Based Variety Discrimination for Single Soybean Seed. Spectrosc. Spect. Anal. 2010, 30, 3217–3221. [Google Scholar]
- Liu, Y.; Wu, T.; Yang, J.J.; Tan, K.Z.; Wang, S.W. Hyperspectral Band Selection for Soybean Classification Based on Information Measure in Frs Theory. Biosys. Eng. 2019, 178, 219–232. [Google Scholar] [CrossRef]
- Zhang, X.L.; Liu, F.; He, Y.; Li, X.L. Application of Hyperspectral Imaging and Chemometric Calibrations for Variety Discrimination of Maize Seeds. Sensors 2012, 12, 17234–17246. [Google Scholar] [CrossRef]
- Zhao, Y.Y.; Zhu, S.S.; Zhang, C.; Feng, X.P.; Feng, L.; He, Y. Application of Hyperspectral Imaging and Chemometrics for Variety Classification of Maize Seeds. RSC Adv. 2018, 8, 1337–1345. [Google Scholar] [CrossRef] [Green Version]
- Huang, M.; He, C.J.; Zhu, Q.B.; Qin, J.W. Maize Seed Variety Classification Using the Integration of Spectral and Image Features Combined with Feature Transformation Based on Hyperspectral Imaging. Appl. Sci. 2016, 6, 183. [Google Scholar] [CrossRef] [Green Version]
- Wang, H.L.; Yang, X.D.; Zhang, C.; Guo, D.Q.; Bao, Y.D.; He, Y.; Liu, F. Fast Identification of Transgenic Soybean Varieties Based near Infrared Hyperspectral Imaging Technology. Spectrosc. Spect. Anal. 2016, 36, 1843–1847. [Google Scholar]
- Liu, C.H.; Liu, W.; Lu, X.Z.; Chen, W.; Yang, J.B.; Zheng, L. Nondestructive Determination of Transgenic Bacillus Thuringiensis Rice Seeds (Oryza sativa L.) Using Multispectral Imaging and Chemometric Methods. Food Chem. 2014, 153, 87–93. [Google Scholar] [CrossRef]
- Liu, W.; Liu, C.H.; Hu, X.H.; Yang, J.B.; Zheng, L. Application of Terahertz Spectroscopy Imaging for Discrimination of Transgenic Rice Seeds with Chemometrics. Food Chem. 2016, 210, 415–421. [Google Scholar] [CrossRef]
- Gao, J.F.; Li, X.L.; Zhu, F.; He, Y. Application of Hyperspectral Imaging Technology to Discriminate Different Geographical Origins of Jatropha curcas L. Seeds. Comput. Electron. Agric. 2013, 99, 186–193. [Google Scholar] [CrossRef]
- Baek, I.; Kim, M.S.; Cho, B.K.; Mo, C.; Barnaby, J.Y.; McClung, A.M.; Oh, M. Selection of Optimal Hyperspectral Wavebands for Detection of Discolored, Diseased Rice Seeds. Appl. Sci. 2019, 9, 1027. [Google Scholar] [CrossRef] [Green Version]
- Chelladurai, V.; Karuppiah, K.; Jayas, D.S.; Fields, P.G.; White, N.D.G. Detection of Callosobruchus maculatus (f.) Infestation in Soybean Using Soft X-ray and Nir Hyperspectral Imaging Techniques. J. Stored Prod. Res. 2014, 57, 43–48. [Google Scholar] [CrossRef]
- Huang, M.; Tang, J.Y.; Yang, B.; Zhu, Q.B. Classification of Maize Seeds of Different Years Based on Hyperspectral Imaging and Model Updating. Comput. Electron. Agric. 2016, 122, 139–145. [Google Scholar] [CrossRef]
- He, X.T.; Feng, X.P.; Sun, D.W.; Liu, F.; Bao, Y.D.; He, Y. Rapid and Nondestructive Measurement of Rice Seed Vitality of Different Years Using Near-Infrared Hyperspectral Imaging. Molecules 2019, 24, 2227. [Google Scholar] [CrossRef] [Green Version]
- Shrestha, S.; Knapic, M.; Zibrat, U.; Deleuran, L.C.; Gislum, R. Single Seed Near-Infrared Hyperspectral Imaging in Determining Tomato (Solanum lycopersicum L.) Seed Quality in Association with Multivariate Data Analysis. Sens. Actuators B Chem. 2016, 237, 1027–1034. [Google Scholar] [CrossRef]
- Baek, I.; Kusumaningrum, D.; Kandpal, L.M.; Lohumi, S.; Mo, C.; Kim, M.S.; Cho, B.K. Rapid Measurement of Soybean Seed Viability Using Kernel-Based Multispectral Image Analysis. Sensors 2019, 19, 271. [Google Scholar] [CrossRef] [Green Version]
- Agelet, L.E.; Ellis, D.D.; Duvick, S.; Goggi, A.S.; Hurburgh, C.R.; Gardner, C.A. Feasibility of Near Infrared Spectroscopy for Analyzing Corn Kernel Damage and Viability of Soybean and Corn Kernels. J. Cereal Sci. 2012, 55, 160–165. [Google Scholar] [CrossRef] [Green Version]
- Kandpal, L.M.; Lohumi, S.; Kim, M.S.; Kang, J.S.; Cho, B.K. Near-Infrared Hyperspectral Imaging System Coupled with Multivariate Methods to Predict Viability and Vigor in Muskmelon Seeds. Sens. Actuators B Chem. 2016, 229, 534–544. [Google Scholar] [CrossRef]
- Shetty, N.; Min, T.G.; Gislum, R.; Olesen, M.H.; Boelt, B. Optimal Sample Size for Predicting Viability of Cabbage and Radish Seeds Based on Near Infrared Spectra of Single Seeds. J. Near Infrared Spectrosc. 2011, 19, 451–461. [Google Scholar] [CrossRef]
- Kurtulmus, F.; Alibas, I.; Kavdir, I. Classification of Pepper Seeds Using Machine Vision Based on Neural Network. Int. J. Agric. Biol. Eng. 2016, 9, 51–62. [Google Scholar]
- Huang, K.Y.; Chien, M.C. A Novel Method of Identifying Paddy Seed Varieties. Sensors 2017, 17, 809. [Google Scholar] [CrossRef] [PubMed]
- Chaugule, A.A.; Mali, S.N. Identification of Paddy Varieties Based on Novel Seed Angle Features. Comput. Electron. Agric. 2016, 123, 415–422. [Google Scholar] [CrossRef]
- Ran, H.; Cui, Y.J.; Jin, Z.X.; Yan, Y.L.; An, D. Identification of Maize Seed Purity Based on Spectral Images of a Small Amount of Near Infrared Bands. Spectrosc. Spect. Anal. 2017, 37, 2743–2750. [Google Scholar]
- Jordan, M.I.; Mitchell, T.M. Machine learning: Trends, Perspectives, and Prospects. Science 2015, 349, 255–260. [Google Scholar] [CrossRef]
- Barbedo, J.G.A. Plant Disease Identification from Individual Lesions and Spots Using Deep Learning. Biosys. Eng. 2019, 180, 96–107. [Google Scholar] [CrossRef]
- Barbedo, J.G.A. Impact of Dataset Size and Variety on the Effectiveness of Deep Learning and Transfer Learning for Plant Disease Classification. Comput. Electron. Agric. 2018, 153, 46–53. [Google Scholar] [CrossRef]
- DeChant, C.; Wiesner-Hanks, T.; Chen, S.Y.; Stewart, E.L.; Yosinski, J.; Gore, M.A.; Nelson, R.J.; Lipson, H. Automated Identification of Northern Leaf Blight-Infected Maize Plants from Field Imagery Using Deep Learning. Phytopathology 2017, 107, 1426–1432. [Google Scholar] [CrossRef] [Green Version]
- Shen, R.P.; Huang, A.Q.; Li, B.L.; Guo, J. Construction of a Drought Monitoring Model Using Deep Learning Based on Multi-Source Remote Sensing Data. Int. J. Appl. Earth Obs. 2019, 79, 48–57. [Google Scholar] [CrossRef]
- Jin, B.X.; Ye, P.; Zhang, X.Y.; Song, W.W.; Li, S.H. Object-Oriented Method Combined with Deep Convolutional Neural Networks for Land-Use-Type Classification of Remote Sensing Images. J. Indian Soc. Remote Sens. 2019, 47, 951–965. [Google Scholar] [CrossRef] [Green Version]
- Rasti, P.; Ahmad, A.; Samiei, S.; Belin, E.; Rousseau, D. Supervised Image Classification by Scattering Transform with Application to Weed Detection in Culture Crops of High Density. Remote. Sens. 2019, 11, 249. [Google Scholar] [CrossRef] [Green Version]
- Zhu, S.S.; Zhou, L.; Gao, P.; Bao, Y.D.; He, Y.; Feng, L. Near-Infrared Hyperspectral Imaging Combined with Deep Learning to Identify Cotton Seed Varieties. Molecules 2019, 24, 3268. [Google Scholar] [CrossRef] [Green Version]
- Wu, N.; Zhang, Y.; Na, R.S.; Mi, C.X.; Zhu, S.S.; He, Y.; Zhang, C. Variety Identification of Oat Seeds Using Hyperspectral Imaging: Investigating the Representation Ability of Deep Convolutional Neural Network. RSC Adv. 2019, 9, 12635–12644. [Google Scholar] [CrossRef] [Green Version]
- Qiu, Z.J.; Chen, J.; Zhao, Y.Y.; Zhu, S.S.; He, Y.; Zhang, C. Variety Identification of Single Rice Seed Using Hyperspectral Imaging Combined with Convolutional Neural Network. Appl. Sci. 2018, 8, 212. [Google Scholar] [CrossRef] [Green Version]
- Lu, S.Y.; Lu, Z.H.; Zhang, Y.D. Pathological Brain Detection Based on Alexnet and Transfer Learning. J. Comput. Sci. 2019, 30, 41–47. [Google Scholar] [CrossRef]
- Suh, H.K.; Ijsselmuiden, J.; Hofstee, J.W.; van Henten, E.J. Transfer Learning for the Classification of Sugar Beet and Volunteer Potato under Field Conditions. Biosyst. Eng. 2018, 174, 50–65. [Google Scholar] [CrossRef]
- Marmanis, D.; Datcu, M.; Esch, T.; Stilla, U. Deep Learning Earth Observation Classification Using Imagenet Pretrained Networks. IEEE Geosci. Remote Sens. 2016, 13, 105–109. [Google Scholar] [CrossRef] [Green Version]
- Pan, S.J.; Yang, Q.A. A Survey on Transfer Learning. IEEE Trans. Knowl. Data Eng. 2010, 22, 1345–1359. [Google Scholar] [CrossRef]
- Cheng, X.; Zhang, Y.H.; Chen, Y.Q.; Wu, Y.Z.; Yue, Y. Pest Identification via Deep Residual Learning in Complex Background. Comput. Electron. Agric. 2017, 141, 351–356. [Google Scholar] [CrossRef]
- Boulent, J.; Foucher, S.; Theau, J.; St-Charles, P.L. Convolutional Neural Networks for the Automatic Identification of Plant Diseases. Front. Plant Sci. 2019, 10, 941. [Google Scholar] [CrossRef] [Green Version]
- Motta, D.; Santos, A.A.B.; Winkler, I.; Machado, B.A.S.; Pereira, D.; Cavalcanti, A.M.; Fonseca, E.O.L.; Kirchner, F.; Badaro, R. Application of Convolutional Neural Networks for Classification of Adult Mosquitoes in the Field. PLoS ONE 2019, 14, e0210829. [Google Scholar] [CrossRef] [PubMed] [Green Version]
- Milella, A.; Marani, R.; Petitti, A.; Reina, G. In-field High Throughput Grapevine Phenotyping with a Consumer-Grade Depth Camera. Comput. Electron. Agric. 2019, 156, 293–306. [Google Scholar] [CrossRef]
- Heravi, E.J.; Aghdam, H.H.; Puig, D. An optimized Convolutional Neural Network with Bottleneck and Spatial Pyramid Pooling Layers for Classification of Foods. Pattern Recognit. Lett. 2018, 105, 50–58. [Google Scholar] [CrossRef]
- Altuntas, Y.; Comert, Z.; Kocamaz, A.F. Identification of Haploid and Diploid Maize Seeds Using Convolutional Neural Networks and a Transfer Learning Approach. Comput. Electron. Agric. 2019, 163, 104874. [Google Scholar] [CrossRef]
- Feng, L.; Zhu, S.S.; Zhang, C.; Bao, Y.D.; Gao, P.; He, Y. Variety Identification of Raisins Using Near-Infrared Hyperspectral Imaging. Molecules 2018, 23, 2907. [Google Scholar] [CrossRef] [Green Version]
- Liu, W.J.; Li, W.J.; Li, H.G.; Qin, H.; Ning, X. Research on the Method of Identifying Maize Haploid Based on kpca and Near Infrared. Spectrosc. Spect. Anal. 2017, 37, 2024–2027. [Google Scholar]
- Yang, S.; Zhu, Q.B.; Huang, M.; Qin, J.W. Hyperspectral Image-Based Variety Discrimination of Maize Seeds by Using A Multi-Model Strategy Coupled with Unsupervised Joint Skewness-Based Wavelength Selection Algorithm. Food Anal. Methods 2017, 10, 424–433. [Google Scholar] [CrossRef]
- Nie, P.C.; Zhang, J.N.; Feng, X.P.; Yu, C.L.; He, Y. Classification of Hybrid Seeds Using Near-Infrared Hyperspectral Imaging Technology Combined with Deep Learning. Sens. Actuators B Chem. 2019, 296, UNSP 126630. [Google Scholar] [CrossRef]
- Krizhevsky, A.; Sutskever, I.; Hinton, G.E. Imagenet Classification with Deep Convolutional Neural Networks. Commun. ACM 2017, 60, 84–90. [Google Scholar] [CrossRef]
Sample Availability: Samples of the compounds are available from the authors. |


| Variety | Seed Type | Luster | Hilum Color | 100-Seed Weight (g) | Crude Protein (%) | Crude Fat (%) |
|---|---|---|---|---|---|---|
| Nannong 1606 | circular | yes | brown | 15.4 | 36.0 | 19.7 |
| Shangdou 161 | circular | yes | brown | 21.6 | 35.6 | 19.6 |
| Shangdou 1201 | oval | yes | brown | 19.1 | 43.1 | 20.2 |
| Shangdou 1310 | oval | weak | pale brown | 18.0 | 42.1 | 20.5 |
| Yudou 18 | circular | yes | brown | 16.8 | 44.5 | 18.8 |
| Yudou 22 | circular | yes | pale brown | 19.3 | 46.5 | 18.9 |
| Yudou 25 | circular | yes | brown | 18.4 | 46.3 | 17.1 |
| Zheng 196 | circular | weak | pale brown | 17.4 | 40.7 | 19.5 |
| Zheng 3074 | flat oval | weak | pale brown | 19.7 | 40.9 | 17.1 |
| Zheng 9525 | circular | yes | pale brown | 21.7 | 45.0 | 17.7 |
| Network | Image Input Size | Layers | Network | Image Input Size | Layers |
|---|---|---|---|---|---|
| AlexNet | 227-by-227-by-3 | 25 | InceptionV3 | 229-by-229-by-3 | 316 |
| ResNet18 | 224-by-224-by-3 | 72 | DenseNet201 | 224-by-224-by-3 | 709 |
| Xception | 229-by-229-by-3 | 171 | NASNetLarge | 331-by-331-by-3 | 1244 |
| Parameters | Values | Parameters | Values |
|---|---|---|---|
| Momentum | 0.9 | Max epochs | 10 |
| Initial learn rate | 0.0001 | Mini batch size | 10 |
| Initial learn schedule | Piecewise | Shuffle | Every-epoch |
| Learn rate drop period | 10 | Validation frequency | 200 |
| Learn rate drop factor | 0.1 | Sequence length | Longest |
| L2regularization | 0.0001 | Gradient threshold method | Global-l2norm |
| Classifiers | Parameters | Values |
|---|---|---|
| GS-SVM | Kernel function | Linear kernel |
| Grid c/g bound | −8–8 | |
| Grid c/g step | 0.5 | |
| EL | Ensemble method | AdaBoost |
| Learning rate | 0.1 | |
| Number of learners | 30 | |
| ANN | Type of neural network | Back propagation |
| Number of hidden neurons | 15 | |
| Training function | Traingdm |
© 2019 by the authors. Licensee MDPI, Basel, Switzerland. This article is an open access article distributed under the terms and conditions of the Creative Commons Attribution (CC BY) license (http://creativecommons.org/licenses/by/4.0/).
Share and Cite
Zhu, S.; Zhang, J.; Chao, M.; Xu, X.; Song, P.; Zhang, J.; Huang, Z. A Rapid and Highly Efficient Method for the Identification of Soybean Seed Varieties: Hyperspectral Images Combined with Transfer Learning. Molecules 2020, 25, 152. https://0-doi-org.brum.beds.ac.uk/10.3390/molecules25010152
Zhu S, Zhang J, Chao M, Xu X, Song P, Zhang J, Huang Z. A Rapid and Highly Efficient Method for the Identification of Soybean Seed Varieties: Hyperspectral Images Combined with Transfer Learning. Molecules. 2020; 25(1):152. https://0-doi-org.brum.beds.ac.uk/10.3390/molecules25010152
Chicago/Turabian StyleZhu, Shaolong, Jinyu Zhang, Maoni Chao, Xinjuan Xu, Puwen Song, Jinlong Zhang, and Zhongwen Huang. 2020. "A Rapid and Highly Efficient Method for the Identification of Soybean Seed Varieties: Hyperspectral Images Combined with Transfer Learning" Molecules 25, no. 1: 152. https://0-doi-org.brum.beds.ac.uk/10.3390/molecules25010152