Article

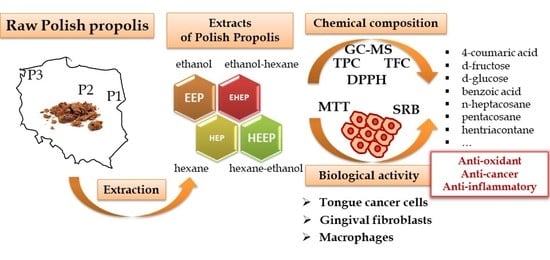
Polish Propolis—Chemical Composition and Biological Effects in Tongue Cancer Cells and Macrophages

1
Department of Experimental Dentistry, Wroclaw Medical University, 50-425 Wroclaw, Poland
2
Department of Engineering and Technology of Chemical Processes, Wroclaw University of Science and Technology, 50-370 Wroclaw, Poland
3
Institute of Genetics and Microbiology, University of Wroclaw, 51-148 Wroclaw, Poland
4
Department of Prosthetic Dentistry, Wroclaw Medical University, 50-425 Wroclaw, Poland
5
Department of Molecular and Cellular Biology, Wroclaw Medical University, 50-556 Wroclaw, Poland
6
Department of Chemistry, Wroclaw University of Environmental and Life Sciences, 50-375 Wroclaw, Poland
*
Authors to whom correspondence should be addressed.
Submission received: 14 April 2020 / Revised: 19 May 2020 / Accepted: 20 May 2020 / Published: 22 May 2020
(This article belongs to the Special Issue Anticancer Properties of Natural and Derivative Products)

Abstract

:
The purpose of this study was to compare the chemical composition and biological properties of Polish propolis. Ethanol, ethanol-hexane, hexane and hexane-ethanol extracts of propolis from three different regions of Poland were prepared. On the basis of the evaluation of their chemical composition as well as the extraction yield and free radical scavenging activity, the ethanol and hexane-ethanol extractions were proposed as the most effective methods. Subsequently, the biological properties of the extracts were evaluated to investigate the selectivity of an anticancer effect on tongue cancer cells in comparison to normal gingival fibroblasts. The obtained products demonstrated anticancer activity against tongue cancer cells. Additionally, when the lowest extract concentration (100 µg/mL) was applied, they were not cytotoxic to gingival fibroblasts. Finally, a possible anti-inflammatory potential of the prepared products was revealed, as reduced mitochondrial activity and proliferation of macrophages exposed to the extracts were observed. The results obtained indicate a potential of Polish propolis as a natural product with cancer-selective toxicity and anti-inflammatory effect. However, further studies are still needed to thoroughly explain the molecular mechanisms of its action and to obtain the promising health benefits of this versatile natural product.

Graphical Abstract

1. Introduction

Nature, as an immemorial source of diverse active molecules, continues to serve as a major inspiration for drug development. Therapeutic applications of natural products offer great opportunities for modern medicine, while being simultaneously a huge challenge due to the problem of standardization procedures and the chemical complexity of these substances. On the other hand, such complexity is inevitable and a final therapeutic effect of a whole extract in general is better than effects of individual compounds since it results from the synergistic activity of the extract components [1].
One of the most attractive natural products is propolis—the resinous substance collected by bees from plants and mixed with wax and enzymes. It is then used to strengthen and protect their hives as well as to prevent decomposition of intruders’ carcasses. People have also widely used propolis in folk medicine, as it is known for a broad spectrum of biological properties including antibacterial, antifungal, antiviral, anti-inflammatory, antioxidant and anticancer activity [2]. Nowadays, it is used in the cosmetics industry, i.e., as a component of anti-acne creams and products for oral hygiene [3]. However, the therapeutic potential of propolis is still untapped and many research groups continue investigation of a chemical composition and biological properties of this material. The studies revealed a variability in propolis composition depending on the geographical region of collection and the plant sources. For instance, bud exudates of different poplar buds are the main source of propolis collected in the temperate zone, including Europe [4]. Silva-Carvalho et al. reported that poplar propolis is mainly composed of flavonoids, phenolic acids and its esters [3].
In particular, contemporary oral medicine may benefit from the wide spectrum of propolis activities. Many dental specialties which make use of this natural product have been reported [5]. Research on Polish propolis is mainly focused on its antimicrobial properties [6,7,8,9,10,11]. Interestingly, no research on the use of Polish propolis against oral cancer has been published so far. There is little research concerning the antiproliferative effect of Polish propolis on glioblastoma cells [12], colon, lung and breast cancer cells [13], as well as prostate cancer cells [14]. On the other hand, taking into account global data, the problem of oral cancer treatment is still unsolved. In 2018, new cases of oral cancer occurred globally in approximately 355,000 people and caused 177,000 deaths. The most common oral cancer type is tongue squamous cell carcinoma (TSCC), characterized by high lymphatic metastasis, recurrence and drug resistance. The current treatment approaches include surgery, which may be followed by radiotherapy and/or chemotherapy. However, there is still no effective therapeutic strategy and the death toll linked to this disease is still increasing [15].
The purpose of this study was to evaluate the anticancer properties of three different types of propolis from different regions of Poland on the in vitro model of tongue cancer cells. For this reason, ethanol, ethanol-hexane, hexane and hexane-ethanol extracts of Polish propolis were prepared. Normal human gingival fibroblasts were used as a control group of non-cancer cells and a murine macrophage-like cell line was used to evaluate anti-inflammatory potential of the prepared products. Additionally, chemical composition and antioxidant activity of the prepared extracts were compared.

2. Results

2.1. Extraction Yield

The extraction yields of the propolis extracts were calculated and are presented in Table 1. The extraction yield values of the ethanol extracts of propolis (EEP) were higher than the hexane extracts of propolis (HEP) and the highest values of extraction yield were obtained for propolis from Masovia (P2) and West Pomerania Province (P3). Therefore, the results indicated that ethanol was a better solvent than n-hexane. In addition, the hexane-ethanol extracts of propolis (HEEP) had the second highest extraction yields among all the propolis extracts analyzed.

2.2. Total Polyphenol Content

The total polyphenol content (TPC) was determined with the Folin–Ciocalteu method (Table 2). The statistical analysis revealed that there was not strong variation between the TPC of all propolis harvested in different provinces of Poland (F(2, 109) = 0.86794; p = 0.42270). However, regardless of a type of propolis, there were statistically significant differences of TPC (F(3, 108) = 1178.4; p = 0.0000) between different extracts, such as ethanol extract of propolis (EEP), ethanol-hexane extract of propolis (EHEP), hexane extract of propolis (HEP) and hexane-ethanol extract of propolis (HEEP). The TPC for EEP and HEEP was above 220 mg GAE (gallic acid equivalent)/g of the propolis extract, while the TPC for EHEP and HEP was below 50 mg GAE/g. Tukey’s post-hoc test revealed that all differences of TPC between each type of propolis extract tested were statistically significant at p < 0.05. Interestingly, when only EEP and HEEP were considered, the strong differences among TPC of the propolis harvested in different provinces were observed (F(2, 51) = 31.058; p = 0.00000). Thus, the propolis extracts from West Pomerania Province (P3) had the highest TPC, while the lowest TPC was obtained for propolis extracts from Podlasie (P1).

2.3. Total Flavonoid Content

The total flavonoid content (TFC), evaluated via aluminum chloride method, was presented in Table 2. Similarly to the measurement results of TPC, this analysis also revealed no statistically significant differences among propolis of different origin (F(2, 133) = 3.3270; p = 0.03891). On the other hand, differences among various extracts—EEP, EHEP, HEP and HEEP—were statistically significant (F(3, 132) = 360.77; p = 0.0000). Tukey’s post-hoc test revealed that all differences of TFC between each extract type tested were statistically significant at p < 0.05, except for the differences between EEP and HEEP samples (p = 0.122385). For all the ethanol and hexane-ethanol extracts (EEP and HEEP) analyzed, TFC was above 18.76 mg QE (quercetin equivalent)/g of the propolis extract, while ethanol-hexane and hexane extracts (EHEP and HEP) were characterized by significantly lower TFC. The highest TFC among all samples tested was found for propolis extracts from Masovia (EEP_P2 and HEEP_P2).

2.4. GC-MS Analysis

The chemical composition of EEP from different regions of Poland (Podlasie, Masovia and West Pomerania Province) was determined using gas chromatography–mass spectrometry (GC-MS) and is presented in Appendix A, Table A1. Briefly, the analysis of EEP revealed the presence of seventy-two components, out of which sixty-two were identified. The main components of the material analyses were TMS derivatives of 4-coumaric acid, d-fructose, d-glucose, d-mannopyranose, benzoic acid, lignoceric acid, ferulic acid and naringenin. GC-MS analysis of the ethanol extracts of propolis from Podlasie (EEP_P1) and Masovia (EEP_P2) showed a higher concentration of aromatic acids than the ethanol extract of propolis from West Pomerania Province (EEP_P3). The concentration of the compounds selected is presented in Table A1. The results indicate that the highest concentration of 4-coumaric acid and caffeic acid was measured in EEP_P2, while the lowest one was found in EEP_P3. Furthermore, the highest concentration of ferulic acid and benzoic acid was measured in EEP_P1, while the lowest one was found in EEP_P3.
The chemical composition of HEP from different regions of Poland is presented in Appendix A, Table A2. The profile of the compounds of the n-hexane extracts of propolis, determined by GC-MS, contains forty-one compounds (out of which forty were identified). The results showed domination of waxes and fatty acids derivatives of TMS. The main compounds of HEP_P1 and HEP_P2 were methyl triacontyl ether, heptacosane, pentacosane and lignoceric acid. The main compounds of HEP_P3 were heptacosane, lignoceric acid, 13-octadecanoic acid and methyl triacontyl ether. In addition, HEPs contained around two times more (HEP_P1: 8.10%, HEP_P2: 8.47%) or four times more (HEP_P3: 13.19%) benzoic acid than EEP.
The chemical composition of HEEP harvested from different regions of Poland is presented in Appendix A, Table A3. The profile of the compounds of the hexane-ethanol extracts of propolis contained sixty-five compounds (out of which sixty-two were identified). High similarity of the content of EEP and HEEP was observed. The dominant compounds in HEEP were 4-coumaric acid, d-fructose, d-glucose, d-mannopyranose and ferulic acid.

Fatty Acids Composition

The complete chemical composition of fatty acids in HEP from different regions of Poland is presented in Appendix A, Table A4. Fourteen compounds were identified when analyzing fatty acids contained in propolis of different origins. The main components found in the HEP fraction are: hexadecanoic acid methyl ester, heptadecanoic acid methyl ester, oleic acid methyl ester and tetracosanoic acid methyl ester.

2.5. DPPH Free Radical Scavenging Activity

A 2,2-diphenyl-1-picrylhydrazyl (DPPH) assay was used to measure antioxidant activity of the propolis extracts, with the results presented in Figure 1.
As shown in the Figure 1a–c, all the tested ethanol-hexane and hexane extracts (EHEP and HEP) obtained from propolis harvested in different regions of Poland (P1, P2, P3) had only minimal DPPH free radical scavenging activity compared to the standard. Therefore, they were assumed as having no effect at all. In contrast, for EEP and HEEP, the free radical scavenging activity increased with the increase of the extracts’ concentration from 0 to 200 µg/mL. For these active extracts their IC50 were calculated (the concentration of extracts that inhibits the formation of DPPH free radicals by 50%) and showed in Table 3. Statistically significant differences among IC50 of propolis from different regions of Poland were demonstrated (F(2, 55) = 43.365; p = 0.00000). Tukey’s post-hoc test revealed that all differences of IC50 between each type of propolis tested (P1, P2, P3) were statistically significant at p < 0.05. Regardless of the type of propolis studied, the type of extract did not significantly influence the obtained values of IC50 (F(1, 56) = 0.09896; p = 0.75425). The lowest IC50 values were calculated for propolis extracts from West Pomerania Province (P3), indicating the highest antioxidant potential of these preparations among all the extracts tested.

2.6. Anticancer Activity

The anticancer activity of the selected Polish propolis extracts was evaluated on human squamous cell carcinoma derived from tongue (SCC-25) after incubation for 5 min and 24 h. For this purpose, 3-(4,5-dimethyl-2-thiazolyl)-2,5-diphenyl-2H-tetrazolium bromide assay (MTT assay) and sulforhodamine B assay (SRB assay) were performed. In addition, for both methods, 24 h incubation with human gingival fibroblasts (HGFs) was used as a control model to investigate the effects of propolis in normal, i.e., non-cancer cells. The cytotoxicity values of EEP and HEEP harvested from three different regions in Poland and applied at three concentrations (100, 500 and 1000 µg/mL) are presented in Figure 2 (MTT assay results) and in Figure 3 (SRB assay results).

2.6.1. MTT Assay

When 5 min of incubation with the propolis extracts was applied, mitochondrial activity of SCC-25 cells was only slightly reduced (Figure 2a). Moreover, when concentrations of all the extracts tested were increased, the mitochondrial activity was still above 80% compared to the control. However, the prolonged 24 h incubation period affected the cell viability significantly (Figure 2b). Three-way ANOVA revealed that for all tested extracts of Polish propolis the differences between groups based on the propolis type or extraction type were not statistically significant (p = 0.093920 and p = 0.493920, respectively). The only factor determining significant differences between groups was the extract concentration (p = 0.000000). For tongue cancer cells, incubation with each of the tested propolis extract at a concentration of 500 and 1000 µg/mL resulted in a decrease of mitochondrial activity to ca. 20% of the control. When the concentration of the propolis extracts applied was 100 µg/mL, the mitochondrial activity was most reduced for EEP_P3 (33% of the control) and least reduced for EEP_P1 (59% of the control), therefore, EEP_P1 was less active. The results obtained for HGFs treated with propolis indicated that the tested propolis extracts impaired also the viability of normal cells (Figure 2c). Incubation of HGFs with each tested propolis extract at a concentration of 500 and 1000 µg/mL reduced the mitochondrial activity to ca. 40% compared to the control. In addition, when the propolis extract concentration of 100 µg/mL was applied, EEP_P3 was the most active propolis extract, which reduced the mitochondrial activity to 52% of the control. Furthermore, HEEP_P2 reduced the mitochondrial activity to 76% compared to the control and therefore it was the least active propolis extract. Three-way ANOVA results for HGFs revealed that all the factors studied (type of propolis, type of extract and extract concentration) were source of significant variation at p < 0.05.

2.6.2. SRB Assay

When SCC-25 cells were incubated with Polish propolis for 5 min, for all the concentrations of all the extracts tested the total protein content of cells was above 93% compared to the control (Figure 3a). Therefore, no cytotoxic effect of propolis extracts after a short-time incubation was revealed. However, the prolonged incubation, i.e., 24 h, affected the cellular proliferation significantly (Figure 3b). The results showed that 24 h incubation of tongue cancer cells with increasing concentration of propolis extract resulted in a decrease of total protein content. For example, when the concentrations of 100 and 500 µg/mL of all Polish propolis extracts were applied, cellular protein content was reduced to ca. 55% of the control. Notably, the least activity was observed at 100 µg/mL of EEP_P1, that reduced the cellular protein content to 72% compared to the control. However, for 500 µg/mL of HEEP_P1 the cellular protein content was reduced to 45% of the control. Finally, when tongue cancer cells were incubated with each of the Polish propolis extracts tested at a concentration of 1000 µg/mL, it resulted in a decrease in total protein content to ca. 45% compared to the control. The results for HGFs indicated that the analyzed propolis extracts at concentrations of 500 and 1000 µg/mL impaired the proliferation of normal cells (Figure 3c). Incubation of HGFs with 1000 µg/mL propolis extracts reduced total protein content to ca. 30% compared to the control. Incubation of HGFs with 1000 µg/mL of HEEP_P2 resulted in the lowest level of protein content, reduced to 20% of the control. On the other hand, incubation of HGFs with 1000 µg/mL of EEP_P1 resulted in the highest level of total protein content, i.e., 40% of the control. Additionally, incubation of HGFs with 500 µg/mL propolis extracts also induced a significant cytotoxicity. In contrast, for the concentration of 100 µg/mL, the lowest level of total protein content, i.e., 79% of the control, was observed when HGFs were incubated with EEP_P3 and HEEP_P3. The three-way ANOVA of results both for SCC-25 and HGFs revealed that all the factors studied (type of propolis, type of extract and extract concentration) were sources of significant variation at p < 0.05.

2.7. Anti-Inflammatory Potential

Anti-inflammatory potential of the propolis extracts selected was evaluated on murine macrophage-like cell line (P388-D1) via MTT assay (Figure 4a) and SRB assay (Figure 4b) after 24 h of incubation. For all the analyzed concentrations of all the extracts tested it was observed that the prolonged 24 h incubation period affected the cellular mitochondrial activity and proliferation significantly. Incubation with each tested propolis extract at a concentration of 1000 µg/mL resulted in a decrease in mitochondrial activity of P388-D1 cells to ca. 19% of the control (Figure 4a) and a decrease in total protein content to ca. 38% of the control (Figure 4b). When the lowest concentration of extracts (100 µg/mL) was applied, the cellular mitochondrial activity was reduced to 48% and the cellular protein content to ca. 55% of the control.

3. Discussion

Propolis demonstrated antiproliferative activity on various cancer cell lines. It was reported that this natural product can block specific oncogene signaling pathways, leading to a decrease in cell proliferation. It can also increase apoptosis, exert antiangiogenic effects, and modulate the tumor microenvironment [3,16].
In spite of these beneficial properties, research on the anticancer activity of propolis on human tongue cancer cells is very limited. Antiproliferative activity of the ethanol extract of Chilean propolis on human mouth epidermoid carcinoma cells (KB) was demonstrated by Russo et al. [17]. Furthermore, Yen et al. and Chiu et al. showed an anti-inflammatory effect of various propolis extracts by inhibiting one of the inflammatory markers—COX-2—in KB cell line [18]. The study of Salehi et al. determined the chemopreventive effect of Iranian propolis on dysplastic changes in the rats’ tongue epithelium after administration of carcinogens (DMBA). The results have showed that propolis can prevent DMBA-induced dysplasia of the oral mucosa in animal model [19]. A similar effect was obtained for hydroalcoholic extract of Brazilian red propolis (HERP) on oral squamous cell carcinoma (OSCC) in rodents. The research revealed that HERP inhibited tumor growth and progression [20].
The anticancer effect of propolis is often attributed to one of its active components—caffeic acid phenethyl ester (CAPE). It can be considered as a potential support for therapy of patients with oral squamous cell carcinoma due to the ability to inhibit cellular proliferation and to prevent cancer metastasis [21,22,23]. On the other hand, the other approach to the clarification of the natural drug’s mechanisms of action is more comprehensive and takes into account a complexity of the product rather than the effect of its individual components. The study of Czyżewska et al. suggested that the synergistic effect of different polyphenols (chrysin, galangin, pinocembrin, caffeic acid, p-coumaric acid and ferulic acid) is responsible for the propolis’ ability to inhibit the growth of human tongue cancer cells through apoptosis [24]. Another study indicated the synergistic effect of the main components of Iranian propolis on mouth epidermoid carcinoma (KB) cells. MTT assay revealed that IC50 values of EEP and its main component, quercetin (Q) were 40 μg/mL and 195 μg/mL respectively after 48 h of incubation [25].
In this study, the whole extracts of Polish propolis were evaluated in terms of the selectivity of their anticancer effect on the tongue cancer cells in comparison to the normal gingival fibroblasts. Chemical analyses revealed that ethanolic and hexane-ethanol extraction were the most effective methods of raw propolis extraction to receive the most chemically complex product. This conclusion confirms the findings of the other studies indicating ethanol extraction as the most common method of raw propolis processing [26,27,28]. The second proposed method—ethanol–hexane extraction—may be an interesting alternative allowing the wax content removal [29]. Both spectroscopic and chromatographic methods enabled determination of a chemical character of the extracts obtained. The chemical compounds identified in the prepared propolis extracts are analogous to the results described by Sahinler and Kaftanogl [30] as well as by Anjum et al. [31], showing high concentration of the aromatic acids, hydrocarbons, alcohols, polyphenols and fatty acids. The presence of phenolic compounds in the propolis extracts is particularly promising when its anticancer activity is considered [32].
The biological analysis of the selected systems showed that the prolonged 24 h incubation of cells with propolis significantly affected the cell viability measured via MTT and SRB assays. Differences between groups, based on the propolis type or extraction type, were not statistically significant. This may confirm the hypothesis that differences in the chemical composition of the extracts obtained did not influence the general biological effect induced by them. It should be emphasized that higher concentrations of the propolis extracts (500 and 1000 µg/mL) significantly affected the viability of normal HGFs as well. For this reason, only the extract concentration of 100 µg/mL could be considered as effective selectively in cancer cells. Similar results demonstrating the cytotoxic effect of propolis on normal human fibroblasts were obtained by Tyszka-Czochara et al. [33], Popova et al. [13] and in our previous study [10]. Moreover, the study presented by Popova et al. revealed the similar chemical profile of the propolis sample (mainly flavanones and dihydroflavonols, as well as a series of esters of p-coumaric acid, ferulic acid, benzoic acid and fatty acids (palmitic acid, linoleic acid, oleic acid) compared to the extracts analyzed in our study [13]).
Additionally, due to the polyphenolic content of propolis, the anti-inflammatory activity of the extracts prepared was verified on macrophage models commonly used in case of natural compounds [34,35]. Szliszka et al. suggested that phenolic compounds may be responsible for a crucial contribution of Brazilian green propolis in the modulation of chemokine-mediated inflammation [34]. In our study, the impairment of the cellular proliferation and mitochondrial activity observed in macrophage-like cell line (P388-D1) suggested a possible anti-inflammatory activity of the prepared extracts. Here we have observed that the effect was dependent on the cytotoxic effect of propolis extracts applied.
In the future, the preliminary results reported in this research should be used to select the ethanol and hexane-ethanol extraction as the most effective methods of propolis extraction to obtain chemically complex and biologically active products. The prepared extracts should become a subject of an in-depth analysis aimed at the identification of the most active components and at the investigation of a precise molecular mechanism of their anticancer and anti-inflammatory action. In addition, the selected natural extracts could be combined with conventional chemotherapeutic regimens in order to propose safer and more effective treatment of cancer [36]. Finally, functional polymer microparticles for encapsulation of biologically active compounds could be designed and manufactured [37].

4. Materials and Methods

4.1. Material

The research materials were propolis samples originating from three different regions in Poland (Table 4). Raw propolis was collected from beehives manually. Before processing it was stored at room temperature under dark conditions.

4.2. Extraction

Ethanol, ethanol-hexane, hexane and hexane-ethanol extracts of Polish propolis were prepared according to the procedure illustrated in Figure 5. For this purpose, 5 g of raw propolis was cut into small pieces, dissolved in 50 mL of 70% ethanol (POCH, Poland) or 50 mL of hexane (POCH, Poland) and stirred for 48 h at room temperature under dark conditions, using a magnetic stirrer (Big-squid, IKA, Germany). Subsequently, the samples were centrifuged at 10,500 rpm for 10 min at room temperature, using a 5804 centrifuge (Eppendorf, Germany). The supernatant obtained was named ethanol extract of propolis (EEP) and hexane extract of propolis (HEP). Then, the residue was extracted one more time with ethanol or hexane to obtain EEP_II or HEP_II, respectively. Subsequently, the residue left after ethanol extraction was treated twice with hexane to obtain ethanol-hexane extracts (EHEP and EHEP_II). The residue left after hexane extraction was dissolved twice with 70% ethanol to obtain hexane-ethanol extracts (HEEP and HEEP_II). Non-dissolved residues were discarded.
The extracts were evaporated to dryness at 40 °C using a RV 10 rotary vacuum evaporator (IKA, Germany) and stored at 4 °C under dark conditions. After evaporation, the samples obtained were weighted using an analytical balance: WPS 510/C/2 (Radwag, Poland); extraction yields were expressed in percentage as a ratio of the mass of the sample after evaporation to the mass of the propolis material before extraction. The samples obtained after second extraction with the same solvent (EEP_II, HEP_II, EHEP_II, HEEP_II) were not subjected to further analysis due to their small quantity. Then, the samples were dissolved in methanol (POCH, Poland) at a concentration of 1 mg/mL (for chemical studies) or in DMSO (POCH, Poland) at a concentration of 100 mg/mL (for biological studies).

4.3. Total Polyphenol Content

The total soluble phenolic compounds in the samples were determined using the Folin–Ciocalteu colorimetric method [38]. For this purpose, 100 µL of analyzed propolis extract was dissolved in methanol (1 mg/mL) and then mixed with 900 µL of distilled water and 100 µL of Folin and Ciocalteu’s phenol reagent (Sigma-Aldrich, Poland). After 5 min of incubation, 1 mL of 7% Na2CO3 (POCH, Poland) and 400 µL of distilled water were added. Subsequently, the mixture was incubated for 2 h and the absorbance was measured at 765 nm using a UV-Vis spectrophotometer: SP 8001 (Metertech, Norway). Gallic acid (Sigma-Aldrich, Poland) was used as a standard. The results were expressed in mg of gallic acid equivalent per g of propolis extract (mg GAE/g). The minimum number of measurements for each extract was n = 9.

4.4. Total Flavonoid Content

The total flavonoid contents in the samples were determined using an aluminum chloride method [39]. Briefly, 100 µL of propolis extract dissolved in methanol (1 mg/mL) was mixed with 100 µL of 2% AlCl3 (Sigma-Aldrich, Poland). After 15 min of incubation, the absorbance was measured at 435 nm using a UV-Vis spectrophotometer: SP 8001 (Metertech, Norway). Quercetin (Sigma-Aldrich, Poland) was used as a standard. The results were expressed in mg of quercetin equivalent per g of propolis extract (mg QE/g). The minimum number of measurements for each extract was n = 9.

4.5. GC-MS Analysis

The propolis extracts obtained (EEP, HEP and HEEP) were evaluated in terms of a low-molecular-weight compound content by means of derivatization with N,O-bis (trimethylsilyl)trifluoroacetamide (BSTFA) silylation approach on gas chromatography, coupled with mass spectrometry (Shimadzu GC-MS QP 2020, Shimadzu, Kyoto, Japan). Each of the extracts was evaporated under reduced pressure. Then, 500 µL of pyridine and 50 µL of BSTFA were added to all samples. The mixture was placed in a vial and heated for 15 min at 70 °C. Separation was achieved using Zebron ZB-5 capillary column with a length of 30 m, inner diameter of 0.25 mm, and film thickness of 0.25 μm (Phenomenex, Torrance, CA, USA). The GC-MS analysis was performed according to the following parameters: scan mode with mass range from 40 to 1050 m/z in electronic impact (EI) mode at 70 eV; mode at 10 scan s−1 mode. Analyses were conducted using helium as a carrier gas at a flow rate of 1.0 mL min−1 in a split ratio of 1:20 and the following program: (a) 100 °C for 1 min; (b) rate of 2.0 °C min−1 from 100 to 190 °C; (c) rate of 5 °C min−1 from 190 to 300 °C. An injector was held at 280 °C, respectively. Compounds were identified by using two different analytical methods that compare: retention times with authentic chemicals (Supelco C7-C40 Saturated Alkanes Standard), and obtained mass spectra with available library data (Willey NIST 17, match index >90%).

Fatty Acids Composition

The lipid fraction was obtained according to the previously described method [40]. In the next step, the extracted nonpolar fraction, approx. 30 mg, was saponified (10 min at 75 °C) with 2 mL of 0.5 M KOH/MeOH solution and subjected to methylation (10 min at 75 °C) using 2 mL of 14% (v/v) BF3/MeOH (Sigma-Aldrich, St. Louis, MO, USA). Subsequently, water was added to reaction mixture and methyl esters of fatty acids were extracted with 10 mL of hexane (UQF Wroclaw, Poland), then washed with 10 mL 10% sodium bicarbonate (UQF Wroclaw, Poland) and desiccated with anhydrous sodium sulphate. The organic phase was evaporated under reduced pressure and stored at −27 °C until chromatographical analysis. The FAME profile was assessed using gas chromatograph coupled with a mass spectrometer (Shimadzu GCMS QP 2020, Shimadzu, Kyoto, Japan). Separation was achieved using Zebron ZB-FAME capillary column with a length of 60 m, inner diameter of 0.20 mm, and film thickness of 0.20 μm (Phenomenex, Torrance, CA, USA). The GC-MS analysis was according to the following parameters: scan mode with mass range from 40 to 400 m/z in electronic impact (EI) mode at 70 eV; mode at 3 scan s−1 mode. Analyses were conducted using helium as a carrier gas at a flow rate of 1.8 mL min−1 in a split ratio of 1:10 and the following program: (a) 80 °C for 2 min; (b) rate of 3.0 °C min−1 from 80 to 180 °C; (c) rate of 8 °C min−1 from 180 to 240 °C. An injector was held at 280 °C, respectively. Compounds were identified by using two different analytical methods that compare: retention times with authentic chemicals (Supelco 37 Component FAME Mix), and obtained mass spectra with available library data (Willey NIST 17, match index >90%).

4.6. DPPH Free Radical Scavenging Activity

The 2,2-diphenyl-1-picrylhydrazyl (DPPH) free radical scavenging activity was determined using a method described by Yang et al. [39]. For this purpose, 100 µL of propolis extract dissolved in methanol (10, 20, 50, 100, 150, 200 µg/mL) was placed into a 96 well plate (Nunc, Denmark) and 100 µL of 0.2 mM DPPH solution (Sigma-Aldrich, Poland) was added. After 15 min of incubation, the absorbance was measured at 517 nm using a multiwell-plate reader (EnSpire Multimode Reader, Perkin Elmer, USA). Ascorbic acid (P.P.H. STANLAB Sp.J., Poland) was used as a standard. The percentage inhibition capacity was calculated from the following equation:
percentage inhibition = (A0 − A1)/(A0 × 100),
where A0 is the absorbance of the control group and A1 is the absorbance of the extracts.

4.7. Biological Characterisation

Taking into account the results of the chemical analyses, hexane extracts (HEP) and ethanol-hexane extracts (EHEP) were excluded from further studies. Biological analyses were conducted only for ethanol extracts (EEP) and hexane-ethanol extracts (HEEP), which were characterized by the highest TPC, TFC and DPPH free radical scavenging activity.

4.7.1. Cell Culture

Human squamous cell carcinomas derived from tongue (SCC-25 cell line, ATCC CRL-1628, ATCC, USA) were cultured in a 1:1 mixture of Dulbecco’s Modified Eagle’s Medium (DMEM) and Ham’s F12 medium (Lonza, Switzerland) supplemented with 10% fetal bovine serum (FBS, Sigma-Aldrich, Poland), and antibiotics: penicillin/streptomycin (Sigma-Aldrich, Poland), as recommended by ATCC.
Human gingival fibroblasts (HGFs) were mechanically isolated from a fragment of gingival tissue (1–2 mm) in healthy patients, according to the procedure described by Dominiak and Saczko [41]. The biopsies were provided by the Department of Dental Surgery at the Wroclaw Medical University in accordance with the requirements of the Bioethics Commission of Wroclaw Medical University (Bioethical Committee approval, No.: KB-8/2010). The fragment of tissue was taken by a scalpel and immediately placed on Petri dishes (60 mm, Nunc, Denmark) with DMEM (Sigma-Aldrich, Poland) containing 10% FBS (Sigma-Aldrich, Poland) and antibiotics: penicillin/streptomycin (Sigma-Aldrich, Poland).
Murine macrophage-like cells (P388-D1 cell line, ATCC CCL-46, ATCC, USA) were cultured in a 1:1 mixture of DMEM and RPMI 1640 medium (Lonza, Switzerland) supplemented with 10% FBS (Sigma-Aldrich, Poland) and antibiotics: penicillin/streptomycin (Sigma-Aldrich, Poland).
All cell lines were incubated in a humidified atmosphere at 37 °C and 5% CO2. After trypsinization with 0.25% trypsin-EDTA (Sigma-Aldrich, Poland), the cells were passaged and grown in 25 cm2 flasks (Equimed, Poland). In order to evaluate cytotoxicity of the extracts tested, cells were seeded into a 96-well plate (Nunc, Denmark). After 24 h, the culture medium was removed and then propolis extracts, diluted with an appropriate culture medium (100, 500 and 1000 μg/mL), were added for 5 min or 24 h. MTT and SRB assays were performed 24 h later. All results were referred to the untreated control cells.

4.7.2. MTT Assay

To evaluate cytotoxicity of propolis extracts (EEP and HEEP) on the basis of differences in mitochondrial function, 3-(4,5-dimethyl-2-thiazolyl)-2,5-diphenyl-2H-tetrazolium bromide (MTT) assay was performed. Cells were incubated for 90 min with 100 μL of the MTT reagent (Sigma-Aldrich, Poland) at 37 °C. Then, formazan crystals were dissolved by addition of 100 μL of acidic isopropanol and by mixing. The absorbance was measured at 570 nm using a multiwell plate reader (EnSpire Multimode Reader, Perkin Elmer, USA). The results were expressed as the percentage of treated cells with altered mitochondrial function in relation to untreated control cells with normal mitochondrial activity, considered as 100%.

4.7.3. SRB Assay

To evaluate cytotoxicity of propolis extracts on the basis of differences in total protein content in cells, sulforhodamine B (SRB) assay was performed. The protocol was based on the procedure described in [42]. Cell monolayers were fixed with 10% (vol/vol) trichloroacetic acid (Roth, Poland) for 1 h at 4 °C, subsequently washed (five times) in cold water and desiccated. Cell staining was performed for 30 min using 0.4% SRB (Sigma-Aldrich, Poland) in 1% acetic acid (Sigma-Aldrich, Poland) at room temperature. After incubation, the excess of dye was removed by means of washing with 1% (v/v) acetic acid (four times). Plates were desiccated and the protein-bound dye was dissolved in 10 mM Tris base solution (pH 10.5) (BioShop, Canada). The absorbance was measured at 490 nm using a multiwell plate reader (GloMax Discover, Promega, USA). The results were expressed as the percentage of total protein content in treated cells in relation to untreated control cells.

4.8. Statistical Analysis

The results are presented as means ± standard deviation (SD) values for minimum n = 9 repeats. The results were analyzed by one-way ANOVA and α = 0.05 using Statistica ver. 13.3 software (StatSoft, Poland). F-values and p-values were determined, the values p ≤ 0.05 were considered as statistically significant. Tukey’s HSD test was performed when ANOVA indicated statistically significant results. Additionally, for the MTT and SRB assays, the statistical significance of the differences between mean values of different groups and the untreated control group was evaluated by Student’s t-test. The values p ≤ 0.05 were marked with an asterisk and considered as statistically significant. Finally, for MTT and SRB assay results, three–way ANOVA test was performed to indicate, which factor (type of propolis, type of extract, extract concentration) determines significant differences between groups, p ≤ 0.05 were considered as statistically significant.

5. Conclusions

This study has revealed differences in chemical composition and antioxidant activity of the extracts of three different types of Polish propolis obtained after extraction with ethanol, hexane and combinations of both. The products selected (EEP and HEEP) demonstrated anticancer activity in the tongue cancer cells and cytotoxicity towards murine macrophages. In addition, EEP and HEEP did not have any cytotoxic effect in the normal gingival fibroblasts when the lowest concentration was applied.
The following conclusions can be drawn on the basis of the results obtained:
  • The highest total extraction yields were obtained for ethanol and hexane-ethanol extracts (EEP and HEEP);
  • Total polyphenol content (TPC) and total flavonoid content (TFC) of ethanol and hexane-ethanol extracts (EEP and HEEP) were much higher than TPC and TFC of ethanol-hexane and hexane extracts (EHEP and HEP);
  • Antioxidant potential of ethanol and hexane-ethanol extracts (EEP and HEEP) was much higher than that of ethanol-hexane and hexane extracts (EHEP and HEP);
  • The extracts selected (EEP and HEEP) demonstrated anticancer activity in the tongue cancer cells; 24 h incubation affected cell viability and cellular proliferation significantly;
  • The propolis extracts tested at higher concentrations (500 and 1000 µg/mL) impaired the proliferation of normal cells as well;
  • The observed cytotoxicity of the extracts prepared towards murine macrophages requires further investigation to evaluate their possible anti-inflammatory potential.
As a final conclusion, we can select the minimal dose of 100 µg/mL of the extracts applied, which caused anticancer effect on human tongue cancer cells with limited cytotoxic effect on normal mucosal cells and simultaneous anti-inflammatory potential. However, further studies on Polish propolis are still necessary in order to thoroughly explain the molecular mechanisms of its action and to obtain promising health benefits of this versatile natural product.

Author Contributions

Conceptualization, J.W., W.W. and K.A.W.; methodology, J.W. and A.W.; validation, J.K., J.S., R.G. and K.A.W.; formal analysis, J.W., A.W. and N.P.; investigation, J.W., A.W. and N.P.; resources, J.W., W.W., J.K., J.S., M.W. and K.A.W.; writing—original draft preparation, J.W.; writing—review and editing, A.W., J.K., J.S., M.W., R.G. and K.A.W.; visualization, J.W.; supervision, J.K., J.S., R.G. and K.A.W.; project administration, J.W.; funding acquisition, J.W., W.W., M.W. and K.A.W. All authors have read and agreed to the published version of the manuscript.

Funding

This research was funded by the Wroclaw Medical University, grant number STM. B022.17.013 (J. Weżgowiec), and by a statutory activity subsidy from the Polish Ministry of Science and Higher Education for the Faculty of Chemistry at the Wroclaw University of Science and Technology (extracts preparation).

Acknowledgments

A. Szumny from Department of Chemistry, Wroclaw University of Environmental and Life Sciences, is acknowledged for his supervision of GC-MS analysis and for a critical revision of the manuscript.

Conflicts of Interest

The authors declare no conflict of interest.

Appendix A

Table A1. GC-MS profile of ethanol extracts of propolis (EEP) from different regions of Poland: EEP_P1—Podlasie (Hajnowka), EEP_P2—Masovia (Ciechanow), EEP_P3—West Pomerania Province (Miedzyzdroje).
SubstancesRTRI expRI litEEP_P1[%]EEP_P2[%]EEP_P3[%]
1Benzyl alcohol, TMS derivative6.110115511520.120.150.1
2Benzoic Acid, TMS derivative8.795124612494.353.83.15
3Glycerol, TMS10.162128712890.780.991.55
4Butanedioic acid, 2TMS derivative11.445132013210.120.040.13
51-Monoacetin, 2O-TMS11.740132613240.130.070.08
64-Hydroxybenzaldehyde, TMS derivative13.737137313830.220.160.08
7Hydroquinone, 2TMS derivative15.308140914080.240.20.08
8Malic acid, 3TMS derivative20.278151114970.090.061.1
95-Oxoproline, TMS derivative20.680152115270.10.09-
10Vanillin, TMS derivative21.622153615301.480.50.37
11Cinnamic acid, TMS derivative22.048154515420.120.140.25
124-Hydroxybenzoic acid, 2TMS derivative26.623163416350.270.220.08
13Dodecanoic acid, TMS27.858165816550.130.09-
14β-D-Xylopyranose, 4TMS derivative34.330178417770.17--
15o-Coumaric acid, 2TMS derivative34.975179718150.260.260.09
16D-Psicofuranose37.465184818371.281.20.76
17D-Fructose, 5TMS derivative37.855185618677.49.558.51
18D-Sorbitol, 6TMS derivative41.075192219200.220.097.15
19D-Glucose, 5TMS derivative41.635193419284.828.5-
204-Coumaric acid, 2TMS derivative42.2231947194910.7413.681.34
21D-Glucitol, 6TMS derivative43.902198219800.440.340.18
22Gallic acid, 4TMS derivative44.118198619870.390.10.21
23Salicylic acid, trimethylsilyl ether, benzyl ester45.910202820250.550.490.11
24D-Mannopyranose, 5TMS derivative46.347203820374.878.847.8
25D-Gluconic acid, 6TMS derivative46.875205220430.160.160.09
26Palmitic Acid, TMS derivative47.070205720500.850.70.69
27Isoferulic acid, 2TMS derivative48.435209020810.170.672.7
28Ferulic acid, 2TMS derivative48.950210321034.792.952.69
29Myo-Inositol, 6TMS derivative49.822213221290.180.11.17
30Phtalic acid derivative*50.3872150-1.071.194.02
31Caffeic acid, 3TMS derivative50.548215721551.062.15-
32Unknown51.9082202-1.542.480.19
3313-Octadecenoic acid, (E)-, TMS derivative52.383222222280.590.720.88
343,7,11,15-Tetramethyl-2,6,10,14-hexadecatetraene-1-ol trimethylsilyl ether52.697223622341.652.70.25
35Tricosane54.272230023001.140.420.08
36Unknown55.7332370---1.21
37Unknown56.8102424---2.4
38Pterostilbene, trimethylsilyl ether57.5072462-0.390.480.82
39Pentacosane58.223250125060.830.260.64
40Unknown58.5482519-4.414.321.5
41Ethyl trans-caffeate, bis(tert-butyldimethylsilyl) ether58.675252725470.110.080.16
42Bisphenol C*59.0852551-1.473.585.2
431-Docosanol, TMS derivative59.220255825570.250.480.67
44Unknown59.5772579-0.30.190.45
45Butanoic acid, 4-methoxy-2-nitro-, 2,6-bis(1,1-dimethylethyl)-4-methoxyphenyl ester59.990260425950.60.253.25
46Unknown60.4652635-0.450.710.56
47Behenic acid, TMS derivative60.650264526441.050.37-
48Unknown60.9382664-0.821.222.59
49Unknown61.1322675-0.270.591.51
50Unknown61.2802685-2.120.960.9
51Maltose, 8TMS derivative, isomer 261.415269326931.562.965.33
52n-Heptacosane61.527270027000.820.2-
53Sucrose, 8TMS derivative61.700271227122.380.430.23
54D-(+)-Turanose, octakis(trimethylsilyl) ether, methyloxime (isomer 1)61.925272727240.531.964.92
55Maltose, OTMS62.035273527330.380.180.11
56D-Cellobiose, (isomer 2), 8TMS derivative62.258274927621.72.640.43
57Naringenin, O,O’-bis(trimethylsilyl)-62.612277227781.073.486.06
58Unknown63.1802813---2.08
59Isosakuranetin, TMS derivative63.345282128180.741.430.2
60Lignoceric acid, TMS derivative63.648284228387.823.450.35
61Sakuranetin, TMS derivative64.200288228770.960.580.26
62Catechine, 5TMS derivative64.872293229380.170.13-
63Gettibiose, TMS derivative65.712299129890.390.380.29
64Triacontane65.933300930030.440.360.27
65Pectolinaringenin, TMS derivative66.108302130370.540.410.38
66Hexacosanoic acid, TMS derivative66.367304130390.70.181.84
67Nonacosan-10-ol, O-TMS66.840307830482.590.64-
68Nonacosan-9-ol, O-TMS66.925308530532.131.060.91
69Hentriacontane67.132310031030.360.20.83
70Kaempferol, 4TMS67.298311431120.290.860.77
71Trimethylsilyl octacosanoate, TMS derivative69.220325632290.520.20.52
72Methyl triacontyl ether69.512327532338.380.970.44
RI (retention time); RIexp. and RIlit. indicate retention indices based on experiments and literature, respectively.
Table A2. GC-MS profile of hexane extracts of propolis (HEP) from different regions of Poland: HEP_P1—Podlasie (Hajnowka), HEP_P2—Masovia (Ciechanow), HEP_P3—West Pomerania Province (Miedzyzdroje).
SubstancesRTRI expRI litHEP_P1[%]HEP_P2[%]HEP_P3[%]
1Benzoic Acid, TMS derivative8.765124612498.18.4713.19
2Glycerol, TMS10.137128712890.820.470.6
3Decanoic acid, TMS derivative17.830146014500.151.50.14
4Vanillin, TMS derivative21.590153615300.790.360.27
5Cinnamic acid, TMS derivative21.998154515420.170.260.87
6Dodecanoic acid, TMS27.828165816550.310.370.36
7β-D-Xylopyranose, 4TMS derivative34.300178417770.251.36-
8D-Fructose, 5TMS derivative37.770185618670.360.360.38
94,7,10-Hexadecatrienoic acid, methyl ester40.008189919020.360.13-
10D-Sorbitol, 6TMS derivative41.032192219200.2--
114-Coumaric acid, 2TMS derivative42.122194719490.330.190.21
12Salicylic acid, trimethylsilyl ether, benzyl ester45.865202820250.871.840.63
13Palmitic Acid, TMS derivative47.035205720502.483.062.96
14Ferulic acid, 2TMS derivative48.887210321031.20.763.01
15Phtalic acid derivative*50.3572150 1.041.310.21
16Methyl caffeate, 2TMS derivative51.882220119971.021.670.07
1713-Octadecenoic acid, (E)-, TMS derivative52.365222222281.74.38.05
183,7,11,15-Tetramethyl-2,6,10,14-hexadecatetraene-1-ol trimethylsilyl ether52.677223622340.771.21-
19Stearic acid, TMS derivative53.047224922460.550.891.15
20Tricosane54.255230023003.552.673.05
21Arachidic acid, TMS derivative57.212244624470.430.40.63
22Pterostilbene, trimethylsilyl ether57.7232462-0.340.280.13
23Pentacosane58.200250125065.244.64.00
24Ethyl trans-caffeate, bis(tert-butyldimethylsilyl) ether58.518252725470.841.541.2
25Bisphenol C*59.0432551 0.30.521.28
26Behenic acid, TMS derivative60.617264326442.111.422.19
27Unknown61.2552683-2.021.561.77
28n-Heptacosane61.5122700270014.1114.3112.45
29Maltose, OTMS62.007273527330.380.190.1
30D-Cellobiose, (isomer 2), 8TMS derivative62.290274927620.371.160.55
31Octacosane63.003279828000.561.090.68
32Lignoceric acid, TMS derivative63.620284228387.725.8812.02
33Sakuranetin, TMS derivative64.170288228770.53-0.23
34Nonacosane64.438289929007.159.247.34
35Hexacosanoic acid, TMS derivative66.345304130390.630.672.21
36Nonacosan-10-ol, O-TMS66.817307830485.013.313.27
37Nonacosan-9-ol, O-TMS66.907308530534.363.242.7
38Hentriacontane67.115310031034.256.664.62
39Myristic acid, 9-hexadecenyl ester, (Z)-68.128317731300.60.340.17
40Trimethylsilyl octacosanoate, TMS derivative69.188325632291.211.010.5
41Methyl triacontyl ether69.4933276323316.811.366.82
RI (retention time); RIexp. and RIlit. indicate retention indices based on experiments and literature, respectively.
Table A3. GC-MS profile of hexane-ethanol extracts of propolis (HEEP) from different regions of Poland: HEEP_P1—Podlasie (Hajnowka), HEEP_P2—Masovia (Ciechanow), HEEP_P3—West Pomerania Province (Miedzyzdroje).
SubstancesRTRI expRI litHEEP_P1[%]HEEP_P2[%]HEEP_P3[%]
1Benzyl alcohol, TMS derivative6.112115511520.090.040.08
2Benzoic Acid, TMS derivative8.797124612493.161.241.27
3Cinnamaldehyde9.905127212740.040.080.06
4Glycerol, TMS10.170128712890.871.051.8
5Butanedioic acid, 2TMS derivative11.465132013210.120.050.18
61-Monoacetin, 2O-TMS11.748132613240.140.060.09
74-Hydroxybenzaldehyde, TMS derivative13.748137313830.260.190.14
8Hydroquinone, 2TMS derivative15.325140914080.40.220.13
9Cinnamyl alcohol, trimethylsilyl ether16.27314221428-0.020.03
10Malic acid, 3TMS derivative20.282151114970.120.120.81
115-Oxoproline, TMS derivative20.693152115270.120.060.05
12Vanillin, TMS derivative21.640153715301.820.460.27
13Cinnamic acid, TMS derivative22.043154515420.070.050.15
143,4-Dihydroxybenzaldehyde,26.04516221612-0.130.27
154-Hydroxybenzoic acid, 2TMS derivative26.638163416350.480.220.18
16Dodecanoic acid, TMS27.668165816550.140.020.08
17β-D-Xylopyranose, 4TMS derivative34.563178417770.130.030.03
18o-Coumaric acid, 2TMS derivative34.968179718150.280.250.09
194-Methoxycinnamic acid, TMS derivative36.60218301833-0.080.26
20D-Psicofuranose37.475184818371.461.592.24
21D-Fructose, 5TMS derivative37.8651856186612.5811.922.03
22D-Sorbitol, 6TMS derivative41.092192219200.160.1-
23D-Glucose, 5TMS derivative41.658193419287.1411.98.27
244-Coumaric acid, 2TMS derivative42.2521947194916.7413.5210.74
25D-Glucitol, 6TMS derivative43.917198219800.430.250.44
26Gallic acid, 4TMS derivative44.125198719870.680.13-
27Salicylic acid, trimethylsilyl ether, benzyl ester45.932202820250.10.080.2
28D-Mannopyranose, 5TMS derivative46.353203820376.3313.139.13
29D-Gluconic acid, 6TMS derivative46.885205220430.150.20.08
30Palmitic Acid, TMS derivative47.083205720500.490.180.09
31Isoferulic acid, 2TMS derivative48.453209020810.090.782.95
32Ferulic acid, 2TMS derivative48.965210321037.933.023.86
33Myo-Inositol, 6TMS derivative49.845213221290.090.131.3
34Phtalic acid derivative*50.4032150-0.70.240.03
35Caffeic acid, 3TMS derivative50.565215721550.890.830.03
36Linoleic acid, TMS51.922220322121.312.484.6
3713-Octadecenoic acid, (E)-, TMS derivative52.392222222280.171.770.06
383,7,11,15-Tetramethyl-2,6,10,14-hexadecatetraene-1-ol trimethylsilyl ether52.703223622341.010.070.07
392’,6’-Dihydroxy 4’-methoxydihydrochalcone, trimethylsilyl ether52.71724182405-1.990.1
40Pterostilbene, trimethylsilyl ether57.5202462-0.430.772.58
41Pentacosane58.563250125065.850.440.87
42Ethyl trans-caffeate, bis(tert-butyldimethylsilyl) ether58.56025272547-3.552.22
43Bisphenol*59.0882551 1.650.130.12
441-Docosanol, TMS derivative59.223255825570.194.514.76
45Butanoic acid, 4-methoxy-2-nitro-, 2,6-bis(1,1-dimethylethyl)-4-methoxyphenyl ester59.998260425950.720.320.67
46Unknown60.4752635 0.990.843.44
47Behenic acid, TMS derivative60.550264526440.310.940.83
48Unknown60.9472664 0.951.732.77
49Unknown61.2852685 3.220.691.67
50Maltose, 8TMS derivative, isomer 261.422269326931.833.425.26
51n-Heptacosane61.537270027000.210.110.31
52Sucrose, 8TMS derivative61.705271227125.880.522.61
53D-(+)-Turanose, octakis(trimethylsilyl) ether, methyloxime (isomer 1)61.937272727240.712.664.98
54Maltose, OTMS62.040273527330.290.130.12
55D-Cellobiose, (isomer 2), 8TMS derivative62.262274927621.510.321.3
56Naringenin, O,O’-bis(trimethylsilyl)-62.617277227781.144.15.95
57Isosakuranetin, TMS derivative63.352282128180.941.372.13
58Lignoceric acid, TMS derivative63.650284228381.221.680.44
59Sakuranetin, TMS derivative64.215288228771.750.640.11
60Catechine, 5TMS derivative64.880293229380.330.110.07
61Gettibiose, TMS derivative65.720299129890.760.360.66
62Triacontane65.948300930030.780.40.35
63Hexacosanoic acid, TMS derivative66.375304130390.50.692.04
64Unknown66.9753085-0.660.610.74
65Hentriacontane67.137310031030.490.230.77
RI (retention time); RIexp. and RIlit. indicate retention indices based on experiments and literature, respectively.
Table A4. Percentage of fatty acids in hexane extracts of propolis (HEP) from different regions of Poland: HEP_P1—Podlasie (Hajnowka), HEP_P2—Masovia (Ciechanow), HEP_P3—West Pomerania Province (Miedzyzdroje).
SubstancesRTRI expRI litHEP_P1[%]HEP_P2[%]HEP_P3[%]
1Benzoic acid, methyl ester15.055162316120.692.730.92
2Lauric acid, methyl ester18.820187718041.852.321.28
3cis-9-Tetradecenoic acid, methyl ester25.410211620265.161.942.30
4Pentadecanoic acid, methyl ester27.530219421081.750.790.70
5Hexadecanoic acid, methyl ester29.5902271220831.1727.6320.54
6Heptadecanoic acid, methyl ester32.790266623099.687.676.34
7Octadecanoic acid, methyl ester34.345239424186.405.284.23
8Oleic acid, methyl ester35.0502488243418.1825.3025.90
9cis-11-Octadecenoic acid, methyl ester35.565251224681.190.480.81
10Linolenic acid, methyl ester37.775262525710.952.385.86
11Eicosanoic acid, methyl ester38.180265126391.021.861.89
12Docosanoic acid, methyl ester40.790284428354.705.715.00
13Me. C20:4n3; Eicosa-(8,11,14,17)-tetraenoate <methyl>41.060286628652.482.372.75
14Tetracosanoic acid, methyl ester42.8053067303914.7913.9121.49
RI (retention time); RIexp. and RIlit. indicate retention indices based on experiments and literature, respectively.

References

  1. Thomford, N.E.; Senthebane, D.A.; Rowe, A.; Munro, D.; Seele, P.; Maroyi, A.; Dzobo, K. Natural Products for Drug Discovery in the 21st Century: Innovations for Novel Drug Discovery. Int. J. Mol. Sci. 2018, 19, 1578. [Google Scholar] [CrossRef] [Green Version]
  2. Sforcin, J.M. Biological Properties and Therapeutic Applications of Propolis. Phytotherapy Res. 2016, 30, 894–905. [Google Scholar] [CrossRef] [PubMed]
  3. Carvalho, R.; Baltazar, F.; Aguiar, C.A.A. Propolis: A Complex Natural Product with a Plethora of Biological Activities That Can Be Explored for Drug Development. Evid.-Based Complement. Altern. Med. 2015, 2015, 1–29. [Google Scholar] [CrossRef] [PubMed] [Green Version]
  4. Giannopoulou, E.; De Castro, S.L.; Marcucci, M.C. Propolis: Recent advances in chemistry and plant origin. Apidologie 2000, 31, 3–15. [Google Scholar] [CrossRef]
  5. Więckiewicz, W.; Miernik, M.; Więckiewicz, M.; Morawiec, T. Does Propolis Help to Maintain Oral Health? Evid.-Based Complement. Altern. Med. 2013, 2013, 1–8. [Google Scholar] [CrossRef] [PubMed] [Green Version]
  6. Przybyłek, I.; Karpiński, T.M. Antibacterial Properties of Propolis. Molecules 2019, 24, 2047. [Google Scholar] [CrossRef] [Green Version]
  7. Grecka, K.; Kuś, P.M.; Okińczyc, P.; Worobo, R.; Walkusz, J.; Szweda, P. The Anti-Staphylococcal Potential of Ethanolic Polish Propolis Extracts. Molecules 2019, 24, 1732. [Google Scholar] [CrossRef] [Green Version]
  8. Pobiega, K.; Kraśniewska, K.; Derewiaka, D.; Gniewosz, M. Comparison of the antimicrobial activity of propolis extracts obtained by means of various extraction methods. J. Food Sci. Technol. 2019, 56, 5386–5395. [Google Scholar] [CrossRef] [Green Version]
  9. Piekarz, T.; Mertas, A.; Wiatrak, K.; Rój, R.; Kownacki, P.; Śmieszek-Wilczewska, J.; Kopczyńska, E.; Wrzoł, M.; Cisowska, M.; Szliszka, E.; et al. The Influence of Toothpaste Containing Australian Melaleuca alternifolia Oil and Ethanolic Extract of Polish Propolis on Oral Hygiene and Microbiome in Patients Requiring Conservative Procedures. Molecules 2017, 22, 1957. [Google Scholar] [CrossRef] [Green Version]
  10. Wieczynska, A.; Wezgowiec, J.; Wieckiewicz, W.; Czarny, A.; Kulbacka, J.; Nowakowska, D.; Gancarz, R.; Wilk, K.A. Antimicrobial Activity, Cytotoxicity and Total Phenolic Content of Different Extracts of Propolis from the West Pomeranian Region in Poland. Acta Pol. Pharm.-Drug Res. 2017, 74, 715–722. [Google Scholar]
  11. Wojtyczka, R.D.; Dziedzic, A.; Idzik, D.; Kępa, M.; Kubina, R.; Kabała-Dzik, A.; Smoleń-Dzirba, J.; Stojko, J.; Sajewicz, M.; Wąsik, T.J. Susceptibility of Staphylococcus aureus Clinical Isolates to Propolis Extract Alone or in Combination with Antimicrobial Drugs. Molecules 2013, 18, 9623–9640. [Google Scholar] [CrossRef] [Green Version]
  12. Borawska, M.; Naliwajko, S.; Moskwa, J.; Markiewicz-Żukowska, R.; Puścion-Jakubik, A.; Soroczyńska, J. Anti-proliferative and anti-migration effects of Polish propolis combined with Hypericum perforatum L. on glioblastoma multiforme cell line U87MG. BMC Complement. Altern. Med. 2016, 16, 367. [Google Scholar] [CrossRef] [PubMed] [Green Version]
  13. Popova, M.; Giannopoulou, E.; Skalicka-Woźniak, K.; Graikou, K.; Widelski, J.; Giannopoulou, E.; Kalofonos, H.P.; Sivolapenko, G.; Gaweł-Bęben, K.; Antosiewicz, B.; et al. Characterization and Biological Evaluation of Propolis from Poland. Molecules 2017, 22, 1159. [Google Scholar] [CrossRef] [PubMed]
  14. Szliszka, E.; Sokół-Łętowska, A.; Kucharska, A.Z.; Jaworska, D.; Czuba, Z.; Krol, W. Ethanolic Extract of Polish Propolis: Chemical Composition and TRAIL-R2 Death Receptor Targeting Apoptotic Activity against Prostate Cancer Cells. Evid.-Based Complement. Altern. Med. 2013, 2013, 1–12. [Google Scholar] [CrossRef]
  15. Yu, X.; Li, Z. MicroRNA expression and its implications for diagnosis and therapy of tongue squamous cell carcinoma. J. Cell. Mol. Med. 2015, 20, 10–16. [Google Scholar] [CrossRef] [PubMed]
  16. Chan, G.C.; Cheung, K.-W.; Sze, D.M.-Y. The Immunomodulatory and Anticancer Properties of Propolis. Clin. Rev. Allergy Immunol. 2012, 44, 262–273. [Google Scholar] [CrossRef]
  17. Russo, A.; Cardile, V.; Sánchez, F.; Troncoso, N.; Vanella, A.; Garbarino, J. Chilean propolis: Antioxidant activity and antiproliferative action in human tumor cell lines. Life Sci. 2004, 76, 545–558. [Google Scholar] [CrossRef]
  18. Yen, C.-H.; Chiu, H.-F.; Wu, C.-H.; Lu, Y.-Y.; Han, Y.-C.; Shen, Y.; Venkatakrishnan, K.; Wang, C.-K. Beneficial efficacy of various propolis extracts and their digestive products by in vitro simulated gastrointestinal digestion. LWT 2017, 84, 281–289. [Google Scholar] [CrossRef]
  19. Salehi, M.; Motallebnejad, M.; Moghadamnia, A.A.; Seyemajidi, M.; Khanghah, S.N.; Ebrahimpour, A.; Molania, T. An Intervention Airing the Effect of Iranian Propolis on Epithelial Dysplasia of the Tongue: A Preliminary Study. J. Clin. Diagn. Res. 2017, 11, ZC67–ZC70. [Google Scholar] [CrossRef]
  20. Ribeiro, D.R.; Alves Ângela, V.F.; Dos Santos, E.P.; Padilha, F.F.; Gomes, M.Z.; Rabelo, A.S.; Cardoso, J.; Massarioli, A.P.; Alencar, S.M.; De Albuquerque-Júnior, R.L.C.; et al. Inhibition of DMBA-induced Oral Squamous Cells Carcinoma Growth by Brazilian Red Propolis in Rodent Model. Basic Clin. Pharmacol. Toxicol. 2015, 117, 85–95. [Google Scholar] [CrossRef]
  21. Lee, Y.-T.; Don, M.-J.; Hung, P.-S.; Shen, Y.-C.; Lo, Y.-S.; Chang, K.-W.; Chen, C.-F.; Ho, L.-K. Cytotoxicity of phenolic acid phenethyl esters on oral cancer cells. Cancer Lett. 2005, 223, 19–25. [Google Scholar] [CrossRef] [PubMed]
  22. Kuo, Y.-Y.; Jim, W.-T.; Su, L.-C.; Chung, C.-J.; Lin, C.-Y.; Huo, C.; Tseng, J.-C.; Huang, S.-H.; Lai, C.-J.; Chen, B.-C.; et al. Caffeic Acid Phenethyl Ester Is a Potential Therapeutic Agent for Oral Cancer. Int. J. Mol. Sci. 2015, 16, 10748–10766. [Google Scholar] [CrossRef] [PubMed] [Green Version]
  23. Kuo, Y.-Y.; Lin, H.-P.; Huo, C.; Su, L.-C.; Yang, J.; Hsiao, P.-H.; Chiang, H.-C.; Chung, C.-J.; Wang, H.-D.; Chang, J.-Y.; et al. Caffeic Acid Phenethyl Ester Suppresses Proliferation and Survival of TW2.6 Human Oral Cancer Cells via Inhibition of Akt Signaling. Int. J. Mol. Sci. 2013, 14, 8801–8817. [Google Scholar] [CrossRef] [PubMed] [Green Version]
  24. Czyżewska, U.; Siemionow, K.; Zaręba, I.; Miltyk, W. Proapoptotic Activity of Propolis and Their Components on Human Tongue Squamous Cell Carcinoma Cell Line (CAL-27). PLOS ONE 2016, 11, e0157091. [Google Scholar] [CrossRef]
  25. Asgharpour, F.; Moghadamnia, A.A.; Zabihi, E.; Kazemi, S.; Namvar, A.E.; Gholinia, H.; Motallebnejad, M.; Nouri, H.R. Iranian propolis efficiently inhibits growth of oral streptococci and cancer cell lines. BMC Complement. Altern. Med. 2019, 19, 266–268. [Google Scholar] [CrossRef] [Green Version]
  26. Sawaya, A.C.; Cunha, I.B.D.S.; Marcucci, M.C. Analytical methods applied to diverse types of Brazilian propolis. Chem. Central J. 2011, 5, 1–10. [Google Scholar] [CrossRef] [Green Version]
  27. Rassu, G.; Cossu, M.; Langasco, R.; Carta, A.; Cavalli, R.; Giunchedi, P.; Gavini, E. Propolis as lipid bioactive nano-carrier for topical nasal drug delivery. Colloids Surfaces B Biointerfaces 2015, 136, 908–917. [Google Scholar] [CrossRef]
  28. Kubilienė, L.; Laugaliene, V.; Pavilonis, A.; Maruska, A.; Majiene, D.; Barčauskaitė, K.; Kubilius, R.; Kasparaviciene, G.; Savickas, A. Alternative preparation of propolis extracts: Comparison of their composition and biological activities. BMC Complement. Altern. Med. 2015, 15, 156. [Google Scholar] [CrossRef] [Green Version]
  29. Maciejewicz, W. Isolation of Flavonoid Aglycones from Propolis by A Column Chromatography Method and Their Identification By Gc-Ms And Tlc Methods. J. Liq. Chromatogr. Relat. Technol. 2001, 24, 1171–1179. [Google Scholar] [CrossRef]
  30. Anjum, S.I.; Ullah, A.; Khan, K.A.; Attaullah, M.; Khan, H.; Ali, H.; Bashir, M.A.; Tahir, M.; Rana, R.M.; Ghramh, H.A.; et al. Composition and functional properties of propolis (bee glue): A review. Saudi J. Boil. Sci. 2019, 26, 1695–1703. [Google Scholar] [CrossRef] [PubMed]
  31. Sahinler, N.; Kaftanoglu, O. Natural product propolis: Chemical composition. Nat. Prod. Res. 2005, 19, 183–188. [Google Scholar] [CrossRef] [PubMed]
  32. Roleira, F.M.F.; Da Silva, E.J.T.; Varela, C.; Costa, S.; Silva, T.; Garrido, J.; Borges, F. Plant derived and dietary phenolic antioxidants: Anticancer properties. Food Chem. 2015, 183, 235–258. [Google Scholar] [CrossRef] [PubMed]
  33. Tyszka-Czochara, M.; Paśko, P.; Reczyński, W.; Szlósarczyk, M.; Bystrowska, B.; Opoka, W. Zinc and propolis reduces cytotoxicity and proliferation in skin fibroblast cell culture: Total polyphenol content and antioxidant capacity of propolis. Boil. Trace Element Res. 2014, 160, 123–131. [Google Scholar] [CrossRef] [PubMed] [Green Version]
  34. Szliszka, E.; Kucharska, A.Z.; Sokół-Łętowska, A.; Mertas, A.; Czuba, Z.; Krol, W. Chemical Composition and Anti-Inflammatory Effect of Ethanolic Extract of Brazilian Green Propolis on Activated J774A.1 Macrophages. Evid.-Based Complement. Altern. Med. 2013, 2013, 1–13. [Google Scholar] [CrossRef] [PubMed]
  35. Bueno-Silva, B.; Rosalen, P.L.; Alencar, S.M.; Mayer, M.P.A. Anti-inflammatory mechanisms of neovestitol from Brazilian red propolis in LPS-activated macrophages. J. Funct. Foods 2017, 36, 440–447. [Google Scholar] [CrossRef]
  36. Parashar, K.; Sood, S.; Mehaidli, A.; Curran, C.; Vegh, C.; Nguyen, C.; Pignanelli, C.; Zhang, Z.; Liang, G.; Wang, Y.; et al. Evaluating the Anti-cancer Efficacy of a Synthetic Curcumin Analog on Human Melanoma Cells and Its Interaction with Standard Chemotherapeutics. Molecules 2019, 24, 2483. [Google Scholar] [CrossRef] [Green Version]
  37. Tsirigotis-Maniecka, M.; Szyk-Warszynska, L.; Michna, A.; Warszyński, P.; Wilk, K.A. Colloidal characteristics and functionality of rationally designed esculin-loaded hydrogel microcapsules. J. Colloid Interface Sci. 2018, 530, 444–458. [Google Scholar] [CrossRef]
  38. Makhafola, T.J.; Elgorashi, E.; McGaw, L.J.; Verschaeve, L.; Jn, E. The correlation between antimutagenic activity and total phenolic content of extracts of 31 plant species with high antioxidant activity. BMC Complement. Altern. Med. 2016, 16, 490. [Google Scholar] [CrossRef] [Green Version]
  39. Yang, H.; Dong, Y.; Du, H.; Shi, H.; Peng, Y.; Li, X. Antioxidant Compounds from Propolis Collected in Anhui, China. Molecules 2011, 16, 3444–3455. [Google Scholar] [CrossRef]
  40. Zali, A.G.; Ehsanzadeh, P.; Szumny, A.; Matkowski, A. Genotype-specific response of Foeniculum vulgare grain yield and essential oil composition to proline treatment under different irrigation conditions. Ind. Crop. Prod. 2018, 124, 177–185. [Google Scholar] [CrossRef]
  41. Dominiak, M.; Saczko, J. Method of Primary Culture of Human Fibroblasts for Autologous Augmentation. Patent No. PL209784B1, 31 October 2011. [Google Scholar]
  42. Houghton, P.; Fang, R.; Techatanawat, I.; Steventon, G.; Hylands, P.J.; Lee, C. The sulphorhodamine (SRB) assay and other approaches to testing plant extracts and derived compounds for activities related to reputed anticancer activity. Methods 2007, 42, 377–387. [Google Scholar] [CrossRef] [PubMed]
Sample Availability: Samples of the extracts of propolis prepared are available from the authors.
Figure 1. DPPH free radical scavenging activity of the prepared propolis extracts from: (a) Podlasie (P1); (b) Masovia (P2); (c) West Pomerania Province (P3); EEP— ethanol extract of propolis, EHEP—ethanol-hexane extracts of propolis, HEP—hexane extract of propolis, HEEP—hexane-ethanol extracts of propolis.
Molecules 25 02426 g001
Figure 2. MTT assay results for: (a) tongue cancer cells (SCC-25) incubated for 5 min with propolis extracts; (b) tongue cancer cells (SCC-25) incubated for 24 h with propolis extracts; (c) human gingival fibroblasts (HGFs) incubated for 24 h with propolis extracts; * p < 0.05, ** p < 0.005; P1—propolis from Podlasie, P2—propolis from Masovia, P3—propolis from West Pomerania Province, EEP—ethanol extract of propolis, HEEP—hexane-ethanol extracts of propolis.
Molecules 25 02426 g002
Figure 3. Sulforhodamine B (SRB) assay results for: (a) tongue cancer cells (SCC-25) incubated for 5 min with propolis extracts; (b) tongue cancer cells (SCC-25) incubated for 24 h with propolis extracts; (c) human gingival fibroblasts (HGFs) incubated for 24 h with propolis extracts; * p < 0.05, ** p < 0.005; P1—propolis from Podlasie, P2—propolis from Masovia, P3—propolis from West Pomerania Province, EEP—ethanol extract of propolis, HEEP—hexane-ethanol extracts of propolis.
Molecules 25 02426 g003
Figure 4. Results for murine macrophage cells (P388-D1) incubated for 24 h with propolis extracts; (a) MTT assay; (b) SRB assay; ** p < 0.005; P1—propolis from Podlasie, P2—propolis from Masovia, P3—propolis from West Pomerania Province, EEP—ethanol extract of propolis, HEEP—hexane-ethanol extracts of propolis.
Molecules 25 02426 g004
Figure 5. Schematic illustration of procedure for propolis extract preparation; EEP—ethanol extract of propolis, EHEP—ethanol-hexane extracts of propolis, HEP—hexane extract of propolis, HEEP— hexane-ethanol extracts of propolis, RE—residue after extraction with ethanol, RH—residue after extraction with hexane.
Molecules 25 02426 g005
Table 1. Extraction yields of the prepared extracts; P1—propolis from Podlasie, P2—propolis from Masovia, P3—propolis from West Pomerania Province, EEP—ethanol extract of propolis, EHEP— ethanol-hexane extracts of propolis, HEP—hexane extract of propolis, HEEP—hexane-ethanol extracts of propolis.
SymbolSequence of SolventsExtraction Yield [%]
P1P2P3
EEPethanol33.457.563.7
EHEPethanol–hexane24.28.413.3
HEPhexane28.217.514.5
HEEPhexane–ethanol32.942.747.9
Table 2. Total polyphenol content and total flavonoid content of the prepared extracts; the results are expressed as mean ± SD; P1—propolis from Podlasie, P2—propolis from Masovia, P3—propolis from West Pomerania Province, EEP—ethanol extract of propolis, EHEP—ethanol-hexane extracts of propolis, HEP—hexane extract of propolis, HEEP—hexane-ethanol extracts of propolis, GAE—gallic acid equivalent, QE—quercetin equivalent.
Propolis ExtractP1P2P3
Total Polyphenol Content [mg GAE/g]
EEP222.05 ± 14.29259.63 ± 11.73275.79 ± 13.42
EHEP16.36 ± 1.1219.60 ± 1.0718.02 ± 1.09
HEP20.45 ± 4.0845.02 ± 7.2238.84 ± 6.40
HEEP249.92 ± 8.64277.19 ± 14.28308.92 ± 15.85
Total Flavonoid Content [mg QE/g]
EEP18.76 ± 0.6622.19 ± 0.4419.79 ± 0.19
EHEP11.10 ± 0.0610.87 ± 0.0312.99 ± 0.07
HEP12.23 ± 0.2113.49 ± 0.1314.45 ± 0.19
HEEP19.00 ± 0.5722.46 ± 0.4021.63 ± 0.25
Table 3. The concentration of extracts that inhibits the formation of DPPH free radicals by 50% (IC50); P1—propolis from Podlasie, P2—propolis from Masovia, P3—propolis from West Pomerania Province, EEP—ethanol extract of propolis, HEEP—hexane-ethanol extracts of propolis.
Propolis ExtractIC50 [µg/mL]
P1P2P3
EEP78.02 ± 4.8655.07 ± 7.3933.01 ± 2.73
HEEP62.84 ± 14.5960.72 ± 2.8940.92 ± 7.55
Table 4. Geographical origin of the Polish propolis examined.
SymbolRegion of OriginThe Most Abundant Plants in the RegionBee Species
P1Podlasie (Hajnowka)spruce (Picea abies L.)—30%, pine (Pinus sylvestris L.)—27%, alder (Alnus glutinosa L.)—20%, sessile oak (Quercus petraea L.)—10%, silver birch (Betula pendula L.)—7%
Apis mellifera carnica x Apis mellifera caucasica
P2Mazovia (Ciechanow)pine (Pinus sylvestris L.)—70%, alder (Alnus glutinosa L.)—10%, sessile oak (Quercus petraea L.)—10%, silver birch (Betula pendula L.)—7%
Apis mellifera carnica
P3West Pomerania (Miedzyzdroje)pine (Pinus sylvestris L.)—75%, alder (Alnus glutinosa L.)—5%, beech (Fagus sylvatica L.)—5%, sessile oak (Quercus petraea L.)—5%, silver birch (Betula pendula L.)—4%Apis mellifera mellifera

