
Qualitative and Quantitative Analysis of Ukrainian Iris Species: A Fresh Look on Their Antioxidant Content and Biological Activities

 ,
,  ,
,  ,
,  , , and
Abstract
:
1. Introduction
2. Results and Discussion
2.1. Optimization of the HPLC-DAD and UPLC–MS/MS Conditions
2.2. Validation of the Methodology
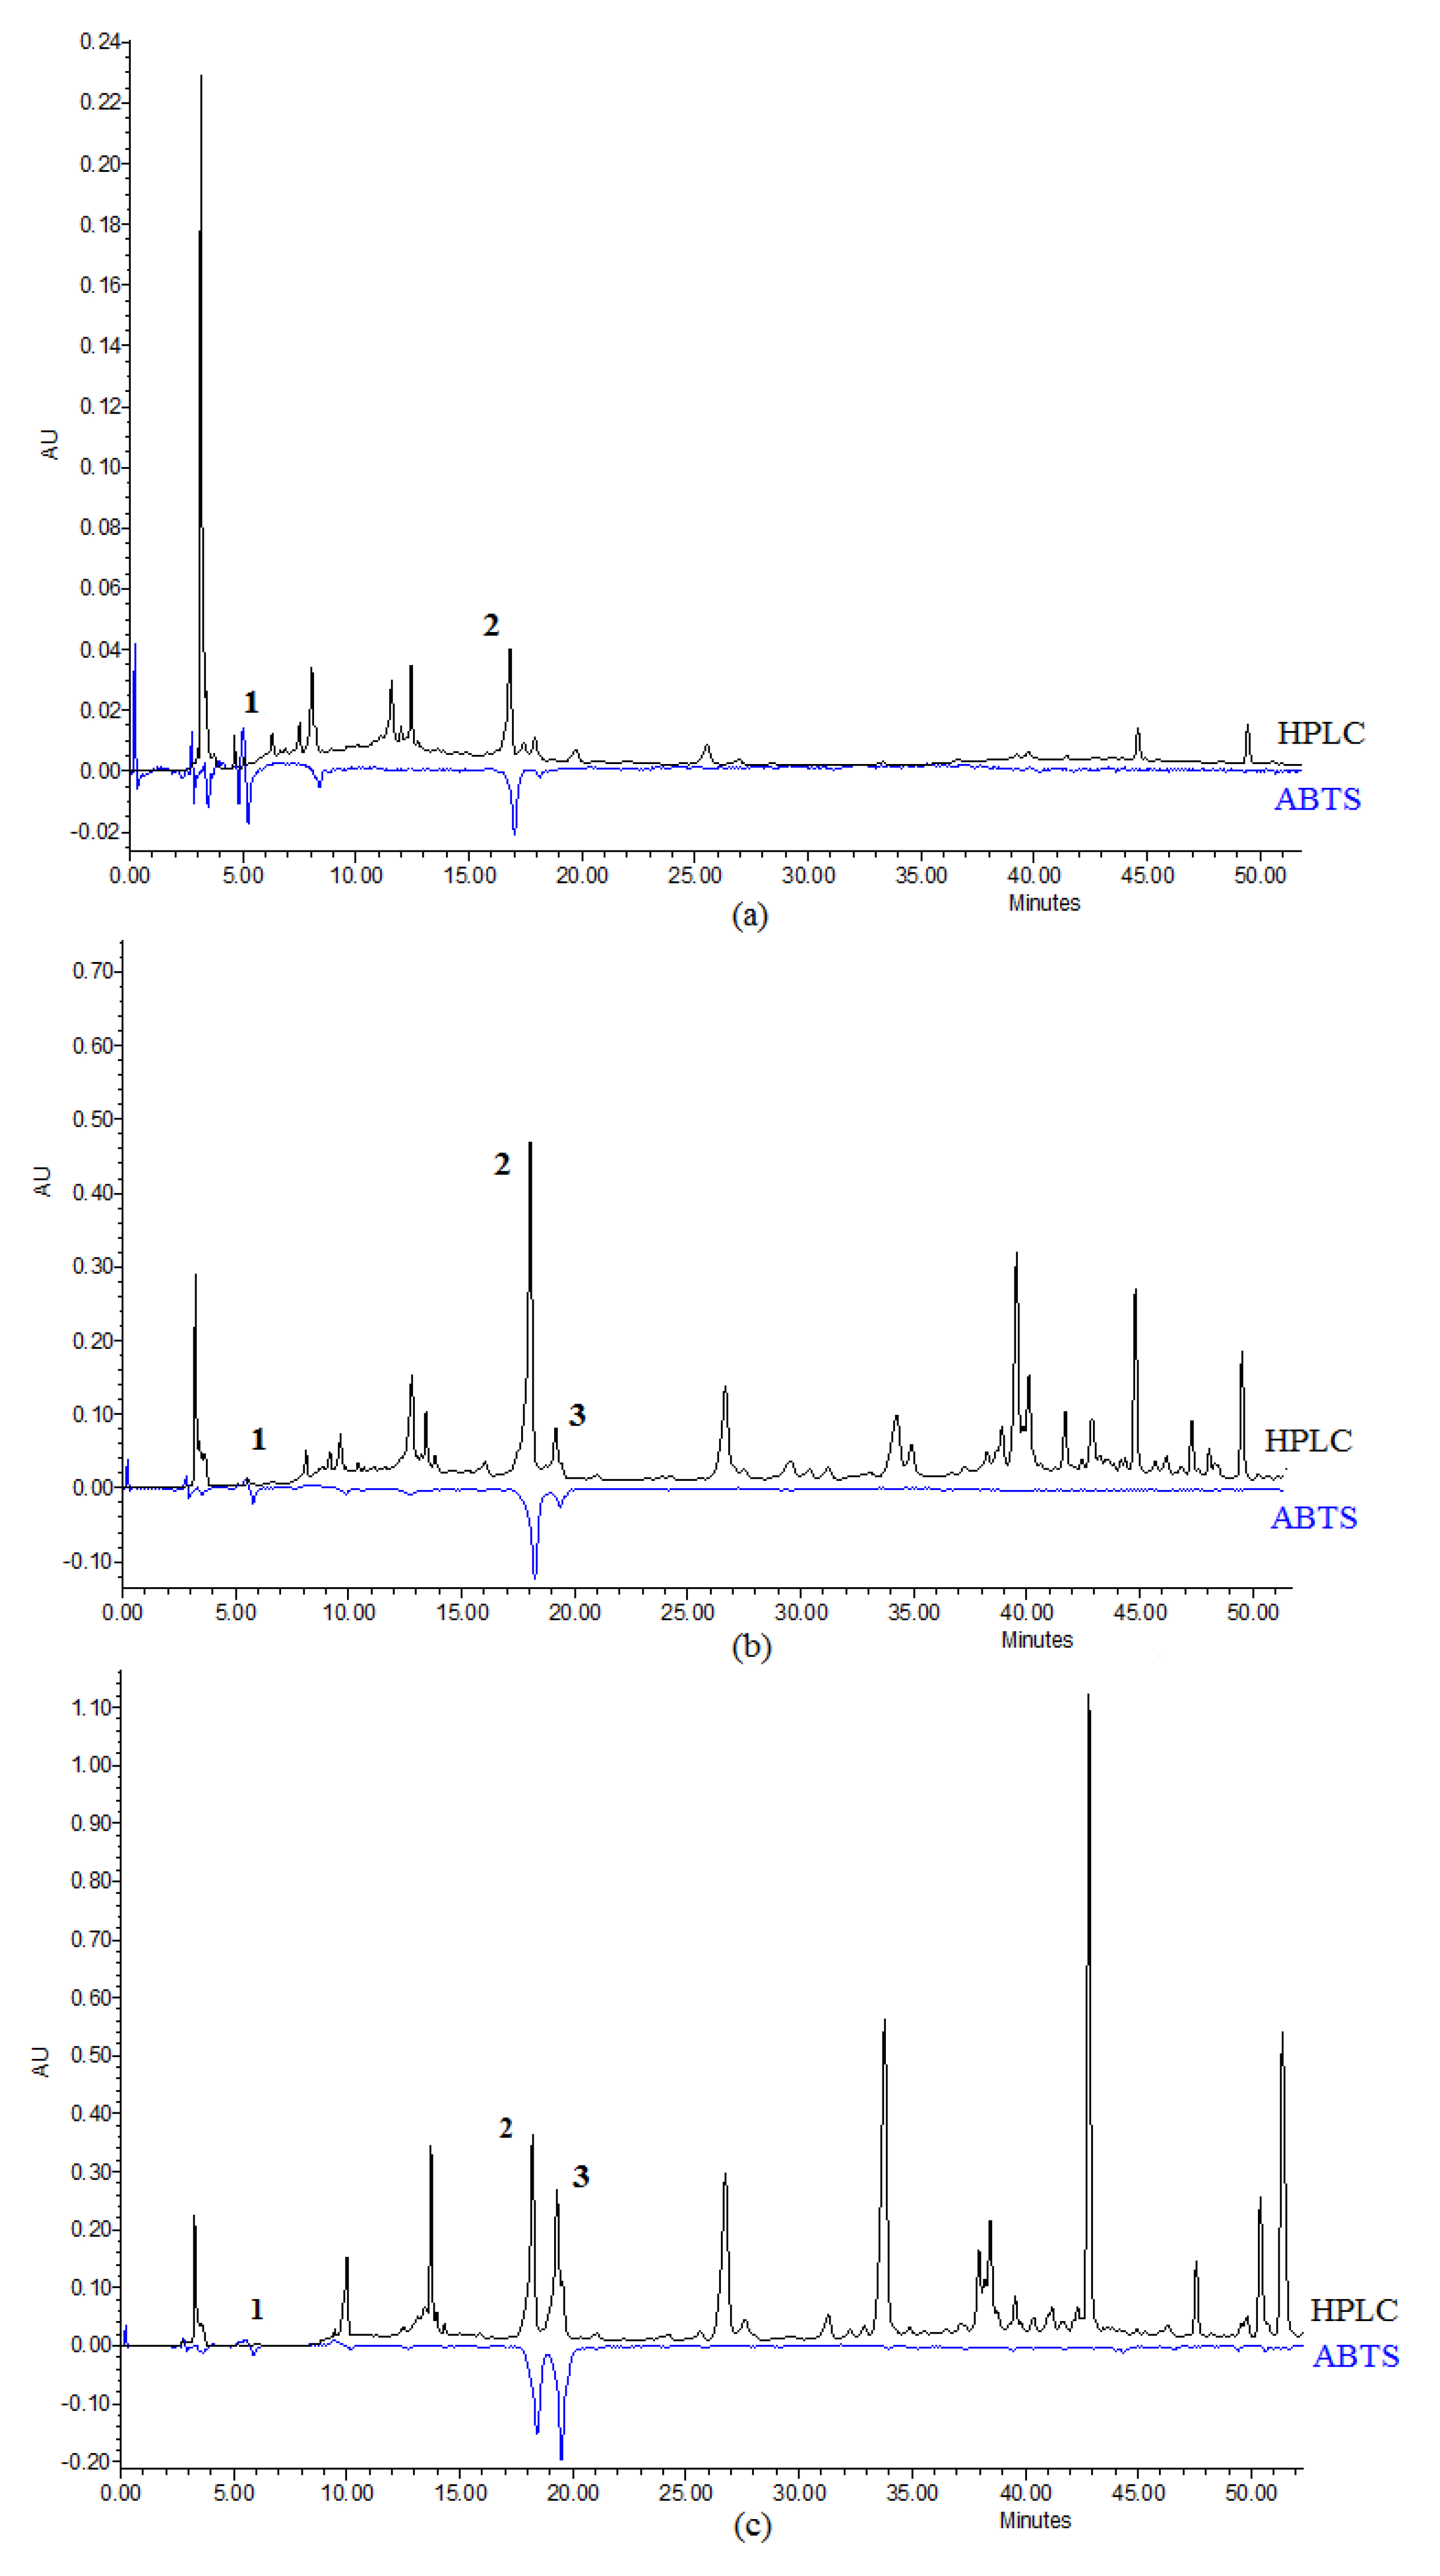
2.3. Qualitative Analysis of the Samples
2.4. Quantitative Analysis of the Samples
2.5. Pharmacology Investigation of I. variegata and I. hungarica Extracts
2.5.1. Antioxidant Activity
2.5.2. Anti-Inflammatory Activity of Iris sp. Extracts against Respiratory Burst and Degranulation by Human Neutrophils
2.5.3. Antioxidant Capacity Expressed as NRF2 Activity
2.5.4. Assessment of the Anti-Allergic Activity by the Inhibition of RBL-2H3 Cells Degranulation
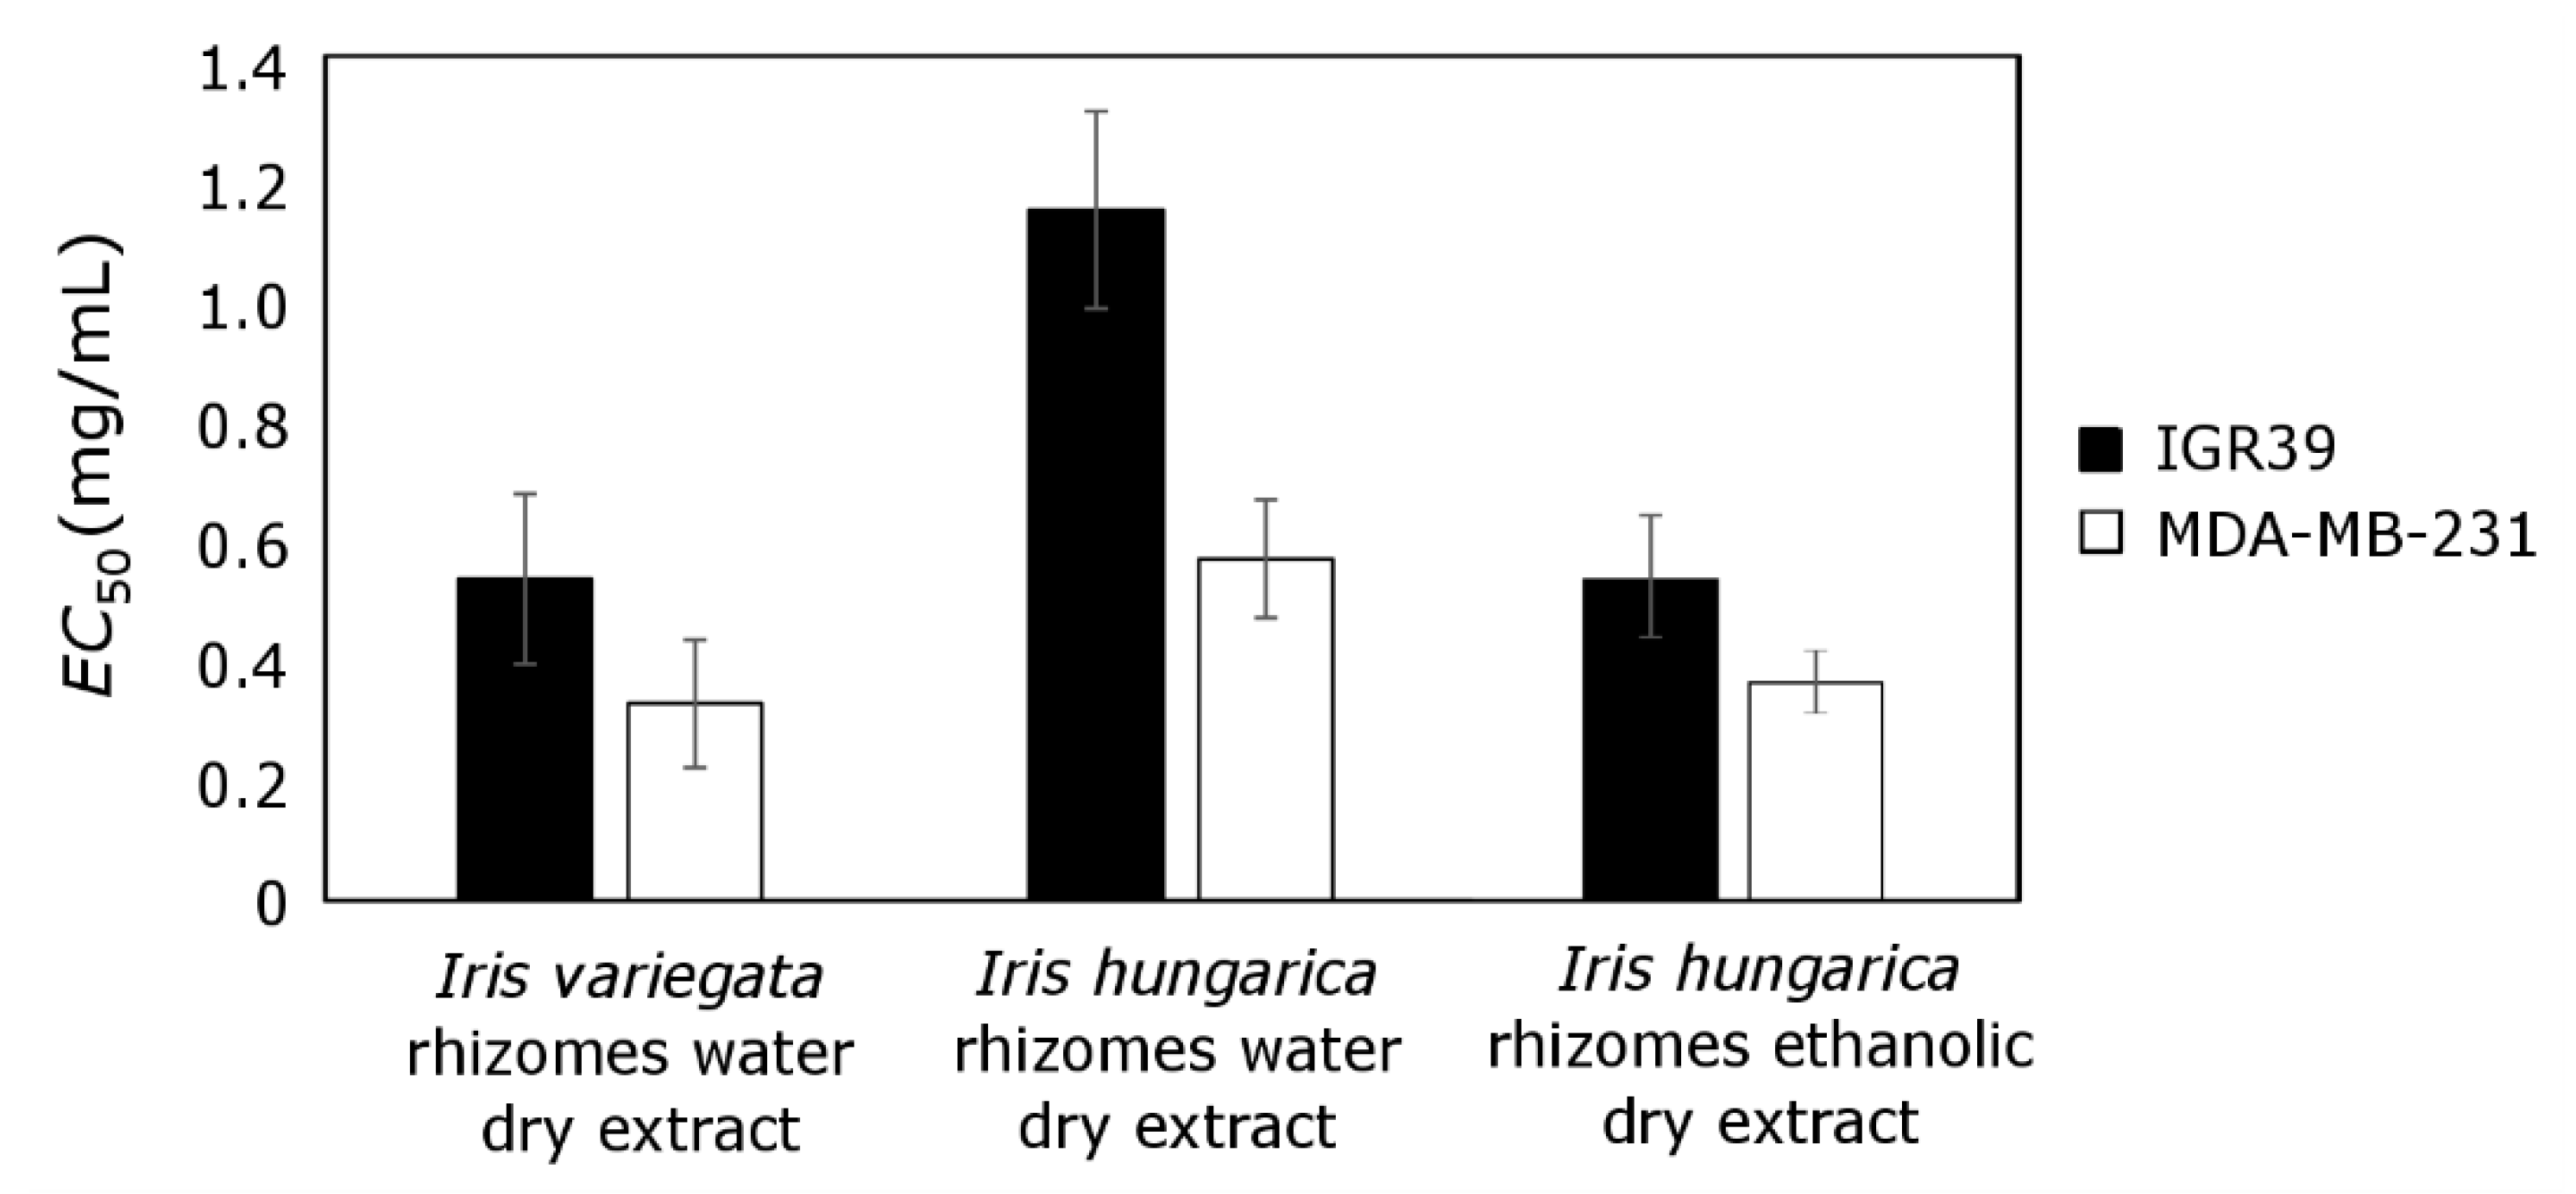
2.5.5. Cytotoxic Activity of Iris sp. Extracts
2.5.6. Lipid Formation Activity
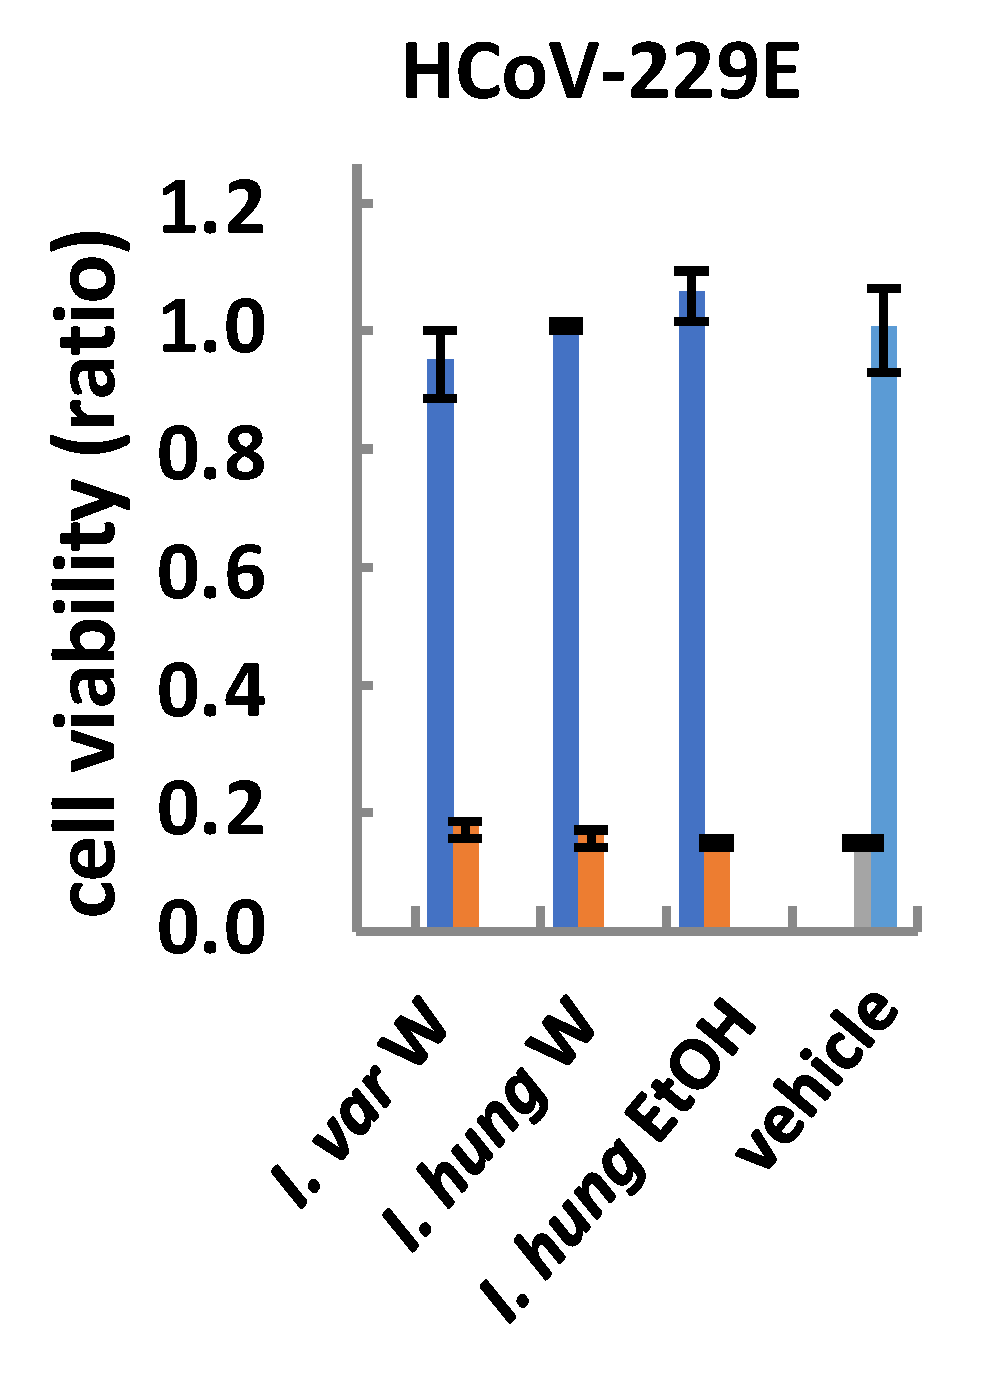
2.5.7. Human Coronavirus 229E Activity
3. Materials and Methods
3.1. Chemicals and Reagents
3.2. Plant Materials
3.3. Sample Preparation
3.4. HPLC Conditions
3.5. Chromatographic Conditions for the UPLC-MS Method
3.6. Identification of the Peaks and Peak Purity
3.7. Quantitative Determination of the Constituents
3.8. Quantitative Analysis Validation Procedures
3.9. HPLC-PDA Conditions and HPLC Post-Column Assay
3.10. Instruments
3.11. Extraction Procedure of Iris sp. for Bioassay
3.12. In-Vitro Assessment of NRF2 Activity
3.13. Lipid Droplet Assay
3.14. Assessment of Anti-Allergic Activity Using In Vitro Assay
3.15. Assessment of Anti-Inflammatory Activity Using In Vitro Assay
3.16. In Vitro Assessment of Cytotoxic Activity
3.17. Coronavirus 229E Assay
3.18. Statistical Analysis
4. Conclusions
Supplementary Materials
Author Contributions
Funding
Acknowledgments
Conflicts of Interest
Abbreviations
| ABTS | 2,2′-azino-bis (3-ethylbenzothiazoline-6-sulfonic acid) diammonium salt |
| CB | cytochalasin B |
| DMEM | Dulbecco’s modified Eagle’s medium |
| DMSO | dimethyl sulfoxide |
| DNP-BSA | dinitrophenyl-conjugated bovine serum albumin |
| FBS | fetal bovine serum |
| fMLF | formyl-methionyl-leucyl-phenylalanine |
| HPLC-DAD | high-performance liquid chromatography coupled with diode array detector |
| NRF2 | nuclear factor erythroid 2-related factor 2 |
| RBL | rat basophilic leukemia |
| UPLC-MS/MS | ultra-performance liquid chromatography coupled with tandem mass spectrometry |
References
- Kruk, J.; Aboul-Enein, H.Y.; Kladna, A.; Bowser, J.E. Oxidative stress in biological systems and its relation with pathophysiological functions: The effect of physical activity on cellular redox homeostasis. Free. Radic. Res. 2019, 53, 497–521. [Google Scholar] [CrossRef]
- Ahmadinejad, F.; Geir Moller, S.; Hashemzadeh-Chaleshtori, M.; Bidkhori, G.; Jami, M.S. Molecular mechanisms behind free radical scavengers function against oxidative stress. Antioxidants 2017, 6, 51. [Google Scholar] [CrossRef]
- Paunkov, A.; Chartoumpekis, D.V.; Ziros, P.G.; Sykiotis, G.P. A bibliometric review of the Keap1/Nrf2 pathway and its related antioxidant compounds. Antioxidants 2019, 8, 353. [Google Scholar] [CrossRef] [Green Version]
- Yang, S.C.; Chen, P.J.; Chang, S.H.; Weng, Y.T.; Chang, F.R.; Chang, K.Y.; Chen, C.Y.; Kao, T.I.; Hwang, T.L. Luteolin attenuates neutrophilic oxidative stress and inflammatory arthritis by inhibiting RAF1 activity. Biochem. Pharmacol. 2018, 154, 384–396. [Google Scholar] [CrossRef]
- Nguyen, T.H.; Le, H.D.; Kim, T.N.T.; The, H.P.; Nguyen, T.M.; Cornet, V.; Lambert, J.; Kestemont, P. Anti-inflammatory and antioxidant properties of the ethanol extract of Clerodendrum cyrtophyllum Turcz in copper sulfate-induced inflammation in zebrafish. Antioxidants 2020, 9, 192. [Google Scholar] [CrossRef] [PubMed] [Green Version]
- Xie, K.; He, X.; Chen, K.; Chen, J.; Sakao, K.; Hou, D.X. Antioxidant properties of a traditional vine tea, Ampelopsis grossedentata. Antioxidants 2019, 8, 295. [Google Scholar] [CrossRef] [PubMed] [Green Version]
- The Plant List. Available online: http://www.theplantlist.org/ (accessed on 22 February 2020).
- Goldblatt, P.; Manning, J.C. The Iris Family: Natural History and Classification; Timber Press: Portland, OR, USA, 2008. [Google Scholar]
- Panda, H. The Complete Technology Book on Herbal Perfumes & Cosmetics, 2nd ed.; NIIR Project Consultancy Services: Delhi, India, 2012. [Google Scholar]
- Adams, M.; Berset, C.; Kessler, M.; Hamburger, M. Medicinal herbs for the treatment of rheumatic disorders—A survey of European herbals from the 16th and 17th century. J. Ethnopharmacol. 2009, 121, 343–359. [Google Scholar] [CrossRef] [PubMed]
- Lim, T.K. Iris Germanica. Edible Medicinal and Non-Medicinal Plants: Vol. 11, Modified Stems, Roots, Bulbs; Springer International Publishing: Cham, Switzerland, 2016. [Google Scholar]
- Singab, A.N.B.; Ayoub, I.M.; El-Shazly, M.; Korinek, M.; Wu, T.-Y.; Cheng, Y.-B.; Chang, F.-R.; Wu, Y.-C. Shedding the light on Iridaceae: Ethnobotany, phytochemistry and biological activity. Ind. Crops Prod. 2016, 92, 308–335. [Google Scholar] [CrossRef]
- Mykhailenko, O.O.; Kovalyov, V.M.; Kovalyov, S.V.; Krechun, A.V. Biologically active compounds from the rhizomes of Iris hungarica. J. Org. Pharm. Chem. 2016, 14, 4. [Google Scholar] [CrossRef] [Green Version]
- Wang, H.; Cui, Y.; Zhao, C. Flavonoids of the genus Iris (Iridaceae). Mini Rev. Med. Chem. 2010, 10, 643–661. [Google Scholar] [CrossRef] [PubMed]
- Nazir, N.; Koul, S.; Qurishi, M.A.; Taneja, S.C.; Ahmad, S.F.; Khan, B.; Bani, S.; Qazi, G.N. Immunomodulatory activity of isoflavones isolated from Iris germanica (Iridaceae) on T-lymphocytes and cytokines. Phytother. Res. 2009, 23, 428–433. [Google Scholar] [CrossRef] [PubMed]
- Orhan, I.; Nasim, S.; Sener, B.; Ayanoglu, F.; Ozguven, M.; Choudhary, M.I.; ur-Rahman, A. Two isoflavones and bioactivity spectrum of the crude extracts of Iris germanica rhizomes. Phytother. Res. 2003, 17, 575–577. [Google Scholar] [CrossRef] [PubMed]
- Seidlová-Wuttke, D.; Hesse, O.; Jarry, H.; Rimoldi, G.; Thelen, P.; Christoffel, V.; Wuttke, W. Belamcanda chinensis and the thereof purified tectorigenin have selective estrogen receptor modulator activities. Phytomedicine 2004, 11, 392–403. [Google Scholar] [CrossRef] [PubMed]
- Kim, J.L.; Li, H.M.; Kim, Y.H.; Lee, Y.J.; Shim, J.H.; Lim, S.S.; Kang, Y.H. Osteogenic activity of yellow flag iris (Iris pseudacorus) extract modulating differentiation of osteoblasts and osteoclasts. Am. J. Chin. Med. 2012, 40, 1289–1305. [Google Scholar] [CrossRef]
- Moein, M.R.; Khan, S.I.; Ali, Z.; Ayatollahi, S.A.; Kobarfard, F.; Nasim, S.; Choudhary, M.I.; Khan, I.A. Flavonoids from Iris songarica and their antioxidant and estrogenic activity. Planta Med. 2008, 74, 1492–1495. [Google Scholar] [CrossRef] [Green Version]
- Huwaitat, S.; Al-Khateeb, E.; Finjan, S.; Maraqa, A. Antioxidant and antimicrobial activities of Iris nigricans methanolic extracts containing phenolic compounds. Eur. Sci. J. 2013, 9, 83–91. [Google Scholar]
- Basgedik, B.; Ugur, A.; Sarac, N. Antimicrobial, antioxidant, antimutagenic activities, and phenolic compounds of Iris germanica. Ind. Crops Prod. 2014, 61, 526–530. [Google Scholar] [CrossRef]
- Sofianea, G.; Wafab, N.; Loubna, A. Evaluation of antioxidant and antifungal activities of methanolic aerial part extract of Iris unguicularis Poiret. Asian J. Plant Sci. Res. 2016, 6, 18–23. [Google Scholar]
- Ochensberger, S.; Alperth, F.; Mitic, B.; Kunert, O.; Mayer, S.; Mourao, M.F.; Turek, I.; Luca, S.V.; Skalicka-Wozniak, K.; Males, Z.; et al. Phenolic compounds of Iris adriatica and their antimycobacterial effects. Acta. Pharm. 2019, 69, 673–681. [Google Scholar] [CrossRef] [Green Version]
- Hacıbekiroğlu, I.; Kolak, U. Screening antioxidant and anticholinesterase potential of Iris albicans extracts. Arab. J. Chem. 2015, 8, 264–268. [Google Scholar] [CrossRef] [Green Version]
- Wollenweber, E.; Stevens, J.F.; Klimo, K.; Knauft, J.; Frank, N.; Gerhauser, C. Cancer chemopreventive in vitro activities of isoflavones isolated from Iris germanica. Planta Med. 2003, 69, 15–20. [Google Scholar] [CrossRef] [PubMed]
- Choudhary, D.; Alam, A. Pharmacology and phytochemistry of isoflavonoids from Iris species. J. Pharmacol. Clin. Res. 2017, 3, 1–6. [Google Scholar]
- Xie, G.Y.; Zhu, Y.; Shu, P.; Qin, X.Y.; Wu, G.; Wang, Q.; Qin, M.J. Phenolic metabolite profiles and antioxidants assay of three Iridaceae medicinal plants for traditional Chinese medicine "She-gan" by on-line HPLC-DAD coupled with chemiluminescence (CL) and ESI-Q-TOF-MS/MS. J. Pharm. Biomed. Anal. 2014, 98, 40–51. [Google Scholar] [CrossRef] [PubMed]
- Kostic, A.Z.; Gasic, U.M.; Pesic, M.B.; Stanojevic, S.P.; Barac, M.B.; Macukanovic-Jocic, M.P.; Avramov, S.N.; Tesic, Z.L. Phytochemical analysis and total antioxidant capacity of rhizome, above-ground vegetative parts and flower of three Iris species. Chem. Biodivers. 2019, 16, e1800565. [Google Scholar] [CrossRef] [Green Version]
- Bisognin, D.A.; Luz, L.V.d.; Lencina, K.H.; Santos, C.O.d.; Sautter, C.K. Contents of total phenolics and flavonoids in and antioxidant activity of Ilex paraguariensis leaves. Pesqui. Agropecu. Bras. 2019, 54. [Google Scholar] [CrossRef]
- Wu, Z.; Ren, S.; Chen, T.; Hui, A.; Zhang, W. Separation and purification of six isoflavones from Iris tectorum Maxim by macroporous resin-based column chromatography coupled with preparative high-performance liquid chromatography. Sep. Sci. Technol. 2020, 55, 1686–1694. [Google Scholar] [CrossRef]
- Alam, A.; Jaiswal, V.; Akhtar, S.; Jayashree, B.S.; Dhar, K.L. Isolation of isoflavones from Iris kashmiriana Baker as potential anti proliferative agents targeting NF-kappaB. Phytochemistry 2017, 136, 70–80. [Google Scholar] [CrossRef]
- Huwaitat, S.; Al-Khateeb, E.; Finjan, S. Isolation and identification of some phytochemical compounds from different parts of Iris nigricans. Eur. Sci. J. 2013, 9, 213–218. [Google Scholar]
- Conforti, F.; Menichini, F.; Rigano, D.; Senatore, F. Antiproliferative activity on human cancer cell lines after treatment with polyphenolic compounds isolated from Iris pseudopumila flowers and rhizomes. Z. Naturforsch. C J. Biosci. 2009, 64, 490–494. [Google Scholar] [CrossRef] [Green Version]
- Blicharski, T.; Oniszczuk, A. Extraction methods for the isolation of isoflavonoids from plant material. Open Chem. 2017, 15, 34–45. [Google Scholar] [CrossRef]
- Kukula-Koch, W.; Sieniawska, E.; Widelski, J.; Urjin, O.; Glowniak, P.; Skalicka-Wozniak, K. Major secondary metabolites of Iris spp. Phytochem. Rev. 2015, 14, 51–80. [Google Scholar] [CrossRef]
- Kumar, S.; Singh, A.; Kumar, B. Identification and characterization of phenolics and terpenoids from ethanolic extracts of Phyllanthus species by HPLC-ESI-QTOF-MS/MS. J. Pharm. Anal. 2017, 7, 214–222. [Google Scholar] [CrossRef] [PubMed]
- Gouveia-Figueira, S.C.; Castilho, P.C. Phenolic screening by HPLC–DAD–ESI/MSn and antioxidant capacity of leaves, flowers and berries of Rubus grandifolius Lowe. Ind. Crops Prod. 2015, 73, 28–40. [Google Scholar] [CrossRef]
- Bhat, G.; Shawl, A.S.; Shah, Z.; Tantry, M. HPLC-DAD-ESI-MS/MS identification and characterization of major constituents of Iris crocea, Iris germanica and Iris spuria growing in Kashmir Himalayas, India. J. Anal. Bioanal. Tech. 2014, 5, 1000223. [Google Scholar] [CrossRef] [Green Version]
- Sajad, H.W.; Amin, A.; Sofi, S.N.; Mokhdomi, T.A.; Bukhari, S.; Hassan, Q.P.; Shoiab, B.; Qazi, P.H.; Raies, A.Q. RP-HPLC facilitated quantitative analysis of tectorigenin in the different species of Iris plant and evaluation of its in vitro anticancer potential. Int. J. Curr. Res. 2013, 5, 206–211. [Google Scholar]
- Shu, P.; Hong, J.-L.; Wu, G.; Yu, B.-Y.; Qin, M.-J. Analysis of flavonoids and phenolic acids in Iris tectorum by HPLC-DAD-ESI-MSn. Chin. J. Nat. Med. 2010, 8, 202–207. [Google Scholar] [CrossRef]
- Wei, Y.; Shu, P.; Hong, J.; Qin, M. Qualitative and quantitative evaluation of phenolic compounds in Iris dichotoma Pall. Phytochem. Anal. 2012, 23, 197–207. [Google Scholar] [CrossRef]
- Li, M.; Hou, X.F.; Zhang, J.; Wang, S.C.; Fu, Q.; He, L.C. Applications of HPLC/MS in the analysis of traditional Chinese medicines. J. Pharm. Anal. 2011, 1, 81–91. [Google Scholar] [CrossRef] [Green Version]
- Alperth, F.; Mitic, B.; Mayer, S.; Males, Z.; Kunert, O.; Hrusevar, D.; Bucar, F. Metabolic profiling of rhizomes of native populations of the strictly endemic Croatian species Iris adriatica. Plant Biosyst. 2019, 153, 317–324. [Google Scholar] [CrossRef] [Green Version]
- Boligon, A.A.; Athayde, M.L. Importance of HPLC in analysis of plants extracts. Austin Chromatogr. 2014, 1, 2. [Google Scholar]
- Isaey, D.I.; Cerimov, Y.B.; Kovalyov, S.V.; Zatylnikova, O.A. Isoflavones of the rhizomes of Iris imbricata and Iris pseudacorus. Farmacom 2010, 1, 38–42. [Google Scholar]
- Kovalev, V.N.; Zatyl'nikova, O.A.; Kovalev, S.V. A new isoflavone from Iris pseudacorus. Chem. Nat. Compd. 2013, 49, 34–35. [Google Scholar] [CrossRef]
- Mykhailenko, O.; Kovalyov, V.; Kovalyov, S.; Krechun, A. Isoflavonoids from the rhizomes of Iris hungarica and antibacterial activity of the dry rhizomes extract. Ars Pharm. 2017, 58, 39–45. [Google Scholar]
- Fabre, N.; Rustan, I.; de Hoffmann, E.; Quetin-Leclercq, J. Determination of flavone, flavonol, and flavanone aglycones by negative ion liquid chromatography electrospray ion trap mass spectrometry. J. Am. Soc. Mass Spectrom. 2001, 12, 707–715. [Google Scholar] [CrossRef] [Green Version]
- Fernandes, F.H.; Salgado, H.R. Gallic acid: Review of the methods of determination and quantification. Crit. Rev. Anal. Chem. 2016, 46, 257–265. [Google Scholar] [CrossRef]
- Rafiee, S.A.; Farhoosh, R.; Sharif, A. Antioxidant activity of gallic acid as affected by an extra carboxyl group than pyrogallol in various oxidative environments. Eur. J. Lipid Sci. Tech. 2018, 120, 1800319. [Google Scholar] [CrossRef]
- Jiang, R.W.; Lau, K.M.; Hon, P.M.; Mak, T.C.; Woo, K.S.; Fung, K.P. Chemistry and biological activities of caffeic acid derivatives from Salvia miltiorrhiza. Curr. Med. Chem. 2005, 12, 237–246. [Google Scholar] [CrossRef]
- Ru, W.; Pang, Y.; Gan, Y.; Liu, Q.; Bao, J. Phenolic compounds and antioxidant activities of potato cultivars with white, yellow, red and purple flesh. Antioxidants 2019, 8, 419. [Google Scholar] [CrossRef] [Green Version]
- Mykhailenko, O.; Gudzinskas, Z.; Kovalyov, V.; Desenko, V.; Ivanauskas, L.; Bezruk, I.; Georgiyants, V. Effect of ecological factors on the accumulation of phenolic compounds in Iris species from Latvia, Lithuania and Ukraine. Phytochem. Anal. 2020. [Google Scholar] [CrossRef]
- Iwashina, T.; Otani, S. Flavonoids of the genus Iris: Structures, distribution and function (review). Ann. Tsukuba Bot. Gard. 1998, 17, 147–183. [Google Scholar]
- Roger, B.; Jeannot, V.; Fernandez, X.; Cerantola, S.; Chahboun, J. Characterisation and quantification of flavonoids in Iris germanica L. and Iris pallida Lam. resinoids from Morocco. Phytochem. Anal. 2012, 23, 450–455. [Google Scholar] [CrossRef] [PubMed]
- Zheng, M.S.; Lu, Z.Y. Antiviral effect of mangiferin and isomangiferin on herpes simplex virus. Chin. Med. J. 1990, 103, 160–165. [Google Scholar] [PubMed]
- Rajendran, P.; Jayakumar, T.; Nishigaki, I.; Ekambaram, G.; Nishigaki, Y.; Vetriselvi, J.; Sakthisekaran, D. Immunomodulatory effect of mangiferin in experimental animals with benzo(a)pyrene-induced lung carcinogenesis. Int. J. Biomed. Sci. 2013, 9, 68–74. [Google Scholar] [PubMed]
- Pan, J.; Yi, X.; Zhang, S.; Cheng, J.; Wang, Y.; Liu, C.; He, X. Bioactive phenolics from mango leaves (Mangifera indica L.). Ind. Crops Prod. 2018, 111, 400–406. [Google Scholar] [CrossRef]
- Saha, S.; Sadhukhan, P.; Sil, P.C. Mangiferin: A xanthonoid with multipotent anti-inflammatory potential. Biofactors 2016, 42, 459–474. [Google Scholar] [CrossRef]
- Zhu, Y.; Pu, B.Q.; Xie, G.Y.; Tian, M.; Xu, F.Y.; Qin, M.J. Dynamic changes of flavonoids contents in the different parts of rhizome of Belamcanda chinensis during the thermal drying process. Molecules 2014, 19, 10440–10454. [Google Scholar] [CrossRef] [Green Version]
- Atta Ur, R.; Nasim, S.; Baig, I.; Ara Jahan, I.; Sener, B.; Orhan, I.; Choudhary, M.I. Isoflavonoid glycosides from the rhizomes of Iris germanica. Chem. Pharm. Bull. 2002, 50, 1100–1102. [Google Scholar] [CrossRef] [Green Version]
- Xu, Z.; Meenu, M.; Chen, P.; Xu, B. Comparative study on phytochemical profiles and antioxidant capacities of chestnuts produced in different geographic area in China. Antioxidants 2020, 9, 190. [Google Scholar] [CrossRef] [Green Version]
- Marksa, M.; Zymone, K.; Ivanauskas, L.; Radusiene, J.; Pukalskas, A.; Raudone, L. Antioxidant profiles of leaves and inflorescences of native, invasive and hybrid Solidago species. Ind. Crops Prod. 2020, 145, 112123. [Google Scholar] [CrossRef]
- Liu, T.; Li, Z.; Li, R.; Cui, Y.; Zhao, Y.; Yu, Z. Composition analysis and antioxidant activities of the Rhus typhina L. stem. J. Pharm. Anal. 2019, 9, 332–338. [Google Scholar] [CrossRef]
- Ksouda, G.; Hajji, M.; Sellimi, S.; Merlier, F.; Falcimaigne-Cordin, A.; Nasri, M.; Thomasset, B. A systematic comparison of 25 Tunisian plant species based on oil and phenolic contents, fatty acid composition and antioxidant activity. Ind. Crops Prod. 2018, 123, 768–778. [Google Scholar] [CrossRef]
- Babbar, N.; Oberoi, H.S.; Sandhu, S.K. Therapeutic and nutraceutical potential of bioactive compounds extracted from fruit residues. Crit. Rev. Food Sci. Nutr. 2015, 55, 319–337. [Google Scholar] [CrossRef] [PubMed]
- Vargas-Mendoza, N.; Morales-Gonzalez, A.; Madrigal-Santillan, E.O.; Madrigal-Bujaidar, E.; Alvarez-Gonzalez, I.; Garcia-Melo, L.F.; Anguiano-Robledo, L.; Fregoso-Aguilar, T.; Morales-Gonzalez, J.A. Antioxidant and adaptative response mediated by NRF2 during physical exercise. Antioxidants 2019, 8, 196. [Google Scholar] [CrossRef] [PubMed] [Green Version]
- Molagoda, I.M.N.; Lee, K.T.; Choi, Y.H.; Kim, G.Y. Anthocyanins from Hibiscus syriacus L. inhibit oxidative stress-mediated apoptosis by activating the NRF2/HO-1 signaling pathway. Antioxidants 2020, 9, 42. [Google Scholar] [CrossRef] [Green Version]
- Chen, B.H.; Kilmon, M.A.; Ma, C.; Caven, T.H.; Chan-Li, Y.; Shelburne, A.E.; Tombes, R.M.; Roush, E.; Conrad, D.H. Temperature effect on IgE binding to CD23 versus FCεRI. J. Immunol. 2003, 170, 1839–1845. [Google Scholar] [CrossRef] [Green Version]
- Amin, A.; Wani, S.H.; Mokhdomi, T.A.; Bukhari, S.; Wafai, A.H.; Mir, J.I.; Hassan, Q.P.; Qadri, R.A. Investigating the pharmacological potential of Iris kashmiriana in limiting growth of epithelial tumors. Pharmacogn. J. 2013, 5, 170–175. [Google Scholar] [CrossRef]
- Lee, K.L.; Kuo, Y.C.; Ho, Y.S.; Huang, Y.H. Triple-negative breast cancer: Current understanding and future therapeutic breakthrough targeting cancer stemness. Cancers 2019, 11, 1334. [Google Scholar] [CrossRef] [Green Version]
- Yen, C.H.; Chang, H.S.; Yang, T.H.; Wang, S.F.; Wu, H.C.; Chen, Y.C.; Lin, K.J.; Wang, S. High-content screening of a taiwanese indigenous plant extract library identifies Syzygium simile leaf extract as an inhibitor of fatty acid uptake. Int. J. Mol. Sci. 2018, 19, 2130. [Google Scholar] [CrossRef] [Green Version]
- Rohwedder, A.; Zhang, Q.; Rudge, S.A.; Wakelam, M.J. Lipid droplet formation in response to oleic acid in Huh-7 cells is mediated by the fatty acid receptor FFAR4. J. Cell Sci. 2014, 127, 3104–3115. [Google Scholar] [CrossRef] [Green Version]
- Matsuda, D.; Namatame, I.; Ohshiro, T.; Ishibashi, S.; Omura, S.; Tomoda, H. Anti-atherosclerotic activity of triacsin C, an acyl-CoA synthetase inhibitor. J. Antibiot. 2008, 61, 318–321. [Google Scholar] [CrossRef] [Green Version]
- Zumla, A.; Chan, J.F.; Azhar, E.I.; Hui, D.S.; Yuen, K.Y. Coronaviruses-drug discovery and therapeutic options. Nat. Rev. Drug Discov. 2016, 15, 327–347. [Google Scholar] [CrossRef] [PubMed] [Green Version]
- Q2 (R1) Validation of Analytical Procedures: Text and Methodology. Available online: https://www.fda.gov/regulatory-information/search-fda-guidance-documents/q2-r1-validation-analytical-procedures-text-and-methodology (accessed on 22 February 2020).
- Marksa, M.; Radusiene, J.; Jakstas, V.; Ivanauskas, L.; Marksiene, R. Development of an HPLC post-column antioxidant assay for Solidago canadensis radical scavengers. Nat. Prod. Res. 2016, 30, 536–543. [Google Scholar] [CrossRef] [PubMed]
- Chen, Y.S.; Lai, C.C.; Kuo, Y.P.; Chang, H.S.; Chen, I.S.; Yen, C.H. Identification of compound isolated from Beilschmiedia tsangii as a liver cancer specific NRF2 inhibitor. In: Proceedings of the American Association for Cancer Research Annual Meeting 2017; 2017 Apr 1–5; Washington, DC. Philadelphia (PA): AACR. Cancer Res. 2017, 77, Abstract nr 190. [Google Scholar]
- Marks, D.C.; Belov, L.; Davey, M.W.; Davey, R.A.; Kidman, A.D. The MTT cell viability assay for cytotoxicity testing in multidrug-resistant human leukemic cells. Leuk. Res. 1992, 16, 1165–1173. [Google Scholar] [CrossRef]
- Korinek, M.; Chen, K.M.; Jiang, Y.H.; El-Shazly, M.; Stocker, J.; Chou, C.K.; Hwang, T.L.; Wu, Y.C.; Chen, B.H.; Chang, F.R. Anti-allergic potential of Typhonium blumei: Inhibition of degranulation via suppression of PI3K/PLCγ2 phosphorylation and calcium influx. Phytomedicine 2016, 23, 1706–1715. [Google Scholar] [CrossRef] [PubMed]
- Chen, B.H.; Wu, P.Y.; Chen, K.M.; Fu, T.F.; Wang, H.M.; Chen, C.Y. Antiallergic potential on RBL-2H3 cells of some phenolic constituents of Zingiber officinale (ginger). J. Nat. Prod. 2009, 72, 950–953. [Google Scholar] [CrossRef]
- Ayoub, I.M.; Korinek, M.; Hwang, T.-L.; Chen, B.-H.; Chang, F.-R.; El-Shazly, M.; Singab, A.N.B. Probing the antiallergic and anti-inflammatory activity of biflavonoids and dihydroflavonols from Dietes bicolor. J. Nat. Prod. 2018, 81, 243–253. [Google Scholar] [CrossRef]
- Korinek, M.; Tsai, Y.H.; El-Shazly, M.; Lai, K.H.; Backlund, A.; Wu, S.F.; Lai, W.C.; Wu, T.Y.; Chen, S.L.; Wu, Y.C.; et al. Anti-allergic hydroxy fatty acids from Typhonium blumei explored through ChemGPS-NP. Front. Pharmacol. 2017, 8, 356. [Google Scholar] [CrossRef] [Green Version]
- Boyum, A. Isolation of mononuclear cells and granulocytes from human blood. Isolation of monuclear cells by one centrifugation, and of granulocytes by combining centrifugation and sedimentation at 1 g. Scand. J. Clin. Lab. Invest. Suppl. 1968, 97, 77–89. [Google Scholar]
- Yang, S.C.; Chung, P.J.; Ho, C.M.; Kuo, C.Y.; Hung, M.F.; Huang, Y.T.; Chang, W.Y.; Chang, Y.W.; Chan, K.H.; Hwang, T.L. Propofol inhibits superoxide production, elastase release, and chemotaxis in formyl peptide-activated human neutrophils by blocking formyl peptide receptor 1. J. Immunol. 2013, 190, 6511–6519. [Google Scholar] [CrossRef] [Green Version]
- Hwang, T.L.; Su, Y.C.; Chang, H.L.; Leu, Y.L.; Chung, P.J.; Kuo, L.M.; Chang, Y.J. Suppression of superoxide anion and elastase release by C18 unsaturated fatty acids in human neutrophils. J. Lipid Res. 2009, 50, 1395–1408. [Google Scholar] [CrossRef] [PubMed] [Green Version]
- Ceponyte, U.; Paskeviciute, M.; Petrikaite, V. Comparison of NSAIDs activity in COX-2 expressing and non-expressing 2D and 3D pancreatic cancer cell cultures. Cancer Manag. Res. 2018, 10, 1543–1551. [Google Scholar] [CrossRef] [PubMed] [Green Version]
- Hsieh, C.F.; Jheng, J.R.; Lin, G.H.; Chen, Y.L.; Ho, J.Y.; Liu, C.J.; Hsu, K.Y.; Chen, Y.S.; Chan, Y.F.; Yu, H.M.; et al. Rosmarinic acid exhibits broad anti-enterovirus A71 activity by inhibiting the interaction between the five-fold axis of capsid VP1 and cognate sulfated receptors. Emerg. Microbes Infect. 2020, 9, 1194–1205. [Google Scholar] [CrossRef] [PubMed]
Sample Availability: Samples of the compounds gallic acid, mangiferin, caffeic acid, tectoridin, germanaism B, irisolidone-7-O-β-d-glucopyranoside, iristectorigenin B, nigricin, irigenin, 5,6-dihydroxy-7,8,3′,5′-tetramethoxyisoflavone, and irisolidone are available from the authors. |


| Peak No | Compound | Calibration Curve a | Correlation Coefficient r2 (n = 6) | Linear Range (μg/mL) | RSD (%) | LOD b (ng/mL) | LOQ c (ng/mL) |
|---|---|---|---|---|---|---|---|
| 1 | Gallic acid | y = 32880.6x − 612.983 | 0.9999718 | 0.48–61.08 | 1.31 | 30 | 100 |
| 2 | Mangiferin | y = 29263.5x + 13863.9 | 0.9997952 | 0.28–145.00 | 1.32 | 310 | 940 |
| 3 | Caffeic acid | y = 57646.8x − 3853.48 | 0.9999218 | 0.72–91.92 | 1.56 | 20 | 60 |
| 4 | Tectoridin | y = 76104.4x + 114152 | 0.9995802 | 0.51–260.00 | 0.55 | 130 | 400 |
| 5 | Germanaism B | y = 60944.8x + 123042 | 0.9993218 | 0.58–298.00 | 0.46 | 50 | 160 |
| 6 | Irisolidone d-glucoside | y = 29507.2x + 5569.89 | 0.999981 | 0.49–63.1 | 0.98 | 30 | 90 |
| 7 | Iristectorigenin B | y = 109562x + 68062.7 | 0.9996806 | 0.23–120.00 | 0.85 | 50 | 150 |
| 8 | Nigricin | y = 89415.4x + 103288 | 0.9994037 | 0.35–181.00 | 0.30 | 40 | 130 |
| 9 | Irigenin | y = 81832.6x + 137668 | 0.9994881 | 0.54–277.00 | 0.64 | 50 | 160 |
| 10 | 5,6-Dihydroxy-7,8,3′,5′-tetramethoxyisoflavone | y = 86268.5x + 59193.5 | 0.9996879 | 0.26–132.00 | 0.54 | 70 | 210 |
| 11 | Irisolidone | y = 54297.4x + 9147.67 | 0.999988 | 0.54–69.77 | 1.26 | 10 | 30 |
| Peak No. | Compound | Concentration (µg/mL) | Precision | Repeatability | ||||
|---|---|---|---|---|---|---|---|---|
| Intra-Day (n = 3) | Inter-Day (n = 3) | Recovery (%) | RSD (%) | |||||
| RSD (%) | Accuracy (%) | RSD (%) | Accuracy (%) | |||||
| 1 | Gallic acid | 7.65 | 0.57 | 99.81 | 0.75 | 101.37 | 101.07 | 0.65 |
| 30.35 | 0.78 | 99.56 | 0.24 | 102.14 | 99.69 | 0.56 | ||
| 61.20 | 1.02 | 101.53 | 0.38 | 101.32 | 100.09 | 0.94 | ||
| 2 | Mangiferin | 9.06 | 0.33 | 100.46 | 0.29 | 100.41 | 100.29 | 0.25 |
| 36.25 | 0.24 | 99.66 | 0.32 | 100.45 | 100.03 | 0.39 | ||
| 145 | 0.22 | 100.32 | 1.10 | 98.45 | 99.58 | 0.99 | ||
| 3 | Caffeic acid | 11.49 | 1.05 | 102.02 | 0.52 | 98.49 | 100.01 | 0.46 |
| 45.96 | 1.08 | 98.78 | 0.67 | 99.73 | 99.39 | 0.99 | ||
| 91.92 | 0.64 | 100.35 | 0.95 | 98.17 | 100.17 | 0.37 | ||
| 4 | Tectoridin | 16.25 | 1.35 | 101.93 | 1.57 | 102.24 | 101.39 | 0.98 |
| 65 | 1.13 | 101.92 | 0.72 | 101.03 | 100.98 | 0.95 | ||
| 260 | 0.30 | 99.57 | 0.03 | 99.96 | 99.84 | 0.23 | ||
| 5 | Germanaism B | 18.62 | 0.65 | 100.92 | 0.16 | 100.23 | 100.38 | 0.48 |
| 74.5 | 1.07 | 101.52 | 1.50 | 102.15 | 101.22 | 0.99 | ||
| 298 | 0.64 | 99.09 | 0.93 | 98.69 | 99.26 | 0.68 | ||
| 6 | Irisolidone-d-glucoside | 0.49 | 1.07 | 98.35 | 0.92 | 101.64 | 100.34 | 1.05 |
| 7.88 | 0.95 | 101.38 | 0.73 | 99.32 | 98.07 | 0.97 | ||
| 31.55 | 1.02 | 100.44 | 0.94 | 99.78 | 100.74 | 0.31 | ||
| 7 | Iristectorigenin B | 7.5 | 1.23 | 101.76 | 1.64 | 102.35 | 101.36 | 0.97 |
| 30 | 1.01 | 102.88 | 1.23 | 101.76 | 101.54 | 1.01 | ||
| 120 | 0.07 | 99.90 | 0.33 | 99.53 | 99.81 | 0.25 | ||
| 8 | Nigricin | 11.31 | 1.19 | 101.70 | 1.21 | 101.73 | 101.14 | 0.98 |
| 45.25 | 0.37 | 99.47 | 1.19 | 101.70 | 100.39 | 0.96 | ||
| 181 | 0.57 | 99.19 | 0.48 | 99.33 | 99.50 | 0.43 | ||
| 9 | Irigenin | 17.31 | 1.08 | 101.54 | 1.29 | 101.84 | 101.12 | 0.98 |
| 69.25 | 0.80 | 101.14 | 1.16 | 101.65 | 100.93 | 0.84 | ||
| 277 | 0.33 | 99.53 | 0.20 | 99.71 | 99.74 | 0.24 | ||
| 10 | 5,6-Dihydroxy-7,8,3′,5′-tetrametoxyisoflavone | 8.25 | 0.43 | 100.61 | 0.77 | 101.09 | 100.56 | 0.54 |
| 33 | 0.06 | 100.08 | 0.52 | 100.74 | 100.27 | 0.41 | ||
| 132 | 0.18 | 99.74 | 0.80 | 98.88 | 99.54 | 0.59 | ||
| 11 | Irisolidone | 0.54 | 1.07 | 98.74 | 0.52 | 98.24 | 100.06 | 0.52 |
| 8.72 | 1.12 | 101.20 | 0.67 | 99.41 | 99.69 | 0.85 | ||
| 34.88 | 0.42 | 100.29 | 0.95 | 100.86 | 100.77 | 0.20 | ||
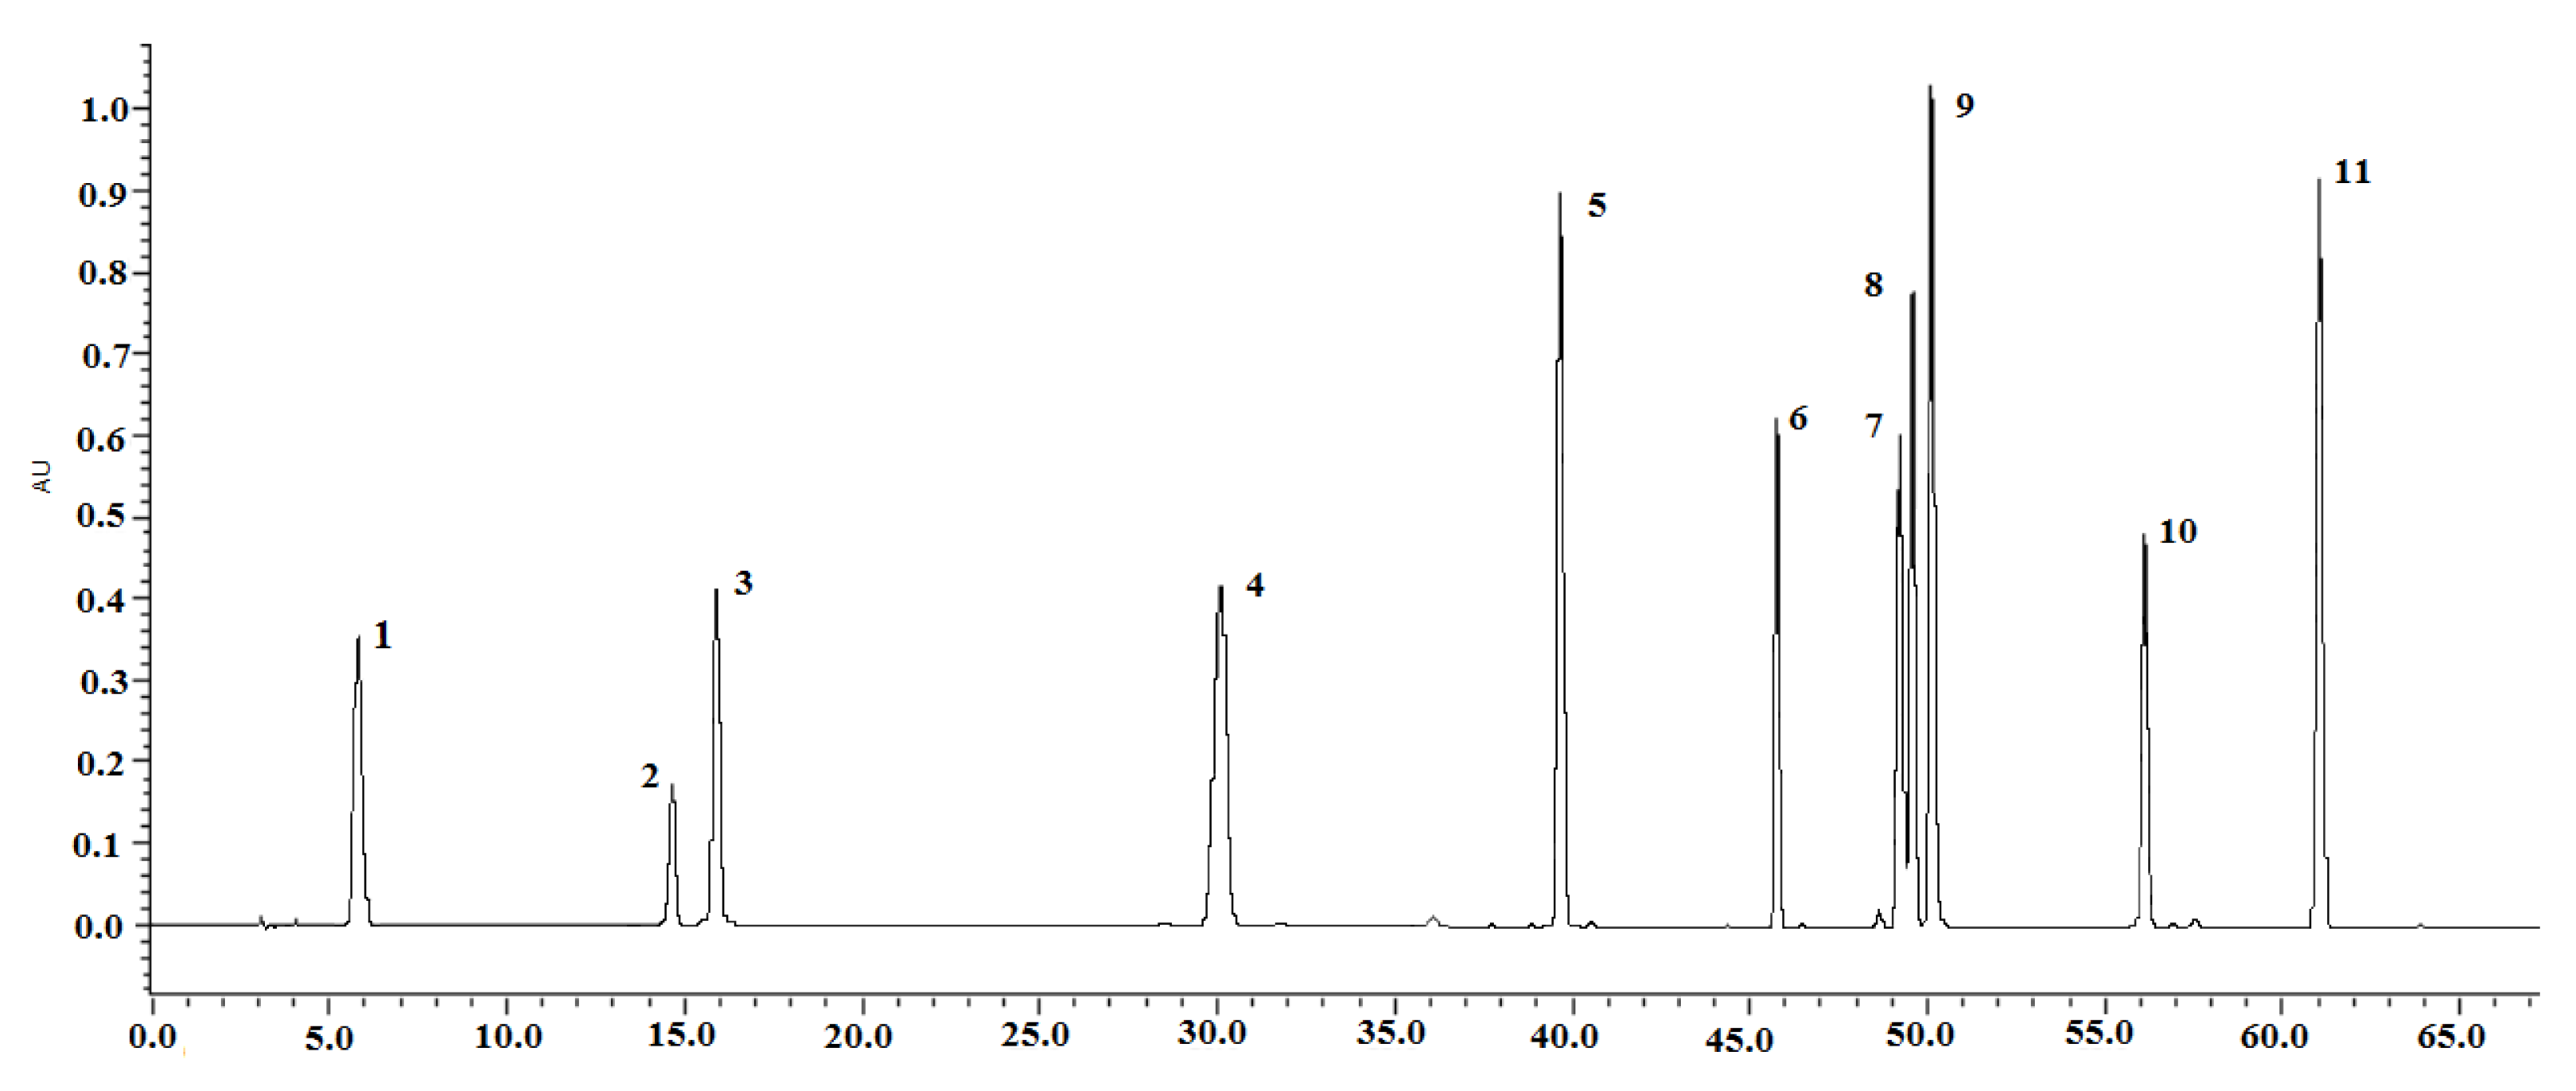
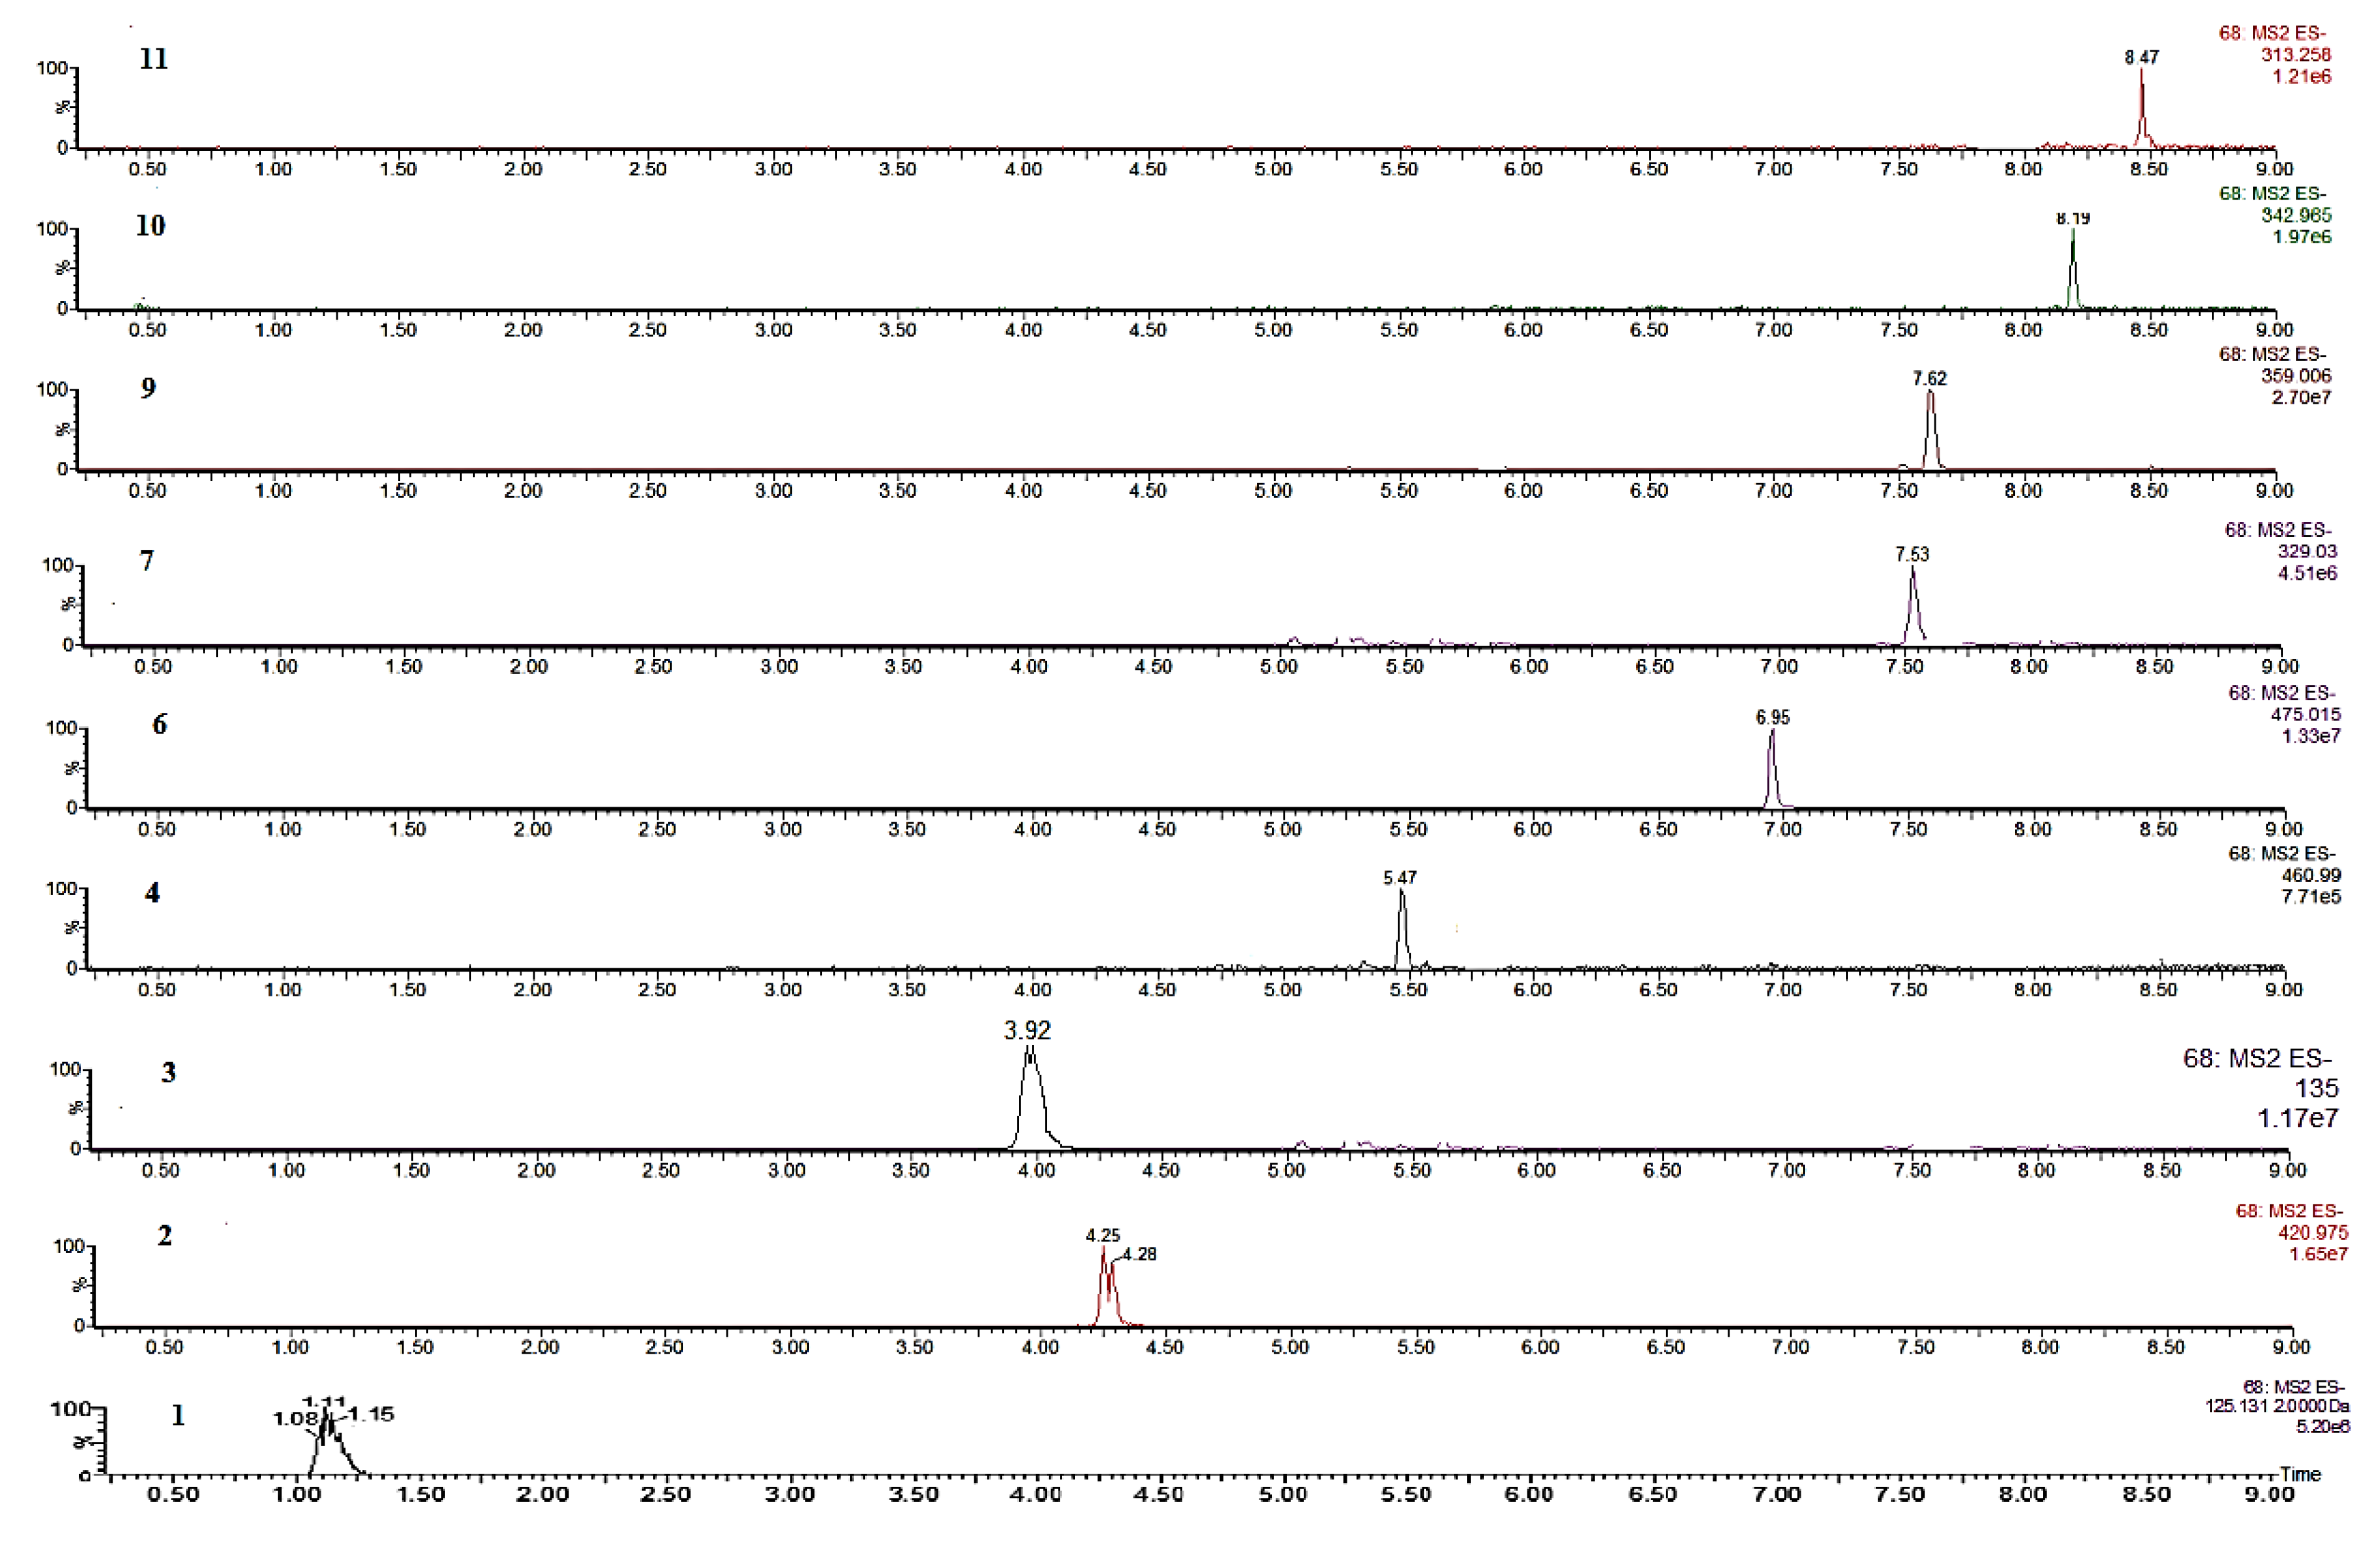
| Peak No | tR (min) | UV λmax (nm) | Mol. Formula | Calculated m/z | Compound | [M − H]− (m/z) | Fragment Ions (−) |
|---|---|---|---|---|---|---|---|
| 1 | 5.96 | 214, 271 | C7H6O5 | 170.12 | Gallic acid | 169 | 125 |
| 2 | 14.18 | 240, 318, 257, 365 | C19H18O11 | 422.33 | Mangiferin | 421 | 403, 331, 301, 271 |
| 3 | 14.48 | 217, 236, 324 | C9H8O4 | 180.16 | Caffeic acid | 179 | 135 |
| 4 | 29.48 | 263, 328 | C22H22O11 | 462.41 | Tectoridin | 461 | 446, 428, 341, 299 |
| 5 | 41.08 | 260, 322 | C23H22O11 | 474.42 | Germanaism B | 473 | ND* |
| 6 | 45.91 | 260, 330 | C23H23O11 | 476.13 | Irisolidone d-glucoside | 475 | 313, 298 |
| 7 | 49.15 | 218, 265 | C17H14O7 | 330.29 | Iristectorigenin B | 329 | 314, 311, 299, 271, 255, 164 |
| 8 | 49.50 | 262, 322 | C17H12O6 | 312.28 | Nigricin | 311 | ND* |
| 9 | 50.03 | 264, 218 | C19H16O8 | 360.32 | Irigenin | 359 | 344, 329, 314, 286, 258 |
| 10 | 56.03 | 222, 265 | C19H18O8 | 374.35 | 5,6-Dihydroxy-7,8,3′,5′-tetramethoxyisoflavone | 373 | 358, 135 |
| 11 | 61.24 | 259, 322 | C14H14O6 | 314.08 | Irisolidone | 313 | 298 |
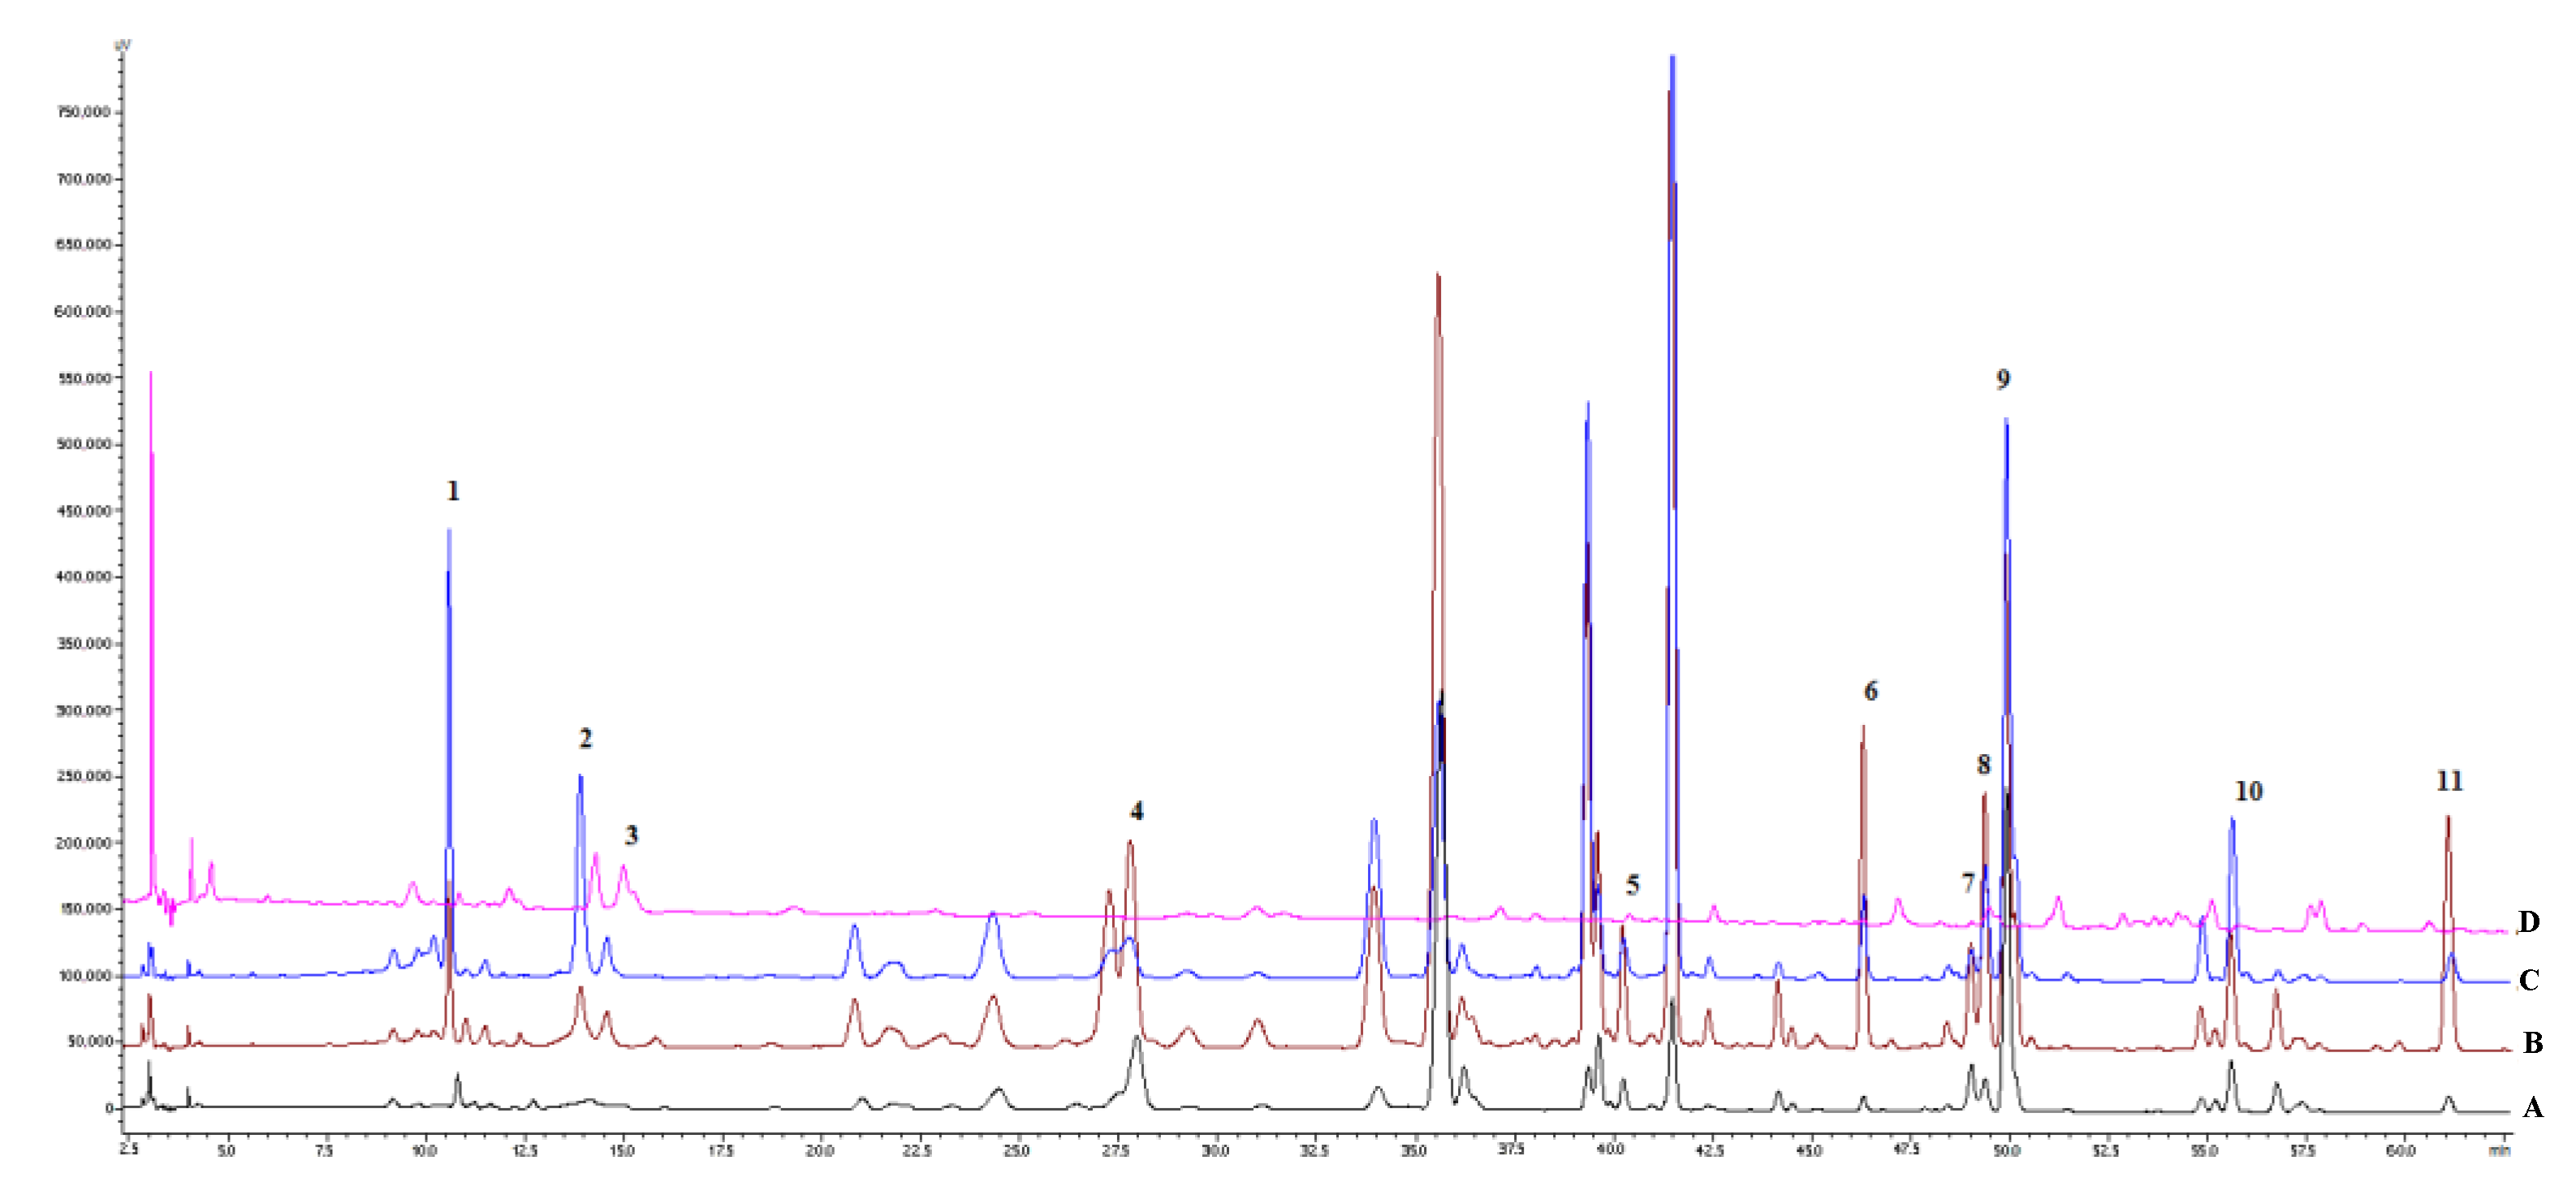
| Peak No | Compound | I. pallida | I. hungarica | I. sibirica | I. variegata |
|---|---|---|---|---|---|
| 1 | Gallic acid | - | 2.362 ± 0.076 | - | 3.729 ± 0.134 |
| 2 | Mangiferin | 0.849 ± 0.029 | 2.368 ± 0.023 | 0.267 ± 0.002 | 5.747 ± 0.080 |
| 3 | Caffeic acid | 0.227 ± 0.033 | 1.515 ± 0.005 | 0.288 ± 0.012 | 1.236 ± 0.005 |
| 4 | Tectoridin | 1.642 ± 0.023 | 3.921 ± 0.071 | 0.038 ± 0.001 | 0.989 ± 0.006 |
| 5 | Germanaism B | 0.534 ± 0.015 | 6.285 ± 0.030 | 0.012 ± 0.000 | 7.089 ± 0.032 |
| 6 | Irisolidone-d-glucoside | 0.325 ± 0.030 | 7.353 ± 0.025 | 0.115 ± 0.005 | 7.507 ± 0.005 |
| 7 | Iristectorigenin B | 0.354 ± 0.004 | 0.750 ± 0.003 | - | 0.204 ± 0.005 |
| 8 | Nigricin | 0.317 ± 0.003 | 2.267 ± 0.003 | 0.079 ± 0.002 | 0.990 ± 0.010 |
| 9 | Irigenin | 3.199 ± 0.034 | 4.892 ± 0.038 | 0.069 ± 0.000 | 5.518 ± 0.031 |
| 10 | 5,6-Dihydroxy-7,8,3′,5′-tetramethoxyisoflavone | 0.457 ± 0.003 | 1.056 ± 0.002 | - | 1.512 ± 0.013 |
| 11 | Irisolidone | 0.264 ± 0.004 | 4.025 ± 0.005 | - | 0.437 ± 0.030 |
| Peak No. | Component | Retention Time | I. variegata Rhizomes Extract (H2O) | I. hungarica Rhizomes Extract (H2O) | I. hungarica Rhizomes Extract (70% EtOH) |
|---|---|---|---|---|---|
| 1 | Gallic acid | 5.78 | 0.52 ± 0.01 | 2.83 ± 0.14 | 3.13 ± 0.14 |
| 2 | Mangiferin | 12.68 | 2.40 ± 0.06 | 18.01 ± 0.87 | 20.55 ± 1.01 |
| 3 | Caffeic acid | 15.80 | - | 2.27 ± 0.10 | 26.64 ± 1.28 |
| Total | 2.92 ± 0.07 | 23.11 ± 0.90 | 50.32 ± 1.09 |
| Sample Description | Superoxide Anion Generation | Elastase Release |
|---|---|---|
| Inh% (10 μg/mL) | Inh% (10 μg/mL) | |
| I. variegata rhizomes (H2O) | 41.0 ± 0.6 *** | 13.8 ± 5.1 |
| I. hungarica rhizomes (H2O) | 45.7 ± 1.4 *** | enhancing a |
| I. hungarica rhizomes (70% C2H5OH) | 23.6 ± 1.3 *** | enhancing a |
| Sample Description | Relative NRF2 Activity a in HacaT Cells b | Lipid Droplet Inhibition Activity c | |
|---|---|---|---|
| I. variegata rhizomes (H2O) | 172.7 | 95.1 ± 11.6 | |
| I. hungarica rhizomes (H2O) | 119.9 | 64.9 ± 8.1 | |
| I. hungarica rhizomes (70% C2H5OH) | 130.8 | 101.5 ± 6.8 |
| Sample Description | % Viability, RBL-2H3 a | % Inhibition of A23187-Induced Degranulation b | % Inhibition of Antigen-Induced Degranulation b | |||
|---|---|---|---|---|---|---|
| 100 μg/mL | 10 μg/mL | 100 μg/mL | 10 μg/mL | 100 μg/mL | ||
| I. variegata rhizomes (H2O) | 96.3 ± 0.7 | 12.7 ± 0.3 | 38.3 ± 3.5 *** | 10.7 ± 3.3 | 27.0 ± 4.5 * | |
| I. hungarica rhizomes (H2O) | 96.7 ± 1.7 | 3.7 ± 3.0 | 3.3 ± 2.0 | 4.0 ± 3.3 | 12.7 ± 1.7 | |
| I. hungarica rhizomes (70% C2H5OH) | 96.3 ± 1.9 | 7.3 ± 2.0 | 22.0 ± 5.0 * | 4.7 ± 3.8 | 46.7 ± 2.1 *** | |
© 2020 by the authors. Licensee MDPI, Basel, Switzerland. This article is an open access article distributed under the terms and conditions of the Creative Commons Attribution (CC BY) license (http://creativecommons.org/licenses/by/4.0/).
Share and Cite
Mykhailenko, O.; Korinek, M.; Ivanauskas, L.; Bezruk, I.; Myhal, A.; Petrikaitė, V.; El-Shazly, M.; Lin, G.-H.; Lin, C.-Y.; Yen, C.-H.; et al. Qualitative and Quantitative Analysis of Ukrainian Iris Species: A Fresh Look on Their Antioxidant Content and Biological Activities. Molecules 2020, 25, 4588. https://0-doi-org.brum.beds.ac.uk/10.3390/molecules25194588
Mykhailenko O, Korinek M, Ivanauskas L, Bezruk I, Myhal A, Petrikaitė V, El-Shazly M, Lin G-H, Lin C-Y, Yen C-H, et al. Qualitative and Quantitative Analysis of Ukrainian Iris Species: A Fresh Look on Their Antioxidant Content and Biological Activities. Molecules. 2020; 25(19):4588. https://0-doi-org.brum.beds.ac.uk/10.3390/molecules25194588
Chicago/Turabian StyleMykhailenko, Olha, Michal Korinek, Liudas Ivanauskas, Ivan Bezruk, Artem Myhal, Vilma Petrikaitė, Mohamed El-Shazly, Guan-Hua Lin, Chia-Yi Lin, Chia-Hung Yen, and et al. 2020. "Qualitative and Quantitative Analysis of Ukrainian Iris Species: A Fresh Look on Their Antioxidant Content and Biological Activities" Molecules 25, no. 19: 4588. https://0-doi-org.brum.beds.ac.uk/10.3390/molecules25194588