Article

Local Structures of Two-Dimensional Zeolites—Mordenite and ZSM-5—Probed by Multinuclear NMR

by
Marina G. Shelyapina
1,*,
Rosario I. Yocupicio-Gaxiola
2,
Iuliia V. Zhelezniak
1,
Mikhail V. Chislov
1,
Joel Antúnez-García
3,
Fabian N. Murrieta-Rico
3,
Donald Homero Galván
3,
Vitalii Petranovskii
3 and
Sergio Fuentes-Moyado
3
1
Department of Nuclear Physics Research Methods, Saint-Petersburg State University, 7/9 Universitetskaya nab., St. Petersburg 199034, Russia
2
Center for Scientific Research and Higher Education at Ensenada (CICESE), Ensenada, Baja California 22860, Mexico
3
Center for Nanoscience and Nanotechnology, National Autonomous University of Mexico (CNyN, UNAM), Ensenada, Baja California 22860, Mexico
*
Author to whom correspondence should be addressed.
Submission received: 13 September 2020 / Revised: 10 October 2020 / Accepted: 13 October 2020 / Published: 14 October 2020
(This article belongs to the Special Issue Advances in NMR and MRI of Materials)

Abstract

:
Mesostructured pillared zeolite materials in the form of lamellar phases with a crystal structure of mordenite (MOR) and ZSM-5 (MFI) were grown using CTAB as an agent that creates mesopores, in a one-pot synthesis; then into the CTAB layers separating the 2D zeolite plates were introduced by diffusion the TEOS molecules which were further hydrolyzed, and finally the material was annealed to remove the organic phase, leaving the 2D zeolite plates separated by pillars of silicon dioxide. To monitor the successive structural changes and the state of the atoms of the zeolite framework and organic compounds at all the steps of the synthesis of pillared MOR and MFI zeolites, the nuclear magnetic resonance method (NMR) with magic angle spinning (MAS) was applied. The 27Al and 29Si MAS NMR spectra confirm the regularity of the zeolite frameworks of the as synthetized materials. Analysis of the 1H and 13C MAS NMR spectra and an experiment with variable contact time evidence a strong interaction between the charged “heads” –[N(CH3)3]+ of CTAB and the zeolite framework at the place of [AlO4] location. According to 27Al and 29Si MAS NMR the evacuation of organic cations leads to a partial but not critical collapse of the local zeolite structure.

1. Introduction

In recent years, much attention has been paid to the techniques of the “one-pot synthesis” for the direct production of zeolitic materials. Zeolites are undoubtedly important heterogeneous catalysts, and the number of industrial processes, in which they are used in that capacity, has been constantly increasing. The interest is mainly issued by the great opportunities these methodologies open up when developing functional zeolite based materials, such as hybrid organic-inorganic molecular sieves [1,2,3], hierarchical microporous-mesoporous zeolites [4,5,6,7], nanozeolites [8,9,10], and template-free molecular sieves [4,7,11].
Zeolites with hierarchical porous structure can also be synthesized directly, without using templates. The template-free methods are mainly based on the following strategies [7]: (i) the development of intercrystalline mesoporosity due to aggregation of nanocrystals; (ii) the emergence of intracrystalline mesoporosity, which is formed by amorphous gels that control crystallization; (iii) mesoporosity created between self-pillared two-dimensional zeolite nanosheets. The latter can be obtained by synthesizing layered zeolites in the presence of organic structure directing agents (OSDA) followed by calcination [4]. It is known that the use of various OSDA makes it possible to obtain target zeolites with specific physicochemical properties, and even novel or improved zeolitic frameworks [12]. In this sense, the physicochemical properties of zeolites are highly dependent on the synthesis procedure, including the choice of OSDA. The latter is of primary importance for the aluminum distribution, the acidic properties of the obtained material, the size and morphology of crystals, which are the key parameters for the catalysts [13,14,15,16].
One of the widely used OSDA for the synthesis of mesoporous silica and organic-inorganic layered materials is Cetyltrimethylammonium Bromide (CTAB). It is also widely applied in the synthesis of zeolites [15,17,18,19]. For example, under certain synthesis conditions, it is possible to grow a layered material in which inorganic layers of ZSM-5 zeolite and organic layers consisting of ordered CTAB molecules alternate. Under the conditions generally used for zeolite synthesis (100–180 °C and high pH), the CTAB molecules do not decompose, but interact strongly with the components of aluminosilicate gel. As a result of using CTAB, it was possible to direct the synthesis towards the formation of inorganic-organic microporous materials and the design of hierarchical zeolite catalysts from a plate-like zeolite precursor, which opens up new possibilities for the complex production of mesoporous zeolites. The main factor in this process is the guest-host interactions between organic surfactant and inorganic framework during the self-assembly and structure evolution development [17,19]. In such a process, a swelling-type multilamellar ECNU-7P with alternative stacking of MWW nanosheets and organic CTAB layers was successfully prepared through a dissolution−recrystallization route. This was the first time that a simple surfactant CTAB and a layered zeolite precursor could act synergistically during self-assembly. As a result, an alternative, attractive pathway opens up to current post-synthetic approaches, or to the hydrothermal syntheses of MWW nanosheets with designed surfactants. Calcined Al-ECNU-7 turned into a hierarchical zeolite catalyst, and exhibited excellent activity, selectivity and stability during the catalytic conversion of bulky molecules. The present approach would be a general methodology and would be suitable for the direct synthesis of hierarchical layered zeolites with other topologies by controlling the self-assembly of a simple surfactant and zeolite precursor. More significantly, the low cost and commercial availability of the CTAB simple surfactant makes it more promising than the complex bifunctional surfactants currently used for the preparation of industrial heterogeneous catalysts.
Despite quite numerous studies of the morphology and catalytic properties of layered zeolites obtained by self-assembling method, studies of their local structure are not so widespread, although this is a key point for understanding of the catalytic activity of materials. Nuclear magnetic resonance (NMR) is one of the most versatile experimental methods to probe the local structure [20]; besides this technique enables to obtain at the microscopic level information on dynamics of intercalated species [21,22] and is successfully applied to study organic-inorganic layered materials [22,23,24,25].
Earlier, we reported on the results of the successful synthesis of 2D ZSM-5 and mordenite [26]. The aim of this work is by applying multinuclear NMR to follow up changes in the local structure at all the stages of preparation, starting from a freshly synthesized hybrid material, in which the confinement of organic and inorganic layers is implemented, then pillaring between the layers, and finally removal of organic material during calcination.

2. Results and Discussion
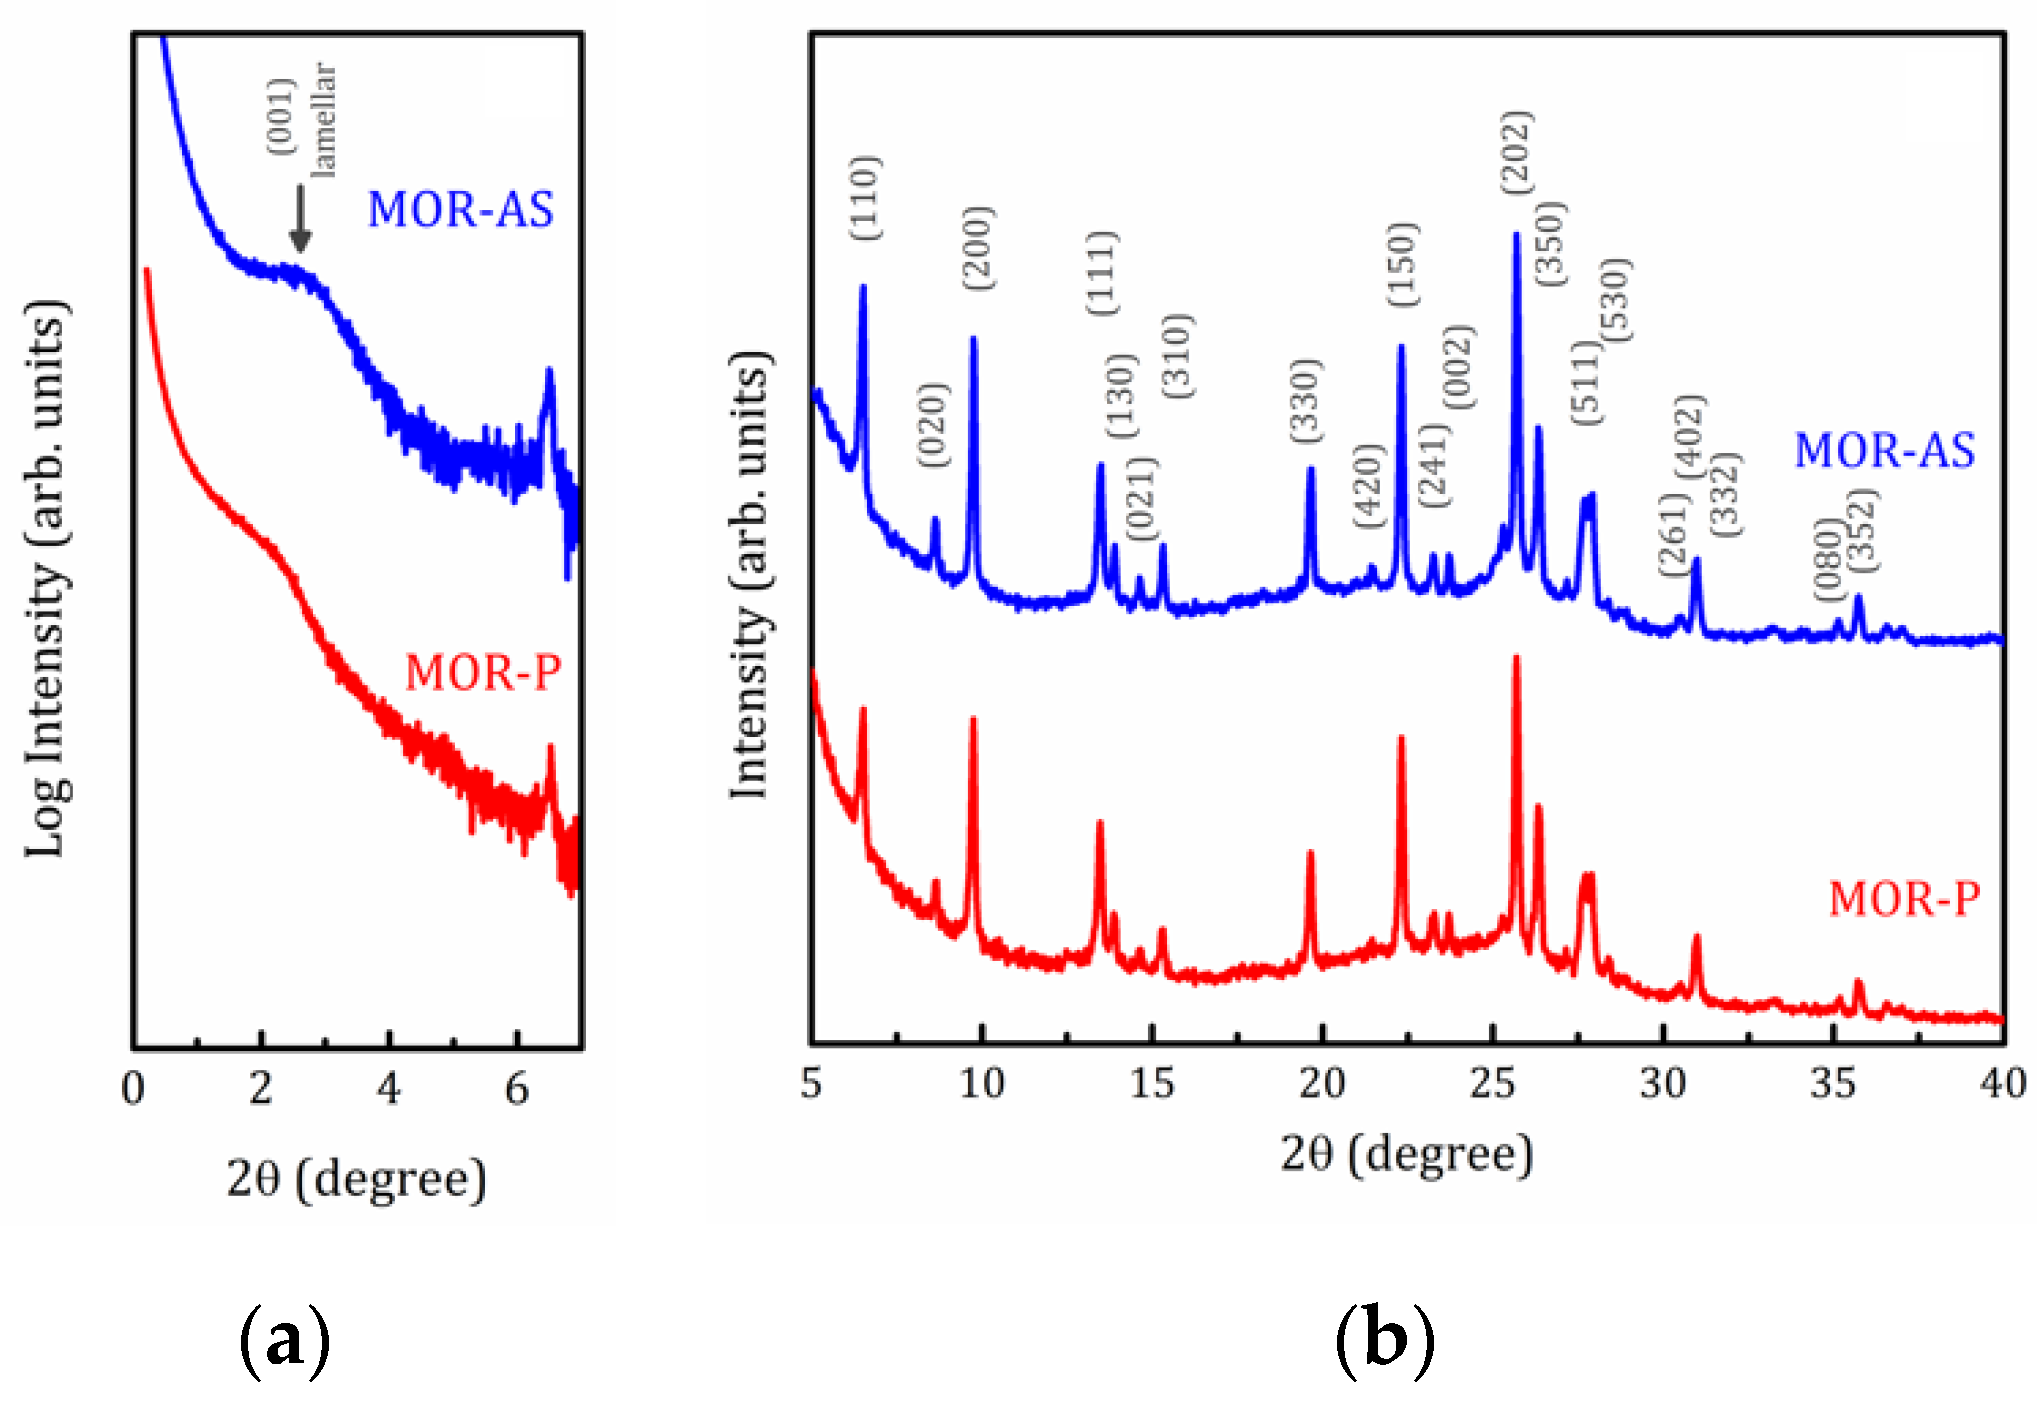
In this work, layered two-dimensional (2D) zeolites with mordenite and ZSM-5 structures were prepared and studied. Further in the text and in the figures, they will be denoted by three-letter structural codes adopted by the International Zeolite Association (IZA) [27], as MOR and MFI, using additional abbreviations those are marking a certain stage of preparation. Both materials were synthesized according to the procedure described in our previous work [26]. Pillaring of the obtained materials was done in accordance with the process proposed by Na et al. [28]. As a result, our method for preparing samples included four steps: (i) obtaining of organic-inorganic hybrid lamellar zeolites by self-assembling method with addition of CTAB (and tetrapropylammonium bromide (TPABr) as OSDA for the synthesis of 2D ZSM-5): the MOR-AS and MFI-AS samples; (ii) introduction of tetraethoxysilane (TEOS) molecules into the organic layer of the interlamellar space filled with CTAB molecules: the MOR-T and MFI-T samples; (iii) hydrolysis of an organosilicon compound and the formation of pillars of amorphous SiO2: the MOR-TH and MFI-TH samples; (iv) calcination to remove organic molecules: the MOR-P and MFI-P samples. A more detailed description of the preparation method can be found in Section 3.

2.1. X-ray Analysis

Figure 1 and Figure 2 represent the X-ray Diffraction (XRD) patterns of both as synthetized and pillared MOR and MFI samples, respectively. As can be seen in Figure 1b and Figure 2b, both samples exhibit typical features of the corresponding zeolite structure with an amorphous halo (range 2θ between 17–30 degrees) which is very consistent with this kind of materials [28,29]. This amorphous halo should vanish after calcination process, but it is necessary to remind the amorphous character of the pillars even after calcination could maintain or intensify this feature.
Small angle X-ray scattering (SAXS) patterns shown in Figure 1a and Figure 2a unambiguously indicate the formation of lamellar mesophases [28]. For lamellar samples, the peak at 2θ = 2.7° for MOR-AS and 2θ = 2.3° for MFI-AS, corresponds to the (001) reflections with interplanar distances d = 3.2 and 3.8 nm, respectively. For pillared samples, this peak is smoothed and shifted toward small angles (2θ = 2.2 and 1.7° with d = 4.0 and 5.2 nm for MOR-P and MFI-P, respectively), which shows that the introduction of SiO2 pillars increased the interlamellar space. The present results are consistent with our previously reported data [26]. A wider interplanar distance d distribution is a clear evidence of the random growing of pillars, that is to say, some distances can be expanded while others can be contracted. A detailed discussion of the physical structure of these zeolite plates, separated by plates consisting of organic material, is of particular interest. However, this topic is beyond the scope of the present article and will be published separately elsewhere.

2.2. SEM-EDX Studies

Figure 3 shows scanning electron microscopy (SEM) images for the initial as synthetized zeolites and the final samples after pillaring. As seen from Figure 3a,c both MOR-AS and MFI-AS have similar morphology: elongated plates up to 1 μm in length and 0.1 μm in width, combined in stacks. The pillaring does not change noticeably the morphology of the layered zeolites, see Figure 3b,d.
The results of the energy dispersive X-rays (EDX) elemental analysis of the as-synthetized and pillared materials are summarized in Table 1. Both MOR-AS and MFI-AS have nearly the same Si/Al ratios, 8.4 ± 0.3 and 8.8 ± 0.3, respectively. The Na/Al ratio in MFI-AS is close to unity within the experimental error, which means that all the negative charge due to partial substitution of Si for Al is compensated by Na+. In MOR-AS an excess of positive charge (Na/Al > 1) must be balanced by Br anions. No trace of Br was detected in the MFI set of samples and in MOR-P. This means that both CTAB and TPABr are present only in their cationic forms, CTA+ (hexadecyltrimethylammonium) and TPA+ (tetrapropylammonium), respectively, balancing the dangling bonds of the zeolite layers. Such a rather nontrivial question of the coordination of charged Al tetrahedra and organic cations requires additional research, which the authors plan to carry out in the future, and the results of which will be published elsewhere.
The pillaring results in an almost twofold increase in the Si/Al ratio, 15.2 ± 1.3 and 16.5 ± 1.0 for MOR-P and MFI-P, respectively, with a simultaneous decrease in sodium content, more pronounced for MOR-P. Sodium leaching is quite likely during sample processing in TEOS hydrolysis (Step 3). The role of compensating cations should eventually pass to protons, even if organic cations are involved in the hydrolyzed samples. In addition, it should be noted that all the materials are characterized by a certain inhomogeneity in the distribution of elements: there are regions with higher and lower Si/Al ratios, which is reflected in a rather large experimental error. An example of the element map distribution for the MOR-P sample is shown in Figure 4.

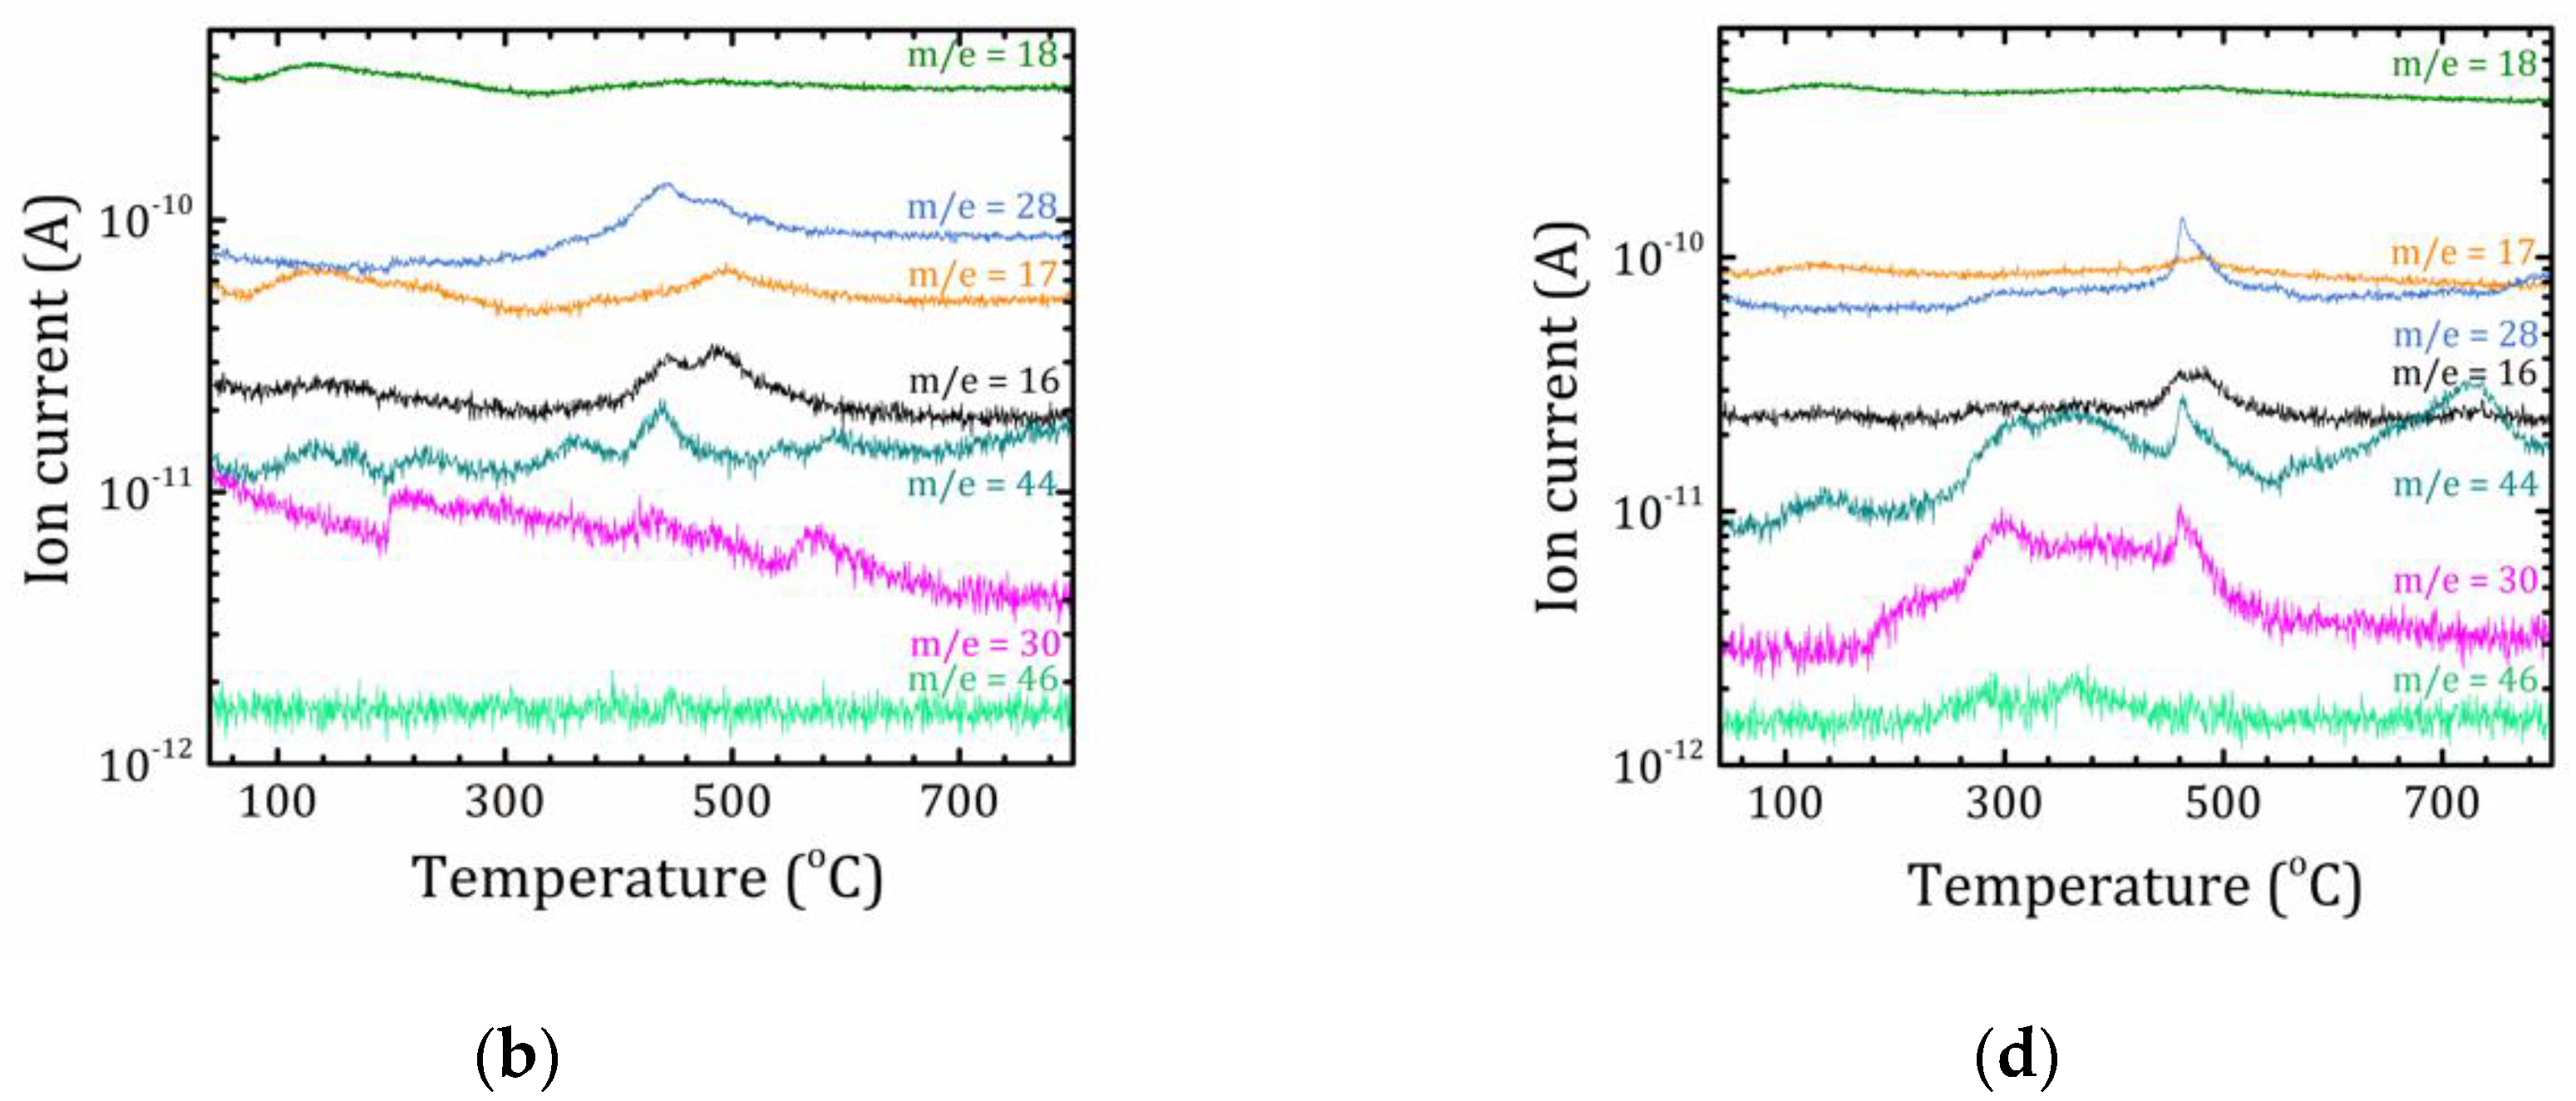
2.3. Thermal Analysis

The results of the simultaneous thermal analysis (including thermogravimetry (TG) and differential scanning calorimetry (DSC) combined with mass spectrometric analysis (MS) of the evolved gases) of the MOR-AS and MFI-AS samples are shown in Figure 5a–d, respectively.
Both samples exhibit a rather complex mass loss. For MOR-AS, the mass loss below 300 °C is associated with water release (m/e = 16, 17, 18) from macro- and microcavities, peaks at 175 and 228 °C, respectively. The mass loss between 300 and 500 °C is related with a multistep decomposition of CTA+ and PEG with formation of ammonium fragments, volatile low-carbon residues, e.g., ethylene (m/e = 28) and products of combustion of non-volatile high-carbon residues, CO2 and H2O. The peaks in the corresponding ion-current curves are accompanied by DSC peaks at 445 and 488 °C. In MFI-AS, water release occurs in one step below 220 °C, mass loss above 250 °C is associated with the decomposition of organic cations and molecules (CTA+, TPA+ and PEG).

2.4. NMR Study

2.4.1. 1H MAS NMR and 13C CP-MAS NMR

Figure 6 shows the 1H MAS and 13C CP/MAS (at the contact pulse duration τcp = 2 ms) NMR spectra for the studied samples of “as-synthesized” MOR-AS and MFI-AS. All the spectral lines can be attributed to the organic molecules CTAB and TPABr, the latter for the MFI-AS sample only. The reference spectra of pure CTAB and TPABr substances, simulated using the online service www.nmrdb.org [30], as well as the spatial structure of their molecules with atom labeling, are shown in the upper part of Figure 6a,b. As can be seen, the spectra for both zeolite samples exhibit typical features of the corresponding organic molecules (except the 1H lines above 4.5 ppm that can be attributed to PEG and water), but all lines are broadened and shifted towards a lower magnetic field. The broadness of the spectral lines points out that the molecule mobility is frozen.
For better visualization, in Figure 6c the 13C chemical shifts for all carbon atoms of CTAB in the MOR-AS and MFI-AS samples are plotted versus the numbering of carbon atoms. The data for a crystalline CTAB powder from Ref. [23], together with the simulation for a CTAB molecule are given as a comparison. The 13C CTAB spectra for both MOR-AS and MFI-AS samples are very similar and correspond to immobilized rigid molecules in the all-trans conformation [23]. A chemical shift value of about 31 ppm can be attributed to C4–C13 carbon atoms in the central part of the CTAB chain. A typical value of the chemical shift obtained in crystalline n-alkanes in the trans-conformation is 33 ppm [31]; the lower chemical shift of these methylene carbons by 2 ppm is usually attributed to the presence of a significant fraction of gauche conformers [23]. A higher chemical shift of carbon C1 by 4 ppm evidences a strong interaction between the charged –[N(CH3)3]+ head of the CTAB and the zeolite framework. This is also confirmed by a linewidth of the 1H-NMR lines. The 1H NMR lines broaden as one moves from the tail towards the –[N(CH3)3]+ head of the molecule that means a decrease of the mobility of methyl groups (broad HN peak) as compared to the CTAB tail. This is very consistent with the findings of studies on the inclusion of CTAB into a MWW type structure synthesized under basic/alkaline conditions, where it is suggested that CTAB can be included into hemicavities of MWW through intermolecular hydrogen bonding with bridged oxygen atoms that are connected to Q4 sites [19]. In the same way, in some NMR studies on the inclusion of Al into MCM-41 mesoporous aluminosilicates, which are synthesized using CTAB as a mesoporogen or structure directing agent, it was found that the polar head of CTAB shows a strong correlation with four-coordinated Al through electrostatic interactions between cationic ammonium-methyl head groups and tetrahedral Al (in the framework) [32]. In this sense, the interaction of the polar head of the surfactant with the surface of silica is carried out by silanol groups [33], which are very weak sites; while the interaction of CTAB with ordered aluminosilicate occurs by electrostatic interaction with the framework charge in the place where tetrahedral aluminum is present.
This conclusion is in agreement with the VCT experiment. Figure 6d represents the intensity of the selected carbon peaks of CTAB in MOR-AS as a function of contact time 1H-13C. For C4–13, the signal intensity is normalized per carbon nucleus.
The building up and loss of signal intensity during VCT can be described by the following Equation (1) [34]:
I = I 0 ( 1 T CH T 1 ρ ) 1 × [ exp ( τ cp T 1 ρ ) exp ( τ cp T CH ) ]
TCH determines the rising part of the intensity and represents the efficiency of the cross polarization between 1H and 13C nuclei and is often related to the mobility of the nuclei under study: mobile atoms have a high TCH value because of the inefficiency of cross-polarization. The decay of the signal is governed by the rate of 1H spin T relaxation. The TCH and T parameters for the selected carbon sites of CTAB in MOR-AS, as determined from the dependencies shown in Figure 6d using Equation (1), are listed in Table 2. The CN and the terminal methyl group (C16) have a much longer TCH than other carbon atoms. The terminal C16 group has the greatest mobility: the largest TCH, and within the studied contact time range, the signal intensity does not decrease even at the longest τcp values that point out to a large T value that cannot be determined due to the low signal intensity. The C1 group has the shortest TCH and T times and hence the lowest mobility.
Coming back to the NMR spectral analysis, the introduction of TEOS and subsequent hydrolysis result in an essential broadening of the 1H- and 13C-NMR lines that is associated with a further decrease in the mobility of CTAB, see Figure 7.
The line positions in MOR-T, MOR-TH, MFI-T and MFI-TH remain untouched as compared to MOR-AS and MFI-AS, respectively. Annealing results in the complete disappearance of organic matters (there are no traces of the 13C-NMR signal in the MOR-P and MFI-P spectra). A broad 1H line at 4.8 ppm points out to the presence of water molecules with restricted mobility.

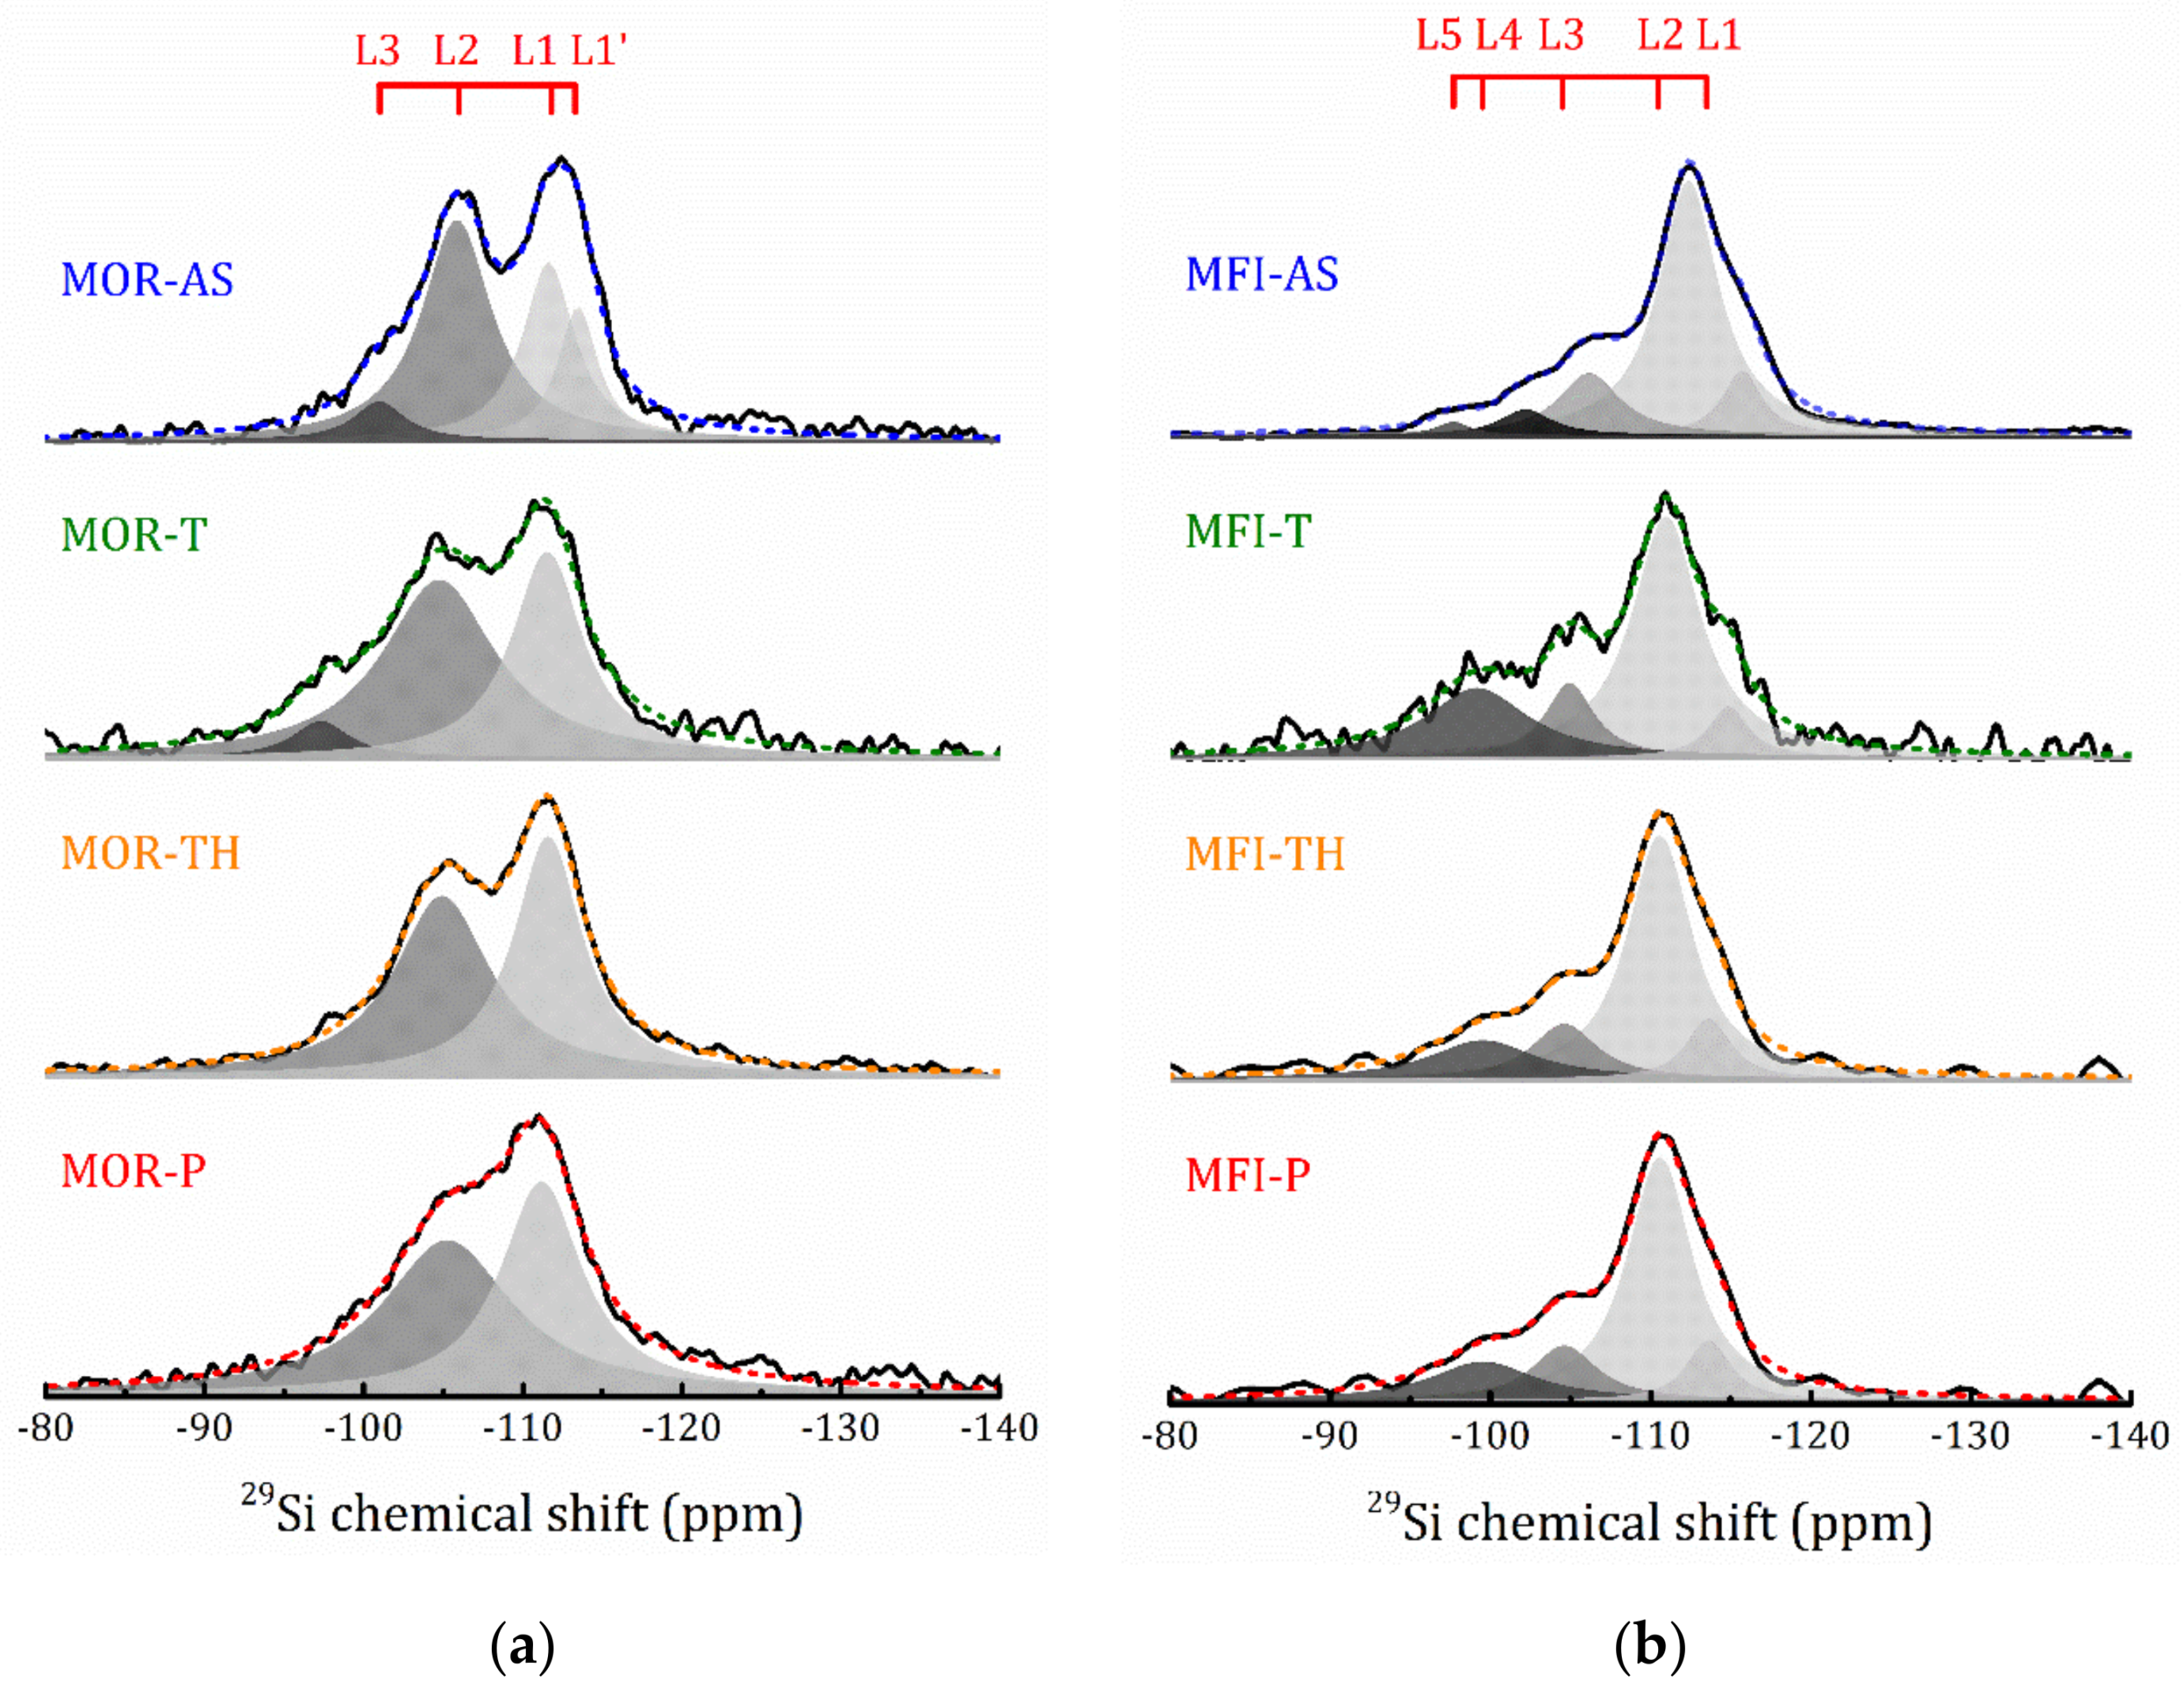
2.4.2. 27Al and 29Si MAS NMR

The 27Al MAS NMR spectra confirm the regularity of the zeolite frameworks of the as prepared samples, see Figure 8, the only line at about 54 ppm corresponds to Al in regular tetrahedral sites. The introduction of TEOS and the subsequent hydrolysis procedure do not perturb much the framework aluminum: the line slightly broadens and shifts at 2–3 ppm due to interaction with TEOS, see Table 3. However, the calcination procedure results in the appearance of six-coordinated extra-framework Al (the line at about 2 ppm) (20 and 27% for MOR-P and MFI-P, respectively). The presence of six-coordinated Al is often observed in protonated zeolites obtained by calcination of the ammonium form [35,36,37,38].
It should be noted that the data reported in Table 3 can be used for a rough estimate of the 27Al MAS NMR spectra that was done by a simple fitting by a Lorentzian line. But, as one can see from Figure 8, after hydrolysis, a shoulder at about 52 ppm appears (more pronounced for pillared samples). Such an asymmetric shape of the spectral line is issued by quadrupole interactions [39] and may point out at an increase in the quadrupole interactions due to the deformation of [AlO4] tetrahedra [40,41].
Figure 9 represents the 29Si MAS NMR spectra of all the studied compounds. The spectra for the as-synthesized layered zeolites exhibit features typical for 3D zeolites.
For MOR-AS, the 29Si spectrum was fitted by four Lorentzian lines (L1, L1′, L2 and L3) that can be assigned with specific Q-type Si sites in the mordenite lattice: −113.5 and −111.6 ppm correspond to two different Q4(0Al) sites, whereas −105.8 and −101.0 ppm can be attributed to Q4(1Al) and Q4(2Al), respectively [42]. Using the integrated areas of these lines, the Si/Al ratio can be estimated as 8.3 [43,44]. This is in a fair agreement with the EDX data and implicitly confirms the 29Si NMR line assignment. However, rather important contributions of Q4(1Al) and Q4(2Al) are observed in layered mordenite, as compared with 3D mordenites with a close Si/Al ratio [45,46]. This could be due to the interaction of CTAB heads with Al tetrahedra at the interface that is truncated, resulting in a higher prevalence of Al in certain preferred sites of the zeolitic structure. In addition, one should take into account the change in the T-O-T angles for the Q4(nAl) sites due to local structural distortions in the 2D plate. For several zeolites, including mordenite, there is an almost linear correlation between the 29Si chemical shift of the Q4(nAl) signal with the magnitude of T-O-T angle [47]. And finally, there may be an effect of the simultaneous action of these two factors.
To follow the changes in the 29Si spectra that occur at each preparation step, in Figure 10 we plotted the parameters of individual spectral lines shown in Figure 9. As can be seen, for the mordenite sample, the introduction of TEOS (MOR-T) results in essential broadening the line width, the two lines previously attributed to Q4(0Al) are merged, and a low chemical shift part of the 29Si spectrum becomes more pronounced. After hydrolysis (MOR-TH) the spectrum can be perfectly fitted by two Lorentzian lines. Further, annealing (MOR-P) results in a slight line broadening and redistribution of the line intensities. The main difficulty in assigning the spectral line is caused by the partial overlapping of the Q4(1Al) and Q4(2Al) 29Si mordenite signal with Q4 and Q3 of TEOS. The typical ranges of 29Si chemical shift in mordenite [42,44], and TEOS [48] are shown in Figure 10a.
It should be noted that the 29Si signal below 90 ppm was not detected even in CP/MAS mode (see Figure S1 in Supplementary Materials). In MOR-T, after the introduction of TEOS, this means that from the first moments a sol-gel reaction (hydrolysis and polycondensation) takes place, which triggers the formation of a three-dimensional network of Si tetrahedra in the interlayer space of the zeolite, between the CTAB molecules. This is consistent with the data for gelled TEOS reported in [48]. The next step, a targeted hydrolysis procedure, completes it (total disappearance of the Q3 signal). A consistent increase in the intensity of the L1 line at each step of preparation implicitly points out the formation of SiO2 oligomers. And in the pillared MOR-P signal at −111.2 ppm corresponds to the overlapping mordenite Q4(0Al) site and Q4 of amorphous SiO2 [49,50].
In the layered ZSM-5 zeolite, MFI-AS, the 29Si spectrum can be decomposed into five Lorentzian lines (L1–L5), Figure 9b. The signals at −115.7 and −112.4 ppm can be attributed to two different Q4(0Al) sites, the remaining signals, −106.16, −102.2 and −97.7 ppm, can be assigned with Q4(1Al), Q3(0Al) and Q3(1Al), respectively [44,47,51]. The introduction of TEOS, in MFI-T, leads to significant changes in the Q3(0Al) signal: an increasing of the linewidth and integral intensity is observed, and the chemical shift is 3 ppm lower, Figure 10b. Overlapping basically triggers these changes with the Q3 signal of TEOS. Similarly to MOR-T, an autohydrolysis and condensation also occur in MFI-T, but with the predominant formation of Q3 structures. The subsequent hydrolysis procedure (MFI-P) leads to a further increase in the formation of Q3, but after annealing (MFI-P), a sharp decrease in the L4 line intensity means that this is due to Q3(0Al) of the ZSM-5 zeolite. The autohydrolysis is in good agreement with the ease of hydrolysis of this type of alkoxide compounds when exposed to a small amount of water or humidity. Step 1 was carried out in the presence of water in the reaction mixture and flushing with methanol of this zeolite/organics hybrid interlayered compound under reflux did not completely remove the water. In addition, the interlaminar diffusion treatments with TEOS (Step 2) were not carried out in a controlled dry atmosphere, so the presence of internal water in the sample and ambient humidity may cause autohydrolysis of the compound even before it is treated in water at 90 °C (Step 3).

3. Materials and Methods

Both sets of materials were synthesized according to the procedure described in our previous work [26]. Pillaring of the obtained materials was done in accordance with the process proposed by Na et al. [28].
Step 1: For mordenite, the organic components (3.123 g of CTAB, 0.5205 g of polyethylene glycol (PEG) 20000) and 0.47 g of NaOH were completely dissolved in 36.3 mL of H2O. After that 21.46 g of sodium silicate solution (25 wt% of SiO2 and 10.6 wt% of Na2O) were added. The obtained mixture was vigorously stirred for 20 min. Then, the solution of sodium aluminate (0.48 g of NaAlO2 dissolved in 26.6 g of H2O) was added dropwise. Finally, 26 g of a 10 wt% H2SO4 solution was added under vigorous stirring. The same method was used to obtain ZSM-5 zeolite, but with the addition of 2.66 g of TPABr as OSDA to other organic components.
The obtained mixtures were heated at 150 °C for 4 days in a stainless-steel autoclave with teflon coating under autogenous pressure. Then, the samples were filtered and washed with distilled water, and then washed with methanol under refluxing for 12 h at 60 °C to remove physically occluded surfactants. The resulting samples were labeled as MOR-AS and MFI-AS.
Step 2: 1.0 g of MOR-AS (or MFI-AS) sample was stirred in 5.0 g of TEOS for 12 h at 25 °C. Then samples were filtered and dried at 35 °C for 12 h. The obtained samples were labeled as MOR-T and MFI-T.
Step 3: To hydrolyze TEOS, 1.0 g of the MOR-T and MFI-T samples were stirred in 10.0 g of distilled water at 90 °C for 12 h. Washed with distilled water, filtered, and dried at 120 °C samples were labeled as MOR-TH and MFI-TH.
Step 4: Samples of MOR-TH and MFI-TH obtained after hydrolysis were calcined at 550 °C for 4 h in air to remove organic compounds. As a result, samples of pillared MOR and MFI were obtained, which were labeled MOR-P and MFI-P, respectively.
Powder XRD analysis was done on a Bruker D8 DISCOVER diffractometer using monochromatic CuKα radiation (λ = 0.154056 nm). Diffractograms were recorded in the 2θ range of 5–40° (step width 0.0302°), where the main characteristic peaks of the MOR and MFI zeolites appear. SAXS patterns were recorded in a scan range from 0.2 to 7.0 2θ degree, step width 0.01°.
Simultaneous thermal analysis was carried out using a Netzsch STA 449 F1 Jupiter coupled with a QMS 403 Aëolos quadrupole mass spectrometer. The mass change of the samples and the composition of the evolved gases were registered. Analysis of samples was carried out in the temperature range 40–820 °C at a heating rate of 10 °C/min in an argon stream at a rate of 90 mL/min.
The morphology and elemental analysis of the samples was studied by an optical system integrated into D8 DISCOVER spectrometer (Bruker AXS, Karlsruhe, Germany) and by SEM applying Zeiss Merlin (Zeiss, Oberkochen, Germany) equipped with an EDX Oxford Instruments INCAx-act.
NMR spectra were recorded using a Bruker Avance IIIWB 400 MHz (Bruker, Karlsruhe, Germany) solid-state NMR spectrometer (operating with Topspin version 3.2) using a double-resonance 4 mm Magic Angle Spinning (MAS) probe. The operating frequencies were 400.23, 100.64, 104.28 and 79.5 MHz for 1H, 13C, 27Al, and 29Si nuclei, respectively. The rotor speed was 14 kHz. For all nuclei except 13C, the direct excitation method was used. To increase the intensity of 13C-NMR spectra, the cross-polarization (CP/MAS) method was applied. Variable contact time (VCT) experiments were performed with contact time τcp varied between 70 and 10,000 µs. The relaxation delay time was 5 s. Tetramethylsilane (TMS) was used as an external standard.

4. Conclusions

Mesostructured zeolite materials with the crystalline structure of MOR and MFI having Si/Al ratios equal to 8.4 and 8.8, respectively, were grown in the form of lamellar inorganic phases separated by layers of organic material. CTAB was used as an agent that creates mesopores, in a one-pot synthesis. It was shown that the mesostructured array consists of alternating lamellas of CTAB, with a thickness of ~3.5 nm, and a zeolite, with a thickness of one-unit cell along the z axis for each of the synthesized structures. Both lamellar zeolites have a similar morphology: elongated plates up to 1 μm long and 0.1 μm wide combined in stacks.
27Al and 29Si MAS NMR spectra confirm the regularity of the zeolite frameworks of the as-synthetized layered 2D materials: there is no extra-framework Al, 29Si spectra correspond to bulk 3D MOR and MFI with broadened lines from Q4(0Al), Q4(1Al) and Q4(2Al) sites.
Analysis of the 1H and 13C MAS NMR spectra and the VCT experiment evidence a strong interaction between the charged –[N(CH3)3]+ heads of CTAB and the zeolite framework: the C1 and terminal C16 groups of CTAB have the lowest and highest mobility, respectively. Since in the both MOR-AS and MFI-AS samples the Na/Al ratio is close to unity (a slight excess of Na+ found in MOR-AS is balanced by Br anions), CTA+ and TPA+ cations balance the dangling bonds of the zeolite layers.
The introduction of TEOS from the beginning leads to autohydrolysis and the formation of SiO2 oligomers due to the water contained in the sample. Further targeted hydrolysis completes the formation of amorphous SiO2 pillars separating the zeolite layers and holding them at fixed distances after thermal removal of the organic layers. Annealing leads to a partial drop out of Al from the zeolite frameworks (the appearance of extra-framework six-coordinated Al species). This implicitly points out that CTA+ cations in the as-synthetized materials are localized near [AlO4], and the removal of organic cations leads to a partial collapse of the local structure. However, in general, the zeolite structure of the layers is preserved. After calcination the role of compensating cations should eventually pass to protons; moreover, the surface hydroxyls should balance of the dangling bonds of the zeolite layers. From this perspective the study of the inner surface of the pillared zeolites is of great interest and is actually under evaluation.

Supplementary Materials

The following is available online, Figure S1: 29Si {1H} CP/MAS NMR at τcp = 2 ms for the MOR-T and MFI-T samples.

Author Contributions

M.G.S. and V.P. conceived an experiment and analyzed the general data set; R.I.Y.-G. fabricated the layered two-dimensional (2D) MOR and MFI samples; I.V.Z. carried out the NMR analysis of the synthetized samples under supervision of M.G.S.; M.V.C. performed the thermal analysis; J.A.-G. and D.H.G. analyzed XRD and SAXS data; F.N.M.-R. and S.F.-M. examined data of SEM-EDX studies. All the authors discussed the topic, helped identify specific aspects studied in this work, discussed the experimental results and contributed to the writing of the manuscript. All authors have read and agreed to the published version of the manuscript.

Funding

This research was funded by the Russian Foundation for Basic Research project No 18-53-34004 (RFBR and CITMA), and UNAM PAPIIT IN115920 Grant.

Acknowledgments

The samples were synthetized at CNyN-UNAM and studied at the Research Park of Saint Petersburg State University: Centre for X-ray Diffraction Studies, Interdisciplinary Resource Centre for Nanotechnology, Centre of Thermal Analysis and Calorimetry and Centre for Magnetic Resonance.

Conflicts of Interest

The authors declare no conflict of interest.

References

  1. Wight, A.P.; Davis, M.E. Design and Preparation of Organic−Inorganic Hybrid Catalysts. Chem. Rev. 2002, 102, 3589–3614. [Google Scholar] [CrossRef] [PubMed]
  2. Li, D.; Wu, Z.; Zhou, D.; Xia, Y.; Lu, X.; He, H.; Xia, Q. One-step synthesis of hybrid zeolite with exceptional hydrophobicity to accelerate the interfacial reaction at low temperature. Microporous Mesoporous Mater. 2019, 280, 195–202. [Google Scholar] [CrossRef]
  3. Čejka, J.; Millini, R.; Opanasenko, M.; Serrano, D.P.; Roth, W.J. Advances and challenges in zeolite synthesis and catalysis. Catal. Today 2020, 345, 2–13. [Google Scholar] [CrossRef]
  4. Roth, W.J.; Nachtigall, P.; Morris, R.E.; Čejka, J. Two-Dimensional Zeolites: Current Status and Perspectives. Chem. Rev. 2014, 114, 4807–4837. [Google Scholar] [CrossRef] [PubMed]
  5. Zhang, K.; Ostraat, M.L. Innovations in hierarchical zeolite synthesis. Catal. Today 2016, 264, 3–15. [Google Scholar] [CrossRef]
  6. Ge, T.; Hua, Z.; He, X.; Zhu, Y.; Ren, W.; Chen, L.; Zhang, L.; Chen, H.; Lin, C.; Yao, H.; et al. One-pot synthesis of hierarchically structured ZSM-5 zeolites using single micropore-template. Chin. J. Catal. 2015, 36, 866–873. [Google Scholar] [CrossRef]
  7. Jia, X.; Khan, W.; Wu, Z.; Choi, J.; Yip, A.C. Modern synthesis strategies for hierarchical zeolites: Bottom-up versus top-down strategies. Adv. Powder Technol. 2019, 30, 467–484. [Google Scholar] [CrossRef]
  8. Koohsaryan, E.; Anbia, M. Nanosized and hierarchical zeolites: A short review. Chin. J. Catal. 2016, 37, 447–467. [Google Scholar] [CrossRef]
  9. Mintova, S.; Grand, J.; Valtchev, V. Nanosized zeolites: Quo Vadis? Comptes Rendus Chim. 2016, 19, 183–191. [Google Scholar] [CrossRef] [Green Version]
  10. Margarit, V.J.; Portilla, M.T.; Navarro, M.T.; Abudawoud, R.; Al-Zahrani, I.M.; Shaikh, S.; Martínez, C.; Corma, A. One-pot co-crystallization of beta and pentasil nanozeolites for the direct conversion of a heavy reformate fraction into xylenes. Appl. Catal. A Gen. 2019, 581, 11–22. [Google Scholar] [CrossRef]
  11. Moliner, M. Direct Synthesis of Functional Zeolitic Materials. ISRN Mater. Sci. 2012, 2012, 1–24. [Google Scholar] [CrossRef] [Green Version]
  12. Moliner, M.; Rey, F.; Corma, A. Towards the Rational Design of Efficient Organic Structure-Directing Agents for Zeolite Synthesis. Angew. Chem. Int. Ed. 2013, 52, 13880–13889. [Google Scholar] [CrossRef] [PubMed]
  13. Guo, G.-Q.; Long, Y.-C.; Sun, Y.-J. Synthesis of FER type zeolite with tetrahydrofuran as the template. Chem. Commun. 2000, 1893–1894. [Google Scholar] [CrossRef]
  14. Migliori, M.; Aloise, A.; Giordano, G. Methanol to dimethylether on H-MFI catalyst: The influence of the Si/Al ratio on kinetic parameters. Catal. Today 2014, 227, 138–143. [Google Scholar] [CrossRef]
  15. Li, H.-J.; Zhou, X.-D.; Di, Y.H.; Zhang, J.-M.; Zhang, Y. Effect of Si-ATP/CTAB ratio on crystal morphology, pore structure and adsorption performance of hierarchical (H) ZSM-11 zeolite. Microporous Mesoporous Mater. 2018, 271, 146–155. [Google Scholar] [CrossRef]
  16. Catizzone, E.; Migliori, M.; Mineva, T.; Van Daele, S.; Valtchev, V.; Giordano, G. New synthesis routes and catalytic applications of ferrierite crystals. Part 2: The effect of OSDA type on zeolite properties and catalysis. Microporous Mesoporous Mater. 2020, 296, 109988. [Google Scholar] [CrossRef]
  17. Che, S.; Feng, J.; Che, S. An insight into the role of the surfactant CTAB in the formation of microporous molecular sieves. Dalton Trans. 2014, 43, 3612–3617. [Google Scholar] [CrossRef]
  18. Wang, X.; Chen, H.; Meng, F.; Gao, F.; Sun, C.; Sun, L.; Wang, S.; Wang, L.; Wang, Y. CTAB resulted direct synthesis and properties of hierarchical ZSM-11/5 composite zeolite in the absence of template. Microporous Mesoporous Mater. 2017, 243, 271–280. [Google Scholar] [CrossRef]
  19. Xu, L.; Ji, X.; Li, S.; Zhou, Z.; Du, X.; Sun, J.; Deng, F.; Che, S.; Wu, P. Self-Assembly of Cetyltrimethylammonium Bromide and Lamellar Zeolite Precursor for the Preparation of Hierarchical MWW Zeolite. Chem. Mater. 2016, 28, 4512–4521. [Google Scholar] [CrossRef]
  20. Chizhik, V.I.; Chernyshev, Y.S.; Donets, A.V.; Frolov, V.V.; Komolkin, A.V.; Shelyapina, M.G. Magnetic Resonance and Its Applications; Springer International Publishing: Cham, Switzerland, 2014. [Google Scholar] [CrossRef]
  21. Shelyapina, M.; Nefedov, D.Y.; Kostromin, A.V.; Siluykov, O.; Zvereva, I. Proton mobility in Ruddlesden-Popper phase H2La2Ti3O10 studied by 1H-NMR. Ceram. Int. 2019, 45, 5788–5795. [Google Scholar] [CrossRef]
  22. Shelyapina, M.; Lushpinskaya, I.P.; Kurnosenko, S.A.; Silyukov, O.I.; Zvereva, I.A. Identification of Intercalates and Grafted Organic Derivatives of H2La2Ti3O10 by Multinuclear NMR. Russ. J. Gen. Chem. 2020, 90, 760–761. [Google Scholar] [CrossRef]
  23. Kharkov, B.B.; Dvinskikh, S.V. Chain dynamics of surfactants in mesoporous silica. Phys. Chem. Chem. Phys. 2013, 15, 18620–18626. [Google Scholar] [CrossRef] [PubMed]
  24. Kharkov, B.B.; Corkery, R.W.; Dvinskikh, S.V. Phase Transitions and Chain Dynamics of Surfactants Intercalated into the Galleries of Naturally Occurring Clay Mineral Magadiite. Langmuir 2014, 30, 7859–7866. [Google Scholar] [CrossRef]
  25. Khimyak, Y.Z.; Klinowski, J. Solid-state NMR studies of the organic template in mesostructured aluminophosphates. Phys. Chem. Chem. Phys. 2001, 3, 616–626. [Google Scholar] [CrossRef]
  26. Yocupicio-Gaxiola, R.I.; Petranovskii, V.; Antúnez-García, J.; Moyado, S.F. One-pot synthesis of lamellar mordenite and ZSM-5 zeolites and subsequent pillaring by amorphous SiO2. Appl. Nanosci. 2019, 9, 557–565. [Google Scholar] [CrossRef]
  27. Baerlocher, C.; McCusker, L.B.; Olson, D.H. Atlas of Zeolite Framework Types, 6th ed.; Elsevier: Amsterdam, The Netherlands, 2007. [Google Scholar]
  28. Na, K.; Choi, M.; Park, W.; Sakamoto, Y.; Terasaki, O.; Ryoo, R. Pillared MFI Zeolite Nanosheets of a Single-Unit-Cell Thickness. J. Am. Chem. Soc. 2010, 132, 4169–4177. [Google Scholar] [CrossRef]
  29. Na, K.; Park, W.; Seo, Y.; Ryoo, R. Disordered Assembly of MFI Zeolite Nanosheets with a Large Volume of Intersheet Mesopores. Chem. Mater. 2011, 23, 1273–1279. [Google Scholar] [CrossRef]
  30. Banfi, D.; Patiny, L. www.nmrdb.org: Resurrecting and Processing NMR Spectra On-line. Chim. Int. J. Chem. 2008, 62, 280–281. [Google Scholar] [CrossRef]
  31. Ishikawa, S.; Kurosu, H.; Ando, I. Structural studies of n-alkanes by variable-temperature solid-state high-resolution 13C-NMR spectroscopy. J. Mol. Struct. 1991, 248, 361–372. [Google Scholar] [CrossRef]
  32. Janicke, M.; Landry, C.C.; Christiansen, S.C.; Kumar, D.; Stucky, G.D.; Chmelka, B.F. Aluminum Incorporation and Interfacial Structures in MCM-41 Mesoporous Molecular Sieves. J. Am. Chem. Soc. 1998, 120, 6940–6951. [Google Scholar] [CrossRef]
  33. Baccile, N.; Babonneau, F. Organo-modified mesoporous silicas for organic pollutant removal in water: Solid-state NMR study of the organic/silica interactions. Microporous Mesoporous Mater. 2008, 110, 534–542. [Google Scholar] [CrossRef] [Green Version]
  34. Voelkel, R. High-Resolution Solid-State 13C-NMR Spectroscopy of Polymers [New Analytical Methods(37)]. Angew. Chem. Int. Ed. 1988, 27, 1468–1483. [Google Scholar] [CrossRef]
  35. Deng, F.; Yue, Y.; Ye, C. Observation of Nonframework Al Species in Zeolite β by Solid-State NMR Spectroscopy. J. Phys. Chem. B 1998, 102, 5252–5256. [Google Scholar] [CrossRef]
  36. Li, S.; Zheng, A.; Su, Y.; Fang, H.; Shen, W.; Yu, Z.; Chen, L.; Deng, F. Extra-framework aluminium species in hydrated faujasite zeolite as investigated by two-dimensional solid-state NMR spectroscopy and theoretical calculations. Phys. Chem. Chem. Phys. 2010, 12, 3895. [Google Scholar] [CrossRef]
  37. Zhukov, Y.; Efimov, A.Y.; Shelyapina, M.; Petranovskii, V.; Zhizhin, E.; Burovikhina, A.; Zvereva, I. Effect of preparation method on the valence state and encirclement of copper exchange ions in mordenites. Microporous Mesoporous Mater. 2016, 224, 415–419. [Google Scholar] [CrossRef]
  38. Shelyapina, M.; Krylova, E.A.; Zhukov, Y.M.; Zhukov, Y.; Rodríguez-Iznaga, I.; Petranovskii, V.; Fuentes-Moyado, S.; Iznaga, R.; Moyado, F. Comprehensive Analysis of the Copper Exchange Implemented in Ammonia and Protonated Forms of Mordenite Using Microwave and Conventional Methods. Molecules 2019, 24, 4216. [Google Scholar] [CrossRef] [Green Version]
  39. Freude, D. Quadrupolar nuclei in solid-state muclear magnetic resonance. In Encyclopedia of Analytical Chemistry; Meyers, R.A., Dybowski, C., Eds.; Wiley: New York, NY, USA, 2006; pp. 1–37. [Google Scholar]
  40. Kasperovich, V.S.; Sodel’, N.E.; Shelyapina, M. Nonempirical cluster calculations of the electric field gradient tensor in yttrium-aluminum garnet Y3Al5O12. Phys. Solid State 2006, 48, 1684–1688. [Google Scholar] [CrossRef]
  41. Shelyapina, M.; Kasperovich, V.; Wolfers, P. Electronic structure and electric-field-gradients distribution in Y3Al5O12: An ab initio study. J. Phys. Chem. Solids 2006, 67, 720–724. [Google Scholar] [CrossRef]
  42. Fyfe, C.A.; Feng, Y.; Grondey, H.; Kokotailo, G.T.; Gies, H. One- and two-dimensional high-resolution solid-state NMR studies of zeolite lattice structures. Chem. Rev. 1991, 91, 1525–1543. [Google Scholar] [CrossRef]
  43. Engelhardt, G.; Michel, D. High Resolution Solid State NMR of Silicates and Zeolites; Wiley: New York, NY, USA, 1987. [Google Scholar]
  44. Brouwer, D.H.; Brouwer, C.C.; Mesa, S.; Semelhago, C.A.; Steckley, E.E.; Sun, M.P.; Mikolajewski, J.G.; Baerlocher, C. Solid-state 29Si NMR spectra of pure silica zeolites for the International Zeolite Association Database of Zeolite Structures. Microporous Mesoporous Mater. 2020, 297, 110000. [Google Scholar] [CrossRef]
  45. Kato, M.; Itabashi, K.; Matsumoto, A.; Tsutsumi, K. Characteristics of MOR-Framework Zeolites Synthesized in Fluoride-Containing Media and Related Ordered Distribution of Al Atoms in the Framework. J. Phys. Chem. B 2003, 107, 1788–1797. [Google Scholar] [CrossRef]
  46. Paixão, V.; Carvalho, A.P.; Rocha, J.; Fernandes, A.; Martins, F. Modification of MOR by desilication treatments: Structural, textural and acidic characterization. Microporous Mesoporous Mater. 2010, 131, 350–357. [Google Scholar] [CrossRef]
  47. Klinowski, J. Recent Advances in Solid-State NMR of Zeolites. Annu. Rev. Mater. Res. 1988, 18, 189–218. [Google Scholar] [CrossRef]
  48. Glaser, R.H.; Wilkes, G.L.; Bronnimann, C.E. Solid-state 29Si NMR of TEOS-based multifunctional sol-gel materials. J. Non-Cryst. Solids 1989, 113, 73–87. [Google Scholar] [CrossRef]
  49. Brinker, C.; Kirkpatrick, R.; Tallant, D.; Bunker, B.; Montez, B. NMR confirmation of strained “defects” in amorphous silica. J. Non-Cryst. Solids 1988, 99, 418–428. [Google Scholar] [CrossRef]
  50. Rainho, J.P.; Rocha, J.; Carlos, L.D.; Almeida, R.M. 29Si nuclear-magnetic-resonance and vibrational spectroscopy studies of SiO2–TiO2 powders prepared by the sol-gel process. J. Mater. Res. 2001, 16, 2369–2376. [Google Scholar] [CrossRef]
  51. Klinowski, J.; Carpenter, T.; Gladden, L. High-resolution solid-state NMR studies of temperature-induced phase transitions in silicalite (zeolite ZSM-5). Zeolites 1987, 7, 73–78. [Google Scholar] [CrossRef]
Sample Availability: Samples of the compounds are available from the author (R.I.Y.-G.) upon request.
Publisher’s Note: MDPI stays neutral with regard to jurisdictional claims in published maps and institutional affiliations.
Figure 1. Small-angle (a) and full (b) XRD powder patterns for the mordenite samples as synthetized (MOR-AS) and pillared (MOR-P).
Molecules 25 04678 g001
Figure 2. Small-angle (a) and full (b) XRD powder patterns for the ZSM-5 samples as synthetized (MFI-AS) and pillared (MFI-P).
Molecules 25 04678 g002
Figure 3. SEM images of the samples, as synthetized and pillared: MOR-AS (a), MOR-P (b), MFI-AS (c), MFI-P (d).
Molecules 25 04678 g003
Figure 4. Element distribution maps in the MOR-P sample.
Molecules 25 04678 g004
Figure 5. (a,c): TG (blue), DTG (violet), DSC (red) and (b,d): ion current (various colors) curves for the MOR-AS (a,b) and MFI-AS (c,d) samples.
Molecules 25 04678 g005aMolecules 25 04678 g005b
Figure 6. 1H MAS NMR (a) and 13C CP/MAS NMR at τcp = 2 ms (b) spectra of the studied samples MOR-AS and MFI-AS with simulated spectra of CTAB and TPABr (at the top) given for a comparison; (c) 13C isotropic chemical shift profiles of CTAB: CTAB/MOR-AS (open triangles), CTAB/MFI-AS (open squares), crystalline powder from Ref. [23] (closed circles), simulated using www.nmrdb.org [30] (closed triangles); (d) integral peak intensity for CN, C1, C4–13 and C16 atoms of CTAB in MOR-AS versus contact pulse duration τcp (VCT experiment), dashed lines corresponds to the fitting within Equation (1).
Molecules 25 04678 g006
Figure 7. 1H MAS NMR (a,c) and 13C CP/MAS NMR at τcp = 2 ms (b,d) spectra of the studied MOR (a,b) and MFI (c,d) samples at all the preparation steps.
Molecules 25 04678 g007aMolecules 25 04678 g007b
Figure 8. 27Al MAS NMR spectra of the studied MOR (a) and MFI (b) samples at all the preparation steps.
Molecules 25 04678 g008
Figure 9. 29Si MAS NMR spectra for the MOR (a) and MFI (b) samples at the all preparation steps. Filled patterns represent decomposition on Lorentzian functions, dashed lines represent the total fit.
Molecules 25 04678 g009
Figure 10. 29Si NMR chemical shift (left), the line width at half maximum, Δν1/2 (center) and relative integral intensities (right) of the individual Lorentzian lines for the MOR (a) and MFI (b) samples at the all preparation steps. Filled areas show the typical ranges of 29Si chemical shift in zeolites (solid fill) and TEOS (hatched fill).
Molecules 25 04678 g010
Table 1. EDX elemental analysis of the as synthetized and pillared samples.
SampleNa/AlSi/AlBr/Al
MOR-AS1.14 ± 0.038.4 ± 0.30.24 ± 0.05
MOR-P0.17 ± 0.0615.2 ± 1.3Not detected
MFI-AS1.11 ± 0.098.8 ± 0.4Not detected
MFI-P0.34 ± 0.0514.8 ± 1.0Not detected
Table 2. Values of TCH and T1ρ for the selected CTAB spectral lines in MOR-AS derived from 1H-13C CP/MAS NMR measurements.
CTAB Carbon Siteδ (ppm)TCH (ms)T (ms)
CN54.52.21 ± 0.0431 ± 13
C167.30.37 ± 0.044.5 ± 0.5
C41330.50.98 ± 0.1270 ± 30
C1614.62.8 ± 0.3-
Table 3. 27Al NMR chemical shift (ν0) and line width at half maximum (Δν1/2) in the studied samples.
Sampleν0 (ppm)Δν1/2 (ppm)Sampleν0 (ppm)Δν1/2 (ppm)
MOR-AS54.6 ± 0.14.8 ± 0.1MFI-AS53.7 ± 0.14.9 ± 0.1
MOR-T56.9 ± 0.15.6 ± 0.1MFI-T55.9 ± 0.14.9 ± 0.1
MOR-TH56.3 ± 0.15.0 ± 0.1MFI-TH56.1 ± 0.14.7 ± 0.1
MOR-P58.1 ± 0.1
2.6 ± 0.1
5.7 ± 0.1
4.2 ± 0.2
MFI-P57.2 ± 0.1
1.6 ± 0.1
6.2 ± 0.1
8.5 ± 0.1

