
Dependence of the Nanoscale Composite Morphology of Fe3O4 Nanoparticle-Infused Lysozyme Amyloid Fibrils on Timing of Infusion: A Combined SAXS and AFM Study

 , , , ,
Abstract
:1. Introduction
2. Results
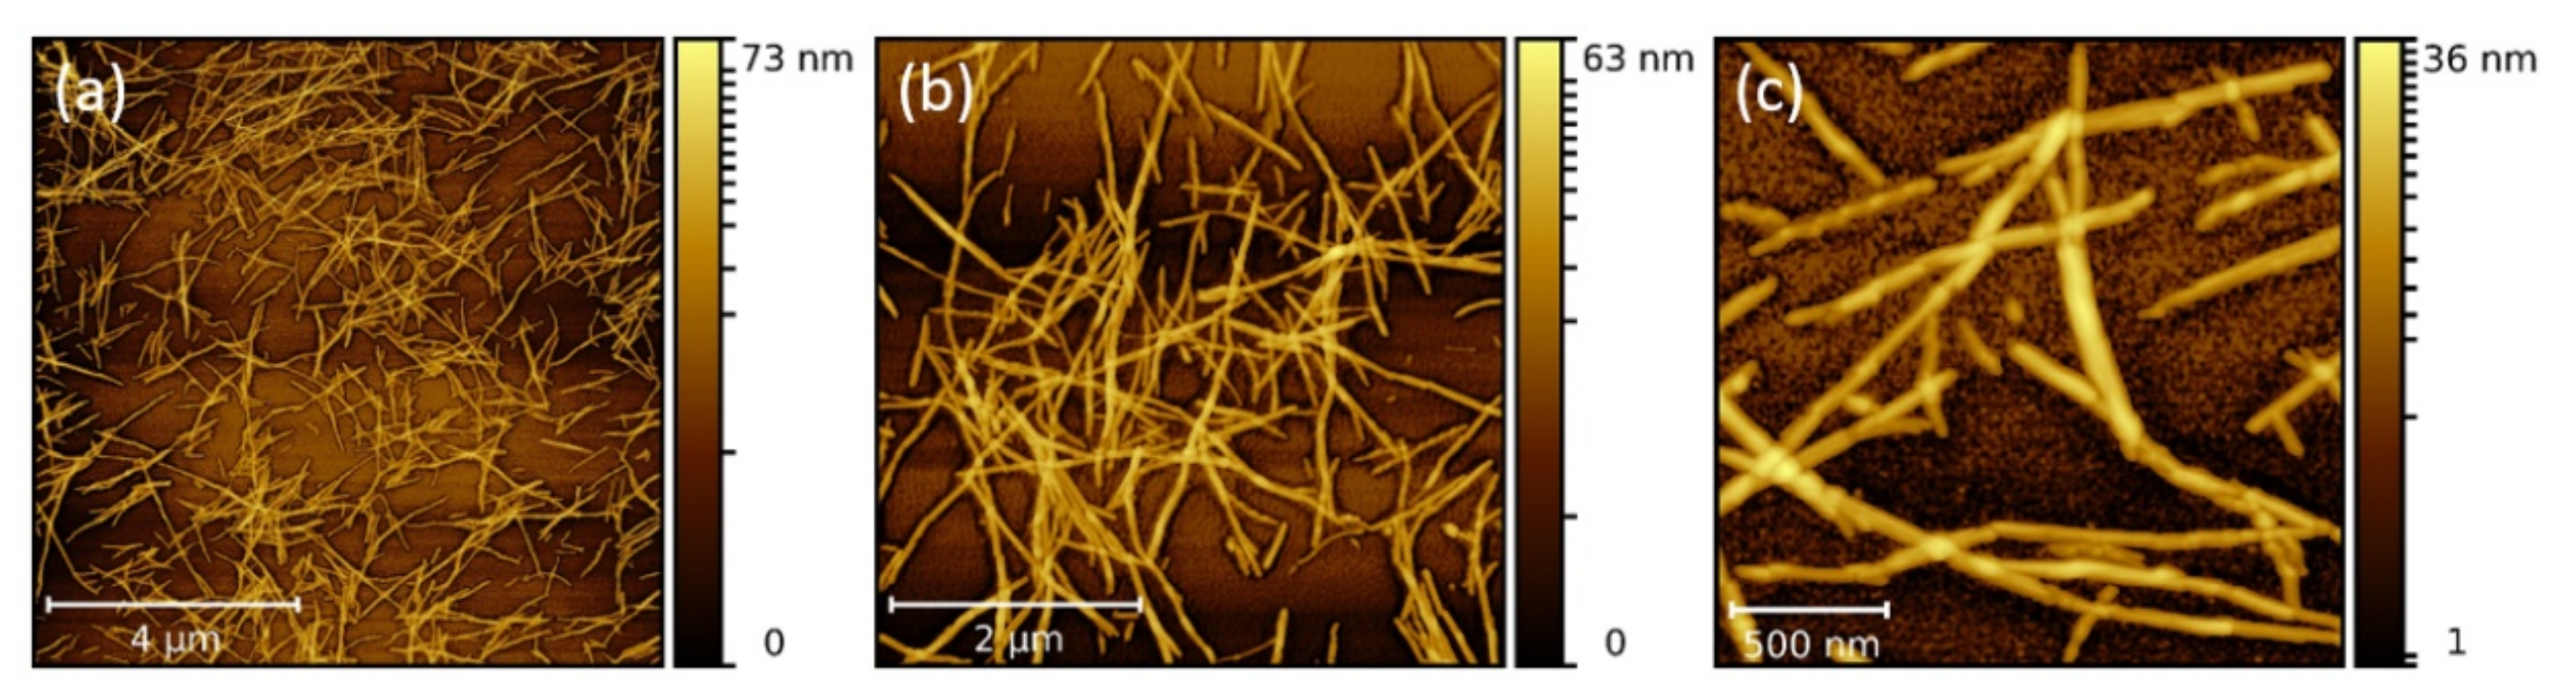
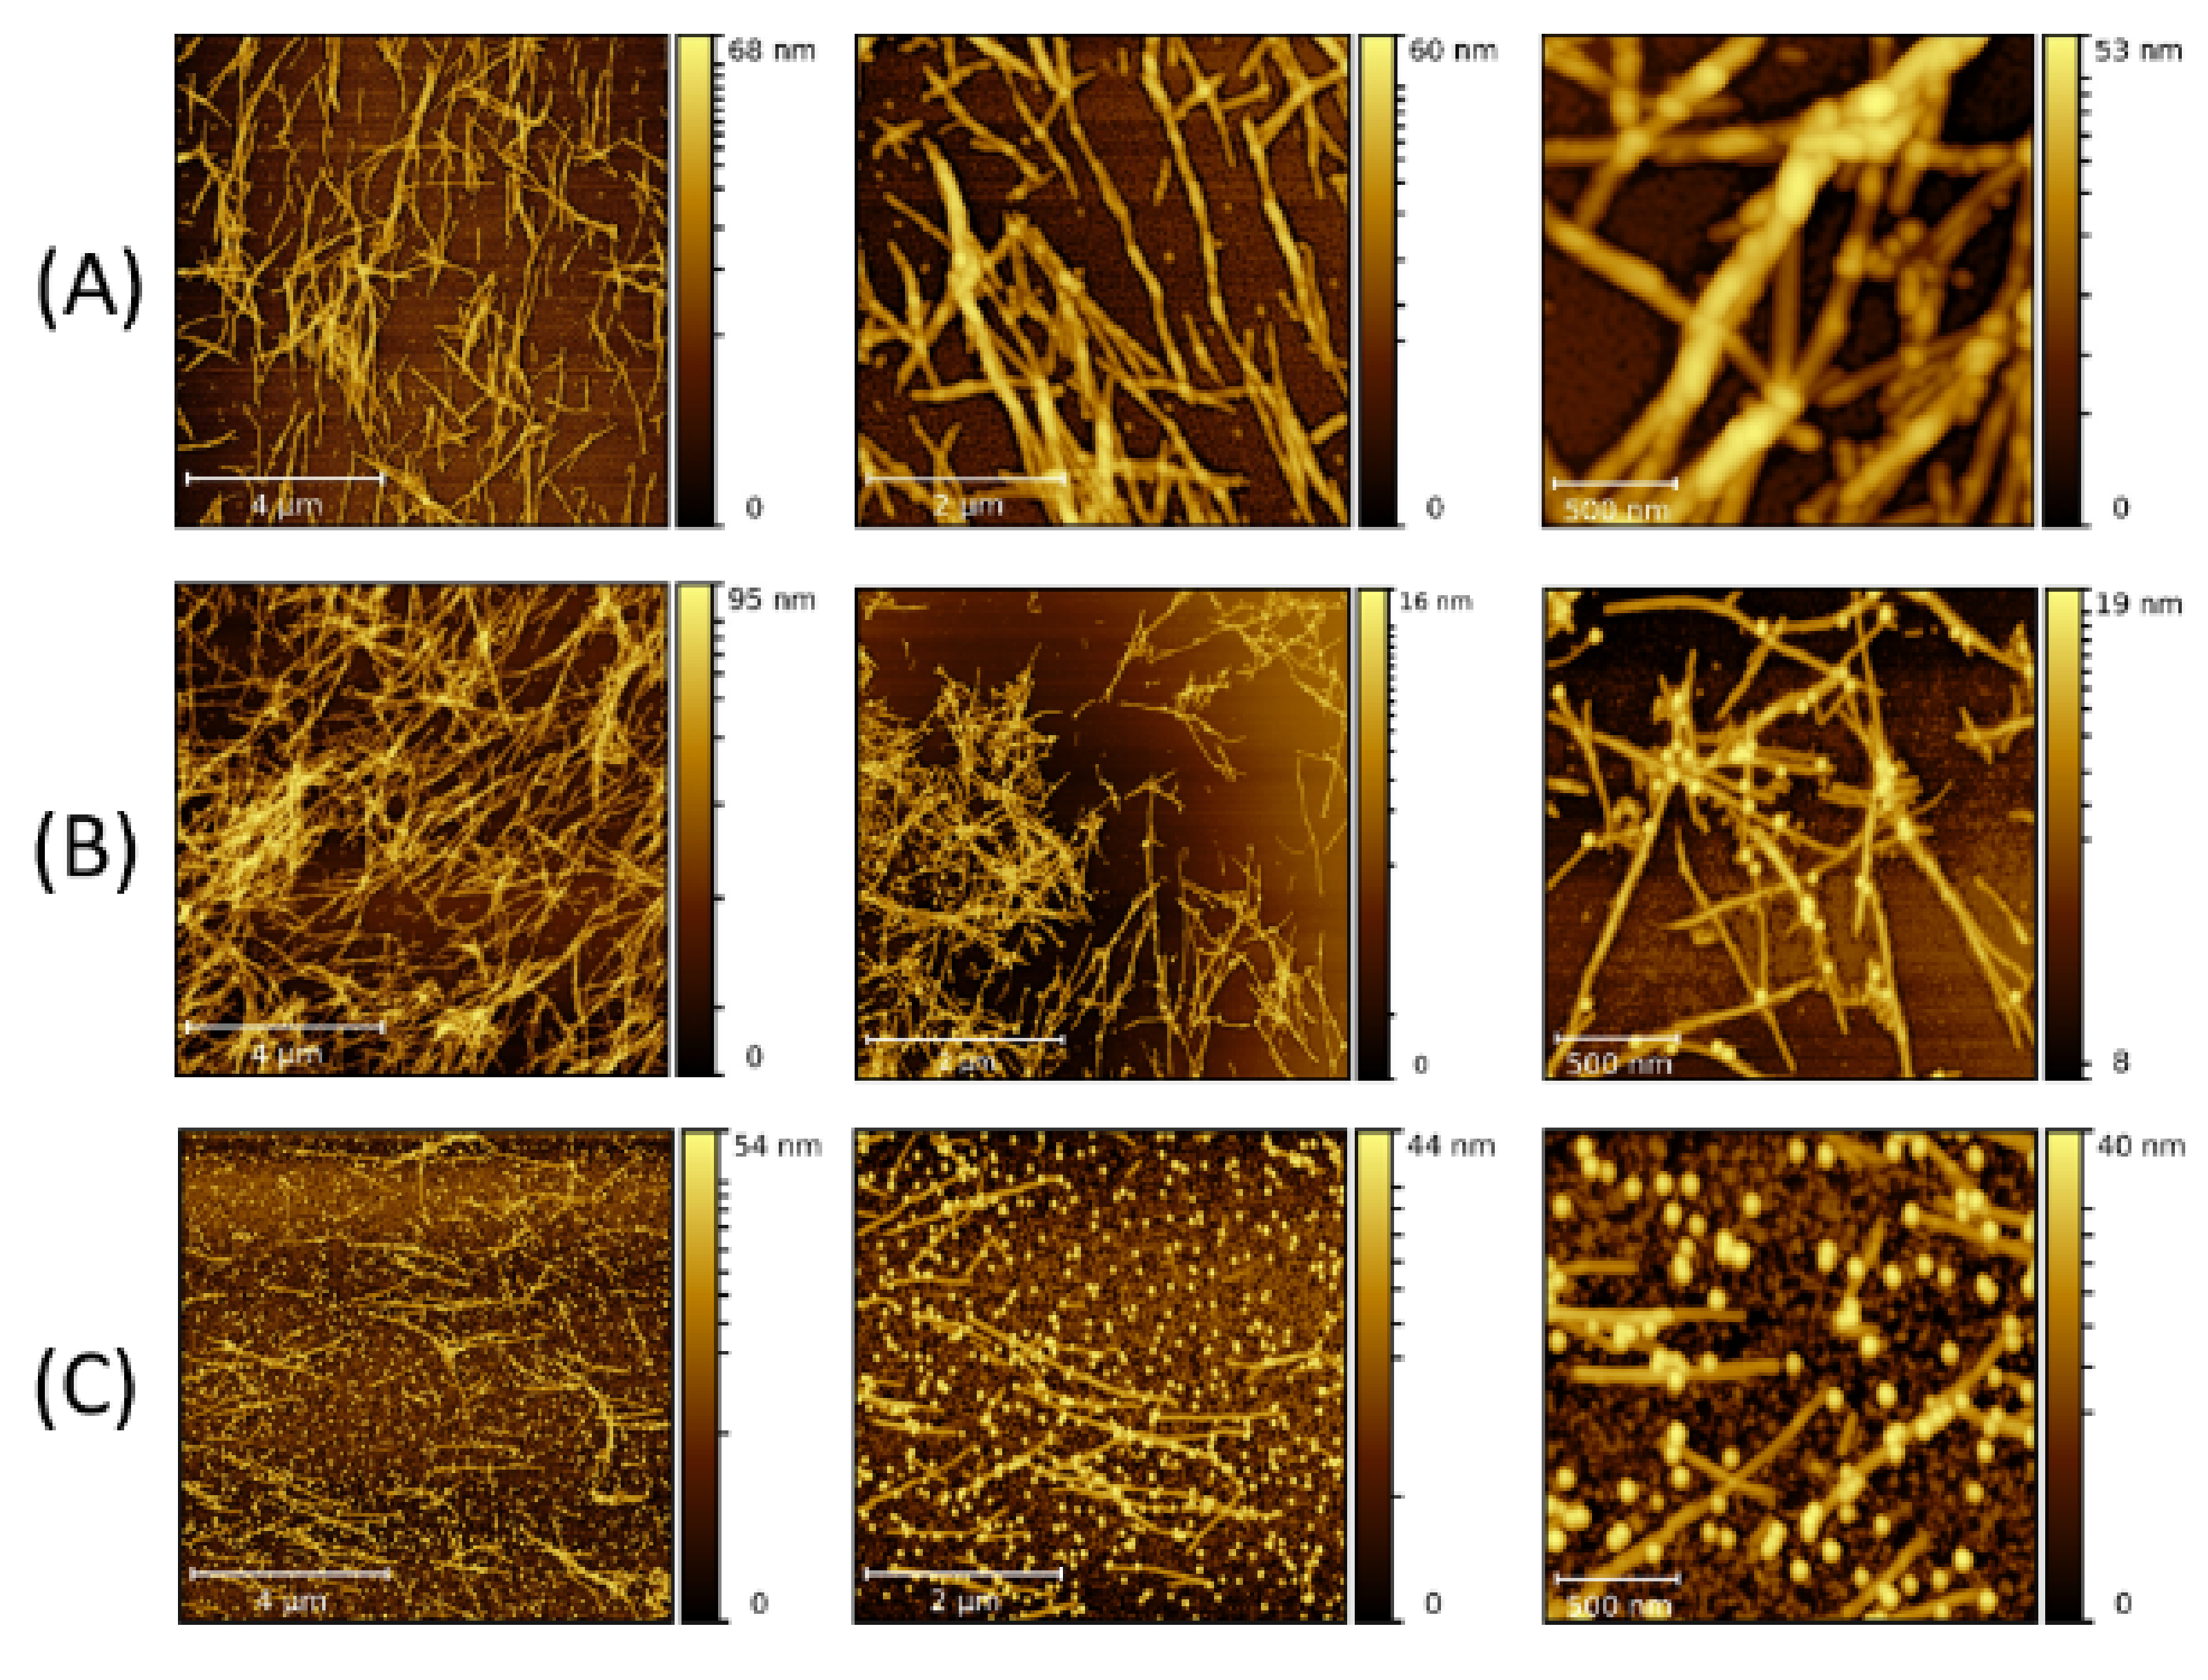
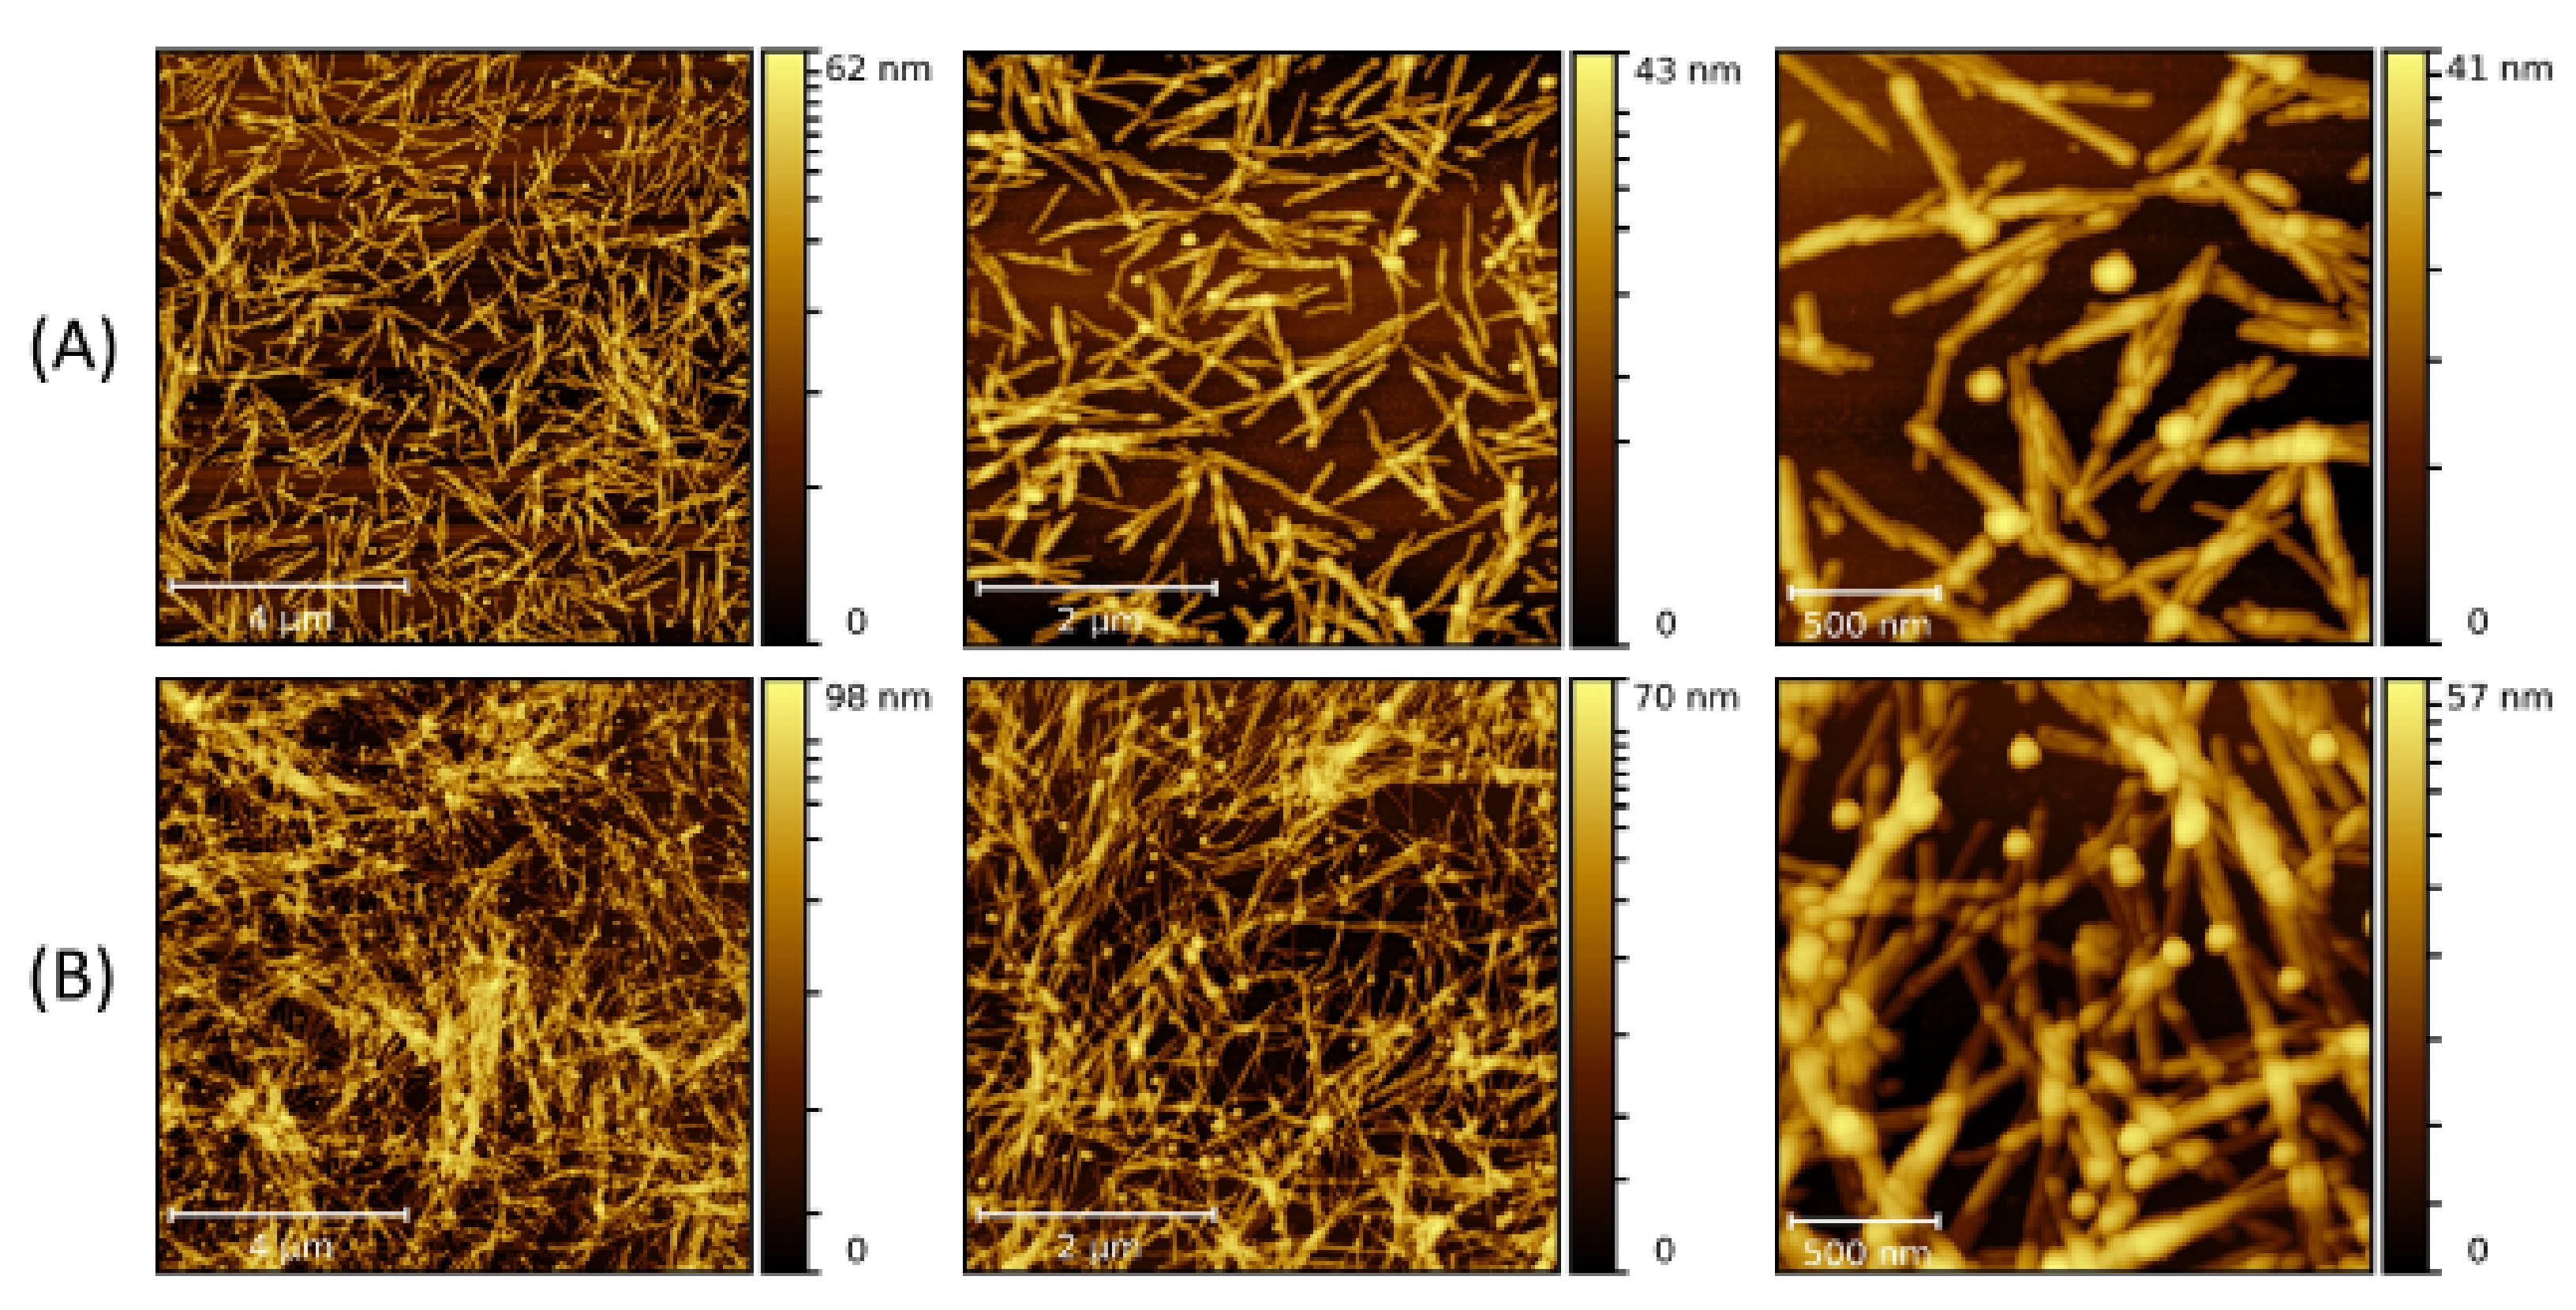
2.1. AFM Imaging
2.2. SAXS Characterization
2.3. Ab Initio Models
3. Discussion
4. Materials and Methods
4.1. Fe3O4 Nanoparticles
4.2. Lysozyme Amyloid Fibrils
4.3. Sample Preparation
4.4. Atomic Force Microscopy
4.5. Small Angle X-Ray Scattering
4.6. SAXS Data Analysis
5. Conclusions
Author Contributions
Funding
Data Availability Statement
Conflicts of Interest
Sample Availability
References
- Comellas, G.; Lemkau, L.R.; Nieuwkoop, A.J.; Kloepper, K.D.; Ladror, D.T.; Ebisu, R.; Woods, W.S.; Lipton, A.S.; George, J.M.; Rienstra, C.M. Structured regions of a-synuclein fibrils include the early-onset Parkinson’s disease mutation sites. J. Mol. Biol. 2011, 411, 881–895. [Google Scholar] [CrossRef] [PubMed] [Green Version]
- Westermark, P.; Andersson, A.; Westermark, G.T. Islet Amyloid polypeptide, islet amyloid, and diabetes mellitus. Physiol. Rev. 2011, 91, 795–826. [Google Scholar] [CrossRef] [PubMed] [Green Version]
- Mucchiano, G.I.; Jonasson, L.; Haggqvist, B.; Einarsson, E.; Westermark, P. Apolipoprotein A-I-Derived amyloid in atherosclerosis. Am. J. Clin. Pathol. 2001, 115, 298–303. [Google Scholar] [CrossRef] [Green Version]
- Rambaran, R.N.; Serpell, L.C. Amyloid fibrils: Abnormal protein assembly. Prion 2008, 2, 112–117. [Google Scholar] [CrossRef] [PubMed]
- Sinnige, T.; Stroobants, K.; Dobson, C.M.; Vendruscolo, M. Biophysical studies of protein misfolding and aggregation in in vivo. Q. Rev. Biophys. 2020, 53, e10. [Google Scholar] [CrossRef] [PubMed]
- Kakraba, S.; Ayyadaevara, S.; Penthala, N.R.; Balasubramaniam, M.; Ganne, A.; Liu, L.; Alla, R.; Bommagani, S.B.; Barger, S.W.; Griffin, W.S.; et al. A novel microtubule-binding drug attenuates and reverses protein aggregation in animal models of alzheimer’s disease. Front. Mol. Neurosci. 2019, 12, 310. [Google Scholar] [CrossRef] [PubMed] [Green Version]
- Ban, D.K.; Paul, S. Nano zinc oxide inhibits fibrillary growth and suppresses cellular toxicity of lysozyme amyloid. ACS Appl. Mater. Interfaces 2016, 8, 31587–31601. [Google Scholar] [CrossRef] [PubMed]
- Bellova, A.; Bystrenova, E.; Koneracka, M.; Kopcansky, P.; Valle, F.; Tomasovicova, N.; Timko, M.; Bagelova, J.; Biscarini, F.; Gazova, Z. Effect of Fe3O4 magnetic nanoparticles on lysozyme amyloid aggregation. Nanotechnology 2010, 21, 065103. [Google Scholar] [CrossRef]
- Liao, Y.H.; Chang, Y.J.; Yoshiike, Y.; Chang, Y.C.; Chen, Y.R. Negatively charged gold nanoparticles inhibit alzheimer’s amyloid-b fibrillation, induce fibril dissociation, and mitigate neurotoxicity. Small 2012, 8, 3621–3639. [Google Scholar] [CrossRef]
- Skaat, H.; Chen, R.; Grinberg, I.; Margel, S. Engineered polymer nanoparticles containing hydrophobic dipeptide for inhibition of amyloid-b fibrillation. Biomacromolecules 2012, 13, 2662–2670. [Google Scholar] [CrossRef]
- Sukhanova, A.; Poly, S.; Bozrova, S.; Lamber, E.; Ewald, M.; Karaulov, A.; Molinari, M.; Nabiev, I. Nanoparticles with a specific size and surface charge promote disruption of the secondary structure and amyloid-like fibrillation of human insulin under physiological conditions. Front. Chem. 2019, 7, 480. [Google Scholar] [CrossRef] [PubMed] [Green Version]
- Li, M.; Zhao, A.; Dong, K.; Li, W.; Ren, J.; Qu, X. Chemically exfoliated WS2 nanosheet can efficiently inhibit amyloid β-peptide aggregation and use for photothermal treatment of Alzheimer’s disease. Nano Res. 2015, 8, 3216–3227. [Google Scholar] [CrossRef]
- Moore, K.A.; Pate, K.M.; Soto-Ortega, D.D.; Lohse, S.; Munnik, N.; Lim, M.; Jackson, K.S.; Lyles, V.D.; Jones, L.; Glassgow, N.; et al. Influence of gold nanoparticle surface chemistry and diameter upon Alzheimer’s disease amyloid-β protein aggregation. J. Biol. Eng. 2017, 11, 1–11. [Google Scholar] [CrossRef] [PubMed] [Green Version]
- Antosova, A.; Gazova, Z.; Fedunova, D.; Valusova, E.; Bystrenova, E.; Valle, F.; Daxnerova, Z.; Biscarini, F.; Antalik, M. Anti-amyloidogenic activity of glutathione-covered gold nanoparticles. Mater. Sci. Eng. C 2012, 32, 2529–2535. [Google Scholar] [CrossRef]
- Palmal, S.; Maity, A.R.; Singh, B.K.; Basu, S.; Jana, N.R. Inhibition of amyloid fibril growth and dissolution of amyloid fibrils by curcumin-gold nanoparticles. Chemistry 2014, 20, 6184–6191. [Google Scholar] [CrossRef]
- Sudhakar, S.; Kalipillai, P.; Santhosh, P.B.; Mani, E. Role of surface charge of inhibitors on amyloid beta fibrillation. J. Phys. Chem. C 2017, 121, 6339–6348. [Google Scholar] [CrossRef]
- Kogan, M.J.; Bastus, N.G.; Amigo, R.; Grillo-Bosch, D.; Araya, E.; Turiel, A.; Labarta, A.; Giralt, E.; Puntes, V.F. Nanoparticle-mediated local and remote manipulation of protein aggregation. Nano Lett. 2006, 6, 110–115. [Google Scholar] [CrossRef]
- Cox, D.L.; Lashuel, H.; Lee, K.Y.C.; Singh, R.R.P. The materials science of protein aggregation. MRS Bull. 2005, 30, 452–457. [Google Scholar] [CrossRef] [Green Version]
- Cui, Z.R.; Lockman, P.R.; Atwood, C.S.; Hsu, C.H.; Gupte, A.; Allen, D.D.; Mumper, R.J. Novel D-penicillamine carrying nanoparticles for metal chelation therapy in Alzheimer’s and other CNS diseases. Eur. J. Pharm. Biopharm. 2005, 59, 263–272. [Google Scholar] [CrossRef]
- Tomasovicova, N.; Hu, P.S.; Zeng, C.L.; Majorosova, J.; Zakutanska, K.; Kopcansky, P. Dual size-dependent effect of Fe3O4 magnetic nanoparticles upon interaction with lysozyme amyloid fibrils: Disintegration and adsorption. Nanomaterials 2019, 9, 37. [Google Scholar] [CrossRef] [Green Version]
- Bolisetty, S.; Vallooran, J.J.; Adamcik, J.; Mezzenga, R. Magnetic-Responsive Hybrids of Fe3O4 Nanoparticles with beta-Lactoglobulin Amyloid Fibrils and Nanoclusters. ACS Nano 2013, 7, 6146–6155. [Google Scholar] [CrossRef]
- Skaat, H.; Sorci, M.; Belfort, G.; Margel, S. Effect of maghemite nanoparticles on insulin amyloid fibril formation: Selective labeling, kinetics, and fibril removal by a magnetic field. J. Biomed. Mater. Res. A 2009, 91, 342–350. [Google Scholar] [CrossRef]
- Majorošová, J.; Schroer, M.A.; Tomašovičová, N.; Batková, M.; Hu, P.-S.; Kubovčíková, M.; Svergun, D.I.; Kopčanský, P. Effect of the concentration of protein and nanoparticles on the structure of biohybrid nanocomposites. Biopolymers 2020, 111, e23342. [Google Scholar] [CrossRef]
- Majorošová, J.; Petrenko, V.I.; Siposova, K.; Timko, M.; Tomašovičová, N.; Garamus, V.M.; Koralewski, M.; Avdeev, M.; Leszczynski, B.; Jurga, S.; et al. On the adsorption of magnetite nanoparticles on lysozyme amyloid fibrils. Colloids Surface B 2016, 146, 794–800. [Google Scholar] [CrossRef] [PubMed]
- Tomasovicova, N.; Hu, P.-S.; Zeng, C.-L.; Hurakova, M.; Csach, K.; Majorosova, J.; Kubovcikova, M.; Kopcansky, P. Dynamic morphogenesis of dendritic structures formation in hen eggwhite lysozyme fibrils doped with magnetic nanoparticles. Colloids Surf. B 2018, 161, 457–463. [Google Scholar] [CrossRef] [PubMed]
- Chen, Y.-W.; Chang, C.-W.; Hung, H.-S.; Kung, M.-L.; Yrh, B.-W.; Hsieh, S. Magnetite nanoparticle interactions with insulin amyloid fibrils. Nanotechnology 2016, 27, 415702. [Google Scholar] [CrossRef]
- Franke, D.; Petoukhov, M.V.; Konarev, P.V.; Panjkovich, A.; Tuukkanen, A.; Mertens, H.D.T.; Kikhney, A.G.; Hajizadeh, N.R.; Franklin, J.M.; Jeffries, C.M.; et al. ATSAS 2.8: A comprehensive data analysis suite for small-angle scattering from macromolecular solutions. J. Appl. Crystallogr. 2017, 50, 1212–1225. [Google Scholar] [CrossRef] [Green Version]
- Svergun, D.I. Deterimination of the regularization parameter in indirect-transform methods using perceptual criteria. J. Appl. Crystallogr. 1992, 25, 495–503. [Google Scholar] [CrossRef]
- Franke, D.; Svergun, D.I. DAMMIF, a program for rapid ab-initio shape determination in small-angle scattering. J. Appl. Crystallogr. 2009, 42, 342–346. [Google Scholar] [CrossRef] [PubMed] [Green Version]
- Konarev, P.V.; Volkov, V.V.; Sokolova, A.V.; Koch, M.H.J.; Svergun, D.I. PRIMUS—A Windows-PC based system for small-angle scattering data analysis. J. Appl. Crystallogr. 2003, 36, 1277–12282. [Google Scholar] [CrossRef]
- Li, T.; Senesi, A.J.; Lee, B. Small angle X-ray scattering for nanoparticle research. Chem. Rev. 2016, 116, 11128–11180. [Google Scholar] [CrossRef] [PubMed]
- Svergun, D.I.; Koch, M.H.J.; Timmins, P.A.; May, R.P. Small Angle X-ray and Neutron Scattering from Solutions of Biological Macromolecules; Oxford University Press: Oxford, UK, 2013. [Google Scholar]
- Schroer, M.A.; Markgraf, J.; Wieland, D.C.F.; Sahle, C.J.; Moeller, J.; Paulus, M.; Tolan, M.; Winter, R. Nonlinear pressure dependence of the interaction potential of dense protein solutions. Phys. Rev. Lett. 2011, 106, 178102. [Google Scholar] [CrossRef] [PubMed] [Green Version]
- Franklin, J.M.; Surampudi, L.N.; Ashbaugh, H.S.; Pozzo, D.C. Numerical validation of IFT in the analysis of protein–surfactant complexes with SAXS and SANS. Langmuir 2012, 28, 12593–12600. [Google Scholar] [CrossRef] [PubMed]
- Safarik, I.; Prochazkova, J.; Schroer, M.A.; Garamus, V.M.; Kopcansky, P.; Timko, M.; Rajnak, M.; Karpets, M.; Ivankov, O.I.; Avdeev, M.V.; et al. Cotton textile/iron oxide nanozyme composites with peroxidase-like activity: Preparation, characterization, ans application. ACS Appl. Mater. Interfaces 2021, 13, 23627–23637. [Google Scholar] [CrossRef] [PubMed]
- Konarev, P.V.; Svergun, D.I. Direct shape determination of intermediates in evolving macromolecular solutions form small-angle scattering data. IUCrJ 2018, 5, 402–409. [Google Scholar] [CrossRef] [Green Version]
- Svergun, D.I. Restoring low resolution structure of biological macromolecules from solution scattering using simulated annealing. Biophys. J. 1999, 76, 2879–2886. [Google Scholar] [CrossRef] [Green Version]
- Majorosova, J.; Tomasovicova, N.; Gdovinova, V.; Yang, C.W.; Batkova, M.; Demcakova, M.; Csach, K.; Kubovcikova, M.; Hayryan, S.; Hwang, I.S.; et al. Self-assembly of hen egg white lysozyme fibrils doped with magnetic particles. J. Magn. Magn. Mat. 2019, 471, 400–406. [Google Scholar] [CrossRef]
- Perumal, V.; Hashim, U.; Gopinath, S.C.B.; Haarindraprasad, R.; Foo, K.L.; Balakrishnan, S.R.; Poopalan, P. ‘Spotted Nanoflowers’: Goldseeded Zinc Oxide Nanohybrid for Selective Bio-capture. Sci. Rep. 2015, 5, 12231. [Google Scholar] [CrossRef] [Green Version]
- Bolisetty, S.; Mezzenga, R. Amyloid-carbon hybrid membranes for universal water purification. Nat. Nanotechnol. 2016, 11, 365–371. [Google Scholar] [CrossRef]
- Schroer, M.A.; Svergun, D.I. Recent developments in small-angle X-ray scattering and hybrid method approaches for biomacromolecular solutions. Emerg. Top. Life Sci. 2018, 2, 69–79. [Google Scholar] [CrossRef]
- Blanchet, C.E.; Spilotros, A.; Schwemmer, F.; Graewert, M.A.; Kikhney, A.; Jeffries, C.M.; Franke, D.; Mark, D.; Zengerle, R.; Cipriani, F.; et al. Versatile sample environments and automation for biological solution X-ray scattering experiments at the P12 beamline (PETRA III, DESY). J. Appl. Crystallogr. 2015, 48, 431–443. [Google Scholar] [CrossRef] [PubMed] [Green Version]
- Franke, D.; Kikhney, A.G.; Svergun, D.I. Automated acquisition and analysis of small angle X-ray scattering data. Nucl. Instrum. Methods Phys. Rev. A 2012, 689, 52–59. [Google Scholar] [CrossRef]
- Gdovinova, V.; Schroer, M.A.; Tomasovicova, N.; Appel, I.; Behrens, S.; Majorosova, J.; Kovac, J.; Svergun, D.I.; Kopcansky, P. Structuralization of magnetic nanoparticles in 5CB liquid crystals. Soft Matter 2017, 13, 7890–7896. [Google Scholar] [CrossRef]
- Sun, Y.; Zuo, X.; Sankaranarayan, S.K.; Peng, S.; Narayan, B.; Kamath, G. Quantitative 3D evolution of colloidal nanoparticle oxidation in solution. Science 2017, 356, 303–307. [Google Scholar] [CrossRef] [PubMed]
- Luo, Z.; Marson, D.; Ong, Q.K.; Loiudice, A.; Kohlbrecher, J.; Radulescu, A.; Krause-Heuer, A.; Darwish, T.; Balog, S.; Buonosanti, R.; et al. Quantitative 3D determination of self-assembled structures on nanoparticles using small angle neutron scattering. Nat. Commun. 2018, 9, 1–10. [Google Scholar] [CrossRef] [PubMed] [Green Version]


| Sample | Size (nm) |
|---|---|
| LAF: maximum particle size Dmax | 80 ± 2 |
| LAF: diameter d | 23 ± 2 |
| P10: | 5.7 ± 0.1 |
| P20: | 10.7 ± 0.1 |
| P30: | 13.3 ± 0.4 |
Publisher’s Note: MDPI stays neutral with regard to jurisdictional claims in published maps and institutional affiliations. |
© 2021 by the authors. Licensee MDPI, Basel, Switzerland. This article is an open access article distributed under the terms and conditions of the Creative Commons Attribution (CC BY) license (https://creativecommons.org/licenses/by/4.0/).
Share and Cite
Schroer, M.A.; Hu, P.-S.; Tomasovicova, N.; Batkova, M.; Zakutanska, K.; Wu, P.-Y.; Kopcansky, P. Dependence of the Nanoscale Composite Morphology of Fe3O4 Nanoparticle-Infused Lysozyme Amyloid Fibrils on Timing of Infusion: A Combined SAXS and AFM Study. Molecules 2021, 26, 4864. https://0-doi-org.brum.beds.ac.uk/10.3390/molecules26164864
Schroer MA, Hu P-S, Tomasovicova N, Batkova M, Zakutanska K, Wu P-Y, Kopcansky P. Dependence of the Nanoscale Composite Morphology of Fe3O4 Nanoparticle-Infused Lysozyme Amyloid Fibrils on Timing of Infusion: A Combined SAXS and AFM Study. Molecules. 2021; 26(16):4864. https://0-doi-org.brum.beds.ac.uk/10.3390/molecules26164864
Chicago/Turabian StyleSchroer, Martin A., Po-Sheng Hu, Natalia Tomasovicova, Marianna Batkova, Katarina Zakutanska, Po-Yi Wu, and Peter Kopcansky. 2021. "Dependence of the Nanoscale Composite Morphology of Fe3O4 Nanoparticle-Infused Lysozyme Amyloid Fibrils on Timing of Infusion: A Combined SAXS and AFM Study" Molecules 26, no. 16: 4864. https://0-doi-org.brum.beds.ac.uk/10.3390/molecules26164864