Article

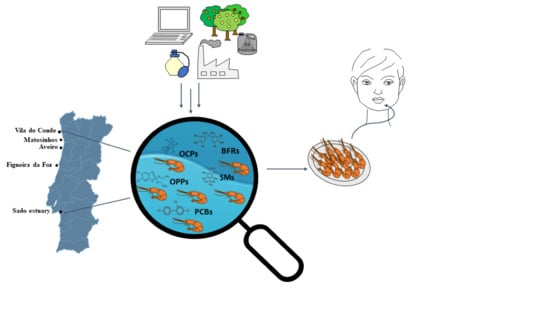
Validation and Evaluation of Selected Organic Pollutants in Shrimp and Seawater Samples from the NW Portuguese Coast

by
Maria Luz Maia
1,2,
Cristina Delerue-Matos
1,
Conceição Calhau
2,3 and
Valentina Fernandes Domingues
1,*
1
REQUIMTE/LAQV-GRAQ, Instituto Superior de Engenharia do Porto, Politécnico do Porto, 4249-015 Porto, Portugal
2
Center for Research in Health Technologies and Information Systems, 4200-450 Porto, Portugal
3
Nutrição e Metabolismo, NOVA Medical School, Faculdade de Ciências Médicas, Universidade Nova de Lisboa, 1169-056 Lisboa, Portugal
*
Author to whom correspondence should be addressed.
Submission received: 6 September 2021 / Revised: 19 September 2021 / Accepted: 21 September 2021 / Published: 23 September 2021

Abstract

:
The development of coastal regions has contributed to the intensification of environmental contamination, which can accumulate in aquatic biota, such as shrimps. These crustaceans, besides being delicious and being a good source of nutrients, can also accumulate environmental pollutants. Amongst others, these include organochlorine pesticides (OCPs), organophosphorus pesticides (OPPs), brominated flame retardants (BFRs), polychlorinated biphenyls (PCBs) and synthetic musks (SMs). These pollutants, classified as endocrine disruptors, are related to adverse effects in humans and since one of the major routes of exposition is ingestion, this is a cause for concern regarding their presence in food. The aim of the present study was to quantify the presence of environmental pollutants in shrimp samples and in the water from their habitat along the northwest Portuguese coast. In seawater samples, only two OCPs (lindane and DDD) and one BFR (BTBPE) were detected, and in shrimp samples, one OCP (DDD) and three SMs (HHCB, AHTN and ketone) were found. Bioaccumulation and the risk assessment of dietary exposure of SMs in shrimp samples were investigated. It was observed that all shrimp samples analyzed significantly presented bioaccumulation of the three SMs found. Concentrations of SMs detected in shrimp samples do not present a health risk for the adult Portuguese population.

Graphical Abstract

1. Introduction

In the last several decades, rapid commercial, agricultural and industrial development has contributed to increasing environmental pollution. Oceans are a reservoir of pollutants and play an important role in the transport and fate of environmental pollutants. The large seawater volume in oceans makes this matrix an important inventory for pollutants, particularly in coastal regions [1]. Environmental pollution of surface waters poses a threat to the aquatic environment, through the toxic effects on aquatic organisms. The accumulation of pollutants in the ecosystem is also a potential hazard to human health. As a result, protection of water resources and biota is a priority. The European Union (EU) released maximum allowable concentration levels for some pollutants in surface waters [2]. In aquatic environments, hydrophobic pollutants can bioaccumulate though direct uptake from the water or trophic transfer [3]. This creates safety concerns for human consumption of aquatic organisms. Shrimp is one of the most popular crustaceans consumed worldwide and can be a healthy addition to our diet. Shrimp is low in fat and calories, rich in omega-3 fatty acids and a good source of key nutrients, such as iodine, phosphorus, choline, copper, zinc, B-complex vitamins, vitamin A and E and antioxidants, especially astaxanthin [4,5].
Shrimps can accumulate pollutants from their surrounding environment. These pollutants include organochlorine pesticides (OCPs), organophosphorus pesticides (OPPs), brominated flame retardants (BFRs), polychlorinated biphenyls (PCBs) and synthetic musks (SMs). These chemicals are lipophilic endocrine disruptors that are persistent in the environment and can be transferred through the food chain [6,7,8]. These pollutants are a global problem for the environment and human health.
OCPs have been used extensively in agriculture as pest and insect control. The use of OCPs, such as dichlorodiphenyltrichloroethane (DDT), hexachlorobenzene (HCB), aldrin, endrin, chlordane, heptachlor, mirex and toxaphene, have been prohibited in many European, North American and South American countries from the 1970s and 1980s [9,10]. Despite this, DDT and lindane (γ-HCH) are still used in some countries. DDT is used to inhibit mosquito growth to prevent vector-borne diseases such as dengue, leishmaniosis, malaria and Japanese encephalitis and lindane is used to treat head lice in children [11].
OPPs are the class of agriculture pesticides most used worldwide. Besides their agricultural use, OPPs also have many domestic uses. Although OPPs are less persistent, most of them can cause harmful effects on humans [12]. Some OPPs, such as dimethoate, malathion and chlorpyrifos, have already been banned from commercialization in Europe, under Regulation EC No.1107/2009 [13].
BFRs are chemicals used to reduce the flammability of a variety of products, including electronics, vehicles, plastics and textiles. This group of chemicals consists of polybrominated diphenyl ethers (PBDEs) that comprise 209 congeners, polybrominated biphenyls (PBBs), tetrabromobisphenol A (TBBPA) and hexabromocyclododecane (HBCDD). Certain BFRs also have legislation that restricts or bans their use. Directive 2003/11/EC amends Directive 76/769/EEC and prohibits the sale of PentaBDE and OctaBDE (two commercial mixtures of PBDEs) in concentrations higher than 0.1% by mass [14]. Since 2006, all new electrical and electronic equipment should not contain PBBs and PBDEs [15,16]. In 2008, DecaBDE was also banned [17].
PCBs are a group of chlorinated hydrocarbons that include between one and ten chlorine atoms attached to a biphenyl moiety [18,19] and have 209 possible congeners. Since 1929, these chemicals have been widely used in various industrial materials such as hydraulic fluids, insulating oil in condensers and transformers and paints. Additionally, some paint manufacturing processes can produce PCB congeners as by-products [19,20]. Europe prohibited the manufacturing of PCBs in the late 1970s [19,21], the Stockholm Convention classified PCBs as persistent organic pollutants in 2001 [22] and the International Agency for the Research on Cancer (IARC) classified PCBs in Group I (carcinogenic to humans) [23].
SMs are chemicals used as fragrance additives in diverse household and personal care products, including perfumes, shampoos, lotions, deodorants, soaps and detergents. SMs can be divided into four major groups: nitro, polycyclic, macrocyclic and alicyclic musks. Nitro musks have been banned in many countries and replaced by polycyclic musks [24]. The EU forbids the use of the musks ambrette, moskene and tibetene in cosmetic products. The EU also limits the musks xylene and ketone in cosmetic products to less than 0.003–1% and 0.042–1.4%, respectively [25].
The major exposure routes for these chemicals are diet, occupational exposure, inhalation or absorption through the skin. These pollutants are linked to adverse health effects, including cancers, neurological, respiratory, immunological and reproductive disorders, thyroid dysfunction and diabetes [12,20,26,27,28,29].
These chemicals can be detected in shrimp and seawater samples all over the world [30]. Table S1 (Supplementary Material) presents some examples of contaminant levels found in Europe. The purpose of this study was to measure the presence of contaminants in two shrimp species, Palaemon serratus and Palaemon varians, and in the water from their habitat on the northwest (NW) Portuguese coast, contributing to the quality of the aquatic environment and to ensure food safety.

2. Results

2.1. Validation of the Analytical Methodology

The optimized procedure presented an adequate separation and quantification of the compounds with retention times in the range of 16.41–25.19 min (OCPs), 10.15–20.21 min (OPPs), 19.42–71.65 min (BFRs and PCBs) and 14.83–26.35 min (SMs). For all the compounds, the intraday and interday precisions were below 20%, and the results are summarized in Table S2. Intraday and interday precisions were 4.0–13.9% and 2.9–11.0% for OCPs, respectively, 6.7–9.9% and 5.4–15.8% for OPPs, respectively, 7.4–12.5% and 0.5–10.8% for BFRs, respectively, 3.3–7.7% and 1.0–4.9% for PCBs, respectively, and 7.4–13.5% and 4.1–13.2% for SMs, respectively. The results of the expanded combined uncertainty (Ur, tot) were 6.6–15.3% for OCPs, 11.3–38.0% for OPPs, 1.6–24.2% for BFRs, 5.2–15.3 for PCBs and 7.4–26.5% for SMs (Table S2). The values are in accordance with the EU guidance requirement of <50% [31].

2.1.1. Water Sampled in the Shrimps’ Habitat

The optimized procedure was adequate for multiresidue analysis of various pollutants with a valuable separation and quantification of the compounds. The linearity range, coefficient of determination (R2), method detection (MDL) and method quantification (MQL) limits, matrix effect (ME) and average recoveries for each group (OCPs, BFRs, PCBs, OPPs and SMs) for seawater samples are presented in Table S3. Good linearity was achieved for all the curves for the entire range of concentrations with R2 higher than 0.99, except for BFR, TBECH (Table S3). The average recoveries presented in Table S3 ranged from 60–88% for OCPs with the exception of HCB (46%), 70–83% for OPPs, 86–93% for BFRs, 62–95% for PCBs and 65–77% for SMs. MDLs and MQLs were 0.006–0.013 ng/g wet weight (ww) and 0.020–0.044 ng/g ww for OCPs, 0.007–0.013 ng/g ww and 0.023–0.044 ng/g ww for OPPs, 0.004–0.031 ng/g ww and 0.013–0.104 ng/g ww for BFRs, 0.002–0.013 ng/g ww and 0.008–0.044 ng/g ww for PCBs and 0.009–0.013 ng/g ww and 0.029–0.045 ng/g ww for SMs, respectively. ME was calculated as described in Section 3.4, and values ranged between 16% and −109% (OCPs), 0% and 36% (OPPs), −9% and −70% (BFRs), −15% and −83% (PCBs) and 90% and 93% (SMs), as described in Table S3. For all the pollutants analyzed, 55.1% of the compounds suffered ion suppression, 18.4% ion enhancement, 24.5% were in the range of −20–20% and one presented a value of 0%.

2.1.2. Shrimp Samples

The chromatographic method was optimized for the edible tissues of shrimp samples. Three different QuEChERS methods were tested for OCPs, and the best QuEChERS was the AOAC (Table S4). Applying the selected QuEChERS (AOAC), different quantities of graphitized carbon black were tested in the clean-up for OCPs, the best results were obtained with 2 mg (Table S4). The linearity range, R2, MDL, MQL, ME and average recoveries for each group of pollutants (OCPs, BFRs, PCBs, OPPs and SMs) are presented in Table S5. Good linearity was achieved in all analyte curves for the entire range of concentrations used, since R2 values were higher than 0.99. The average recoveries ranged between 56–96% for OCPs, 60–91% for OPPs, 65–136% for BFRs, 73–88% for PCBs and 74–94% for SMs (Table S5). MDLs and MQLs were 0.95–2.89 ng/g ww and 3.16–9.63 ng/g ww for OCPs, 4.23–6.39 ng/g ww and 14.10–21.31 ng/g ww for OPPs, 1.08–3.70 ng/g ww and 3.59–12.33 ng/g ww for BFRs, 1.80–3.08 ng/g ww and 5.99–10.27 ng/g ww for PCBs and 1.33–3.51 ng/g ww and 4.42–11.71 ng/g ww for SMs, respectively. The complexity of food matrices with a large number of compounds can be problematic, interfering with the analytical signal causing ME. ME values were between −9% and −212% for OCPs, 1% and 29% for OPPs, 3% and −174% for BFRs, −16% and −107% for PCBs and 38% and 61% for SMs (Table S5). For all the compounds analyzed, 49.0% of the analytes suffered ion suppression, 21.6% ion enhancement and 29.4% were in the range of −20–20%, not considered the ME [32,33].

2.2. Pollutants

2.2.1. Pollutants in Water Sampled in the Shrimps’ Habitat

Quantification of pollutants in seawater can be challenging because the levels are potentially low in this environmental matrix. The concentrations of the analyzed pollutants found in the different locations are reported in Table 1. All the results are presented as µg/L of water sampled in the shrimps’ habitat. The OCPs found in seawater samples were α-HCH, lindane, δ-HCH, aldrin, dieldrin, DDE, DDD and DDT. However, only DDD and lindane were found above MDL. A DDD concentration of 0.012 µg/L was determined in the sample from aquaculture, in spring of 2018. Lindane was found in autumn samples from Ria de Aveiro 2017 (0.014 µg/L), Figueira da Foz 2017 (0.014 µg/L), Aveiro 2018 (0.021 µg/L) and Sado 2017 (0.023 µg/L). A previous study from 2002 also found the presence of OCPs in the Atlantic Ocean, in the Portugal zone, at 68 pg/L for α-HCH and 112 pg/L for lindane [34]. Chlorpyrifos was the only OPP found in the seawater samples analyzed, although below the MDL. A study from Zhong et al., in the North Sea reported concentrations between 27 and 86 pg/L for chlorpyrifos [35]. Regarding BFRs, BDE 28 and BTBPE were found, but only BTBPE was found above the MDL. A BTBPE concentration of 0.013 and 0.015 µg/L was found in spring samples from Ria de Aveiro 2018 and from aquaculture 2019, respectively. BFRs were detected previously in the Atlantic Ocean [36] (Table S1). BTBPE was detected previously in Korea Bays at a maximum of 0.021 ng/L [37]. PCB 28 was the only PCB found in seawater samples but was below the MDL. This is in accordance with another study in the Atlantic Ocean that found PCB 28 and other PCBs [38]. Concerning SMs, HHCB, AHTN and ketone were found in samples, although all below the MDL. A study that attempted to determine the presence of SMs in the Atlantic Ocean around Portugal did not detect any of the SMs analyzed, including HHCB, AHTN and ketone [39]. On the other hand, these three SMs were found in aquaculture sites from the Atlantic Ocean and Mediterranean Sea, with values between ˂MDL and 98.90 ng/L [40].

2.2.2. Pollutants in Shrimp Samples

Concentrations for the analyzed pollutants found in two shrimp species in different locations are summarized in Table 2. All the results are presented as ng/g ww. Despite the fact that several OCPs were detected in water, DDD was the only OCP found in shrimp samples. A concentration of 6.09 ng/g ww of DDD was found in a sample from Vila do Conde, autumn 2017. Persistent chemicals have been reported previously in shrimp samples from Europe, and a study from Belgium reported values of not detected (ND) to 0.81 ng/g ww for HCB, DDE and HCHs [41]. Another study from Belgium–Netherlands presented values of ND to 1.03 ng/g ww for DDE, DDD and DDT [42]. A report from Italy described values of ND to 1.02 ng/g ww for DDE, DDD, DDT and HCB [43]. OPPS and BFRs were not detected in any sample analyzed. Although BFRs have been described previously [44], as reported in Table S1, for OPPs, no report from Europe on the concentration in shrimps was found (using Web of Science database). Regarding PCBs, PCB 153 and PCB 180 were detected, but below the MDL, compared to a study from the Netherlands that reported a value of 0.117 ng/g ww for the sum of PCB 28, 52, 101, 108, 138, 153 and 180 [45]. Concerning SMs, HHCB, AHTN and ketone were detected. HHCB was detected in all the samples analyzed at concentrations ranging between 3.16 ng/g ww and 7.55 ng/g ww in spring from Aveiro 2019 and Ria de Aveiro 2018, respectively. AHTN was found in three samples from spring above the MDL, 2.64 ng/g ww in Matosinhos (shrimps with eggs) 2019 and, in Ria de Aveiro and Sado from 2018, the same value was obtained, 2.97 ng/g ww. The presence of eggs or shell does not significantly affect the quantity of pollutants. Ketone was observed to be present in half of the samples, in concentrations between 2.15 ng/g ww in Ria de Aveiro and 11.06 ng/g ww in Sado from spring 2018. The concentrations found in other studies are in the range of the values reported in this work. In shrimp samples from Asia, values for HHCB and AHTN ranged from 1.5–5.3 ng/g ww [46] and a further study, analyzing shrimp samples from local supermarkets in Spain, found values for HHCB and AHTN between 2.9 and 3.8 ng/g ww [47]. The sum and average of the SMs were calculated considered MDL/ 2 for concentrations below the MDL [48]. Comparing the average concentration values of spring and autumn for the three detected SMs, higher values were observed in spring. The average concentration value for HHCB was 4.89 ng/g ww in spring and 4.15 ng/g ww in autumn, and ketone presented values of 5.40 ng/g ww for spring and 4.55 ng/g ww for autumn. AHTN only presented values above the MDL in samples from spring, with an average of 2.86 ng/g ww. Evaluating the difference between the values for spring and autumn for the three SMs, we found that HHCB was significantly higher in spring samples (p = 0.027). Regarding the two shrimp species, the average for P. serratus was 4.64, 1.86 and 4.41 ng/g ww and for P. varians it was 4.40, 1.83 and 6.33 ng/g ww for HHCB, AHTN and ketone, respectively. Aquaculture shrimps have slightly lower values of HHCB and partially higher values of AHTN and ketone.

2.3. Bioaccumulation

The bioaccumulation degree can be reported as the bioaccumulation factor (BAF). For the calculation of the BAF, only the values detected for SMs were used, because these were found simultaneously in water and shrimp samples between 2017 and 2019. All SMs detected, HHCB, AHTN and ketone in seawater samples were below the MDL, whereas in shrimp samples HHCB and ketone were all above the MDL and three samples also presented AHTN above the MDL. For the pollutants below the MDL, the MDL was used to calculate the BAF [49]. The BAF values calculated are presented in Table 3. We observed bioaccumulation of all SMs detected in the biota samples. Regarding the average values for the three SMs detected, the BAF values are ranked as follows: ketone > HHCB > AHTN, ranging between 183.2 L/kg ww for P. serratus and 940.7 L/kg ww for P. varians. The BAF values regarding SMs in fish samples reported previously showed a wide range, from 93.3 L/kg ww to 6,456.5 L/kg ww, suggesting species-specific accumulation patterns [50,51].

2.4. Maximum Admissible Concentration

Pollutants such as OCPs, OPPs, PCBs and BFRs are already banned or have been restricted (with maximum levels legislated) [2,52,53,54]. The concentrations detected in this study for these pollutants were almost all ˂ MDL, with the exception of lindane, DDD and BTBPE in seawater samples and DDD in shrimp samples. We can see that OCPs such as DDD and lindane, already banned for several years, can still be detected in the samples analyzed with values > MDL. BTBPE, detected in seawater samples, is an emerging BFR and, although it has been investigated, it is not yet legislated. The limited experimental data collected for BTBPE identified that this compound can accumulate in the body over time, due to the BAFs reported. These findings were included in a scientific opinion released by the European Food Safety Authority (EFSA) [55]. Regarding SMs, HHCB, ANTH and ketone were detected in shrimp samples > MDL. Although some legislation has been established, concerning the maximum concentration allowed of SMs in cosmetics [25], no regulation has been established for environmental or biota samples. The results of this study reported concentrations of SMs in shrimps and with BAF values higher than 100. These findings validate that specific legislation for SMs should be enforced for foodstuffs, such as fishery products.

2.5. Risk Assessment

The risk of exposure was evaluated for the detected SMs (HHCB, AHTN and ketone), the group of contaminants present with higher frequency in the analyzed samples. Data on safe SM consumption levels and their health risks for human population are very limited. However, to these SMs are attributed values for no observed adverse effect level (NOAEL) [56,57,58], as presented in Table 4. Based on this, the tolerable daily intake (TDI) was calculated. The values for maximum shrimp daily consumption per individual (28.82 g/day) and mean adult body weight in the Portuguese population (71.68 kg) were described in a previous work reporting data on the Portuguese population [59]. Only values of SM concentrations above the MDL were used to calculate the dietary exposure. The results described in Table 4 present values of exposure (median, 25th and 75th percentile) all below the TDI calculated, so it is unlikely that a potential health risk is present based on this risk assessment. These results are in accordance with previous works reporting risk assessment for SMs in seafood [46,47].

3. Materials and Methods

In this study, fourteen OCPs, six OPPs, twelve BFRs, thirteen PCBs and six SMs were included, in a total of 51 endocrine disruptors. Most of these compounds have high Log Kow which increases the potential to bioconcentrate in living organisms.

3.1. Sample Collection

P. serratus and P. varians shrimp species were collected in Portugal. P. serratus was collected along the NW Portuguese coast (namely in Vila do Conde, Matosinhos, Aveiro, Ria de Aveiro and Figueira da Foz) by local fishermen and P. varians (wild and aquaculture origin) was collected in the Sado estuary. P. serratus’s size ranged from 4–9 cm and the size of P. varians ranged from 2–4 cm. A total of 1 kg of shrimps was sampled in each location. The sampling was performed in autumn and spring between 2017 and 2019 in all the locations, according to the period allowed for shrimp capture by Portuguese law [60]. The edible portion of the shrimp was separated from the shell, except in some samples of P. varians in which separation was not possible, due to the small size of the shrimp; shrimps with eggs were stored separately. Twenty-eight samples were storage at −20 °C until analysis.
Surface water was collected in the same locations of shrimp samples and during the same period. A total of twenty-five samples were gathered: 4 in Vila do Conde, 4 in Matosinhos, 3 in Aveiro, 2 in Ria de Aveiro, 4 in Figueira da Foz and 8 in the Sado estuary (4 for aquaculture and 4 for wild shrimp). Samples were collected in clean glass bottles, previously rinsed with ultra-pure water and stored at −20 °C until extraction.

3.2. Reagents, Solvents and Materials

The detailed description of the reagents, solvents and materials used for the extraction and analysis of the studied contaminants is given in Table S6. For the contaminants analyzed by GC (Table S7), standard stock solutions of individual and mixed compounds were prepared in n-hexane with different concentrations and stored in amber colored vials at 4 °C prior to utilization.

3.3. Extraction Procedure

3.3.1. Water Sampled in the Shrimps’ Habitat

Prior to extraction, the samples were filtered with ashless filter paper and the sample pH was adjusted to 2.5 using HCl 1 M. Internal standard (IS) was added to volumetric flasks (final concentrations of 100 µg/L for 4.4’-dichlorobenzophenone and 50 µg/L for 5′-fluoro-2,3′,4,4′,5-pentabromodiphenyl ether, TPP and AHTN-d3). The solid phase extraction (SPE) method was used for the extraction procedure. Strata C18-E cartridges (500 mg, 3 mL), in a vacuum system manifold (Chromabond, Düren, Germany), were previously cleaned with 5 mL of ethyl acetate:dichloromethane (1:1), and conditioned with 5 mL of methanol and 5 mL of ultrapure water. Subsequently, seawater samples were percolated through the cartridge. Then, the cartridges were rinsed with 10 mL of ultrapure water and dried under vacuum for 15 min. The elution was performed using 8 mL of ethyl acetate and 8 mL of dichloromethane. The cartridges were dried under vacuum. Anhydrous sodium sulfate (5 g) was added to the eluted samples (to remove all the existent water). In the end, 30 µL of D-(+)-gluconic acid δ-lactone at 5 mg/mL in acetonitrile (ACN)/ultrapure water (9:1) were added as an analyte protector. The extract was evaporated under a stream of nitrogen and the residues were reconstituted with 500 µL of n-hexane and injected into the chromatograph. OCPs, BFRs and PCBs were analyzed using gas chromatography with an electron capture detector (GC-ECD), OPPs by gas chromatography with a flame photometric detector (GC-FPD) and SMs using gas chromatography coupled with a mass spectrometric detector (GC-MS). Positive results were confirmed by GC-MS/MS. Details of the chromatography analysis are presented in the Supplementary Material (Section S1), GC-MS and MS/MS conditions for SMs are described in Table S8 [61,62] and GC-MS/MS conditions for the other compounds in Table S9 [63,64,65].

3.3.2. Shrimp

Optimization of the extraction procedure was performed with OCPs, by testing different QuEChERS (Original, AOAC and EN) and clean-up compositions (150 mg anhydrous magnesium sulfate, 50 mg PSA and 50 mg C18 with 2 mg graphitized carbon black or 5 mg graphitized carbon black) (Table S4). The optimized method was then tested and applied to all analyzed contaminants. Briefly, shrimp edible portions (shrimp muscle) were mechanically homogenized with a kitchen blender (Braun, Frankfurt, Germany), 5 g were weighed and the IS solution was added to a final concentration of 100 µg/L for 4.4′-dichlorobenzophenone and 50 µg/L for 5′-fluoro-2,3′,4,4′,5-pentabromodiphenyl ether, TPP and AHTN-d3. Next, 8 mL of ACN were added to the shrimp, followed by vortex homogenization for 3 min. QuEChERS AOAC was added and the mixture was again vortexed for 3 min and then centrifuged at 4000 rpm for 5 min. Afterwards, 1 mL of supernatant was transferred to a 2 mL tube containing the clean-up sorbents (150 mg anhydrous magnesium sulfate, 50 mg PSA, 50 mg C18 and 2 mg graphitized carbon black). The tubes were vortexed for 2 min followed by centrifugation at 4000 rpm for 5 min. An aliquot of the supernatant 300 µL (for OCP and OPPs) or 600 µL (for BFRs, PCBs and SMs) was transferred to a vial and concentrated just to dryness using a gentle stream of nitrogen. The sample residue was reconstituted in 150 µL of n-hexane and injected into the GC for analysis. GC analysis of shrimp samples was conducted as described for seawater samples.

3.4. Method Validation

Repeatability was presented as intraday precision and intermediate as interday precision. Calibration curves were obtained for all contaminants analyzed in this study in shrimp or seawater fortified after extraction with standard solutions (matrix-matched calibration). In seawater samples, recoveries were calculated using spiked samples at three levels in triplicate, 0.06, 0.09 and 0.13 µg/L for all the compounds analyzed. The recoveries for shrimp samples were calculated using spiked samples at three levels, 16, 24 and 32 ng/g w/w for OCPs, 16, 28 and 40 ng/g w/w for OPPs and 8, 14 and 20 ng/g w/w for BFRs, PCBs and SMs, with each level in triplicate. The ME was calculated, as previously described [32], using standard solutions prepared in n-hexane compared to spiked blank samples. A positive result corresponds to an enhancement of the analytical response, whereas a negative value corresponds to a suppression effect. Values within the 20% signal variation are not considered as a ME [32,33]. The uncertainty was determined following the “top-down” approach, using validation data and the uncertainty of the purity of analytical standards. The coverage factor k of 2 and confidence level of 95% were applied for all the analytes [32].

3.5. Bioaccumulation Factor

The BAF can be measured as the ratio between concentration in aquatic species (shrimp μg/kg ww) and the concentration in ambient water (µg/L) [49]. The units of the BAF are mostly presented as L/kg [66]. A BAF greater than 1 indicates a potential of the organism to accumulate the pollutants, and values above 100 are considered significant [67].

3.6. Risk Assessment

A risk assessment was performed for a group of contaminants present in a higher frequency in the analyzed samples. The NOAEL [56,57,58] values were used to calculate a TDI by applying an uncertainty factor of 100 to account for the human variability and species differences [46]. The dietary exposure (µg/kg bw/day) of SMs was calculated according to the Equation (1) described previously [47].
E i = C i B × x
where Ei is the dietary exposure to the SM for individual (i) (µg/kg bw/day), Ci is the maximum shrimp daily consumption by individual (i) (g/day), B is the mean body weight of the adult Portuguese population (kg) and x is the concentration of SM in shrimp samples (μg/kg).

3.7. Statistical Analysis

The statistical analysis was performed using GraphPad Prism 6.01 software (La Jolla, CA, USA). Differences were considered significant when p < 0.05. Statistical significance of the difference between groups (autumn and spring) was evaluated by Student’s t-test and a Wilcoxon test.

4. Conclusions

This study reports, for the first time, the analysis of trace organic pollutants in shrimp species collected from the NW Portuguese coast. Lindane, DDD and BTBPE were detected above the MDL in seawater samples. In shrimp samples, DDD, HHCB, AHTN and ketone were found above the MDL. The average concentrations of SMs in shrimp samples were higher in spring than in autumn. In addition, aquaculture shrimps had lower HHCB values and higher AHTN and ketone values than wild shrimp. Bioaccumulation of HHCB, AHTN and ketone was confirmed using BAF calculation. The estimated exposure levels of SMs in shrimp samples were all below the estimated TDI, although these results need to be interpreted with caution due to the uncertainties of the limited data available. Although some of these pollutants have been banned for several years, they can still be detected in the environment today. Our results highlight the importance of continuous monitoring of pollutants in aquatic environments and marine organisms. For emerging pollutants like SMs, it is essential to establish specific legislation for aquatic environments and fishery products, such as shrimp, which is highly valuable in the human diet.

Supplementary Materials

The following are available online. Section S1: Gas chromatography Analysis description; Table S1: Concentration levels of the contaminants found in shrimp (ng/g ww) and seawater (μg/L) samples in previous studies in Europe; Table S2: Summary of uncertainties, intraday and interday precision obtained for OCPs, OPPs, BFRs, PCBs and SMs analytes; Table S3: Validation parameters using water sampled in the shrimp’s habitat matrix matched calibration for the selected OCPs, OPPs, BFRs, PCBs and SMs; Table S4: QuEChERS and clean-up optimization; Table S5: Validation parameters using shrimp matrix matched calibration for the selected OCPs, OPPs, BFRs, PCBs and SMs; Table S6: Reagents, solvents, and materials used in the extraction of the samples and in the analysis of the studied contaminants; Table S7: Physic-chemical characteristics, molecular mass, and the supplier company of the studied contaminants; Table S8: GC-MS and MS/MS conditions for SMs analysis; Table S9: GC-MS/MS conditions for OCPs, OPPs, BFRs, PCBs analysis.

Author Contributions

Conceptualization, M.L.M. and V.F.D.; methodology, M.L.M.; validation, M.L.M. and V.F.D.; investigation, M.L.M.; Writing—original draft, M.L.M.; resources, C.D.-M.; writing—review and editing, C.D.-M., C.C. and V.F.D.; supervision, V.F.D. All authors have read and agreed to the published version of the manuscript.

Funding

This work was supported by UIDB/50006/2020 by the Fundação para a Ciência e a Tecnologia (FCT)/Ministério da Ciência, Tecnologia e Ensino Superior (MCTES) through national funds. The authors also thank FCT and the European Union’s H2020 Research and Innovation Program for funding through the project Systemic—An integrated approach to the challenge of sustainable food systems: adaptive and mitigatory strategies to address climate change and malnutrition. Maria Luz Maia is grateful to FCT) and ESF (European Social Fund) through POCH (Programa Operacional Capital Humano) for the PhD grant SFRH/BD/128817/2017.

Institutional Review Board Statement

Not applicable.

Informed Consent Statement

Not applicable.

Data Availability Statement

Not applicable.

Conflicts of Interest

The authors declare no conflict of interest.

Sample Availability

Samples of the compounds are not available from the authors.

References

  1. Jurado, E.; Lohmann, R.; Meijer, S.; Jones, K.C.; Dachs, J. Latitudinal and seasonal capacity of the surface oceans as a reservoir of polychlorinated biphenyls. Environ. Pollut. 2004, 128, 149–162. [Google Scholar] [CrossRef]
  2. EU Directive 2013/39/EU of the European Parliament and of the Council of 12 August 2013 Amending Directives 2000/60/EC and 2008/105/EC as Regards Priority Substances in the Field of Water Policy. Available online: https://eur-lex.europa.eu/LexUriServ/LexUriServ.do?uri=OJ:L:2013:226:0001:0017:en:PDF (accessed on 5 March 2021).
  3. Al-Malki, A.L.; Moselhy, S.S. Impact of pesticides residue and heavy metals on lipids and fatty acids composition of some seafoods of Red Sea (KSA). Hum. Exp. Toxicol. 2011, 30, 1666–1673. [Google Scholar] [CrossRef]
  4. Ayas, D.; Ozogul, Y.; Yazgan, H. The effects of season on fat and fatty acids contents of shrimp and prawn species. Eur. J. Lipid Sci. Technol. 2013, 115, 356–362. [Google Scholar] [CrossRef]
  5. Dayal, J.S.; Ponniah, A.G.; Khan, H.I.; Babu, E.P.M.M.; Ambasankar, K.; Vasagam, K.P.K.K. Shrimps—A nutritional perspective. Curr. Sci. 2013, 104, 1487–1491. [Google Scholar]
  6. Aksoy, A.; Guvenc, D.; Yavuz, O.; Das, Y.K.; Atmaca, E. Seasonal variation of polychlorinated biphenyls and organochlorine pesticide levels of sea and cultured farm fish in the Samsun Region of Turkey. Bull. Environ. Contam. Toxicol. 2012, 88, 842–849. [Google Scholar] [CrossRef] [PubMed]
  7. Choi, M.; Lee, I.-S.; Jung, R.-H. Rapid determination of organochlorine pesticides in fish using selective pressurized liquid extraction and gas chromatography–mass spectrometry. Food Chem. 2016, 205, 1–8. [Google Scholar] [CrossRef]
  8. Yilmaz, B.; Terekeci, H.; Sandal, S.; Kelestimur, F. Endocrine disrupting chemicals: Exposure, effects on human health, mechanism of action, models for testing and strategies for prevention. Rev. Endocr. Metab. Disord. 2020, 21, 127–147. [Google Scholar] [CrossRef]
  9. EPA Persistent Organic Pollutants: A Global Issue, A Global Response; United States Environmental Protection Agency: Washington, DC, USA, 2009.
  10. Stockholm Convention Protecting Human Health and the Environment from Persistent Organic Pollutants. Genève, Switzerland. Available online: http://www.pops.int/TheConvention/Overview/tabid/3351/Default.aspx (accessed on 4 April 2021).
  11. Chung, S.W.C.; Chen, B.L.S. Development of a Multiresidue Method for the Analysis of 33 Organochlorine Pesticide Residues in Fatty and High Water Content Foods. Chromatographia 2015, 78, 565–577. [Google Scholar] [CrossRef]
  12. Teodoro, M.; Briguglio, G.; Fenga, C.; Costa, C. Genetic polymorphisms as determinants of pesticide toxicity: Recent advances. Toxicol. Rep. 2019, 6, 564–570. [Google Scholar] [CrossRef]
  13. EU Regulation (EC) No 1107/2009 of the European Parliament and of the Council of 21 October 2009 Concerning the Placing of Plant Protection Products on the Market and Repealing Council Directives 79/117/EEC and 91/414/EEC. Available online: https://eur-lex.europa.eu/LexUriServ/LexUriServ.do?uri=OJ:L:2009:309:0001:0050:EN:PDF (accessed on 9 March 2021).
  14. EU Directive 2003/11/EC of the European Parliament and of the Council of 6 February 2003 Amending for the 24th time Council Directive 76/769/EEC Relating to Restrictions on the Marketing and Use of Certain Dangerous Substances and Preparations (pentabromodip). Available online: https://eur-lex.europa.eu/LexUriServ/LexUriServ.do?uri=OJ:L:2003:042:0045:0046:EN:PDF (accessed on 8 March 2021).
  15. EU Directive 2002/95/EC of the European Parliament and of the Council of 27 January 2003 on the Restriction of the Use of Certain Hazardous Substances in Electrical and Electronic Equipment. Available online: https://eur-lex.europa.eu/LexUriServ/LexUriServ.do?uri=OJ:L:2003:037:0019:0023:en:PDF (accessed on 8 March 2021).
  16. EU Directive 2011/65/EU of the European Parliament and of the Council of 8 June 2011 on the Restriction of the Use of Certain Hazardous Substances in Electrical and Electronic Equipment. Available online: https://eur-lex.europa.eu/LexUriServ/LexUriServ.do?uri=OJ:L:2011:174:0088:0110:EN:PDF (accessed on 8 March 2021).
  17. European Court of Justice 2008/C 116/02. Available online: https://eur-lex.europa.eu/LexUriServ/LexUriServ.do?uri=OJ:C:2008:116:0002:0003:EN:PDF (accessed on 8 March 2021).
  18. Gandhi, N.; Bhavsar, S.P.; Reiner, E.J.; Chen, T.; Morse, D.; Arhonditsis, G.B.; Drouillard, K.G. Evaluation and Interconversion of Various Indicator PCB Schemes for ΣPCB and dioxin-like PCB toxic equivalent levels in fish. Environ. Sci. Technol. 2015, 49, 123–131. [Google Scholar] [CrossRef]
  19. Tsutsumi, T.; Kawashima, A.; Hamada, N.; Adachi, R.; Akiyama, H. A novel analytical method for determining total polychlorinated biphenyl concentrations in fish and shellfish using a simple and rapid clean-up followed by GC-MS/MS. J. Food Compos. Anal. 2021, 96, 103725. [Google Scholar] [CrossRef]
  20. Saktrakulkla, P.; Lan, T.; Hua, J.; Marek, R.F.; Thorne, P.S.; Hornbuckle, K.C. Polychlorinated Biphenyls in Food. Environ. Sci. Technol. 2020, 54, 11443–11452. [Google Scholar] [CrossRef] [PubMed]
  21. EU Council Directive 96/591EC of 16 September 1996 on the Disposal of Polychlorinated Biphenyls and Polychlorinated Terphenyls (PCB/PCT). Available online: https://eur-lex.europa.eu/legal-cotent/EN/TXT/PDF/?uri=CELEX:31996L0059&from=EN (accessed on 10 March 2021).
  22. UNEP. The 12 Initial POPs under the Stockholm Convention. Available online: http://chm.pops.int/TheConvention/ThePOPs/The12InitialPOPs/tabid/296/Default.aspx (accessed on 9 March 2021).
  23. Agudo, A.; Aronson, K.J.; Bonefeld-Jorgensen, E.C.; Cocco, P.; Cogliano, V.; Cravedi, J.P.; Esch, H.; Fiedler, H.; Glauert, H.P.; Guo, Y.-L.L.; et al. Polychlorinated Biphenyls and Polybrominated Biphenyls; IARC Publications: Lyon, France, 2016. [Google Scholar]
  24. Taylor, K.M.; Weisskopf, M.; Shine, J. Human exposure to nitro musks and the evaluation of their potential toxicity: An overview. Environ. Health 2014, 13, 14. [Google Scholar] [CrossRef] [PubMed] [Green Version]
  25. EU Regulation (EC) No 1223/2009 of the European Parliament and of the Council of 30 November 2009 on Cosmetic Products. Available online: https://ec.europa.eu/health/sites/default/files/endocrine_disruptors/docs/cosmetic_1223_2009_regulation_en.pdf (accessed on 8 March 2021).
  26. Mostafalou, S.; Abdollahi, M. Pesticides: An update of human exposure and toxicity. Arch. Toxicol. 2017, 91, 549–599. [Google Scholar] [CrossRef] [PubMed]
  27. Xiao, X.; Clark, J.M.; Park, Y. Potential contribution of insecticide exposure and development of obesity and type 2 diabetes. Food Chem. Toxicol. 2017, 105, 456–474. [Google Scholar] [CrossRef]
  28. Pinkas, A.; Gonçalves, C.L.; Aschner, M. Neurotoxicity of fragrance compounds: A review. Environ. Res. 2017, 158, 342–349. [Google Scholar] [CrossRef] [PubMed]
  29. Kim, Y.R.; Harden, F.A.; Toms, L.M.L.; Norman, R.E. Health consequences of exposure to brominated flame retardants: A systematic review. Chemosphere 2014, 106, 1–19. [Google Scholar] [CrossRef] [PubMed] [Green Version]
  30. Maia, M.L.; Sousa, S.; Correia-Sá, M.L.; Delerue-Matos, C.; Calhau, C.; Domingues, V.F. Organochlorine pesticides, brominated flame retardants, synthetic musks and polycyclic aromatic hydrocarbons in shrimps. An overview of occurrence and its implication on human exposure. Heliyon 2020, 6, e04870. [Google Scholar] [CrossRef]
  31. EU Document on Analytical Quality Control and Method Validation Procedures for Pesticides Residues Analysis in Food and Feed. Available online: https://www.eurl-pesticides.eu/userfiles/file/EurlALL/AqcGuidance_SANTE_2019_12682.pdf (accessed on 28 January 2021).
  32. Nagyová, S.; Tölgyessy, P. Validation including uncertainty estimation of a GC-MS/MS method for determination of selected halogenated priority substances in fish using rapid and efficient lipid removing sample preparation. Foods 2019, 8, 101. [Google Scholar] [CrossRef] [Green Version]
  33. Huerta, B.; Rodriguez-Mozaz, S.; Nannou, C.; Nakis, L.; Ruhí, A.; Acuña, V.; Sabater, S.; Barcelo, D. Determination of a broad spectrum of pharmaceuticals and endocrine disruptors in biofilm from a waste water treatment plant-impacted river. Sci. Total Environ. 2016, 540, 241–249. [Google Scholar] [CrossRef] [Green Version]
  34. Lakaschus, S.; Weber, K.; Wania, F.; Bruhn, R.; Schrems, O. The air-sea equilibrium and time trend of hexachlorocyclohexanes in the Atlantic Ocean between the Arctic and Antarctica. Environ. Sci. Technol. 2002, 36, 138–145. [Google Scholar] [CrossRef] [PubMed] [Green Version]
  35. Zhong, G.; Xie, Z.; Möller, A.; Halsall, C.; Caba, A.; Sturm, R.; Tang, J.; Zhang, G.; Ebinghaus, R. Currently used pesticides, hexachlorobenzene and hexachlorocyclohexanes in the air and seawater of the German Bight (North Sea). Environ. Chem. 2012, 9, 405–414. [Google Scholar] [CrossRef]
  36. Lohmann, R.; Klanova, J.; Kukucka, P.; Yonis, S.; Bollinger, K. Concentrations, fluxes, and residence time of PBDEs across the tropical Atlantic Ocean. Environ. Sci. Technol. 2013, 47, 13967–13975. [Google Scholar] [CrossRef] [Green Version]
  37. Lee, H.K.; Lee, S.; Lim, J.E.; Moon, H.B. Legacy and novel flame retardants in water and sediment from highly industrialized bays of Korea: Occurrence, source tracking, decadal time trend, and ecological risks. Mar. Pollut. Bull. 2020, 160, 111639. [Google Scholar] [CrossRef] [PubMed]
  38. Gioia, R.; Nizzetto, L.; Lohmann, R.; Dachs, J.; Temme, C.; Jones, K.C. Polychlorinated biphenyls (PCBs) in air and seawater of the Atlantic Ocean: Sources, trends and processes. Environ. Sci. Technol. 2008, 42, 1416–1422. [Google Scholar] [CrossRef]
  39. Ramos, S.; Homem, V.; Santos, L. Simultaneous determination of synthetic musks and UV-filters in water matrices by dispersive liquid-liquid microextraction followed by gas chromatography tandem mass-spectrometry. J. Chromatogr. A 2019, 1590, 47–57. [Google Scholar] [CrossRef] [PubMed]
  40. Aminot, Y.; Sayfritz, S.J.; Thomas, K.V.; Godinho, L.; Botteon, E.; Ferrari, F.; Boti, V.; Albanis, T.; Köck-Schulmeyer, M.; Diaz-Cruz, M.S.; et al. Environmental risks associated with contaminants of legacy and emerging concern at European aquaculture areas. Environ. Pollut. 2019, 252, 1301–1310. [Google Scholar] [CrossRef]
  41. Voorspoels, S.; Covaci, A.; Maervoet, J.; De Meester, I.; Schepens, P. Levels and profiles of PCBs and OCPs in marine benthic species from the Belgian North Sea and the Western Scheldt Estuary. Mar. Pollut. Bull. 2004, 49, 393–404. [Google Scholar] [CrossRef]
  42. Van Ael, E.; Covaci, A.; Blust, R.; Bervoets, L. Persistent organic pollutants in the Scheldt estuary: Environmental distribution and bioaccumulation. Environ. Int. 2012, 48, 17–27. [Google Scholar] [CrossRef]
  43. Ferrante, M.C.; Cirillo, T.; Naso, B.; Clausi, M.T.; Lucisano, A.; Cocchieri, R.A. Polychlorinated Biphenyls and Organochlorine Pesticides in Seafood from the Gulf of Naples (Italy). J. Food Prot. 2007, 70, 706–715. [Google Scholar] [CrossRef]
  44. Verslycke, T.A.; Vethaak, A.D.; Arijs, K.; Janssen, C.R. Flame retardants, surfactants and organotins in sediment and mysid shrimp of the Scheldt estuary (The Netherlands). Environ. Pollut. 2005, 136, 19–31. [Google Scholar] [CrossRef] [Green Version]
  45. Van Leeuwen, S.P.J.; Van Velzen, M.J.M.; Swart, C.P.; van der Veen, I.; Traag, W.A.; de Boer, J. Halogenated Contaminants in Farmed Salmon, Trout, Tilapia, Pangasius, and Shrimp. Environ. Sci. Technol. 2009, 43, 4009–4015. [Google Scholar] [CrossRef]
  46. Cunha, S.C.; Trabalón, L.; Jacobs, S.; Castro, M.; Fernandez-Tejedor, M.; Granby, K.; Verbeke, W.; Kwadijk, C.; Ferrari, F.; Robbens, J.; et al. UV-filters and musk fragrances in seafood commercialized in Europe Union: Occurrence, risk and exposure assessment. Environ. Res. 2018, 161, 399–408. [Google Scholar] [CrossRef] [PubMed]
  47. Trabalón, L.; Cano-Sancho, G.; Pocurull, E.; Nadal, M.; Domingo, J.L.; Borrull, F. Exposure of the population of Catalonia (Spain) to musk fragrances through seafood consumption: Risk assessment. Environ. Res. 2015, 143, 116–122. [Google Scholar] [CrossRef] [PubMed]
  48. Hornung, R.W.; Reed, L.D. Estimation of Average Concentration in the Presence of Nondetectable Values. Appl. Occup. Environ. Hyg. 1990, 5, 46–51. [Google Scholar] [CrossRef]
  49. Griboff, J.; Wunderlin, D.A.; Horacek, M.; Monferrán, M.V. Seasonal variations on trace element bioaccumulation and trophic transfer along a freshwater food chain in Argentina. Environ. Sci. Pollut. Res. 2020, 27, 40664–40678. [Google Scholar] [CrossRef]
  50. Yao, L.; Zhao, J.L.; Liu, Y.S.; Zhang, Q.Q.; Jiang, Y.X.; Liu, S.; Liu, W.R.; Yang, Y.Y.; Ying, G.G. Personal care products in wild fish in two main Chinese rivers: Bioaccumulation potential and human health risks. Sci. Total Environ. 2018, 621, 1093–1102. [Google Scholar] [CrossRef]
  51. Wang, Q.; Kelly, B.C. Assessing bioaccumulation behaviour of hydrophobic organic contaminants in a tropical urban catchment. J. Hazard. Mater. 2018, 358, 366–375. [Google Scholar] [CrossRef]
  52. EU Commission Regulation (EU) No 1259/2011 of 2 December 2011 Amending Regulation (EC) No 1881/2006 as Regards Maximum Levels for Dioxins, Dioxin-like PCBs and Non Dioxin-like PCBs in Foodstuffs. Available online: https://eur-lex.europa.eu/LexUriServ/LexUriServ.do?uri=OJ:L:2011:320:0018:0023:EN:PDF (accessed on 27 March 2021).
  53. EU Commission Regulation (EC) No 178/2006 of 1 February 2006 Amending Regulation (EC) No 396/2005 of the European Parliament and of the Council to Establish Annex I Listing the Food and Feed Products to Which Maximum Levels for Pesticide Residues Apply. Available online: https://www.eurl-pesticides.eu/userfiles/file/EurlALL/AqcGuiance_SANTE_2019_12682.pdf (accessed on 27 March 2021).
  54. EU Commission Recommendation of 3 March 2014 on the Monitoring of Traces of Brominated Flame Retardants in Food. Available online: https://eur-lex.europa.eu/legal-content/EN/TXT/PDF/?uri=CELEX:32006R0178&from=EN (accessed on 27 March 2021).
  55. EFSA Panel on Contaminants in the Food Chain. Scientific Opinion on Emerging and Novel Brominated Flame Retardants (BFRs) in Food. EFSA J. 2012, 10, 1–133. [Google Scholar] [CrossRef]
  56. Chemical Substances Bureau. 4′-TERT-BUTYL-2′,6′-DIMETHYL-3′,5′-DINITROACETOPHENONE (MUSK KETONE)_Risk Assessment. Available online: https://echa.europa.eu/documents/10162/c870f3b6-a674-4589-9565-c7a771b5fb5d (accessed on 22 April 2021).
  57. Chemical Substances Bureau. 1-(5,6,7,8-TETRAHYDRO-3,5,5,6,8,8-HEXAMETHYL-2-NAPHTHYL)ETHAN-1-ONE (AHTN)-Risk Assessment. Available online: https://echa.europa.eu/documents/10162/a0da6504-8d8c-49af-8614-fe396c556c43 (accessed on 22 April 2021).
  58. Chemical Substances Bureau. 1,3,4,6,7,8-HEXAHYDRO-4,6,6,7,8,8-HEXAMETHYLCYCLOPENTA-γ-2-BENZOPYRAN (1,3,4,6,7,8-HEXAHYDRO-4,6,6,7,8,8-HEXAMETHYLIN-DENO[5,6-C]PYRAN-HHCB)-Risk Assessment. Available online: https://echa.europa.eu/documents/10162/947def3b-bbbf-473b-bc19-3bda7a8da910 (accessed on 22 April 2021).
  59. Jacobs, S.; Sioen, I.; Jacxsens, L.; Domingo, J.L.; Sloth, J.J.; Marques, A.; Verbeke, W. Risk assessment of methylmercury in five European countries considering the national seafood consumption patterns. Food Chem. Toxicol. 2017, 104, 26–34. [Google Scholar] [CrossRef] [PubMed]
  60. Aprova o Regulamento da Pesca por Arte de Arrasto Portaria n.° 1102-E/2000 - Diário da República n.° 270/2000, 2° Suplemento, Série I-B de 2000-11-22. Available online: https://dre.pt/web/guest/legislacao-consolidada/-/lc/106487480/201804160154/exportPdf/maximized/1/cacheLevelPage?rp=indice (accessed on 30 November 2020).
  61. Dong, H.; Tang, H.; Chen, D.; Xu, T.; Li, L. Analysis of 7 synthetic musks in cream by supported liquid extraction and solid phase extraction followed by GC-MS/MS. Talanta 2014, 120, 248–254. [Google Scholar] [CrossRef] [PubMed]
  62. Kuklenyik, Z.; Bryant, X.A.; Needham, L.L.; Calafat, A.M. SPE/SPME-GC/MS approach for measuring musk compounds in serum and breast milk. J. Chromatogr. B Anal. Technol. Biomed. Life Sci. 2007, 858, 177–183. [Google Scholar] [CrossRef] [PubMed]
  63. Fernandes, V.C.; Domingues, V.F.; Mateus, N.; Delerue-Matos, C. Organochlorine pesticide residues in strawberries from integrated pest management and organic farming. J. Agric. Food Chem. 2011, 59, 7582–7591. [Google Scholar] [CrossRef] [PubMed] [Green Version]
  64. Sapozhnikova, Y. High-throughput analytical method for 265 pesticides and environmental contaminants in meats and poultry by fast low pressure gas chromatography and ultrahigh-performance liquid chromatography tandem mass spectrometry. J. Chromatogr. A 2018, 1572, 203–211. [Google Scholar] [CrossRef] [PubMed]
  65. Sapozhnikova, Y.; Lehotay, S.J. Multi-class, multi-residue analysis of pesticides, polychlorinated biphenyls, polycyclic aromatic hydrocarbons, polybrominated diphenyl ethers and novel flame retardants in fish using fast, low-pressure gas chromatography-tandem mass spectrometry. Anal. Chim. Acta 2013, 758, 80–92. [Google Scholar] [CrossRef] [PubMed]
  66. Arnot, J.A.; Gobas, F.A.P.C. A review of bioconcentration factor (BCF) and bioaccumulation factor (BAF) assessments for organic chemicals in aquatic organisms. Environ. Rev. 2006, 14, 257–297. [Google Scholar] [CrossRef]
  67. U.S. EPA. Technical Support Document for Water Quality-based Toxics Control; United States Environmental Protection Agency, Office of Water: Washington, DC, USA, 1991.
Table 1. Levels for the pollutants found in water sampled in the shrimps’ habitat (µg/L) from NW Portuguese coast; ND: not detected.
Concentrations µg/L
OCPsOPPsBFRsPCBsSMs
Location and Date of Samplingα-HCHLindaneδ-HCHAldrinDDEDieldrinDDDDDTChlorpyrifosBDE 28BTBPEPCB 28HHCBAHTNKetone
Vila do Conde
Autumn 2017
NDNDND˂MDLNDNDNDND˂MDLNDNDND˂MDL˂MDL˂MDL
Vila do Conde
Spring 2018
˂MDL˂MDL˂MDLNDNDNDNDNDNDNDND˂MDL˂MDL˂MDL˂MDL
Vila do Conde
Autumn 2018
˂MDL˂MDL˂MDLNDNDNDNDNDNDNDNDND˂MDL˂MDL˂MDL
Vila do Conde
Spring 2019
˂MDLNDNDNDNDNDNDNDNDNDNDND˂MDL˂MDLND
Matosinhos
Autumn 2017
NDNDNDNDNDND˂MDL˂MDLNDNDNDND˂MDL˂MDL˂MDL
Matosinhos
Spring 2018
ND˂ MDLNDNDNDNDNDNDNDNDNDND˂MDL˂MDL˂MDL
Matosinhos
Autumn 2018
˂MDLNDNDNDNDNDNDNDNDNDNDND˂MDL˂MDL˂MDL
Matosinhos
Spring 2019
ND˂MDLNDNDNDNDNDNDNDNDNDND˂MDL˂MDL˂MDL
Aveiro
Spring 2018
ND˂MDLND˂MDLNDNDNDNDNDNDNDND˂MDL˂MDL˂MDL
Aveiro
Autumn 2018
ND0.021NDNDNDNDNDNDNDNDNDND˂MDL˂MDL˂MDL
Aveiro
Spring 2019
ND˂MDL˂MDLNDND˂MDLNDNDNDNDNDND˂MDL˂MDL˂MDL
Ria de Aveiro
Autumn 2017
ND0.014ND˂MDLNDNDNDNDNDNDNDND˂MDL˂MDL˂MDL
Ria de Aveiro
Spring 2018
NDNDNDNDNDNDNDNDNDND0.013ND˂MDL˂MDL˂MDL
Figueira da Foz
Autumn 2017
ND0.014˂MDLNDNDNDNDNDNDNDNDND˂MDL˂MDL˂MDL
Figueira da Foz
Spring 2018
NDND˂MDLNDNDNDNDNDNDNDNDND˂MDL˂MDL˂MDL
Figueira da Foz
Autumn 2018
ND˂MDL˂MDLNDNDNDNDNDNDNDNDND˂MDL˂MDL˂MDL
Figueira da Foz
Spring 2019
NDNDND˂MDL˂MDLNDNDNDND˂MDL NDND˂MDL˂MDL˂MDL
Aquaculture
Autumn 2017
NDNDNDNDNDNDNDND˂MDLNDNDND˂MDL˂MDLND
Aquaculture
Spring 2018
NDND˂MDLNDNDND0.012NDNDNDNDND˂MDL˂MDL˂MDL
Aquaculture
Autumn 2018
NDNDNDNDNDNDNDNDNDNDNDND˂MDLND˂MDL
Aquaculture
Spring 2019
NDNDNDNDNDNDNDNDNDND0.015ND˂MDL˂MDL˂MDL
Sado
Autumn 2017
˂MDL0.023˂MDL˂MDLNDNDNDNDNDNDNDND˂MDL˂MDL˂MDL
Sado
Spring 2018
NDNDNDNDNDNDNDNDNDNDNDND˂MDL˂MDL˂MDL
Sado
Autumn 2018
NDNDNDNDNDNDNDNDNDNDNDND˂MDL˂MDL˂MDL
Sado
Spring 2019
NDNDNDNDNDNDNDNDNDNDNDND˂MDL˂MDL˂MDL
Table 2. Levels for the pollutants found in shrimp samples (ng/g ww) from Portugal.
Concentrations ng/g ww
OCPsPCBsSMs
Location and Date of SamplingDDDPCB 153PCB 180HHCBAHTNKetone
Vila do conde Autumn 20176.09NDND3.34ND3.59
Vila do Conde Spring 2018NDNDND4.76NDND
Vila do Conde Spring 2018_ENDND˂MDL5.26ND5.38
Vila do Conde Autumn 2018NDNDND4.17NDND
Vila do Conde Spring 2019NDNDND4.34˂MDLND
Vila do Conde Spring 2019_ENDNDND3.95NDND
Matosinhos Autumn 2017ND˂MDLND3.49˂MDLND
Matosinhos Spring 2018_ENDND˂MDL4.95ND6.71
Matosinhos Autumn 2018NDNDND5.78NDND
Matosinhos Spring 2019NDNDND5.92˂MDLND
Matosinhos Spring 2019_ENDNDND4.302.64ND
Aveiro Spring 2018NDND˂MDL5.38˂MDL5.49
Aveiro Autumn 2018NDNDND3.64NDND
Aveiro Spring 2019NDNDND3.16˂MDL4.62
Ria de Aveiro Atumn 2017NDNDND4.74NDND
Ria de Aveiro Spring 2018NDNDND7.552.972.15
Figueira da Foz Autumn 2017NDNDND3.76˂MDL4.52
Figueira da Foz Spring 2018NDNDND4.75NDND
Figueira da Foz Autum 2018NDNDND5.30ND3.30
Figueira da Foz Spring 2019NDNDND4.18ND3.96
Aquaculture Autumn 2017NDNDND4.02ND7.41
Aquaculture Spring 2018NDNDND6.02ND4.26
Aquaculture Autumn 2018NDNDND4.46˂MDL3.96
Aquaculture Spring 2019_SNDNDND3.79˂MDL4.95
Sado Autumn 2017NDNDND3.17˂MDLND
Sado Spring 2018NDNDND6.342.9711.06
Sado Autumn 2018_SNDND˂MDL3.85NDND
Sado Spring 2019_SND˂MDL˂MDL3.58˂MDLND
ND: not detected; E: eggs; S: shell.
Table 3. Bioaccumulation factors (BAFs) for the SMs found in shrimps (L/kg ww).
Location and Date of SamplingHHCBAHTNKetone
Vila do conde Autumn 2017249.4 305.2
Vila do Conde Spring 2018355.7
Vila do Conde Autumn 2018312.0
Vila do Conde Spring 2019324.1254.2
Matosinhos Autumn 2017260.9254.2
Matosinhos Spring 2018369.9 570.6
Matosinhos Autumn 2018432.4
Matosinhos Spring 2019442.8254.2
Aveiro Spring 2018402.3254.2467.3
Aveiro Autumn 2018272.5
Aveiro Spring 2019236.0254.2392.6
Ria de Aveiro Autumn 2017354.6
Ria de Aveiro Spring 2018564.5346.3183.2
Figueira da Foz Autumn 2017281.4254.2384.7
Figueira da Foz Spring 2018354.9
Figueira da Foz Autumn 2018396.4 280.3
Figueira da Foz Spring 2019312.7 336.7
Aquaculture Autumn 2017300.6
Aquaculture Spring 2018450.3 362.1
Aquaculture Autumn 2018333.7 336.4
Aquaculture Spring 2019283.4254.2421.3
Sado Autumn 2017237.1254.2
Sado Spring 2018474.1345.6940.7
Sado Autumn 2018288.0
Sado Spring 2019267.7254.2
Table 4. NOAEL values and the estimated exposure to detected SMs from shrimp consumption among the Portuguese population.
NOAELTDI CalculatedMedian ExposureP25 ExposureP75 Exposure
SMsmg/kg bw/dayµg/kg bw/dayµg/kg bw/dayµg/kg bw/dayµg/kg bw/day
HHCB505001.741.522.13
AHTN5501.191.061.20
Ketone2.5251.841.552.33
Publisher’s Note: MDPI stays neutral with regard to jurisdictional claims in published maps and institutional affiliations.

