
A Validated Ultrasound-Assisted Extraction Coupled with SPE-HPLC-DAD for the Determination of Flavonoids in By-Products of Plant Origin: An Application Study for the Valorization of the Walnut Septum Membrane


Abstract
:1. Introduction
2. Results and Discussion
2.1. Method Development and Validation
2.2. Walnut Septum Analysis
2.3. Quantitative Analysis of Flavonoids
2.3.1. Catechin
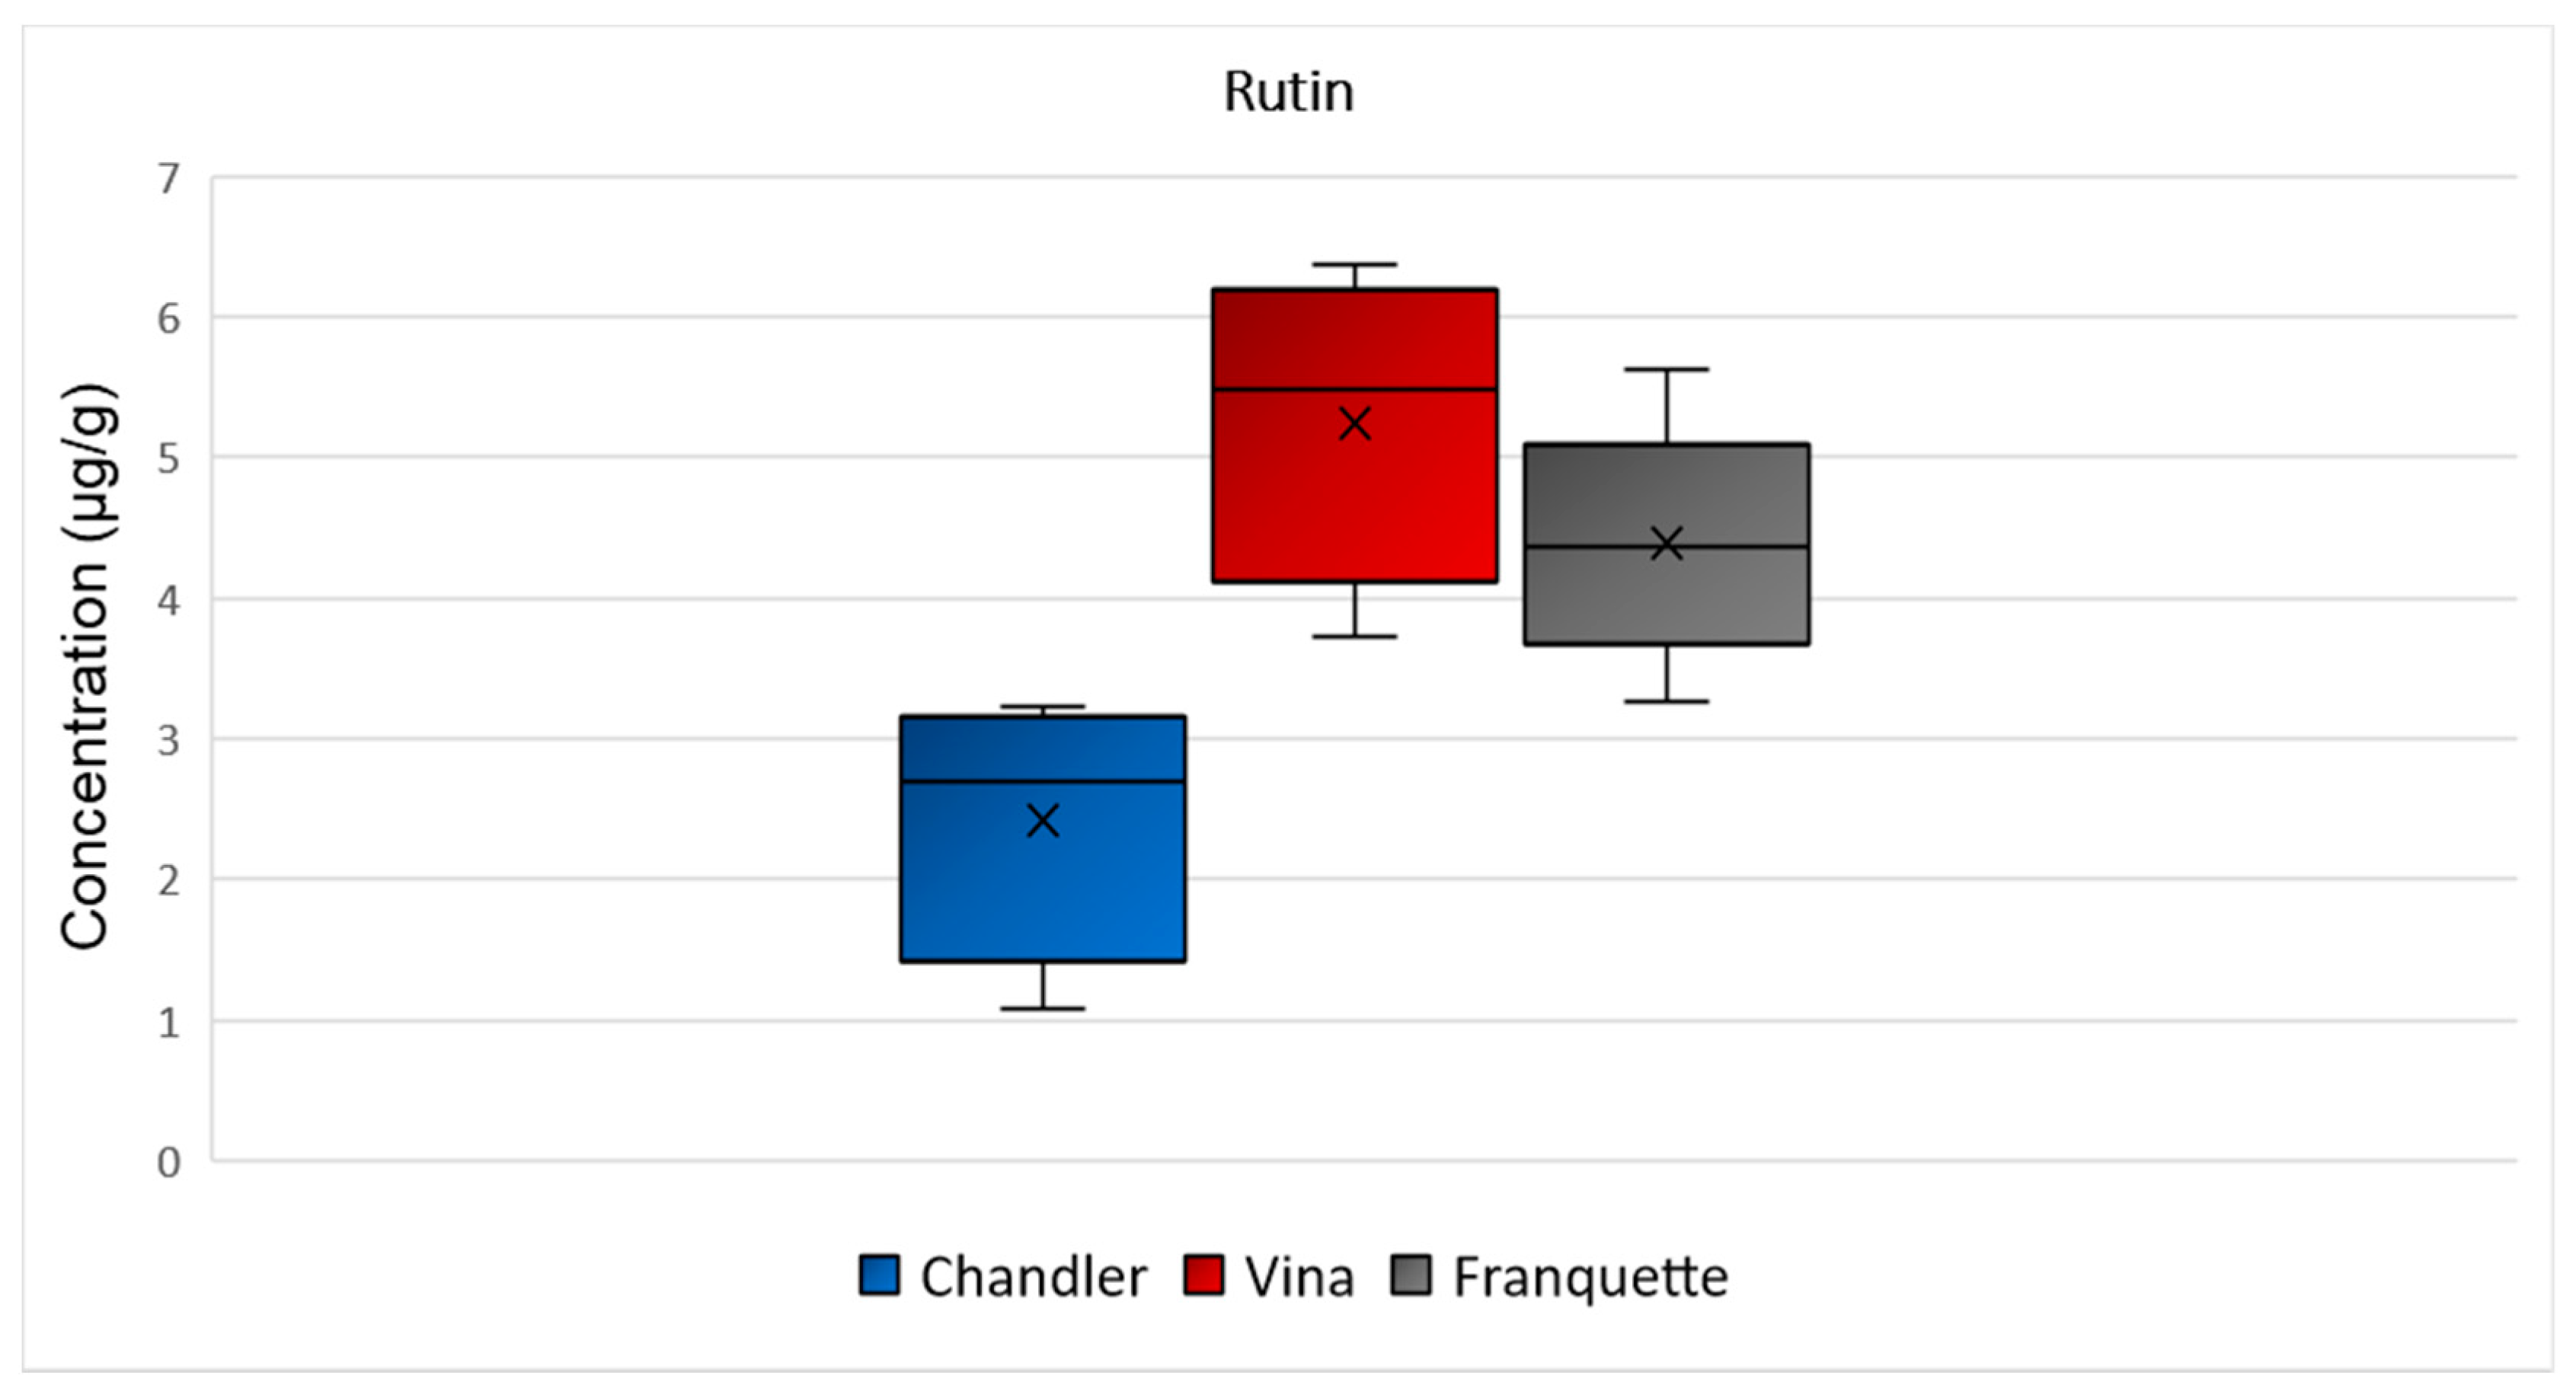
2.3.2. Rutin
2.3.3. Myricetin
2.3.4. Luteolin
2.3.5. Quercetin
2.3.6. Apigenin
2.3.7. Kaempferol
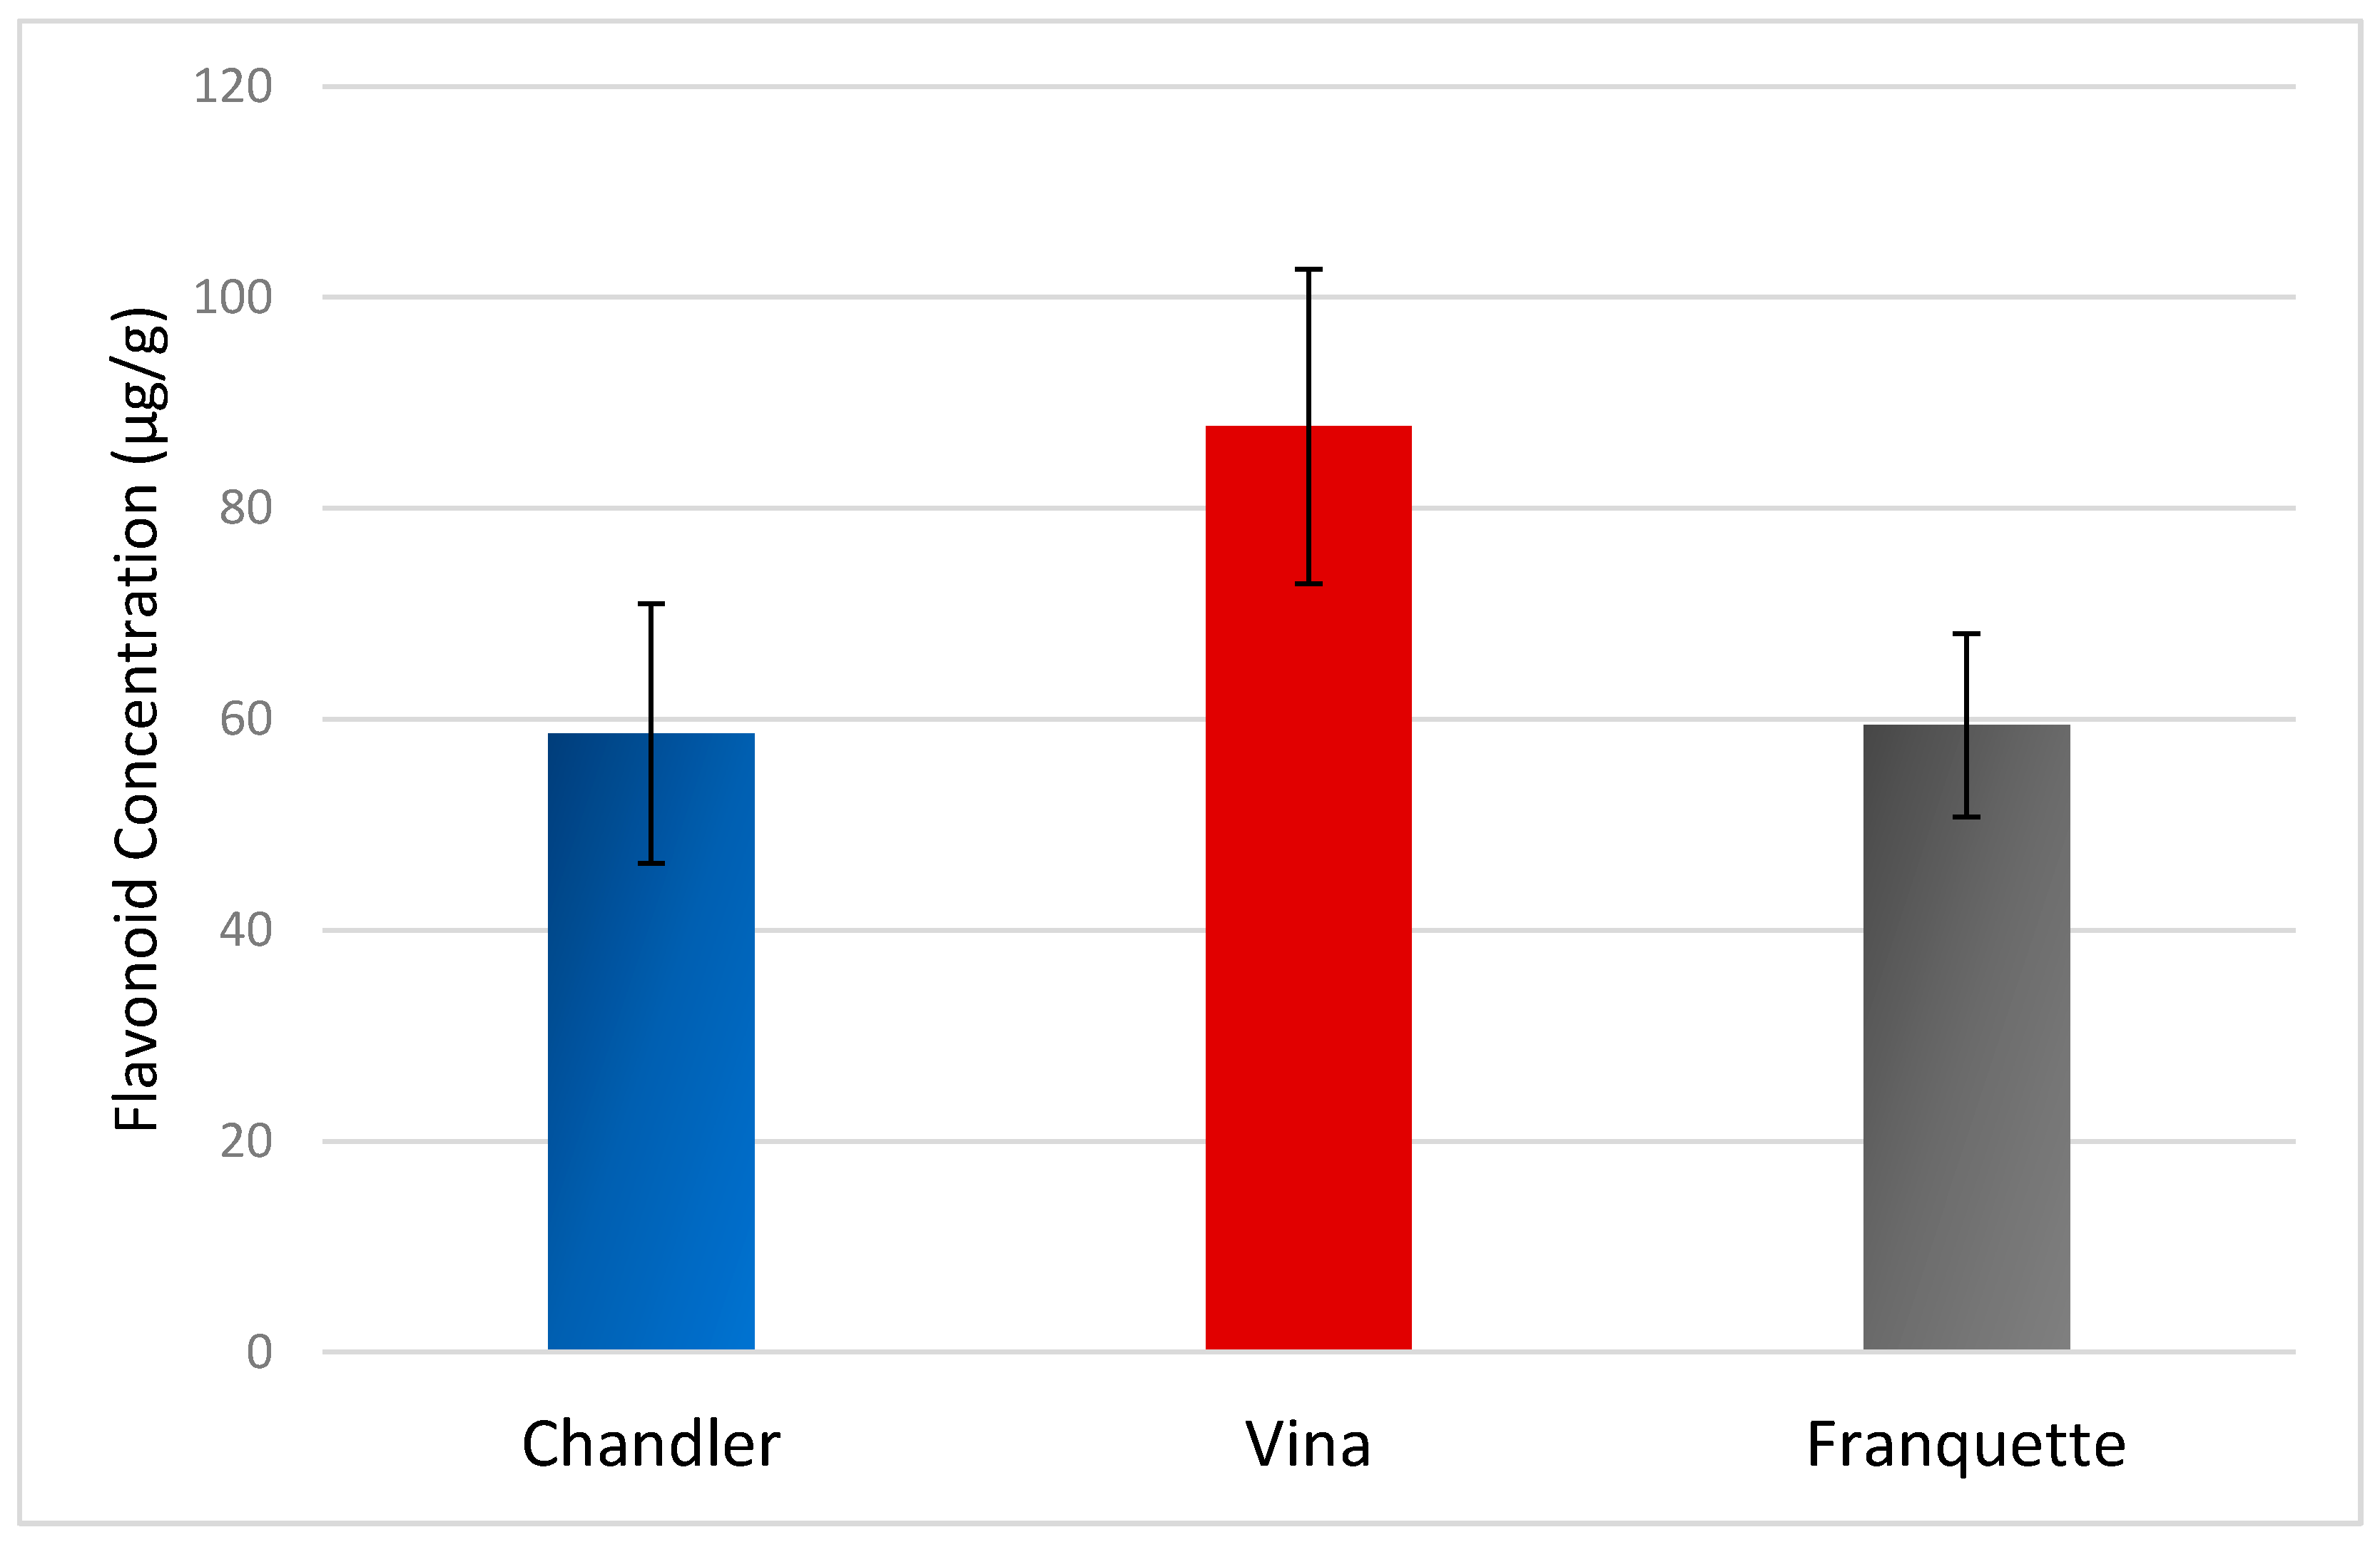
2.4. Effect of the Variety on the Phenolic Content
3. Materials and Methods
3.1. Chemicals and Reagents
3.2. Instrumentation
3.3. Chromatographic Separation and Analysis
3.4. Sample Collection
3.5. Sample Preparation
3.6. Method validation and Quantification
3.7. Chemometric Analysis
4. Conclusions
Supplementary Materials
Author Contributions
Funding
Acknowledgments
Conflicts of Interest
Sample Availability
References
- Kaderides, K.; Kyriakoudi, A.; Mourtzinos, I.; Goula, A.M. Potential of pomegranate peel extract as a natural additive in foods. Trends Food Sci. Technol. 2021, 115, 380–390. [Google Scholar] [CrossRef]
- Martínez, M.L.; Mattea, M.A.; Maestri, D.M. Varietal and crop year effects on lipid composition of walnut (Juglans regia) genotypes. JAOCS, J. Am. Oil Chem. Soc. 2006, 83, 791–796. [Google Scholar] [CrossRef]
- Abdallah, I.B.; Tlili, N.; Martinez-Force, E.; Rubio, A.G.P.; Perez-Camino, M.C.; Albouchi, A.; Boukhchina, S. Content of carotenoids, tocopherols, sterols, triterpenic and aliphatic alcohols, and volatile compounds in six walnuts (Juglans regia L.) varieties. Food Chem. 2015, 173, 972–978. [Google Scholar] [CrossRef] [Green Version]
- Kalogiouri, N.P.; Manousi, N.; Rosenberg, E.; Zachariadis, G.A.; Samanidou, V.F. Advances in the Chromatographic Separation and Determination of Bioactive Compounds for Assessing the Nutrient Profile of Nuts. Curr. Anal. Chem. 2020, 16, 1–17. [Google Scholar]
- Medic, A.; Jakopic, J.; Hudina, M.; Solar, A.; Veberic, R. Identification and quantification of the major phenolic constituents in Juglans regia L. peeled kernels and pellicles, using HPLC–MS/MS. Food Chem. 2021, 352, 129404. [Google Scholar] [CrossRef] [PubMed]
- Slatnar, A.; Mikulic-Petkovsek, M.; Stampar, F.; Veberic, R.; Solar, A. Identification and quantification of phenolic compounds in kernels, oil and bagasse pellets of common walnut (Juglans regia L.). Food Res. Int. 2015, 67, 255–263. [Google Scholar] [CrossRef]
- Pereira, J.A.; Oliveira, I.; Sousa, A.; Ferreira, I.C.F.R.; Bento, A.; Estevinho, L. Bioactive properties and chemical composition of six walnut (Juglans regia L.) cultivars. Food Chem. Toxicol. 2008, 46, 2103–2111. [Google Scholar] [CrossRef] [PubMed]
- Medic, A.; Jakopic, J.; Solar, A.; Hudina, M.; Veberic, R. Walnut (J. regia) agro-residues as a rich source of phenolic compounds. Biology (Basel). 2021, 10, 1–24. [Google Scholar]
- Pereira, J.A.; Oliveira, I.; Sousa, A.; Valentão, P.; Andrade, P.B.; Ferreira, I.C.F.R.; Ferreres, F.; Bento, A.; Seabra, R.; Estevinho, L. Walnut (Juglans regia L.) leaves: Phenolic compounds, antibacterial activity and antioxidant potential of different cultivars. Food Chem. Toxicol. 2007, 45, 2287–2295. [Google Scholar] [CrossRef]
- Liu, P.; Li, L.; Song, L.; Sun, X.; Yan, S.; Huang, W. Characterisation of phenolics in fruit septum of Juglans regia Linn. by ultra performance liquid chromatography coupled with Orbitrap mass spectrometer. Food Chem. 2019, 286, 669–677. [Google Scholar] [CrossRef]
- Fizeșan, I.; Rusu, M.E.; Georgiu, C.; Pop, A.; Ștefan, M.G.; Muntean, D.M.; Mirel, S.; Vostinaru, O.; Kiss, B.; Popa, D.S. Antitussive, antioxidant, and anti-inflammatory effects of a walnut (Juglans regia L.) septum extract rich in bioactive compounds. Antioxidants 2021, 10, 119. [Google Scholar] [CrossRef] [PubMed]
- Meng, Q.; Wang, Y.; Chen, F.; Xiao, T.; Zhang, L. Polysaccharides from Diaphragma juglandis fructus: Extraction optimization, antitumor, and immune-enhancement effects. Int. J. Biol. Macromol. 2018, 115, 835–845. [Google Scholar] [CrossRef] [PubMed]
- Scarano, A.; Chieppa, M.; Santino, A. Looking at flavonoid biodiversity in horticultural crops: A colored mine with nutritional benefits. Plants 2018, 7, 98. [Google Scholar] [CrossRef] [PubMed] [Green Version]
- Alara, O.R.; Abdurahman, N.H.; Ukaegbu, C.I. Soxhlet extraction of phenolic compounds from Vernonia cinerea leaves and its antioxidant activity. J. Appl. Res. Med. Aromat. Plants 2018, 11, 12–17. [Google Scholar] [CrossRef]
- de Albuquerque Mendes, M.K.; dos Santos Oliveira, C.B.; Veras, M.D.A.; Araujo, B.Q.; Dantas, C.; Chaves, M.H.; Júnior, C.A.L.; Vieira, E.C. Application of multivariate optimization for the selective extraction of phenolic compounds in cashew nuts (Anacardium occidentale L.). Talanta 2019, 205, 120100. [Google Scholar] [CrossRef]
- Manousi, N.; Raber, G.; Papadoyannis, I. Recent Advances in Microextraction Techniques of Antipsychotics in Biological Fluids Prior to Liquid Chromatography Analysis. Separations 2017, 4, 18. [Google Scholar] [CrossRef] [Green Version]
- Bodoira, R.; Maestri, D. Phenolic Compounds from Nuts: Extraction, Chemical Profiles, and Bioactivity. J. Agric. Food Chem. 2020, 68, 927–942. [Google Scholar] [CrossRef] [PubMed]
- Kalogiouri, N.P.; Samanidou, V.F. HPLC Fingerprints for the Characterization of Walnuts and the Detection of Fraudulent Incidents. Foods 2021, 10, 2145. [Google Scholar] [CrossRef]
- Motilva, M.J.; Serra, A.; Macià, A. Analysis of food polyphenols by ultra high-performance liquid chromatography coupled to mass spectrometry: An overview. J. Chromatogr. A 2013, 1292, 66–82. [Google Scholar] [CrossRef]
- Delgado-Zamarreño, M.M.; Fernández-Prieto, C.; Bustamante-Rangel, M.; Pérez-Martín, L. Determination of tocopherols and sitosterols in seeds and nuts by QuEChERS-liquid chromatography. Food Chem. 2016, 192, 825–830. [Google Scholar] [CrossRef] [PubMed]
- Bolling, B.W.; Chen, C.Y.O.; McKay, D.L.; Blumberg, J.B. Tree nut phytochemicals: Composition, antioxidant capacity, bioactivity, impact factors. A systematic review of almonds, Brazils, cashews, hazelnuts, macadamias, pecans, pine nuts, pistachios and walnuts. Nutr. Res. Rev. 2011, 24, 244–275. [Google Scholar] [CrossRef] [PubMed] [Green Version]
- Pyrzynska, K.; Sentkowska, A. Recent Developments in the HPLC Separation of Phenolic Food Compounds. Crit. Rev. Anal. Chem. 2015, 45, 41–51. [Google Scholar] [CrossRef]
- Ghisoni, S.; Lucini, L.; Rocchetti, G.; Chiodelli, G.; Farinelli, D.; Tombesi, S.; Trevisan, M. Untargeted metabolomics with multivariate analysis to discriminate hazelnut (Corylus avellana L.) cultivars and their geographical origin. J. Sci. Food Agric. 2020, 100, 500–508. [Google Scholar] [CrossRef] [PubMed]
- Bahadori, M.B.; Zengin, G.; Dinparast, L.; Eskandani, M. The health benefits of three Hedgenettle herbal teas (Stachys byzantina, Stachys inflata, and Stachys lavandulifolia) - profiling phenolic and antioxidant activities. Eur. J. Integr. Med. 2020, 36, 101134. [Google Scholar] [CrossRef]
- Fusi, F.; Trezza, A.; Tramaglino, M.; Sgaragli, G.; Saponara, S.; Spiga, O. The beneficial health effects of flavonoids on the cardiovascular system: Focus on K+ channels. Pharmacol. Res. 2020, 152, 104625. [Google Scholar] [CrossRef]
- Kritikou, E.; Kalogiouri, N.P.; Kolyvira, L.; Thomaidis, N.S. Target and Suspect HRMS Metabolomics for the Determination of Functional Ingredients in 13 Varieties of Olive Leaves and Drupes from Greece. Molecules 2020, 25, 4889. [Google Scholar] [CrossRef] [PubMed]
- Babou, L.; Hadidi, L.; Grosso, C.; Zaidi, F.; Valentão, P.; Andrade, P.B. Study of phenolic composition and antioxidant activity of myrtle leaves and fruits as a function of maturation. Eur. Food Res. Technol. 2016, 242, 1447–1457. [Google Scholar] [CrossRef]
- Zheng, J.; Lu, B.; Xu, B. An update on the health benefits promoted by edible flowers and involved mechanisms. Food Chem. 2021, 340, 127940. [Google Scholar] [CrossRef]
- Alañón, M.E.; Pérez-Coello, M.S.; Marina, M.L. Wine science in the metabolomics era. TrAC - Trends Anal. Chem. 2015, 74, 1–20. [Google Scholar] [CrossRef]
- Kalogiouri, N.P.; Samanidou, V.F. Liquid chromatographic methods coupled to chemometrics: A short review to present the key workflow for the investigation of wine phenolic composition as it is affected by environmental factors. Environ. Sci. Pollut. Res. 2020. [Google Scholar] [CrossRef]
- Arceusz, A.; Wesolowski, M.; Ulewicz-Magulska, B. Flavonoids and Phenolic Acids in Methanolic Extracts, Infusions and Tinctures from Commercial Samples of Lemon Balm. Nat. Prod. Commun. 2015, 10, 8–12. [Google Scholar] [CrossRef] [Green Version]
- Martínez-Poveda, B.; Torres-Vargas, J.A.; Ocaña, M.D.C.; García-Caballero, M.; Medina, M.Á.; Quesada, A.R. The mediterranean diet, a rich source of angiopreventive compounds in cancer. Nutrients 2019, 11, 2036. [Google Scholar] [CrossRef] [PubMed] [Green Version]
- Jegal, K.H.; Kim, E.O.; Kim, J.K.; Park, S.M.; Jung, D.H.; Lee, G.H.; Ki, S.H.; Byun, S.H.; Ku, S.K.; Cho, I.J.; et al. Luteolin prevents liver from tunicamycin-induced endoplasmic reticulum stress via nuclear factor erythroid 2-related factor 2-dependent sestrin 2 induction. Toxicol. Appl. Pharmacol. 2020, 399, 115036. [Google Scholar] [CrossRef]
- Tamkutė, L.; Gil, B.M.; Carballido, J.R.; Pukalskienė, M.; Venskutonis, P.R. Effect of cranberry pomace extracts isolated by pressurized ethanol and water on the inhibition of food pathogenic/spoilage bacteria and the quality of pork products. Food Res. Int. 2019, 120, 38–51. [Google Scholar] [CrossRef]
- Nour, V.; Trandafir, I.; Cosmulescu, S. Bioactive compounds, antioxidant activity and nutritional quality of different culinary aromatic herbs. Not. Bot. Horti Agrobot. Cluj-Napoca 2017, 45, 179–184. [Google Scholar] [CrossRef] [Green Version]
- Srivastava, J.K.; Shankar, E.; Gupta, S. Chamomile: A herbal medicine of the past with a bright future (review). Mol. Med. Rep. 2010, 3, 895–901. [Google Scholar]
- Dormán, G.; Flachner, B.; Hajdú, I.; András, C.D. Target identification and polypharmacology of nutraceuticals. Nutraceuticals Effic. Saf. Toxic. 2016, 263–286. [Google Scholar]
- Esteki, M.; Farajmand, B.; Amanifar, S.; Barkhordari, R.; Ahadiyan, Z.; Dashtaki, E.; Mohammadlou, M.; Vander Heyden, Y. Classification and authentication of Iranian walnuts according to their geographical origin based on gas chromatographic fatty acid fingerprint analysis using pattern recognition methods. Chemom. Intell. Lab. Syst. 2017, 171, 251–258. [Google Scholar] [CrossRef]
- Vu, D.C.; Vo, P.H.; Coggeshall, M.V.; Lin, C.H. Identification and Characterization of Phenolic Compounds in Black Walnut Kernels. J. Agric. Food Chem. 2018, 66, 4503–4511. [Google Scholar] [CrossRef]
- Jaćimović, V.; Adakalić, M.; Ercisli, S.; Božović, D.; Bujdoso, G. Fruit quality properties of walnut (Juglans regia l.) genetic resources in Montenegro. Sustain. 2020, 12, 1–19. [Google Scholar]
- Bajkacz, S.; Baranowska, I.; Buszewski, B.; Kowalski, B.; Ligor, M. Determination of Flavonoids and Phenolic Acids in Plant Materials Using SLE-SPE-UHPLC-MS/MS Method. Food Anal. Methods 2018, 11, 3563–3575. [Google Scholar] [CrossRef] [Green Version]
- Zakeri-Milani, P.; Islambulchilar, Z.; Majidpour, F.; Jannatabadi, E.; Lotfpour, F.; Valizadeh, H. A study on enhanced intestinal permeability of clarithromycin nanoparticles. Brazilian J. Pharm. Sci. 2014, 50, 121–129. [Google Scholar] [CrossRef] [Green Version]
- Pang, Z.; Chong, J.; Zhou, G.; de Lima Morais, D.A.; Chang, L.; Barrette, M.; Gauthier, C.; Jacques, P.-É.; Li, S.; Xia, J. MetaboAnalyst 5.0: Narrowing the gap between raw spectra and functional insights. Nucleic Acids Res. 2021, 49, 388–396. [Google Scholar] [CrossRef]


| Compound | Calibration Equation y = (a ± Sa) + (b ± Sb)x (Linear Range: 1–10 μg/g) | r2 | Fcalc | Ftab | LOD (μg/g) | LOQ (μg/g) |
|---|---|---|---|---|---|---|
| catechin | y = (1095 ± 1115) + (11808 ± 305)x | 0.997 | 7.9 × 10⁻⁹ | 0.2334 | 0.31 | 0.94 |
| rutin | y = (389 ± 1200) + (19857± 204)x | 0.995 | 1.9 × 10⁻⁹ | 0.2334 | 0.20 | 0.60 |
| myricetin | y = (989 ± 1450) + (20005 ± 424)x | 0.993 | 5.6 × 10⁻⁹ | 0.2334 | 0.24 | 0.72 |
| luteolin | y = (1017 ± 1608) + (17008 ± 440)x | 0.995 | 2.9 × 10⁻⁹ | 0.2334 | 0.20 | 0.60 |
| quercetin | y = (−1032 ± 1128) + (18404 ± 153)x | 0.993 | 6.5 × 10⁻⁹ | 0.2334 | 0.20 | 0.60 |
| apigenin | y = (1732 ± 152) + (1745 ± 665)x | 0.994 | 4.6 × 10⁻⁷ | 0.2334 | 0.29 | 0.87 |
| kaempferol | y = (1710 ± 54.3) + (19045 ± 685)x | 0.996 | 1.7 × 10⁻⁹ | 0.2334 | 0.29 | 0.90 |
| Compound | %R Low Conc. Level (1 μg/g) | %RSD | %R Medium Conc. Level (5 μg/g) | %RSD | %R Maximum Conc. Level (10 μg/g) | %RSD |
|---|---|---|---|---|---|---|
| catechin | 97.1 | 5.3 | 96.4 | 6.2 | 97.5 | 5.3 |
| rutin | 93.5 | 5.1 | 92.5 | 4.5 | 98.4 | 2.5 |
| myricetin | 91.8 | 4.3 | 94.4 | 5.2 | 91.2 | 1.7 |
| luteolin | 94.2 | 3.8 | 95.6 | 4.6 | 93.6 | 3.9 |
| quercetin | 93.6 | 3.4 | 98.8 | 4.2 | 94.1 | 4.2 |
| apigenin | 94.4 | 5.4 | 91.7 | 6.1 | 90.8 | 5.1 |
| kaempferol | 92.1 | 2.8 | 93.5 | 3.2 | 93.5 | 2.9 |
| Compound | %R Low Conc. Level (1 μg/g) | %RSD | %R Medium Conc. Level (5 μg/g) | %RSD | %R Maximum Conc. Level (10 μg/g) | %RSD |
|---|---|---|---|---|---|---|
| catechin | 95.1 | 5.2 | 96.2 | 4.8 | 92.1 | 6.4 |
| rutin | 93.5 | 7.1 | 95.7 | 5.9 | 95.2 | 5.2 |
| myricetin | 88.5 | 6.2 | 93.4 | 6.5 | 94.4 | 6.1 |
| luteolin | 91.8 | 5.8 | 89.2 | 7.5 | 93.5 | 8.5 |
| quercetin | 94.5 | 7.8 | 90.3 | 8.1 | 92.3 | 6.9 |
| apigenin | 93.7 | 6.3 | 91.1 | 7.4 | 94.2 | 5.4 |
| kaempferol | 95.5 | 5.8 | 88.9 | 6.6 | 95.4 | 7.3 |
| Compound | Chemical Structure | Rt | λ (nm) |
|---|---|---|---|
| catechin |  | 5.8 | 278 |
| rutin |  | 10.1 | 353 |
| myricetin |  | 16.5 | 370 |
| luteolin |  | 21.1 | 356 |
| quercetin |  | 22.7 | 378 |
| apigenin |  | 24.5 | 360 |
| kaempferol |  | 26.1 | 360 |
| Variety | Chandler | Vina | Franquette | |||
|---|---|---|---|---|---|---|
| Compound | Concentration Range (μg/g) | Mean Value (μg/g ± SD) | Concentration Range (μg/g) | Mean Value (μg/g ± SD) | Concentration Range (μg/g) | Mean Value (μg/g ± SD) |
| catechin | 30–33 | 32 ± 5 | 41–53 | 47 ± 3 | 25–37 | 31 ± 1 |
| rutin | 1–3 | 2.4 ± 0.2 | 3–6 | 5 ± 2 | 3–6 | 4 ± 2 |
| myricetin | 1–6 | 3.8 ± 0.8 | 3–11 | 8 ± 2 | 5–9 | 7 ± 2 |
| luteolin | 1–4 | 2.6 ± 0.2 | 2–5 | 3.4 ± 0.9 | 1–3 | 2.4 ± 0.3 |
| quercetin | 5–14 | 9 ± 1 | 9–16 | 12 ± 4 | 4–8 | 6 ± 2 |
| apigenin | 1–6 | 4 ± 1 | 4–9 | 6 ± 2 | 2–10 | 5.5 ± 0.7 |
| kaempferol | 2–9 | 5 ± 3 | 2–8 | 6 ± 1 | 2–5 | 3.7 ± 0.9 |
Publisher’s Note: MDPI stays neutral with regard to jurisdictional claims in published maps and institutional affiliations. |
© 2021 by the authors. Licensee MDPI, Basel, Switzerland. This article is an open access article distributed under the terms and conditions of the Creative Commons Attribution (CC BY) license (https://creativecommons.org/licenses/by/4.0/).
Share and Cite
Kalogiouri, N.P.; Samanidou, V.F. A Validated Ultrasound-Assisted Extraction Coupled with SPE-HPLC-DAD for the Determination of Flavonoids in By-Products of Plant Origin: An Application Study for the Valorization of the Walnut Septum Membrane. Molecules 2021, 26, 6418. https://0-doi-org.brum.beds.ac.uk/10.3390/molecules26216418
Kalogiouri NP, Samanidou VF. A Validated Ultrasound-Assisted Extraction Coupled with SPE-HPLC-DAD for the Determination of Flavonoids in By-Products of Plant Origin: An Application Study for the Valorization of the Walnut Septum Membrane. Molecules. 2021; 26(21):6418. https://0-doi-org.brum.beds.ac.uk/10.3390/molecules26216418
Chicago/Turabian StyleKalogiouri, Natasa P., and Victoria F. Samanidou. 2021. "A Validated Ultrasound-Assisted Extraction Coupled with SPE-HPLC-DAD for the Determination of Flavonoids in By-Products of Plant Origin: An Application Study for the Valorization of the Walnut Septum Membrane" Molecules 26, no. 21: 6418. https://0-doi-org.brum.beds.ac.uk/10.3390/molecules26216418