
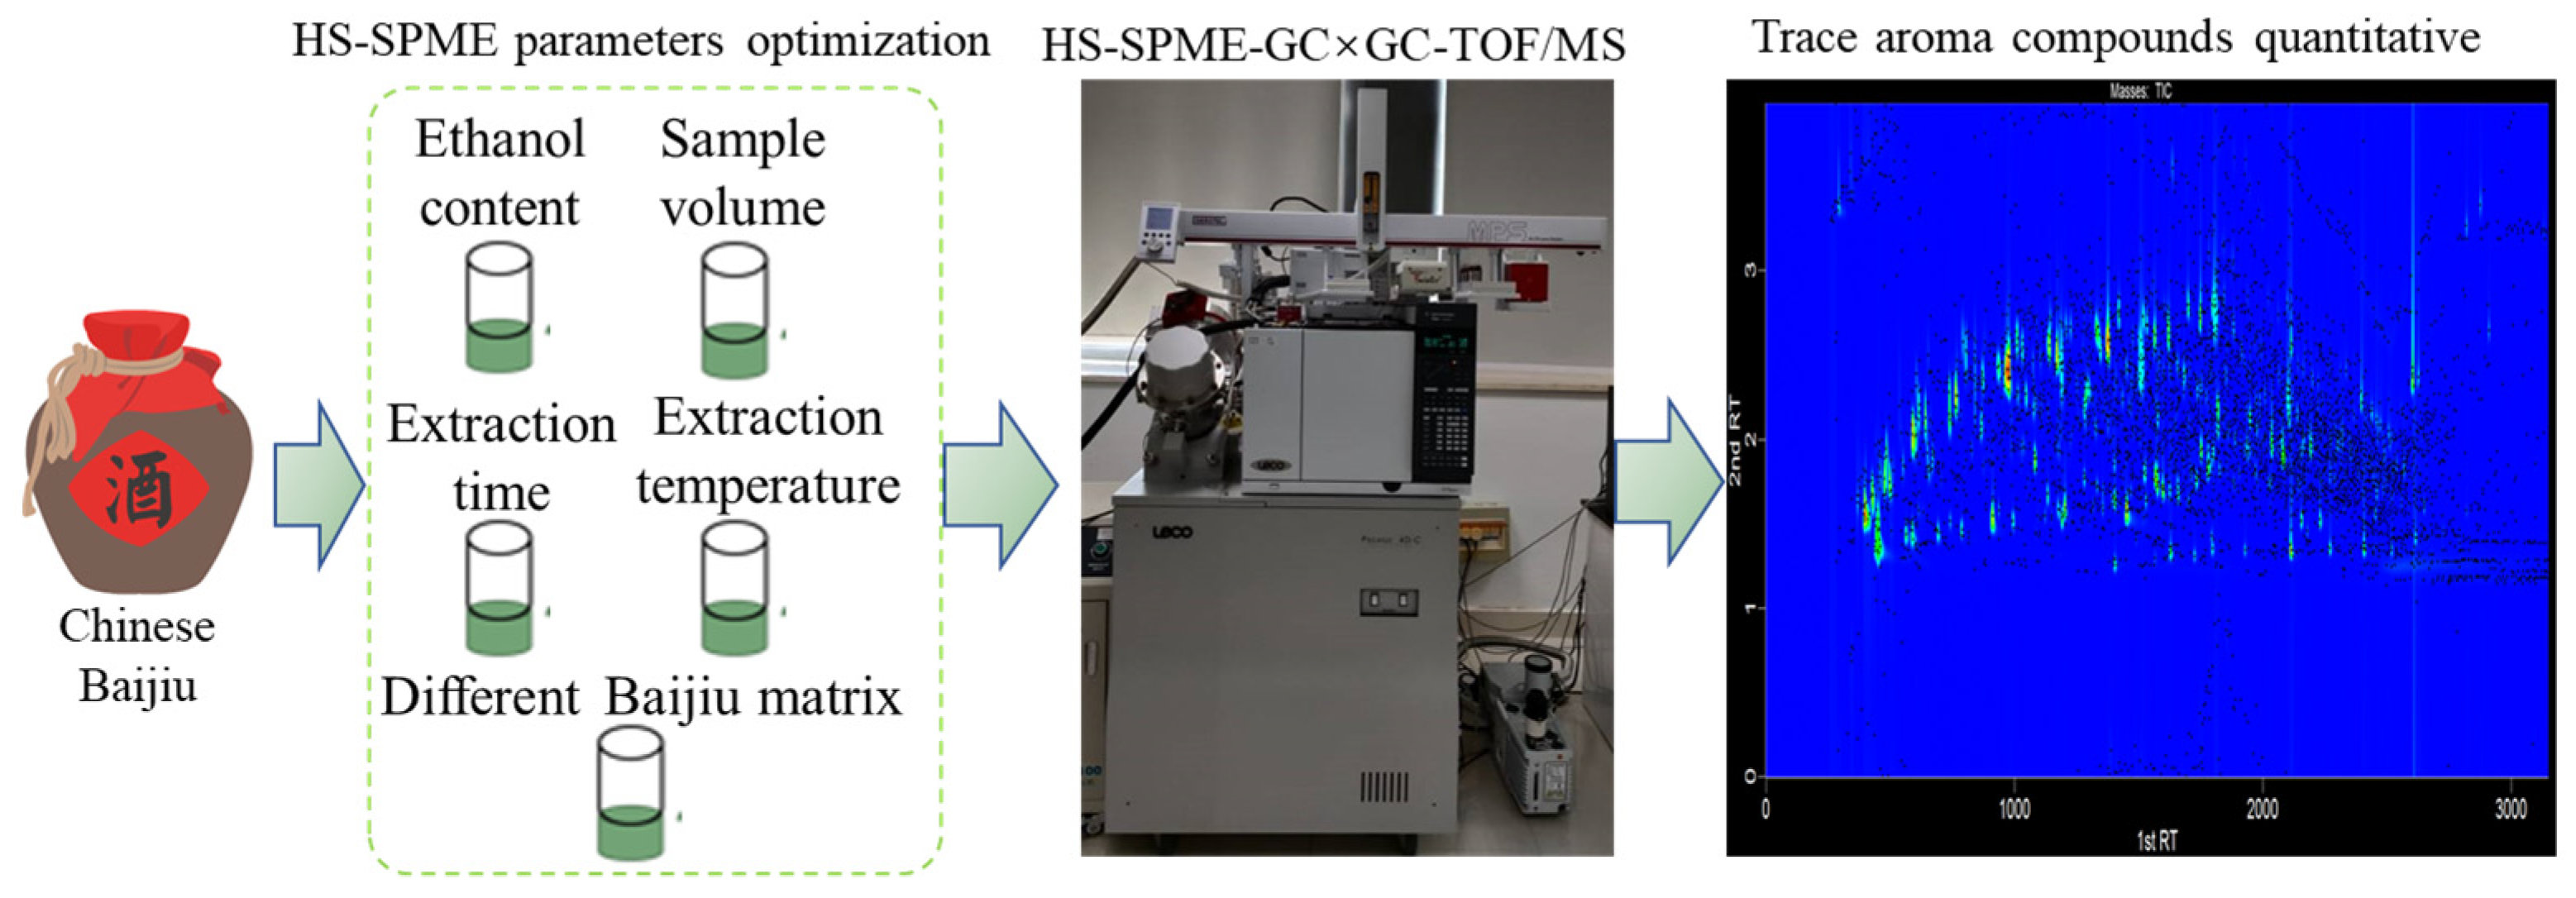
Optimization and Validation of a Headspace Solid-Phase Microextraction with Comprehensive Two-Dimensional Gas Chromatography Time-of-Flight Mass Spectrometric Detection for Quantification of Trace Aroma Compounds in Chinese Liquor (Baijiu)


Abstract
:1. Introduction
2. Materials and Methods
2.1. Chemicals and Reagents
2.2. Samples
2.2.1. Baijiu Samples
2.2.2. Model Synthetic Solution
2.3. Optimization of HS-SPME Parameters
2.4. GC×GC-TOFMS Conditions
2.5. Processing and Analysis of Chromatographic Data
2.6. Method Validation
2.6.1. Calibration and Detection Limits
2.6.2. Precision and Accuracy
3. Results and Discussion
3.1. Optimization of the HS-SPME Methods
3.1.1. Effect of Sample Dilution
3.1.2. Effect of Sample Volume
3.1.3. Effect of Extraction Temperature and Time
3.2. Assessment of the Matrix Effects
3.3. Method Validation
3.4. Analysis of Baijiu Samples
4. Conclusions
Author Contributions
Funding
Institutional Review Board Statement
Informed Consent Statement
Data Availability Statement
Conflicts of Interest
Sample Availability
References
- Guallar-Castillon, P.; Rodriguez-Artalejo, F.; Ganan, L.D.; Banegas, J.R.B.; Urdinguio, P.L.; Cabrera, R.H. Consumption of alcoholic beverages and subjective health in Spain. J. Epidemiol. Community Health 2001, 55, 648–652. [Google Scholar] [CrossRef] [PubMed] [Green Version]
- Franitza, L.; Granvogl, M.; Schieberle, P. Characterization of the key aroma compounds in two commercial rums by means of the sensomics approach. J. Agric. Food Chem. 2016, 64, 637–645. [Google Scholar] [CrossRef]
- Gonzalez-Robles, I.W.; Cook, D.J. The impact of maturation on concentrations of key odour active compounds which determine the aroma of tequila. J. Inst. Brew. 2016, 122, 369–380. [Google Scholar] [CrossRef] [Green Version]
- Poisson, L.; Schieberle, P. Characterization of the most odor-active compounds in an American Bourbon whisky by application of the aroma extract dilution analysis. J. Agric. Food Chem. 2008, 56, 5813–5819. [Google Scholar] [CrossRef] [PubMed]
- Jia, W.; Fan, Z.; Du, A.; Li, Y.; Zhang, R.; Shi, Q.; Chu, X. Recent advances in Baijiu analysis by chromatography based technology-A review. Food Chem. 2020, 324, 126899. [Google Scholar] [CrossRef] [PubMed]
- Plutowska, B.; Wardencki, W. Application of gas chromatography-olfactometry (GC-O) in analysis and quality assessment of alcoholic beverages—A review. Food Chem. 2008, 107, 449–463. [Google Scholar] [CrossRef]
- Wisniewska, P.; Sliwinska, M.; Dymerski, T.; Wardencki, W.; Namiesnik, J. Application of gas chromatography to analysis of spirit-based alcoholic beverages. Crit. Rev. Anal. Chem. 2015, 45, 201–225. [Google Scholar] [CrossRef] [PubMed]
- Chambers, E.; Koppel, K. Associations of volatile compounds with sensory aroma and flavor: The complex nature of flavor. Molecules 2013, 18, 4887–4905. [Google Scholar] [CrossRef]
- Li, H.; Qin, D.; Wu, Z.; Sun, B.; Sun, X.; Huang, M.; Zheng, F. Characterization of key aroma compounds in Chinese Guojing sesame-flavor Baijiu by means of molecular sensory science. Food Chem. 2019, 284, 100–107. [Google Scholar] [CrossRef]
- Chen, S.; Sha, S.; Qian, M.; Xu, Y. Characterization of volatile sulfur compounds in Moutai liquors by headspace solid-phase microextraction gas chromatography-pulsed flame photometric detection and odor activity value. J. Food Sci. 2017, 82, 2816–2822. [Google Scholar] [CrossRef]
- Tranchida, P.Q.; Franchina, F.A.; Dugo, P.; Mondello, L. Comprehensive two-dimensional gas chromatography-mass spectrometry: Recent evolution and current trends. Mass Spectrom. Rev. 2016, 35, 524–534. [Google Scholar] [CrossRef]
- Welke, J.E.; Zanus, M.; Lazzarotto, M.; Zini, C.A. Quantitative analysis of headspace volatile compounds using comprehensive two-dimensional gas chromatography and their contribution to the aroma of Chardonnay wine. Food Res. Int. 2014, 59, 85–99. [Google Scholar] [CrossRef] [Green Version]
- Alexovič, M.; Andruch, V.; Balogh, I.S.; Sandrejova, J. A single-valve sequential injection manifold (SV-SIA) for automation of air-assisted liquid-phase microextraction: Stopped flow spectrophotometric determination of chromium(VI). Anal. Methods 2021, 5, 2497–2502. [Google Scholar] [CrossRef]
- Roberts, D.D.; Pollien, P.; Milo, C. Solid-phase microextraction method development for headspace analysis of volatile flavor compounds. J. Agric. Food Chem. 2000, 48, 2430–2437. [Google Scholar] [CrossRef] [PubMed]
- Yao, F.; Yi, B.; Shen, C.; Tao, F.; Liu, Y.; Lin, Z.; Xu, P. Chemical analysis of the Chinese liquor Luzhoulaojiao by comprehensive two-dimensional gas chromatography/time-of-flight mass spectrometry. Sci. Rep. 2015, 5, 9553. [Google Scholar] [CrossRef] [PubMed] [Green Version]
- Murray, J.A. Qualitative and quantitative approaches in comprehensive two-dimensional gas chromatography. J. Chromatogr. A 2012, 1261, 58–68. [Google Scholar] [CrossRef] [PubMed]
- Liu, H.; Sun, B. Effect of fermentation processing on the flavor of Baijiu. J. Agric. Food Chem. 2018, 66, 5425–5432. [Google Scholar] [CrossRef] [PubMed]
- Jin, G.Y.; Zhu, Y.; Xu, Y. Mystery behind Chinese liquor fermentation. Trends Food Sci. Technol. 2017, 63, 18–28. [Google Scholar] [CrossRef]
- Wen-Lai, F.; Yan, X. Current practice and future trends of aroma and flavor of Chinese liquor (baijiu). J. Food Saf. Qual. 2014, 5, 3073–3078. [Google Scholar]
- Du, H.; Fan, W.; Xu, Y. Characterization of Geosmin as source of earthy odor in different aroma type Chinese liquors. J. Agric. Food Chem. 2011, 59, 8331–8337. [Google Scholar] [CrossRef] [PubMed]
- Hanrahan, G.; Lu, K. Application of factorial and response surface methodology in modern experimental design and optimization. Crit. Rev. Anal. Chem. 2006, 36, 141–151. [Google Scholar] [CrossRef]
- Zhang, X.; Wang, C.; Wang, L.; Chen, S.; Xu, Y. Optimization and validation of a head space solid-phase microextraction-arrow gas chromatography-mass spectrometry method using central composite design for determination of aroma compounds in Chinese liquor (Baijiu). J. Chromatogr. A 2020, 1610, 460584. [Google Scholar] [CrossRef] [PubMed]
- Yan, Y.; Chen, S.; Nie, Y.; Xu, Y. Characterization of volatile sulfur compounds in soy sauce aroma type Baijiu and changes during fermentation by GC x GC-TOFMS, organoleptic impact evaluation, and multivariate data analysis. Food Res. Int. 2020, 131, 109043. [Google Scholar] [CrossRef] [PubMed]
- Stefanuto, P.-H.; Perrault, K.A.; Dubois, L.M.; L’Homme, B.; Allen, C.; Loughnane, C.; Focant, J.F. Advanced method optimization for volatile aroma profiling of beer using two-dimensional gas chromatography time-of-flight mass spectrometry. J. Chromatogr. A 2017, 1507, 45–52. [Google Scholar] [CrossRef]
- Bean, H.D.; Hill, J.E.; Dimandja, J.-M.D. Improving the quality of biomarker candidates in untargeted metabolomics via peak table-based alignment of comprehensive two-dimensional gas chromatography-mass spectrometry data. J. Chromatogr. A 2015, 1394, 111–117. [Google Scholar] [CrossRef] [PubMed] [Green Version]
- Azzi-Achkouty, S.; Estephan, N.; Ouainib, I.; Rutledge, D.N. Headspace solid-phase microextraction for wine volatile analysis. Crit. Rev. Food Sci. Nutr. 2017, 57, 2009–2020. [Google Scholar] [CrossRef] [PubMed]
- Hernandes, K.C.; Souza-Silva, E.A.; Assumpcao, C.F.; Zini, C.A.; Welke, J.E. Matrix-compatible solid phase microextraction coating improves quantitative analysis of volatile profile throughout brewing stages. Food Res. Int. 2019, 123, 75–87. [Google Scholar] [CrossRef]
- Naccarato, A.; Tassone, A.; Moretti, S.; Elliani, R.; Sprovieri, F.; Pirrone, N.; Tagarelli, A. A green approach for organophosphate ester determination in airborne particulate matter: Microwave-assisted extraction using hydroalcoholic mixture coupled with solid-phase microextraction gas chromatography-tandem mass spectrometry. Talanta 2018, 189, 657–665. [Google Scholar] [CrossRef] [PubMed]
- Abdulra’uf, L.B.; Tan, G.H. Chemometric approach to the optimization of HS-SPME/GC-MS for the determination of multiclass pesticide residues in fruits and vegetables. Food Chem. 2015, 177, 267–273. [Google Scholar] [CrossRef] [PubMed]
- Plutowska, B.; Chmiel, T.; Dymerski, T.; Wardencki, W. A headspace solid-phase microextraction method development and its application in the determination of volatiles in honeys by gas chromatography. Food Chem. 2011, 126, 1288–1298. [Google Scholar] [CrossRef]
- Castro, R.; Natera, R.; Duran, E.; Garcia-Barroso, C. Application of solid phase extraction techniques to analyse volatile compounds in wines and other enological products. Eur. Food Res. Technol. 2008, 228, 1–18. [Google Scholar] [CrossRef]
- Chmiel, T.; Kupska, M.; Wardencki, W.; Namiesnik, J. Application of response surface methodology to optimize solid-phase microextraction procedure for chromatographic determination of aroma-active monoterpenes in berries. Food Chem. 2017, 221, 1041–1056. [Google Scholar] [CrossRef]
- Jung, D.M.; Ebeler, S.E. Headspace solid-phase microextraction method for the study of the volatility of selected flavor compounds. J. Agric. Food Chem. 2003, 51, 200–205. [Google Scholar] [CrossRef]
- Goldner, M.C.; Zamora, M.C.; Di Leo Lira, P.; Gianninoto, H.; Bandoni, A. Effect of ethanol level in the perception of aroma attributes and the detection of volatile compounds in red wine. J. Sens. Stud. 2009, 24, 243–257. [Google Scholar] [CrossRef]
- Fan, H.; Fan, W.; Xu, Y. Characterization of key odorants in Chinese Chixiang aroma-type liquor by gas chromatography-olfactometry, quantitative measurements, aroma recombination, and omission studies. J. Agric. Food Chem. 2015, 63, 3660–3668. [Google Scholar] [CrossRef] [PubMed]
- Wang, L.; Hu, G.; Lei, L.; Lin, L.; Wang, D.; Wu, J. Identification and aroma impact of volatile terpenes in Moutai Liquor. Int. J. Food Prop. 2016, 19, 1335–1352. [Google Scholar] [CrossRef]
- Hai, D.U.; Wen-lai, F.A.N.; Yan, X.U. Quantification of two off-flavor compounds in Chinese liquor using headspace solid phase microextraction and gas chromatography-mass spectrometry. Sci. Technol. Food Ind. 2010, 31, 373–375. [Google Scholar]
- Wang, X.; Fan, W.; Xu, Y. Comparison on aroma compounds in Chinese soy sauce and strong aroma type liquors by gas chromatography-olfactometry, chemical quantitative and odor activity values analysis. Eur. Food Res. Technol. 2014, 239, 813–825. [Google Scholar] [CrossRef]
- Gao, W.; Fan, W.; Xu, Y. Characterization of the key odorants in light aroma type Chinese liquor by gas chromatography-olfactometry, quantitative measurements, aroma recombination, and omission studies. J. Agric. Food Chem. 2014, 62, 5796–5804. [Google Scholar] [CrossRef]
- Campo, E.; Ferreira, V.; Lopez, R.; Escudero, A.; Cacho, J. Identification of three novel compounds in wine by means of a laboratory-constructed multidimensional gas chromatographic system. J. Chromatogr. A 2006, 1122, 202–208. [Google Scholar] [CrossRef]


| Volatile Compound | Peak Area Percentage (%) a | |||
|---|---|---|---|---|
| Water | SS | SS + HCV | Baijiu b | |
| Esters | ||||
| Phenethyl butyrate | 100 | 90 | 52 | 48 |
| Ethyl cinnamate | 100 | 71 | 41 | 38 |
| Methyl benzoate | 100 | 98 | 95 | 88 |
| Alcohols | ||||
| 1-Nonanol | 100 | 47 | 20 | 18 |
| 1-Octen-3-ol | 100 | 70 | 59 | 58 |
| Benzyl alcohol | 100 | 72 | 35 | 29 |
| Aldehydes and ketones | ||||
| 1-Octen-3-one | 100 | 82 | 56 | 43 |
| E-2-heptenal | 100 | 77 | 33 | 30 |
| Trans-2-nonenal | 100 | 87 | 47 | 49 |
| Furans | ||||
| 2-Acetylfuran | 100 | 62 | 23 | 16 |
| Ethyl 2-furoate | 100 | 90 | 62 | 52 |
| Pyrazines | ||||
| 2,3-Dimethylpyrazine | 100 | 52 | 16 | 13 |
| 2-Ethyl-6-methylpyrazine | 100 | 59 | 25 | 16 |
| 2,3-Diethylpyrazine | 100 | 68 | 75 | 69 |
| Sulfur compounds | ||||
| Methyl thiobutyrate | 100 | 60 | 29 | 18 |
| Thiazole | 100 | 27 | 15 | 11 |
| Ethyl 3-methylthiopropionate | 100 | 88 | 44 | 44 |
| Phenols | ||||
| 4-Methylguaiacol | 100 | 90 | 74 | 77 |
| 4-Methylphenol | 100 | 96 | 74 | 69 |
| 4-Ethylphenol | 100 | 88 | 87 | 86 |
| Terpenes | ||||
| Isophorone | 100 | 90 | 57 | 52 |
| β-Cyclocitral | 100 | 82 | 77 | 69 |
| Geraniol | 100 | 83 | 76 | 71 |
| Lactones | ||||
| γ-Valerolactone | 100 | 53 | 30 | 32 |
| γ-Butyrolactone | 100 | 56 | 39 | 13 |
| γ-Nononactone | 100 | 92 | 81 | 80 |
| Volatile Compounds | Linear Range (μg/L) | R2 | LOD (ng/L) | LOQ (ng/L) | Intraday Precision (%) | Interday Precision (%) | Recovery (%) |
|---|---|---|---|---|---|---|---|
| Esters | |||||||
| Isoamyl acetate | 180.12–92,220.01 | 0.992 | 1148.12 | 3827.07 | 5.06 | 6.28 | 98.13 |
| Ethyl phenylacetate | 17.88–2289.20 | 0.9978 | 3.48 | 11.61 | 0.99 | 4.67 | 100.46 |
| Phenethyl acetate | 96.28–770.32 | 0.9948 | 10.31 | 34.37 | 1.85 | 0.68 | 90.26 |
| Phenethyl butyrate | 0.98–499.92 | 0.9988 | 1.54 | 5.13 | 3.06 | 1.98 | 105.04 |
| Ethyl propionate | 370.88–11,868.92 | 0.997 | 106.94 | 356.48 | 1.21 | 4.84 | 98.16 |
| Isobutyl hexanoate | 4.88–2497.87 | 0.9926 | 5.30 | 17.68 | 6.20 | 9.08 | 86.86 |
| Isoamyl butyrate | 6.42–408.65 | 0.9931 | 2.58 | 8.61 | 1.55 | 8.12 | 107.80 |
| Ethyl laurate | 10.27–657.14 | 0.9912 | 1.81 | 6.03 | 1.94 | 5.73 | 87.32 |
| Butyl butyrate | 2.25–1151.63 | 0.9971 | 3.31 | 11.04 | 4.39 | 8.28 | 98.52 |
| Ethyl decanoate | 32.79–4196.64 | 0.9944 | 2.37 | 7.89 | 5.34 | 9.04 | 98.73 |
| Diethyl succinate | 66.29–8485.24 | 0.9916 | 54.80 | 182.67 | 0.87 | 0.97 | 92.08 |
| Ethyl nonanoate | 43.64–2793.24 | 0.9918 | 6.78 | 22.59 | 6.66 | 8.15 | 96.24 |
| Butyl acetate | 5.93–699.58 | 0.9911 | 3.03 | 10.10 | 2.11 | 9.59 | 96.08 |
| Ethyl 3-phenylpropionate | 6.45–6609.15 | 0.9986 | 2.38 | 7.95 | 2.49 | 8.43 | 101.19 |
| Isoamyl octanoate | 8.44–1080.32 | 0.9943 | 0.64 | 2.13 | 3.76 | 2.48 | 96.47 |
| Ethyl 4-methylpentanoate | 2.93–750.04 | 0.9962 | 105.66 | 352.19 | 4.75 | 7.54 | 97.83 |
| Ethyl cyclohexanoate | 0.57–73.52 | 0.9973 | 46.24 | 154.13 | 2.57 | 5.00 | 102.98 |
| Ethyl 2-methylpentanoate | 0.20–100.01 | 0.9975 | 85.61 | 285.37 | 8.67% | 7.93 | 92.72 |
| Pentyl hexanoate | 7.99–4091.65 | 0.9963 | 3.75 | 12.49 | 7.14 | 8.47 | 106.11 |
| Ethyl 3-methylpentanoate | 0.54–34.48 | 0.9972 | 37.44 | 124.81 | 1.06 | 2.09 | 90.60 |
| Propyl hexanoate | 93.78–12,003.71 | 0.9926 | 18.38 | 61.26 | 1.24 | 5.26 | 103.77 |
| Hexyl hexanoate | 19.52–2498.12 | 0.9947 | 5.86 | 19.55 | 7.35 | 8.22 | 104.70 |
| Ethyl 2-methylbutyrate | 11.96–6133.28 | 0.9971 | 15.43 | 51.44 | 0.69 | 6.26 | 91.50 |
| Methyl benzoate | 2.03–259.48 | 0.9847 | 3.30 | 11.01 | 4.00 | 1.52 | 96.04 |
| Ethyl benzoate | 31.77–4066.20 | 0.99 | 341.25 | 1137.48 | 2.90 | 1.31 | 98.53 |
| Ethyl 2-methylpropionate | 320.53–12,497.38 | 0.9882 | 119.84 | 399.47 | 3.16 | 4.34 | 111.53 |
| Alcohols | |||||||
| Phenyl alcohol | 94.68–12,119.28 | 0.9992 | 68.64 | 228.79 | 0.90 | 7.31 | 102.07 |
| Benzyl alcohol | 69.48–4446.43 | 0.9992 | 199.71 | 665.70 | 2.29 | 7.09 | 103.27 |
| Hexanol | 242.69–62,128.28 | 0.9907 | 12,928.22 | 43,094.07 | 2.15 | 7.18 | 96.70 |
| Heptanol | 11.20–1434.06 | 0.9904 | 7.33 | 24.42 | 0.91 | 4.72 | 110.33 |
| Octanol | 32.25–1032.04 | 0.9912 | 19.91 | 66.37 | 8.08 | 5.25 | 100.30 |
| Nonanol | 2.93–93.69 | 0.9986 | 117.90 | 393.01 | 5.55 | 7.01 | 101.36 |
| 1-Octen-3-ol | 1.56–399.10 | 0.9919 | 1.37 | 4.57 | 6.73 | 9.45 | 88.32 |
| 2-Heptanol | 3.01–1540.65 | 0.9975 | 2.00 | 6.68 | 2.29 | 9.46 | 89.10 |
| 3-Octanol | 19.08–305.34 | 0.9901 | 6.98 | 23.28 | 1.91 | 7.32 | 110.88 |
| 2-Nonanol | 3.93–125.66 | 0.9961 | 1.57 | 5.23 | 0.99 | 4.60 | 105.82 |
| Pentanol | 411.42–26,330.92 | 0.9964 | 500.59 | 1668.64 | 2.68 | 1.46 | 110.10 |
| Acids | |||||||
| Pentanoic acid | 177.41–11,354.34 | 0.9973 | 1372.23 | 4574.09 | 2.59 | 9.10 | 109.25 |
| Heptanoic acid | 242.35–31,020.48 | 0.9934 | 117.06 | 390.19 | 6.90 | 4.99 | 104.77 |
| Octanoic acid | 44.84–11,479.92 | 0.9957 | 41.33 | 137.77 | 1.29 | 8.60 | 109.49 |
| Decanoic acid | 39.10–5005.16 | 0.9911 | 30.57 | 101.90 | 3.88 | 6.02 | 92.30 |
| 3-Methylbutanoic acid | 583.78–74,723.63 | 0.9982 | 1007.61 | 3358.72 | 8.97 | 9.80 | 93.50 |
| 4-Methylpentanoic acid | 28.00–7168.97 | 0.9906 | 1404.05 | 4680.17 | 2.62 | 7.67 | 101.36 |
| Aldehydes and ketones | |||||||
| Decanal | 13.68–7005.85 | 0.9986 | 3.55 | 11.84 | 6.07 | 7.34 | 100.18 |
| (E)-2-Heptenal | 2.44–624.05 | 0.9999 | 143.06 | 476.85 | 6.72 | 3.20 | 102.62 |
| (E)-2-Nonenal | 16.07–4113.58 | 0.9987 | 220.85 | 736.18 | 7.24 | 5.58 | 99.75 |
| (E)-2-Octenal | 1.88–962.22 | 0.9929 | 72.72 | 242.39 | 6.87 | 0.32 | 93.76 |
| 2,3-Butanedione | 35.14–17,990.24 | 0.9926 | 1335.46 | 4451.53 | 5.75 | 1.48 | 90.53 |
| 3-Hydroxy-2-butanone | 156.53–80,142.00 | 0.9967 | 306.35 | 1021.18 | 4.86 | 8.87 | 93.53 |
| 2-Methylpropanal | 47.19–24,160.00 | 0.9954 | 525.86 | 1752.88 | 0.86 | 5.98 | 96.05 |
| 2-Methylbutanal | 33.75–4320.10 | 0.9913 | 62.70 | 209.00 | 6.11 | 2.99 | 101.95 |
| Benzaldehyde | 58.21–1862.72 | 0.999 | 58.56 | 195.20 | 4.99 | 6.75 | 99.25 |
| 2-Octanone | 11.22–5743.20 | 0.9905 | 13.45 | 44.82 | 5.55 | 4.88 | 86.79 |
| Phenylacetaldehyde | 103.33–13,226.36 | 0.9986 | 1004.68 | 3348.92 | 0.77 | 7.57 | 98.87 |
| Propanal | 16.71–8555.70 | 0.9935 | 292.70 | 975.67 | 1.16 | 4.17 | 99.70 |
| Octanal | 1.76–900.13 | 0.9926 | 23.65 | 78.84 | 5.02 | 2.94 | 106.08 |
| Nonanal | 5.60–2868.71 | 0.9943 | 6.83 | 22.77 | 5.72 | 3.64 | 99.36 |
| 1-Octen-3-one | 0.39–199.77 | 0.9982 | 38.02 | 126.72 | 1.89 | 2.82 | 101.62 |
| (E, Z)-2,6-Nonadienal | 0.24–124.82 | 0.9981 | 33.64 | 112.13 | 1.54 | 3.89 | 105.50 |
| 3-Methylbutanal | 833.01–106,624.86 | 0.9935 | 177.73 | 592.42 | 7.44 | 8.91 | 110.06 |
| (E, E)-2,4-Hexadienal | 3.90–499.25 | 0.9945 | 50.40 | 167.99 | 7.62 | 0.51 | 105.77 |
| (E, E)-2,4-Decadienal | 0.70–177.98 | 0.9919 | 15.13 | 50.44 | 0.60 | 0.40 | 90.92 |
| (E, E)-2,4-Nonadienal | 0.39–50.04 | 0.9924 | 6.14 | 20.46 | 0.82 | 5.47 | 89.37 |
| Hexanal | 34.35–8793.90 | 0.9993 | 558.22 | 1860.74 | 1.39 | 2.02 | 93.31 |
| 1,1,3-Triethoxypropane | 6.88–3520.47 | 0.9988 | 6017.76 | 20,059.20 | 0.44 | 6.12 | 97.18 |
| 2-Nonanone | 3.45–1765.25 | 0.994 | 1.13 | 3.77 | 0.71 | 7.40 | 91.82 |
| Acetophenone | 3.27–417.96 | 0.9924 | 8.77 | 29.22 | 1.01 | 4.16 | 92.81 |
| Furans | |||||||
| 5-Methyl-2-acetylfuran | 35.48–4541.41 | 0.9993 | 46.21 | 154.03 | 3.79 | 9.50 | 99.75 |
| Furfuryl alcohol | 11.52–5900.35 | 0.9897 | 730.23 | 2434.10 | 4.37 | 9.24 | 102.21 |
| Furfural | 200.81–51,406.86 | 0.9958 | 153.63 | 512.11 | 7.77 | 0.95 | 101.29 |
| 2-Acetylfuran | 6.35–3249.79 | 0.9961 | 49.68 | 165.59 | 0.60 | 4.28 | 93.58 |
| Ethyl 2-furoate | 18.26–584.20 | 0.999 | 57.53 | 191.76 | 1.89 | 9.62 | 97.75 |
| 5-Methyl furfural | 9.77–5003.88 | 0.9949 | 35.51 | 118.36 | 1.67 | 9.03 | 92.99 |
| Pyrazines | |||||||
| 2,6-Dimethylpyrazine | 42.63–21,824.65 | 0.9962 | 282.14 | 940.48 | 6.39 | 7.40 | 99.70 |
| 2-Methylpyrazine | 30.53–3907.93 | 0.9991 | 1234.73 | 4115.76 | 2.05 | 8.89 | 101.51 |
| 2,3,5,6-Tetramethylpyrazine | 13.79–7058.28 | 0.9934 | 222.93 | 743.08 | 4.80 | 4.82 | 102.52 |
| 2-Methyl-6-ethylpyrazine | 7.82–4001.93 | 0.9975 | 78.95 | 263.18 | 3.83 | 9.93 | 97.75 |
| 2,3,5-Trimethylpyrazine | 10.24–5244.50 | 0.995 | 126.96 | 423.18 | 5.84 | 8.64 | 105.46 |
| 2,3-Diethylpyrazine | 1.97–503.46 | 0.9881 | 244.59 | 815.29 | 5.86 | 4.72 | 96.43 |
| 2,3-Diethyl-5-methylpyrazine | 0.39–200.30 | 0.9986 | 90.86 | 302.88 | 4.26 | 8.88 | 95.33 |
| 2,3-Dimethylpyrazine | 1.54–787.52 | 0.9898 | 654.62 | 2182.06 | 6.26 | 6.57 | 90.94 |
| Sulfur compounds | |||||||
| Methional | 54.87–28,092.79 | 0.9989 | 41.47 | 136.85 | 6.04 | 9.62 | 98.64 |
| Methyl furfuryl disulfide | 5.30–403.27 | 0.992 | 1.75 | 5.83 | 4.37 | 6.35 | 95.38 |
| Dimethyl disulfide | 9.71–621.28 | 0.9964 | 571.31 | 1904.37 | 6.48 | 6.10 | 100.51 |
| Furfuryl mercaptan | 2.31–1182.16 | 0.9917 | 212.26 | 707.52 | 4.27 | 2.03 | 109.64 |
| Ethyl 3-methylthiopropionate | 1.32–674.00 | 0.9952 | 165.67 | 552.24 | 4.12 | 1.55 | 101.58 |
| Methyl thiobutyrate | 0.78–399.74 | 0.9981 | 148.20 | 494.00 | 2.57 | 7.30 | 109.68 |
| Thiazole | 1.58–810.31 | 0.9987 | 25.02 | 82.57 | 9.02 | 0.14 | 100.09 |
| Dimethyl trisulfide | 24.85–795.25 | 0.993 | 1.36 | 4.49 | 1.59 | 4.92 | 94.21 |
| Methionol | 50.58–12,949.55 | 0.9962 | 14.44 | 47.65 | 5.62 | 6.97 | 99.75 |
| Methyl 2-methyl-3-furyl disulfide | 0.20–50.10 | 0.9911 | 26.08 | 86.95 | 4.07 | 9.83 | 96.42 |
| Methanethiol | 3.91–4000.00 | 0.9979 | 34.38 | 114.59 | 8.89 | 2.92 | 101.94 |
| Phenols | |||||||
| 4-Methylphenol | 25.41–3252.20 | 0.9925 | 48.96 | 163.19 | 8.80 | 6.60 | 107.67 |
| 3-Methylphenol | 0.78–199.90 | 0.9945 | 26.24 | 87.45 | 9.10 | 7.38 | 90.94 |
| Phenol | 5.08–649.68 | 0.9916 | 16.48 | 54.93 | 2.08 | 2.56 | 111.94 |
| 4-Ethylphenol | 3.72–475.86 | 0.9987 | 13.17 | 43.88 | 4.71 | 8.70 | 92.53 |
| 4-Ethyl-2-methoxyphenol | 4.78–613.76 | 0.9906 | 17.80 | 59.32 | 7.18 | 7.29 | 104.39 |
| 4-Hydroxy-3-methoxystyrene | 19.04–9747.99 | 0.9935 | 441.90 | 1472.98 | 4.24 | 3.72 | 96.29 |
| 4-Methyl-2-methoxyphenol | 10.25–2624.53 | 0.992 | 50.03 | 166.77 | 6.17 | 4.86 | 88.98 |
| Terpenes | |||||||
| 2-Undecanone | 0.57–290.54 | 0.9921 | 0.04 | 0.14 | 3.26 | 5.65 | 101.13 |
| β-Damascenone | 0.55–278.98 | 0.9989 | 62.90 | 209.66 | 3.87 | 7.23 | 88.41 |
| Farnesol | 6.80–435.15 | 0.9965 | 25.24 | 84.12 | 4.28 | 1.32 | 94.25 |
| α-Cedrene | 3.49–1785.27 | 0.9974 | 15.24 | 50.81 | 6.77 | 2.81 | 98.43 |
| Caryophyllene | 0.42–108.51 | 0.9957 | 22.90 | 76.33 | 9.34 | 5.04 | 102.94 |
| Rosoxide | 0.39–100.35 | 0.9974 | 3.16 | 10.54 | 4.77 | 5.21 | 100.54 |
| Citronellol | 0.31–160.93 | 0.9959 | 12.64 | 42.14 | 1.28 | 9.19 | 105.53 |
| Geraniol | 0.15–77.84 | 0.9939 | 64.43 | 214.78 | 2.47 | 8.60 | 95.81 |
| Irisone | 0.03–17.47 | 0.9966 | 15.55 | 51.84 | 3.46 | 1.82 | 110.83 |
| Geranylacetone | 0.51–130.62 | 0.9912 | 1.06 | 3.54 | 4.73 | 3.82 | 98.84 |
| β-Cyclocitral | 0.49–251.81 | 0.9949 | 14.85 | 49.50 | 6.64 | 6.89 | 107.52 |
| Cineole | 0.72–367.11 | 0.9983 | 79.35 | 264.50 | 4.29 | 0.57 | 103.62 |
| Terpinen-4-ol | 0.39–199.60 | 0.9961 | 24.68 | 82.27 | 2.92 | 3.64 | 93.41 |
| Cedrol | 1.10–560.10 | 0.9994 | 7.49 | 24.98 | 4.54 | 9.51 | 100.04 |
| Isophorone | 0.73–375.64 | 0.9903 | 4.70 | 15.66 | 4.73 | 6.36 | 96.71 |
| Linalool | 0.63–320.22 | 0.999 | 1.82 | 6.07 | 8.36 | 4.05 | 100.05 |
| Lactones | |||||||
| γ-Decalactone | 0.26–133.12 | 0.9951 | 19.67 | 65.58 | 4.08 | 8.01 | 97.61 |
| γ-Dodecalactone | 4.72–604.68 | 0.99 | 22.66 | 75.54 | 0.14 | 2.99 | 102.34 |
| γ-Nonolactone | 5.32–2722.23 | 0.9975 | 89.68 | 298.93 | 4.16 | 8.72 | 100.66 |
| γ-Hexalactone | 3.53–112.25 | 0.9909 | 1.77 | 5.90 | 5.31 | 1.56 | 103.76 |
| Volatile Compounds | Odor Thresholds | Fenjiu | Wuliangye | Guotai | |||
|---|---|---|---|---|---|---|---|
| Concentration | OAV | Concentration | OAV | Concentration | OAV | ||
| Esters | |||||||
| Isoamyl acetate | 94 | 5339.58 ± 951.27 | 56.80 | 6423.77 ± 922.57 | 68.34 | 9176.91 ± 250.18 | 97.63 |
| Ethyl phenylacetate | 407 | 189.57 ± 26.6 | 0.47 | 688.71 ± 32.78 | 1.69 | 568.37 ± 27.91 | 1.40 |
| Phenethyl acetate | 909 | 146.62 ± 32.39 | 0.16 | 344.29 ± 36.29 | 0.38 | 109.58 ± 8.14 | 0.12 |
| Phenethyl butyrate | 961 | 1.37 ± 0.2 | 0.00 | 47.4 ± 3.52 | 0.05 | 20.53 ± 1.15 | 0.02 |
| Ethyl propionate | 19,019 | 853.43 ± 41.34 | 0.04 | 1108.46 ± 181.78 | 0.06 | 6932.92 ± 393.8 | 0.36 |
| Isobutyl hexanoate | 5250 | 6.83 ± 0.05 | 0.00 | 316.88 ± 38.23 | 0.06 | 24.36 ± 1.51 | 0.00 |
| Isoamyl butyrate | 915 | 8.21 ± 0.17 | 0.01 | 73.86 ± 12.66 | 0.08 | nd | — |
| Ethyl laurate | 500 | 150.93 ± 50.11 | 0.30 | 500.38 ± 53.63 | 1.00 | 116.53 ± 4.95 | 0.23 |
| Butyl butyrate | 110 | nd | — | nq | — | 4.55 ± 0.2 | 0.04 |
| Ethyl decanoate | 1120 | 441.88 ± 26.09 | 0.39 | 2389.6 ± 119.02 | 2.13 | 1338.32 ± 81.26 | 1.19 |
| Diethyl succinate | 35,3193 | 4886.71 ± 38.29 | 0.01 | 1129.74 ± 168.32 | 0.00 | 1946.71 ± 10.21 | 0.01 |
| Ethyl nonanoate | 3150 | 79.42 ± 7.04 | 0.03 | 429.59 ± 108.49 | 0.14 | 363.75 ± 24.23 | 0.12 |
| Butyl acetate | 2.63 | 6.24 ± 0.65 | 2.37 | 14.15 ± 1.61 | 5.38 | 22.71 ± 0.48 | 8.63 |
| Ethyl 3-phenylpropionate | 125 | 61.69 ± 0.73 | 0.49 | 905.9 ± 0.26 | 7.25 | 98.75 ± 7.94 | 0.79 |
| Isoamyl octanoate | 600 | 33.51 ± 4.57 | 0.06 | 519.45 ± 13.33 | 0.87 | 137.92 ± 2.81 | 0.23 |
| Ethyl 4-methylpentanoate | 21.4 | 62.42 ± 4.35 | 2.92 | 622.67 ± 166.24 | 29.10 | 263.38 ± 12.52 | 12.31 |
| Ethyl cyclohexanoate | 20.2 | 1.61 ± 0.07 | 0.08 | 23.56 ± 1.15 | 1.17 | 3.8 ± 0.01 | 0.19 |
| Ethyl 2-methylpentanoate | * | nd | — | 6.58 ± 1.96 | — | 2.29 ± 0.26 | — |
| Pentyl hexanoate | 14,000 | nd | — | 269.42 ± 42.46 | 0.02 | 20.26 ± 1.45 | 0.00 |
| Ethyl 3-methylpentanoate | 18 | 1.17 ± 0.02 | 0.07 | nd | — | 6.75 ± 0.02 | 0.38 |
| Propyl hexanoate | 12,800 | nq | — | 1001.98 ± 74.85 | 0.08 | 115.16 ± 4.12 | 0.01 |
| Hexyl hexanoate | 1890 | 21.26 ± 1.79 | 0.01 | 407.91 ± 104.9 | 0.22 | 141.88 ± 10.43 | 0.08 |
| Ethyl 2-methylbutyrate | 18 | 241.71 ± 2.61 | 13.43 | 3119.13 ± 48.35 | 173.29 | 2366.74 ± 49.87 | 131.49 |
| Methyl benzoate | 0.073 | 2.32 ± 0.04 | 31.78 | 3.84 ± 0.16 | 52.60 | 3.9 ± 0.17 | 53.42 |
| Ethyl benzoate | 1430 | 143.21 ± 27.72 | 0.10 | 179.29 ± 8.01 | 0.13 | 366.95 ± 10.15 | 0.26 |
| Ethyl 2-methylpropionate | 57.47 | 329.46 ± 20.21 | 5.73 | 1464.44 ± 78.06 | 25.48 | 2545.15 ± 156.29 | 44.29 |
| Alcohols | |||||||
| Phenyl alcohol | 28,900 | 3256.13 ± 237.93 | 0.11 | 3049.82 ± 12.37 | 0.11 | 7868.06 ± 49.55 | 0.27 |
| Benzyl alcohol | 40,900 | 123.76 ± 8.78 | 0.00 | 144.44 ± 5.59 | 0.00 | 1145.19 ± 89.22 | 0.03 |
| Hexanol | 5370 | 5472.49 ± 16.92 | 1.02 | 71,913.75 ± 171.52 | 13.39 | 10,216.49 ± 234.94 | 1.90 |
| Heptanol | 26,600 | 262.14 ± 12.37 | 0.01 | 1221.84 ± 7.3 | 0.05 | 779.65 ± 7.08 | 0.03 |
| Octanol | 1100 | 70.9 ± 14.14 | 0.06 | 261.84 ± 3.25 | 0.24 | 684.62 ± 1.55 | 0.62 |
| Nonanol | 50 | 54.29 ± 10.27 | 1.09 | 63.44 ± 0.61 | 1.27 | 33.14 ± 0.2 | 0.66 |
| 1-Octen-3-ol | 6.12 | 98.79 ± 4.68 | 16.14 | 197.71 ± 3.23 | 32.31 | 92.95 ± 5.78 | 15.19 |
| 2-Heptanol | 1430 | 12.62 ± 8 | 0.01 | 1273.52 ± 7.73 | 0.89 | 391.19 ± 41.99 | 0.27 |
| 3-Octanol | 393 | nd | — | 30.99 ± 2.27 | 0.08 | 173.23 ± 4.44 | 0.44 |
| 2-Nonanol | 75 | 43.4 ± 4.37 | 0.58 | 69.37 ± 15.35 | 0.92 | 41.14 ± 2.25 | 0.55 |
| Pentanol | 4000 | 562.71 ± 7.22 | 0.14 | 1556.27 ± 537.43 | 0.39 | 1462.39 ± 176.97 | 0.37 |
| Acids | |||||||
| Pentanoic acid | 389 | 349.62 ± 10.85 | 0.90 | 6631.68 ± 1004.73 | 17.05 | 3336.22 ± 318.74 | 8.58 |
| Heptanoic acid | 13,300 | 1024.96 ± 86.08 | 0.08 | 17,513.91 ± 569.26 | 1.32 | 5493.77 ± 75.02 | 0.41 |
| Octanoic acid | 2700 | 918.51 ± 97.38 | 0.34 | 6287.55 ± 704.09 | 2.33 | 4896.17 ± 11.55 | 1.81 |
| Decanoic acid | 500 | 414.33 ± 41.32 | 0.83 | 2248.13 ± 52.02 | 4.50 | 864.62 ± 3.32 | 1.73 |
| 3-Methylbutanoic acid | 1050 | 970.4 ± 40.16 | 0.92 | 6946.24 ± 76.03 | 6.62 | 2629.44 ± 181.79 | 2.50 |
| 4-Methylpentanoic acid | 144 | 147.63 ± 15.04 | 1.03 | 1028.92 ± 293.65 | 7.15 | 766.3 ± 58.65 | 5.32 |
| Aldehydes and ketones | |||||||
| Decanal | 12 | 61.26 ± 0.78 | 5.11 | 581.48 ± 13.79 | 48.46 | 316.29 ± 66.91 | 26.36 |
| (E)-2-Heptenal | 0.0046 | 18.56 ± 0.08 | 4034.78 | 2.45 ± 0.07 | 532.61 | 20.53 ± 0.75 | 4463.04 |
| (E)-2-Nonenal | 51 | 16.58 ± 0.47 | 0.33 | 71.87 ± 8.2 | 1.41 | 51.29 ± 12.93 | 1.01 |
| (E)-2-Octenal | * | nd | — | 26.98 ± 8.16 | — | 58.71 ± 1.83 | — |
| 2,3-Butanedione | 5 | nd | — | nd | — | 877.35 ± 18.33 | 175.47 |
| 3-Hydroxy-2-butanone | 259 | 2102.04 ± 1637.78 | 8.12 | 15,734.59 ± 322.84 | 60.75 | 52,264.56 ± 487.69 | 201.79 |
| 2-Methylpropanal | 1300 | 657.74 ± 16.75 | 0.51 | 3540.37 ± 620.42 | 2.72 | 7700.86 ± 884.05 | 5.92 |
| 2-Methylbutanal | 16 | 161.22 ± 6.82 | 10.08 | 535.09 ± 14.85 | 33.44 | 887.15 ± 9.04 | 55.45 |
| Benzaldehyde | 4200 | 496.91 ± 33.56 | 0.12 | 1102.29 ± 94.87 | 0.26 | 945.66 ± 198.82 | 0.23 |
| 2-Octanone | 50 | 47.32 ± 11.86 | 0.95 | 276.17 ± 52.66 | 5.52 | 217.12 ± 7.27 | 4.34 |
| Phenylacetaldehyde | 262 | 4799.96 ± 240.22 | 18.32 | 6189.03 ± 1958.57 | 23.62 | 2808.12 ± 95.44 | 10.72 |
| Propanal | 2 | 544.13 ± 22.67 | 272.07 | 1021.4 ± 143.35 | 510.70 | 4236.21 ± 270.52 | 2118.11 |
| Octanal | 40 | 30.54 ± 5.51 | 0.76 | 128.18 ± 2.58 | 3.20 | 73.92 ± 3.71 | 1.85 |
| Nonanal | 122 | 285.32 ± 10.39 | 2.34 | 734.07 ± 60.83 | 6.02 | 497.54 ± 28.48 | 4.08 |
| 1-Octen-3-one | 0.05 | 3.55 ± 0.1 | 71.00 | 6.13 ± 0.24 | 122.60 | 3.28 ± 0.06 | 65.60 |
| (E,Z)-2,6-Nonadienal | 0.64 | 4.87 ± 0.19 | 7.61 | 7.31 ± 1.03 | 11.42 | 5.25 ± 0.31 | 8.20 |
| 3-Methylbutanal | 17 | 14,920.17 ± 419.99 | 877.66 | 58,465.44 ± 290.21 | 3439.14 | 82,260.03 ± 392.72 | 4838.83 |
| (E,E)-2,4-Hexadienal | * | nd | — | 9.87 ± 0.07 | — | nd | — |
| (E,E)-2,4-Decadienal | 7.71 | 12.93 ± 1.17 | 1.68 | 14.63 ± 0.15 | 1.90 | 13.27 ± 0.38 | 1.72 |
| (E,E)-2,4-Nonadienal | 0.0026 | 3.46 ± 0.36 | 1330.77 | 32.2 ± 3.75 | 12384.62 | 11.19 ± 0.1 | 4303.85 |
| Hexanal | 25.5 | 151.24 ± 24.36 | 5.93 | 845.76 ± 11.03 | 33.17 | 640.99 ± 28.31 | 25.14 |
| 1,1,3-Triethoxypropane | 3700 | 283.61 ± 30.7 | 0.08 | nd | — | 306.05 ± 0.46 | 0.08 |
| 2-Nonanone | 483 | 13.77 ± 0.49 | 0.03 | 219 ± 16.22 | 0.45 | 179.96 ± 8.08 | 0.37 |
| Acetophenone | 256 | 12.38 ± 3.7 | 0.05 | 119.71 ± 40.44 | 0.47 | 186.4 ± 0.47 | 0.73 |
| Furans | |||||||
| 5-Methyl-2-acetylfuran | 40,900 | 45.89 ± 1.09 | 0.00 | 155.35 ± 4.14 | 0.00 | 279.74 ± 7.28 | 0.01 |
| Furfuryl alcohol | 2000 | 77.07 ± 1.73 | 0.04 | 1252.52 ± 378.8 | 0.63 | 4574.64 ± 4.98 | 2.29 |
| Furfural | 44,000 | 9185.87 ± 87.24 | 0.21 | 26,655.25 ± 1198.7 | 0.61 | 38,657.5 ± 3092.53 | 0.88 |
| 2-Acetylfuran | 58,504 | 42.42 ± 1.81 | 0.00 | 548.31 ± 43.39 | 0.01 | 2031.18 ± 228.43 | 0.03 |
| Ethyl 2-furoate | 130,000 | 40.55 ± 1.5 | 0.00 | 499.12 ± 63.31 | 0.00 | 222.37 ± 21.18 | 0.00 |
| 5-Methyl furfural | 466,000 | 41.91 ± 3.79 | 0.00 | 677.38 ± 95.46 | 0.00 | 2484.69 ± 33.48 | 0.01 |
| Pyrazines | |||||||
| 2,6-Dimethylpyrazine | 791 | nq | — | 456.93 ± 106.52 | 0.58 | 2352.68 ± 62.85 | 2.97 |
| 2-Methylpyrazine | 121927 | 44.59 ± 3.97 | 0.00 | 69.84 ± 11.73 | 0.00 | 470.1 ± 5.31 | 0.00 |
| 2,3,5,6-Tetramethylpyrazine | 80,100 | 35.58 ± 1.91 | 0.00 | 122.35 ± 5.47 | 0.00 | 1191.78 ± 89.18 | 0.01 |
| 2-Methyl-6-ethylpyrazine | 40 | 8.14 ± 0.06 | 0.20 | 97.83 ± 6.67 | 2.45 | 928.97 ± 5.64 | 23.22 |
| 2,3,5-Trimethylpyrazine | 730 | 24.58 ± 5.77 | 0.03 | 151.92 ± 1.95 | 0.21 | 578.88 ± 18.35 | 0.79 |
| 2,3-Diethylpyrazine | 172 | nd | — | nd | — | 7.12 ± 0.17 | 0.04 |
| 2,3-Diethyl-5-methylpyrazine | * | nd | — | 3.93 ± 0.1 | — | 3.89 ± 0.71 | — |
| 2,3-Dimethylpyrazine | 10,824 | 10.9 ± 4.25 | 0.00 | 5.48 ± 2.54 | 0.00 | 84.91 ± 4.12 | 0.01 |
| Sulfur compounds | |||||||
| Methional | 7.12 | nd | — | nd | — | 73.68 ± 14.19 | 10.35 |
| Methyl furfuryl disulfide | 0.4 | nd | — | nd | — | 10.14 ± 0.2 | 25.35 |
| Dimethyl disulfide | 9 | 23.77 ± 0.29 | 2.64 | 97.71 ± 6.11 | 10.86 | 121.77 ± 7.55 | 13.53 |
| Furfuryl mercaptan | 0.1 | 11.24 ± 0.73 | 112.40 | nd | — | 35.2 ± 1.01 | 352.00 |
| Ethyl 3-methylthiopropionate | 3080 | nd | — | nd | — | 48.41 ± 0.75 | 0.02 |
| Methyl thiobutyrate | 0.14 | nd | — | 113.15 ± 21.92 | 808.21 | 14.15 ± 0.36 | 101.07 |
| Thiazole | 740 | 38.08 ± 6.53 | 0.05 | 42.79 ± 0.13 | 0.06 | 85.21 ± 7.69 | 0.12 |
| Dimethyl trisulfide | 0.36 | 43.97 ± 5.01 | 122.14 | 172.73 ± 2.22 | 479.81 | 182.28 ± 6.62 | 506.33 |
| Methionol | 2110 | nd | — | nd | — | 732.65 ± 24.54 | 0.35 |
| Methyl 2-methyl-3-furyl disulfide | 0.02 | 0.44 ± 0.04 | 22.00 | 0.56 ± 0.06 | 28.00 | 0.94 ± 0.09 | 47.00 |
| Methanethiol | 2 | 185.05 ± 27.02 | 92.53 | 238.18 ± 26.04 | 119.09 | 249.95 ± 4.03 | 124.98 |
| Phenols | |||||||
| 4-Methylphenol | 167 | 28.16 ± 0.91 | 0.17 | 1530.14 ± 8.94 | 9.16 | 127.14 ± 13.81 | 0.76 |
| 3-Methylphenol | * | nq | — | 1.38 ± 0.17 | — | 9.61 ± 0.01 | — |
| Phenol | 18,900 | 73.34 ± 5.76 | 0.00 | 539.69 ± 13.9 | 0.03 | 235.54 ± 6.55 | 0.01 |
| 4-Ethylphenol | 123 | 54.51 ± 5.87 | 0.44 | 322.84 ± 5.13 | 2.62 | 72.88 ± 3.43 | 0.59 |
| 4-Ethyl-2-methoxyphenol | 123 | 108.8 ± 6.39 | 0.88 | 161.72 ± 2.08 | 1.31 | nd | — |
| 4-Hydroxy-3-methoxystyrene | 209 | 21.47 ± 0.03 | 0.10 | nd | — | 25.98 ± 4.19 | 0.12 |
| 4-Methyl-2-methoxyphenol | 315 | 6.64 ± 0.18 | 0.02 | 43.97 ± 1.04 | 0.14 | 82.63 ± 1.1 | 0.26 |
| Terpenes | |||||||
| 2-Undecanone | 6 | nq | — | 12.67 ± 1.98 | 2.11 | 9.19 ± 4.05 | 1.53 |
| β-Damascenone | 0.12 | 6.55 ± 1.71 | 54.58 | 9.93 ± 0.06 | 82.75 | 8.69 ± 0.95 | 72.42 |
| Farnesol | * | nd | — | 14.87 ± 1.22 | — | 20.04 ± 0.86 | — |
| α-Cedrene | 6500 | 5.88 ± 0.83 | 0.00 | 8.86 ± 0.2 | 0.00 | 6.82 ± 0.03 | 0.00 |
| Caryophyllene | 130 | 1.68 ± 0.24 | 0.01 | 4.75 ± 0.36 | 0.04 | 21.74 ± 0.14 | 0.17 |
| Rosoxide | * | 1.57 ± 0.09 | — | nd | — | nd | — |
| Citronellol | 300 | 4.34 ± 0.59 | 0.01 | 3.42 ± 0.27 | 0.01 | 6.22 ± 0.8 | 0.02 |
| Geraniol | 120 | 8.72 ± 0.75 | 0.07 | 4.12 ± 0.05 | 0.03 | 10.85 ± 0.31 | 0.09 |
| Irisone | 1.3 | 0.59 ± 0.01 | 0.45 | 0.69 ± 0.01 | 0.53 | 1.11 ± 0.04 | 0.85 |
| Geranylacetone | 60 | 11.82 ± 0.9 | 0.20 | 23.66 ± 3.94 | 0.39 | 46.04 ± 7.22 | 0.77 |
| β-Cyclocitral | 3 | 4.3 ± 1 | 1.43 | 9.45 ± 0.73 | 3.15 | 2.11 ± 0 | 0.70 |
| Cineole | 0.55 | 5.09 ± 0.55 | 9.25 | nd | — | 35.48 ± 4.06 | 64.51 |
| Terpinen-4-ol | 940 | 3.66 ± 0.13 | 0.00 | 3.48 ± 0.38 | 0.00 | 2.93 ± 0.11 | 0.00 |
| Cedrol | 7300 | 3.41 ± 1.77 | 0.00 | 19.99 ± 3.25 | 0.00 | 54.48 ± 1.88 | 0.01 |
| Isophorone | 11 | 18.09 ± 1.15 | 1.64 | 10.74 ± 3.55 | 0.98 | 14.52 ± 0.69 | 1.32 |
| Linalool | 13.1 | 48.07 ± 1.94 | 3.67 | 45.33 ± 6.54 | 3.46 | 77.84 ± 3.48 | 5.94 |
| Lactones | |||||||
| γ-Decalactone | 11 | 3.21 ± 1.01 | 0.29 | 0.28 ± 0.03 | 0.03 | 9.18 ± 0.37 | 0.83 |
| γ-Dodecalactone | 60.68 | 24.56 ± 3.45 | 0.40 | 42.16 ± 6.61 | 0.69 | 36.92 ± 1.27 | 0.61 |
| γ-Nonolactone | 91 | 121.36 ± 1.77 | 1.33 | 198.03 ± 2.78 | 2.18 | 275.61 ± 6.94 | 3.03 |
| γ-Hexalactone | 359,000 | 47.23 ± 1.04 | 0.00 | 54.51 ± 20.82 | 0.00 | nd | — |
Publisher’s Note: MDPI stays neutral with regard to jurisdictional claims in published maps and institutional affiliations. |
© 2021 by the authors. Licensee MDPI, Basel, Switzerland. This article is an open access article distributed under the terms and conditions of the Creative Commons Attribution (CC BY) license (https://creativecommons.org/licenses/by/4.0/).
Share and Cite
Mu, X.; Lu, J.; Gao, M.; Li, C.; Chen, S. Optimization and Validation of a Headspace Solid-Phase Microextraction with Comprehensive Two-Dimensional Gas Chromatography Time-of-Flight Mass Spectrometric Detection for Quantification of Trace Aroma Compounds in Chinese Liquor (Baijiu). Molecules 2021, 26, 6910. https://0-doi-org.brum.beds.ac.uk/10.3390/molecules26226910
Mu X, Lu J, Gao M, Li C, Chen S. Optimization and Validation of a Headspace Solid-Phase Microextraction with Comprehensive Two-Dimensional Gas Chromatography Time-of-Flight Mass Spectrometric Detection for Quantification of Trace Aroma Compounds in Chinese Liquor (Baijiu). Molecules. 2021; 26(22):6910. https://0-doi-org.brum.beds.ac.uk/10.3390/molecules26226910
Chicago/Turabian StyleMu, Xiaoqing, Jun Lu, Mengxin Gao, Changwen Li, and Shuang Chen. 2021. "Optimization and Validation of a Headspace Solid-Phase Microextraction with Comprehensive Two-Dimensional Gas Chromatography Time-of-Flight Mass Spectrometric Detection for Quantification of Trace Aroma Compounds in Chinese Liquor (Baijiu)" Molecules 26, no. 22: 6910. https://0-doi-org.brum.beds.ac.uk/10.3390/molecules26226910