
Screening of Potential Thrombin and Factor Xa Inhibitors from the Danshen–Chuanxiong Herbal Pair through a Spectrum–Effect Relationship Analysis

 and
and
Abstract
: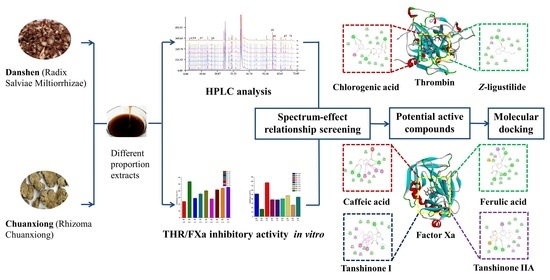
1. Introduction
2. Results and Discussion
2.1. Inhibitory Effects of DC Extracts on THR and FXa
2.2. Spectrum–Effect Relationship Analysis
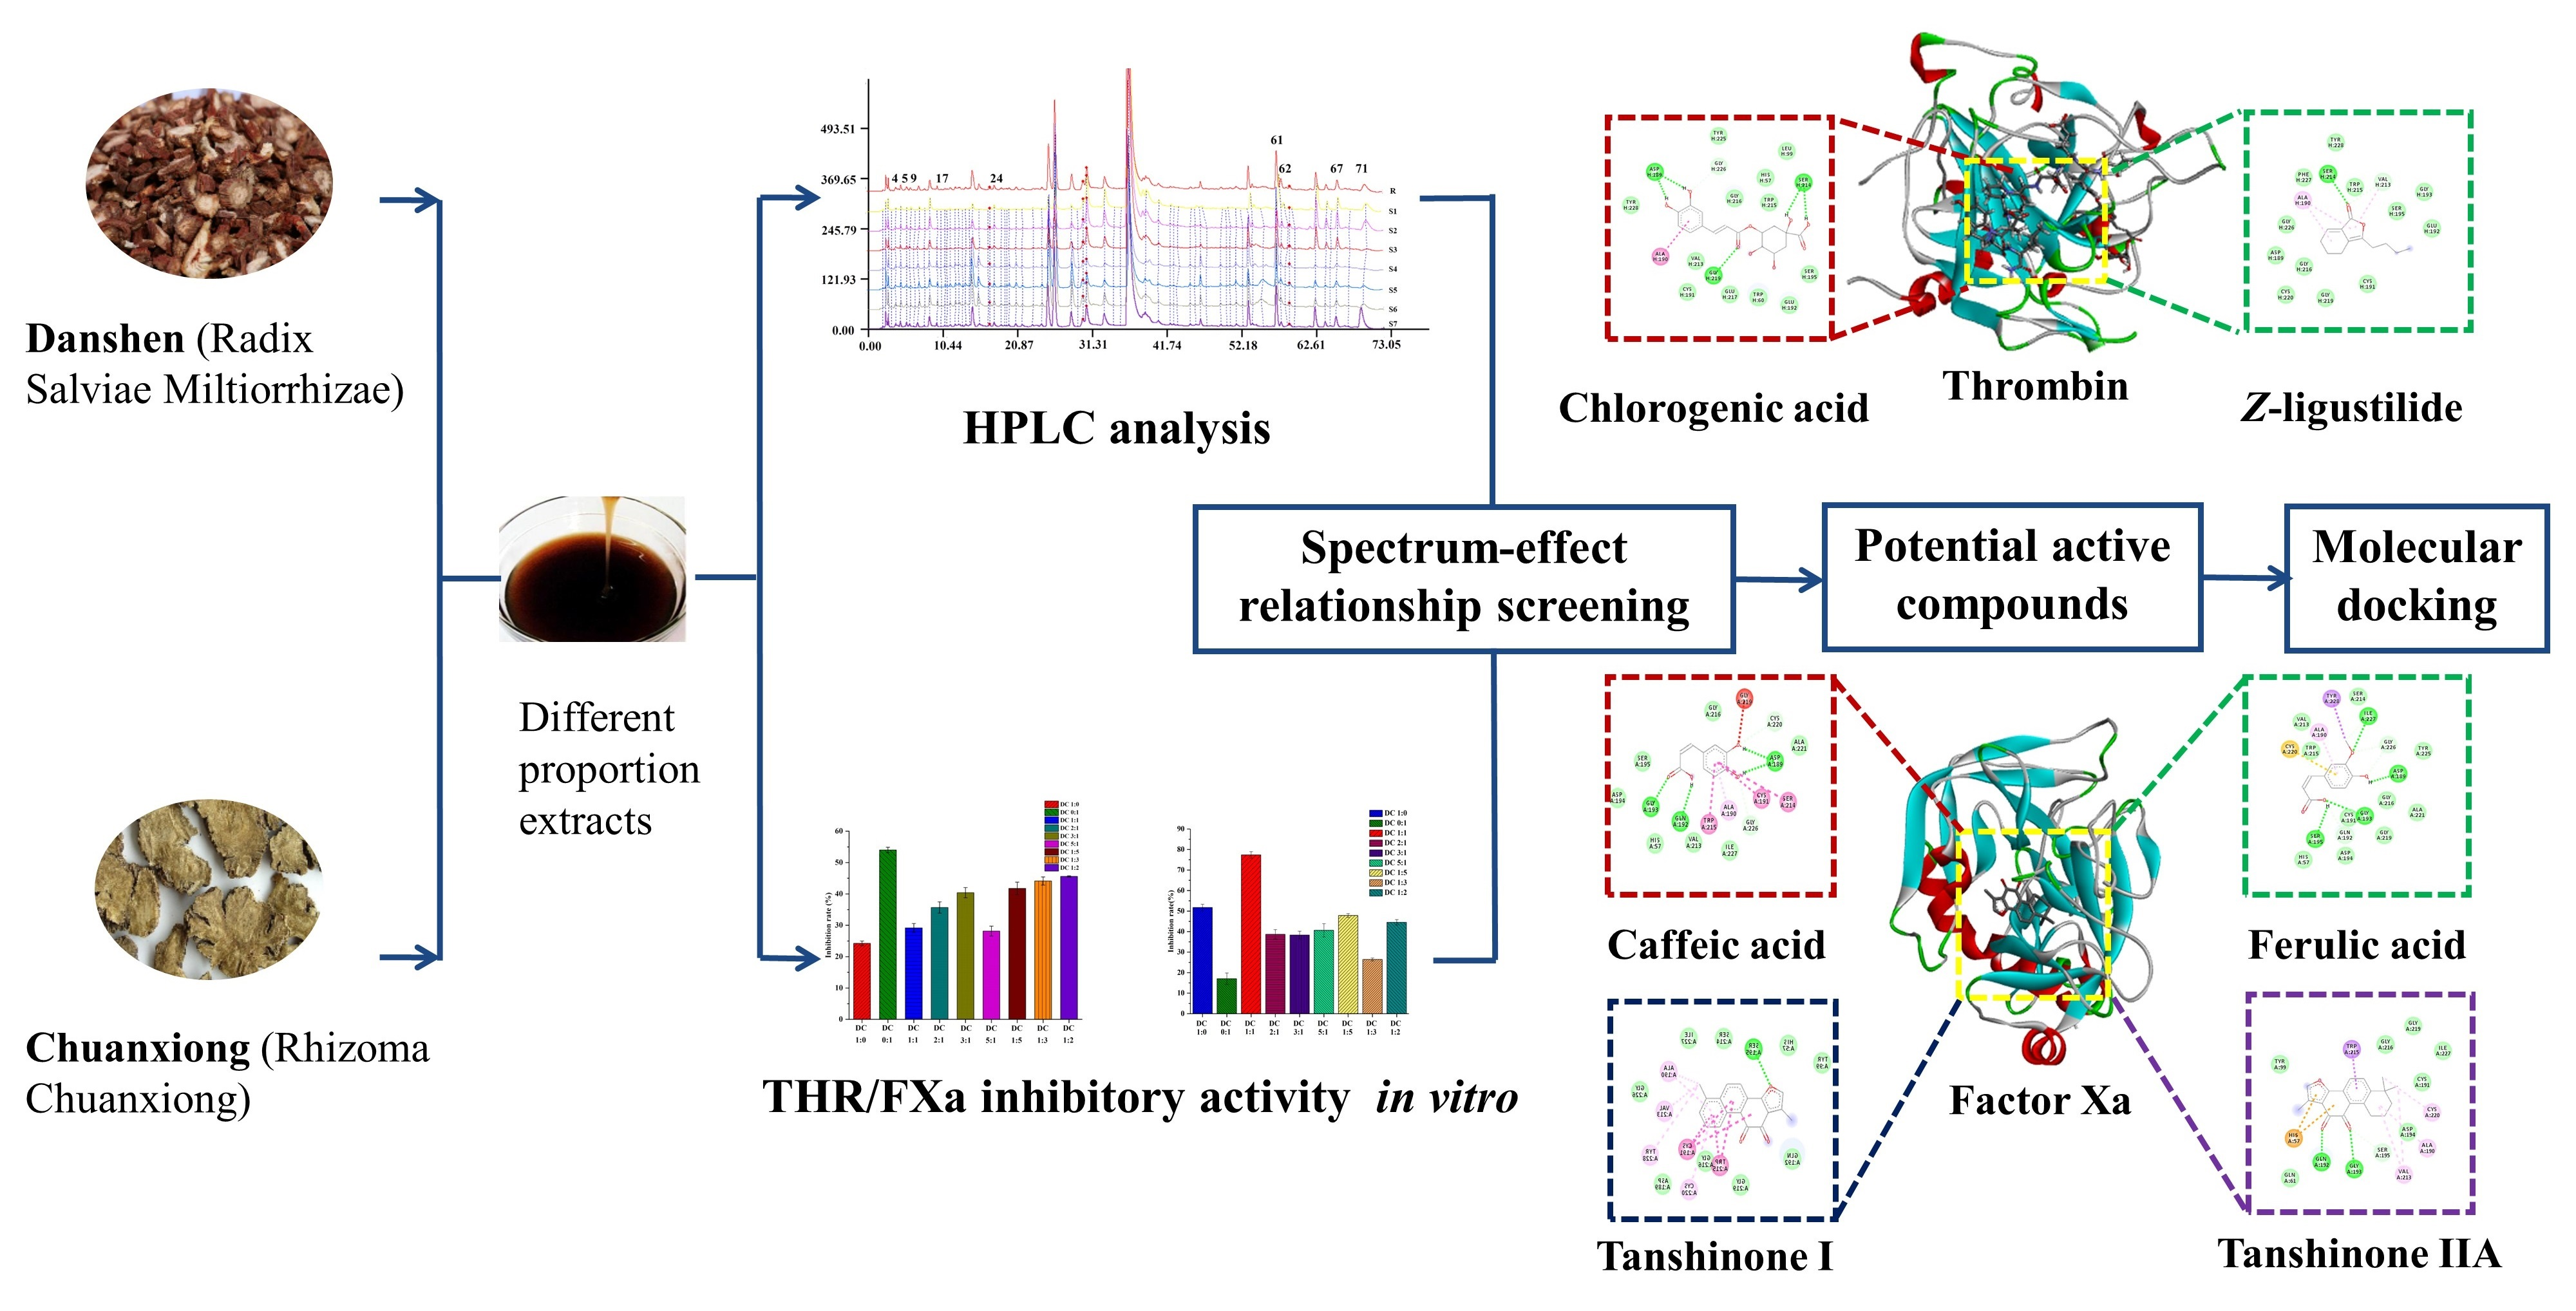
2.3. Identifications of the Potential Active Compounds through an LC–MS Analysis
2.4. In Vitro Activity Tests for the Predicted Compounds
2.5. Molecular Docking of THR and FXa and Identified Active Compounds
3. Materials and Methods
3.1. Chemicals and Materials
3.2. Preparation of DC Extracts
3.3. HPLC and LC–MS Analysis
3.4. THR and FXa Inhibitory Activity Assay
3.4.1. Preparation of Buffers and Solutions
3.4.2. Calculation of the % Inhibition
3.5. Spectrum–Effect Relationship Analysis
3.6. Molecular Docking of THR and FXa and Identified Active Compounds
3.7. Statistical Analysis
4. Conclusions
Author Contributions
Funding
Institutional Review Board Statement
Informed Consent Statement
Data Availability Statement
Conflicts of Interest
Sample Availability
References
- Yang, Y.Y.; Wu, Z.Y.; Xia, F.B.; Zhang, H.; Wang, X.; Gao, J.L.; Yang, F.Q.; Wan, J.B. Characterization of thrombin/factor Xa inhibitors in Rhizoma Chuanxiong through UPLC-MS-based multivariate statistical analysis. Chin. Med. 2020, 15, 93. [Google Scholar] [CrossRef]
- Liu, L.; Ma, H.Y.; Yang, N.Y.; Tang, Y.P.; Guo, J.M.; Tao, W.W.; Duan, J.A. A series of natural flavonoids as thrombin inhibitors: Structure-activity relationships. Thromb. Res. 2010, 126, e365–e378. [Google Scholar] [CrossRef] [PubMed]
- Leadley, R.J. Coagulation factor Xa inhibition: Biological background and rationale. Curr. Top Med. Chem. 2001, 1, 151–159. [Google Scholar] [CrossRef]
- Gong, P.Y.; Guo, Y.J.; Tian, Y.S.; Gu, L.F.; Qi, J.; Yu, B.Y. Reverse tracing anti-thrombotic active ingredients from dried Rehmannia Radix based on multidimensional spectrum-effect relationship analysis of steaming and drying for nine cycles. J. Ethnopharmacol. 2021, 10, 114177. [Google Scholar] [CrossRef] [PubMed]
- Yang, Y.Y.; Wu, Z.Y.; Zhang, H.; Yin, S.J.; Xia, F.B.; Zhang, Q.; Wan, J.B.; Gao, J.L.; Yang, F.Q. LC-MS-based multivariate statistical analysis for the screening of potential thrombin/factor Xa inhibitors from Radix Salvia Miltiorrhiza. Chin Med. 2020, 15, 38. [Google Scholar] [CrossRef] [Green Version]
- Liss, D.B.; Mullins, M.E. Antithrombotic and antiplatelet drug toxicity. Crit. Care Clin. 2021, 37, 591–604. [Google Scholar] [CrossRef] [PubMed]
- Ding, Y.; Li, X.; Zhou, M.; Cai, L.; Tang, H.; Xie, T.; Shi, Z.; Fu, W. Factor Xa inhibitor rivaroxaban suppresses experimental abdominal aortic aneurysm progression via attenuating aortic inflammation. Vascul. Pharmacol. 2021, 136, 106818. [Google Scholar] [CrossRef] [PubMed]
- Fawaz, B.; Candelario, N.M.; Rochet, N.; Tran, C.; Brau, C. Warfarin-induced skin necrosis following heparin-induced thrombocytopenia. Baylor Univ. Med. Center Proc. 2016, 29, 60–61. [Google Scholar] [CrossRef] [Green Version]
- Wu, Z.Y.; Zhang, H.; Yang, Y.Y.; Yang, F.Q. An online dual-enzyme co-immobilized microreactor based on capillary electrophoresis for enzyme kinetics assays and screening of dual-target inhibitors against thrombin and factor Xa. J. Chromatogr. A. 2020, 1619, 460948. [Google Scholar] [CrossRef]
- Chen, C.; Wang, F.Q.; Xiao, W.; Xia, Z.N.; Hu, G.; Wan, J.B.; Yang, F.Q. Effect on platelet aggregation activity: Extracts from 31 Traditional Chinese Medicines with the property of activating blood and resolving stasis. J. Tradit. Chin. Med. 2017, 37, 64–75. [Google Scholar] [CrossRef]
- Li, Z.M.; Xu, S.W.; Liu, P.Q. Salvia miltiorrhizaBurge (Danshen): A golden herbal medicine in cardiovascular therapeutics. Acta. Pharmacol. Sin. 2018, 39, 802–824. [Google Scholar] [CrossRef] [Green Version]
- Chen, W.; Wang, N.; Li, R.C.; Xu, G.F.; Bao, G.; Jiang, H.T.; Wang, M.D. Salvianolic acid B renders glioma cells more sensitive to radiation via Fis-1-mediated mitochondrial dysfunction. Biomed. Pharmacother. 2018, 107, 1230–1236. [Google Scholar] [CrossRef] [PubMed]
- Chen, Z.; Zhang, C.; Gao, F.; Fu, Q.; Fu, C.; He, Y.; Zhang, J. A systematic review on the rhizome of Ligusticum chuanxiong Hort. (Chuanxiong). Food Chem. Toxicol. 2018, 119, 309–325. [Google Scholar] [CrossRef]
- Zuo, H.L.; Linghu, K.G.; Wang, Y.L.; Liu, K.M.; Gao, Y.; Yu, H.; Yang, F.Q.; Hu, Y.J. Interactions of antithrombotic herbal medicines with Western cardiovascular drugs. Pharmacol. Res. 2020, 159, 104963. [Google Scholar] [CrossRef] [PubMed]
- Chang, Y.; Zhang, D.; Yang, G.; Zheng, Y.; Guo, L. Screening of anti-lipase components of artemisia argyi leaves based on spectrum-effect relationships and HPLC-MS/MS. Front. Pharmacol. 2021, 7, 675396. [Google Scholar] [CrossRef] [PubMed]
- Wu, P.; Dong, X.; Song, G.Q.; Wei, M.M.; Fang, C.; Zheng, F.B.; Zhao, Y.J.; Lu, H.Q.; Cheng, L.H.; Zhou, J.L.; et al. Bioactivity-guided discovery of quality control markers in rhizomes of Curcuma wenyujin based on spectrum-effect relationship against human lung cancer cells. Phytomedicine 2021, 86, 153559. [Google Scholar] [CrossRef]
- Wang, Y.L.; Hu, G.; Zhang, Q.; Yang, Y.X.; Li, Q.Q.; Hu, Y.J.; Chen, H.; Yang, F.Q. Screening and characterizing tyrosinase inhibitors from Salvia miltiorrhiza and Carthamus tinctorius by spectrum-effect relationship analysis and molecular docking. J. Anal. Methods Chem. 2018, 9, 2141389. [Google Scholar] [CrossRef]
- Han, J.H.; Tan, H.; Duan, Y.J.; Chen, Y.L.; Zhu, Y.; Zhao, B.C.; Wang, Y.; Yang, X.X. The cardioprotective properties and the involved mechanisms of NaoXinTong capsule. Pharmacol. Res. 2019, 141, 409–417. [Google Scholar] [CrossRef]
- Wang, Y.L.; Zhang, Q.; Yin, S.J.; Cai, L.; Yang, Y.X.; Liu, W.; Hu, Y.J.; Chen, H.; Yang, F.Q. Screening of blood-activating active components from Danshen-Honghua herbal pair by spectrum-effect relationship analysis. Phytomedicine 2019, 54, 149–158. [Google Scholar] [CrossRef] [PubMed]
- Zhang, X.L.; Liu, L.F.; Zhu, L.Y.; Bai, Y.J.; Mao, Q.; Li, S.L.; Chen, S.L.; Xu, H.X. A high performance liquid chromatography fingerprinting and ultra high performance liquid chromatography coupled with quadrupole time-of-flight mass spectrometry chemical profiling approach to rapidly find characteristic chemical markers for quality evaluation of dispensing granules, a case study on Chuanxiong Rhizoma. J. Pharm. Biomed. Anal. 2014, 88, 391–400. [Google Scholar] [CrossRef] [PubMed]
- Liang, W.Y.; Chen, W.J.; Wu, L.F.; Li, S.; Qi, Q.; Cui, Y.P.; Liang, L.J.; Ye, T.; Zhang, L.Z. Quality Evaluation and chemical markers screening of Salvia miltiorrhiza Bge. (Danshen) based on HPLC fingerprints and HPLC-MSn coupled with chemometrics. Molecules 2017, 2, 478. [Google Scholar] [CrossRef] [PubMed] [Green Version]
- Yang, M.; Liu, A.; Guan, S.; Sun, J.; Xu, M.; Guo, D. Characterization of tanshinones in the roots of Salvia miltiorrhiza (Dan-shen) by high-performance liquid chromatography with electrospray ionization tandem mass spectrometry. Rapid Commun. Mass Spectrom. 2006, 20, 1266–1280. [Google Scholar] [CrossRef] [PubMed]


| Peak | 1 | 2 | 3 | 4 | 5 | 6 | 7 | 8 | 9 | 10 | 11 | 12 | 13 | 14 | 15 |
| THR | −0.598 | 0.727 * | 0.715 * | 0.831 ** | −0.453 | 0.723 * | 0.709 * | −0.734 * | −0.442 | 0.761 * | −0.356 | −0.338 | 0.580 | 0.578 | 0.695 * |
| FXa | −0.212 | −0.127 | 0.132 | −0.497 | 0.628 * | 0.175 | 0.278 | 0.359 | 0.750 * | −0.112 | 0.149 | 0.093 | 0.205 | −0.566 | −0.242 |
| Peak | 16 | 17 | 18 | 19 | 20 | 21 | 22 | 23 | 24 | 25 | 26 | 27 | 28 | 29 | 30 |
| THR | 0.769 * | 0.826 ** | 0.750 * | 0.449 | 0.679 * | 0.758 * | 0.743 * | 0.645 * | 0.812 ** | 0.747 * | 0.690 * | 0.756 * | 0.779 * | 0.694 * | 0.574 |
| FXa | −0.245 | −0.195 | −0.394 | −0.265 | −0.294 | −0.264 | −0.126 | −0.310 | −0.142 | −0.111 | −0.082 | −0.292 | −0.226 | −0.119 | 0.218 |
| Peak | 31 | 32 | 33 | 34 | 35 | 36 | 37 | 38 | 39 | 40 | 41 | 42 | 43 | 44 | 45 |
| THR | −0.484 | 0.749 * | 0.697 * | 0.712 * | 0.685 * | 0.346 | 0.766 * | −0.570 | −0.549 | −0.400 | 0.455 | −0.563 | −0.420 | −0.515 | −0.375 |
| FXa | 0.173 | −0.219 | −0.119 | −0.141 | −0.102 | −0.326 | −0.346 | 0.092 | −0.030 | −0.289 | −0.083 | 0.078 | 0.231 | 0.104 | 0.018 |
| Peak | 46 | 47 | 48 | 49 | 50 | 51 | 52 | 53 | 54 | 55 | 56 | 57 | 58 | 59 | 60 |
| THR | 0.520 | 0.410 | 0.723 * | −0.560 | 0.724 * | 0.460 | −0.511 | 0.701 * | 0.635 * | 0.877 ** | 0.793 * | 0.722 * | 0.343 | −0.326 | 0.301 |
| FXa | 0.077 | −0.182 | −0.127 | 0.131 | 0.181 | 0.106 | 0.455 | −0.122 | 0.051 | −0.369 | −0.309 | −0.284 | 0.300 | 0.169 | 0.249 |
| Peak | 61 | 62 | 63 | 64 | 65 | 66 | 67 | 68 | 69 | 70 | 71 | ||||
| THR | 0.862 ** | 0.912 * | 0.482 | −0.170 | −0.550 | −0.500 | −0.781 * | −0.463 | 0.265 | 0.422 | −0.597 | ||||
| FXa | −0.626 * | −0.310 | 0.213 | 0.364 | 0.138 | 0.045 | 0.867 ** | 0.156 | 0.410 | −0.016 | 0.703 * |
| Peak No. | tR (min) | MW | MS1 (m/z) | MS2 (m/z) | Formula | Identification |
|---|---|---|---|---|---|---|
| 4 | 3.599 | 354 | 353.18 | 191.06;179.06;135.03 | C16H18O9 | Chlorogenic acid |
| 5 | 4.178 | 180 | 179.06 | 135.03 | C9H8O4 | Caffeic acid |
| 9 | 6.768 | 194 | 193.05 | 149.01 | C10H10O4 | Ferulic acid |
| 17 | 11.698 | 192 | 191.07 | 173.02 | C12H14O2 | Z-ligustilide |
| 24 | 17.217 | 382 | 381.03 | 191.07 | - | Unknown |
| 55 | 50.687 | - | - | - | - | Unknown |
| 61 | 57.766 | 312 | 311.24 | 265.16 | C18H16O5 | Tanshindiol B |
| 62 | 58.527 | 340 | 339.22 | 261.13 | C20H20O5 | Methyl dihydronortanshinonate |
| 67 | 64.584 | 278 | 277.23 | 248.99 | C18H12O3 | Tanshinone I |
| 71 | 69.298 | 294 | 293.23 | 277.23; 248.99 | C19H18O3 | Tanshinone IIA |
| Compounds | Binding Energy (kcal/mol) | Hydrogen Bond | Van der Waals Forces | Electrostatic Interaction and Other Forces |
|---|---|---|---|---|
| Chlorogenic acid | −5.81 | - | GLY219, CYS191, ASP194, HIS57, GLU192, TRP215 | ALA190, CYS220, SER214, LYS224 |
| Z-ligustilide | −6.44 | SER214, GLY226 | GLU192, ASP194, VAL213, TYR228, SER214, CYS220 | LYS224, ARG221A, ASP189 |
| Compounds | Binding Energy (kcal/mol) | Hydrogen Bond | Van der Waals Forces | Electrostatic Interaction and Other Forces |
|---|---|---|---|---|
| Caffeic acid | −5.82 | - | SER214, ASP194, ILE227, GLY216, ASP189 | VAL213, TRP215, CYS191, CYS220 |
| Ferulic acid | −6.35 | - | ILE227, GLY226, GLY216, GLY219, TYR99, ILE227, | ALA190, VAL213, TYR228, HIS57, TRP215 |
| Tanshinone I | −7.87 | SER214, GLY219 | HIS57, SER214, GLN192, TYR99, GLY216, GLY219 | CYS191, CYS220, TRP215, ALA190, VAL213 |
| Tanshinone IIA | −7.44 | GLY219, GLN192 | LYS96, PHE174, THR98, MET180 | TRP215, TYR99, GLU97 |
Publisher’s Note: MDPI stays neutral with regard to jurisdictional claims in published maps and institutional affiliations. |
© 2021 by the authors. Licensee MDPI, Basel, Switzerland. This article is an open access article distributed under the terms and conditions of the Creative Commons Attribution (CC BY) license (https://creativecommons.org/licenses/by/4.0/).
Share and Cite
Wang, X.; Zhang, D.-Y.; Yin, S.-J.; Jiang, H.; Lu, M.; Yang, F.-Q.; Hu, Y.-J. Screening of Potential Thrombin and Factor Xa Inhibitors from the Danshen–Chuanxiong Herbal Pair through a Spectrum–Effect Relationship Analysis. Molecules 2021, 26, 7293. https://0-doi-org.brum.beds.ac.uk/10.3390/molecules26237293
Wang X, Zhang D-Y, Yin S-J, Jiang H, Lu M, Yang F-Q, Hu Y-J. Screening of Potential Thrombin and Factor Xa Inhibitors from the Danshen–Chuanxiong Herbal Pair through a Spectrum–Effect Relationship Analysis. Molecules. 2021; 26(23):7293. https://0-doi-org.brum.beds.ac.uk/10.3390/molecules26237293
Chicago/Turabian StyleWang, Xu, Dai-Yan Zhang, Shi-Jun Yin, Hui Jiang, Min Lu, Feng-Qing Yang, and Yuan-Jia Hu. 2021. "Screening of Potential Thrombin and Factor Xa Inhibitors from the Danshen–Chuanxiong Herbal Pair through a Spectrum–Effect Relationship Analysis" Molecules 26, no. 23: 7293. https://0-doi-org.brum.beds.ac.uk/10.3390/molecules26237293