
Proteomics Approach of Rapamycin Anti-Tumoral Effect on Primary and Metastatic Canine Mammary Tumor Cells In Vitro

 ,
, 
 and
and
Abstract
:
1. Introduction
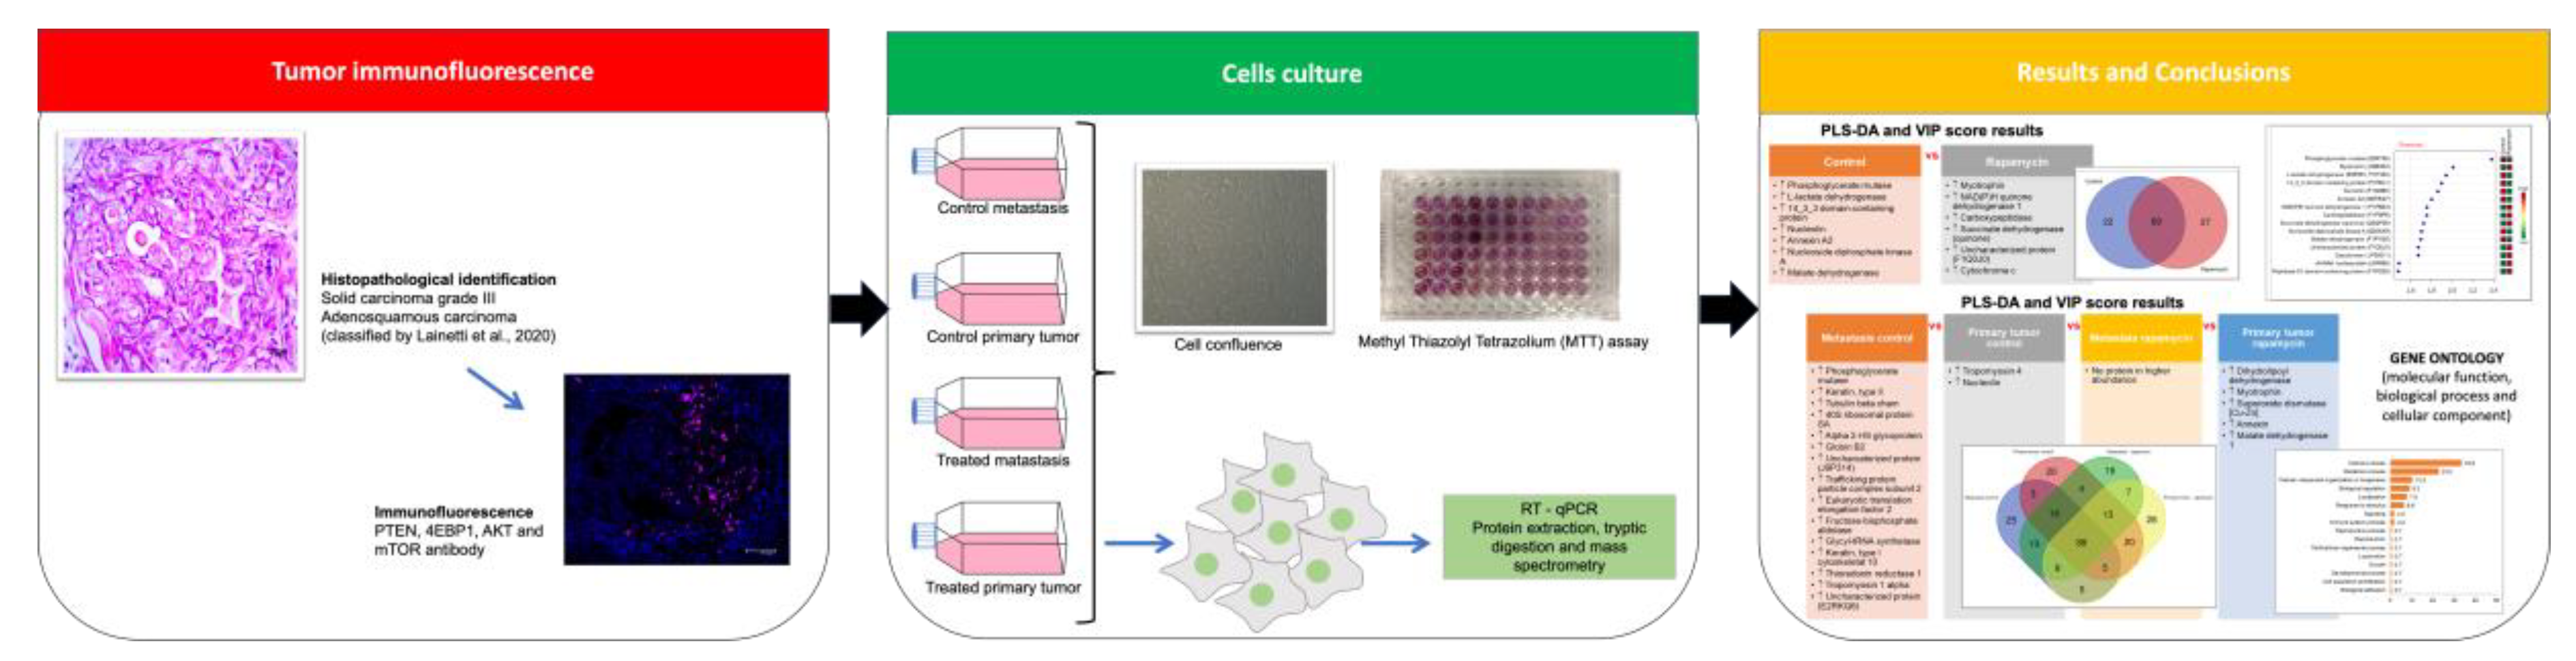
2. Results
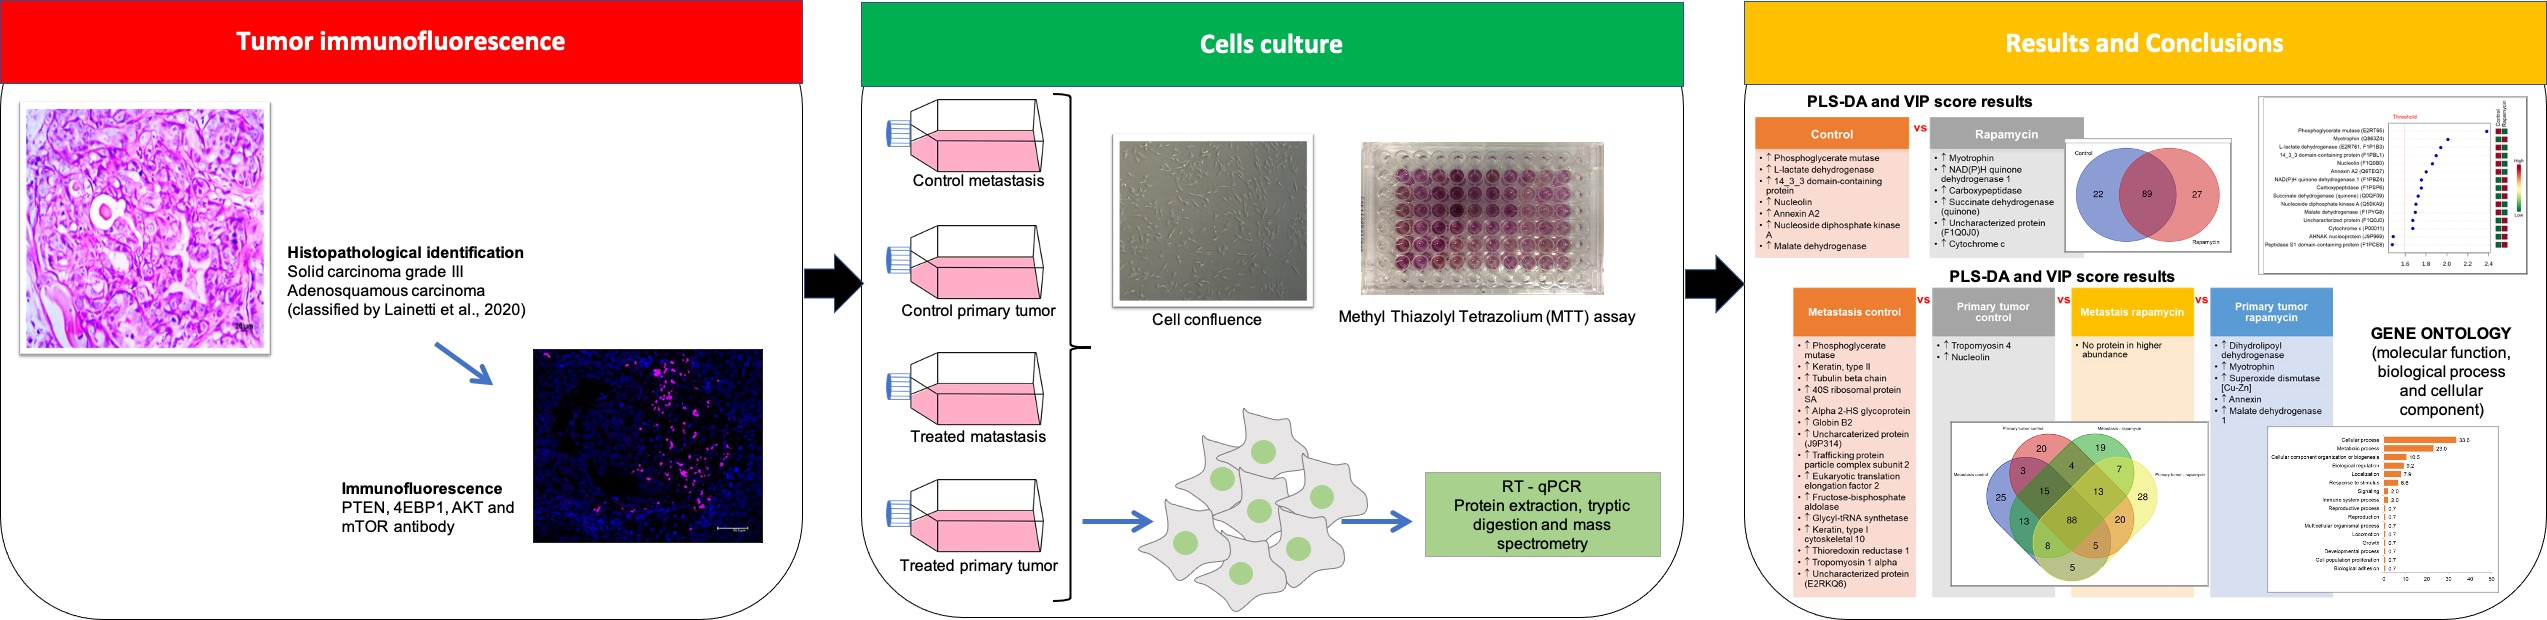
2.1. Mammary Carcinoma Tissue
2.2. Cell Culture
2.2.1. Cellular Metabolic Activity Evaluation
2.2.2. RT-qPCR
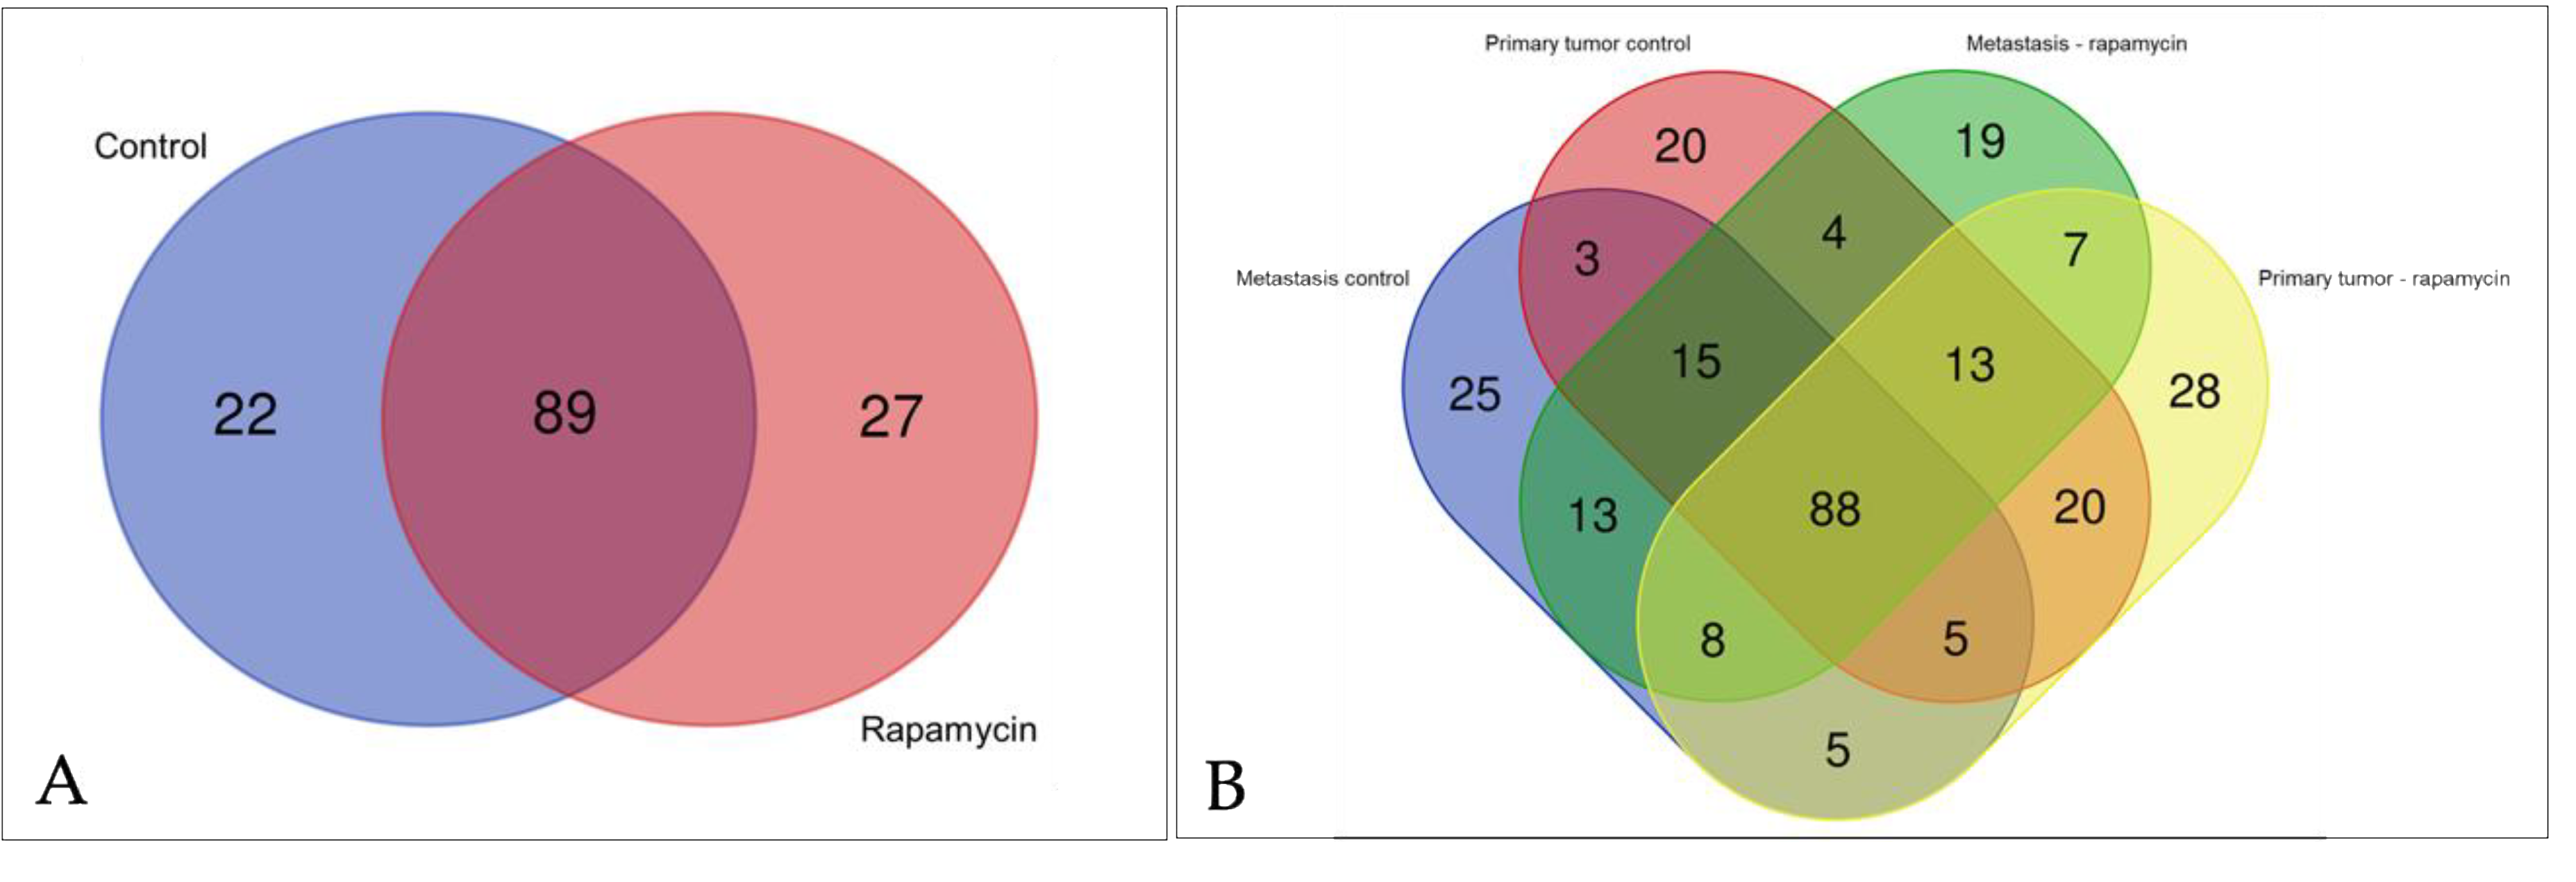
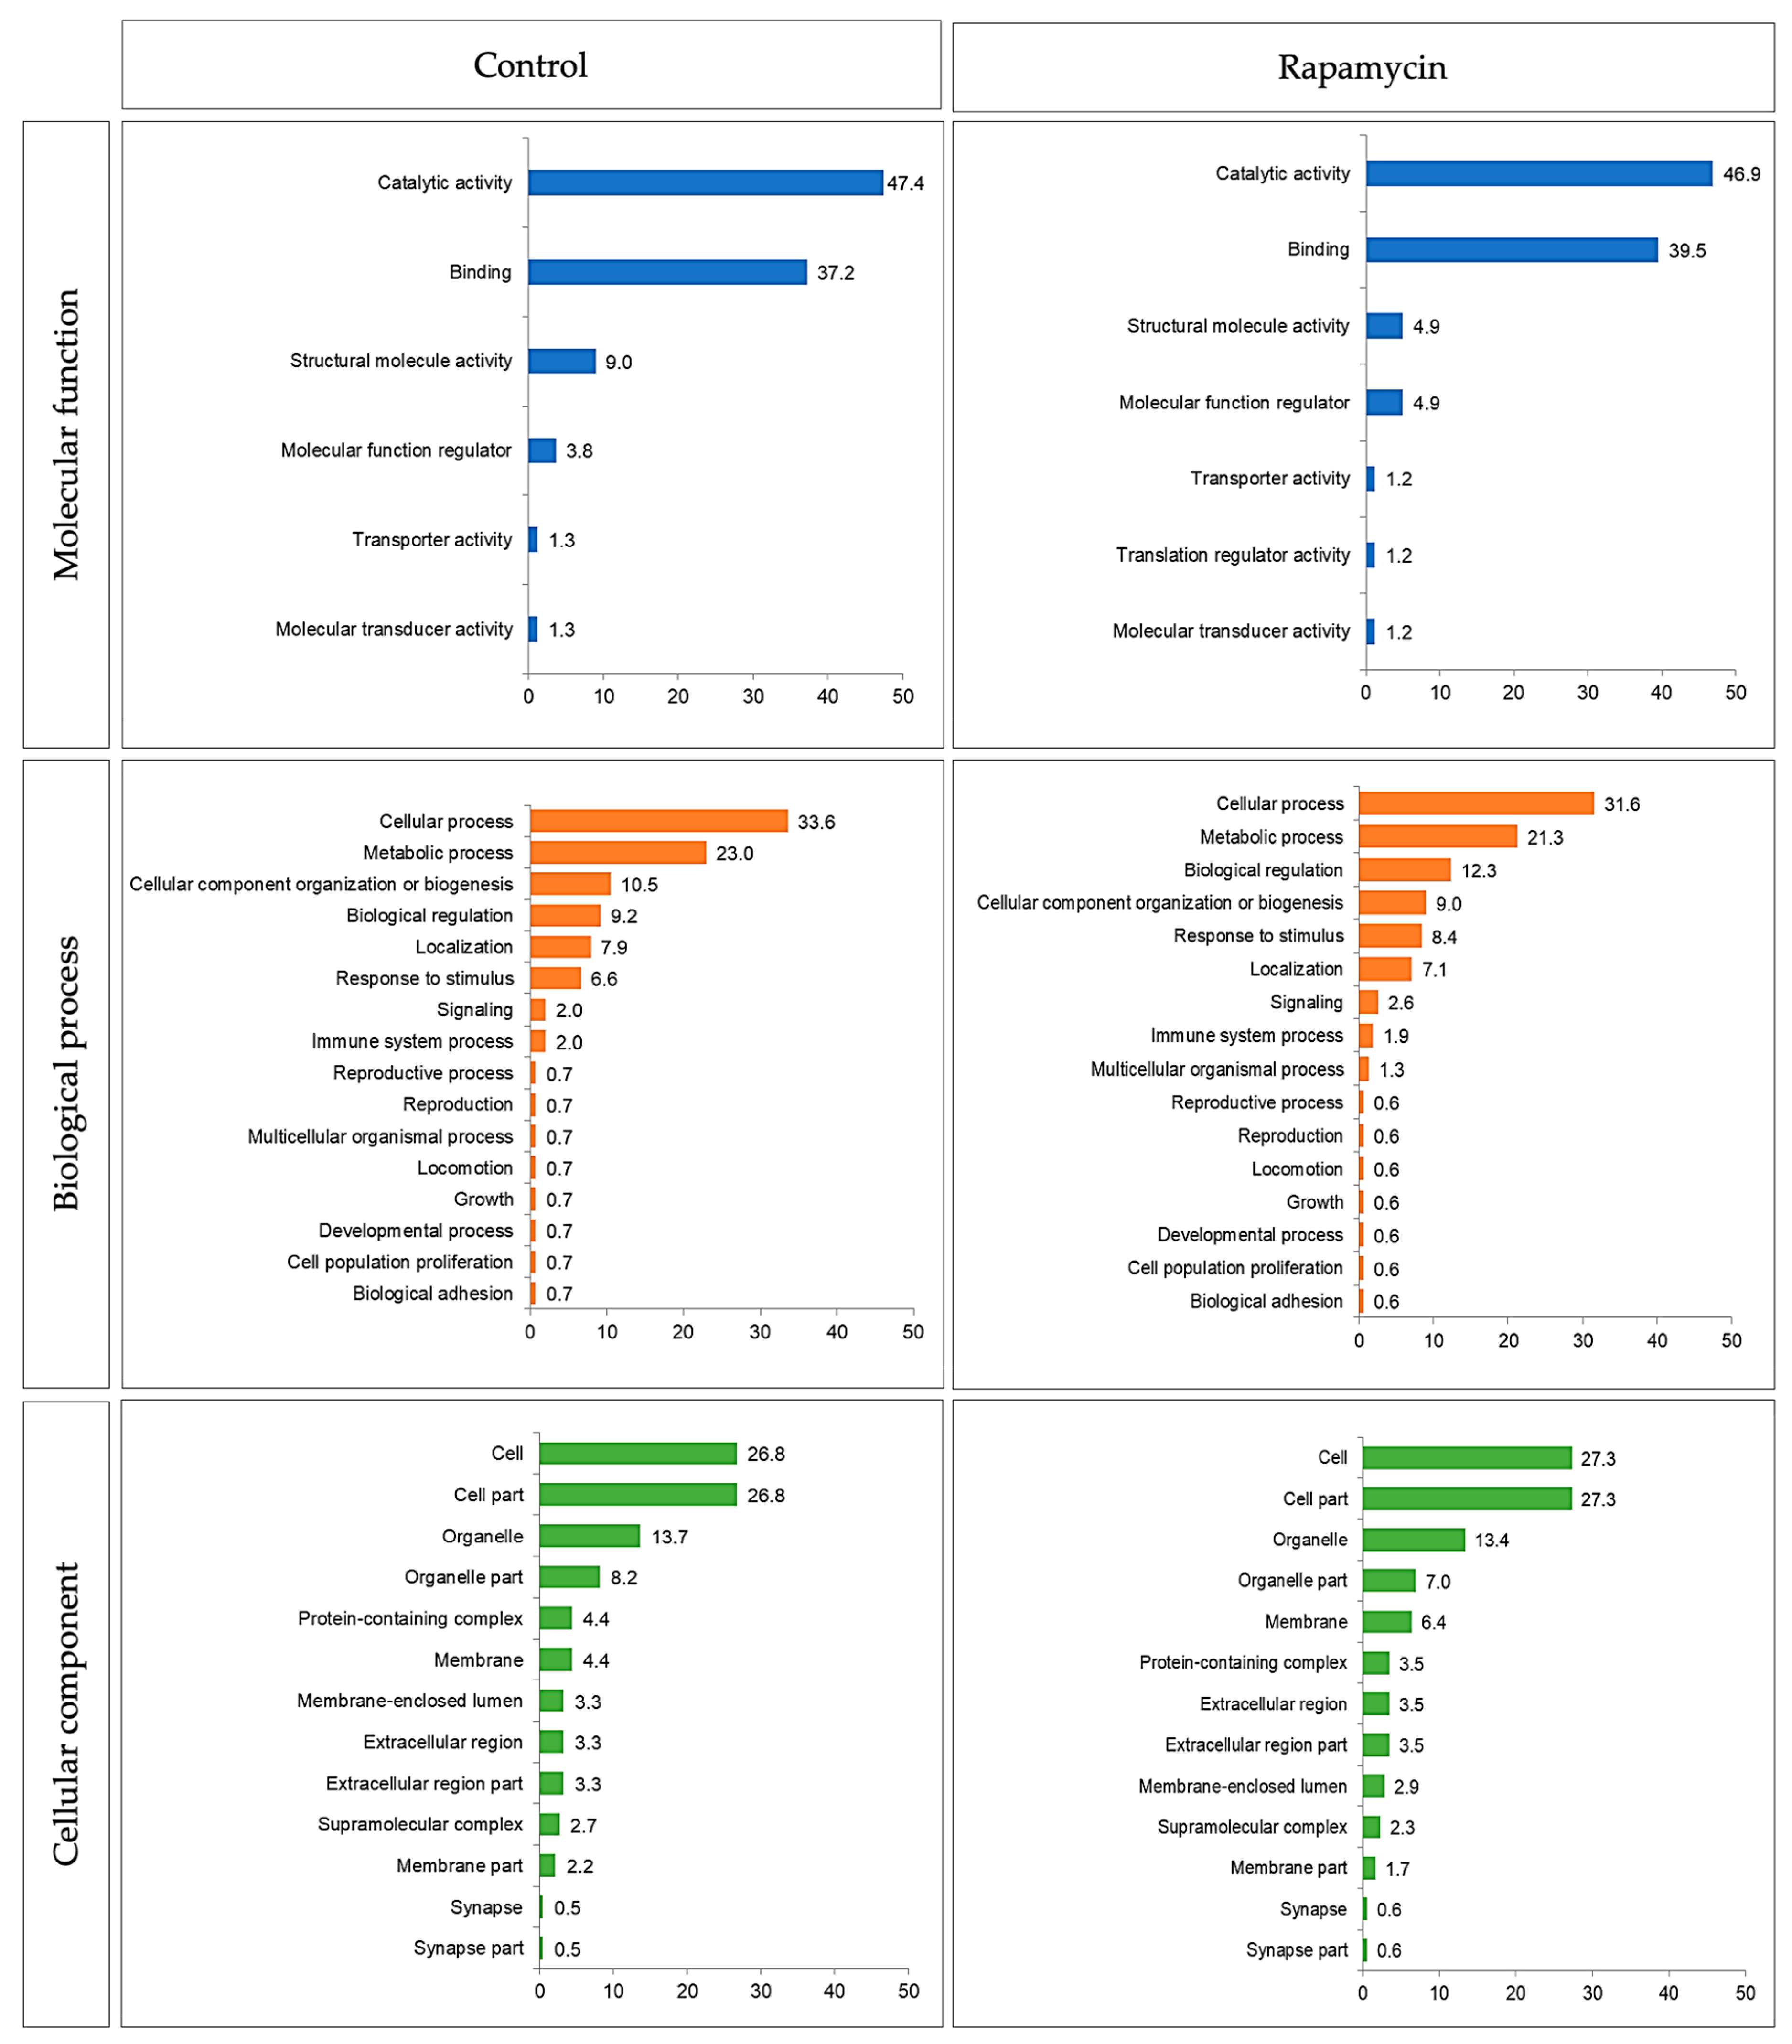
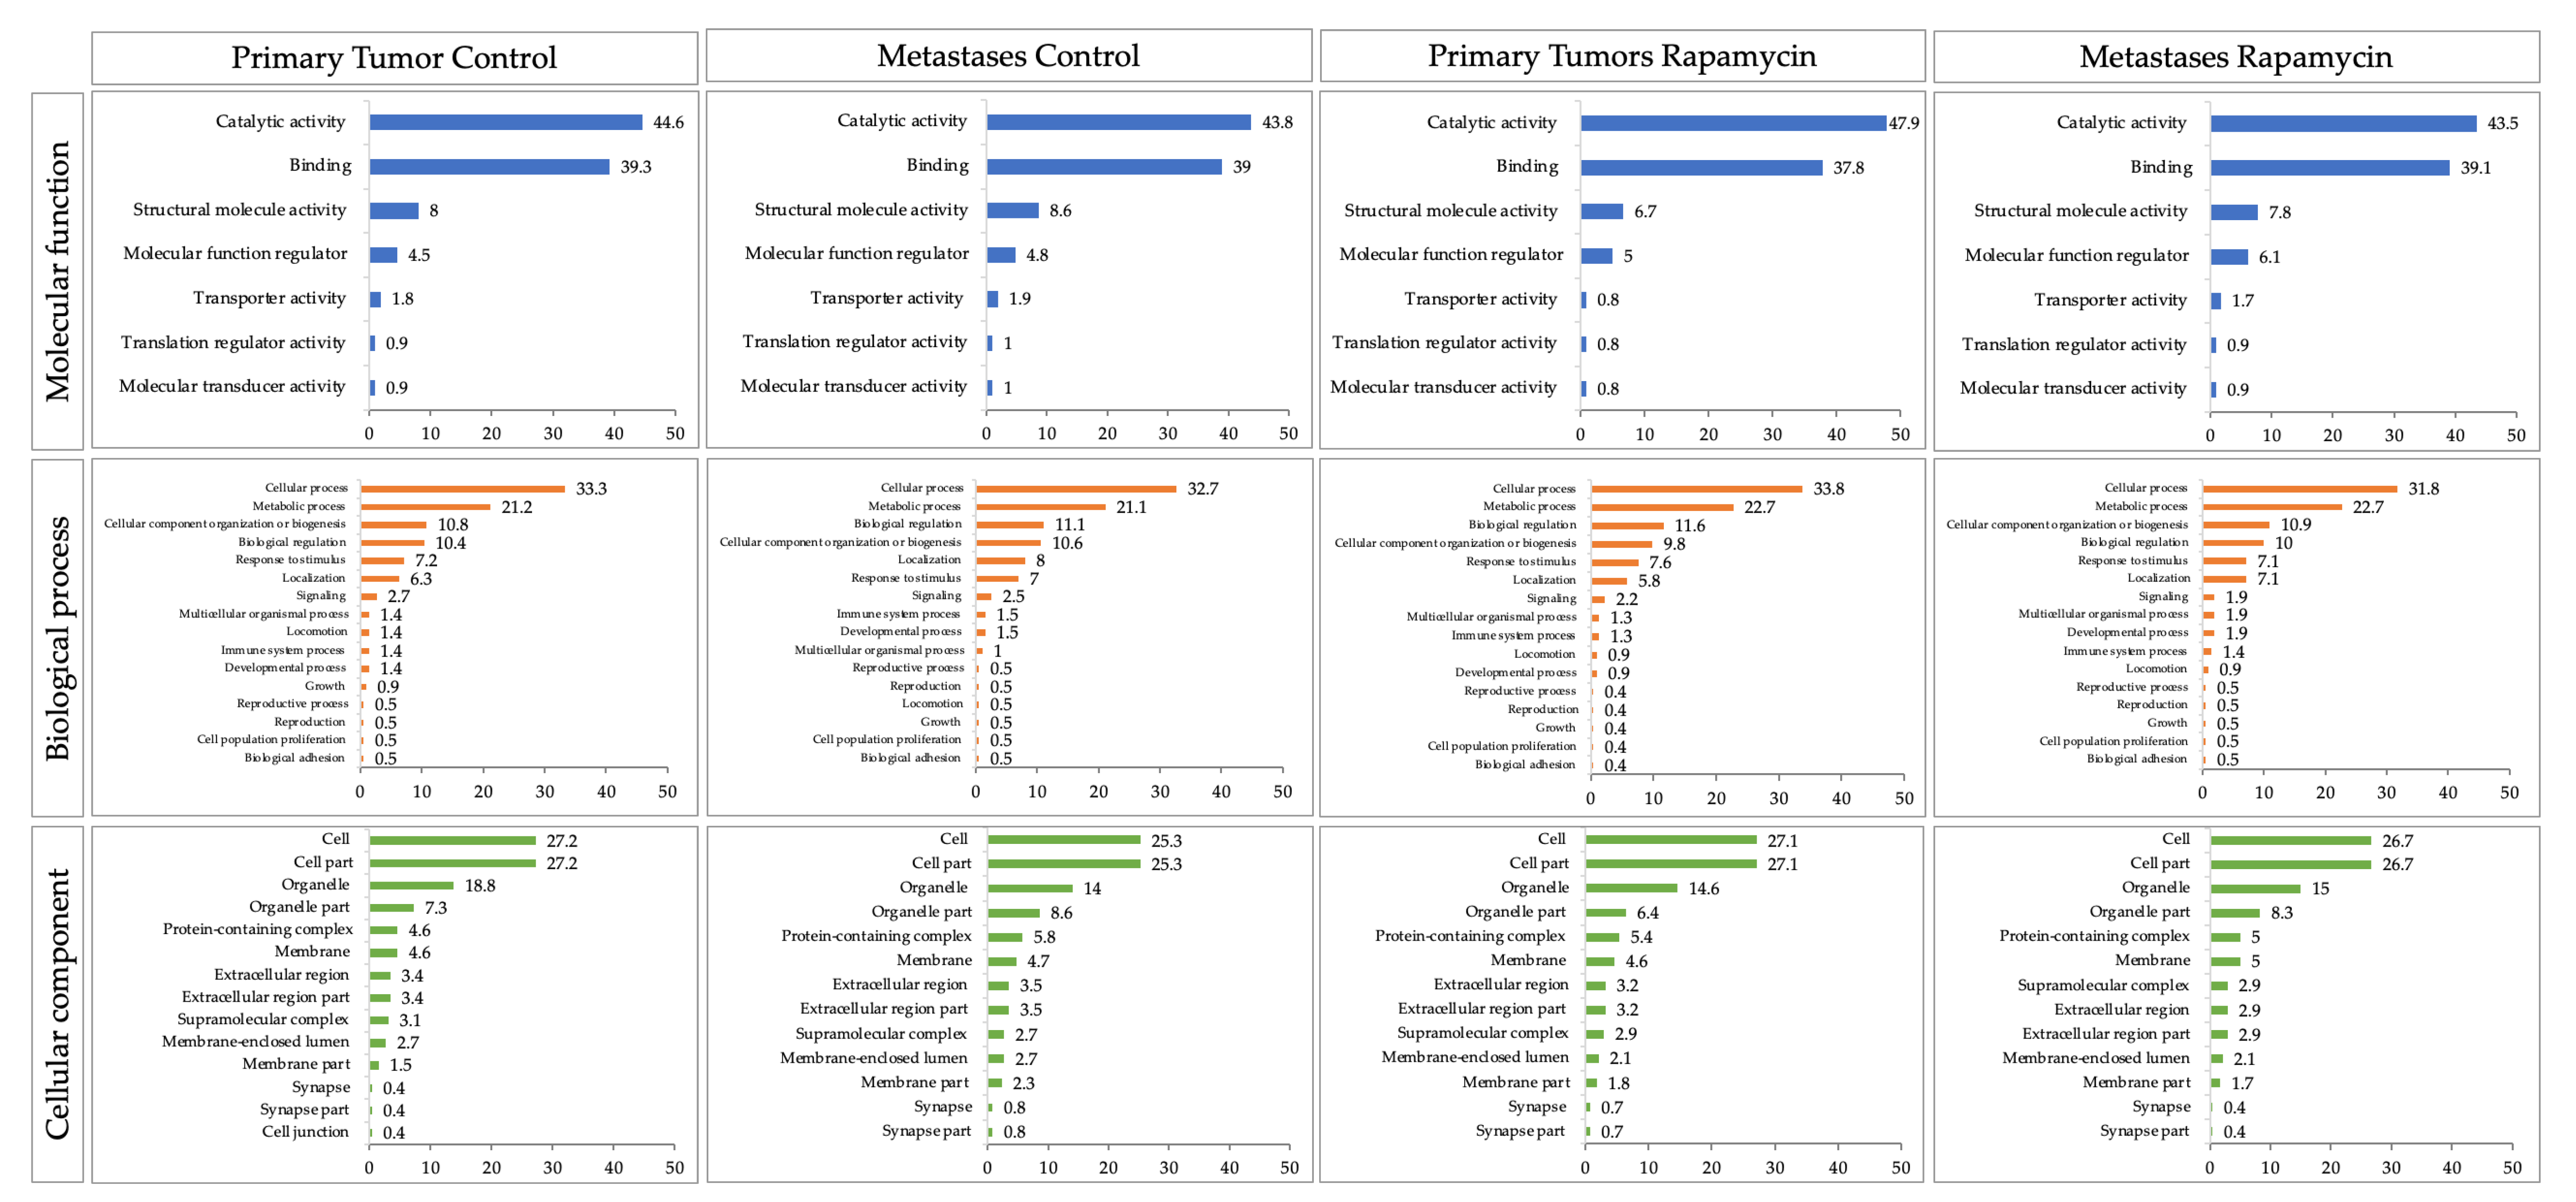
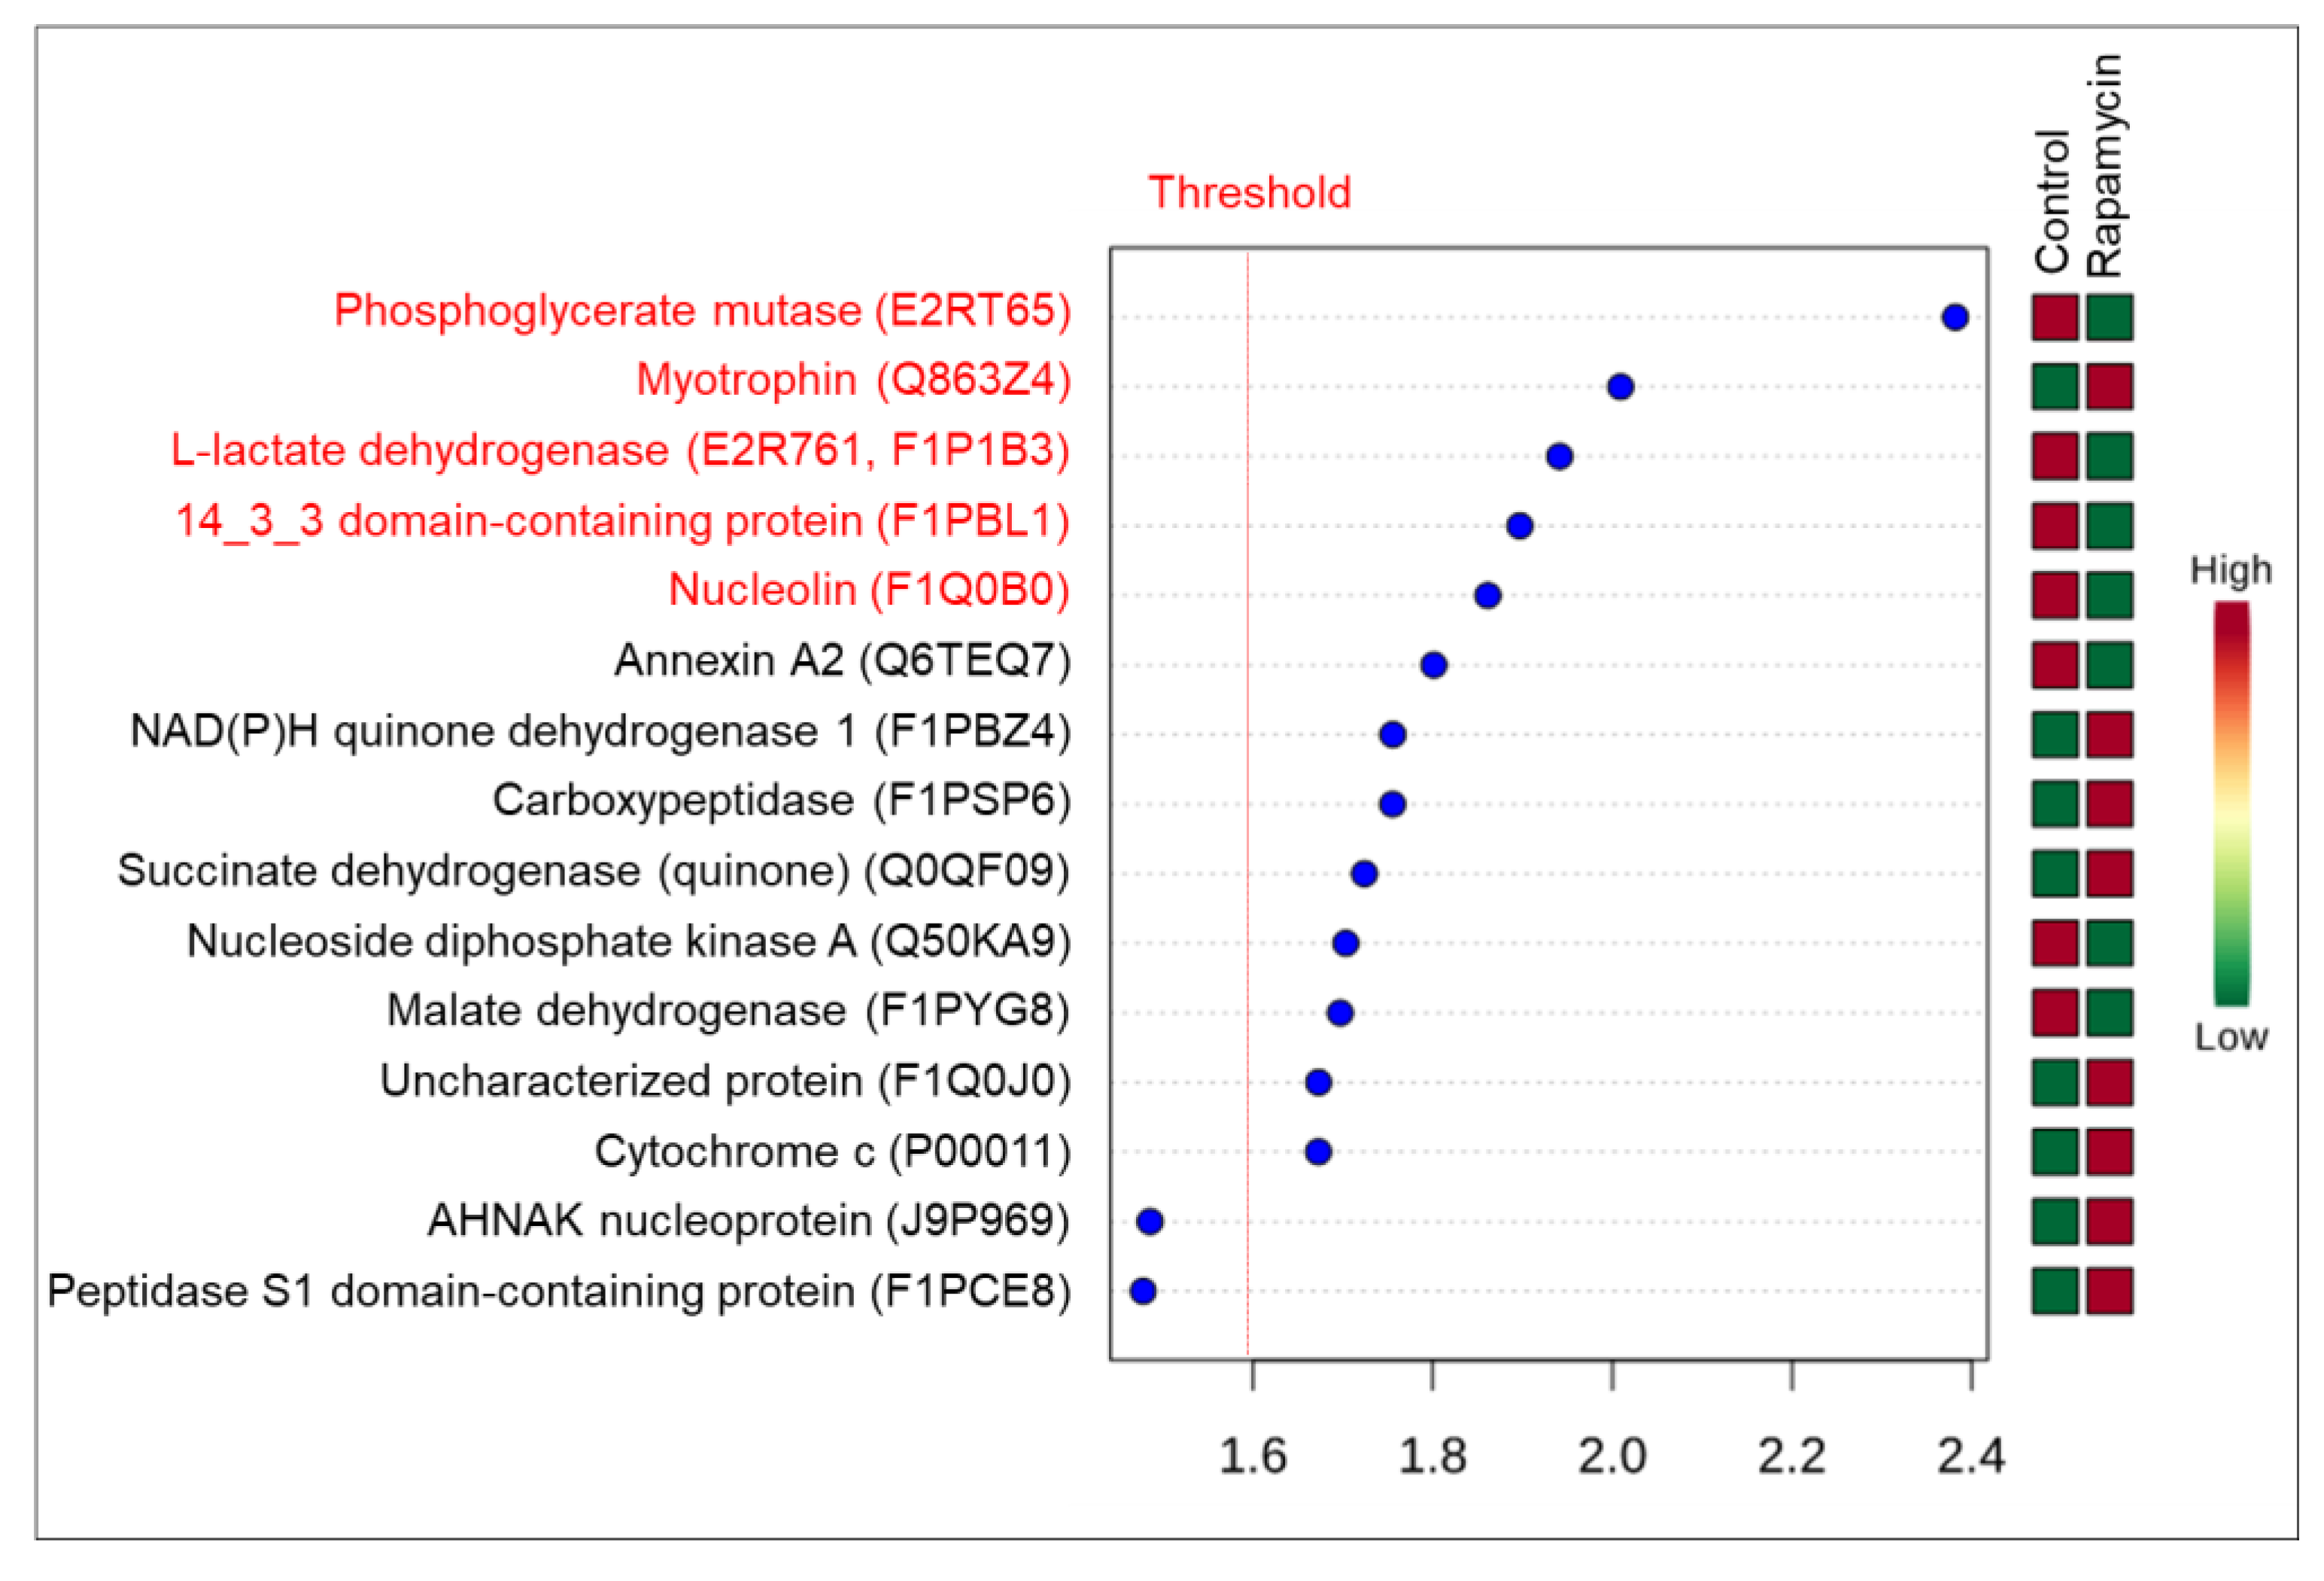
2.2.3. Proteomics
3. Discussion
4. Materials and Methods
4.1. Ethics Committee
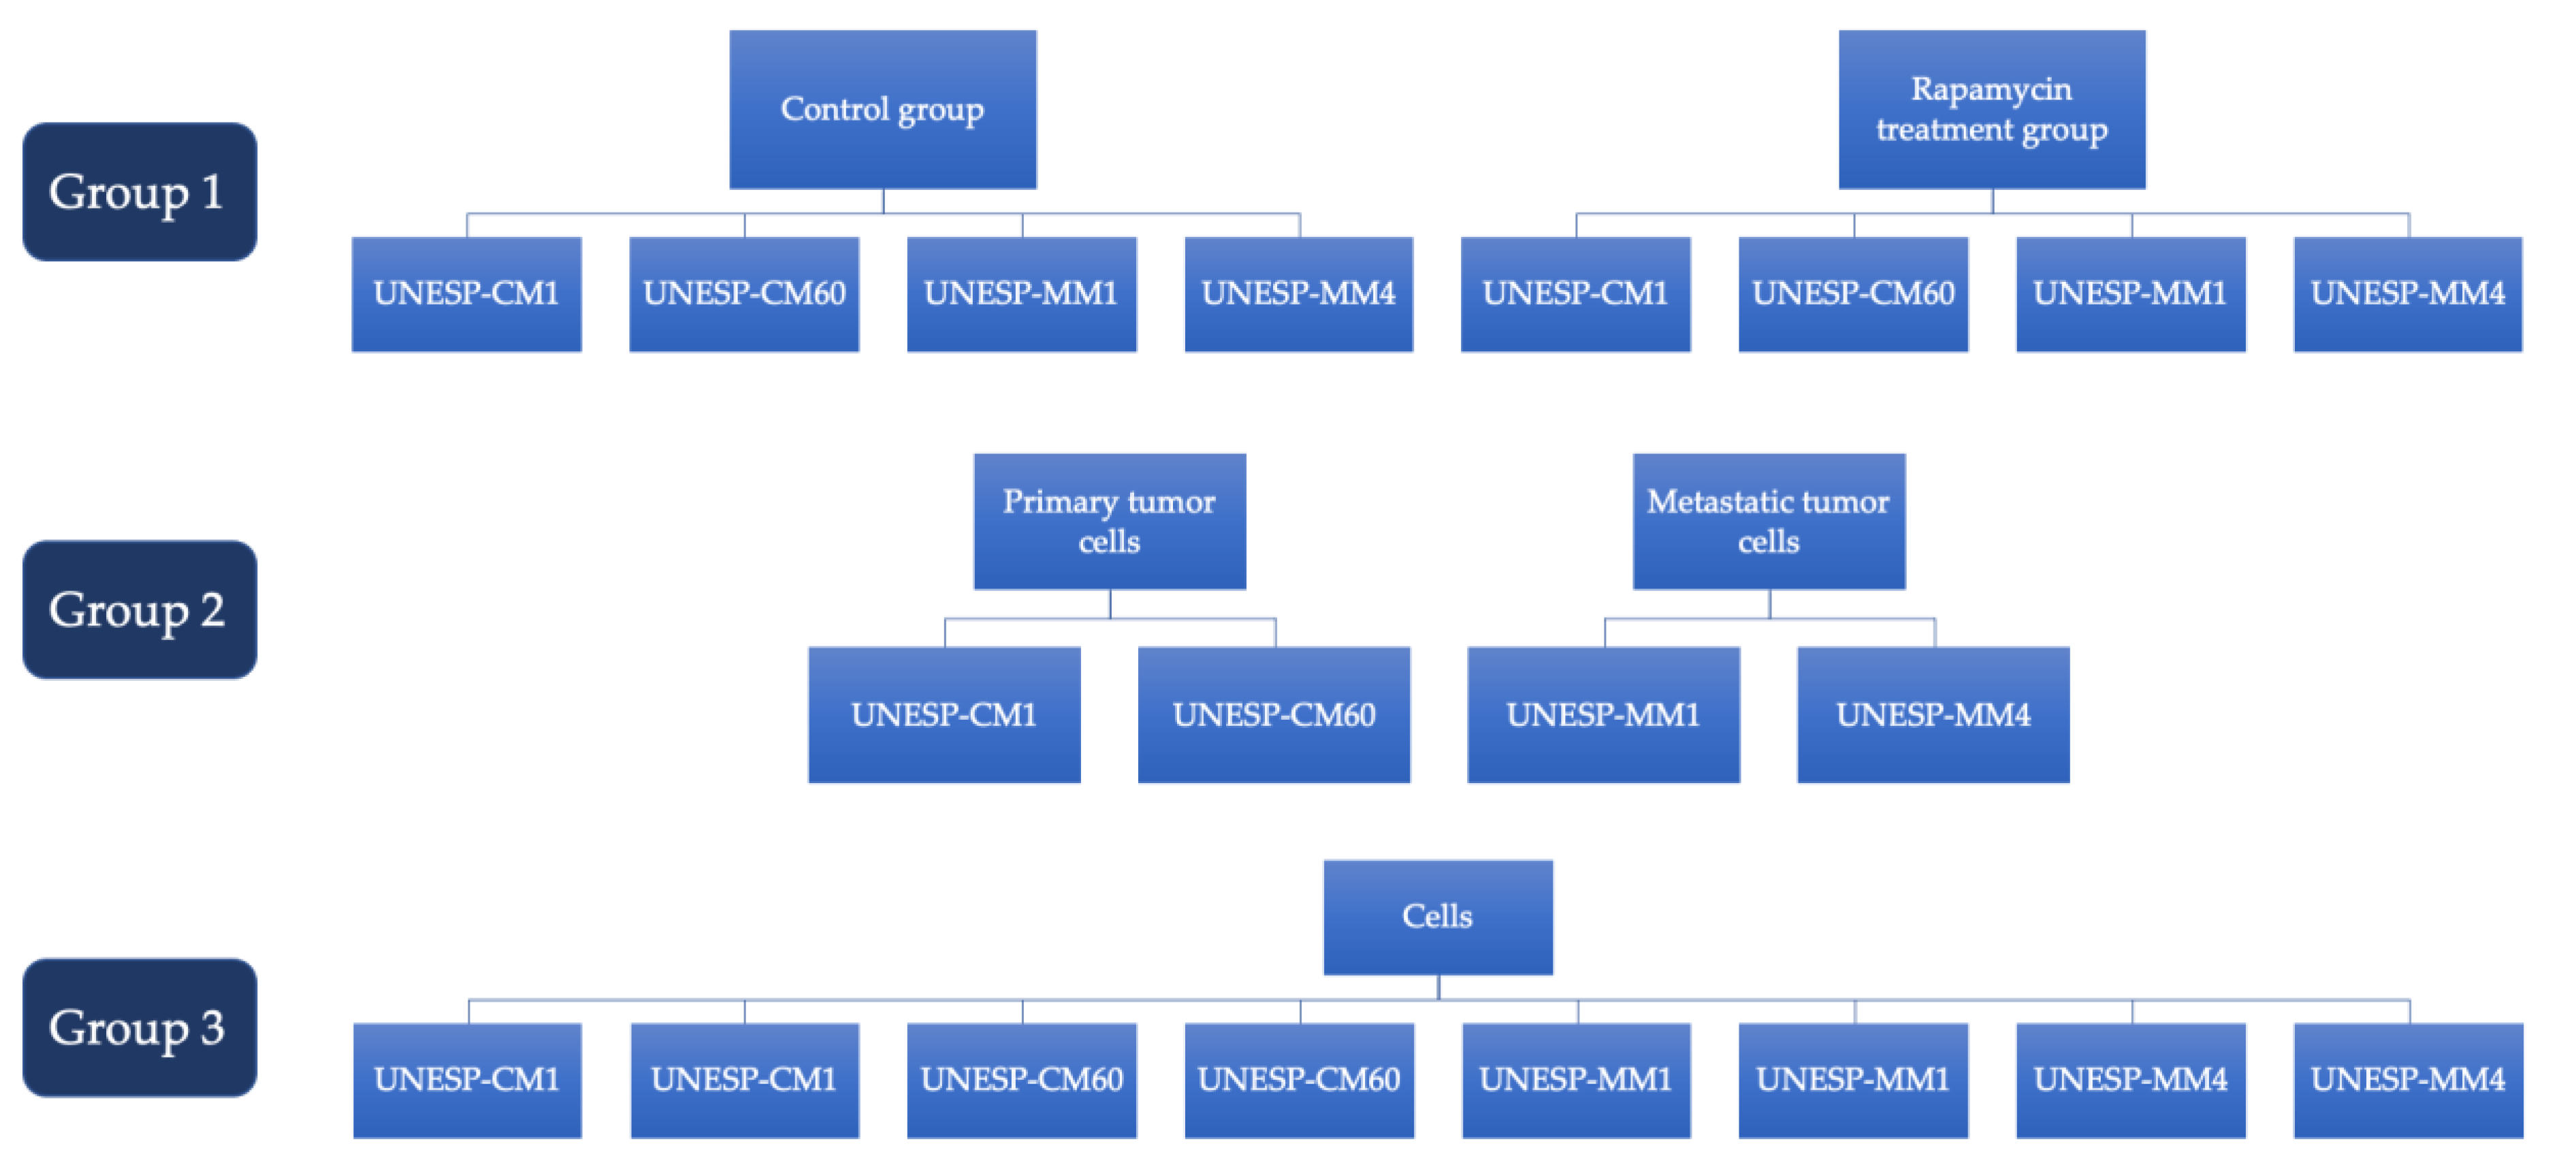
4.2. Experimental Design
4.3. Mammary Carcinoma Samples, Histological and Immunohistochemical Analysis
4.4. Immunofluorescence of Tumor Tissue
4.5. Cell Culture
4.6. Rapamycin Treatment and Assessment of Cellular Metabolic Activity
4.7. RT-qPCR
4.8. Proteomics
4.9. Statistical Analysis
4.9.1. Immunofluorescence of Tumor Tissue
4.9.2. Cellular Metabolic Activity (MTT) and RT-qPCR
4.9.3. Proteomics
4.10. Data Availability
5. Conclusions
Supplementary Materials
Author Contributions
Funding
Institutional Review Board Statement
Informed Consent Statement
Data Availability Statement
Acknowledgments
Conflicts of Interest
Sample Availability
References
- Sorenmo, K. Canine mammary gland tumors. Vet. Clin. N. Am. Small Anim. Pract. 2003, 33, 573–596. [Google Scholar] [CrossRef]
- Sleeckx, N.; de Rooster, H.; Veldhuis Kroeze, E.J.; Van Ginneken, C.; Van Brantegem, L. Canine mammary tumours, an overview. Reprod. Domest. Anim. 2011, 46, 1112–1131. [Google Scholar] [CrossRef]
- Rasotto, R.; Berlato, D.; Goldschmidt, M.H.; Zappulli, V. Prognostic Significance of Canine Mammary Tumor Histologic Subtypes: An Observational Cohort Study of 229 Cases. Vet. Pathol. 2017, 54, 571–578. [Google Scholar] [CrossRef] [PubMed]
- Cassali, G.D.; Damasceno, K.A.; Bertagnolli, A.C.; Estrela-Lima, A.; Lavalle, G.E.; Di Santis, G.W.; De Nardi, A.B.; Fernandes, C.G.; Cogliati, B.; Sobral, R.; et al. Consensus regarding the diagnosis, prognosis and treatment of canine mammary tumors: Benign mixed tumors, carcinomas in mixed tumors and carcinosarcomas. Braz. J. Vet. Pathol. 2017, 10, 87–99. [Google Scholar] [CrossRef]
- Cassali, G.D.; Jark, P.C.; Gamba, C.; Damasceno, K.A.; Estrela-Lima, A.; De nradi, A.B.; Ferreria, E.; Horta, R.S.; Firmo, B.F.; Sueiro, F.A.R.; et al. Consensus Regarding the Diagnosis, Prognosis and Treatment of Canine and Feline Mammary Tumors—2019. Braz. J. Vet. Pathol. 2020, 13, 555–574. [Google Scholar] [CrossRef]
- Merten, O.W. Introduction to animal cell culture technology-past, present and future. Cytotechnology 2006, 50, 1–7. [Google Scholar] [CrossRef] [Green Version]
- Brock, E.J.; Ji, K.; Shah, S.; Mattingly, R.R.; Sloane, B.F. In Vitro Models for Studying Invasive Transitions of Ductal Carcinoma In Situ. J. Mammary Gland Biol. Neoplasia 2019, 24, 1–15. [Google Scholar] [CrossRef]
- van Staveren, W.C.; Solís, D.Y.; Hébrant, A.; Detours, V.; Dumont, J.E.; Maenhaut, C. Human cancer cell lines: Experimental models for cancer cells in situ? For cancer stem cells? Biochim. Biophys. Acta 2009, 1795, 92–103. [Google Scholar] [CrossRef]
- Noh, W.C.; Mondesire, W.H.; Peng, J.; Jian, W.; Zhang, H.; Dong, J.; Mills, G.B.; Hung, M.C.; Meric-Bernstam, F. Determinants of rapamycin sensitivity in breast cancer cells. Clin. Cancer Res. 2004, 10, 1013–1023. [Google Scholar] [CrossRef] [Green Version]
- Foster, D.A.; Toschi, A. Targeting mTOR with rapamycin: One dose does not fit all. Cell Cycle 2009, 8, 1026–1029. [Google Scholar] [CrossRef]
- Phung, T.L.; Eyiah-Mensah, G.; O’Donnell, R.K.; Bieniek, R.; Shechter, S.; Walsh, K.; Kuperwasser, C.; Benjamin, L.E. Endothelial Akt signaling is rate-limiting for rapamycin inhibition of mouse mammary tumor progression. Cancer Res. 2007, 67, 5070–5075. [Google Scholar] [CrossRef] [PubMed] [Green Version]
- Gordon, I.K.; Ye, F.; Kent, M.S. Evaluation of the mammalian target of rapamycin pathway and the effect of rapamycin on target expression and cellular proliferation in osteosarcoma cells from dogs. Am. J. Vet. Res. 2008, 69, 1079–1084. [Google Scholar] [CrossRef] [PubMed]
- Parrales, A.; McDonald, P.; Ottomeyer, M.; Roy, A.; Shoenen, F.J.; Broward, M.; Bruns, T.; Thamm, D.H.; Weir, S.J.; Neville, K.A.; et al. Comparative oncology approach to drug repurposing in osteosarcoma. PLoS ONE 2018, 13, e0194224. [Google Scholar] [CrossRef] [PubMed]
- Li, J.; Kim, S.G.; Blenis, J. Rapamycin: One drug, many effects. Cell Metab. 2014, 19, 373–379. [Google Scholar] [CrossRef] [Green Version]
- Osaki, M.; Oshimura, M.; Ito, H. PI3K-Akt pathway: Its functions and alterations in human cancer. Apoptosis 2004, 9, 667–676. [Google Scholar] [CrossRef]
- Dutra, A.P.; Granja, N.V.; Schmitt, F.C.; Cassali, G.D. c-erbB-2 expression and nuclear pleomorphism in canine mammary tumors. Braz. J. Med. Biol. Res. 2004, 37, 1673–1681. [Google Scholar] [CrossRef] [Green Version]
- Abadie, J.; Nguyen, F.; Loussouarn, D.; Peña, L.; Gama, A.; Rieder, N.; Belousov, A.; Bemelmans, I.; Jaillardon, L.; Ibisch, C.; et al. Canine invasive mammary carcinomas as models of human breast cancer. Part 2: Immunophenotypes and prognostic significance. Breast Cancer Res. Treat. 2018, 167, 459–468. [Google Scholar] [CrossRef]
- Abdelmegeed, S.M.; Mohammed, S. Canine mammary tumors as a model for human disease. Oncol. Lett. 2018, 15, 8195–8205. [Google Scholar] [CrossRef] [Green Version]
- Nguyen, F.; Peña, L.; Ibisch, C.; Loussouarn, D.; Gama, A.; Rieder, N.; Belousov, A.; Campone, M.; Abadie, J. Canine invasive mammary carcinomas as models of human breast cancer. Part 1: Natural history and prognostic factors. Breast Cancer Res. Treat. 2018, 167, 635–648. [Google Scholar] [CrossRef] [Green Version]
- Fragomeni, S.M.; Sciallis, A.; Jeruss, J.S. Molecular Subtypes and Local-Regional Control of Breast Cancer. Surg. Oncol. Clin. N. Am. 2018, 27, 95–120. [Google Scholar] [CrossRef]
- Burrai, G.P.; Tanca, A.; De Miglio, M.R.; Abbondio, M.; Pisanu, S.; Polinas, M.; Pirino, S.; Mohammed, S.I.; Uzzau, S.; Addis, M.F.; et al. Investigation of HER2 expression in canine mammary tumors by antibody-based, transcriptomic and mass spectrometry analysis: Is the dog a suitable animal model for human breast cancer? Tumor Biol. 2015, 36, 9083–9091. [Google Scholar] [CrossRef] [PubMed]
- Yang, Q.; Mori, I.; Sakurai, T.; Yoshimura, G.; Suzuma, T.; Nakamura, Y.; Nakamura, M.; Taniguchi, E.; Tamaki, T.; Umemura, T.; et al. Correlation between nuclear grade and biological prognostic variables in invasive breast cancer. Breast Cancer 2001, 8, 105–110. [Google Scholar] [CrossRef] [PubMed]
- Klopfleisch, R.; Klose, P.; Weise, C.; Bondzio, A.; Multhaup, G.; Einspanier, R.; Gruber, A.D. Proteome of metastatic canine mammary carcinomas: Similarities to and differences from human breast cancer. J. Proteome Res. 2010, 9, 6380–6391. [Google Scholar] [CrossRef] [PubMed]
- Muñoz, J.J.; Drigo, S.A.; Kuasne, H.; Villacis, R.A.; Marchi, F.A.; Domingues, M.A.; Lopes, A.; Santos, T.G.; Rogatto, S.R. A comprehensive characterization of cell cultures and xenografts derived from a human verrucous penile carcinoma. Tumor Biol. 2016, 37, 11375–11384. [Google Scholar] [CrossRef]
- Guba, M.; von Breitenbuch, P.; Steinbauer, M.; Koehl, G.; Flegel, S.; Hornung, M.; Bruns, C.J.; Zuelke, C.; Farkas, S.; Anthuber, M.; et al. Rapamycin inhibits primary and metastatic tumor growth by antiangiogenesis: Involvement of vascular endothelial growth factor. Nat. Med. 2002, 8, 128–135. [Google Scholar] [CrossRef]
- Timmermans-Sprang, E.P.M.; Gracanin, A.; Mol, J.A. Molecular Signaling of Progesterone, Growth Hormone, Wnt, and HER in Mammary Glands of Dogs, Rodents, and Humans: New Treatment Target Identification. Front. Vet. Sci. 2017, 4, 53. [Google Scholar] [CrossRef] [Green Version]
- Pascual, J.; Turner, N.C. Targeting the PI3-kinase pathway in triple-negative breast cancer. Ann. Oncol. 2019, 30, 1051–1060. [Google Scholar] [CrossRef] [Green Version]
- Sharif, F.; Rasul, A.; Ashraf, A.; Hussain, G.; Younis, T.; Sarfraz, I.; Chaudhry, M.A.; Bukhari, S.A.; Ji, X.Y.; Selamoglu, Z.; et al. Phosphoglycerate mutase 1 in cancer: A promising target for diagnosis and therapy. IUBMB Life 2019, 71, 1418–1427. [Google Scholar] [CrossRef]
- Zhang, D.; Jin, N.; Sun, W.; Li, X.; Liu, B.; Xie, Z.; Qu, J.; Xu, J.; Yang, X.; Su, Y.; et al. Correction: Phosphoglycerate mutase 1 promotes cancer cell migration independent of its metabolic activity. Oncogene 2020, 39, 2451–2452. [Google Scholar] [CrossRef] [Green Version]
- Hitosugi, T.; Zhou, L.; Elf, S.; Fan, J.; Kang, H.B.; Seo, J.H.; Shan, C.; Dai, Q.; Zhang, L.; Xie, J.; et al. Phosphoglycerate mutase 1 coordinates glycolysis and biosynthesis to promote tumor growth. Cancer Cell 2012, 22, 585–600. [Google Scholar] [CrossRef] [Green Version]
- Wen, Y.A.; Zhou, B.W.; Lv, D.J.; Shu, F.P.; Song, X.L.; Huang, B.; Wang, C.; Zhao, S.C. Phosphoglycerate mutase 1 knockdown inhibits prostate cancer cell growth, migration, and invasion. Asian J. Androl. 2018, 20, 178–183. [Google Scholar] [CrossRef] [PubMed]
- Evans, M.J.; Saghatelian, A.; Sorensen, E.J.; Cravatt, B.F. Target discovery in small-molecule cell-based screens by in situ proteome reactivity profiling. Nat. Biotechnol. 2005, 23, 1303–1307. [Google Scholar] [CrossRef] [PubMed]
- Spainhour, J.C.; Qiu, P. Identification of gene-drug interactions that impact patient survival in TCGA. BMC Bioinform. 2016, 17, 409. [Google Scholar] [CrossRef] [PubMed] [Green Version]
- Chen, S.; Cai, J.; Zhang, W.; Zheng, X.; Hu, S.; Lu, J.; Xing, J.; Dong, Y. Proteomic identification of differentially expressed proteins associated with the multiple drug resistance in methotrexate-resistant human breast cancer cells. Int. J. Oncol. 2014, 45, 448–458. [Google Scholar] [CrossRef] [PubMed] [Green Version]
- Mansouri, S.; Shahriari, A.; Kalantar, H.; Moini Zanjani, T.; Haghi Karamallah, M. Role of malate dehydrogenase in facilitating lactate dehydrogenase to support the glycolysis pathway in tumors. Biomed. Rep. 2017, 6, 463–467. [Google Scholar] [CrossRef] [PubMed] [Green Version]
- Liu, Q.; Harvey, C.T.; Geng, H.; Xue, C.; Chen, V.; Beer, T.M.; Qian, D.Z. Malate dehydrogenase 2 confers docetaxel resistance via regulations of JNK signaling and oxidative metabolism. Prostate 2013, 73, 1028–1037. [Google Scholar] [CrossRef] [Green Version]
- Sarfraz, I.; Rasul, A.; Hussain, G.; Hussain, S.M.; Ahmad, M.; Nageen, B.; Jabeen, F.; Selamoglu, Z.; Ali, M. Malic enzyme 2 as a potential therapeutic drug target for cancer. IUBMB Life 2018, 70, 1076–1083. [Google Scholar] [CrossRef] [Green Version]
- Lima Queiroz, A.; Zhang, B.; Comstock, D.E.; Hao, Y.; Eriksson, M.; Hydbring, P.; Vakifahmetoglu-Norberg, H.; Norberg, E. miR-126-5p targets Malate Dehydrogenase 1 in non-small cell lung carcinomas. Biochem. Biophys. Res. Commun. 2018, 499, 314–320. [Google Scholar] [CrossRef]
- Naik, R.; Ban, H.S.; Jang, K.; Kim, I.; Xu, X.; Harmalkar, D.; Shin, S.A.; Kim, M.; Kim, B.K.; Park, J.; et al. Methyl 3-(3-(4-(2,4,4-Trimethylpentan-2-yl)phenoxy)-propanamido)benzoate as a Novel and Dual Malate Dehydrogenase (MDH) 1/2 Inhibitor Targeting Cancer Metabolism. J. Med. Chem. 2017, 60, 8631–8646. [Google Scholar] [CrossRef]
- Doherty, J.R.; Cleveland, J.L. Targeting lactate metabolism for cancer therapeutics. J. Clin. Investig. 2013, 123, 3685–3692. [Google Scholar] [CrossRef]
- Mishra, D.; Banerjee, D. Lactate Dehydrogenases as Metabolic Links between Tumor and Stroma in the Tumor Microenvironment. Cancers 2019, 11, 750. [Google Scholar] [CrossRef] [PubMed] [Green Version]
- Cheng, A.; Zhang, P.; Wang, B.; Yang, D.; Duan, X.; Jiang, Y.; Xu, T.; Jiang, Y.; Shi, J.; Ding, C.; et al. Aurora-A mediated phosphorylation of LDHB promotes glycolysis and tumor progression by relieving the substrate-inhibition effect. Nat. Commun. 2019, 10, 5566. [Google Scholar] [CrossRef] [PubMed] [Green Version]
- Urbańska, K.; Orzechowski, A. Unappreciated Role of LDHA and LDHB to Control Apoptosis and Autophagy in Tumor Cells. Int. J. Mol. Sci. 2019, 20, 2085. [Google Scholar] [CrossRef] [PubMed] [Green Version]
- Zha, X.; Wang, F.; Wang, Y.; He, S.; Jing, Y.; Wu, X.; Zhang, H. Lactate dehydrogenase B is critical for hyperactive mTOR-mediated tumorigenesis. Cancer Res. 2011, 71, 13–18. [Google Scholar] [CrossRef] [Green Version]
- Freeman, A.K.; Morrison, D.K. 14-3-3 Proteins: Diverse functions in cell proliferation and cancer progression. Semin. Cell Dev. Biol. 2011, 22, 681–687. [Google Scholar] [CrossRef] [Green Version]
- Ballone, A.; Centorrino, F.; Ottmann, C. 14-3-3: A Case Study in PPI Modulation. Molecules 2018, 23, 1386. [Google Scholar] [CrossRef] [Green Version]
- Cau, Y.; Valensin, D.; Mori, M.; Draghi, S.; Botta, M. Structure, Function, Involvement in Diseases and Targeting of 14-3-3 Proteins: An Update. Curr. Med. Chem. 2018, 25, 5–21. [Google Scholar] [CrossRef]
- Fan, X.; Cui, L.; Zeng, Y.; Song, W.; Gaur, U.; Yang, M. 14-3-3 Proteins Are on the Crossroads of Cancer, Aging, and Age-Related Neurodegenerative Disease. Int. J. Mol. Sci. 2019, 20, 3518. [Google Scholar] [CrossRef] [Green Version]
- Hiraoka, E.; Mimae, T.; Ito, M.; Kadoya, T.; Miyata, Y.; Ito, A.; Okada, M. Correction to: Breast cancer cell motility is promoted by 14-3-3γ. Breast Cancer 2019, 26, 594. [Google Scholar] [CrossRef] [Green Version]
- Wolfson, E.; Solomon, S.; Schmukler, E.; Goldshmit, Y.; Pinkas-Kramarski, R. Nucleolin and ErbB2 inhibition reduces tumorigenicity of ErbB2-positive breast cancer. Cell Death Dis. 2018, 9, 47. [Google Scholar] [CrossRef] [Green Version]
- Gregório, A.C.; Lacerda, M.; Figueiredo, P.; Simões, S.; Dias, S.; Moreira, J.N. Meeting the needs of breast cancer: A nucleolin’s perspective. Crit. Rev. Oncol. Hematol. 2018, 125, 89–101. [Google Scholar] [CrossRef] [PubMed]
- Romano, S.; Fonseca, N.; Simões, S.; Gonçalves, J.; Moreira, J.N. Nucleolin-based targeting strategies for cancer therapy: From targeted drug delivery to cytotoxic ligands. Drug Discov. Today 2019, 24, 1985–2001. [Google Scholar] [CrossRef] [PubMed]
- Christensen, M.V.; Høgdall, C.K.; Jochumsen, K.M.; Høgdall, E.V.S. Annexin A2 and cancer: A systematic review. Int. J. Oncol. 2018, 52, 5–18. [Google Scholar] [CrossRef] [PubMed]
- Zhao, C.; Zheng, S.; Yan, Z.; Deng, Z.; Wang, R.; Zhang, B. CCL18 promotes the invasion and metastasis of breast cancer through Annexin A2. Oncol. Rep. 2020, 43, 571–580. [Google Scholar] [CrossRef] [PubMed]
- Mahdi, A.F.; Malacrida, B.; Nolan, J.; McCumiskey, M.E.; Merrigan, A.B.; Lal, A.; Tormey, S.; Lowery, A.J.; McGourty, K.; Kiely, P.A. Expression of Annexin A2 Promotes Cancer Progression in Estrogen Receptor Negative Breast Cancers. Cells 2020, 9, 1582. [Google Scholar] [CrossRef] [PubMed]
- Stacpoole, P.W. Therapeutic Targeting of the Pyruvate Dehydrogenase Complex/Pyruvate Dehydrogenase Kinase (PDC/PDK) Axis in Cancer. J. Natl. Cancer Inst. 2017, 109, 1–14. [Google Scholar] [CrossRef] [Green Version]
- Park, S.; Jeon, J.H.; Min, B.K.; Ha, C.M.; Thoudam, T.; Park, B.Y.; Lee, I.K. Role of the Pyruvate Dehydrogenase Complex in Metabolic Remodeling: Differential Pyruvate Dehydrogenase Complex Functions in Metabolism. Diabetes Metab. J. 2018, 42, 270–281. [Google Scholar] [CrossRef]
- Raza, M.H.; Siraj, S.; Arshad, A.; Waheed, U.; Aldakheel, F.; Alduraywish, S.; Arshad, M. ROS-modulated therapeutic approaches in cancer treatment. J. Cancer Res. Clin. Oncol. 2017, 143, 1789–1809. [Google Scholar] [CrossRef]
- Dayan, A.; Fleminger, G.; Ashur-Fabian, O. Targeting the Achilles’ heel of cancer cells via integrin-mediated delivery of ROS-generating dihydrolipoamide dehydrogenase. Oncogene 2019, 38, 5050–5061. [Google Scholar] [CrossRef]
- Shin, D.; Lee, J.; You, J.H.; Kim, D.; Roh, J.L. Dihydrolipoamide dehydrogenase regulates cystine deprivation-induced ferroptosis in head and neck cancer. Redox Biol. 2020, 30, 101418. [Google Scholar] [CrossRef]
- Asher, G.; Lotem, J.; Kama, R.; Sachs, L.; Shaul, Y. NQO1 stabilizes p53 through a distinct pathway. Proc. Natl. Acad. Sci. USA 2002, 99, 3099–3104. [Google Scholar] [CrossRef] [PubMed] [Green Version]
- Paek, A.R.; Mun, J.Y.; Jo, M.J.; Choi, H.; Lee, Y.J.; Cheong, H.; Myung, J.K.; Hong, D.W.; Park, J.; Kim, K.H.; et al. The Role of ZNF143 in Breast Cancer Cell Survival Through the NAD(P)H Quinone Dehydrogenase 1⁻p53⁻Beclin1 Axis Under Metabolic Stress. Cells 2019, 8, 296. [Google Scholar] [CrossRef] [PubMed] [Green Version]
- Røsland, G.V.; Dyrstad, S.E.; Tusubira, D.; Helwa, R.; Tan, T.Z.; Lotsberg, M.L.; Pettersen, I.K.N.; Berg, A.; Kindt, C.; Hoel, F.; et al. Epithelial to mesenchymal transition (EMT) is associated with attenuation of succinate dehydrogenase (SDH) in breast cancer through reduced expression of SDHC. Cancer Metab. 2019, 7, 6. [Google Scholar] [CrossRef] [Green Version]
- Dalla Pozza, E.; Dando, I.; Pacchiana, R.; Liboi, E.; Scupoli, M.T.; Donadelli, M.; Palmieri, M. Regulation of succinate dehydrogenase and role of succinate in cancer. Semin. Cell Dev. Biol. 2020, 98, 4–14. [Google Scholar] [CrossRef] [PubMed]
- Moosavi, B.; Zhu, X.L.; Yang, W.C.; Yang, G.F. Molecular pathogenesis of tumorigenesis caused by succinate dehydrogenase defect. Eur. J. Cell Biol. 2020, 99, 151057. [Google Scholar] [CrossRef]
- Paoloni, M.C.; Mazcko, C.; Fox, E.; Fan, T.; Lana, S.; Kisseberth, W.; Vail, D.M.; Nuckolls, K.; Osborne, T.; Yalkowsy, S.; et al. Rapamycin pharmacokinetic and pharmacodynamic relationships in osteosarcoma: A comparative oncology study in dogs. PLoS ONE 2010, 5, e11013. [Google Scholar] [CrossRef]
- Rodrik-Outmezguine, V.S.; Okaniwa, M.; Yao, Z.; Novotny, C.J.; McWhirter, C.; Banaji, A.; Won, H.; Wong, W.; Berger, M.; de Stanchina, E.; et al. Overcoming mTOR resistance mutations with a new-generation mTOR inhibitor. Nature 2016, 534, 272–276. [Google Scholar] [CrossRef] [Green Version]
- Xie, J.; Wang, X.; Proud, C.G. mTOR inhibitors in cancer therapy. F1000 Res. 2016, 5, 1–11. [Google Scholar] [CrossRef] [Green Version]
- Mukhopadhyay, S.; Frias, M.A.; Chatterjee, A.; Yellen, P.; Foster, D.A. The enigma of rapamycin dosage. Mol. Cancer Ther. 2016, 15, 347–353. [Google Scholar] [CrossRef] [Green Version]
- National Research Council. Guide for the Care and Use of Laboratory Animals, 8th ed.; National Academies Press: Washington, DC, USA, 2011. [Google Scholar]
- Lainetti, P.F.; Brandi, A.; Leis-Filho, A.F.; Prado, M.C.M.; Kobayashi, P.E.; Laufer-Amorim, R.; Fonseca-Alves, C.E. Establishment and Characterization of Canine Mammary Gland Carcinoma Cell Lines with Vasculogenic Mimicry Ability in vitro and in vivo. Front. Vet. Sci. 2020, 7, 583874. [Google Scholar] [CrossRef]
- Zappulli, V.; Pena, L.; Rasotto, R.; Goldschmidt, M.H.; Gama, A.; Scruggs, J.L.; Kiupel, M. Surgical Pathology of Tumors of Domestic Animals—Volume 2: Mammary Tumors; Davis-Thompson DVM Foundation: Gurnee, IL, USA, 2019. [Google Scholar]
- Clemente-Vicario, F.; Alvarez, C.E.; Rowell, J.L.; Roy, S.; London, C.A.; Kisseberth, W.C.; Lorch, G. Human Genetic Relevance and Potent Antitumor Activity of Heat Shock Protein 90 Inhibition in Canine Lung Adenocarcinoma Cell Lines. PLoS ONE 2015, 10, e0142007. [Google Scholar] [CrossRef] [PubMed]
- Rivera-Calderón, L.G.; Fonseca-Alves, C.E.; Kobayashi, P.E.; Carvalho, M.; Drigo, S.A.; de Oliveira Vasconcelos, R.; Laufer-Amorim, R. Alterations in PTEN, MDM2, TP53 and AR protein and gene expression are associated with canine prostate carcinogenesis. Res. Vet. Sci. 2016, 106, 56–61. [Google Scholar] [CrossRef] [PubMed] [Green Version]
- Kuss-Duerkop, S.K.; Wang, J.; Mena, I.; White, K.; Metreveli, G.; Sakthivel, R.; Mata, M.A.; Muñoz-Moreno, R.; Chen, X.; Krammer, F.; et al. Influenza virus differentially activates mTORC1 and mTORC2 signaling to maximize late stage replication. PLoS Pathog. 2017, 13, e1006635. [Google Scholar] [CrossRef] [PubMed]
- Cho, K.J.; Casteel, D.E.; Prakash, P.; Tan, L.; van der Hoeven, D.; Salim, A.A.; Kim, C.; Capon, R.J.; Lacey, E.; Cunha, S.R.; et al. AMPK and Endothelial Nitric Oxide Synthase Signaling Regulates K-Ras Plasma Membrane Interactions via Cyclic GMP-Dependent Protein Kinase 2. Mol. Cell. Biol. 2016, 36, 3086–3099. [Google Scholar] [CrossRef] [Green Version]
- Livak, K.J.; Schmittgen, T.D. Analysis of relative gene expression data using real-time quantitative PCR and the 2(-Delta Delta C(T)) Method. Methods 2001, 25, 402–408. [Google Scholar] [CrossRef]
- Shevchenko, A.; Wilm, M.; Vorm, O.; Mann, M. Mass spectrometric sequencing of proteins silver-stained polyacrylamide gels. Anal. Chem. 1996, 68, 850–858. [Google Scholar] [CrossRef]
- Aragão, A.Z.; Belloni, M.; Simabuco, F.M.; Zanetti, M.R.; Yokoo, S.; Domingues, R.R.; Kawahara, R.; Pauletti, B.A.; Gonçalves, A.; Agostini, M.; et al. Novel processed form of syndecan-1 shed from SCC-9 cells plays a role in cell migration. PLoS ONE 2012, 7, e43521. [Google Scholar] [CrossRef]
- Mi, H.; Poudel, S.; Muruganujan, A.; Casagrande, J.T.; Thomas, P.D. PANTHER version 10: Expanded protein families and functions, and analysis tools. Nucleic Acids Res. 2016, 44, D336–D342. [Google Scholar] [CrossRef] [Green Version]
- Xia, J.; Wishart, D.S. Using MetaboAnalyst 3.0 for Comprehensive Metabolomics Data Analysis. Curr. Protoc. Bioinform. 2016, 55, 14.10.1–14.10.91. [Google Scholar] [CrossRef]
- Checa, A.; Bedia, C.; Jaumot, J. Lipidomic data analysis: Tutorial, practical guidelines and applications. Anal. Chim. Acta 2015, 885, 1–16. [Google Scholar] [CrossRef]
- Mi, H.; Thomas, P. PANTHER pathway: An ontology-based pathway database coupled with data analysis tools. Methods Mol. Biol. 2009, 563, 123–140. [Google Scholar] [CrossRef] [PubMed]
- Lainetti, P.F.; Leis-Filho, A.F.; Kobayashi, P.E.; Camargo, L.S.; Laufer-Amorim, R.; Fonseca-Alves, C.E.; Ferreira de Souza, F. Proteomics raw data of mammary tumor cells from female dogs. Mendeley Data 2020, V1. [Google Scholar] [CrossRef]


Publisher’s Note: MDPI stays neutral with regard to jurisdictional claims in published maps and institutional affiliations. |
© 2021 by the authors. Licensee MDPI, Basel, Switzerland. This article is an open access article distributed under the terms and conditions of the Creative Commons Attribution (CC BY) license (http://creativecommons.org/licenses/by/4.0/).
Share and Cite
Lainetti, P.F.; Leis-Filho, A.F.; Kobayashi, P.E.; de Camargo, L.S.; Laufer-Amorim, R.; Fonseca-Alves, C.E.; Souza, F.F. Proteomics Approach of Rapamycin Anti-Tumoral Effect on Primary and Metastatic Canine Mammary Tumor Cells In Vitro. Molecules 2021, 26, 1213. https://0-doi-org.brum.beds.ac.uk/10.3390/molecules26051213
Lainetti PF, Leis-Filho AF, Kobayashi PE, de Camargo LS, Laufer-Amorim R, Fonseca-Alves CE, Souza FF. Proteomics Approach of Rapamycin Anti-Tumoral Effect on Primary and Metastatic Canine Mammary Tumor Cells In Vitro. Molecules. 2021; 26(5):1213. https://0-doi-org.brum.beds.ac.uk/10.3390/molecules26051213
Chicago/Turabian StyleLainetti, Patrícia F., Antonio F. Leis-Filho, Priscila E. Kobayashi, Laíza S. de Camargo, Renee Laufer-Amorim, Carlos E. Fonseca-Alves, and Fabiana F. Souza. 2021. "Proteomics Approach of Rapamycin Anti-Tumoral Effect on Primary and Metastatic Canine Mammary Tumor Cells In Vitro" Molecules 26, no. 5: 1213. https://0-doi-org.brum.beds.ac.uk/10.3390/molecules26051213