
Using Bioelements Isotope Ratios and Fatty Acid Composition to Deduce Beef Origin and Zebu Feeding Regime in Cameroon

 ,
,
Abstract
:1. Introduction
2. Results and Discussion
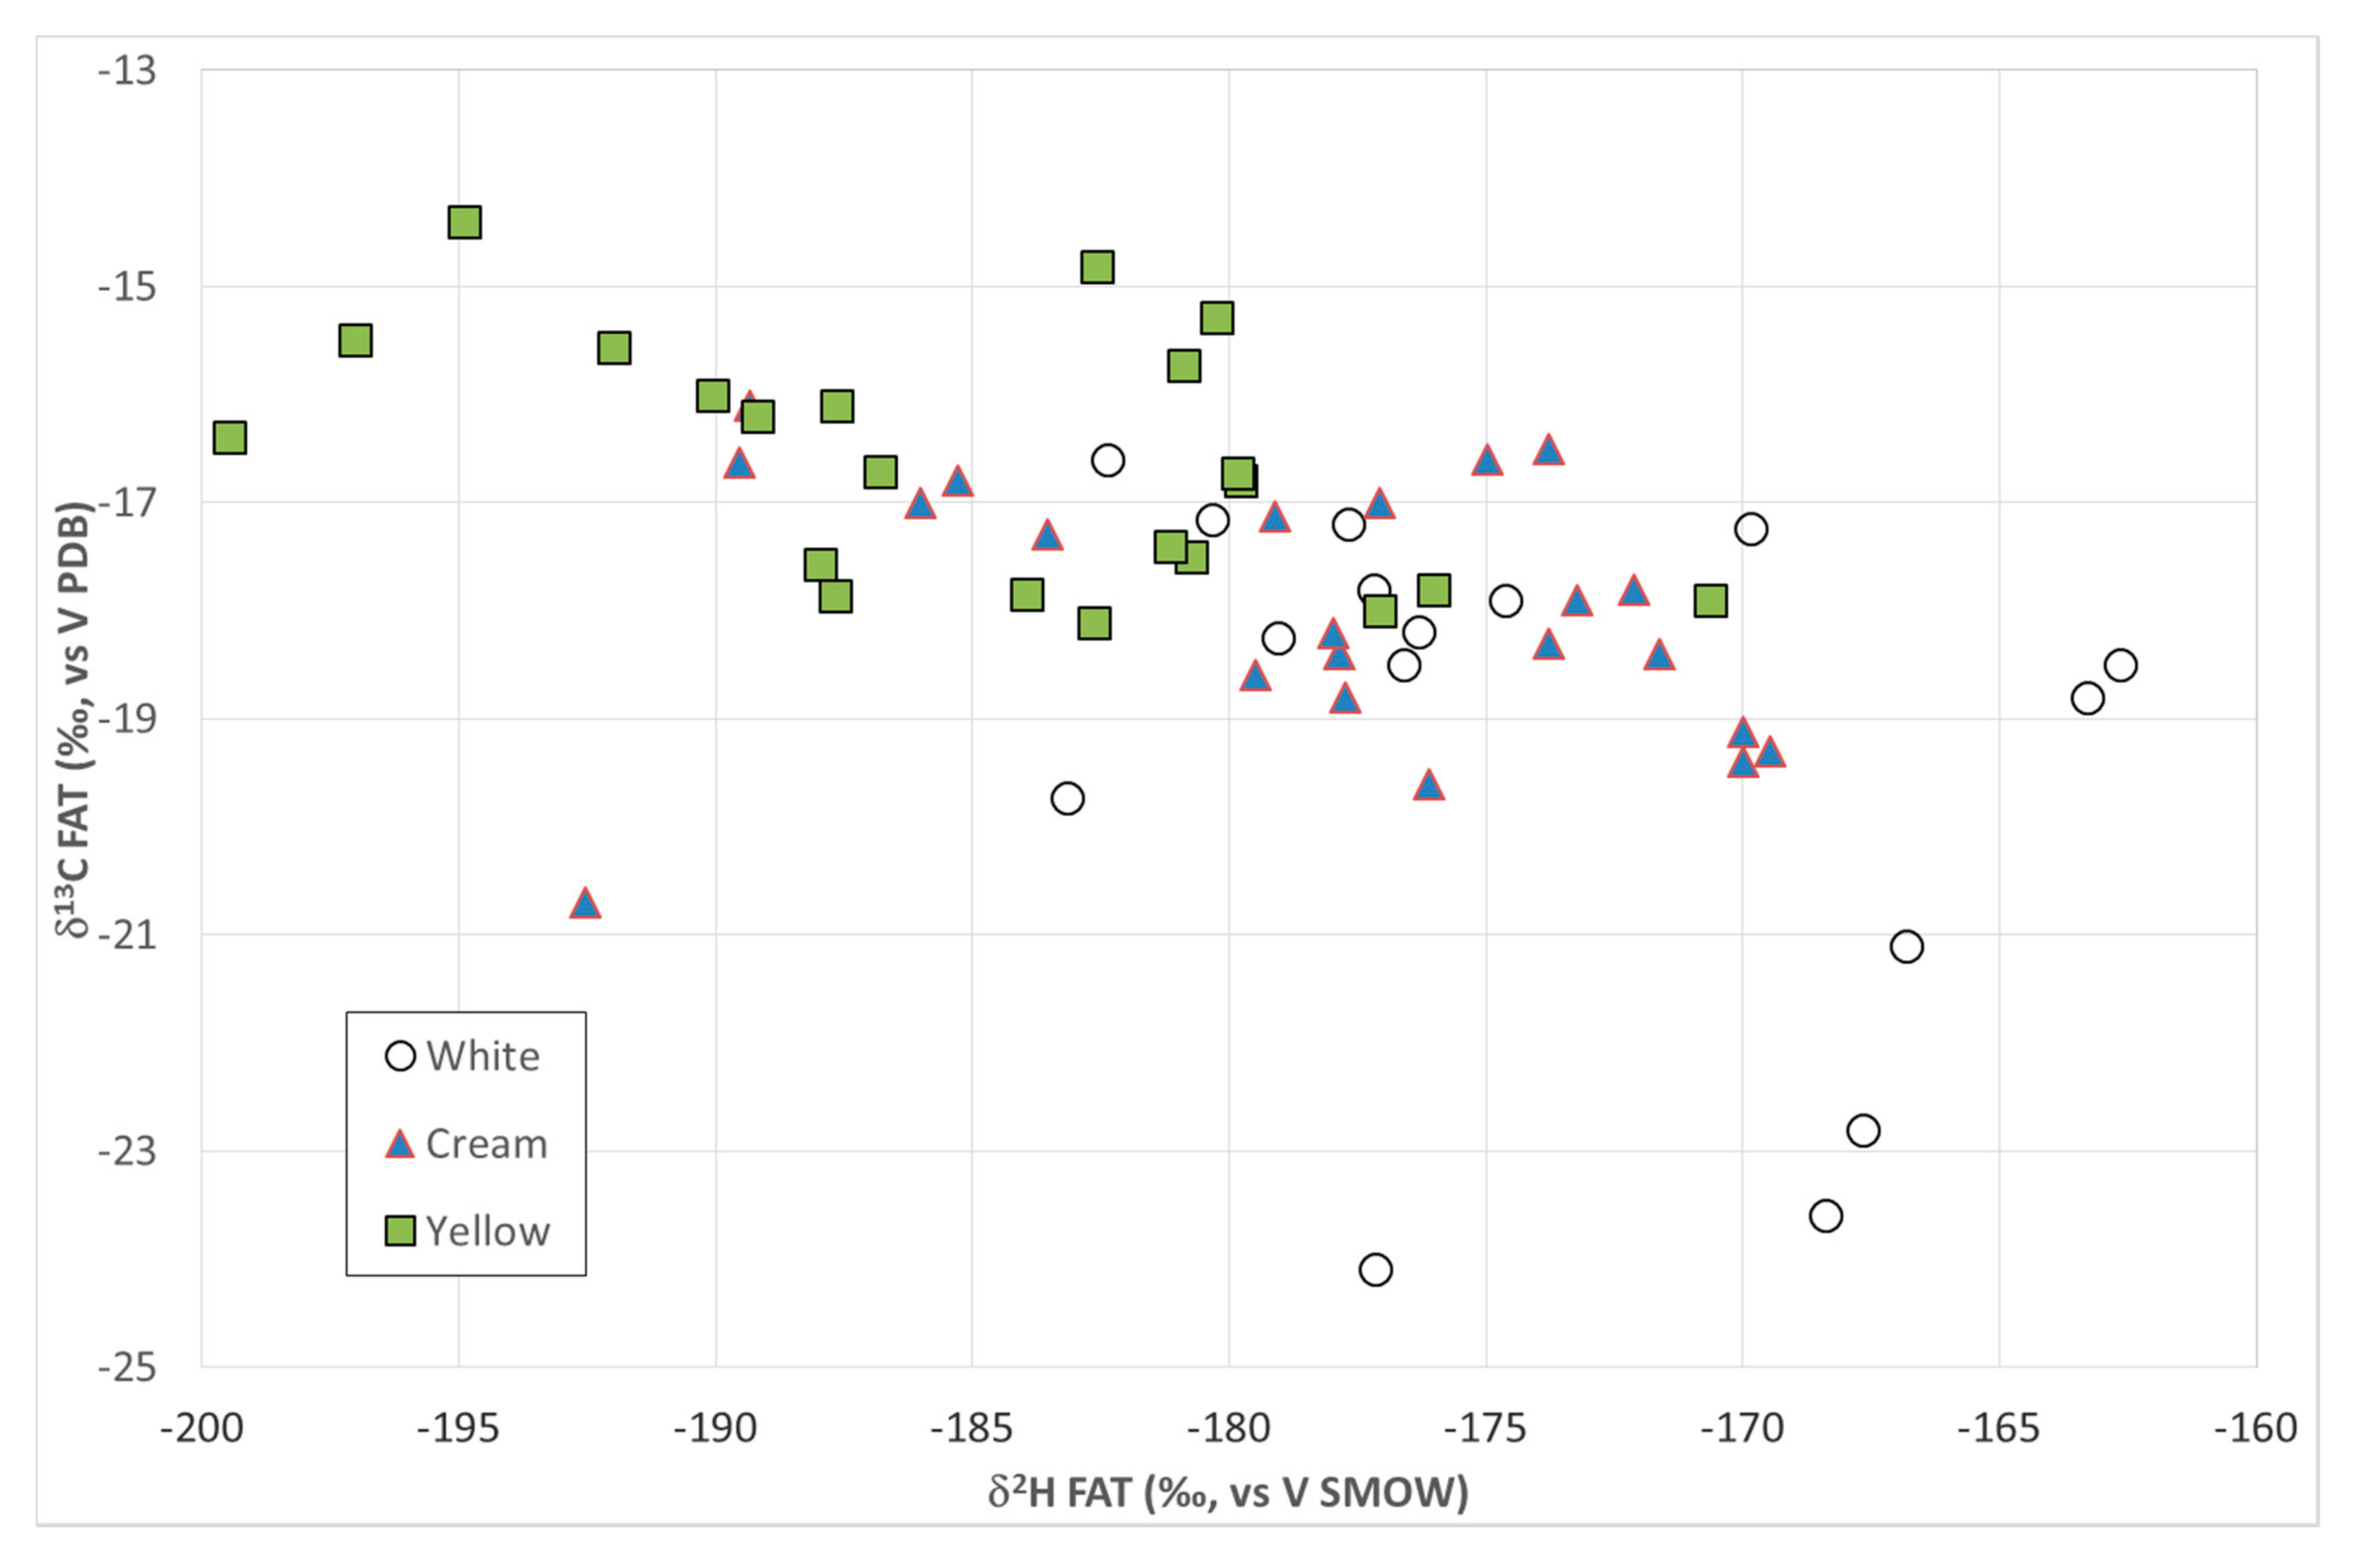
2.1. Variability of the Isotopic Signatures from Multiple Fractions and Their Use as Geographic Tracers
2.2. Correlation between Stable Isotope Ratios and Nutritional Status of Beef
3. Materials and Methods
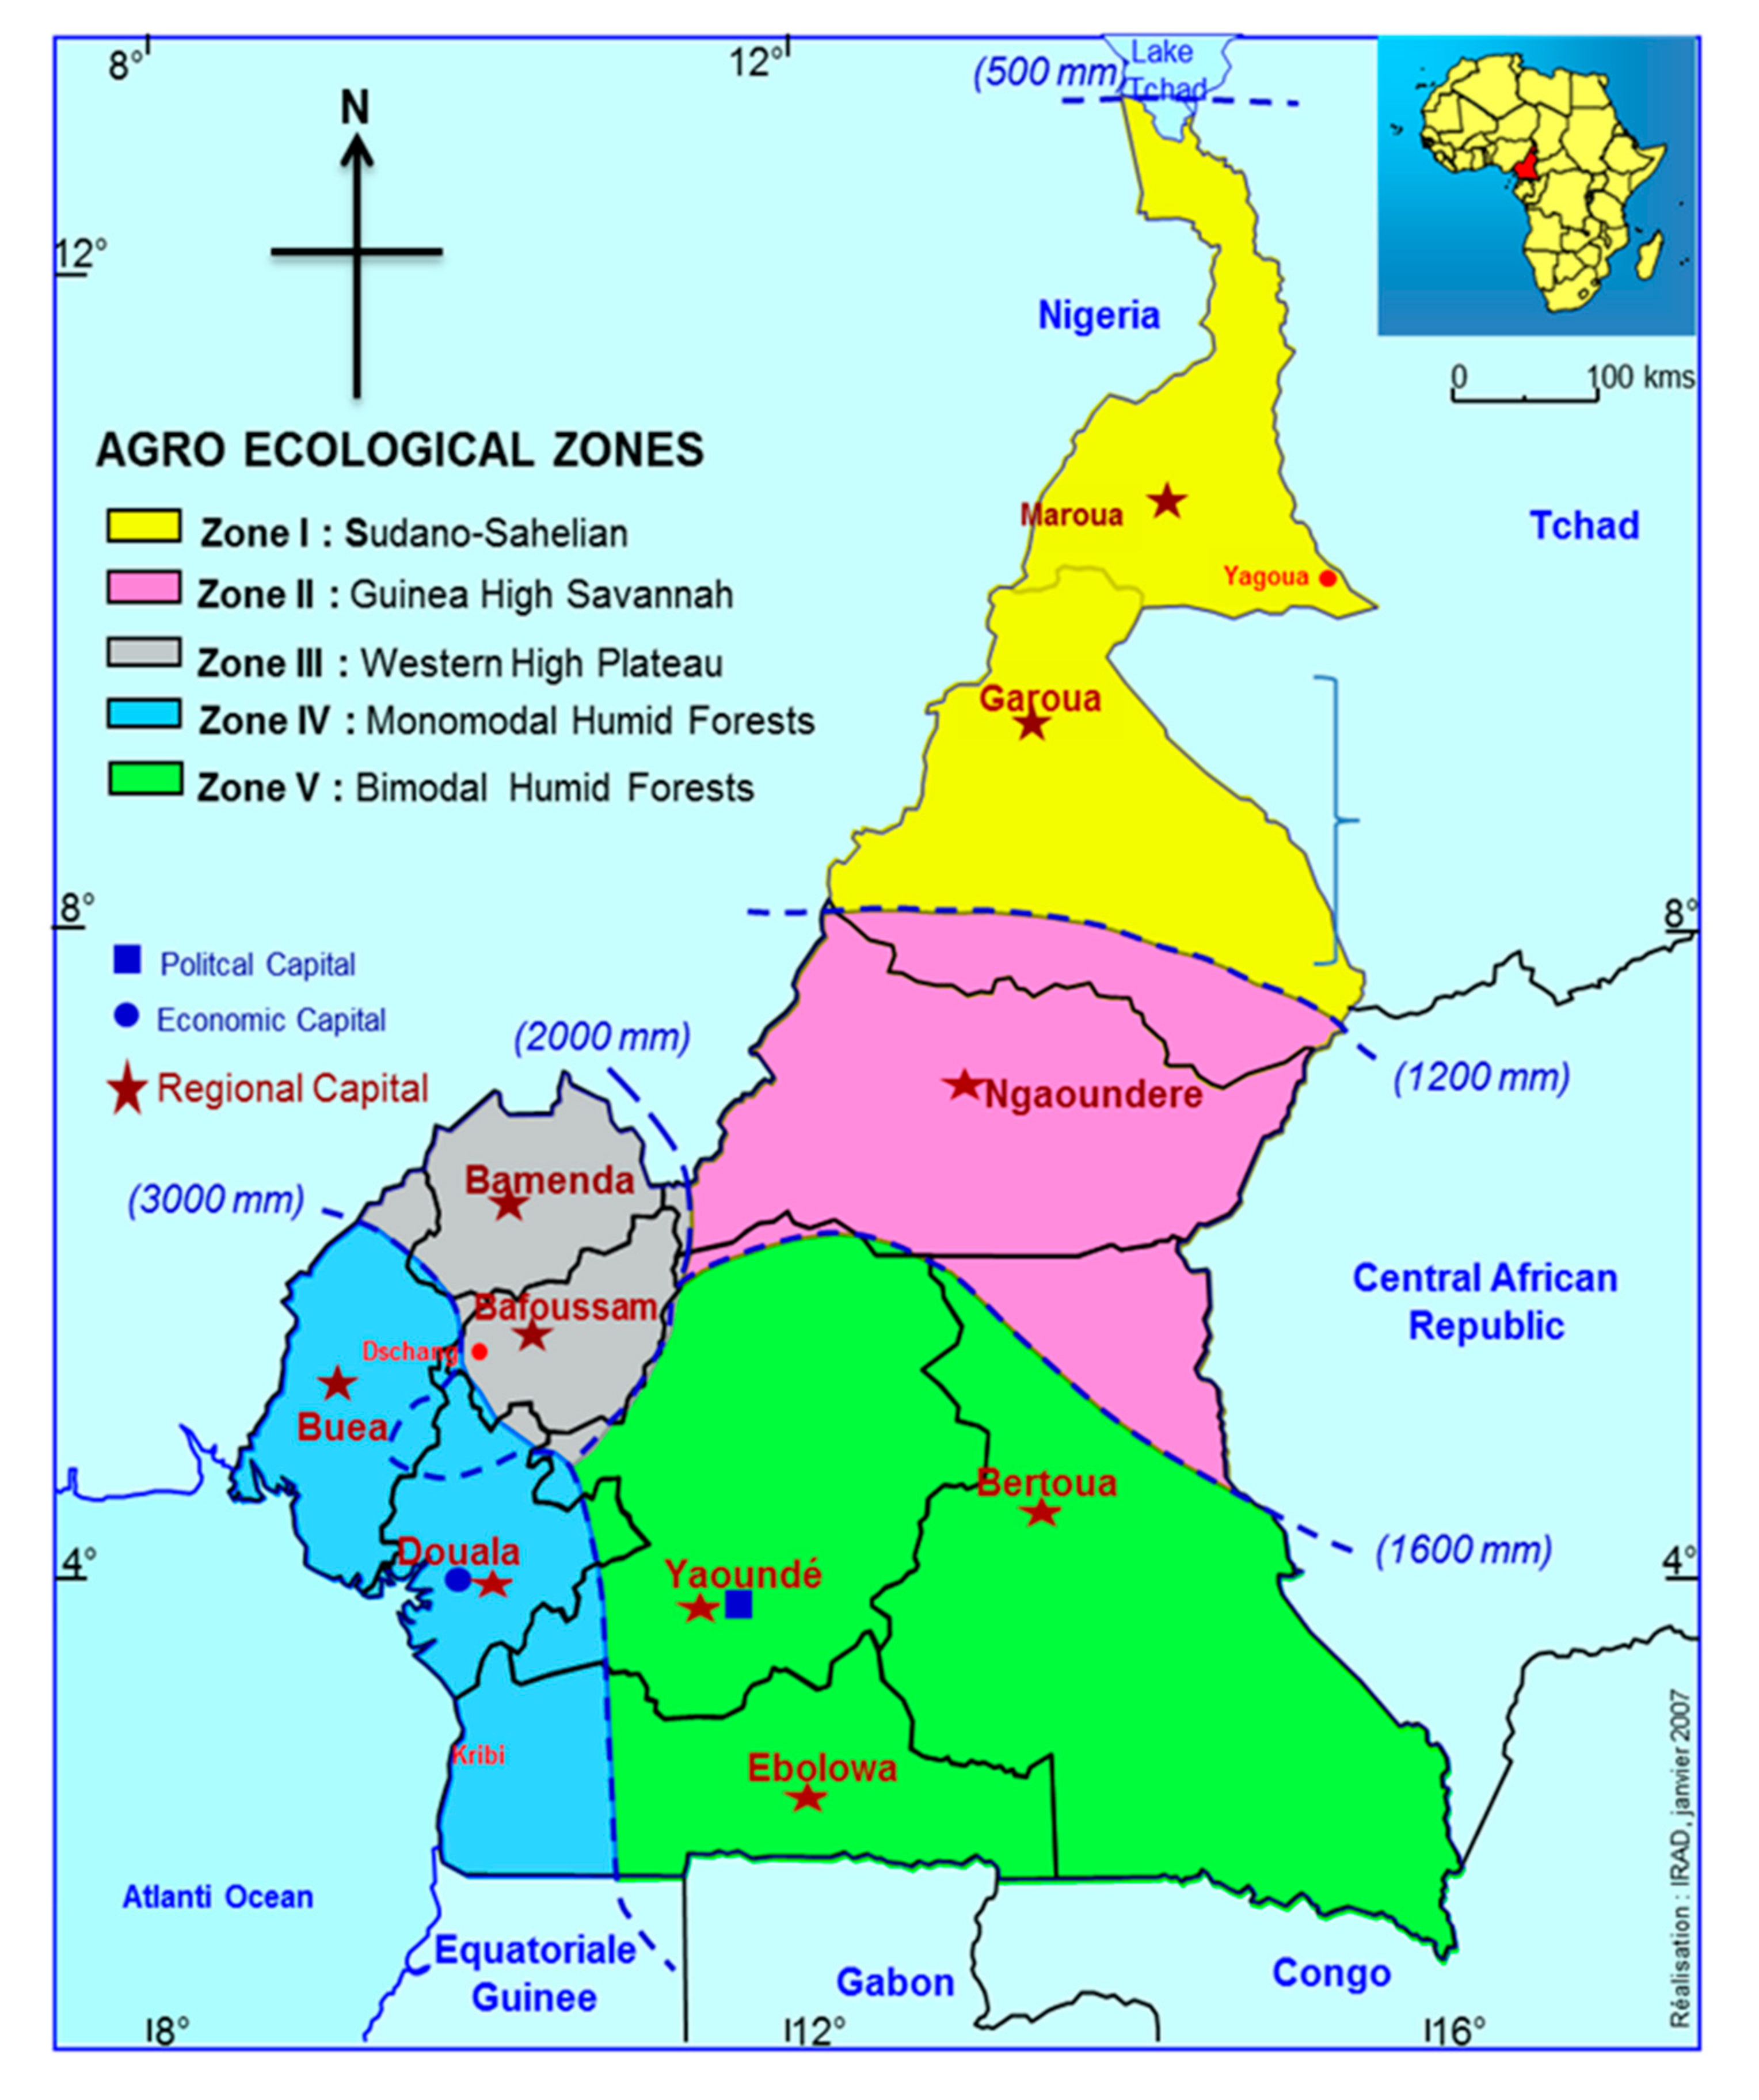
3.1. Animals, Geographical Origin, Carcass Characteristics and Sample Collection
3.2. Sample Preparation and Analysis
3.2.1. Sample Extraction and Fatty Acid Analysis
3.2.2. Sample Fractionation and Stable Isotope Ratio Analysis
3.2.3. Statistical Analysis
4. Conclusions
Author Contributions
Funding
Institutional Review Board Statement
Informed Consent Statement
Data Availability Statement
Conflicts of Interest
Sample Availability
Abbreviations
References
- Madalena, F.E.; Toledo-Alvarado, H.; Cala-Moreno, N. Animals That Produce Dairy Foods: Bos indicus Breeds and Bos indicus × Bos taurus Crosses. In Reference Module in Food Science; Elsevier: Amsterdam, The Netherlands, 2019. [Google Scholar]
- Nfor, B.M.; Corazzin, M.; Fonteh, F.A.; Aziwo, N.T.; Galeotti, M.; Piasentier, E. Quality and Safety of Beef Produced in Central African Sub-Region. Ital. J. Anim. Sci. 2014, 13, 3114. [Google Scholar] [CrossRef]
- Ojong, B.W.; Saccà, E.; Bessong, P.; Piasentier, E. Prevalence of bovine dermatophilosis and disease-associated alleles in zebu Goudali cattle and their Italian Simmental crosses ranching in the western highland plateau savannah of Cameroon. Trop. Anim. Health Prod. 2016, 48, 1329–1335. [Google Scholar] [CrossRef] [PubMed]
- Aboubakar, N.; Havard, M.; Njoupouo, A.; Nansé, M.; Kajeu, S. Rapport Annuel 2007: Rayonnement de L’IRAD et Élaboration Participative D’une Nouvelle Stratégie de la Recherche Agricole; Institut de Recherche Agricole pour le Développement: Yaoundé, Cameroun, 2009. [Google Scholar]
- Food and Agriculture Organization of the United Nations. In The Second Report on the State of the World’s Animal Genetic Resources for Food and Agriculture: FAO Commission on Genetic Resources for Food and Agriculture; Assessments 2015; Food & Agriculture Org.: Rome, Italy, 2015; ISBN 9789251088203.
- Ngalim, A.N. Cattle Rearing Systems in the North West Region of Cameroon: Historical Trends on Changing Techniques and Strategies. J. Educ. Policy Entrep. Res. 2015, 2, 175–189. [Google Scholar]
- Tawah, C.L.; Rege, J.E.O. Gudali cattle of west and central africa. Anim. Genet. Resour. 1996, 17, 147–164. [Google Scholar] [CrossRef]
- Bessong Ojong, W.; Saccà, E.; Corazzin, M.; Sepulcri, A.; Piasentier, E. Body and meat characteristics of young bulls from Zebu Goudali of Cameroon and its crosses with the Italian Simmental. Ital. J. Anim. Sci. 2018, 17, 240–249. [Google Scholar] [CrossRef] [Green Version]
- Saccà, E.; Ojong Bessong, W.; Corazzin, M.; Bovolenta, S.; Piasentier, E. Comparison of longissimus thoracis physical quality traits and the expression of tenderness-related genes between Goudali zebu breed and Italian Simmental × Goudali crossbreed. Ital. J. Anim. Sci. 2018, 17, 851–858. [Google Scholar] [CrossRef]
- Ebangi, A.L.; Achukwi, M.D.; Messine, O.; Abba, D. Characterization of Doayo and Kapsiki taurine cattle breeds of Cameroon in their natural environment. Trop. Anim. Health Prod. 2011, 43, 1117–1122. [Google Scholar] [CrossRef]
- Ibeagha-Awemu, E.M.; Jann, O.C.; Weimann, C.; Erhardt, G. Genetic diversity, introgression and relationships among West/Central African cattle breeds. Genet. Sel. Evol. 2004, 36, 673–690. [Google Scholar] [CrossRef] [PubMed] [Green Version]
- Paguem, A.; Abanda, B.; Achukwi, M.D.; Baskaran, P.; Czemmel, S.; Renz, A.; Eisenbarth, A. Whole genome characterization of autochthonous Bos taurus brachyceros and introduced Bos indicus indicus cattle breeds in Cameroon regarding their adaptive phenotypic traits and pathogen resistance. BMC Genet. 2020, 21, 64. [Google Scholar] [CrossRef]
- Camin, F.; Bontempo, L.; Perini, M.; Piasentier, E. Stable Isotope Ratio Analysis for Assessing the Authenticity of Food of Animal Origin. Compr. Rev. Food Sci. Food Saf. 2016, 15, 868–877. [Google Scholar] [CrossRef] [Green Version]
- Boner, M.; Förstel, H. Stable isotope variation as a tool to trace the authenticity of beef. Anal. Bioanal. Chem. 2004, 378, 301–310. [Google Scholar] [CrossRef] [PubMed]
- Horacek, M.; Min, J.-S. Discrimination of Korean beef from beef of other origin by stable isotope measurements. Food Chem. 2010, 121, 517–520. [Google Scholar] [CrossRef]
- Yanagi, Y.; Hirooka, H.; Oishi, K.; Choumei, Y.; Hata, H.; Arai, M.; Kitagawa, M.; Gotoh, T.; Inada, S.; Kumagai, H. Stable carbon and nitrogen isotope analysis as a tool for inferring beef cattle feeding systems in Japan. Food Chem. 2012, 134, 502–506. [Google Scholar] [CrossRef]
- Osorio, M.T.; Moloney, A.P.; Schmidt, O.; Monahan, F.J. Beef authentication and retrospective dietary verification using stable isotope ratio analysis of bovine muscle and tail hair. J. Agric. Food Chem. 2011, 59, 3295–3305. [Google Scholar] [CrossRef] [PubMed]
- Kouamo, J.; Pa-ana, P. Typology of cattle farms in the northern regions of Cameroon. Rev. Elev. Med. Vet. Pays Trop. 2017, 70, 73–80. [Google Scholar] [CrossRef] [Green Version]
- Schmidt, O.; Quilter, J.M.; Bahar, B.; Moloney, A.P.; Scrimgeour, C.M.; Begley, I.S.; Monahan, F.J. Inferring the origin and dietary history of beef from C, N and S stable isotope ratio analysis. Food Chem. 2005, 91, 545–549. [Google Scholar] [CrossRef]
- Nakashita, R.; Suzuki, Y.; Akamatsu, F.; Iizumi, Y.; Korenaga, T.; Chikaraishi, Y. Stable carbon, nitrogen, and oxygen isotope analysis as a potential tool for verifying geographical origin of beef. Anal. Chim. Acta 2008, 617, 148–152. [Google Scholar] [CrossRef]
- Guo, B.L.; Wei, Y.M.; Pan, J.R.; Li, Y. Stable C and N isotope ratio analysis for regional geographical traceability of cattle in China. Food Chem. 2010, 118, 915–920. [Google Scholar] [CrossRef]
- Crittenden, R.G.; Andrew, A.S.; LeFournour, M.; Young; Middleton, H.; Stockmann, R. Determining the geographic origin of milk in Australasia using multi-element stable isotope ratio analysis. Int. Dairy J. 2007, 17, 421–428. [Google Scholar] [CrossRef]
- O’Leary, M.H. Carbon Isotopes in Photosynthesis. Bioscience 1988, 38, 328–336. [Google Scholar] [CrossRef]
- Farquhar, G.D.; Ehleringer, J.R.; Hubick, K.T. Carbon Isotope Discrimination and Photosynthesis. Annu. Rev. Plant Physiol. Plant Mol. Biol. 1989, 40, 503–537. [Google Scholar] [CrossRef]
- Pamo, E.T. Country Pasture/Forage Resource Profiles; Cameroon FAO: Yaounde, Cameroon, 2008; Volume 76. [Google Scholar]
- Erasmus, S.W.; Muller, M.; van der Rijst, M.; Hoffman, L.C. Stable isotope ratio analysis: A potential analytical tool for the authentication of South African lamb meat. Food Chem. 2016, 192, 997–1005. [Google Scholar] [CrossRef] [PubMed]
- Perini, M.; Camin, F.; Sánchez del Pulgar, J.; Piasentier, E. Effect of origin, breeding and processing conditions on the isotope ratios of bioelements in dry-cured ham. Food Chem. 2013, 136, 1543–1550. [Google Scholar] [CrossRef] [PubMed]
- Piasentier, E.; Valusso, R.; Camin, F.; Versini, G. Stable isotope ratio analysis for authentication of lamb meat. Meat Sci. 2003, 64, 239–247. [Google Scholar] [CrossRef]
- Hobson, K.A.; Atwell, L.; Wassenaar, L.I. Influence of drinking water and diet on the stable-hydrogen isotope ratios of animal tissues. Proc. Natl. Acad. Sci. USA 1999, 96, 8003–8006. [Google Scholar] [CrossRef] [Green Version]
- Harrison, S.M.; Schmidt, O.; Moloney, A.P.; Kelly, S.D.; Rossmann, A.; Schellenberg, A.; Camin, F.; Perini, M.; Hoogewerff, J.; Monahan, F.J. Tissue turnover in ovine muscles and lipids as recorded by multiple (H, C, O, S) stable isotope ratios. Food Chem. 2011, 124, 291–297. [Google Scholar] [CrossRef]
- Bowen, G.J.; Revenaugh, J. Interpolating the isotopic composition of modern meteoric precipitation: Isotopic composition of modern precipitation. Water Resour. Res. 2003, 39. [Google Scholar] [CrossRef]
- Schmidt, H.L.; Werner, R.A.; Rossmann, A. 18O pattern and biosynthesis of natural plant products. Phytochemistry 2001, 58, 9–32. [Google Scholar] [CrossRef]
- Perini, M.; Camin, F.; Bontempo, L.; Rossmann, A.; Piasentier, E. Multielement (H, C, N, O, S) stable isotope characteristics of lamb meat from different Italian regions. Rapid Commun. Mass Spectrom. 2009, 23, 2573–2585. [Google Scholar] [CrossRef] [PubMed]
- Amundson, R.; Austin, A.T.; Schuur, E.A.G.; Yoo, K.; Matzek, V.; Kendall, C.; Uebersax, A.; Brenner, D.; Baisden, W.T. Global patterns of the isotopic composition of soil and plant nitrogen. Glob. Biogeochem. Cycles 2003, 17. [Google Scholar] [CrossRef]
- Trust, B.A.; Fry, B. Stable Sulphur Isotopes In Plants: A Review. Plant. Cell Environ. 1992, 15, 1105–1110. [Google Scholar] [CrossRef]
- Njabo, K.Y.; Smith, T.B.; Yohannes, E. Feeding habits of culicine mosquitoes in the Cameroon lowland forests based on stable isotopes and blood meal analyses. J. Parasitol. Vector Biol. 2013, 5, 6–12. [Google Scholar]
- Dunne, P.G.; Monahan, F.J.; O’Mara, F.P.; Moloney, A.P. Colour of bovine subcutaneous adipose tissue: A review of contributory factors, associations with carcass and meat quality and its potential utility in authentication of dietary history. Meat Sci. 2009, 81, 28–45. [Google Scholar] [CrossRef] [PubMed]
- Nuernberg, K.; Dannenberger, D.; Nuernberg, G.; Ender, K.; Voigt, J.; Scollan, N.D.; Wood, J.D.; Nute, G.R.; Richardson, R.I. Effect of a grass-based and a concentrate feeding system on meat quality characteristics and fatty acid composition of longissimus muscle in different cattle breeds. Livest. Prod. Sci. 2005, 94, 137–147. [Google Scholar] [CrossRef]
- Savell, J.W.; Cross, H.R. The role of fat in the palatability of beef, pork, and lamb. Designing foods: Animal product options in the marketplace. In Committee on Technological Options to Improve the Nutritional Attributes of Animal Products; National Academy Press: Washington, DC, USA, 1988; pp. 345–355. [Google Scholar]
- Salifou, C.F.A.; Dahouda, M.; Houaga, I.; Picard, B.; Hornick, J.L.; Micol, D.; Kassa, S.K.; Farougou, S.; Mensah, G.A.; Clinquart, A.; et al. Muscle characteristics, meat tenderness and nutritional qualities traits of borgou, lagunaire and zebu Fulani bulls raised on natural pasture in Benin. Int. J. Anim. Vet. Adv. 2013, 5, 143–155. [Google Scholar] [CrossRef]
- Deffo, V.; Pamo, E.T.; Tchotsoua, M.; Lieugomg, M.; Arene, C.J.; Nwagbo, E.C. Others Determination of the critical period for cattle farming in Cameroon. Int. J. Livest. Prod. 2011, 2, 59–68. [Google Scholar]
- De Smet, S.; Raes, K.; Demeyer, D. Meat fatty acid composition as affected by fatness and genetic factors: A review. Anim. Res. 2004, 53, 81–98. [Google Scholar] [CrossRef]
- Wang, R.Z. The occurrence of C4 photosynthesis in Yunnan province, a tropical region in South-western China. Photosynthetica 2006, 44, 286–292. [Google Scholar] [CrossRef]
- Folch, J.; Lees, M.; Sloane Stanley, G.H. A simple method for the isolation and purification of total lipides from animal tissues. J. Biol. Chem. 1957, 226, 497–509. [Google Scholar] [CrossRef]
- Christie, W.W. Others Preparation of ester derivatives of fatty acids for chromatographic analysis. Adv. Lipid Methodol. 1993, 2, e111. [Google Scholar]
- Brand, W.A.; Coplen, T.B.; Vogl, J.; Rosner, M.; Prohaska, T. Assessment of international reference materials for isotope-ratio analysis (IUPAC Technical Report). Pure Appl. Chem. 2014, 86, 425–467. [Google Scholar] [CrossRef]
- Camin, F.; Bertoldi, D.; Santato, A.; Bontempo, L.; Perini, M.; Ziller, L.; Stroppa, A.; Larcher, R. Validation of methods for H, C, N and S stable isotopes and elemental analysis of cheese: Results of an international collaborative study. Rapid Commun. Mass Spectrom. 2015, 29, 415–423. [Google Scholar] [CrossRef] [PubMed]
- Wassenaar, L.I.; Hobson, K.A. Comparative equilibration and online technique for determination of non-exchangeable hydrogen of keratins for use in animal migration studies. Isot. Environ. Health Stud. 2003, 39, 211–217. [Google Scholar] [CrossRef] [PubMed]


| Fat Color | Region | δ13C[‰]DFDM i | δ13C[‰]FAT i | δ2H[‰]DFDM | δ2H[‰]FAT | δ18O[‰]DFDM | δ18O[‰]FAT | δ15N[‰]DFDM | δ34S[‰]DFDM | ||||||||
|---|---|---|---|---|---|---|---|---|---|---|---|---|---|---|---|---|---|
| Mean | SD | Mean | SD | Mean | SD | Mean | SD | Mean | SD | Mean | SD | Mean | SD | Mean | SD | ||
| White | Adamawa | −12.2 | 1.44 | −18.7 | 1.87 | −60.5 | 4.99 | −174.1 | 6.30 | 17.4 | 0.90 | 23.7 | 1.26 | 4.70 | 0.58 | 8.09 | 0.84 |
| Northwest | −13.1 | 2.55 | −20.9 | 2.53 | −60.9 | 7.36 | −172.4 | 7.70 | 17.3 | 0.97 | 22.2 | 0.96 | 5.80 | 0.73 | 8.98 | 1.27 | |
| East | −11.3 | 0.70 | −17.0 | 0.36 | −66.8 | 5.67 | −176.6 | 6.33 | 17.3 | 0.44 | 24.6 | 0.14 | 4.70 | 0.89 | 7.39 | 0.50 | |
| Total | −12.4 | 1.89 | −19.2 A | 2.39 | −61.8 | 6.19 | −173.9 B | 6.58 | 17.4 | 0.82 | 23.3 | 1.35 | 5.11 | 0.85 | 8.30 | 1.11 | |
| Cream | Adamawa | −11.5 | 0.78 | −18.1 | 1.32 | −63.2 | 4.23 | −177.9 | 7.03 | 17.4 | 0.52 | 23.8 | 1.31 | 4.53 | 0.80 | 7.86 | 0.88 |
| Northwest | −11.7 | 1.10 | −17.7 | 0.99 | −61.1 | 0.81 | −178.8 | 10.16 | 17.3 | 0.85 | 22.2 | 0.30 | 5.25 | 0.06 | 8.32 | 0.49 | |
| East | −12.3 | 0.90 | −17.6 | 0.98 | −65.4 | 0.94 | −178.8 | 6.57 | 16.9 | 0.75 | 24.2 | 1.49 | 4.81 | 0.48 | 7.16 | 0.38 | |
| Total | −11.7 | 0.85 | −18.0 AB | 1.21 | −63.5 | 3.69 | −178.2 AB | 6.80 | 17.3 | 0.61 | 23.7 | 1.36 | 4.66 | 0.72 | 7.74 | 0.82 | |
| Yellow | Adamawa | −11.3 | 0.67 | −16.6 | 1.11 | −62.8 | 5.71 | −185.2 | 7.73 | 17.4 | 0.92 | 23.5 | 1.14 | 4.31 | 0.62 | 7.73 | 0.57 |
| Northwest | −12.0 | 0.30 | −17.7 | 0.19 | −64.2 | 3.17 | −186.0 | 2.84 | 16.3 | 0.49 | 21.7 | 0.29 | 5.16 | 0.33 | 8.48 | 0.21 | |
| East | −11.6 | 1.15 | −15.8 | 1.34 | −60.5 | 2.35 | −181.2 | 1.94 | 17.9 | 0.35 | 26.9 | 0.18 | 4.33 | 1.12 | 7.79 | 0.87 | |
| Total | −11.4 | 0.70 | −16.6 B | 1.12 | −62.7 | 5.28 | −184.9 A | 7.10 | 17.3 | 0.92 | 23.6 | 1.56 | 4.39 | 0.66 | 7.80 | 0.59 | |
| Total | Adamawa | −11.5 | 0.92 | −17.6 AB | 1.58 | −62.5 | 5.04 | −180.5 | 8.37 | 17.4 | 0.77 | 23.6 B | 1.20 | 4.46 b | 0.69 | 7.84 b | 0.74 |
| Northwest | −12.6 | 2.06 | −19.6 B | 2.52 | −61.6 | 5.76 | −176.4 | 8.80 | 17.1 | 0.90 | 22.1 C | 0.76 | 5.56 a | 0.64 | 8.75 a | 1.01 | |
| East | −11.9 | 0.93 | −17.1 A | 1.09 | −64.8 | 3.71 | −178.6 | 5.60 | 17.2 | 0.68 | 24.8 A | 1.48 | 4.68 b | 0.68 | 7.35 b | 0.52 | |
| Total | −11.8 | 1.22 | −17.8 | 1.86 | −62.8 | 4.99 | −179.5 | 8.08 | 17.3 | 0.78 | 23.6 | 1.42 | 4.68 | 0.78 | 7.91 | 0.86 | |
| Region | Predicted Beef Origin | |||
|---|---|---|---|---|
| Adamawa | Northwest | East | ||
| Original i | Adamawa | 75.0 | 12.5 | 12.5 |
| Northwest | 0.0 | 100.0 | 0.0 | |
| East | 0.0 | 10.0 | 90.0 | |
| Cross-validated ii | Adamawa | 65.0 | 17.5 | 17.5 |
| Northwest | 0.0 | 100.0 | 0.0 | |
| East | 0.0 | 10.0 | 90.0 | |
| Fatty Acid Profile | Correlation | |||||
|---|---|---|---|---|---|---|
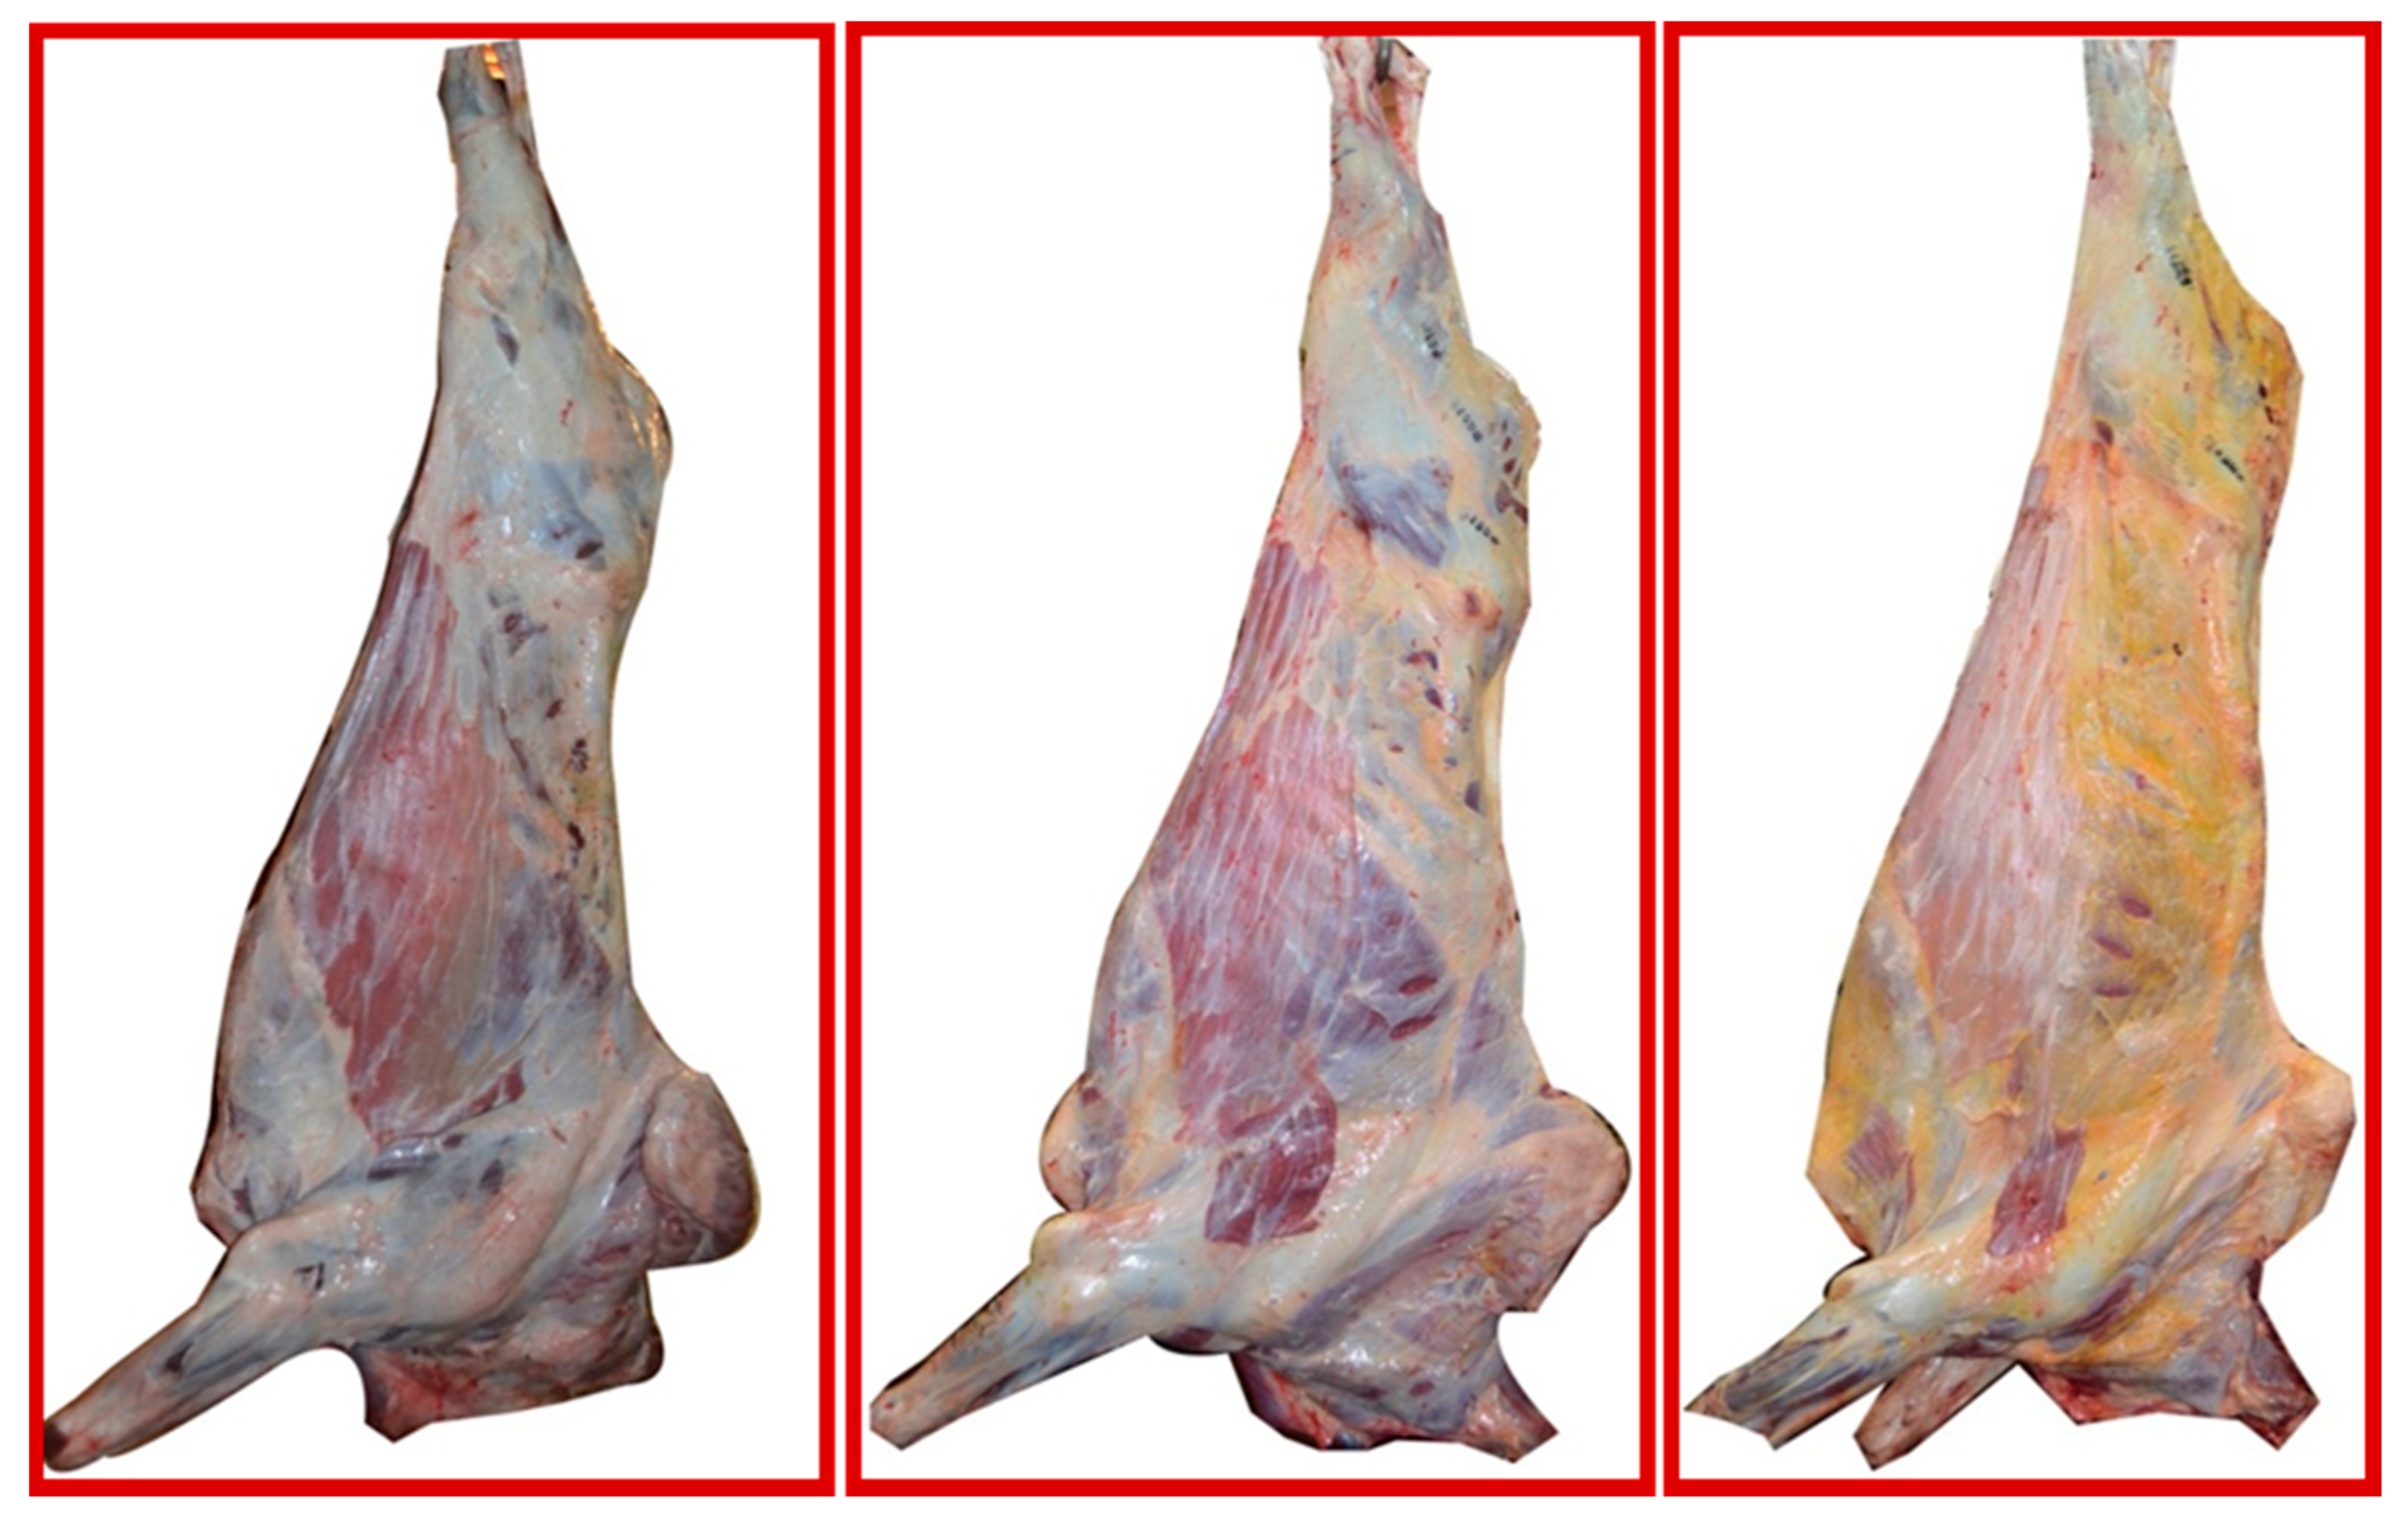
| Subcutaneous Fat Color: | White | Cream | Yellow | SE | δ2H[‰]FAT | δ13C[‰]FAT |
| no. of samples | 16 | 22 | 22 | |||
| Total lipids | 3.3 b | 4.1 b | 7.1 a | 2.61 | −0.478 ** | 0.413 ** |
| SFA | 47.1 b | 49.5 ab | 52.2 a | 5.12 | −0.514 ** | 0.335 ** |
| MUFA | 33.1 b | 35.3 b | 38.3 a | 4.21 | −0.315 * | 0.273 * |
| PUFA-n3 | 6.4 a | 5.0 b | 3.2 c | 1.57 | 0.655 ** | −0.466 ** |
| PUFA-n6 | 13.4 a | 10.2 b | 6.2 c | 3.50 | 0.675 ** | −0.506 ** |
| PUFA | 19.8 a | 15.2 b | 9.4 c | 4.95 | 0.665 ** | −0.483 ** |
Publisher’s Note: MDPI stays neutral with regard to jurisdictional claims in published maps and institutional affiliations. |
© 2021 by the authors. Licensee MDPI, Basel, Switzerland. This article is an open access article distributed under the terms and conditions of the Creative Commons Attribution (CC BY) license (https://creativecommons.org/licenses/by/4.0/).
Share and Cite
Perini, M.; Nfor, M.B.; Camin, F.; Pianezze, S.; Piasentier, E. Using Bioelements Isotope Ratios and Fatty Acid Composition to Deduce Beef Origin and Zebu Feeding Regime in Cameroon. Molecules 2021, 26, 2155. https://0-doi-org.brum.beds.ac.uk/10.3390/molecules26082155
Perini M, Nfor MB, Camin F, Pianezze S, Piasentier E. Using Bioelements Isotope Ratios and Fatty Acid Composition to Deduce Beef Origin and Zebu Feeding Regime in Cameroon. Molecules. 2021; 26(8):2155. https://0-doi-org.brum.beds.ac.uk/10.3390/molecules26082155
Chicago/Turabian StylePerini, Matteo, Mohamadou Bawe Nfor, Federica Camin, Silvia Pianezze, and Edi Piasentier. 2021. "Using Bioelements Isotope Ratios and Fatty Acid Composition to Deduce Beef Origin and Zebu Feeding Regime in Cameroon" Molecules 26, no. 8: 2155. https://0-doi-org.brum.beds.ac.uk/10.3390/molecules26082155