
‘Aggregation-Induced Emission’ Active Mono-Cyclometalated Iridium(III) Complex Mediated Efficient Vapor-Phase Detection of Dichloromethane


Abstract
:1. Introduction
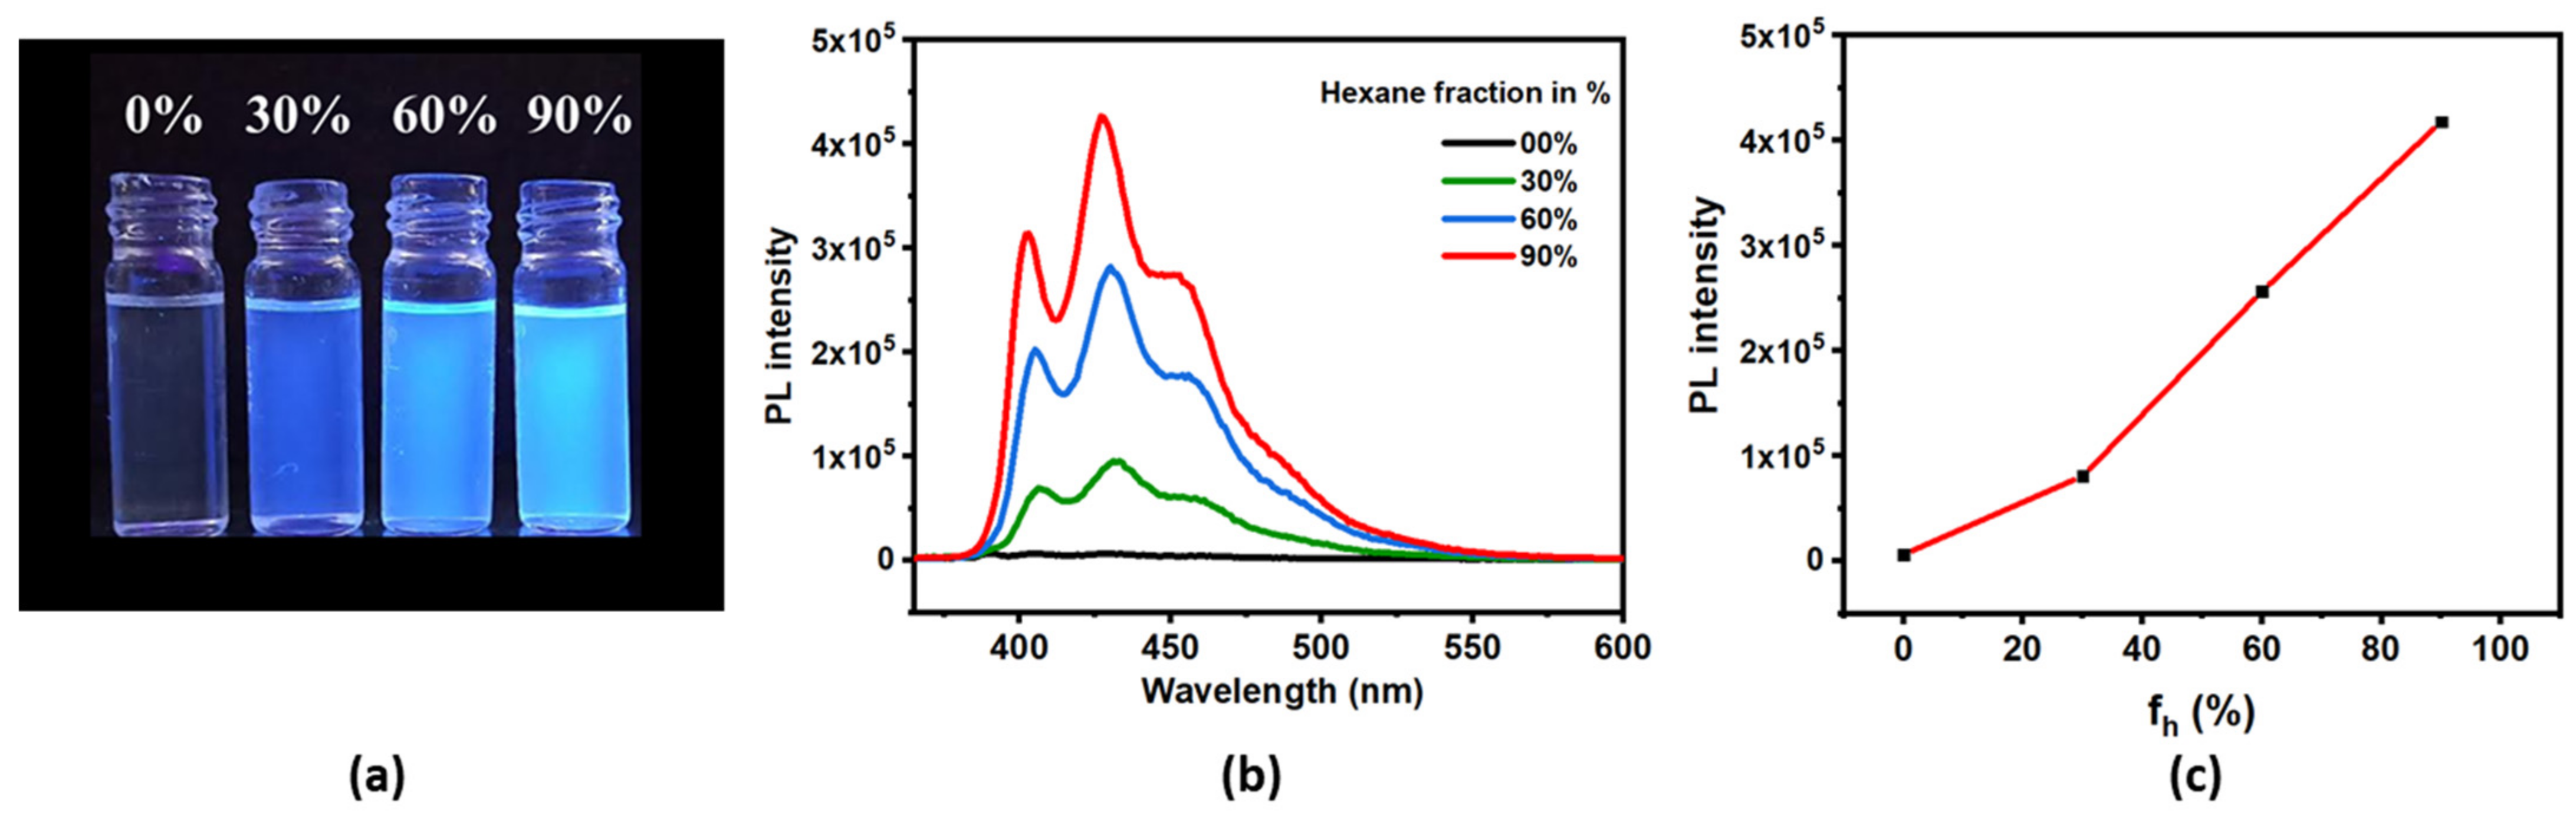
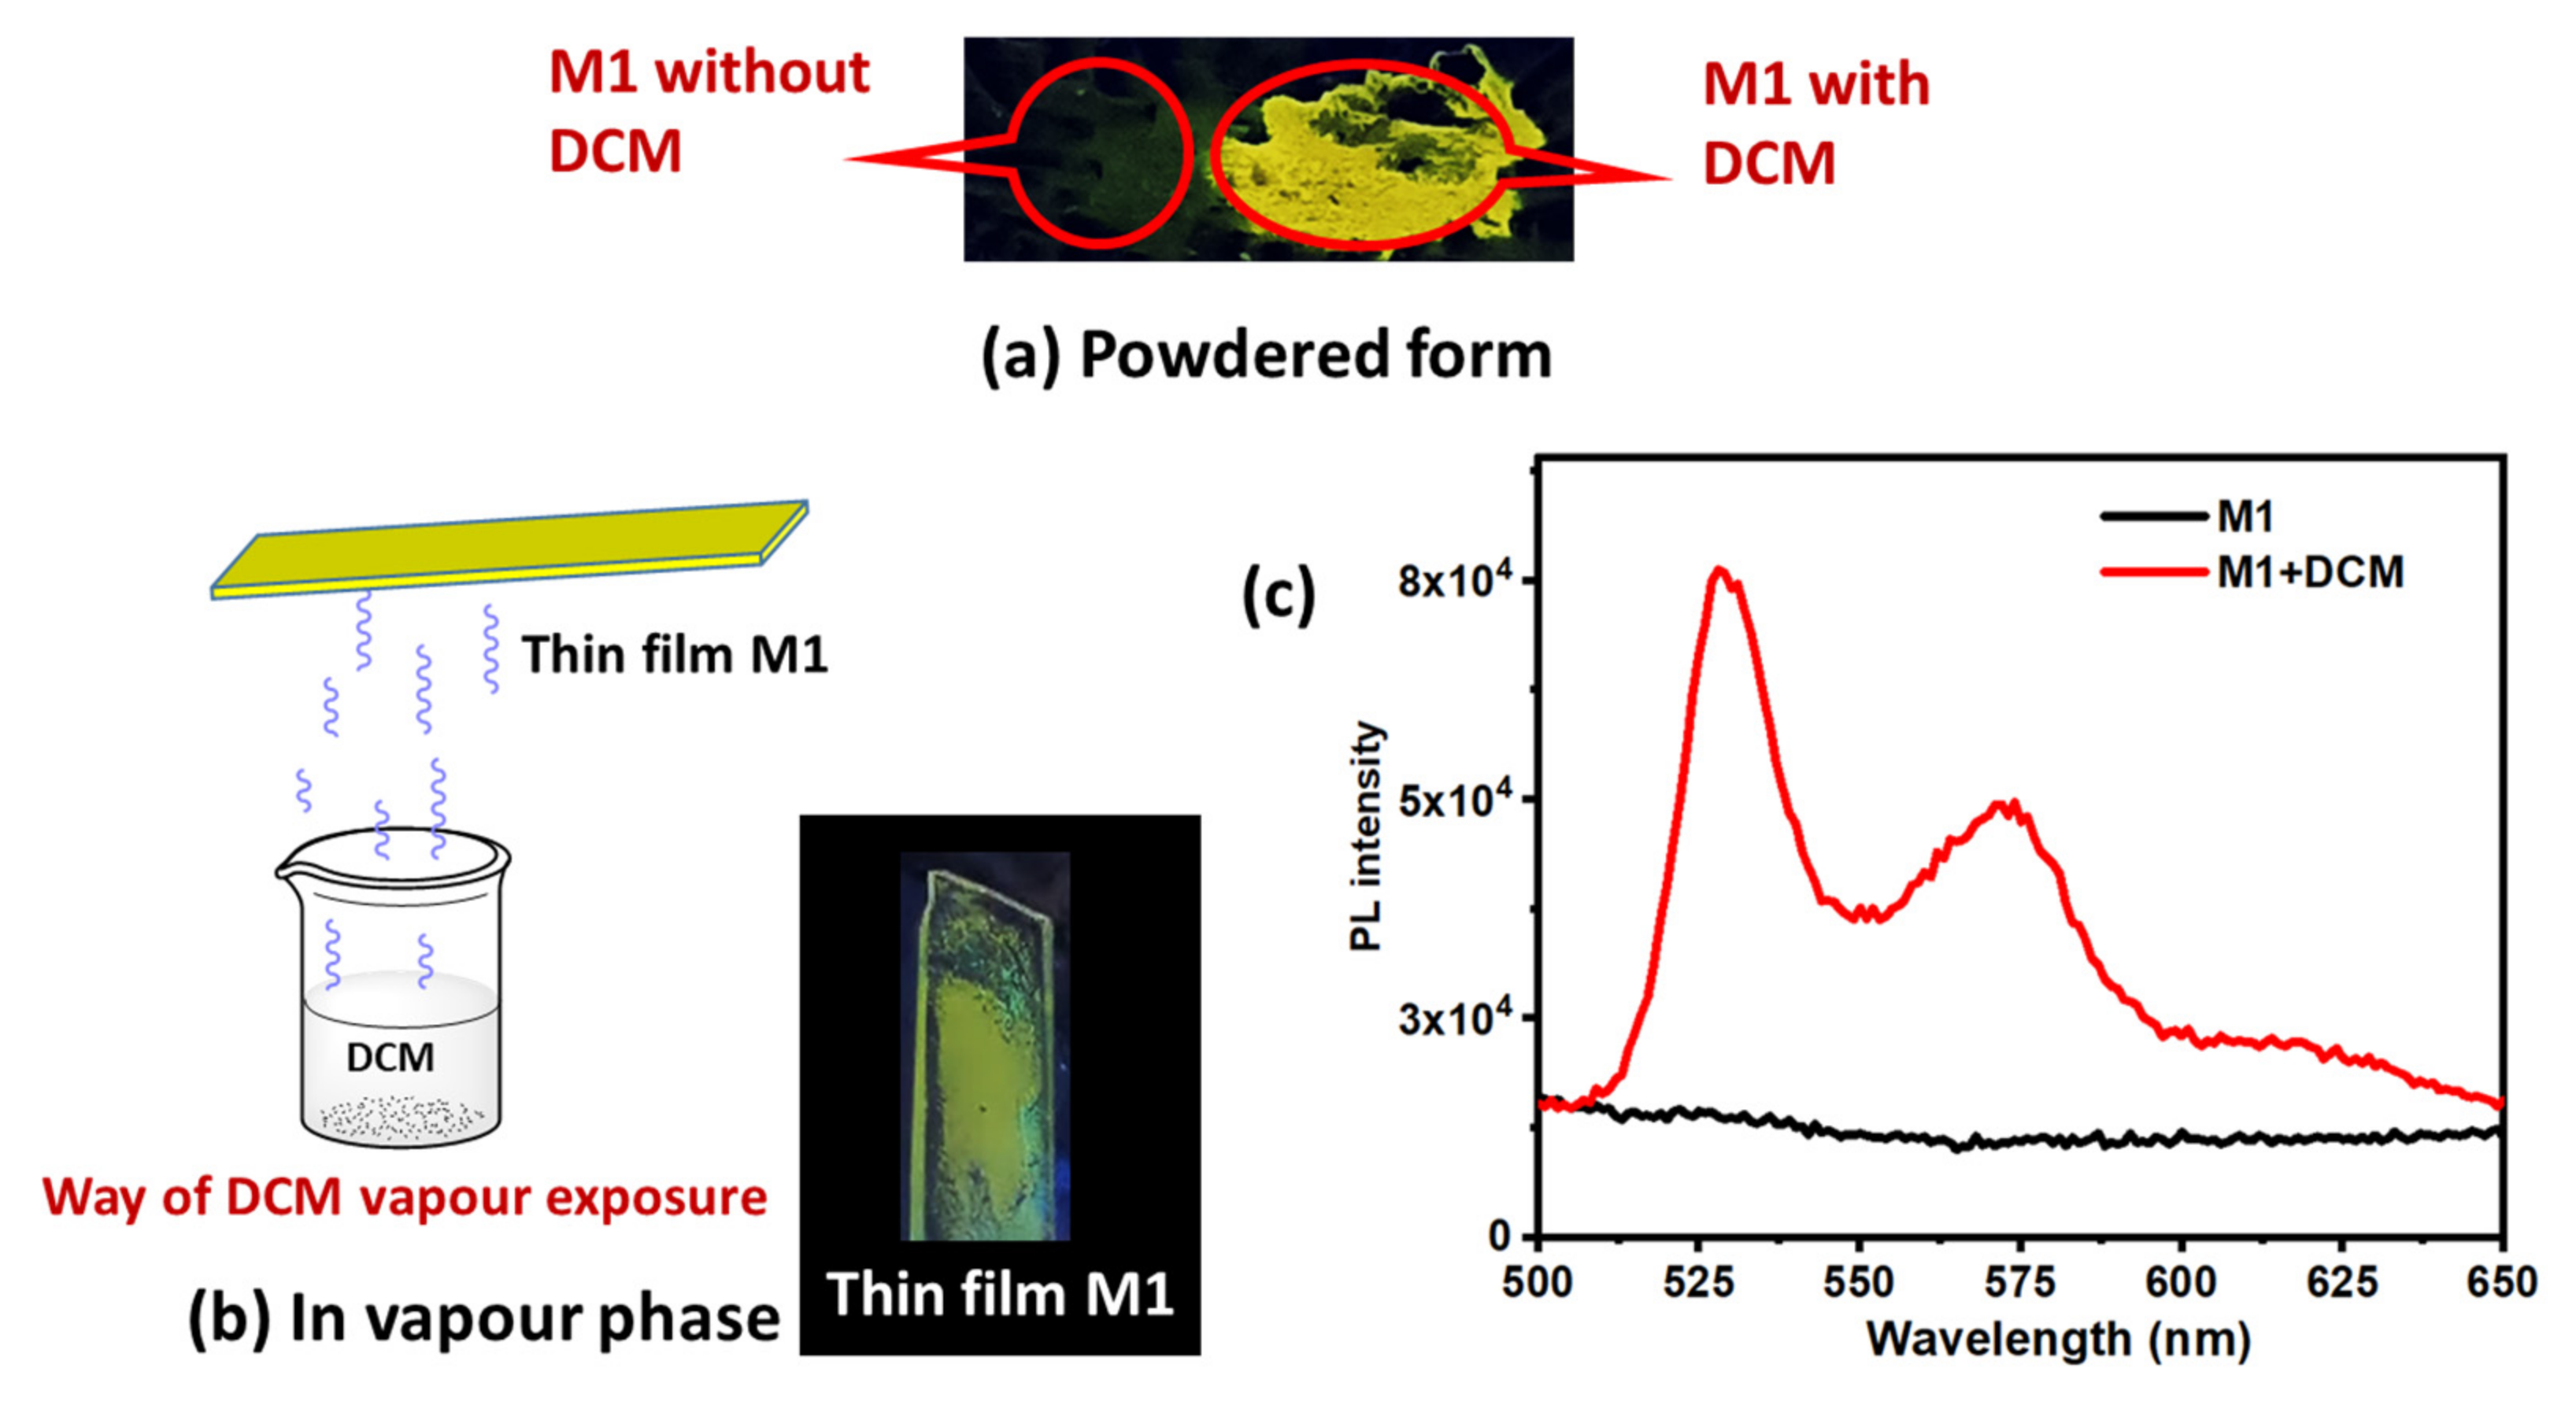
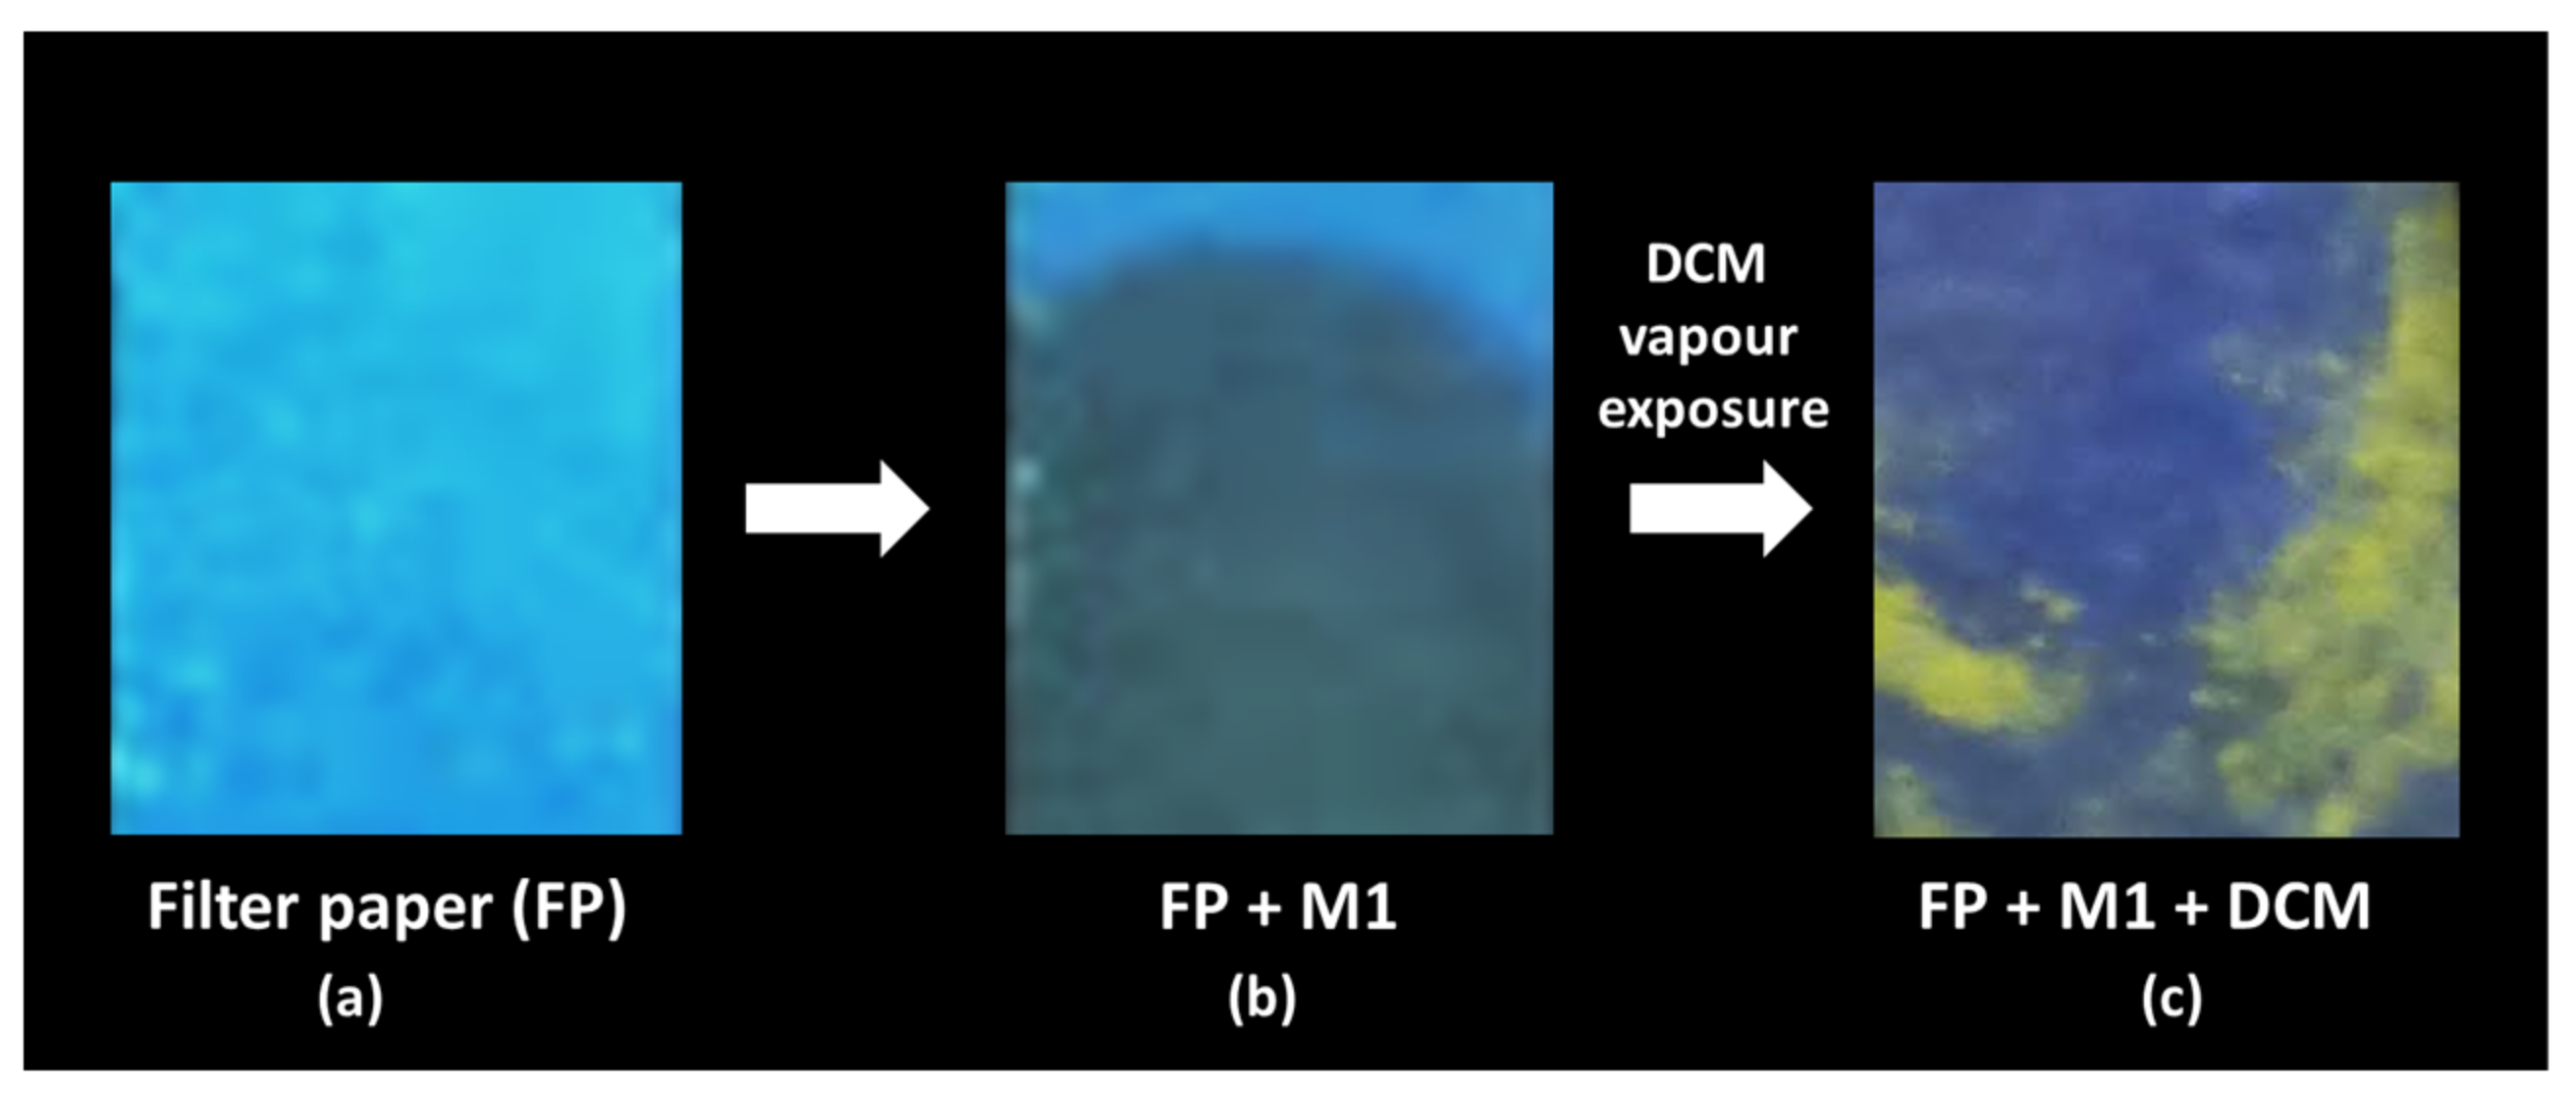
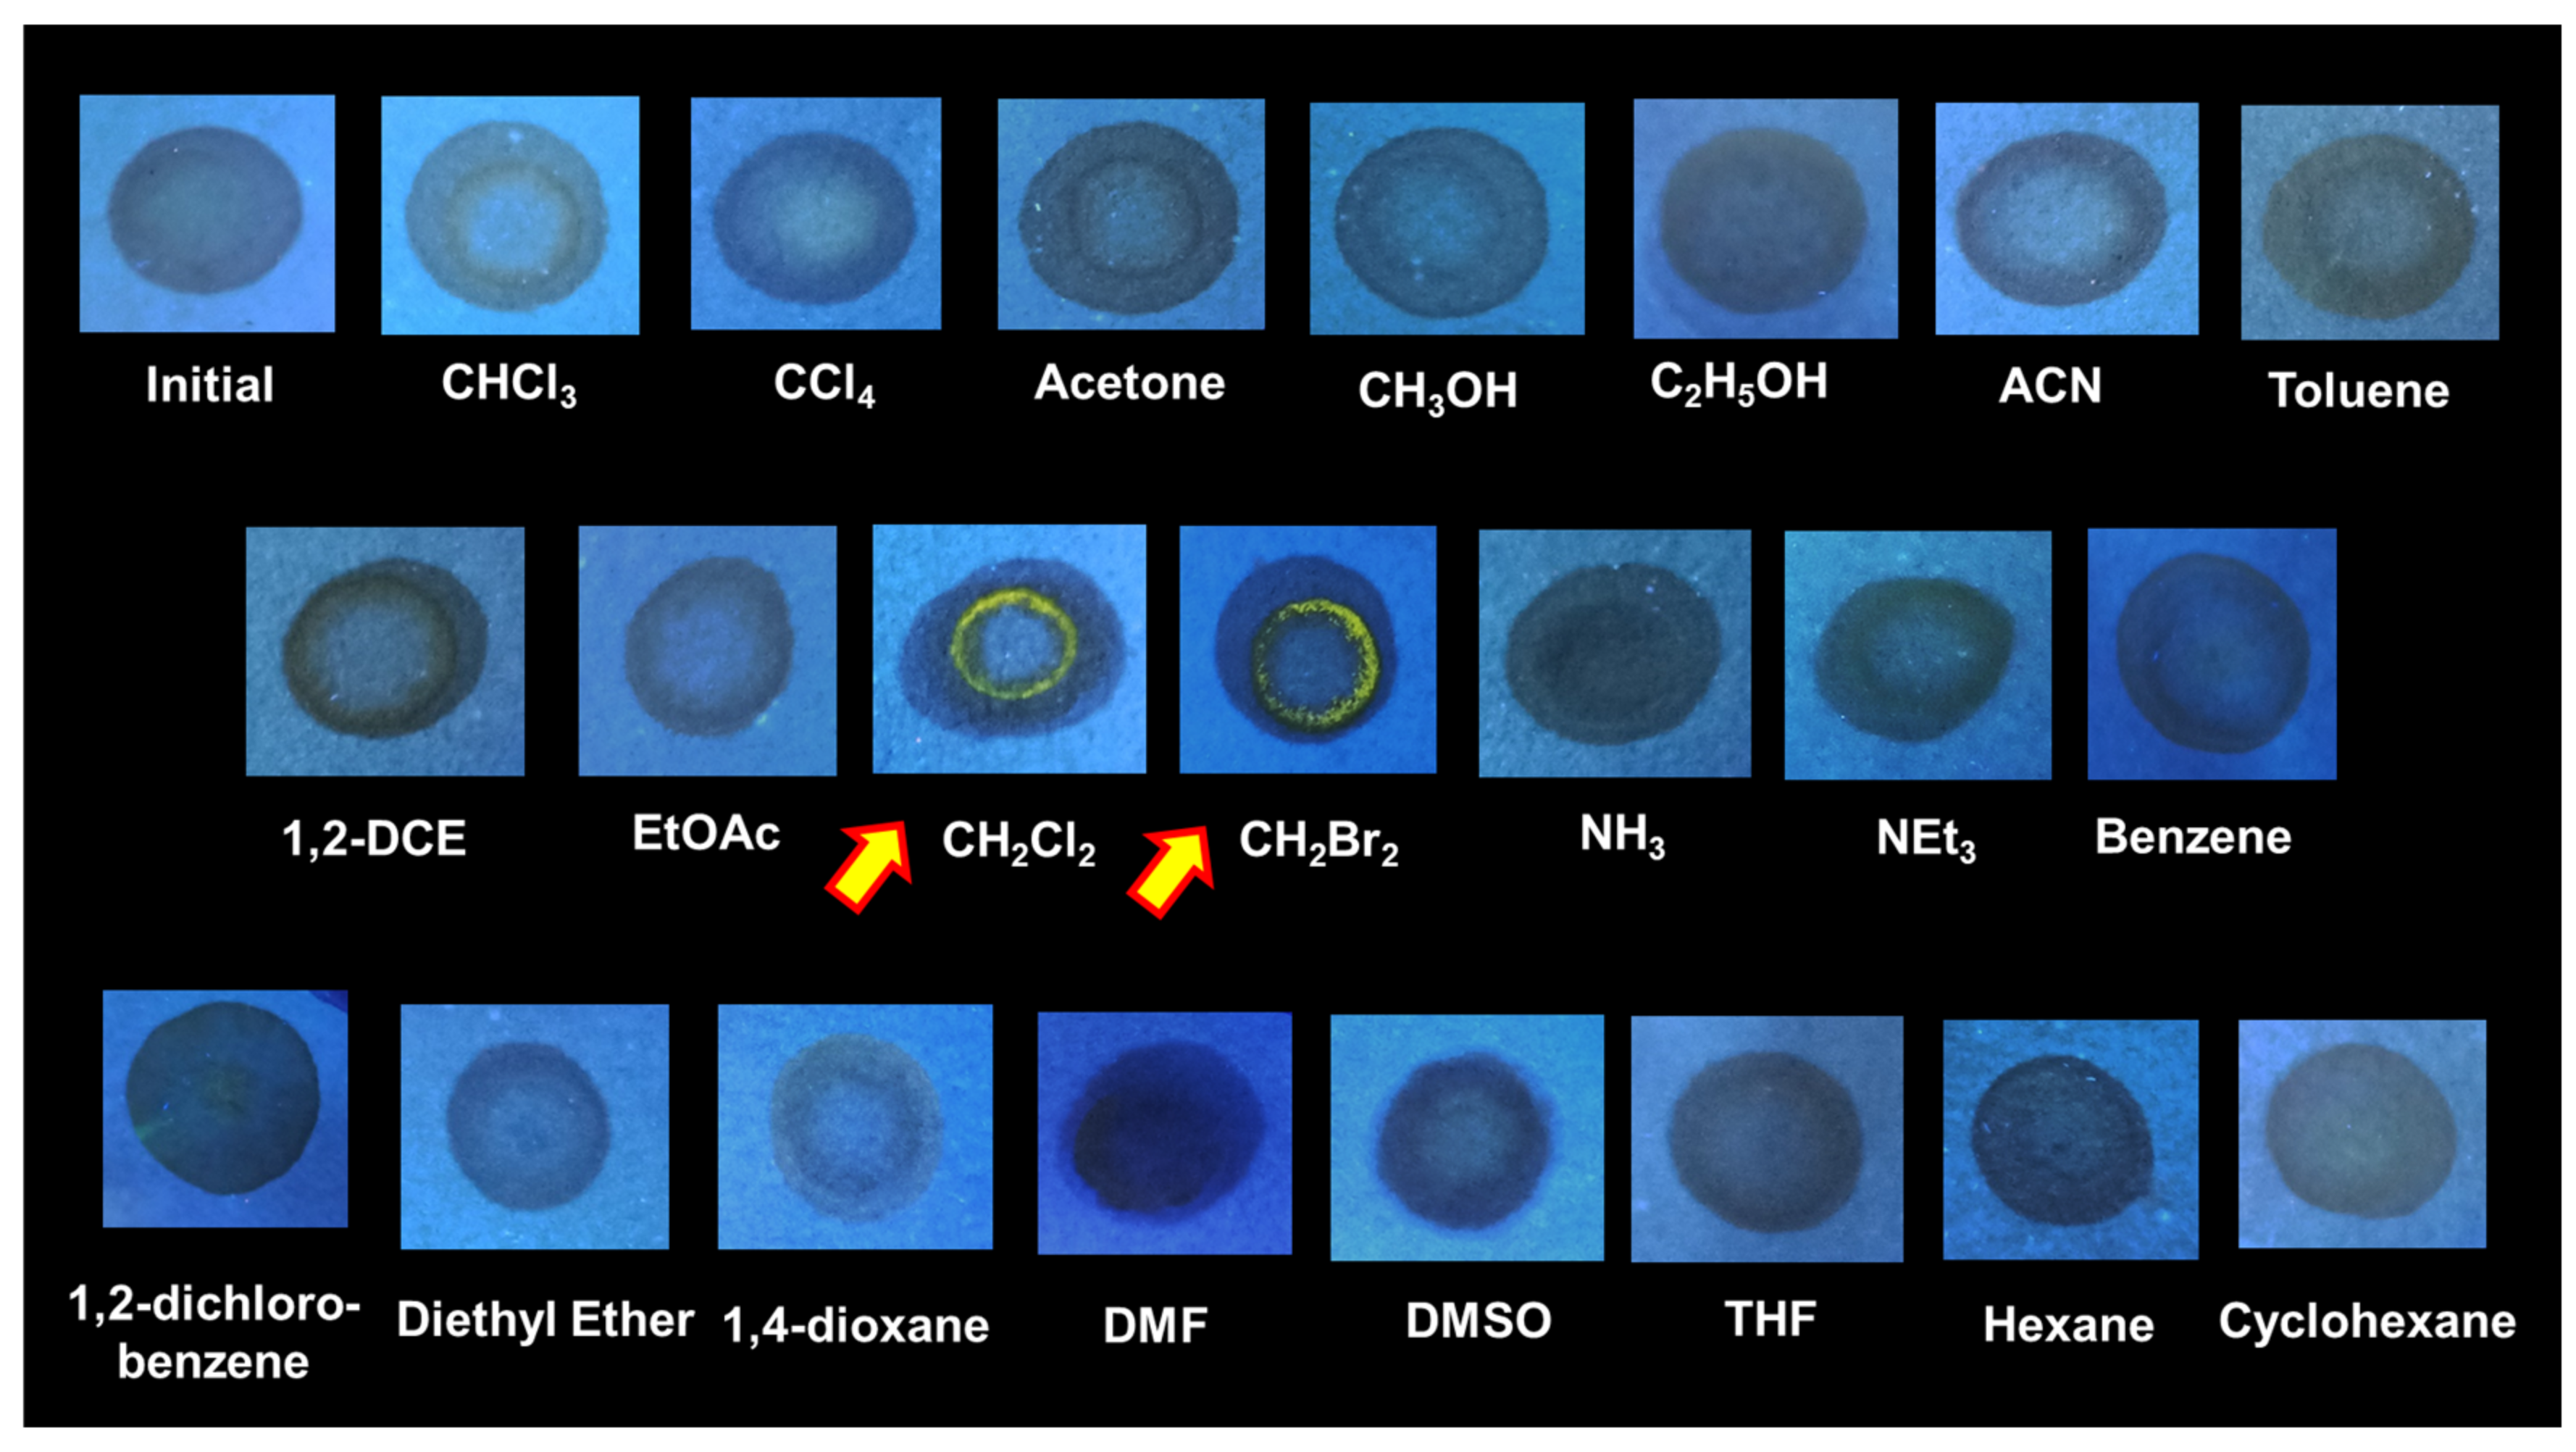
2. Results and Discussion
3. Materials and Methods
3.1. Materials
3.2. Instrumentation
3.3. Experimental Procedure
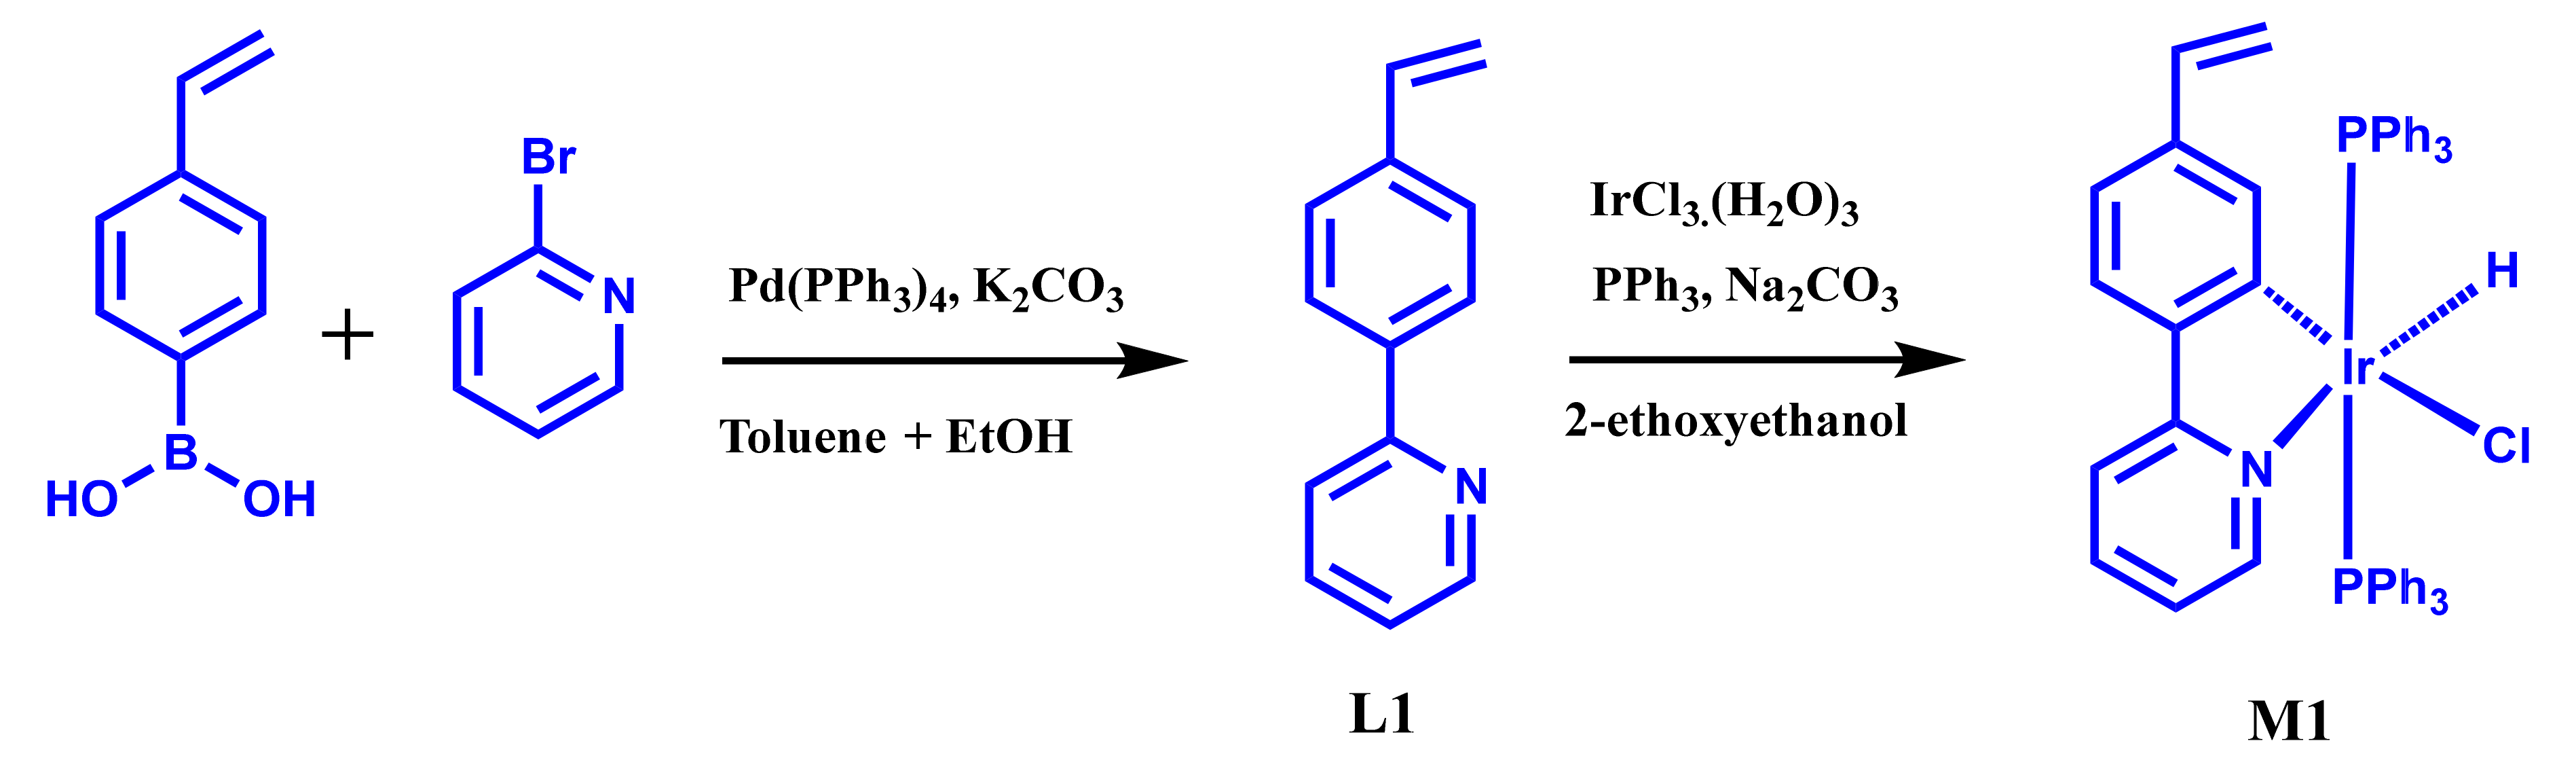
3.3.1. Synthesis of Ligand L1
3.3.2. Synthesis of Iridium Complex M1
4. Conclusions
Supplementary Materials
Author Contributions
Funding
Institutional Review Board Statement
Informed Consent Statement
Data Availability Statement
Acknowledgments
Conflicts of Interest
Sample Availability
References
- Li, H.-Y.; Zhao, S.-N.; Zang, S.-Q.; Li, J. Functional metal–organic frameworks as effective sensors of gases and volatile compounds. Chem. Soc. Rev. 2020, 49, 6364–6401. [Google Scholar] [CrossRef] [PubMed]
- Dichloromethane. IARC Monographs on the Evaluation of Carcinogenic Risks to Humans; IARC: Lyon, France, 1999; Volume 71, Pt 1, pp. 251–315. [Google Scholar]
- Morrison, R.D.; Murphy, B.L.; Doherty, R.E. 12—Chlorinated Solvents. In Environmental Forensics; Morrison, R.D., Murphy, B.L., Eds.; Academic Press: Burlington, VT, USA, 1964; pp. 259–277. [Google Scholar] [CrossRef]
- Vidal, S. Safety First: A Recent Case of a Dichloromethane Injection Injury. ACS Cent. Sci. 2020, 6, 83–86. [Google Scholar] [CrossRef] [Green Version]
- MacMillan, D.S.; Murray, J.; Sneddon, H.F.; Jamieson, C.; Watson, A.J.B. Replacement of dichloromethane within chromatographic purification: A guide to alternative solvents. Green Chem. 2012, 14, 3016–3019. [Google Scholar] [CrossRef] [Green Version]
- Han, J.; Yoon, S.M. Dichloromethane Detection Based on Near-Infrared Absorptive Sensing. IEEE J. Sel. Top. Quantum Electron. 2012, 18, 1547–1552. [Google Scholar] [CrossRef]
- Sakai, T.; Morita, Y.; Wakui, C. Biological monitoring of workers exposed to dichloromethane, using head-space gas chromatography. J. Chromatogr. B 2002, 778, 245–250. [Google Scholar] [CrossRef]
- Poli, D.; Manini, P.; Andreoli, R.; Franchini, I.; Mutti, A. Determination of dichloromethane, trichloroethylene and perchloroethylene in urine samples by headspace solid phase microextraction gas chromatography–mass spectrometry. J. Chromatogr. B 2005, 820, 95–102. [Google Scholar] [CrossRef]
- Lopes, N.; Hawkins, S.A.; Jegier, P.; Menn, F.-M.; Sayler, G.S.; Ripp, S. Detection of dichloromethane with a bioluminescent (lux) bacterial bioreporter. J. Ind. Microbiol. Biotechnol. 2012, 39, 45–53. [Google Scholar] [CrossRef] [PubMed]
- Jiang, Y.; Ma, J.; Lv, J.; Ma, H.; Xia, H.; Wang, J.; Yang, C.; Xue, M.; Li, G.; Zhu, N. Facile Wearable Vapor/Liquid Amphibious Methanol Sensor. ACS Sens. 2019, 4, 152–160. [Google Scholar] [CrossRef] [PubMed]
- Husain, A. Electrical conductivity based ammonia, methanol and acetone vapour sensing studies on newly synthesized polythiophene/molybdenum oxide nanocomposite. J. Sci. Adv. Mater. Devices 2021. [Google Scholar] [CrossRef]
- Zhang, H.; Niu, X.; Zhu, S.; Tian, M.; Liu, W. Synthesis, characterization, and enhanced aggregation-induced emission of oligomer methylacryloyl tetraphenylethylene and volatile organic compounds detection. J. Appl. Polym. Sci. 2021, 51699. [Google Scholar] [CrossRef]
- Duan, Y.; Liu, Y.; Han, H.; Zhang, X.; Zhang, M.; Liao, Y.; Han, T. A donor-π-acceptor aggregation-induced emission compound serving as a portable fluorescent sensor for detection and differentiation of methanol and ethanol in the gas phase. Spectrochim. Acta Part A Mol. Biomol. Spectrosc. 2021, 252, 119515. [Google Scholar] [CrossRef]
- Liu, Y.; Fan, Y.; Hou, C.; Du, W.; Zhang, D.; Liu, Y.; Xu, J.; Bai, Y.-L. Highly Selective Chloromethanes Detection Based on Quartz Crystal Microbalance Gas Sensors with Ba-MOFs. Inorg. Chem. 2021, 60, 16370–16377. [Google Scholar] [CrossRef]
- Liu, H.; Bai, Q.; Yao, L.; Zhang, H.; Xu, H.; Zhang, S.; Li, W.; Gao, Y.; Li, J.; Lu, P.; et al. Highly efficient near ultraviolet organic light-emitting diode based on a meta-linked donor–acceptor molecule. Chem. Sci. 2015, 6, 3797–3804. [Google Scholar] [CrossRef] [PubMed] [Green Version]
- Kramarenko, M.; Ferreira, C.G.; Martínez-Denegri, G.; Sansierra, C.; Toudert, J.; Martorell, J. Relation between Fluorescence Quantum Yield and Open-Circuit Voltage in Complete Perovskite Solar Cells. Sol. RRL 2020, 4, 1900554. [Google Scholar] [CrossRef]
- Alam, P.; Leung, N.L.C.; Zhang, J.; Kwok, R.T.K.; Lam, J.W.Y.; Tang, B.Z. AIE-based luminescence probes for metal ion detection. Coord. Chem. Rev. 2021, 429, 213693. [Google Scholar] [CrossRef]
- He, X.; Yang, Y.; Guo, Y.; Lu, S.; Du, Y.; Li, J.-J.; Zhang, X.; Leung, N.L.C.; Zhao, Z.; Niu, G.; et al. Phage-Guided Targeting, Discriminative Imaging, and Synergistic Killing of Bacteria by AIE Bioconjugates. J. Am. Chem. Soc. 2020, 142, 3959–3969. [Google Scholar] [CrossRef] [PubMed]
- Alam, P.; Kaur, G.; Chakraborty, S.; Roy Choudhury, A.; Laskar, I.R. “Aggregation induced phosphorescence” active “rollover” iridium(iii) complex as a multi-stimuli-responsive luminescence material. Dalton Trans. 2015, 44, 6581–6592. [Google Scholar] [CrossRef]
- Luo, J.; Xie, Z.; Lam, J.W.Y.; Cheng, L.; Chen, H.; Qiu, C.; Kwok, H.S.; Zhan, X.; Liu, Y.; Zhu, D.; et al. Aggregation-induced emission of 1-methyl-1,2,3,4,5-pentaphenylsilole. Chem. Commun. 2001, 1740–1741. [Google Scholar] [CrossRef] [PubMed]
- Fageria, L.; Pareek, V.; Dilip, R.V.; Bhargava, A.; Pasha, S.S.; Laskar, I.R.; Saini, H.; Dash, S.; Chowdhury, R.; Panwar, J. Biosynthesized Protein-Capped Silver Nanoparticles Induce ROS-Dependent Proapoptotic Signals and Prosurvival Autophagy in Cancer Cells. ACS Omega 2017, 2, 1489–1504. [Google Scholar] [CrossRef]
- Kim, H.; Choi, S.-K.; Ahn, J.; Yu, H.; Min, K.; Hong, C.; Shin, I.-S.; Lee, S.; Lee, H.; Im, H.; et al. Kaleidoscopic fluorescent arrays for machine-learning-based point-of-care chemical sensing. Sens. Actuators B: Chem. 2021, 329, 129248. [Google Scholar] [CrossRef]
- Hu, J.; Liu, Y.; Zhang, X.; Han, H.; Li, Z.; Han, T. Fabricating a mechanochromic AIE luminogen into a wearable sensor for volatile organic compound (VOC) detection. Dye. Pigment. 2021, 192, 109393. [Google Scholar] [CrossRef]
- Mo, K.-Q.; Ma, X.-F.; Wang, H.-L.; Zhu, Z.-H.; Liu, Y.-C.; Zou, H.-H.; Liang, F.-P. Tracking the Multistep Formation of Ln(III) Complexes with in situ Schiff Base Exchange Reaction and its Highly Selective Sensing of Dichloromethane. Sci. Rep. 2019, 9, 12231. [Google Scholar] [CrossRef] [PubMed] [Green Version]
- Liu, C.-Y.; Chen, X.-R.; Chen, H.-X.; Niu, Z.; Hirao, H.; Braunstein, P.; Lang, J.-P. Ultrafast Luminescent Light-Up Guest Detection Based on the Lock of the Host Molecular Vibration. J. Am. Chem. Soc. 2020, 142, 6690–6697. [Google Scholar] [CrossRef]
- Zhang, K.; Chen, T.-T.; Shen, Y.-J.; Yang, Z.-R.; Huang, Y.; Zhang, S.; Xue, J.; Li, B. An N-linked disalicylaldehyde together with its caesium ion and dichloromethane sensing performances: ‘dual key & lock’ LMCT-enhanced fluorescence strategy. Analyst 2020, 145, 5826–5835. [Google Scholar] [CrossRef]
- Wang, H.; Zhan, S.; Wu, X.; Wu, L.; Liu, Y. Nanoporous fluorescent sensor based on upconversion nanoparticles for the detection of dichloromethane with high sensitivity. RSC Adv. 2021, 11, 565–571. [Google Scholar] [CrossRef]
- Alam, P.; Kaur, G.; Kachwal, V.; Gupta, A.; Roy Choudhury, A.; Laskar, I.R. Highly sensitive explosive sensing by “aggregation induced phosphorescence” active cyclometalated iridium(iii) complexes. J. Mater. Chem. C 2015, 3, 5450–5456. [Google Scholar] [CrossRef]
- García-Sánchez, F.; Romero-Martínez, A.; Trejo, A. Vapour pressure, critical temperature, and critical pressure of dichloromethane. J. Chem. Thermodyn. 1989, 21, 823–826. [Google Scholar] [CrossRef]
- Schlosser Paul, M.; Bale Ambuja, S.; Gibbons Catherine, F.; Wilkins, A.; Cooper Glinda, S. Human Health Effects of Dichloromethane: Key Findings and Scientific Issues. Environ. Health Perspect. 2015, 123, 114–119. [Google Scholar] [CrossRef] [Green Version]
- Berger, G.; Soubhye, J.; Wintjens, R.; Robeyns, K.; Meyer, F. Crystal packing and theoretical analysis of halogen- and hydrogen-bonded hydrazones from pharmaceuticals. Evidence of type I and II halogen bonds in extended chains of di\-chloro\-methane. Acta Crystallogr. Sect. B 2018, 74, 618–627. [Google Scholar] [CrossRef]
- Ivanov, D.M.; Kinzhalov, M.A.; Novikov, A.S.; Ananyev, I.V.; Romanova, A.A.; Boyarskiy, V.P.; Haukka, M.; Kukushkin, V.Y. H2C(X)–X···X– (X = Cl, Br) Halogen Bonding of Dihalomethanes. Cryst. Growth Des. 2017, 17, 1353–1362. [Google Scholar] [CrossRef] [Green Version]
- Cavallo, G.; Metrangolo, P.; Milani, R.; Pilati, T.; Priimagi, A.; Resnati, G.; Terraneo, G. The Halogen Bond. Chem. Rev. 2016, 116, 2478–2601. [Google Scholar] [CrossRef] [Green Version]
- Berger, G.; Frangville, P.; Meyer, F. Halogen bonding for molecular recognition: New developments in materials and biological sciences. Chem. Commun. 2020, 56, 4970–4981. [Google Scholar] [CrossRef] [PubMed]
- Kurzydłowski, D.; Chumak, T.; Rogoża, J. Phase Stability of Chloroform and Dichloromethane at High Pressure. Crystals 2020, 10, 920. [Google Scholar] [CrossRef]
- Lin-Vien, D.; Colthup, N.B.; Fateley, W.G.; Grasselli, J.G. CHAPTER 6—Alkenes. In The Handbook of Infrared and Raman Characteristic Frequencies of Organic Molecules; Lin-Vien, D., Colthup, N.B., Fateley, W.G., Grasselli, J.G., Eds.; Academic Press: San Diego, CA, USA, 1991; pp. 73–94. [Google Scholar] [CrossRef]
- Garcia, M.A.S.; Ibrahim, M.; Costa, J.C.S.; Corio, P.; Gusevskaya, E.V.; dos Santos, E.N.; Philippot, K.; Rossi, L.M. Study of the influence of PPh3 used as capping ligand or as reaction modifier for hydroformylation reaction involving Rh NPs as precatalyst. Appl. Catal. A: Gen. 2017, 548, 136–142. [Google Scholar] [CrossRef]
- APPENDIX 3—A Summary of Characteristic Raman and Infrared Frequencies. In The Handbook of Infrared and Raman Characteristic Frequencies of Organic Molecules; Lin-Vien, D.; Colthup, N.B.; Fateley, W.G.; Grasselli, J.G. (Eds.) Academic Press: San Diego, CA, USA, 1991; pp. 477–490. [Google Scholar] [CrossRef]
- Mei, J.; Hong, Y.; Lam, J.W.Y.; Qin, A.; Tang, Y.; Tang, B.Z. Aggregation-Induced Emission: The Whole Is More Brilliant than the Parts. Adv. Mater. 2014, 26, 5429–5479. [Google Scholar] [CrossRef] [PubMed]


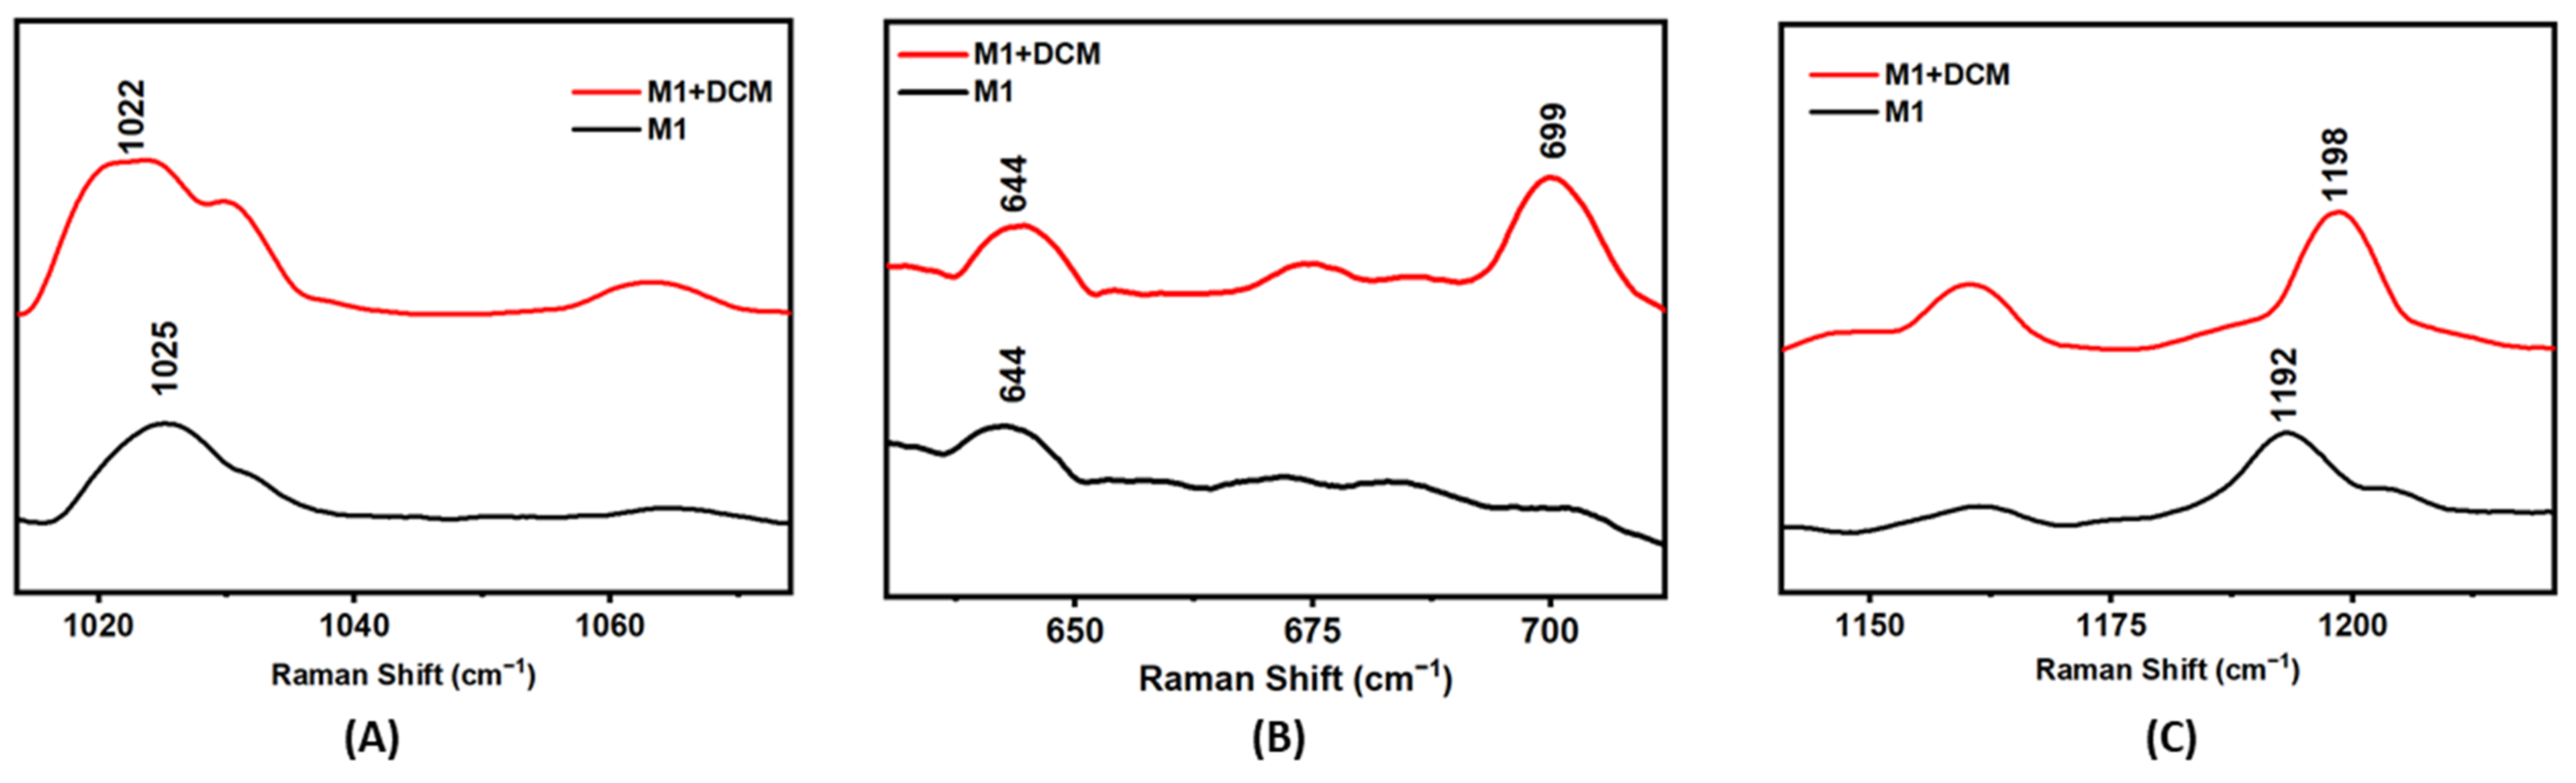
| Raman Shifts (cm−1) | ||||
|---|---|---|---|---|
| Vibrational Modes | DCM only | DCM (in M1+DCM) | M1 only | M1 (in M1+DCM) |
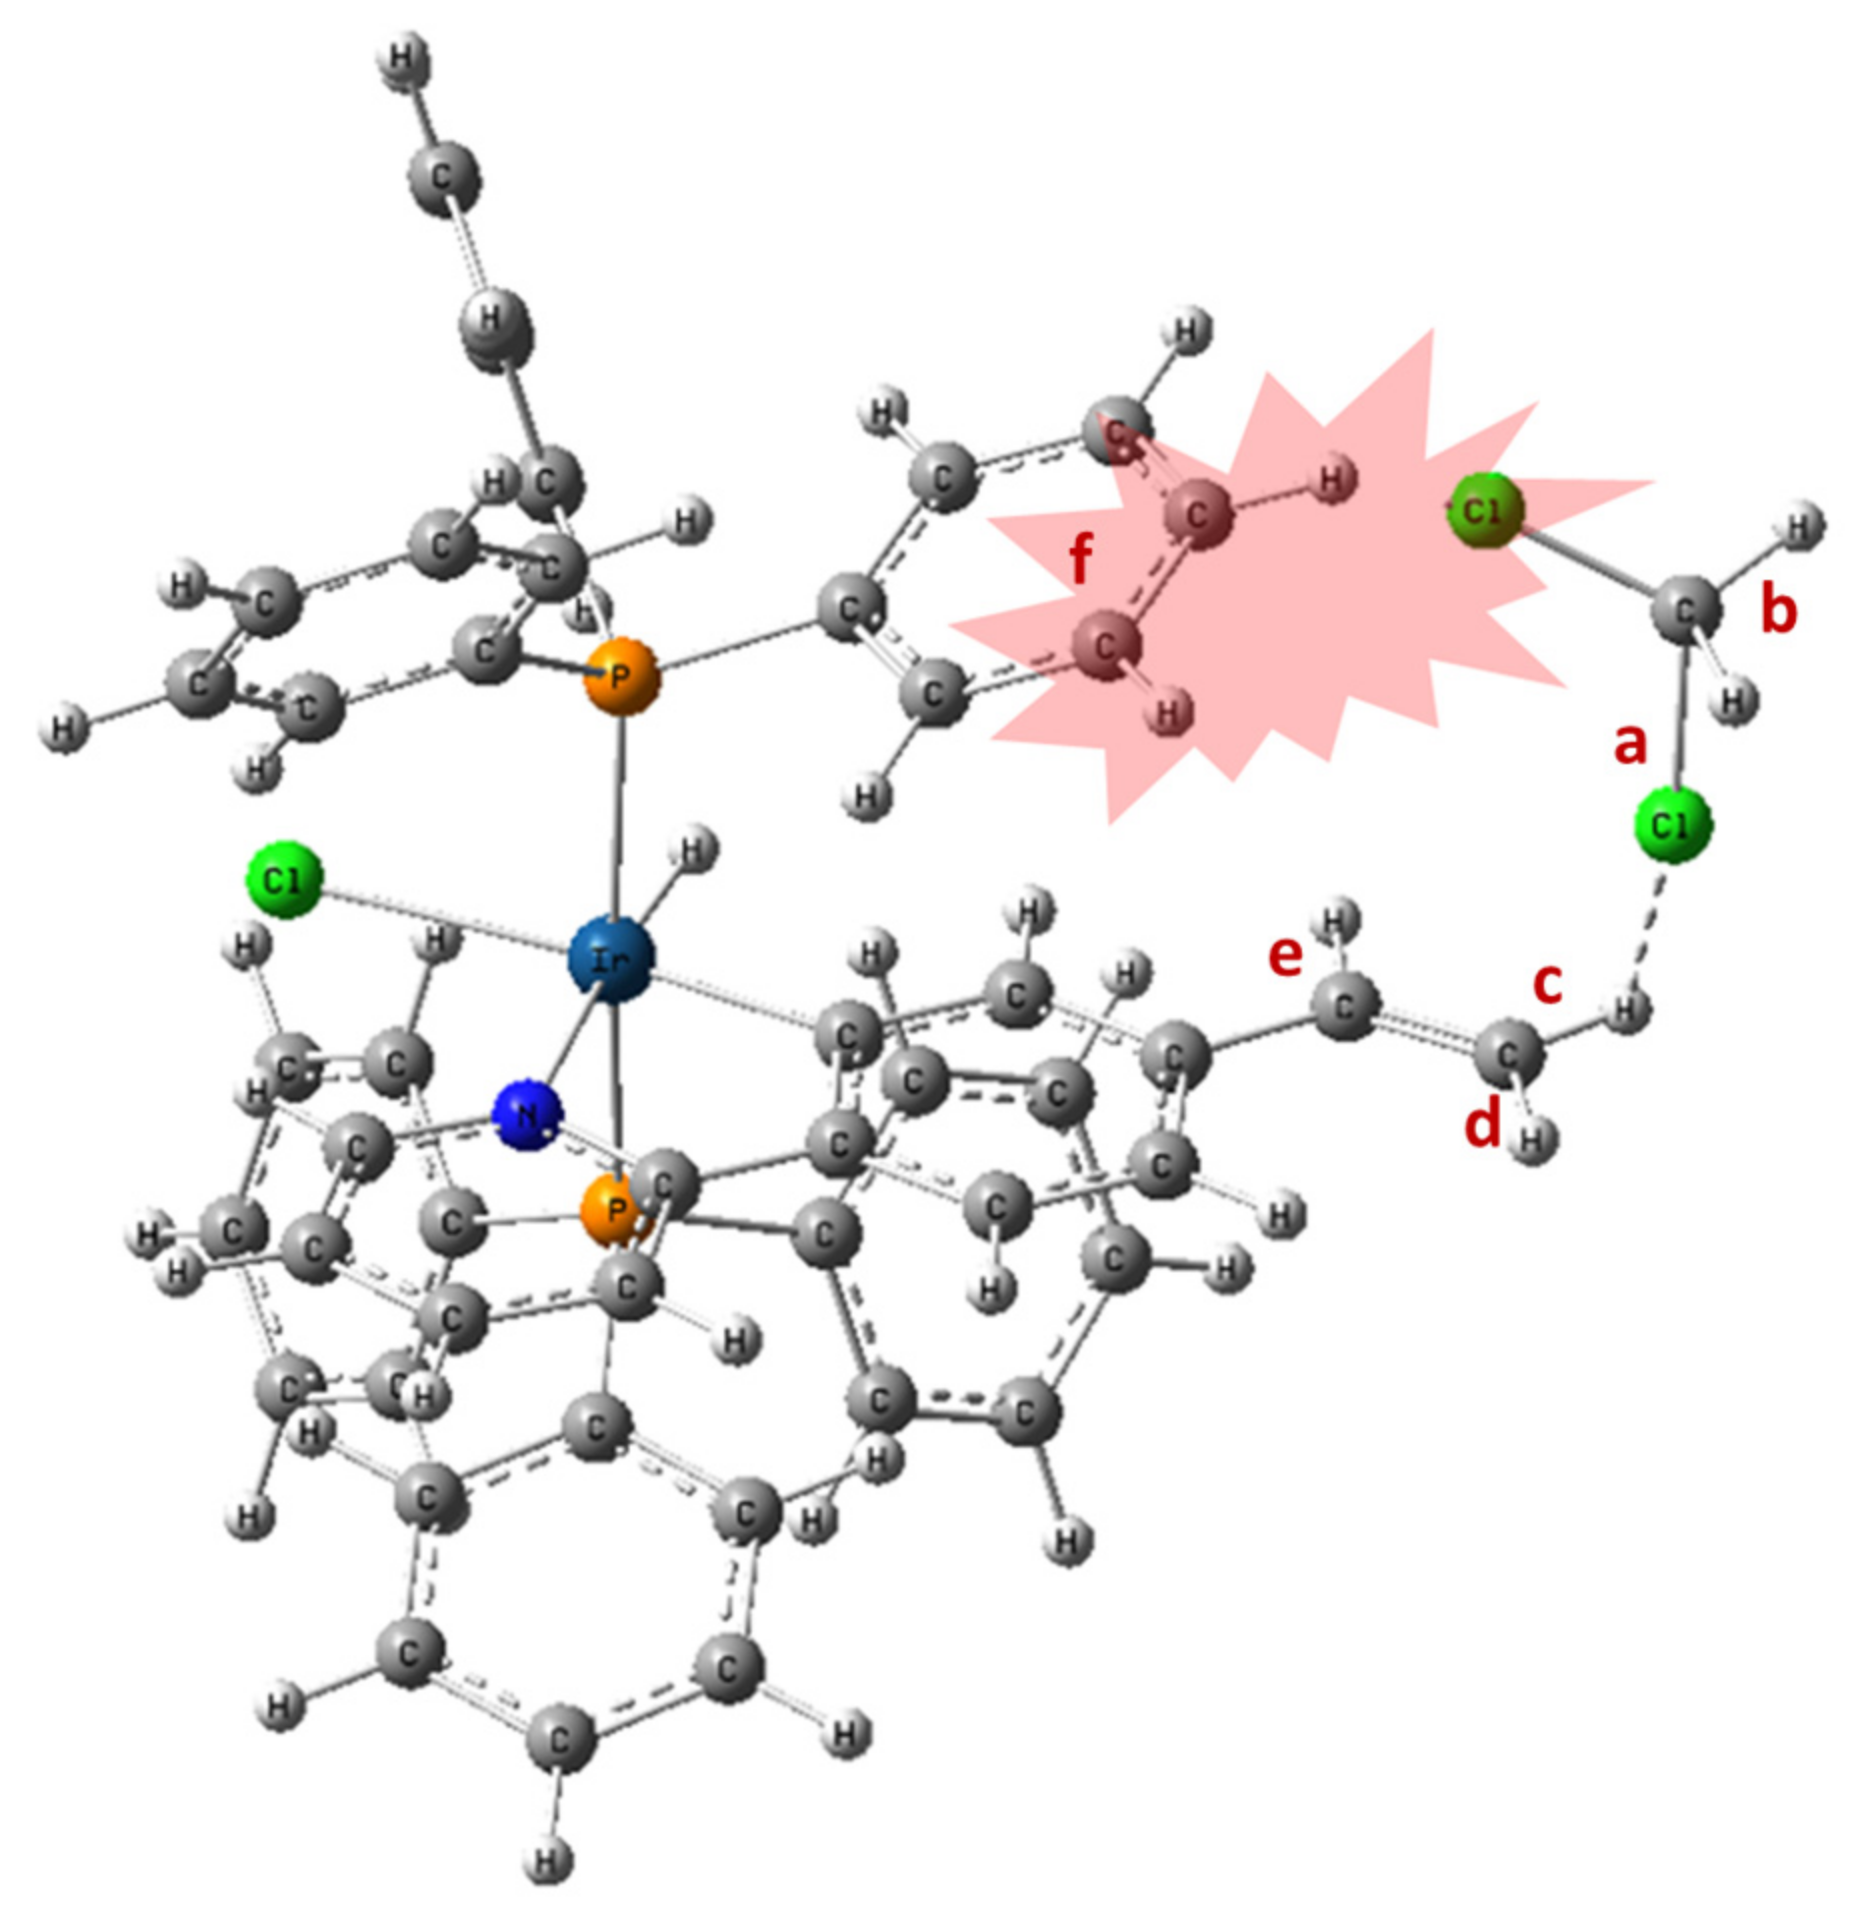
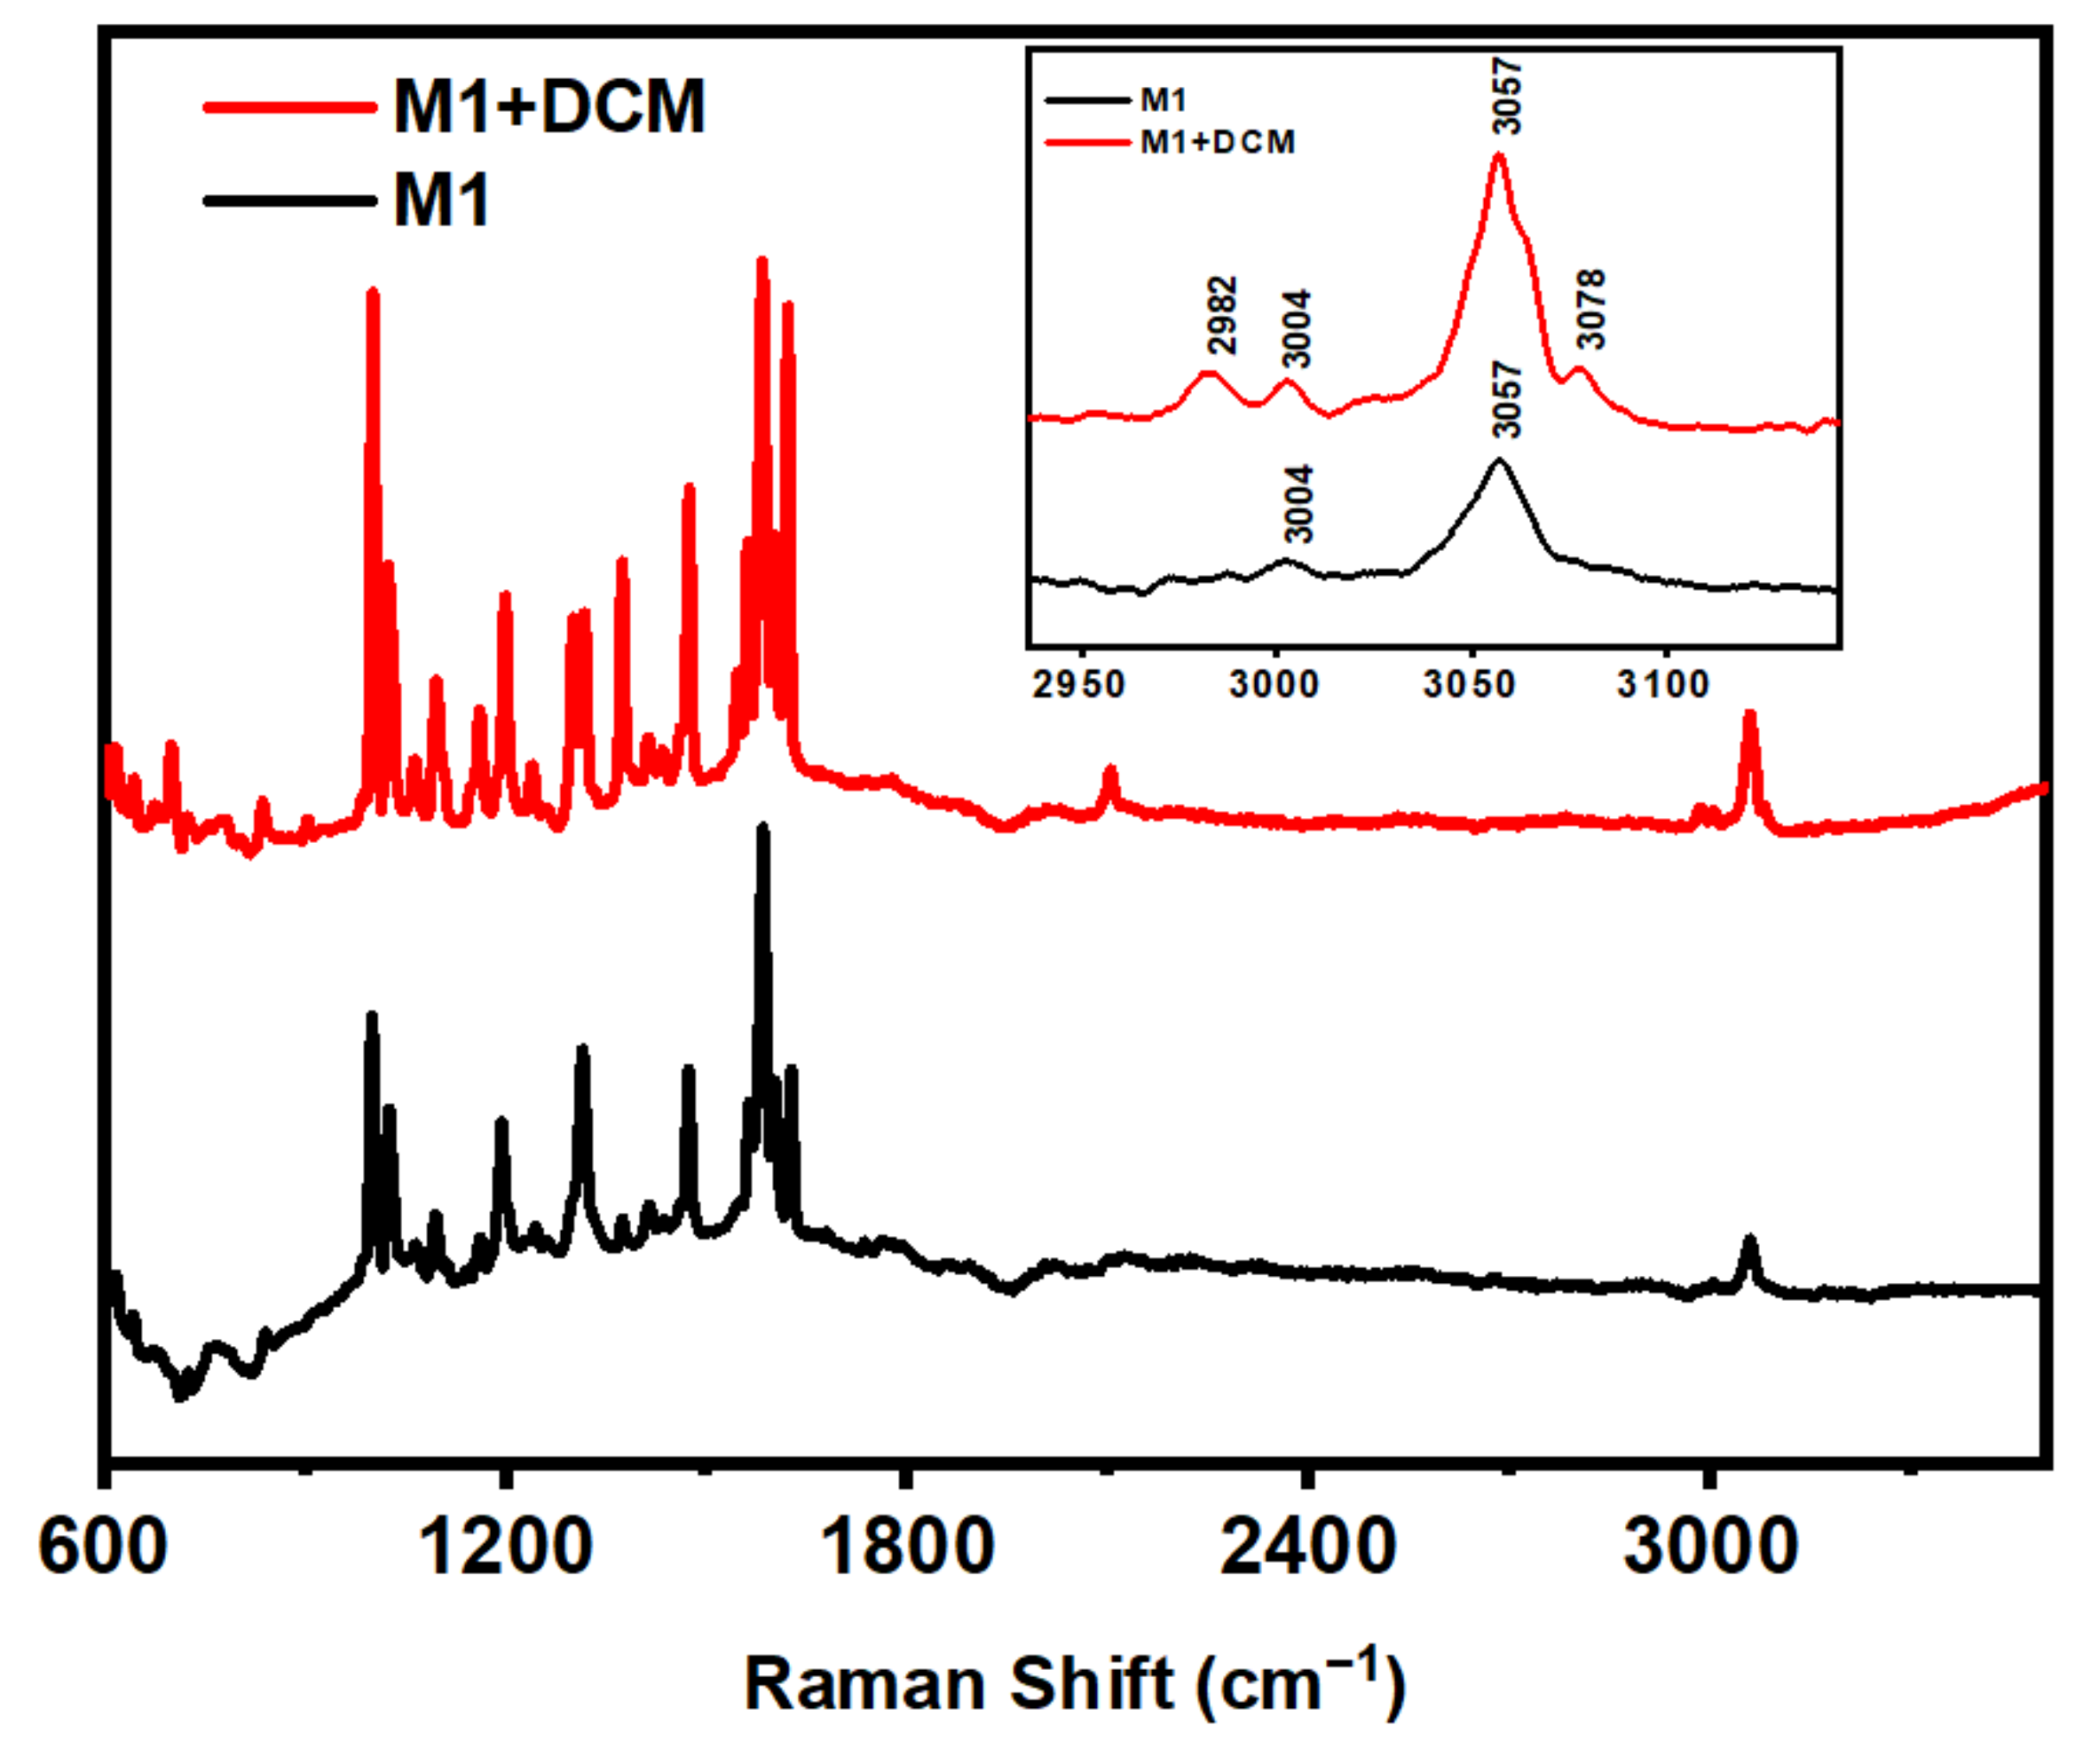
| C-Cl symmetric stretching (a) | 713 | 699 | - | - |
| C-H symmetric stretching (b) | 2996 | 2982 | - | - |
| C-H bending (c) | - | - | 1025 | 1022 |
| C-H bending (d) | - | - | 644 | 644 |
| C-H stretching (e) | - | - | 3057 | 3057 |
| C-H antisymmetric stretching of vinylic carbon (=CH2) (c, d) | - | - | - | 3078 |
| C-H symmetric stretching of vinylic carbon (=CH2) (c, d) | - | - | 3004 | 3004 |
| Phenyl ring vibrations of triphenylphosphine (PPh3) (f) | - | - | 1192 | 1198 |
Publisher’s Note: MDPI stays neutral with regard to jurisdictional claims in published maps and institutional affiliations. |
© 2021 by the authors. Licensee MDPI, Basel, Switzerland. This article is an open access article distributed under the terms and conditions of the Creative Commons Attribution (CC BY) license (https://creativecommons.org/licenses/by/4.0/).
Share and Cite
Raichure, P.C.; Kachwal, V.; Laskar, I.R. ‘Aggregation-Induced Emission’ Active Mono-Cyclometalated Iridium(III) Complex Mediated Efficient Vapor-Phase Detection of Dichloromethane. Molecules 2022, 27, 202. https://0-doi-org.brum.beds.ac.uk/10.3390/molecules27010202
Raichure PC, Kachwal V, Laskar IR. ‘Aggregation-Induced Emission’ Active Mono-Cyclometalated Iridium(III) Complex Mediated Efficient Vapor-Phase Detection of Dichloromethane. Molecules. 2022; 27(1):202. https://0-doi-org.brum.beds.ac.uk/10.3390/molecules27010202
Chicago/Turabian StyleRaichure, Pramod C., Vishal Kachwal, and Inamur Rahaman Laskar. 2022. "‘Aggregation-Induced Emission’ Active Mono-Cyclometalated Iridium(III) Complex Mediated Efficient Vapor-Phase Detection of Dichloromethane" Molecules 27, no. 1: 202. https://0-doi-org.brum.beds.ac.uk/10.3390/molecules27010202