
Purification of Hydrogen from CO with Cu/ZSM-5 Adsorbents

 , and
, and
Abstract
:
1. Introduction
2. Results
2.1. Initial Characterization of the Samples
2.1.1. Chemical Composition
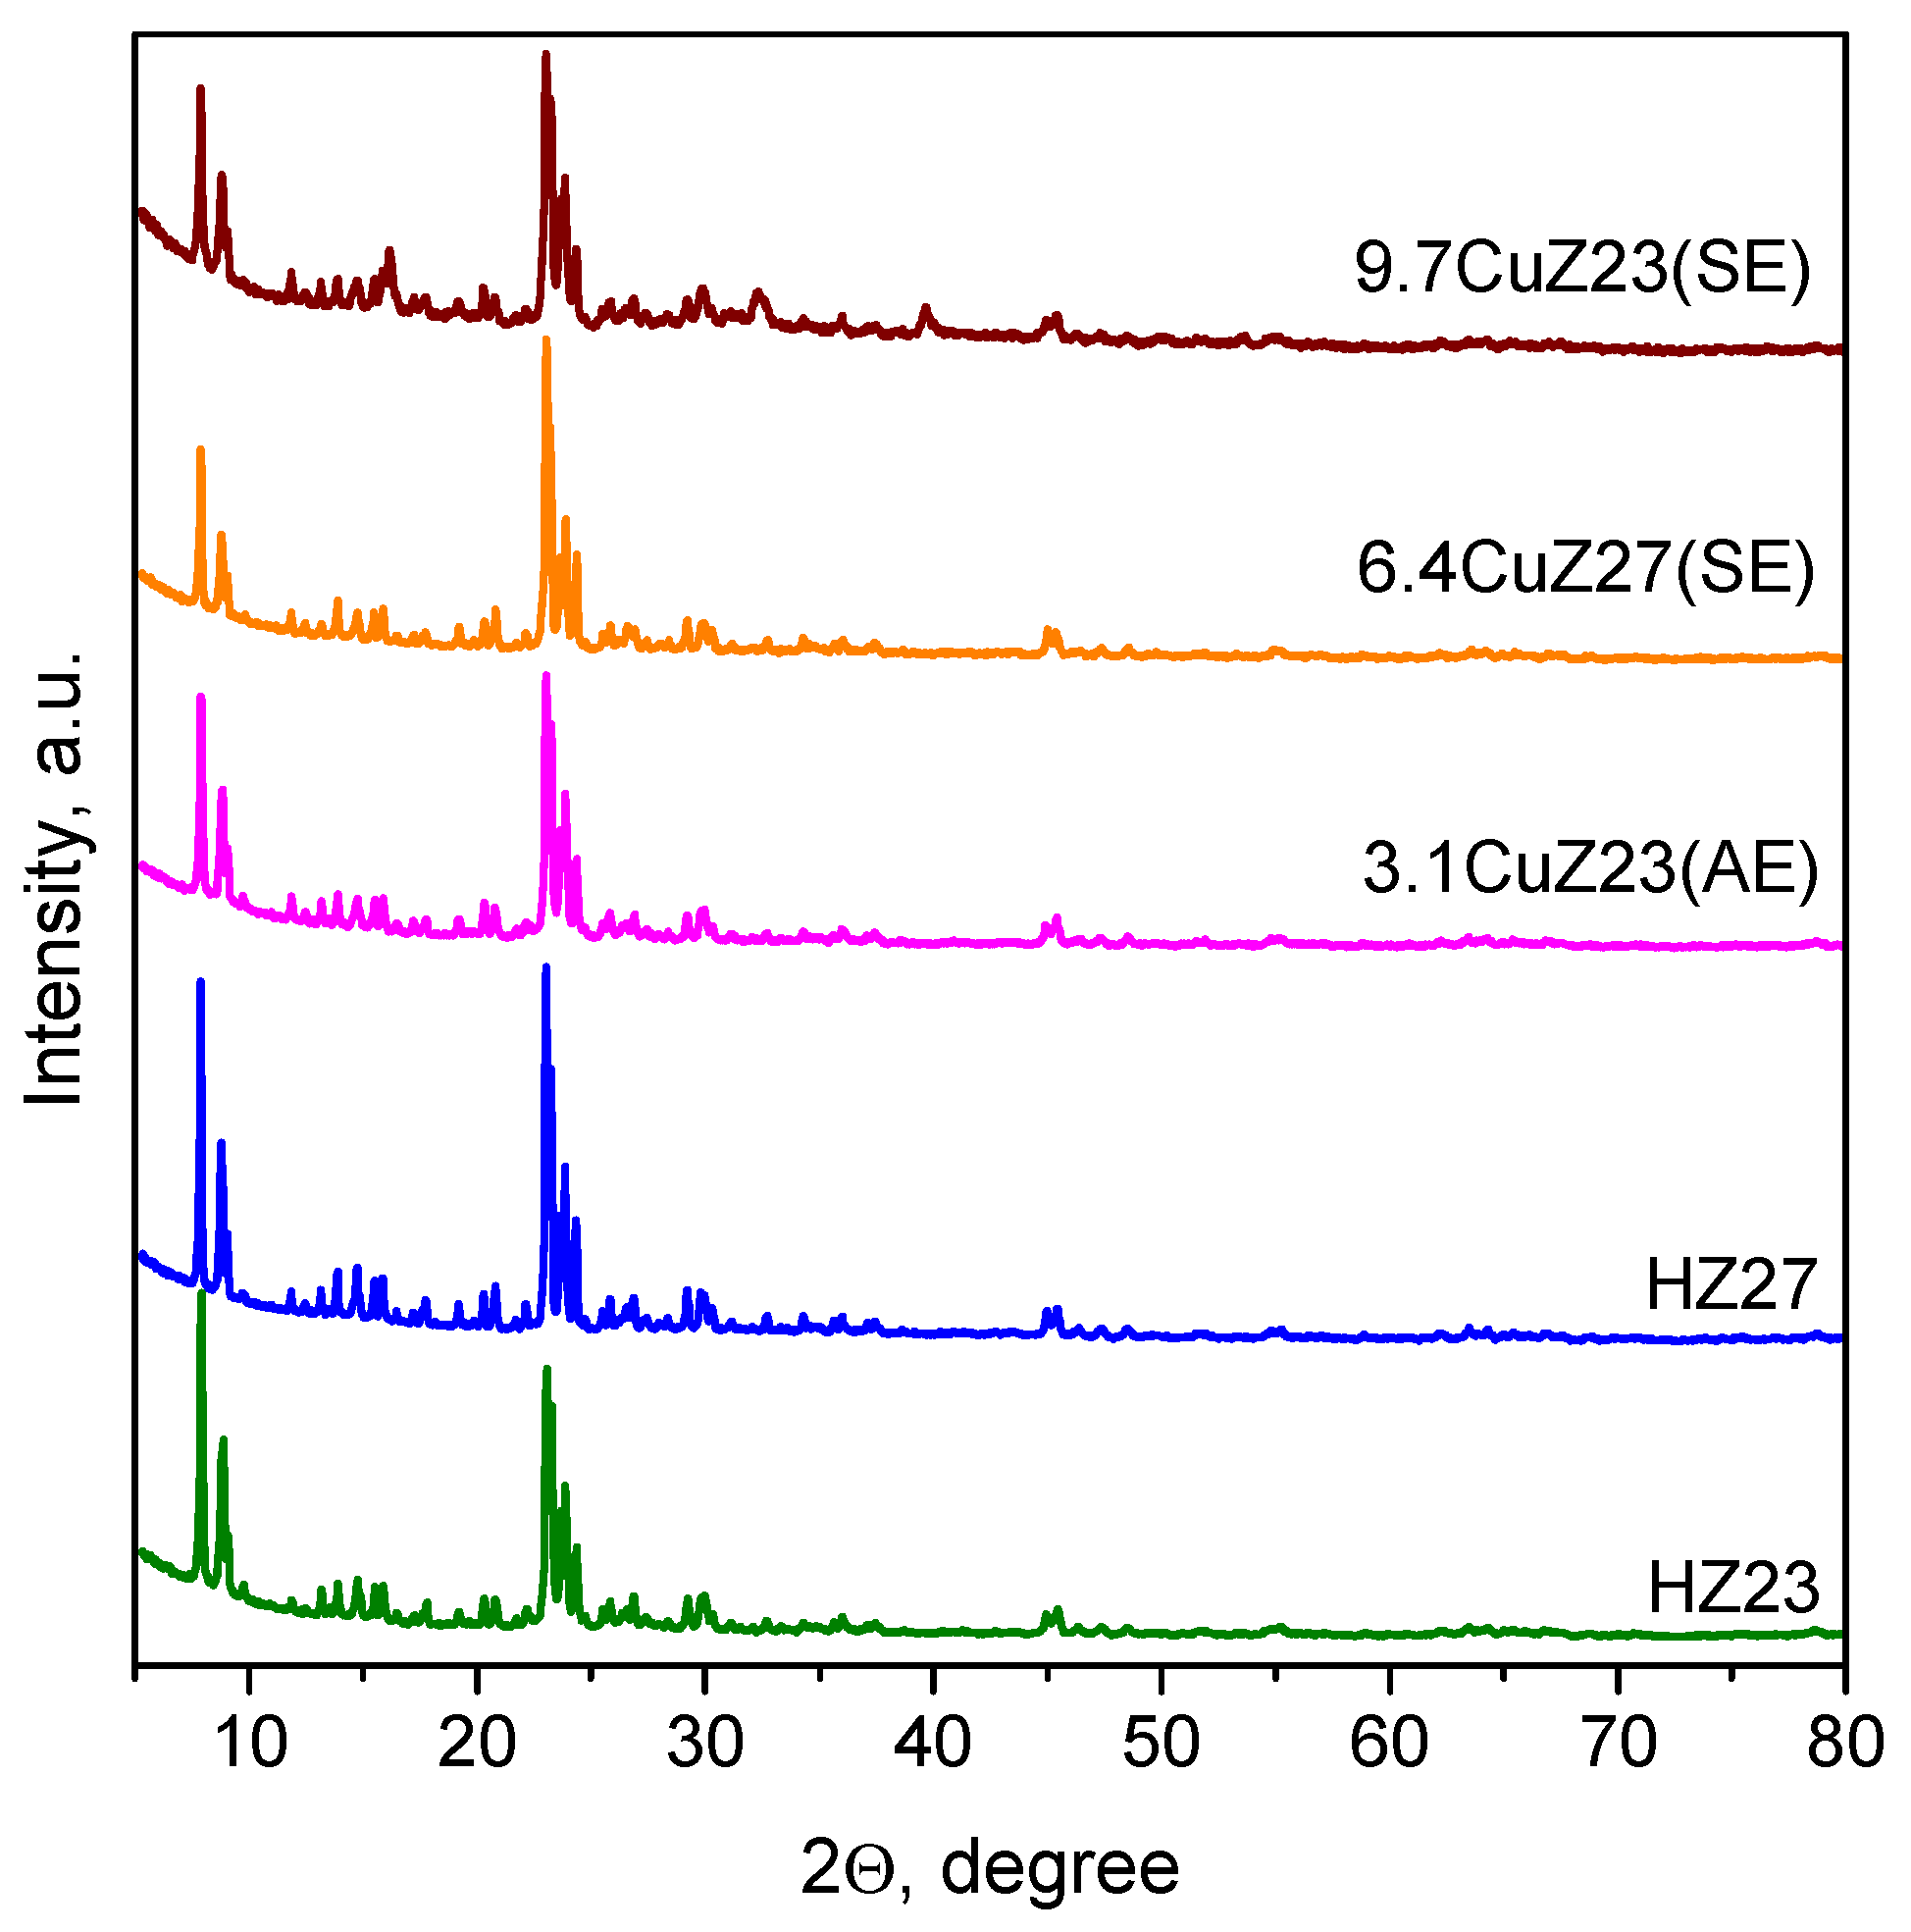
2.1.2. Phase Composition and Morphological Characteristics
2.1.3. Textural Characteristics
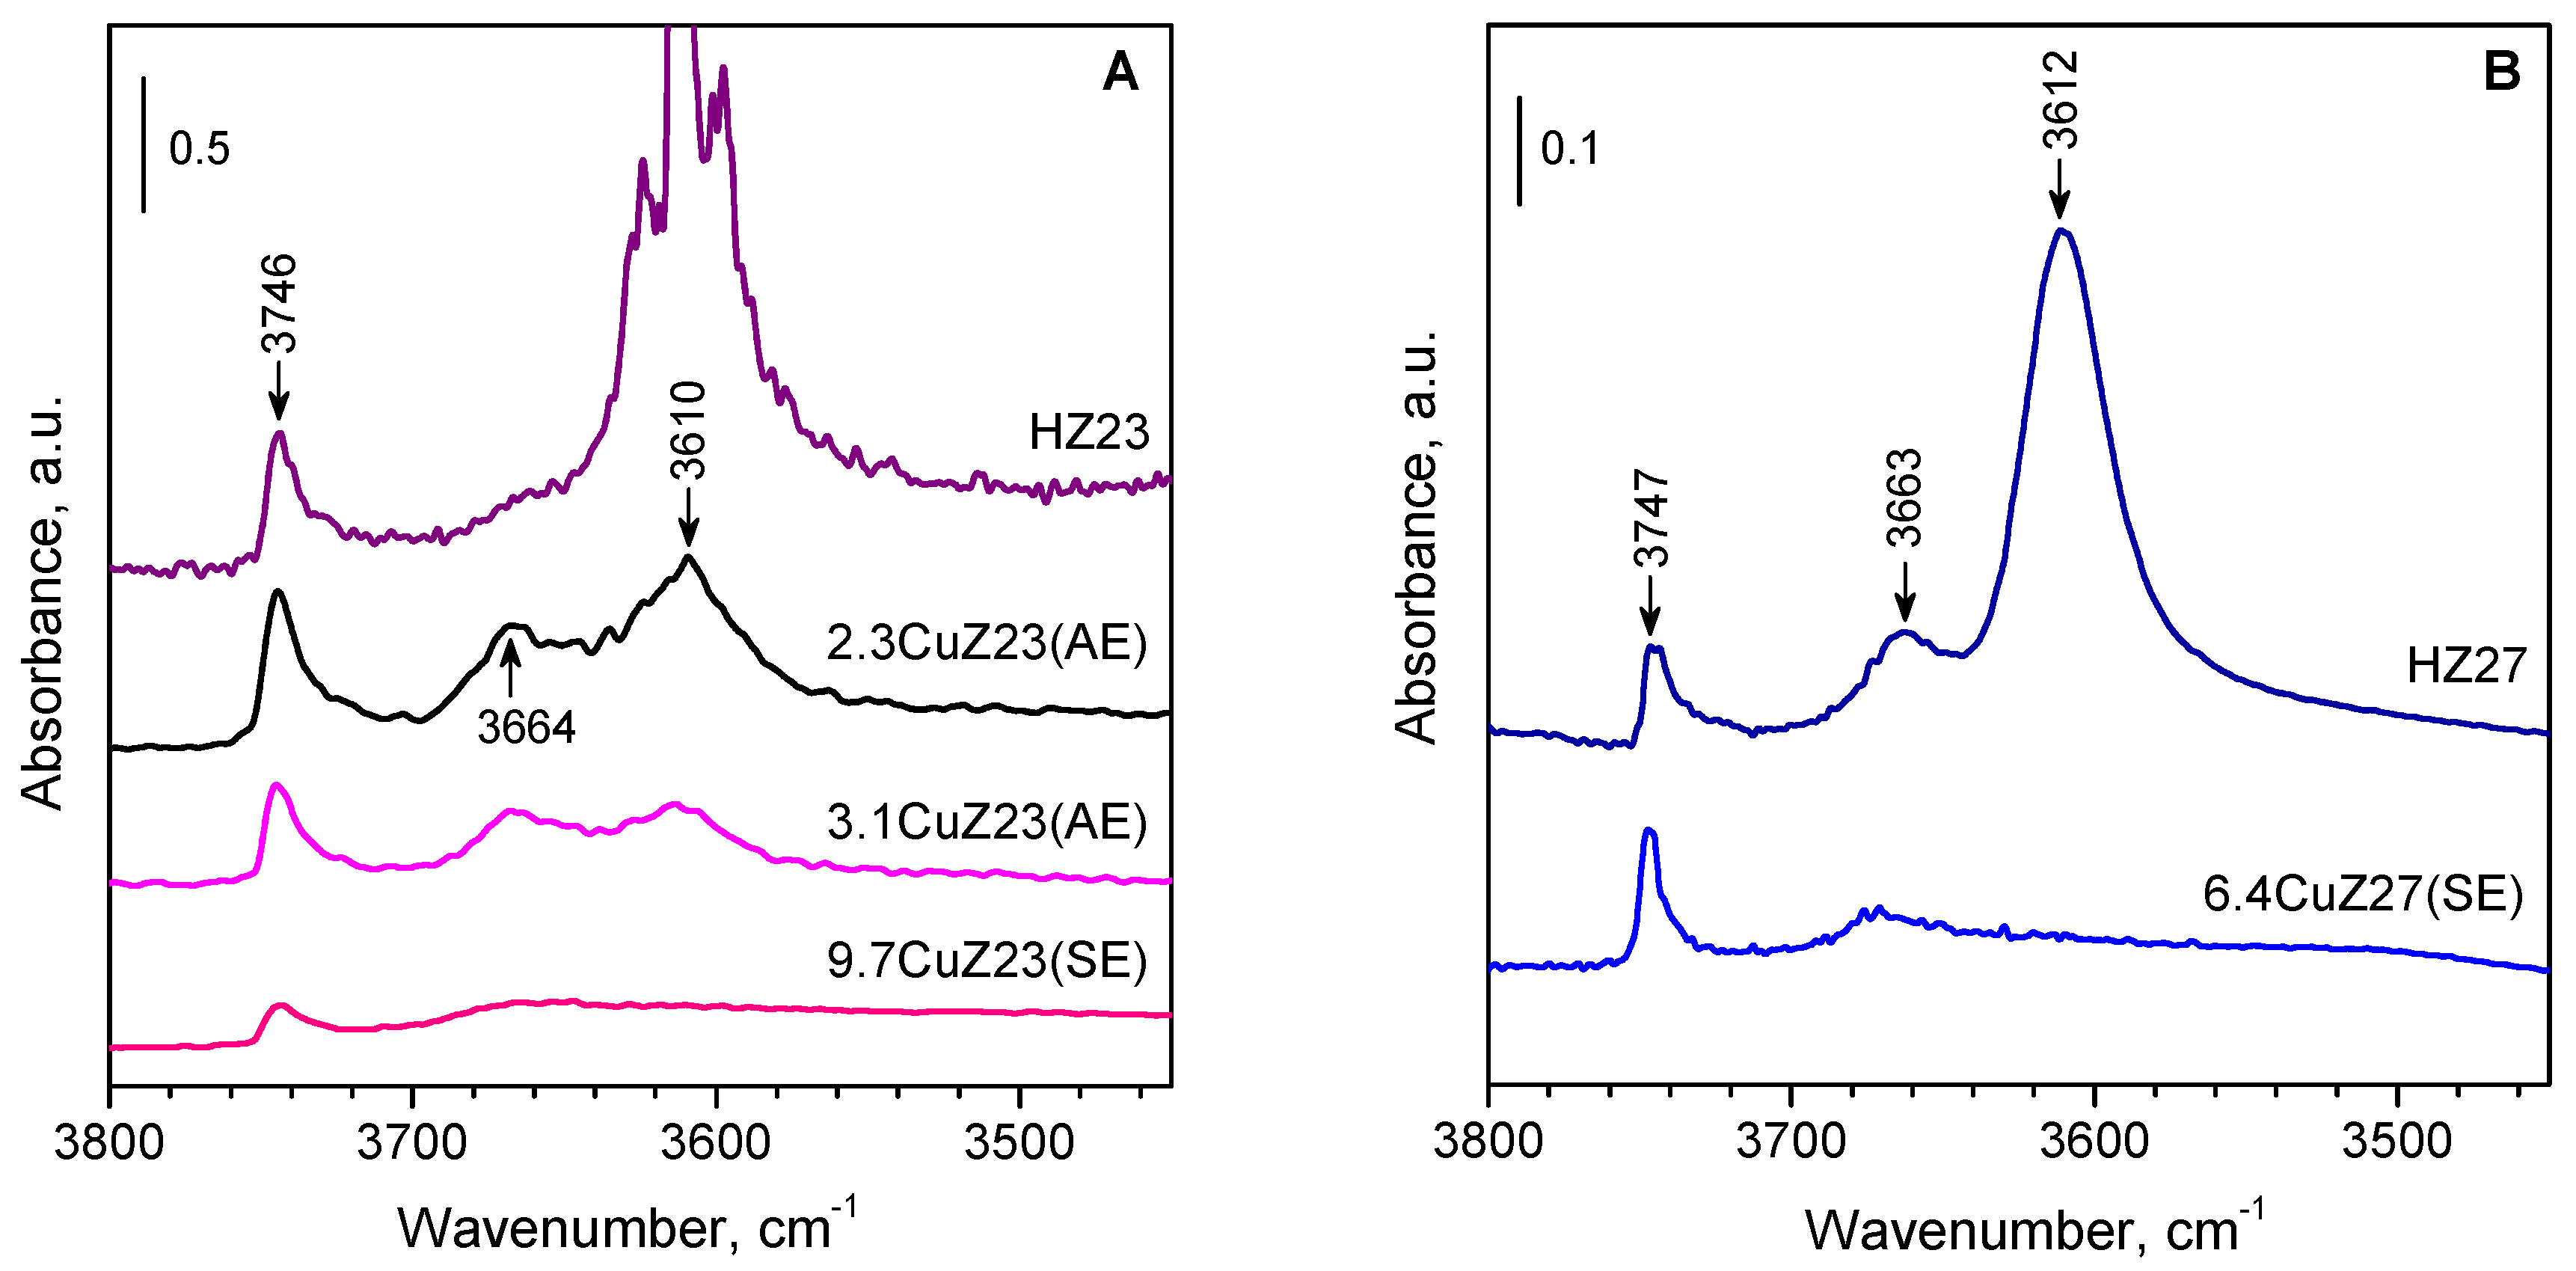
2.1.4. In Situ FTIR Spectroscopy in the OH Stretching Region
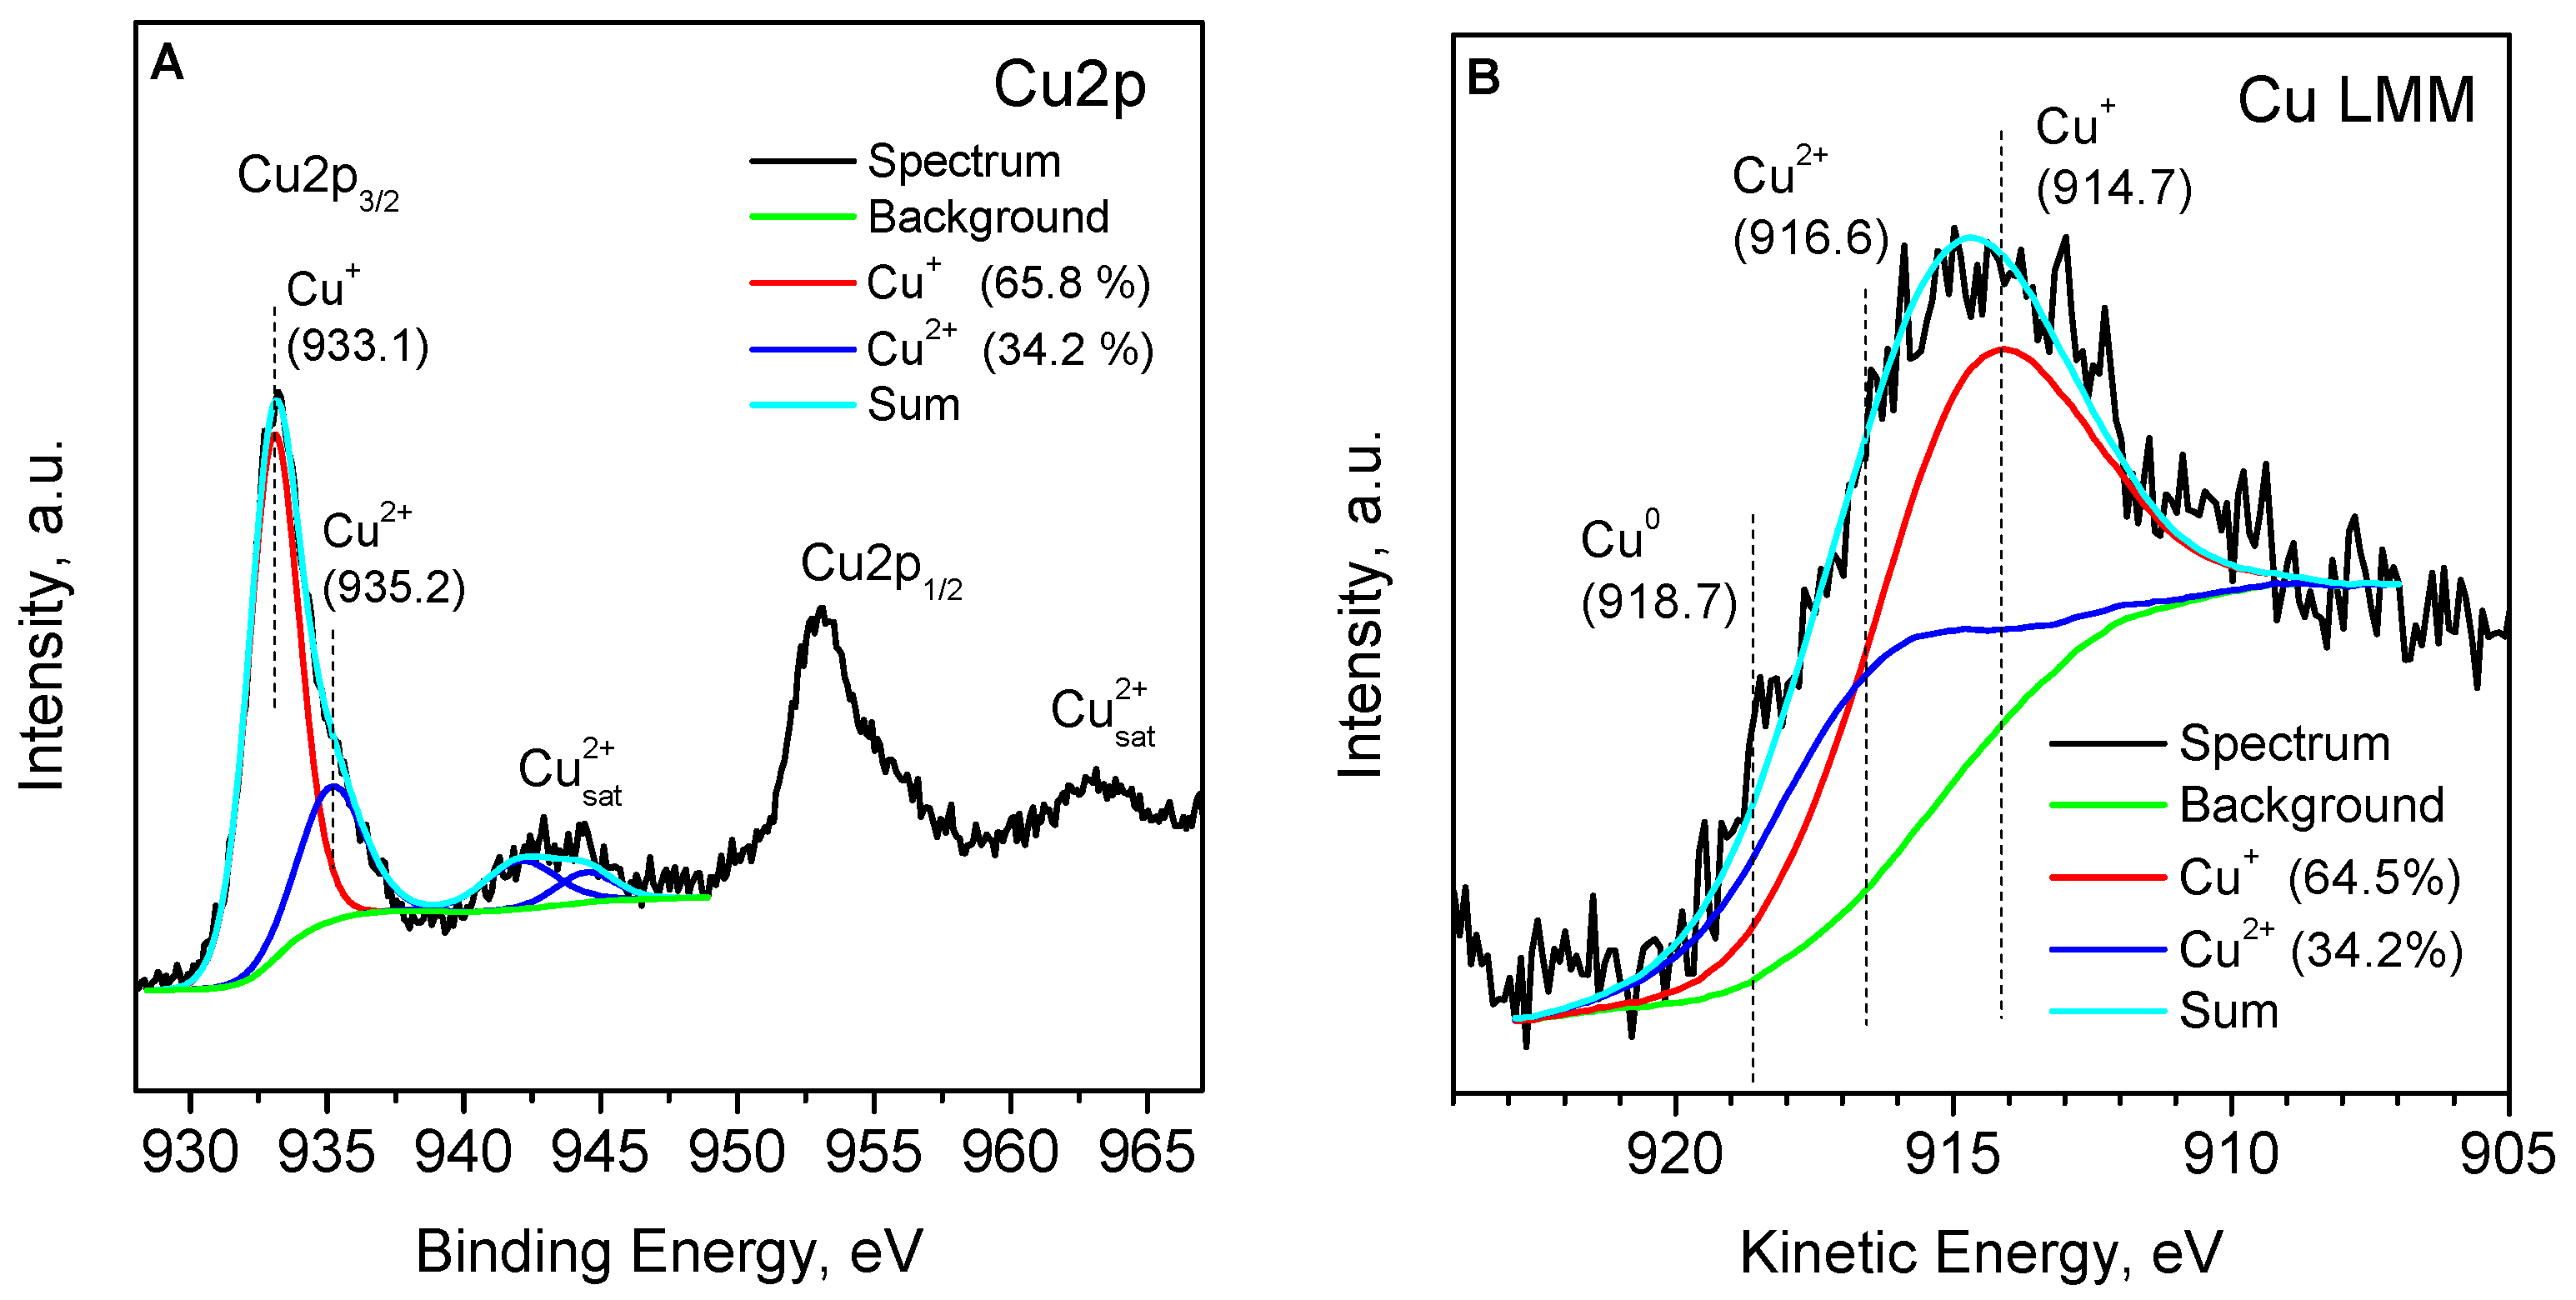
2.1.5. XPS
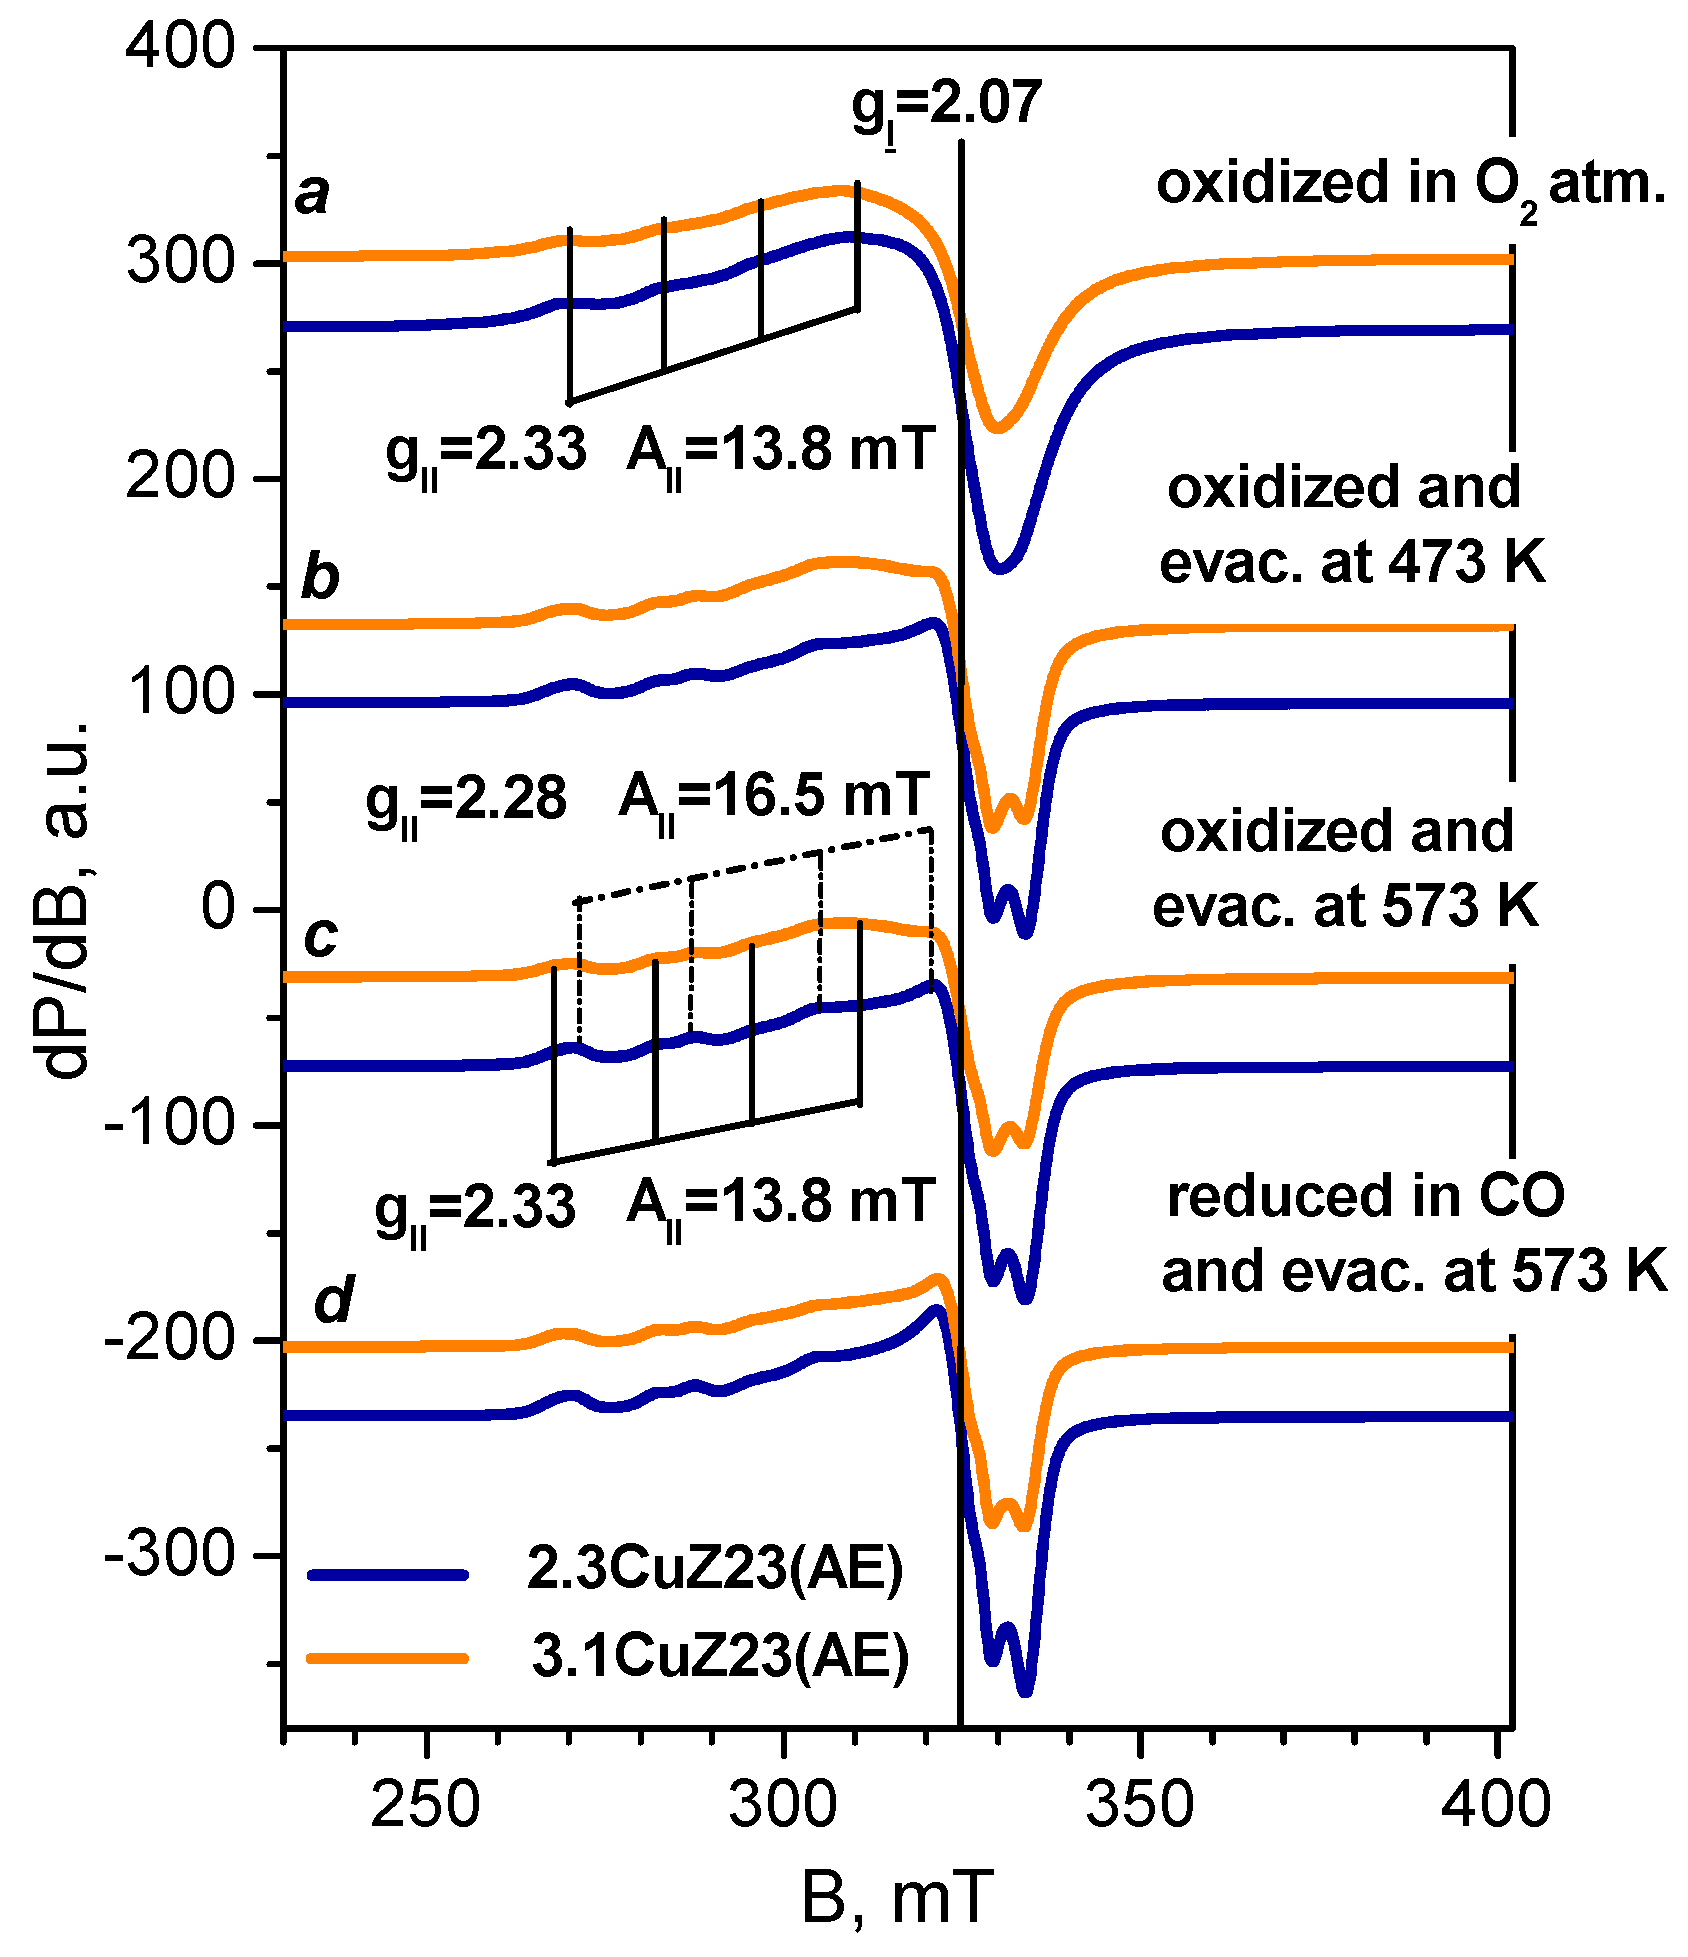
2.1.6. EPR
2.1.7. DR UV-Vis Spectroscopy
2.1.8. TPR
2.2. FTIR Spectroscopy of Adsorbed CO
2.3. TPD of CO
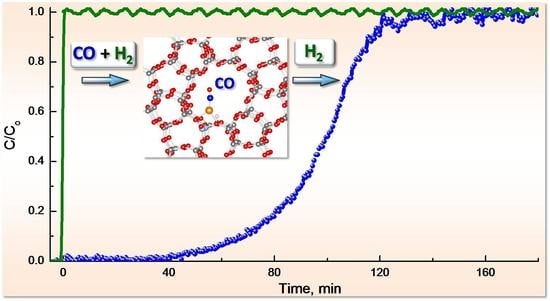
2.4. Dynamic Adsorption Measurements
2.4.1. Effect of Different Factors on the Breakthrough Curves
2.4.2. CO Breakthrough Curves
3. Discussion
4. Materials and Methods
4.1. Synthesis of the Samples
4.2. Chemical Analysis
4.3. Nitrogen Physisorption
4.4. FTIR Spectroscopy
4.5. XRD
4.6. XPS
4.7. EPR
4.8. DR UV-Vis Spectroscopy
4.9. Thermo-Programmed Studies
4.10. Breakthrough Curve Mesurments
5. Conclusions
Supplementary Materials
Author Contributions
Funding
Acknowledgments
Conflicts of Interest
Sample Availability
References
- Zuttel, A. Materials for hydrogen storage. Mater. Today 2003, 6, 24–33. [Google Scholar] [CrossRef]
- Kennedy, R.D.; Krungleviciute, V.; Clingerman, D.J.; Mondloch, J.E.; Peng, Y.; Wilmer, C.E.; Sarjeant, A.A.; Snurr, R.Q.; Hupp, J.T.; Yildirim, T.; et al. Carborane-based metal–organic framework with high methane and hydrogen storage capacities. Chem. Mater. 2013, 25, 3539–3543. [Google Scholar] [CrossRef] [Green Version]
- Hoffmann, P. Tomorrow’s Energy: Hydrogen, Fuel Cells, and the Prospects for a Cleaner Planet; MIT Press: Cambridge, MA, USA, 2012. [Google Scholar]
- Du, Z.; Liu, C.; Zhai, J.; Guo, X.; Xiong, Y.; Su, W.; He, G.A. Review of hydrogen purification technologies for fuel cell vehicles. Catalysts 2021, 11, 393. [Google Scholar] [CrossRef]
- Silva, B.; Salomon, I.; Ribeiro, A.M.; Chang, J.-S.; Loureiro, J.M.; Rodrigues, A.E. H2 purification by pressure swing adsorption using CuBTC. Sep. Purif. Technol. 2013, 118, 744–756. [Google Scholar] [CrossRef]
- Bastos-Neto, M.; Moeller, A.; Staudt, R.; Böhm, J.; Gläser, R. Dynamic bed measurements of CO adsorption on microporous adsorbents at high pressures for hydrogen purification processes. Sep. Purif. Technol. 2011, 77, 251–260. [Google Scholar] [CrossRef] [Green Version]
- Zhu, X.; Shi, Y.; Li, S.; Cai, N. Elevated temperature pressure swing adsorption process for reactive separation of CO/CO2 in H2-rich gas. Int. J. Hydrog. Energy 2018, 43, 13305–13317. [Google Scholar] [CrossRef]
- Brea, P.; Delgado, J.A.; Águeda, V.I.; Gutiérrez, P.; Uguina, M.A. Multicomponent adsorption of H2, CH4, CO and CO2 in zeolites NaX, CaX and MgX. Evaluation of performance in PSA cycles for hydrogen purification. Micropor. Mesopor. Mater. 2019, 286, 187–198. [Google Scholar] [CrossRef]
- Al-Naddaf, Q.; Thakkar, H.; Rezaei, F. Novel Zeolite-5A@MOF-74 Composite Adsorbents with Core–Shell Structure for H2 Purification. ACS Appl. Mater. Interfaces 2018, 10, 29656–29666. [Google Scholar] [CrossRef]
- Pyle, W.R. Hydrogen purification. Home Power 1998, 67, 42–49. [Google Scholar]
- Ilieva, L.; Tabakova, T.; Pantaleo, G.; Ivanova, I.; Zanellac, R.; Paneva, D.; Velinova, N.; Sobczak, J.W.; Lisowski, W.; Avdeev, G.; et al. Nano-gold catalysts on Fe-modified ceria for pure hydrogen production via WGS and PROX: Effect of preparation method and Fe-doping on the structural and catalytic properties. Appl. Catal. A 2013, 467, 76–90. [Google Scholar] [CrossRef]
- Fiorenza, R.; Spitaleri, L.; Gulino, A.; Scirè, S. Ru–Pd bimetallic catalysts supported on CeO2-MnOX oxides as efficient systems for H2 purification through CO preferential oxidation. Catalysts 2018, 8, 203. [Google Scholar] [CrossRef] [Green Version]
- Gokay Avci, G.; Velioglu, S.; Keskin, S. High-Throughput Screening of MOF Adsorbents and Membranes for H2 Purification and CO2 Capture. ACS Appl. Mater. Interfaces 2018, 10, 33693–33706. [Google Scholar] [CrossRef] [PubMed]
- Armatas, G.S.; Kanatzidis, M.G. Mesoporous germanium-rich chalcogenido frameworks with highly polarizable surfaces and relevance to gas separation. Nature Mater. 2009, 8, 217–222. [Google Scholar] [CrossRef]
- Hadjiivanov, K.I.; Kantcheva, M.M.; Klissurski, D.G. IR Study of CO Adsorption on Cu-ZSM-5 and CuO/SiO2 catalysts: σ- and π-components of the Cu+-CO bond. J. Chem. Soc. Faraday Trans. 1996, 92, 4595–4600. [Google Scholar] [CrossRef]
- Hadjiivanov, K.I.; Vayssilov, G.N. Characterization of oxide surfaces and zeolites by carbon monoxide as an IR probe molecule. Adv. Catal. 2002, 47, 307–511. [Google Scholar] [CrossRef]
- Miessner, H.; Burkhardt, I.; Gutschick, D.; Zecchina, A.; Morterra, C.; Spoto, G. Surface chemistry of Rh carbonyls and nitrosyls on dealuminated Y-zeolite at low temperature. J. Chem. Soc. Faraday Trans. 1990, 86, 2321–2327. [Google Scholar] [CrossRef]
- Hadjiivanov, K.; Knözinger, H.; Ivanova, E.; Dimitrov, L. FTIR study of low-temperature CO and 15N2 adsorption on a CaNaY zeolite: Formation of site-specified Ca2+(CO)3 and Ca2+(15N2)3 complexes. Phys. Chem. Chem. Phys. 2001, 3, 2531–2536. [Google Scholar] [CrossRef]
- Aleksandrov, H.A.; Petkov, P.S.; Vayssilov, G.N. Computational evaluation of the capability of transition metal exchanged zeolites for complete purification of hydrogen for fuel cell applications: The cheapest performs the best. Energy Environ. Sci. 2011, 4, 1879–1885. [Google Scholar] [CrossRef]
- Yin, Y.; Wen, Z.-H.; Liu, X.-Q.; Shi, L.; Yuan, A.-H. Modification of metal organic framework HKUST-1 with CuCl for selective separation of CO/H2 and CO/N2. J. Porous Mater. 2018, 25, 1513–1519. [Google Scholar] [CrossRef]
- Hadjiivanov, K.; Knözinger, H.; Mihaylov, M. FTIR study of CO adsorption on Ni−ZSM-5. J. Phys. Chem. B 2002, 106, 2618–2624. [Google Scholar] [CrossRef]
- Serykh, A.I.; Amiridis, M.D. Formation and thermal stability of Ni+ cationic sites in Ni−ZSM-5. J. Phys. Chem. C 2007, 111, 17020–17024. [Google Scholar] [CrossRef]
- Spoto, G.; Zecchina, A.; Bordiga, S.; Ricchiardi, G.; Martra, G.; Leofanti, G.; Petrini, G. Cu(I)-ZSM-5 zeolites prepared by reaction of H-ZSM-5 with gaseous CuCl: Spectroscopic characterization and reactivity towards carbon monoxide and nitric oxide. Appl. Catal. B 1994, 3, 151–172. [Google Scholar] [CrossRef]
- Hadjiivanov, K.; Tsyntsarski, B.; Venkov, T.; Daturi, M.; Saussey, J.; Lavalley, J.-C. New types of polycarbonyls of Co+ formed after interaction of CO with Co–ZSM-5: An FTIR spectroscopic study. Phys. Chem. Chem. Phys. 2003, 5, 243–245. [Google Scholar] [CrossRef]
- Ivanova, E.; Hadjiivanov, K. Polycarbonyls of Rh+ formed after interaction of CO with Rh–MFI: An FTIR spectroscopic study. Phys. Chem. Chem. Phys. 2003, 5, 655–661. [Google Scholar] [CrossRef]
- Zecchina, A.; Otero Arean, A. Diatomic molecular probes for Mid-IR studies of zeolites. Chem. Soc. Rev. 1996, 25, 187–197. [Google Scholar] [CrossRef]
- Maache, M.; Janin, A.; Lavalley, J.-C.; Joly, J.-F.; Benazzi, E. Acidity of zeolites beta dealuminated by acid leaching: An FTIR study using different probe molecules (pyridine, carbon monoxide). Zeolites 1993, 13, 419–426. [Google Scholar] [CrossRef]
- Hadjiivanov, K. Identification and characterization of surface hydroxyl groups by infrared spectroscopy. Adv. Catal. 2014, 57, 99–318. [Google Scholar] [CrossRef]
- Zhang, Y.; Drake, I.J.; Bell, A.T. Characterization of Cu-ZSM-5 prepared by solid-state ion exchange of H-ZSM-5 with CuCl. Chem. Mater. 2006, 18, 2347–2356. [Google Scholar] [CrossRef]
- Chen, H.Y.; Chen, L.; Lin, J.; Tan, K.L.; Li, J. Copper sites in copper-exchanged ZSM-5 for CO activation and methanol synthesis: XPS and FTIR studies. Inorg. Chem. 1997, 36, 1417–1423. [Google Scholar] [CrossRef] [PubMed]
- Meda, L.; Ranghino, G.; Moretti, G.; Cerofolini, G.F. XPS detection of some redox phenomena in Cu-zeolites. Surf. Interface Anal. 2002, 33, 516–521. [Google Scholar] [CrossRef]
- Bolis, V.; Maggiorini, S.; Meda, L.; D’Acapito, F.; Turnes Palomino, G.; Bordiga, S.; Lamberti, C. X-ray photoelectron spectroscopy and x-ray absorption near edge structure study of copper sites hosted at the internal surface of ZSM-5 zeolite: A comparison with quantitative and energetic data on the CO and NH3 adsorption. J. Chem. Phys. 2000, 113, 9248–9261. [Google Scholar] [CrossRef]
- Gaudin, P.; Fioux, P.; Dorge, S.; Nouali, H.; Vierling, M.; Fiani, E.; Molière, M.; Brilhac, J.-F.; Patarin, J. Formation and role of Cu+ species on highly dispersed CuO/SBA-15 mesoporous materials for SOx removal: An XPS study. Fuel Processing Technol. 2016, 153, 129–136. [Google Scholar] [CrossRef]
- Manto, M.J.; Xie, P.; Keller, M.A.; Liano, W.E.; Pu, T.; Wang, C. Recovery of inorganic phosphorus using copper-substituted ZSM-5. ACS Sustain. Chem. Eng. 2017, 5, 6192–6200. [Google Scholar] [CrossRef]
- Spassova, I.; Stoeva, N.; Nickolov, R.; Atanasova, G.; Khristova, M. Impact of carbon on the surface and activity of silica–carbon supported copper catalysts for reduction of nitrogen oxides. Appl. Surf. Sci. 2016, 369, 120–129. [Google Scholar] [CrossRef]
- Wu, Y.; Zhang, H.; Yan, Y. High efficiency of phenol oxidation in a structured fixed bed over Cu-ZSM-5/PSSF prepared by ion-exchanged method. Chem. Eng. J. 2020, 380, 122466. [Google Scholar] [CrossRef]
- Rutkowska, M.; Pacia, I.; Basa, S.; Kowalczyk, A.; Piwowarska, Z.; Duda, M.; Tarach, K.A.; Gora-Marek, K.; Michalik, M.; Díaz, U.; et al. Catalytic performance of commercial Cu-ZSM-5 zeolite modified by desilication in NH3-SCR and NH3-SCO processes. Microporpus Mesoporos Mater. 2017, 246, 193–206. [Google Scholar] [CrossRef]
- Palomino, G.T.; Fisicaro, P.; Bordiga, S.; Zecchina, A.; Giamello, E.; Lamberti, C. Oxidation states of copper ions in ZSM-5 zeolites. A multitechnique investigation. J. Phys. Chem. B 2000, 104, 4064–4073. [Google Scholar] [CrossRef] [PubMed]
- Weckhuysen, B.; Heidler, R.; Schoonheydt, R. Electron spin resonance spectroscopy. Mol. Sieves 2004, 4, 295–335. [Google Scholar] [CrossRef]
- Groothaert, M.H.; Lievens, K.; van Bokhoven, J.A.; Battiston, A.A.; Weckhuysen, B.M.; Pierloot, K.; Schoonheydt, R.A. Bis(μ-OXO)dicopper as intermediate in the catalytic decomposition of NO over Cu-ZSM-5. Stud. Surf. Sci. Catal. 2004, 154, 2449–2457. [Google Scholar] [CrossRef]
- Godiksen, A.; Vennestrøm, P.N.R.; Rasmussen, S.B.; Mossin, S. Identification and quantification of copper sites in zeolites by electron paramagnetic resonance spectroscopy. Top Catal. 2017, 60, 13–29. [Google Scholar] [CrossRef] [Green Version]
- Giordanino, F.; Vennestrøm, P.N.R.; Lundegaard, L.F.; Stappen, F.N.; Mossin, S.; Beato, P.; Bordiga, S.; Lamberti, C. Characterization of Cu-exchanged SSZ-13: A comparative FTIR, UV-Vis, and EPR study with Cu-ZSM-5 and Cu-β with similar Si/Al and Cu/Al ratios. Dalton Trans. 2013, 42, 12741–12761. [Google Scholar] [CrossRef] [PubMed]
- Yashnik, S.; Ismagilov, Z. Cu-substituted ZSM-5 catalyst: Controlling of DeNOx reactivity via ion-exchange mode with copper–ammonia solution. Appl. Catal. B 2015, 170–171, 241–254. [Google Scholar] [CrossRef]
- Centi, G.; Fazzini, F.; Galli, A. Oxide nanoparticles within a host microporous matrix: Polynuclear copper species in Cu-ZSM5 and their role in the reduction of NO. Res. Chem. Intermed. 1998, 24, 541–550. [Google Scholar] [CrossRef]
- Beznis, N.V.; Weckhuysen, B.M.; Bitter, J.H. Cu-ZSM-5 Zeolites for the formation of methanol from methane and oxygen: Probing the active sites and spectator Species. Catal. Lett. 2010, 138, 14–22. [Google Scholar] [CrossRef] [Green Version]
- Da Costa, P.; Modén, B.; Meitzner, G.D.; Lee, D.K.; Iglesia, E. Spectroscopic and chemical characterization of active and inactive Cu species in NO decomposition catalysts based on Cu-ZSM5. Phys. Chem. Chem. Phys. 2002, 4, 4590–4601. [Google Scholar] [CrossRef] [Green Version]
- Neylon, M.K.; Marshall, C.L.; Kropf, A.J. In situ EXAFS analysis of the temperature-programmed reduction of Cu-ZSM-5. J. Am. Chem. Soc. 2002, 124, 5457–5465. [Google Scholar] [CrossRef] [PubMed]
- De Lucas, A.; Valverde, J.L.; Dorado, F.; Romero, A.; Asencio, I. Influence of the ion exchanged metal (Cu, Co, Ni and Mn) on the selective catalytic reduction of NOX over mordenite and ZSM-5. J. Mol. Catal. A 2005, 225, 47–58. [Google Scholar] [CrossRef]
- Nanba, T.; Masukawa, S.; Ogata, A.; Uchisawa, J.; Obuchi, A. Active sites of Cu-ZSM-5 for the decomposition of acrylonitrile. Appl. Catal. B 2005, 61, 288–296. [Google Scholar] [CrossRef]
- Zou, W.; Xi, P.; Hua, W.; Wang, Y.; Kong, D.; Yue, Y.; Ma, Z.; Yang, W.; Gao, Z. Catalytic decomposition of N2O over Cu-ZSM-5 nanosheets. J. Mol. Catal. A 2014, 394, 83–88. [Google Scholar] [CrossRef]
- Lai, S.; Meng, D.; Zhan, W.; Guo, Y.; Guo, Y.; Zhang, Z.; Lu, G. The promotional role of Ce in Cu/ZSM-5 and in situ surface reaction for selective catalytic reduction of NOx with NH3. RSC Adv. 2015, 5, 90235–90244. [Google Scholar] [CrossRef] [Green Version]
- Sárkány, J.; d’Itri, J.L.; Sachtler, W.M.H. Redox chemistry in excessively ion-exchanged Cu/Na-ZSM-5. Catal. Lett. 1992, 16, 241–249. [Google Scholar] [CrossRef]
- Pike, J.; Chan, S.-W.; Zhang, F.; Wang, X.; Hanson, J. Formation of stable Cu2O from reduction of CuO nanoparticles. Appl. Catal. A 2006, 303, 273–277. [Google Scholar] [CrossRef]
- Tortorelli, M.; Chakarova, K.; Lisi, L.; Hadjiivanov, K. Disproportionation of associated Cu2+ sites in Cu-ZSM-5 to Cu+ and Cu3+ and FTIR detection of Cu3+(NO)x (x = 1, 2) species. J. Catal. 2014, 309, 376–385. [Google Scholar] [CrossRef]
- Zdravkova, V.; Drenchev, N.; Ivanova, E.; Mihaylov, M.; Hadjiivanov, K. Surprising coordination chemistry of Cu+ cations in zeolites: FTIR study of adsorption and coadsorption of CO, NO, N2, and H2O on Cu–ZSM-5. J. Phys. Chem. C 2015, 119, 15292–15302. [Google Scholar] [CrossRef] [Green Version]
- Bolis, V.; Barbaglia, A.; Bordiga, S.; Lamberti, C.; Zecchina, A. Heterogeneous nonclassical carbonyls stabilized in Cu(I)- and Ag(I)-ZSM-5 zeolites: Thermodynamic and spectroscopic features. J. Phys. Chem. B 2004, 108, 9970–9983. [Google Scholar] [CrossRef]
- Georgiev, P.A.; Drenchev, N.; Hadjiivanov, K.I.; Ollivier, J.; Unruh, J.; Albinati, A. Dynamics of bound states of dihydrogen at Cu(I) and Cu(II) species coordinated near one and two zeolite framework aluminium atoms: A combined sorption, INS, IR and DFT study. Int. J. Hydrog. Energy 2021, 46, 26897–26914. [Google Scholar] [CrossRef]
- Drenchev, N.; Georgiev, P.A.; Hadjiivanov, K. FTIR Study of 12C16O and 13C18O coadsorption on Cu–ZSM-5. J. Mol. Catal. A 2011, 341, 7–13. [Google Scholar] [CrossRef]
- Hadjiivanov, K.; Klissurski, D.; Ramis, G.; Busca, G. Fourier transform IR study of NOx adsorption on a CuZSM-5 DeNOx catalyst. Appl. Catal. B 1996, 7, 251–267. [Google Scholar] [CrossRef]
- Bulánek, R.; Čičmanec, P.; Knotek, P.; Nachtigallová, D.; Nachtigall, P. Localization of Cu+ sites and framework Al positions in high-silicazeolites: Combined experimental and theoretical study. Phys. Chem. Chem. Phys. 2004, 6, 2003–2007. [Google Scholar] [CrossRef]
- Davidová, M.; Nachtigallová, D.; Bulánek, R.; Nachtigall, P. Characterization of the Cu+ sites in high-silica zeolites interacting with the CO molecule: Combined computational and experimental study. J. Phys. Chem. B 2003, 107, 2327–2332. [Google Scholar] [CrossRef]
- Datka, J.; Kozyra, P.; Kukulska-Zajaç, E.; Szutiak, M.; Kumar, N. The IR studies of the status of Cu+ ions in CuZSM-5, CuBeta and in CuMCM-41. Stud. Surf. Sci. Catal. 2004, 154, 1655–1660. [Google Scholar] [CrossRef]
- Zhang, Y.; Briggs, D.N.; Smit, E.; Bell, A.T. Effects of zeolite structure and composition on the synthesis of dimethyl carbonate by oxidative carbonylation of methanol on Cu-exchanged Y, ZSM-5, and Mordenite. J. Catal. 2007, 251, 443–452. [Google Scholar] [CrossRef]
- Rakić, V.; Damjanović, L. Temperature-programmed desorption (TPD) methods. In Calorimetry and Thermal Methods in Catalysis; Auroux, A., Ed.; Springer: Berlin/Heidelberg, Germany, 2013; Volume 154, pp. 131–174. [Google Scholar] [CrossRef]
- Zhao, D.; Tu, C.-M.; Hu, X.-J.; Zhang, N. Notable in situ surface transformation of Cu2O nanomaterials leads to dramatic activity enhancement for CO oxidation. RSC Adv. 2017, 7, 37596–37603. [Google Scholar] [CrossRef] [Green Version]
- Gabelman, A. Adsorption basics: Part 1. Chem. Eng. Prog. 2017, 113, 48–53. [Google Scholar]
- McCabe, W.L.; Smith, J.C.; Harriott, P. Unit Operations of Chemical Engineering, 6th ed.; McGraw-Hill: Boston, MA, USA, 2001. [Google Scholar]
- Townsend, R.P.; Coker, E.N. Chapter 11 Ion exchange in zeolites. Stud. Surf. Sci. Catal. 2001, 137, 467–524. [Google Scholar] [CrossRef]
- Zhang, Y.; Leo, K.M.; Sarofim, A.F.; Hu, Z.; Flytzani-Stephanopoulos, M. Preparation effects on the activity of Cu-ZSM-5 catalysts for NO decomposition. Catal. Lett. 1995, 31, 75–89. [Google Scholar] [CrossRef]


| Notation | Supplier | SiO2/Al2O3 | SBET, m2 g−1 |
|---|---|---|---|
| HZ23 | Zeolist | 23 | 386 |
| HZ27 | Degussa | 26.8 | 399 |
| Notation | Synthesis Conditions | SBET, m2 g−1 | Cu, wt. % | Cu/Al |
|---|---|---|---|---|
| 9.7CuZ23(SE) | vacuum, 300 °C | 318 | 9.71 | 1.25 |
| 6.4CuZ27(SE) | He flow, 750 °C | 300 | 6.37 | 0.99 |
| 3.1CuZ23(AE) | 0.02 M solution, 50 °C | 342 | 3.10 | 0.45 |
| 2.3CuZ23(AE) | 0.01 M solution, 50 °C | 371 | 2.30 | 0.34 |
| Sample | Cu/Al | Desorbed CO, mL g−1 | CO/Cu |
|---|---|---|---|
| 9.7CuZ23(SE) | 1.25 | 20.1 | 0.55 |
| 6.4CuZ27(SE) | 0.99 | 12.5 | 0.52 |
| 3.1CuZ23(AE) | 0.45 | 10.7 | 0.90 |
| 2.3CuZ23(AE) | 0.34 | 6.5 | 0.74 |
| Sample | Pre-Treatment | COadse, mL g−1 | COadsb, mL g−1 | Efficiency, % | tb, min | HUB, mm |
|---|---|---|---|---|---|---|
| 3.1CuZ23(AE) | O2/Ar at 500 °C | 1.4 | 0.0 | 0 | 0 | 5.0 |
| 3.1CuZ23(AE) | CO/Ar at 300 °C | 9.8 | 3.9 | 40 | 12 | 3.0 |
| 6.4CuZ27(SE) | Ar at 500 °C | 13.8 | 6.0 | 43 | 19 | 2.9 |
| 9.7CuZ23(SE) | Ar at 500 °C | 25.8 | 11.0 | 43 | 45 | 2.9 |
Publisher’s Note: MDPI stays neutral with regard to jurisdictional claims in published maps and institutional affiliations. |
© 2021 by the authors. Licensee MDPI, Basel, Switzerland. This article is an open access article distributed under the terms and conditions of the Creative Commons Attribution (CC BY) license (https://creativecommons.org/licenses/by/4.0/).
Share and Cite
Mihaylov, M.; Ivanova, E.; Zdravkova, V.; Andonova, S.; Drenchev, N.; Chakarova, K.; Kefirov, R.; Kukeva, R.; Stoyanova, R.; Hadjiivanov, K. Purification of Hydrogen from CO with Cu/ZSM-5 Adsorbents. Molecules 2022, 27, 96. https://0-doi-org.brum.beds.ac.uk/10.3390/molecules27010096
Mihaylov M, Ivanova E, Zdravkova V, Andonova S, Drenchev N, Chakarova K, Kefirov R, Kukeva R, Stoyanova R, Hadjiivanov K. Purification of Hydrogen from CO with Cu/ZSM-5 Adsorbents. Molecules. 2022; 27(1):96. https://0-doi-org.brum.beds.ac.uk/10.3390/molecules27010096
Chicago/Turabian StyleMihaylov, Mihail, Elena Ivanova, Videlina Zdravkova, Stanislava Andonova, Nikola Drenchev, Kristina Chakarova, Radoslav Kefirov, Rositsa Kukeva, Radostina Stoyanova, and Konstantin Hadjiivanov. 2022. "Purification of Hydrogen from CO with Cu/ZSM-5 Adsorbents" Molecules 27, no. 1: 96. https://0-doi-org.brum.beds.ac.uk/10.3390/molecules27010096