
Repair of Iron Center Proteins—A Different Class of Hemerythrin-like Proteins


1
Instituto Tecnologia Química e Biológica António Xavier, Universidade Nova de Lisboa, 2780-157 Oeiras, Portugal
2
iBET, Instituto de Biologia Experimental e Tecnológica, 2780-157 Oeiras, Portugal
*
Author to whom correspondence should be addressed.
Molecules 2022, 27(13), 4051; https://0-doi-org.brum.beds.ac.uk/10.3390/molecules27134051
Submission received: 29 April 2022
/
Revised: 14 June 2022
/
Accepted: 17 June 2022
/
Published: 23 June 2022
(This article belongs to the Special Issue Metalloenzyme Biogenesis and Biocatalysis)
Abstract
:Repair of Iron Center proteins (RIC) form a family of di-iron proteins that are widely spread in the microbial world. RICs contain a binuclear nonheme iron site in a four-helix bundle fold, two basic features of hemerythrin-like proteins. In this work, we review the data on microbial RICs including how their genes are regulated and contribute to the survival of pathogenic bacteria. We gathered the currently available biochemical, spectroscopic and structural data on RICs with a particular focus on Escherichia coli RIC (also known as YtfE), which remains the best-studied protein with extensive biochemical characterization. Additionally, we present novel structural data for Escherichia coli YtfE harboring a di-manganese site and the protein’s affinity for this metal. The networking of protein interactions involving YtfE is also described and integrated into the proposed physiological role as an iron donor for reassembling of stress-damaged iron-sulfur centers.
1. Introduction
During the infection process, IFNγ-activated phagocytes of the host innate immune system release superoxide and nitric oxide, whose derivatives are known as reactive oxygen species (ROS) and reactive nitrogen species (RNS). The nitrosative products that result in the combination of ROS with RNS are harmful to pathogens as they damage several bacterial components such as DNA, lipids, and proteins, which causes disruption of key cellular functions [1,2]. In particular, RNS bind to iron in heme cofactors and iron−sulfur (Fe-S) clusters, disabling, among others, respiratory heme-copper oxidases and enzymes of the tricarboxylic acid cycle (TCA), such as the [4Fe-4S]2+/1+ containing aconitase and fumarase. Bacteria have several protecting systems against nitrosative stress, including detoxifying enzymes like hemoglobins, NO reductases, and nitroreductases. Moreover, bacteria can restore the function of impaired cellular components through little-known mechanisms. Repair of Iron Center proteins (RICs) form a widespread family of proteins that are highly expressed under stress conditions. In this work, we summarize the current knowledge on the function of these proteins, namely their relationship with Fe-S cluster repairing. We also provide a new structure of the Escherichia coli YtfE in which the iron binuclear center is replaced by manganese ions and discuss its impact on the overall structure.
2. Microbial RICs
RIC stands for Repair of Iron Center proteins. The first RIC protein was discovered in Escherichia (E.) coli and is encoded by ytfE, a gene that is highly induced under nitrosative stress conditions [3]. The strain inactivated in ytfE is more sensitive to NO and H2O2. Moreover, YtfE was shown to protect and repair Fe-S cluster proteins, namely aconitase and fumarase [4,5].
RIC proteins are broadly spread in the bacterial phyla (Proteobacteria, Bacteroidetes, Firmicutes, Actinobacteria, Acidobacteria) and in eukaryotic pathogens [6]. Studies on several microorganisms reinforced the proposal that RICs are able to repair Fe-S clusters injured by ROS and RNS. For example, cells of Staphylococcus aureus, Neisseria gonorrhoeae, and Trichomonas vaginalis lacking RIC and treated with NO and H2O2 have lower survival rates and decreased activity of aconitase and fumarase, but these activities are restored upon addition of ric [5,6,7]. Therefore, this widespread family of di-iron proteins was named Repair of Iron Center protein [8]. Herein, YtfE will refer to the E. coli protein and RIC to the homologues present in the other microorganisms.
YtfE contains two iron atoms per monomer and is isolated as a combination of monomers and dimers [4], each monomer having a molecular mass of 25 kDa. The amino acid sequence of YtfE contains an HHE–hemerythrin cation binding motif analogous to that present in hemerythrin proteins [9]. The other studied RIC proteins have similar molecular masses, comprise also two iron atoms per monomer, and share a high amino acid sequence identity with E. coli YtfE (Table 1). The sequence alignment of more than 100 RICs revealed highly conserved histidine and carboxylate residues, namely H84, H105, H129, E133, H160, and H204 (E. coli YtfE numbering) [6], which are involved in the coordination of the binuclear site.
RICs are also present in other microbes such as the fungal pathogen Cryptococcus neoformans and the protozoan Trichomonas vaginalis. C. neoformans encodes a RIC-like protein (CNA2870) with two apparent hemerythrin cation binding motifs, which gene is induced by NO [10]. T. vaginalis is the only organism known so far to contain two RIC paralogs designated as RIC1 and RIC2. T. vaginalis ric1 and ric2 that are both induced by nitrosative and oxidative stress. However, only T. vaginalis RIC1 shares similarities with bacterial RICs concerning the spectroscopic features and Fe-S repair ability. RIC2 is not isolated with a di-iron center and apparently lacks the capacity to assemble the binuclear center. Interestingly, RIC2 contains a signal peptide and a leucine zipper motif and is a DNA binding protein. Subcellular localization studies showed that RIC1 is present in the cytoplasm while RIC2 occurs also in the nucleus of T. vaginalis [7].
3. RICs Are Important for Pathogen Survival
RICs have been shown to contribute to survival in host cells of several human pathogens, such as S. aureus, Haemophilus influenzae, Salmonella enterica Typhimurium, and Yersinia pseudotuberculosis [11,12,13,14].
S. aureus Δric is more sensitive to oxidative stress and nitrosative stress and survives less than the wild type when infecting murine macrophages. Moreover, survival of S. aureus Δric is similar to the wild type when the mammalian cells are unable to produce ROS. Infection studies in the wax moth Galleria mellonella showed that S. aureus strains lacking ric are less virulent [11].
The H. influenza Δric mutant presents high sensitivity to NO and reduced ability to infect macrophages. This phenotype is canceled upon the addition of an inhibitor of the inducible NO synthase that impairs the NO production by macrophages [12].
4. Regulation of RICs
The genomic organization of RIC encoding genes has a high degree of variation amongst microorganisms and these genes are not usually clustered with genes related to oxidative/nitrosative defenses. In the organisms so far studied, the ric genes are induced by nitrosative and/or oxidative stress [8]. In E. coli, YtfE is highly expressed in cells exposed to nitrosative stress and cells grown in nitrate and nitrite under anaerobic conditions [3,15]. In S. enterica, S. aureus, T. vaginalis, N. gonorrhoeae, N. meningitidis, Ralstonia eutropha, Pseudomonas stutzeri and C. neoformans the ric genes are upregulated by nitrosative stress. Additionally, S. aureus and T. vaginalis rics are induced by oxidative stress [7,10,13,16,17,18,19,20,21,22]. S. enterica, S. aureus, and Y. pestis rics are highly expressed during infection of macrophages and rats [11,23,24].
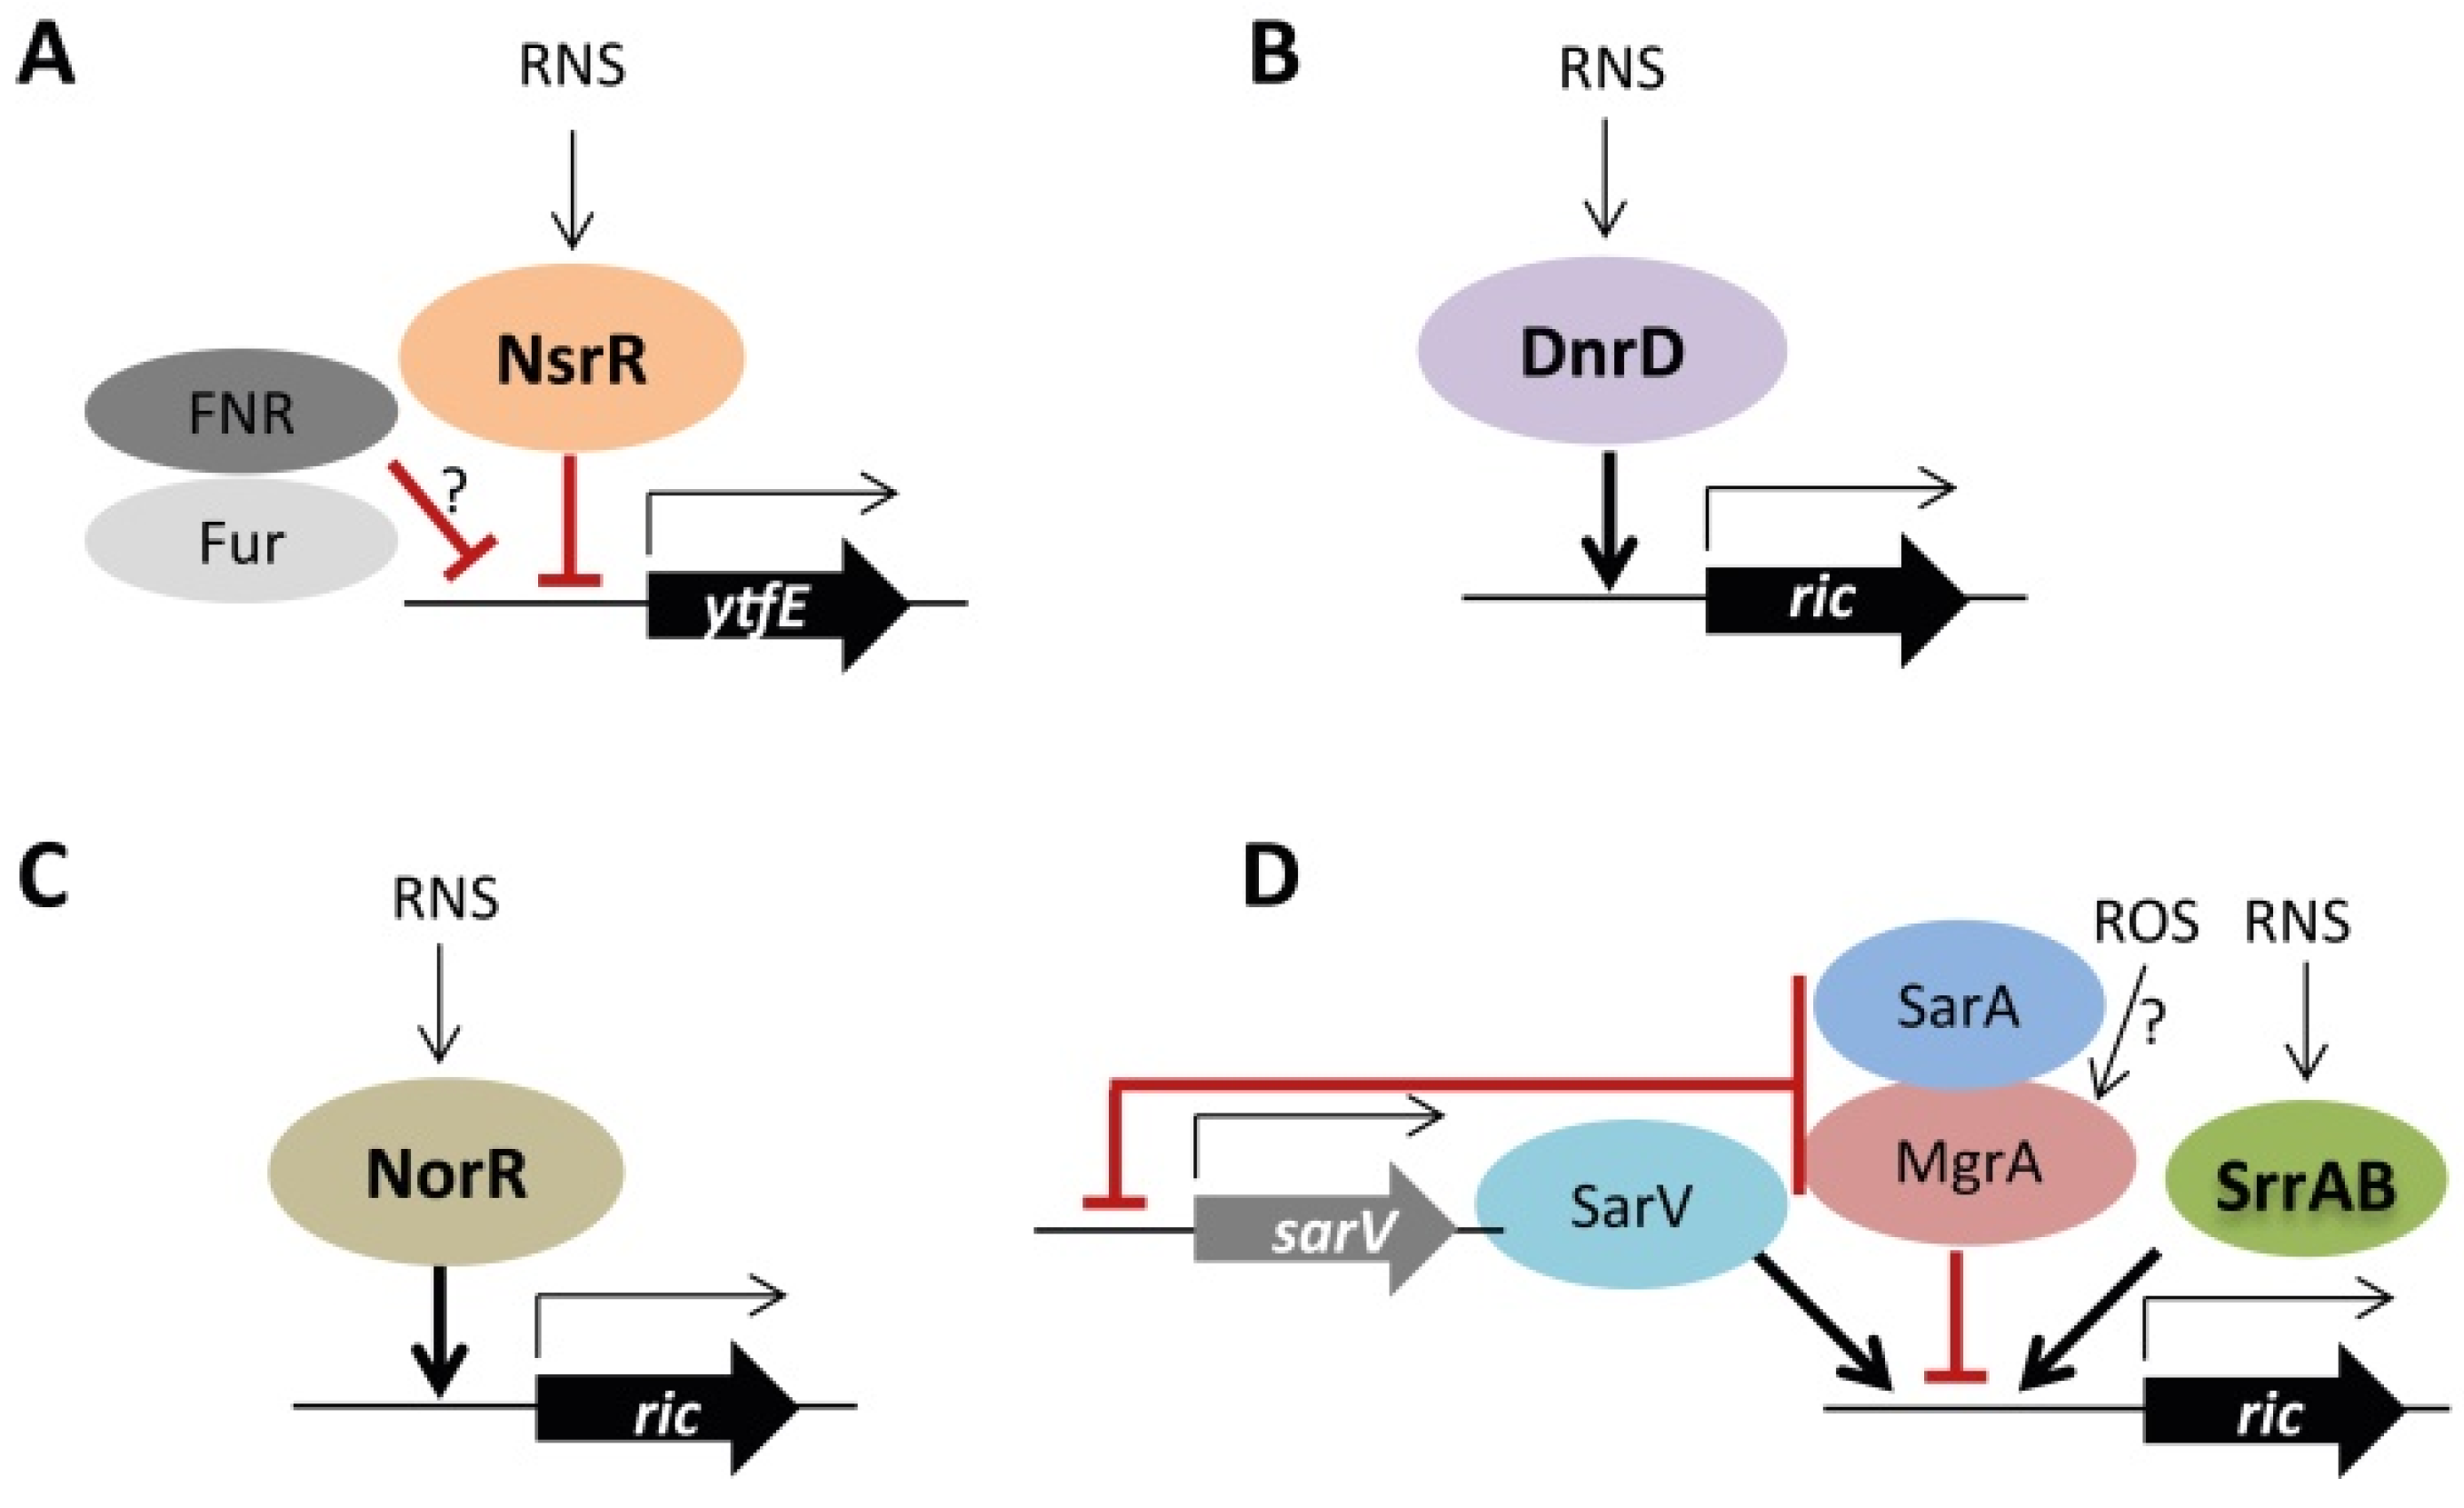
E. coli, N. gonorrhoeae, N. meningitidis, S. enterica and Y. pseudotuberculosis rics are repressed by NsrR [6,14,16]. Additionally, ytfE is de-repressed in E. coli strains lacking the general regulators FNR and Fur. Since no recognized Fur-FNR binding sites are found in the promoter region of ytfE, the FNR/Fur regulation is proposed to occur indirectly through a not yet known mechanism [4,8]. P. stutzeri ric is positively regulated by DnrD regulator, and R. eutropha ric (also known as norA) is upregulated by NorR in response to NO [18,20]. S. aureus ric seems to be under a complex regulation that involves SrrAB, SarV, MgrA, and SarA. The two-component system SrrAB (which is activated by hypoxia and nitrosative stress) induces the ric expression when in the presence of NO [21]. SarV also controls positively the ric transcription [25]. MgrA, a member of the MarR family of regulators that is proposed to act as an oxidative stress sensor, negatively regulates ric [26]. Moreover, higher ric levels were measured in the ΔsarA strain indicating that S. aureus SarA represses the transcription of ric. In all cases, the binding of SarV, MrgA, and SarA to ric promoter remains to be shown. Additionally, it was proposed that regulation of ric by MrgA and SarA is indirect since the two transcription factors also repress the sarV transcription [25]. Figure 1 summarizes the current data on the regulation of RICs.
5. Biochemical and Spectroscopic Properties of RICs
UV-visible, EPR, resonance Raman, Mössbauer, and extended X-ray absorption fine structure (EXAFS) spectroscopic studies of E. coli YtfE were firstly used to analyze the binuclear iron center [4,28,29]. The UV-visible spectrum of YtfE displays a broad band at 360 nm characteristic of di-iron proteins, a feature that was also observed in RICs from R. eutropha, S. aureus, N. gonorrhoeae and T. vaginalis RIC1 [4,6,7,30].
The EPR spectrum of YtfE, acquired at ca. 15 K, exhibits g-values at ~2 (1.96, 1.92, and 1.88) typical of di-iron centers in the mixed-valence Fe2+-Fe3+ state, and similar spectra were also observed for S. aureus RIC and T. vaginalis RIC1 [4,6,7]. The Mössbauer spectrum of the E. coli 57Fe-YtfE proved that the di-iron center is in a mixed-valence state in the as-isolated protein. EPR-monitored redox titration allowed the determination of the two reduction potentials for the di-iron center: +260 and +110 mV, respectively for the Fe(III)Fe(III)-Fe(III)Fe(II) and Fe(III)Fe(II)-Fe(II)Fe(II) transitions [4]. Mössbauer data showed that the two iron atoms are antiferromagnetically coupled, with parameters consistent with the presence of a μ-oxo bridge in the iron center, and that one of the iron atoms is more labile [29]. Resonance Raman spectrum of as-isolated E. coli YtfE exhibits a band at 490 cm−1 which shifts to 478 cm−1 in 18O-labeled YtfE, indicating the presence of a μ-oxo group bridging the two iron atoms [28]. The EXAFS spectrum of E. coli YtfE is dominated by a single oscillation frequency due to ligands such as O and N. In the EXAFS structural model of E. coli YtfE, the two iron ions are coordinated by two histidine residues and two oxygen ligands at an average distance of ∼2 Å, and with a Fe-Fe distance of ∼3.6 Å that does not vary markedly between the ferric and fully reduced state. EXAFS of E. coli YtfE incubated with NO revealed the formation of a single {FeNO} species, a reaction that yields N2O. More recently, the access of NO to the di-iron center of YtfE was proposed to occur through a hydrophobic channel that connects the metal site to the N-terminal domain [31,32]. The ability of YtfE to bind NO is an expected observation as, in general, di-iron proteins bind small molecules like NO, O2, azide, thiocyanide, or chloride ions (e.g., [33]). As for bacterial methane oxygenases and ribonucleotide reductases [34,35,36], the E. coli YtfE NO reductase activity is also negligible [37]. More recently, E. coli YtfE was also described to reduce nitrite with the release of NO, with KM for nitrite of ~250 μM and Kcat of ~35 min−1 [37]. This is a very slow reaction rate when compared with the values usually observed for heme and copper nitrite reductases (in the range of 200–800 s−1) [38].
6. Structural Properties of E. coli YtfE
6.1. RIC Cysteine Motif Does Not Modulate Its Oligomeric Form
E. coli YtfE and R. eutropha RIC were isolated as a mixture of monomers and dimers. In R. eutropha, reduction of RIC with DTT caused the loss of the dimeric form. Therefore, oligomerization was proposed to be related to the formation of disulfide bridges between the two cysteine residues of the highly conserved motif DfCCgG, which is present in the N-terminal domain in most bacterial RICs [30]. To address whether dimerization was linked to the oxidation of these residues, we determined the oligomerization state of a truncated version of E. coli YtfE that lacks the first 57 N-terminal residues and of site-directed mutated proteins where the cysteine residues C30 and C31 were replaced by alanine. Size exclusion chromatography analyses showed that the truncated YtfE is a monomer, as reported earlier [39]. The YtfE-C30A protein is eluted as a mixture of monomers and dimers, as is the case of the wild type protein. On the contrary, the C31A and C30AC31A double mutated proteins are monomers. Thus, we concluded that YtfE oligomerization depends solely on the C31 residue.
6.2. The YtfE Crystal Structure
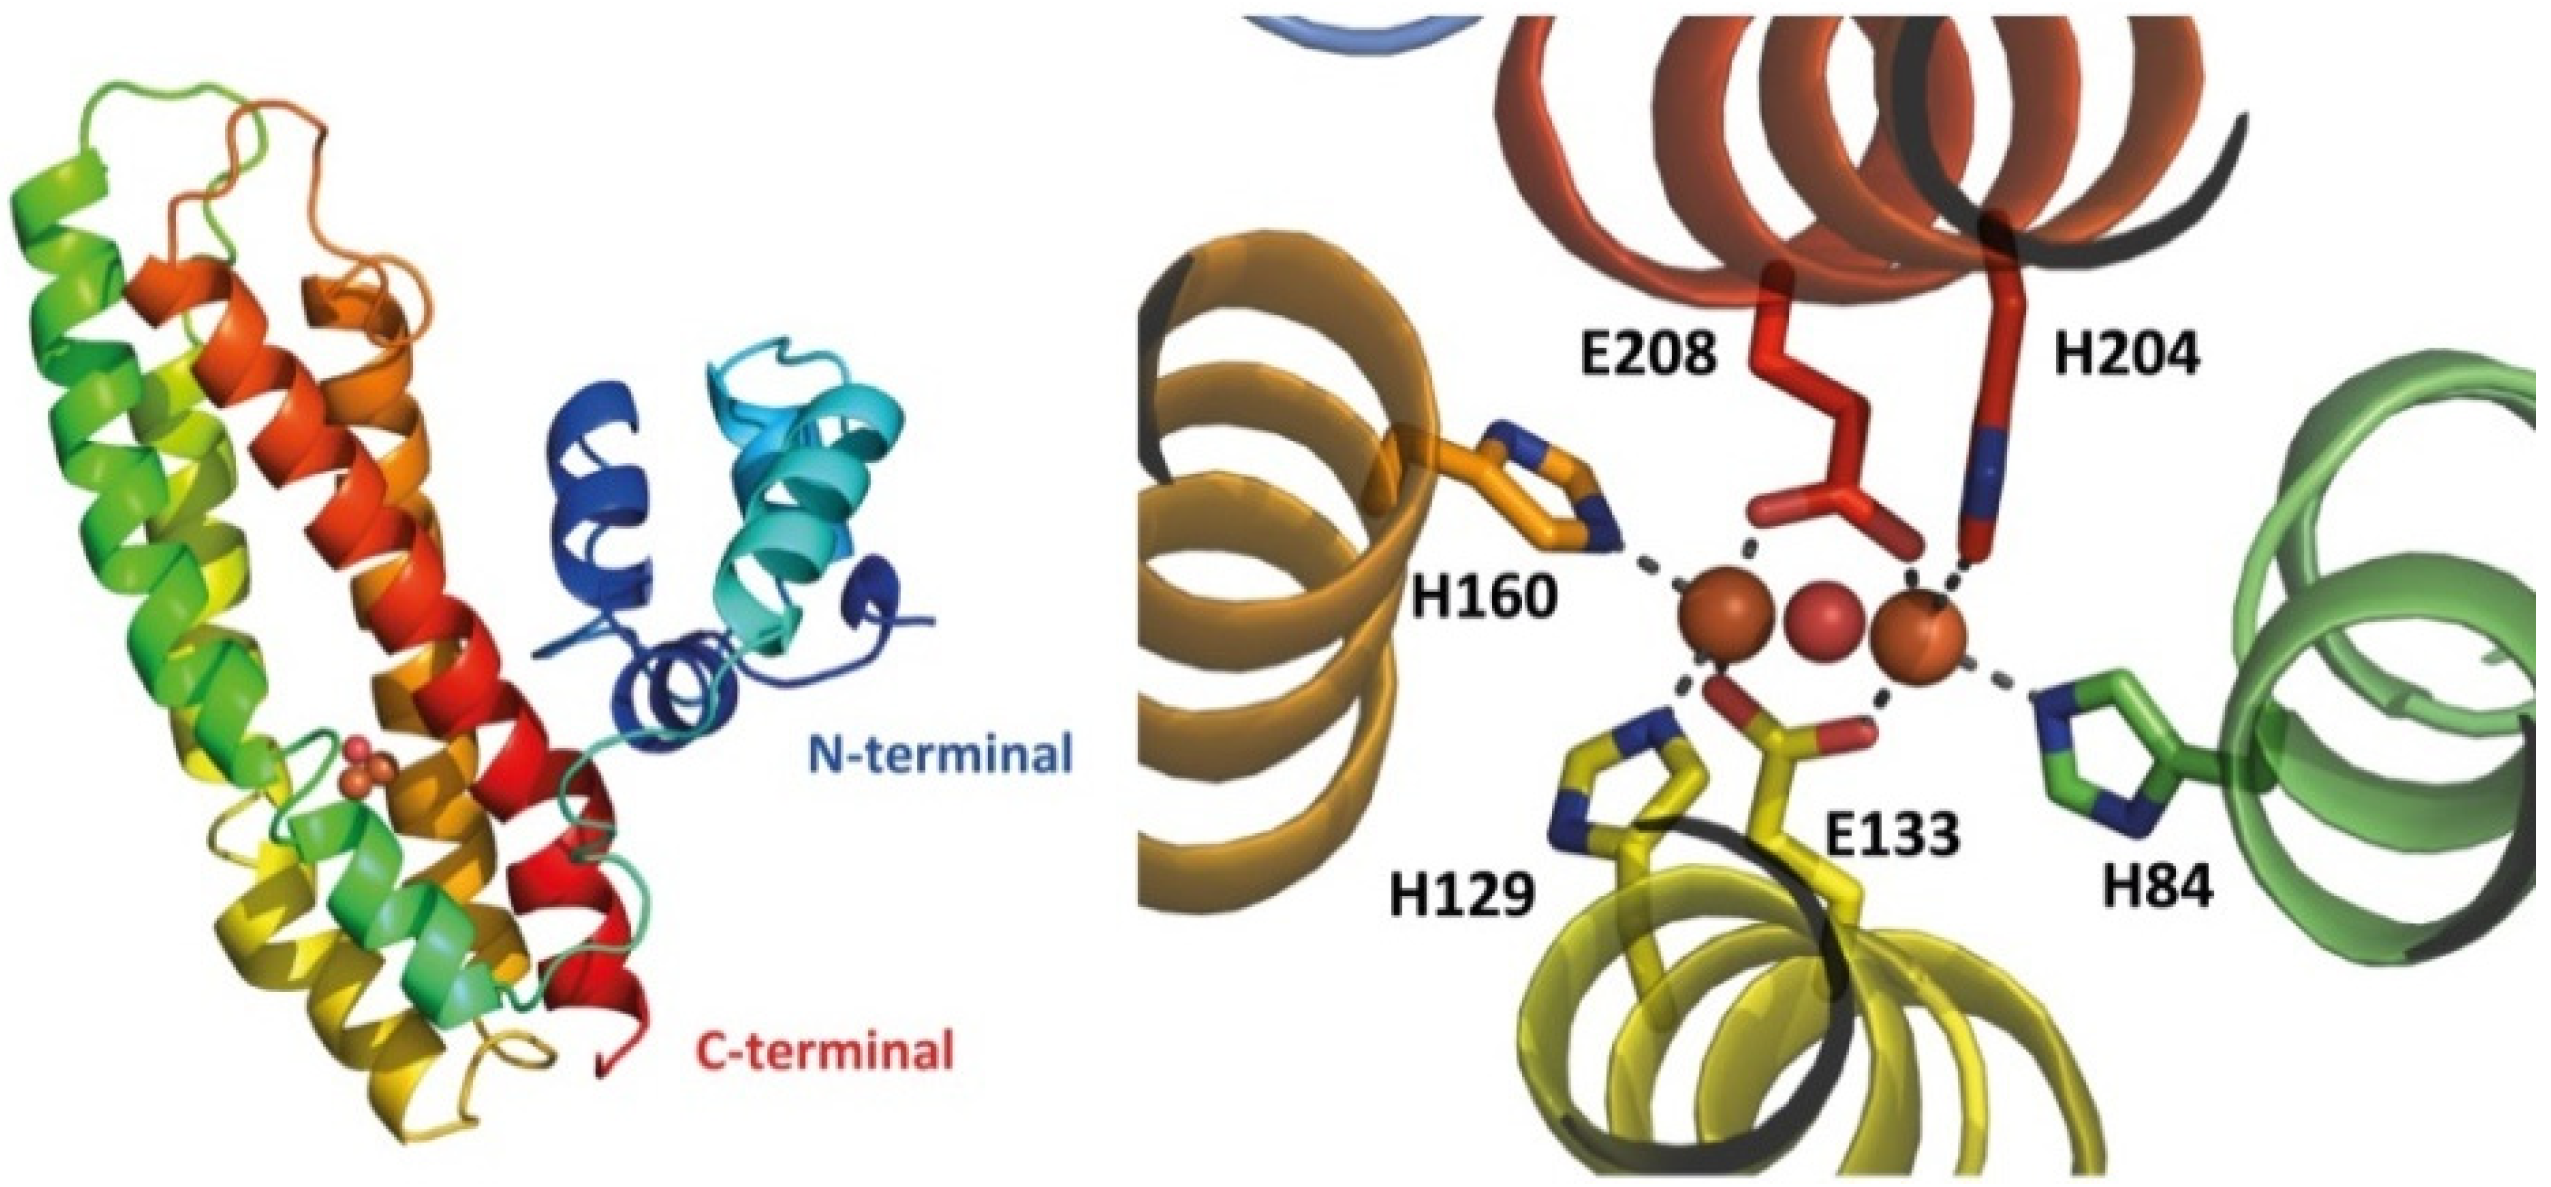
The currently available X-ray structures of RICs are of that the wild type and mutated E. coli YtfE (PDB 7BHA, 5FNN, 5FNP, 5FNY) [31,40]. All structures could only be obtained when harboring the double mutation C30AC31 for reasons that remain unclear. YtfE has an L-shaped two-domain architecture: it exhibits an N-terminal ScdA_N domain connected through a highly flexible penta-peptide to the C-terminal four-helix bundle hemerythrin-like domain containing the di-iron site (Figure 2). The YtfE crystal structure contains two molecules in the asymmetric unit and all molecules show the two domains A and B, which correspond to the ScdA N-terminal domain and the hemerythrin-like domain, respectively. Different YtfE crystal structures were observed to fit in distinct space groups (P21, I41, and P21 21 2), indicating high variability in their inter-domain flexibility [31,40]. Domain A has a globular shape, is composed of 4 α-helices, and contains the conserved motif DfCCgG in the loop between helices 2 and 3. Domain B is composed of a 4-helix bundle fold and shares a similar structural topology with proteins such as hemerythrin, rubrerythrin, and (bacterio)ferritin, with a r.m.s.d. of ca. 3 Å between superimposed main-chain Cα atoms.
An extensive bioinformatics analysis comparing several hemerythrin-like protein structures showed that YtfE has a distinctive two-helix swap resulting in a left-handed four-helix bundle instead of the right-handed one typical of hemerythrins [41]. Thus, regarding the structural fold of the four-helix bundle, RIC proteins form a distinct cluster within the hemerythrin-like and ferritin-like protein families.
The di-iron site inserted in the four-helix bundle is coordinated by histidine residues through their Nε2 atoms: H84 and H204 bind Fe1, and H129 and H160 bind Fe2. The two Fe atoms are bridged by two bidentate glutamates, E133 and E208, and a μ-oxo ligand [31,40].
The YtfE fold forms two channels in the vicinity of the di-iron center. The longer channel (15–25 Å) is mainly formed by hydrophobic residues and connects the di-iron site to the ScdA N-terminal domain. The shorter hydrophilic channel (ca. 10 Å) includes solvent-exposed glutamate residues E125, E159, and E162. Residues E125 and E159 are highly conserved among RICs and are located at about 11.5 and 7 Å from the closest iron atom, respectively. E159 forms an H-bond with the H129 ligand and contributes to the stabilization of the di-iron site. This hydrophilic tunnel has a radius of ~2.3 Å and may accommodate small molecules or ions such as iron; thus, it is proposed to act either as a gate or cation trap [31,39,40].
6.3. YtfE-E159L Can Reassemble A Di-Manganese Site
Our previous studies indicated that mutation of E159 to leucine in YtfE affects the formation of the iron center [39]. The mutated protein no longer exhibits the EPR signal associated with the di-iron center, and the structure contains only one iron atom in the metal site (see below). The E159L mutation induces instability in the overall structure as judged by the higher atomic displacement parameter values when compared to the wild type YtfE. Moreover, the iron is weakly bound as deduced from iron release kinetics data [40].
During the optimization process of the YtfE-159L protein crystallization [40], we observed that when using an additive containing MnCl2 the two iron sites became occupied by manganese. The presence of a di-manganese center improved the overall quality of the crystals with the diffraction data measured at 1.9 Å resolution. Still, in this structure, designated as YtfE-159LMn, coordination and ligand distances were maintained (Figure 3A, Table 2). Data collection and refinement statistics are summarized in Table 3.
These results led us to test the affinity of the wild type YtfE to manganese vs. iron. For this purpose, wild type YtfE was incubated with Mn2+ ions during the crystallization process and X-ray diffraction data were collected. Analysis of the anomalous difference maps obtained from data collected above the Mn and Fe K-absorption edges shows that the metal site contains in both positions a mixture of iron and manganese ions (Figure 3B,C): in position 2, which is closer to E159, manganese represented ca. 45% of the metal occupation, while position 1 retained almost all the iron, as only ca. 10% of manganese was present. No anomalous signal was observed before the Mn K-absorption edge (1.9016 Å) (data not shown). Therefore, iron in position 2 is more easily displaced by manganese than that in position 1 (Figure 3B,C). This observation is consistent with the Mössbauer data showing that in YtfE one of the iron atoms is more labile [29].
6.4. YtfE Binds Preferentially to Iron
Mn-catalases have their metals in the binuclear center bridged by carboxylates and inserted into a four-helix bundle fold, in a structure that shares similarities with that of di-iron sites in hemerythrin-like proteins [47]. Although Fe2+ and Mn2+ may compete for the same metal sites, their physiological functions are very different [48]. Hence it was of relevance to determine the affinity of the wild type YtfE to manganese and compare it with that of iron. This study was done by analyzing the quenching of the intrinsic fluorescence intensity [49] of YtfE upon the addition of Mn2+ or Fe2+, and determination of the binding constants for each metal. Both the apoproteins of the YtfE wild type and the YtfE-E159L variant exhibited intrinsic fluorescence emission spectra, with maxima intensities at ~326 nm. After the addition of Fe2+ or Mn2+ under reducing conditions in the absence of chelating agents, a decrease in the fluorescence intensity was observed, indicating the binding of the metal. Data showed that the wild type protein has a higher affinity to the two metals than the YtfE-E159L mutant. Moreover, the binding affinity constants of the wild type and mutated protein are significantly higher for iron than for manganese (ka = 6.5 ± 0.3 × 10⁻⁶ M (Fe2+) and 0.5 ± 0.2 × 10⁻⁶ M (Mn2+)).
These values clearly indicate that YtfE preferentially accommodates Fe, which is consistent with its physiological function.
7. The Physiological Function of RICs
7.1. Structural Features Related to the Iron Donation Properties of YtfE
E. coli YtfE can provide iron for the assembly of Fe-S centers in the apo-form of the spinach ferredoxin and E. coli IscU, when in reducing conditions and in the presence of IscS and L-cysteine. The E. coli YtfE dissociation constants for the ferric and ferrous iron are ~10−27 M and ~10−13 M, respectively [29]. Analysis of the E. coli YtfE structure shows that the negatively charged residues E125, E159, and E162 are near the di-iron center and the kinetics studies showed that both E125 and E159 control the iron donor properties [40]. We observed that the replacement of E125 and E159 by either hydrophobic or uncharged residues (leucine/asparagine) modifies the iron release properties. When compared to the wild type, the iron release rate of YtfE-E159L is approximately 7-fold higher and that of YtfE-E125L is ca. 8-fold lower [40]. Moreover, the two E125L/N mutants did not promote the assembly of Fe-S clusters in E. coli apo-IscU [29,40].
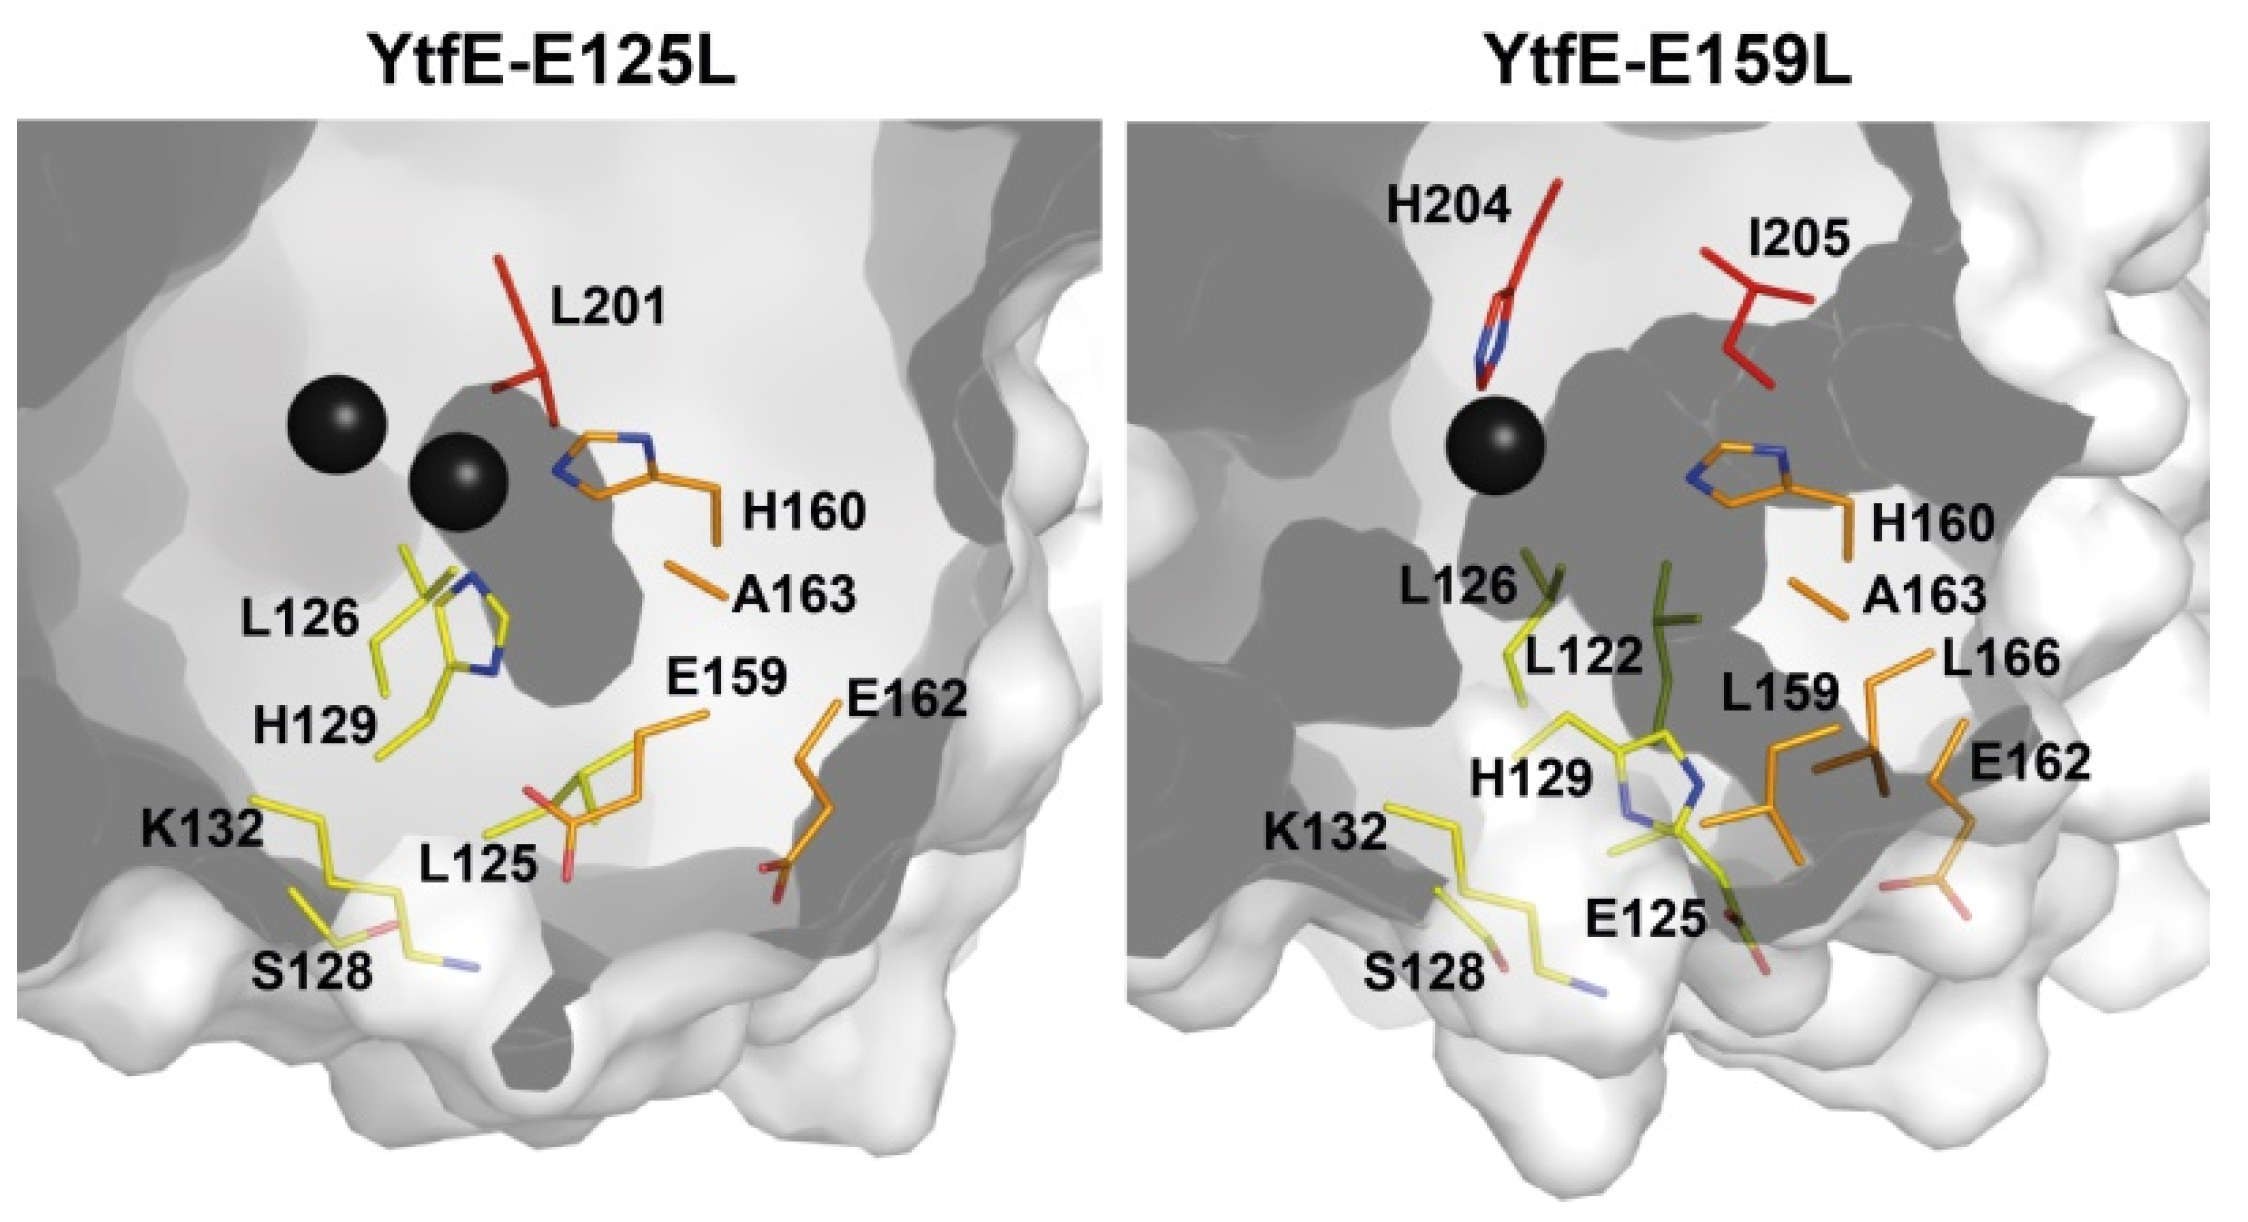
The effect of the replacement of E125 and E159 by leucine in the YtfE structure is depicted in (Figure 4). In YtfE-E125L, the hydrophilic channel is blocked by the side chain of leucine whereas the YtfE-E159L structure retains the iron channel present in the wild type [40].
Prior studies indicated that H129 is the only histidine ligand involved in the control of the iron donation capability of YtfE, as its replacement for a leucine residue produces a protein unable to restore the aconitase activity [39]. Interestingly, H129 forms an H-bond with E159 (H129Nδ1…E159Oε1 2.66 Å). Substitution of E159 by leucine caused the side chain of H129 to change its position towards the protein surface [40], thus impairing the coordination of the second iron atom. This might suggest that the movement of the H129 side chain is concomitant with the release of iron from the di-iron center through the hydrophilic channel. The structural modification of the histidine side chain would also allow the re-entry of an iron atom to rebuild the di-iron center. A similar mechanism has been proposed for the iron traffic in bacterioferritins, as these proteins also have a di-iron center (the ferroxidase site) inserted in a four-helix bundle that is linked to the protein surface through a hydrophilic channel of about 6 Å in length, which is known as the ferroxidase pore. This channel is suggested to be an alternate route for Fe2+ to access the ferroxidase site. Furthermore, the mechanism for iron inclusion contemplates conformational changes of histidine and glutamate residues in the ferroxidase site of bacterioferritin from Azotobacter vinelandii, Pseudomonas aeruginosa, and Desulfovibrio desulfuricans noticed in their X-ray structures [50,51,52,53].
In E. coli CyaY, IscA, SufA, and YtfE, have been considered as putative iron donors for the in vitro assembly of Fe-S clusters (Table 4).
E. coli CyaY is the homologue of human frataxin and a crucial protein for the assembly of Fe-S clusters of mitochondrial, cytoplasmic, and nuclear proteins, leading to its deficiency in the neurodegenerative disease Friedreich ataxia [54]. However, in E. coli and S. enterica, mutations in cyaY do not show a significant impact on Fe-S cluster metabolism [55,56]. More recently, E. coli CyaY was proposed to be a modulator protein of the IscS desulfurase activity, thus refuting its role as an iron donor [57,58,59].
Although both IscA and SufA bind iron, their role in the maturation of [4Fe-4S] clusters also remains elusive. In these proteins, the ferrous iron is weakly bound, as judged by the dissociation constants (Table 4) [60,61,62]. On the contrary, the ferrous iron dissociation constant of YtfE (∼10−13 M) is compatible with an iron donor role under physiological conditions.

7.2. The Protein Interactions of E. coli YtfE
A search in an E. coli DNA library revealed that YtfE interacts with Dps (DNA-Binding Protein from Starved Cells) [68]. Dps is an iron-sequestering protein composed of 12 identical subunits forming a hollow shell surrounding a central cavity where up to ∼500 ferric iron atoms can be stored [69]. We observed that Dps inactivation increases the intracellular ROS levels in relation to cells lacking both ytfE and dps [68]. On the contrary, double and triple mutated strains lacking YtfE, catalases, and alkyl peroxidases showed no changes in ROS content. Moreover, other main iron storage proteins of E. coli, such as bacterioferritin and ferritin FtnA do not interact with YtfE.
Dps protects E. coli cells from oxidative stress generated by ROS formed through the Fenton reaction, which is triggered by free iron, and supports aerobic growth of cells lacking other ROS detoxification systems [70,71]. Studies with Listeria innocua Dps reported that iron is released from the Dps protein cage through 3-fold channels lined by three aspartate residues [72]. Furthermore, the iron release process is triggered by the reduction of ferric oxyhydroxide via reducing agents [72]. Therefore, the interaction of YtfE with Dps could serve to trap ROS released from YtfE di-iron core and/or provide iron needed for the reconstitution of the YtfE di-iron center, a hypothesis that requires further investigation.
E. coli YtfE also establishes interactions with proteins of the isc operon, which codes for proteins required for assembling Fe-S clusters, as shown by the bacterial two-hybrid system, molecular fluorescence complementation, and pull-down assays. In particular, it interacts with the scaffold protein IscU (that transiently assembles a Fe-S cluster) and with cysteine desulfurase IscS, which provides sulfur to the Isc system [40]. Our analysis of the genome of 20 high prevalent pathogens allowed concluding that RICs are found: (i) in bacteria that contain both Isc and Suf systems, as is the case of many bacteria of the Gammaproteobacteria and Clostridia classes; (ii) in microorganisms that contain only the Isc system, such as Neisseria spp. or the protozoan T. vaginalis; and (iii) in bacteria with the Suf system only, as is the case of bacteria of Bacilli (Table 5). Thus, the co-occurrence of RICs with proteins of the Isc and Suf systems may indicate a functional relationship.
Altogether the data so far gathered for YtfE such as the induction by NO stress, the interaction of YtfE with Dps and proteins of the iron-sulfur biogenesis system, the iron donor properties of YtfE, and the ability of YtfE to promote the formation of an iron-sulfur center in IscU and ferredoxin, all indicate that YtfE is a bacterial iron donor. On the contrary, the recently reported low value of nitrite reductase activity of E. coli YtfE was not yet shown to have physiological relevance [37].
8. Conclusions
RICs were first related to the protection of bacteria against NO due to their very high gene expression levels in cells exposed to NO and NO donors [3,8,13,15,17]. However, subsequent studies have shown that YtfE can donate iron for the assembly of Fe-S clusters with a dissociation constant for ferrous ions that is physiologically compatible with this function in vivo. Recent structural and biochemical data revealed that YtfE contains a hydrophilic channel that connects the di-iron site to the protein surface, with dimensions that allow iron traffic. Moreover, YtfE was found to interact with proteins that belong to Fe-S cluster assembly systems. Although more studies are still needed to fully understand the physiological conditions that trigger iron release from RIC and the systems that profit from this iron source, the data gathered is clearly consistent with a role of RICs as iron donor proteins for the assembly of iron-sulfur proteins, which is a novel function for hemerythrin-like proteins.
9. Materials and Methods
9.1. Crystallization and X-ray Diffraction Data Collection and Analysis
Proteins for crystallization were purified and concentrated to 20 mg/mL in buffer Tris-HCl 20 mM pH 7.5 with 150 mM NaCl. Crystallization experiments were done at room temperature using hanging drop 48-well VDX48 plates (Hampton Research) with 0.1 mL of reservoir in each well.
Crystals of E. coli YtfEMn and YtfE-E159LMn were prepared by the hanging drop vapor diffusion method using 1.0:0.8:0.2 µL mixtures of protein-reservoir-additive solutions. The reservoir solutions contained Tris-HCl 0.1 M pH 8.5, 30% PEG 4K and 0.2 M MgCl2 and the additive MnCl2 (0.1 M) (Hampton Research). The YtfE-E159LMn crystals were optimized by streak-seeding using the crystals of YtfE-E159L [40].
Needle-shaped crystals appeared a few minutes after plate set-up and grew to their maximal dimensions in 3–4 days. Crystals were harvested, immersed in a cryoprotectant solution (with the same composition as the reservoir solution supplemented with 25% (v/v) glycerol), flash frozen in liquid nitrogen, and sent to a synchrotron beamline for data collection. The YtfEMn data sets were collected at ALBA beamline XALOC [73] (Barcelona, Spain). The YtfE-E159LMn data set was recorded at beamline ID29 of the European Synchrotron Radiation Facility (ESRF, Grenoble, France). Fluorescence scans near the Mn and Fe K-absorption edges were performed at the XALOC beamline on a YtfEMn crystal and a YtfEwt crystal, respectively. The data were analyzed using the CHOOCH program [74] (Figure 5) and used to select three energies for data collection from the same YtfEMn crystal, namely before the Mn K-edge, at the Mn K-edge peak, and at the Fe K-edge peak. Statistics for data collection and processing for the anomalous data are represented in Table 6.
The three YtfEMn and the single YtfE-E159LMn data sets were integrated and scaled with XDS [75] and autoPROC [76], analyzed with POINTLESS [77], and merged with AIMLESS [78]. The YtfEMn dataset collected at the Mn K-edge (peak Mn) was selected for structure determination and refinement. The YtfEMn and YtfE-E159LMn structures were solved by molecular replacement with PHASER [79] via the CCP4 Graphics User Interface [80,81] using the previously reported E. coli YtfE structure (PDB 7BHA) [40] as the search model. After an initial refinement with REFMAC [82], the models were improved by successive cycles of correction using COOT [83]. The other two YtfEMn datasets (before Mn K-edge and Fe K-edge peak) were phased via refinement with REFMAC against the YtfEMn (Mn peak) structural data. At this stage, anomalous difference maps were calculated with FFT via the CCP4 Graphics User Interface for the Mn K-edge and Fe K-edge datasets.
Refinement of the YtfEMn and YtfE-E159LMn structures continued with PHENIX [84] in five macrocycle steps, with the refinement of positional coordinates and individual isotropic atomic displacement parameters for all non-hydrogen atoms, occupancies, and using non-crystallographic symmetry restraints for the two independent molecules in the asymmetric unit. Hydrogen atoms were added to the structural models and included in the refinement in calculated positions. The examination and editing of the models between refinements were carried out with COOT against σA-weighted 2|Fo| − |Fc| and |Fo| − |Fc| electron density maps. TLS (translation-liberation-screw) rigid body refinement of atomic displacement parameters was carried out for all structures, followed by refinement of individual isotropic B-factors. Two TLS groups were used for each chain, corresponding approximately to the two protein domains. Water molecules were added with PHENIX and verified with COOT. MOLPROBITY [46] was used to examine the model geometry together with the validation tools available in COOT. The structure’s figures were created using the PyMOL, Molecular Graphics System, Version 2.3.4 Open Source (The Pymol Molecular Graphics System, Version 2.0. Schrödinger LLC) [85].
9.2. Fluorescence Measurements to Estimate Metal Binding Affinities
E. coli YtfE wild type and E159L proteins were expressed and purified as described previously [4] but in their apo-form, which was achieved by omitting the addition of iron to the growth medium. The iron content was determined by the TPTZ method [87]. Fluorescence spectra were collected at room temperature on a Cary Varian spectrofluorometer (Agilent). Apo-YtfE and apo-E159L variant protein solutions (5 µM), were prepared in 50 mM HEPES (pH 6.8) with 150 mM NaCl under reducing conditions (with 2 mM Tris (2-carboxyethyl)phosphine, TCEP). Samples were excited at 280 nm and fluorescence spectra were collected in the 290 to 450 nm range [49]. The maximum fluorescence intensity occurred at ~326 nm. MnCl2 and (NH4)2Fe(SO4)2 were used as metal sources. Solutions with different metal concentrations (2.5, 5, 10, 15, 20, 25 µM of Fe2+ or Mn2+) were prepared and incubated with each protein (at 5 µM) for 30 min, after which the fluorescence spectra were recorded. Metal-binding affinities were determined based on the fluorescence changes at 326 nm that occur upon the addition of the metal ion solution. Metal-binding affinities were calculated as metal association constants using GraphPad Prism 5 software.
Author Contributions
L.S.O.S. produced the proteins, performed biochemical experiments, and crystal production. C.V.R., P.M.M. and L.S.O.S. collected and analyzed the crystallographic data. L.M.S., L.S.O.S. and C.V.R. wrote the manuscript with contributions from P.M.M. L.M.S. supervised the work and designed the study. All authors have read and agreed to the published version of the manuscript.
Funding
This work was financially supported by Fundação para a Ciência e Tecnologia (FCT) (Portugal) through fellowship SFRH/BD/118545/2016 (LSOS), PTDC/BIA-MIC/0268/2021 grant, FCT through MOSTMICRO-ITQB R&D Unit (UIDB/04612/2020, UIDP/04612/2020), and LS4FUTURE Associated Laboratory (LA/P/0087/2020). LMS acknowledges funding from the European Union’s Horizon 2020 research and innovation program under grant agreement No. 810856.
Data Availability Statement
The final atomic coordinates and experimental structure factors were deposited in the Worldwide Protein Data Bank with the accession codes 7BE8 and 7OYI for the YtfEMn and YtfE-E159LMn structures, respectively.
Acknowledgments
We would like to thank the staff of the ESRF and EMBL Grenoble for assistance and support in using beamline ID29 regarding the YtfE-E159LMn data. We also thank ALBA Synchrotron Light Facility staff for the collaboration in the YtfEMn data collection at XALOC beamline.
Conflicts of Interest
The authors declare no conflict of interest.
References
- Stern, A.M.; Zhu, J. An Introduction to Nitric Oxide Sensing and Response in Bacteria. Adv. Appl. Microbiol. 2014, 87, 187–220. [Google Scholar] [CrossRef] [PubMed]
- Carvalho, S.M.; Beas, J.Z.; Videira, M.A.M.; Saraiva, L.M. Defenses of Multidrug Resistant Pathogens against Reactive Nitrogen Species Produced in Infected Hosts. Adv. Microb. Physiol. 2022, 80, 85–155. [Google Scholar] [CrossRef] [PubMed]
- Justino, M.C.; Vicente, J.B.; Teixeira, M.; Saraiva, L.M. New Genes Implicated in the Protection of Anaerobically Grown Escherichia coli against Nitric Oxide. J. Biol. Chem. 2005, 280, 2636–2643. [Google Scholar] [CrossRef] [PubMed] [Green Version]
- Justino, M.C.; Almeida, C.C.; Gonçalves, V.L.; Teixeira, M.; Saraiva, L.M. Escherichia coli YtfE Is a Di-Iron Protein with an Important Function in Assembly of Iron-Sulphur Clusters. FEMS Microbiol. Lett. 2006, 257, 278–284. [Google Scholar] [CrossRef] [PubMed] [Green Version]
- Justino, M.C.; Almeida, C.C.; Teixeira, M.; Saraiva, L.M. Escherichia coli Di-Iron YtfE Protein Is Necessary for the Repair of Stress-Damaged Iron-Sulfur Clusters. J. Biol. Chem. 2007, 282, 10352–10359. [Google Scholar] [CrossRef] [PubMed] [Green Version]
- Overton, T.W.; Justino, M.C.; Li, Y.; Baptista, J.M.; Melo, A.M.P.; Cole, J.A.; Saraiva, L.M. Widespread Distribution in Pathogenic Bacteria of Di-Iron Proteins That Repair Oxidative and Nitrosative Damage to Iron-Sulfur Centers. J. Bacteriol. 2008, 190, 2004–2013. [Google Scholar] [CrossRef] [Green Version]
- Nobre, L.S.; Meloni, D.; Teixeira, M.; Viscogliosi, E.; Saraiva, L.M. Trichomonas vaginalis Repair of Iron Centres Proteins: The Different Role of Two Paralogs. Protist 2016, 167, 222–233. [Google Scholar] [CrossRef]
- Justino, M.C.; Baptista, J.M.; Saraiva, L.M. Di-Iron Proteins of the Ric Family Are Involved in Iron-Sulfur Cluster Repair. Biometals 2009, 22, 99–108. [Google Scholar] [CrossRef]
- Bailly, X.; Vanin, S.; Chabasse, C.; Mizuguchi, K.; Vinogradov, S.N. A Phylogenomic Profile of Hemerythrins, the Nonheme Diiron Binding Respiratory Proteins. BMC Evol. Biol. 2008, 8, 1–11. [Google Scholar] [CrossRef] [Green Version]
- Chow, E.D.; Liu, O.W.; O’Brien, S.; Madhani, H.D.; O’Brien, S.; Madhani, H.D.; O’Brien, S.; Madhani, H.D. Exploration of Whole-Genome Responses of the Human AIDS-Associated Yeast Pathogen Cryptococcus neoformans var Grubii: Nitric Oxide Stress and Body Temperature. Curr. Genet. 2007, 52, 137–148. [Google Scholar] [CrossRef]
- Silva, L.O.; Nobre, L.S.; Mil-Homens, D.; Fialho, A.; Saraiva, L.M. Repair of Iron Centers RIC Protein Contributes to the Virulence of Staphylococcus aureus. Virulence 2018, 9, 312–317. [Google Scholar] [CrossRef] [PubMed] [Green Version]
- Harrington, J.C.; Wong, S.M.S.; Rosadini, C.V.; Garifulin, O.; Boyartchuk, V.; Akerley, B.J. Resistance of Haemophilus influenzae to Reactive Nitrogen Donors and Gamma Interferon-Stimulated Macrophages Requires the Formate-Dependent Nitrite Reductase Regulator-Activated YtfE Gene. Infect. Immun. 2009, 77, 1945–1958. [Google Scholar] [CrossRef] [PubMed] [Green Version]
- Karlinsey, J.E.; Bang, I.-S.S.; Becker, L.A.; Frawley, E.R.; Porwollik, S.; Robbins, H.F.; Thomas, V.C.; Urbano, R.; McClelland, M.; Fang, F.C. The NsrR Regulon in Nitrosative Stress Resistance of Salmonella enterica Serovar Typhimurium. Mol. Microbiol. 2012, 85, 1179–1193. [Google Scholar] [CrossRef] [PubMed] [Green Version]
- Davis, K.M.; Krupp, J.; Clark, S.; Isberg, R.R. Iron-Sulfur Cluster Repair Contributes to Yersinia pseudotuberculosis Survival within Deep Tissues. Infect. Immun. 2019, 87, e00533-19. [Google Scholar] [CrossRef] [PubMed] [Green Version]
- Constantinidou, C.; Hobman, J.L.; Griffiths, L.; Patel, M.D.; Penn, C.W.; Cole, J.A.; Overton, T.W. A Reassessment of the FNR Regulon and Transcriptomic Analysis of the Effects of Nitrate, Nitrite, NarXL, and NarQP as Escherichia coli K12 Adapts from Aerobic to Anaerobic Growth. J. Biol. Chem. 2006, 281, 4802–4815. [Google Scholar] [CrossRef] [PubMed] [Green Version]
- Heurlier, K.; Thomson, M.J.; Aziz, N.; Moir, J.W.B. The Nitric Oxide (NO)-Sensing Repressor NsrR of Neisseria meningitidis Has a Compact Regulon of Genes Involved in NO Synthesis and Detoxification. J. Bacteriol. 2008, 190, 2488–2495. [Google Scholar] [CrossRef] [PubMed] [Green Version]
- Filenko, N.; Spiro, S.; Browning, D.F.; Squire, D.; Overton, T.W.; Cole, J.; Constantinidou, C. The NsrR Regulon of Escherichia coli K-12 Includes Genes Encoding the Hybrid Cluster Protein and the Periplasmic, Respiratory Nitrite Reductase. J. Bacteriol. 2007, 189, 4410–4417. [Google Scholar] [CrossRef] [Green Version]
- Pohlmann, A.; Cramm, R.; Schmelz, K.; Friedrich, B. A Novel NO-Responding Regulator Controls the Reduction of Nitric Oxide in Ralstonia eutropha. Mol. Microbiol. 2000, 38, 626–638. [Google Scholar] [CrossRef]
- Richardson, A.R.; Dunman, P.M.; Fang, F.C. The Nitrosative Stress Response of Staphylococcus aureus Is Required for Resistance to Innate Immunity. Mol. Microbiol. 2006, 61, 927–939. [Google Scholar] [CrossRef]
- Vollack, K.-U.; Zumft, W.G. Nitric Oxide Signaling and Transcriptional Control of Denitrification Genes in Pseudomonas stutzeri. J. Bacteriol. 2001, 183, 2516–2526. [Google Scholar] [CrossRef] [Green Version]
- Kinkel, T.L.; Roux, C.M.; Dunman, P.M.; Fang, F.C. The Staphylococcus aureus SrrAB Two-Component System Promotes Resistance to Nitrosative Stress and Hypoxia. MBio 2013, 4, e00696-13. [Google Scholar] [CrossRef] [PubMed] [Green Version]
- Mashruwala, A.A.; Boyd, J.M. The Staphylococcus aureus SrrAB Regulatory System Modulates Hydrogen Peroxide Resistance Factors, Which Imparts Protection to Aconitase during Aerobic Growth. PLoS ONE 2017, 12, e0170283. [Google Scholar] [CrossRef] [PubMed] [Green Version]
- Eriksson, S.; Lucchini, S.; Thompson, A.; Rhen, M.; Hinton, J.C.D. Unravelling the Biology of Macrophage Infection by Gene Expression Profiling of Intracellular Salmonella enterica. Mol. Microbiol. 2003, 47, 103–118. [Google Scholar] [CrossRef] [PubMed]
- Sebbane, F.; Lemaître, N.; Sturdevant, D.E.; Rebeil, R.; Virtaneva, K.; Porcella, S.F.; Hinnebusch, B.J. Adaptive Response of Yersinia pestis to Extracellular Effectors of Innate Immunity during Bubonic Plague. Proc. Natl. Acad. Sci. USA 2006, 103, 11766–11771. [Google Scholar] [CrossRef] [Green Version]
- Manna, A.C.; Ingavale, S.S.; Maloney, M.; van Wamel, W.; Cheung, A.L. Identification of SarV (SA2062), a New Transcriptional Regulator, Is Repressed by SarA and MgrA (SA0641) and Involved in the Regulation of Autolysis in Staphylococcus aureus. J. Bacteriol. 2004, 186, 5267–5280. [Google Scholar] [CrossRef] [Green Version]
- Chen, P.R.; Bae, T.; Williams, W.A.; Duguid, E.M.; Rice, P.A.; Schneewind, O.; He, C. An Oxidation-Sensing Mechanism Is Used by the Global Regulator MgrA in Staphylococcus aureus. Nat. Chem. Biol. 2006, 2, 591–595. [Google Scholar] [CrossRef]
- Nobre, L.S.; Saraiva, L.M. Diiron RICs: Players in Nitrosative-Oxidative Stress Defences. In Stress and Environmental Regulation of Gene Expression and Adaptation in Bacteria; de Bruijn, F.J., Ed.; John Wiley & Sons, Inc.: Hoboken, NJ, USA, 2016; pp. 989–996. ISBN 9781119004882. [Google Scholar]
- Todorovic, S.; Justino, M.C.; Wellenreuther, G.; Hildebrandt, P.; Murgida, D.H.; Meyer-Klaucke, W.; Saraiva, L.M. Iron-Sulfur Repair YtfE Protein from Escherichia coli: Structural Characterization of the Di-Iron Center. J. Biol. Inorg. Chem. 2008, 13, 765–770. [Google Scholar] [CrossRef]
- Nobre, L.S.; Garcia-Serres, R.; Todorovic, S.; Hildebrandt, P.; Teixeira, M.; Latour, J.-M.; Saraiva, L.M. Escherichia coli RIC Is Able to Donate Iron to Iron-Sulfur Clusters. PLoS ONE 2014, 9, e95222. [Google Scholar] [CrossRef] [Green Version]
- Strube, K.; De Vries, S.; Cramm, R. Formation of a Dinitrosyl Iron Complex by NorA, a Nitric Oxide-Binding Di-Iron Protein from Ralstonia eutropha H16. J. Biol. Chem. 2007, 282, 20292–20300. [Google Scholar] [CrossRef] [Green Version]
- Lo, F.-C.; Hsieh, C.-C.; Maestre-Reyna, M.; Chen, C.-Y.; Ko, T.-P.; Horng, Y.-C.; Lai, Y.-C.; Chiang, Y.-W.; Chou, C.-M.; Chiang, C.-H.; et al. Crystal Structure Analysis of the Repair of Iron Centers Protein YtfE and Its Interaction with NO. Chem. A Eur. J. 2016, 22, 1–10. [Google Scholar] [CrossRef]
- Tsai, R.F.; Lin, N.C.; Kao, T.Y.; Kuo, Y.H.; Lo, F.C.; Liaw, W.F.; Chiang, Y.W. Nitrosylation of the Diiron Core Mediated by the N Domain of YtfE. J. Phys. Chem. Lett. 2020, 11, 8538–8542. [Google Scholar] [CrossRef] [PubMed]
- Stenkamp, R.E. Hemerythrin. In Handbook of Metalloproteins; John Wiley & Sons, Ltd.: Chichester, UK, 2006; pp. 1–12. [Google Scholar]
- Lu, J.; Bi, B.; Lai, W.; Chen, H. Origin of Nitric Oxide Reduction Activity in Flavo–Diiron NO Reductase: Key Roles of the Second Coordination Sphere. Angew. Chem. Int. Ed. 2019, 58, 3795–3799. [Google Scholar] [CrossRef] [PubMed]
- Hayashi, T.; Caranto, J.D.; Matsumura, H.; Donald, M.; Kurtz, J.; Moënne-Loccoz, P. Vibrational Analysis of Mononitrosyl Complexes in Hemerythrin and Flavodiiron Proteins: Relevance to Detoxifying NO Reductase. J. Am. Chem. Soc. 2012, 134, 6878–6884. [Google Scholar] [CrossRef] [PubMed] [Green Version]
- Caldas Nogueira, M.L.; Pastore, A.J.; Davidson, V.L. Diversity of Structures and Functions of Oxo-Bridged Non-Heme Diiron Proteins. Arch. Biochem. Biophys. 2021, 705, 108917. [Google Scholar] [CrossRef]
- Crack, J.C.; Balasiny, B.K.; Bennett, S.P.; Rolfe, M.D.; Froes, A.; Macmillan, F.; Green, J.; Cole, J.A.; Le Brun, N.E. The Di-Iron Protein YtfE Is a Nitric Oxide-Generating Nitrite Reductase Involved in the Management of Nitrosative Stress. J. Am. Chem. Soc. 2022, 144, 7129–7145. [Google Scholar] [CrossRef]
- Campeciño, J.; Lagishetty, S.; Wawrzak, Z.; Alfaro, V.S.; Lehnert, N.; Reguera, G.; Hu, J.; Hegg, E.L. Cytochrome c Nitrite Reductase from the Bacterium Geobacter lovleyi Represents a New NrfA Subclass. J. Biol. Chem. 2020, 295, 11455–11465. [Google Scholar] [CrossRef]
- Nobre, L.S.; Lousa, D.; Pacheco, I.; Soares, C.M.; Teixeira, M.; Saraiva, L.M. Insights into the Structure of the Diiron Site of RIC from Escherichia coli. FEBS Lett. 2015, 589, 426–431. [Google Scholar] [CrossRef] [Green Version]
- Silva, L.S.O.; Matias, P.M.; Romão, C.V.; Saraiva, L.M. Structural Basis of RICs Iron Donation for Iron-Sulfur Cluster Biogenesis. Front. Microbiol. 2021, 12, 994. [Google Scholar] [CrossRef]
- Alvarez-Carreño, C.; Alva, V.; Becerra, A.; Lazcano, A. Structure, Function and Evolution of the Hemerythrin-like Domain Superfamily. Protein Sci. 2018, 27, 848–860. [Google Scholar] [CrossRef]
- Arndt, U.; Crowther, R.A.; Mallett, J.F.W. A Computer-Linked Cathode-Ray Tube Microdensitometer for X-Ray Crystallography. J. Sci. Instrum. 1968, 1, 510–516. [Google Scholar] [CrossRef]
- Diederichs, K.; Karplus, P.A. Improved R-Factors for Diffraction Data Analysis in Macromolecular Crystallography. Nat. Struct. Biol. 1997, 4, 269–275. [Google Scholar] [CrossRef] [PubMed]
- Weiss, M.S. Global Indicators of X-Ray Data Quality. J. Appl. Cryst. 2001, 34, 130–135. [Google Scholar] [CrossRef]
- Karplus, P.A.; Diederichs, K. Linking Crystallographic Model and Data Quality. Science. 2012, 336, 1030–1033. [Google Scholar] [CrossRef] [PubMed] [Green Version]
- Williams, C.J.; Headd, J.J.; Moriarty, N.W.; Prisant, M.G.; Videau, L.L.; Deis, L.N.; Verma, V.; Keedy, D.A.; Hintze, B.J.; Chen, V.B.; et al. MolProbity: More and Better Reference Data for Improved All-Atom Structure Validation. Protein Sci. 2018, 27, 293–315. [Google Scholar] [CrossRef]
- Chelikani, P.; Fita, I.; Loewen, P.C. Diversity of Structures and Properties among Catalases. Cell. Mol. Life Sci. 2004, 61, 192–208. [Google Scholar] [CrossRef]
- Cotruvo, J.J.A.; Stubbe, J. Metallation and Mismetallation of Iron and Manganese Proteins in vitro and in vivo: The Class I Ribonucleotide Reductases as a Case Study. Metallomics 2012, 4, 1020–1036. [Google Scholar] [CrossRef] [Green Version]
- Zhang, L.; Butler, C.A.; Khan, H.S.G.; Dashper, S.G.; Seers, C.A.; Veith, P.D.; Zhang, J.G.; Reynolds, E.C. Characterisation of the Porphyromonas gingivalis Manganese Transport Regulator Orthologue. PLoS ONE 2016, 11, e0151407. [Google Scholar] [CrossRef] [Green Version]
- Macedo, S.; Romão, C.V.; Mitchell, E.; Matias, P.M.; Liu, M.Y.; Xavier, A.V.; LeGall, J.; Teixeira, M.; Lindley, P.; Carrondo, M.A. The Nature of the Di-Iron Site in the Bacterio-Ferritin from Desulfovibrio desulfuricans. Nat. Struct. Biol. 2003, 10, 285–290. [Google Scholar] [CrossRef]
- Swartz, L.; Kuchinskas, M.; Li, H.; Poulos, T.L.; Lanzilotta, W.N. Redox-Dependent Structural Changes in the Azotobacter vinelandii Bacterioferritin: New Insights into the Ferroxidase and Iron Transport Mechanism. Biochemistry 2006, 45, 4421–4428. [Google Scholar] [CrossRef]
- Weeratunga, S.K.; Lovell, S.; Yao, H.; Battaile, K.P.; Fischer, C.J.; Gee, C.E.; Rivera, M. Structural Studies of Bacterioferritin B from Pseudomonas aeruginosa Suggest a Gating Mechanism for Iron Uptake via the Ferroxidase Center. Biochemistry 2010, 49, 1160–1175. [Google Scholar] [CrossRef] [Green Version]
- Ebrahimi, K.H.; Hagedoorn, P.-L.; Hagen, W.R. Unity in the Biochemistry of the Iron-Storage Proteins Ferritin and Bacterioferritin. Chem. Rev. 2015, 115, 295–326. [Google Scholar] [CrossRef] [PubMed]
- Vaubel, R.A.; Isaya, G. Iron-Sulfur Cluster Synthesis, Iron Homeostasis and Oxidative Stress in Friedreich Ataxia. Mol. Cell. Neurosci. 2013, 55, 50–61. [Google Scholar] [CrossRef] [PubMed] [Green Version]
- Vivas, E.; Skovran, E.; Downs, D.M. Salmonella Enterica Strains Lacking the Frataxin Homolog CyaY Show Defects in Fe-S Cluster Metabolism In Vivo. J. Bacteriol. 2006, 188, 1175–1179. [Google Scholar] [CrossRef] [PubMed] [Green Version]
- Li, D.S.; Ohshima, K.; Jiralerspong, S.; Bojanowski, M.W.; Pandolfo, M. Knock-out of the CyaY Gene in Escherichia coli Does Not Affect Cellular Iron Content and Sensitivity to Oxidants. FEBS Lett. 1999, 456, 13–16. [Google Scholar] [CrossRef] [Green Version]
- Adinolfi, S.; Iannuzzi, C.; Prischi, F.; Pastore, C.; Iametti, S.; Martin, S.R.; Bonomi, F.; Pastore, A. Bacterial Frataxin CyaY Is the Gatekeeper of Iron-Sulfur Cluster Formation Catalyzed by IscS. Nat. Struct. Mol. Biol. 2009, 16, 390–396. [Google Scholar] [CrossRef]
- Roche, B.; Huguenot, A.; Barras, F.; Py, B. The Iron-Binding CyaY and IscX Proteins Assist the ISC-Catalyzed Fe-S Biogenesis in Escherichia coli. Mol. Microbiol. 2015, 95, 605–623. [Google Scholar] [CrossRef] [Green Version]
- Adinolfi, S.; Puglisi, R.; Crack, J.C.; Iannuzzi, C.; Dal Piaz, F.; Konarev, P.V.; Svergun, D.I.; Martin, S.; Le Brun, N.E.; Pastore, A. The Molecular Bases of the Dual Regulation of Bacterial Iron Sulfur Cluster Biogenesis by CyaY and IscX. Front. Mol. Biosci. 2018, 4, 1–11. [Google Scholar] [CrossRef] [Green Version]
- Blanc, B.; Gerez, C.; Ollagnier de Choudens, S. Assembly of Fe/S Proteins in Bacterial Systems. Biochemistry of the Bacterial ISC System. Biochim. Biophys. Acta Mol. Cell Res. 2015, 1853, 1436–1447. [Google Scholar] [CrossRef]
- Lu, J.; Yang, J.; Tan, G.; Ding, H. Complementary Roles of SufA and IscA in the Biogenesis of Iron-Sulfur Clusters in Escherichia coli. Biochem. J. 2008, 409, 535–543. [Google Scholar] [CrossRef] [Green Version]
- Aussel, L.; Chareyre, S.; Duverger, Y.; Ezraty, B.; Huguenot, A.; Mandin, P.; Py, B.; Zamarreno, J.; Barras, F. The ISC System and the Different Facets of Fe-S Biology in Bacteria. In Biochemistry, Biosynthesis and Human Diseases; Rouault, T., Ed.; De Gruyter: Berlin, Germany; Boston, MA, USA, 2017; Volume 2, pp. 31–45. ISBN 9783110479850. [Google Scholar]
- Bou-Abdallah, F.; Adinolfi, S.; Pastore, A.; Laue, T.M.; Dennis Chasteen, N. Iron Binding and Oxidation Kinetics in Frataxin CyaY of Escherichia coli. J. Mol. Biol. 2004, 341, 605–615. [Google Scholar] [CrossRef]
- Layer, G.; Ollagnier-De Choudens, S.; Sanakis, Y.; Fontecave, M. Iron-Sulfur Cluster Biosynthesis: Characterization of Escherichia coli CyaY as an Iron Donor for the Assembly of [2Fe-2S] Clusters in the Scaffold IscU. J. Biol. Chem. 2006, 281, 16256–16263. [Google Scholar] [CrossRef] [PubMed] [Green Version]
- Ding, H.; Clark, R.J.; Ding, B. IscA Mediates Iron Delivery for Assembly of Iron-Sulfur Clusters in IscU under the Limited Accessible Free Iron Conditions. J. Biol. Chem. 2004, 279, 37499–37504. [Google Scholar] [CrossRef] [PubMed] [Green Version]
- Sendra, M.; Ollagnier de Choudens, S.; Lascoux, D.; Sanakis, Y.; Fontecave, M. The SUF Iron-Sulfur Cluster Biosynthetic Machinery: Sulfur Transfer from the SUFS-SUFE Complex to SUFA. FEBS Lett. 2007, 581, 1362–1368. [Google Scholar] [CrossRef] [PubMed] [Green Version]
- Cui, Q.; Thorgersen, M.P.; Westler, W.M.; Markley, J.L.; Downs, D.M. Solution Structure of YggX: A Prokaryotic Protein Involved in Fe(II) Trafficking. Proteins Struct. Funct. Bioinf. 2006, 62, 578–586. [Google Scholar] [CrossRef]
- Silva, L.S.O.; Baptista, J.M.; Batley, C.; Andrews, S.C.; Saraiva, L.M. The Di-Iron RIC Protein (YtfE) of Escherichia coli Interacts with the DNA-Binding Protein from Starved Cells (Dps) to Diminish RIC Protein-Mediated Redox Stress. J. Bacteriol. 2018, 200, e00527-18. [Google Scholar] [CrossRef] [Green Version]
- Calhoun, L.N.; Kwon, Y.M. Structure, Function and Regulation of the DNA-Binding Protein Dps and Its Role in Acid and Oxidative Stress Resistance in Escherichia coli: A Review. J. Appl. Microbiol. 2011, 110, 375–386. [Google Scholar] [CrossRef]
- Zhao, G.; Ceci, P.; Ilari, A.; Giangiacomo, L.; Laue, T.M.; Chiancone, E.; Chasteen, N.D. Iron and Hydrogen Peroxide Detoxification Proprieties of DNA-Binding Protein from Starved Cells: A Ferritin-like DNA-Binding Protein of Escherichia coli. J. Biol. Chem. 2002, 277, 27689–27696. [Google Scholar] [CrossRef] [Green Version]
- Park, S.; You, X.; Imlay, J.A. Substantial DNA Damage from Submicromolar Intracellular Hydrogen Peroxide Detected in Hpx- Mutants of Escherichia coli. Proc. Natl. Acad. Sci. USA 2005, 102, 9317–9322. [Google Scholar] [CrossRef] [Green Version]
- Bellapadrona, G.; Stefanini, S.; Zamparelli, C.; Theil, E.C.; Chiancone, E. Iron Translocation into and out of Listeria innocua Dps and Size Distribution of the Protein-Enclosed Nanomineral Are Modulated by the Electrostatic Gradient at the 3-Fold “Ferritin-like” Pores. J. Biol. Chem. 2009, 284, 19101–19109. [Google Scholar] [CrossRef] [Green Version]
- Juanhuix, J.; Gil-Ortiz, F.; Cuní, G.; Colldelram, C.; Nicolás, J.; Lidón, J.; Boter, E.; Ruget, C.; Ferrer, S.; Benach, J. Developments in Optics and Performance at BL13-XALOC, the Macromolecular Crystallography Beamline at the Alba Synchrotron. J. Synchrotron Radiat. 2014, 21, 679–689. [Google Scholar] [CrossRef]
- Evans, G.; Pettifer, R.F. CHOOCH: A Program for Deriving Anomalous-Scattering Factors from X-Ray Fluorescence Spectra. Acta Crystallogr. Sect. D Struct. Biol. 2001, 34, 82–86. [Google Scholar] [CrossRef] [Green Version]
- Kabsch, W. XDS. Acta Crystallogr. D. Biol. Crystallogr. 2010, 66, 125–132. [Google Scholar] [CrossRef] [PubMed] [Green Version]
- Vonrhein, C.; Flensburg, C.; Keller, P.; Sharff, A.; Smart, O.; Paciorek, W.; Womack, T.; Bricogne, G. Data Processing and Analysis with the AutoPROC Toolbox. Acta Crystallogr. Sect. D Biol. Crystallogr. 2011, 67, 293–302. [Google Scholar] [CrossRef] [PubMed] [Green Version]
- Evans, P. Scaling and Assessment of Data Quality. Acta Crystallogr. Sect. D Biol. Crystallogr. 2006, 62, 72–82. [Google Scholar] [CrossRef] [PubMed]
- Evans, P.R.; Murshudov, G.N. How Good Are My Data and What Is the Resolution? Acta Crystallogr. Sect. D Biol. Crystallogr. 2013, 69, 1204–1214. [Google Scholar] [CrossRef] [PubMed]
- McCoy, A.J.; Grosse-Kunstleve, R.W.; Adams, P.D.; Winn, M.D.; Storoni, L.C.; Read, R.J. Phaser Crystallographic Software. urn:issn:0021-8898 2007, 40, 658–674. [Google Scholar] [CrossRef] [Green Version]
- Potterton, E.; Briggs, P.; Turkenburg, M.; Dodson, E. A Graphical User Interface to the CCP4 Program Suite. Acta Crystallogr.-Sect. D Biol. Crystallogr. 2003, 59, 1131–1137. [Google Scholar] [CrossRef] [Green Version]
- Winn, M.D.; Ballard, C.C.; Cowtan, K.D.; Dodson, E.J.; Emsley, P.; Evans, P.R.; Keegan, R.M.; Krissinel, E.B.; Leslie, A.G.W.; McCoy, A.; et al. Overview of the CCP4 Suite and Current Developments. Acta Crystallogr. Sect. D Struct. Biol. 2011, 67, 235–242. [Google Scholar] [CrossRef] [Green Version]
- Kovalevskiy, O.; Nicholls, R.A.; Long, F.; Carlon, A.; Murshudov, G.N. Overview of Refinement Procedures within REFMAC 5: Utilizing Data from Different Sources. Acta Crystallogr. Sect. D Struct. Biol. 2018, 74, 215–227. [Google Scholar] [CrossRef] [Green Version]
- Emsley, P.; Lohkamp, B.; Scott, W.G.; Cowtan, K. Features and Development of Coot. Acta Crystallogr. Sect. D Biol. Crystallogr. 2010, 66, 486–501. [Google Scholar] [CrossRef] [Green Version]
- Liebschner, D.; Afonine, P.V.; Baker, M.L.; Bunkoczi, G.; Chen, V.B.; Croll, T.I.; Hintze, B.; Hung, L.W.; Jain, S.; McCoy, A.J.; et al. Macromolecular Structure Determination Using X-Rays, Neutrons and Electrons: Recent Developments in Phenix. Acta Crystallogr. Sect. D Struct. Biol. 2019, 75, 861–877. [Google Scholar] [CrossRef] [PubMed] [Green Version]
- Schrödinger, L. The PyMol Molecular Graphics System, Version 2.0. Schrödinger, LLC. 2020. Available online: http://www.pymol.org/pymol (accessed on 20 April 2022).
- Burley, S.K.; Berman, H.M.; Bhikadiya, C.; Bi, C.; Chen, L.; Di Costanzo, L.; Christie, C.; Duarte, J.M.; Dutta, S.; Feng, Z.; et al. Protein Data Bank: The Single Global Archive for 3D Macromolecular Structure Data. Nucleic Acids Res. 2019, 47, D520–D528. [Google Scholar] [CrossRef] [Green Version]
- Fischer, D.S.; Price, D.C. A Simple Serum Iron Method Using the New Sensitive Chromogen Tripyridyl-s-Triazine. Clin. Chem. 1964, 10, 21–31. [Google Scholar] [CrossRef] [PubMed]
Figure 1.
Regulation of ric in bacteria. (A)—E. coli YtfE is negatively regulated by NsrR and possibly indirectly repressed by FNR and Fur. (B)—P. stutzeri ric is under the positive control of DnrD. (C)—R. eutropha ric is regulated by NorR. (D)—S. aureus ric is regulated by the two-component system SrrAB in response to RNS. Adapted from [27].

Figure 2.
Structure of E. coli YtfE. The left panel shows a carton diagram of the YtfE monomer, rainbow-colored from the N-terminal (in dark blue) to the C-terminal (in red). The right panel displays a close-up view of the di-iron site, with the protein backbone shown in cartoon representation and the ligand residues depicted as sticks, with the iron atoms represented as orange spheres and the oxygen in the oxo-bridge as a red sphere (PDB entry 7BHA).

Figure 3.
Structures of E. coli YtfE- E159L/YtfE-159LMn and YtfEMn. (A)—Superposition of YtfE-E159L (yellow cartoon with the only iron atom shown as a black sphere) with YtfE-E159LMn (cyan cartoon with the metal sites occupied by Mn atoms represented as violet spheres). Figure shows that residues L159 and H129 have their side-chain positions shifted when Mn occupies the center. (B,C)—Anomalous difference maps of wild type YtfE co-crystallized with an excess of Mn. View of the anomalous difference map peaks drawn at the 8σ level in the di-metal site calculated from anomalous differences obtained at the Mn K-edge (1.8917 Å) ((B), purple mesh) and at the Fe K-edge (1.7313 Å) ((C), orange mesh). Ligand residues are represented as sticks and the monomer is shown in cartoon representation, colored in rainbow colors from blue (N-terminal) to red (C-terminal).

Figure 4.
Structural comparison of the iron channel region in YtfE-E125L and YtfE-E159L. In YtfE-E125L a small cavity is present nearby the di-iron center, but the channel formation becomes blocked when leucine replaces E125. In YtfE-E159L, a channel entrance formed by residues E162, L166, and E125, still connects the external surface to the mononuclear iron center. Adapted from [40].

Figure 5.
Analyses of fluorescence scans near the K-absorption edges of Fe and Mn using CHOOCH (A) Fe edge from a crystal of YtfEwt; (B) Mn edge from a crystal of YtfEMn.
Figure 5.
Analyses of fluorescence scans near the K-absorption edges of Fe and Mn using CHOOCH (A) Fe edge from a crystal of YtfEwt; (B) Mn edge from a crystal of YtfEMn.

Table 1.
Studied microbial RIC proteins.
| Organism | Molecular Mass (kDa) | Fe Atoms | Oligomeric Form | Identity * (%) | References | |
|---|---|---|---|---|---|---|
| Escherichia coli | YtfE | 25 | 2 | Monomer/dimer | - | [4] |
| Staphylococcus aureus | RIC | 25 | 2 | Monomer/dimer | 25 | UR |
| Trichomonas vaginalis | RIC 1 | 28 | 2 | Nd | 26 | [7] |
| RIC 2 | 28 | 0 | Nd | 49 | ||
| Neisseria gonorrhoeae | RIC | 18 | 2 | Monomer/dimer | 31 | UR |
* Amino acid sequence identity with E. coli YtfE. Nd—not determined. UR—our unpublished results.
Table 2.
Distances (Å) between the atoms of coordinating ligands relative to the di-metal site in YtfE-E159LMn mutant, and comparison with equivalent distances observed in di-iron containing YtfE wild type and E159L variant.
Table 2.
Distances (Å) between the atoms of coordinating ligands relative to the di-metal site in YtfE-E159LMn mutant, and comparison with equivalent distances observed in di-iron containing YtfE wild type and E159L variant.
| YtfE-E159LMn | YtfE * | YtfE-E159L * | ||||||
|---|---|---|---|---|---|---|---|---|
| Mn1 | H84 Nε2 | 2.16 | Fe1 | H84 Nε2 | 2.19 | Fe1 | H84 Nε2 | 2.72 |
| H204 Nε2 | 2.29 | H204 Nε2 | 2.16 | H204 Nε2 | 2.35 | |||
| E133 Oε1 | 2.20 | E133 Oε1 | 2.11 | E133 Oε21 | 1.97 | |||
| E208 Oε2 | 2.05 | E208 Oε2 | 2.06 | E133 Oε2 | 2.63 | |||
| O | 2.48 | O | 2.02 | E208 Oε1 | 2.53 | |||
| Mn2 | H129 Nε2 | 2.22 | Fe2 | H129 Nε2 | 2.13 | E208 Oε2 | 1.91 | |
| H160 Nε2 | 2.21 | H160 Nε2 | 2.16 | H2O | 3.17 | |||
| E133 Oε2 | 2.05 | E133 Oε2 | 2.00 | |||||
| E208 Oε1 | 2.21 | E208 Oε1 | 2.07 | |||||
| O oxo-bridge | 2.47 | O oxo-bridge | 2.05 | |||||
* From [40].
Table 3.
Data collection, processing, and refinement statistics for the crystal structures of E. coli YtfE wild type and E159L proteins with manganese in the metal site.
Table 3.
Data collection, processing, and refinement statistics for the crystal structures of E. coli YtfE wild type and E159L proteins with manganese in the metal site.
| YtfEMn-pkMn | YtfE-E159LMn | |
|---|---|---|
| Data Collection and Processing Statistics | ||
| Beamline | ALBA XALOC | ESRF ID29 |
| Detector | Dectris Pilatus 6M | Dectris Pilatus 6M |
| Wavelength (Å) | 1.8917 | 0.9762 |
| Space group | P21 | P21 |
| Unit-cell parameters (Å, °) | a = 60.14, b = 50.11, c = 88.22, β = 100.30 | a = 59.82, b = 49.67, c = 88.09, β = 100.48 |
| Data Processing | XDS/POINTLESS/AIMLESS | XDS/POINTLESS/AIMLESS |
| Resolution range (Å) | 59.18–2.02 (2.05–2.02) | 53.39–1.86 (1.89–1.86) |
| No. of observations | 158206 (771) | 142316 (7402) |
| Unique reflections | 26890 (227) | 43000 (2139) |
| <I/σ(I)> | 10.5 (1.1) | 13.0 (2.2) |
| Rmerge a | 0.102 (1.149) | 0.048 (0.563) |
| Rmeas b | 0.122 (1.617) | 0.058 (0.664) |
| Rpim c | 0.066 (1.137) | 0.032 (0.350) |
| CC 1/2 d | 0.996 (0.395) | 0.999 (0.787) |
| Completeness (%) | 78.3 (13.2) | 99.3 (99.9) |
| Multiplicity | 5.9 (3.4) | 3.3 (3.5) |
| Wilson B-factor (Å2) | 36.8 | 31.2 |
| No. of molecules in a.u. | 2 | 2 |
| Vm (Å3 Da−1) | 2.64 | 2.60 |
| Estimated solvent content (%) | 53.5 | 52.6 |
| Structure refinement statistics | ||
| Resolution limits (Å) | 59.18—2.02 (2.09–2.02) | 53.39–1.86 (1.90–1.86) |
| R-factor e | 0.2386 (0.3691) | 0.1810 (0.3170) |
| nr. Reflections | 26758 (590) | 40900 (4092) |
| Free R-factor f | 0.2870 (0.3947) | 0.2047 (0.3371) |
| nr. Reflections | 1268 (30) | 2089 (198) |
| Coordinate error estimate (Å) | 0.28 | 0.25 |
| Model completeness and composition: | ||
| Omitted regions | 1A, 1B–4B | 1A, 1B |
| Nº molecules in asymmetric unit | 2 | 2 |
| Non-hydrogen protein atoms | 3446 | 3738 |
| Solvent molecules | 100 | 227 |
| Mean B values (Å2) g: | ||
| Protein chain A | 40.6 | 34.9 |
| Protein chain B | 71.5 | 69.0 |
| Solvent molecules | 44.8 | 42.9 |
| Model r.m.s. deviations from ideality: | ||
| Bond lengths (Å) | 0.001 | 0.008 |
| Bond angles (°) | 0.551 | 0.790 |
| Chiral centers (Å3) | 0.033 | 0.044 |
| Planar groups (Å) | 0.002 | 0.006 |
| Model validation h: | ||
| % Ramachandran outliers | 0 | 0 |
| % Ramachandran favored | 96.98 | 97.24 |
| % Rotamer outliers | 0.27 | 0 |
| Cβ outliers | 0 | 0 |
| Clash score | 1.16 | 1.85 |
| PDB accession ID | 7BE8 | 7OYI |
a Rmerge = Σhkl Σi|Ii(hkl) − <I(hkl)>|/Σhkl Σi Ii (hkl), where Ii(hkl) is the observed intensity and <I(hkl)> is the average intensity of multiple observations from symmetry-related reflections [42]. b Rmeas = Σhkl [N/(N(hkl) − 1)]1/2 Σi|Ii(hkl) − <I(hkl)>|/Σhkl Σi Ii (hkl), where N(hkl) is the data multiplicity, Ii(hkl) is the observed intensity and <I(hkl)> is the average intensity of multiple observations from symmetry-related reflections. It is an indicator of the agreement between symmetry related observations [43]. c Rpim = Σhkl [1/(N(hkl) − 1)]1/2 Σi|Ii(hkl) − <I(hkl)>|/Σhkl Σi Ii (hkl), where N(hkl) is the data multiplicity, Ii(hkl) is the observed intensity and <I(hkl)> is the average intensity of multiple observations from symmetry-related reflections. It is an indicator of the precision of the final merged and averaged data set [44]. d CC1/2 = Correlation coefficient between intensities from random half-datasets [45]. e Rfactor = Σ|Fobs−Fcalc|/Σ Fobs, where Fobs and Fcalc are the amplitudes of the observed and the model calculated structure factors, respectively. It is a measure of the agreement between the experimental X-ray diffraction data and the crystallographic model. f cross-validation R-factor computed from a randomly chosen subset of 5% of the total number of reflections that was not used in the refinement. g Calculated from isotropic or equivalent isotropic B-values. h Calculated with MOLPROBITY [46]. Values in parenthesis are for the highest resolution shell.
Table 5.
Distribution of RICs in microorganisms.
| Class | Microorganism | RIC | Isc | Suf |
|---|---|---|---|---|
| Gammaproteobacteria | Escherichia coli | x | x | x |
| Salmonella enterica | x | x | x | |
| Shigella flexneri | x | x | x | |
| Klebsiella pneumoniae | x | x | x | |
| Yersinia pestis | x | x | x | |
| Yersinia pseudotuberculosis | x | x | x | |
| Pseudomonas aeruginosa | x | x | ||
| Haemophilus influenza | x | x | ||
| Actinomycetes | Mycobacterium tuberculosis | x | x | |
| Betaproteobacteria | Neisseria meningitidis | x | x | |
| Neisseria gonorrhoea | x | x | ||
| Clostridia | Clostridium difficile | x | x | x |
| Clostridium perfringens | x | x | x | |
| Bacilli | Bacillus subtilis | x | x | |
| Bacillus anthracis | x | x | ||
| Listeria monocytogenes | x | x | ||
| Staphylococcus aureus | x | x | ||
| Staphylococcus epidermidis | x | x | ||
| Streptococcus pneumoniae | x | x | ||
| Zoomastigoporae (Eukaryote) | Trichomonas vaginalis | x | x |
Table 6.
Data collection and processing statistics for the crystal structures of E. coli YtfE wild type with manganese in the metal site YtfEMn, collected before the Mn K-edge (YtfEMn-bfMn) and at the Fe K-edge peak (YtfEMn-pkFe).
Table 6.
Data collection and processing statistics for the crystal structures of E. coli YtfE wild type with manganese in the metal site YtfEMn, collected before the Mn K-edge (YtfEMn-bfMn) and at the Fe K-edge peak (YtfEMn-pkFe).
| YtfEMn-bfMn | YtfEMn-pkFe | |
|---|---|---|
| Beamline | ALBA XALOC | |
| Detector | Pilatus 6M | |
| Wavelength (Å) | 1.9016 | 1.7316 |
| Space group | P21 | P21 |
| Unit-cell parameters (Å, °) | a = 60.15, b = 50.32, c = 88.26, β = 100.47 | a = 60.26, b = 50.11, c = 88.44, β = 100.23 |
| Data Processing | XDS/POINTLESS/AIMLESS | XDS/POINTLESS/AIMLESS |
| Resolution range (Å) | 86.76–2.10 (2.14–2.10) | 87.04–2.29 (2.33–2.29) |
| No. of observations | 143929 (914) | 143038 (5259) |
| Unique reflections | 24438 (263) | 23203 (1053) |
| <I/σ(I)> | 11.6 (1.2) | 6.4 (2.1) |
| Rmerge a | 0.082 (0.823) | 0.334 (2.734) |
| Rmeas b | 0.090 (0.969) | 0.367 (3.085) |
| Rpim c | 0.035 (0.504) | 0.147 (1.376) |
| CC 1/2 d | 0.997 (0.716) | 0.997 (0.329) |
| Completeness (%) | 79.9 (17.5) | 98.3 (90.5) |
| Multiplicity | 5.9 (3.5) | 6.2 (5.0) |
| Wilson B-factor (Å2) | 49.5 | 48.0 |
| No. of molecules in a.u. | 2 | 2 |
| Vm (Å3 Da−1) | 2.63 | 2.63 |
| Estimated solvent content (%) | 53.2 | 53.2 |
a Rmerge = Σhkl Σi|Ii(hkl) − <I(hkl)>|/Σhkl Σi Ii (hkl), where Ii(hkl) is the observed intensity and <I(hkl)> is the average intensity of multiple observations from symmetry-related reflections [42]. b Rmeas = Σhkl [N/(N(hkl) − 1)]1/2 Σi|Ii(hkl) − <I(hkl)>|/Σhkl Σi Ii (hkl), where N(hkl) is the data multiplicity, Ii(hkl) is the observed intensity and <I(hkl)> is the average intensity of multiple observations from symmetry-related reflections. It is an indicator of the agreement between symmetry-related observations [43]. c Rpim = Σhkl [1/(N(hkl) − 1)]1/2 Σi|Ii(hkl) − <I(hkl)>|/Σhkl Σi Ii (hkl), where N(hkl) is the data multiplicity, Ii(hkl) is the observed intensity and <I(hkl)> is the average intensity of multiple observations from symmetry-related reflections. It is an indicator of the precision of the final merged and averaged data set [44]. d CC1/2 = Correlation coefficient between intensities from random half-datasets [45].
Publisher’s Note: MDPI stays neutral with regard to jurisdictional claims in published maps and institutional affiliations. |
© 2022 by the authors. Licensee MDPI, Basel, Switzerland. This article is an open access article distributed under the terms and conditions of the Creative Commons Attribution (CC BY) license (https://creativecommons.org/licenses/by/4.0/).
Share and Cite
MDPI and ACS Style
Silva, L.S.O.; Matias, P.M.; Romão, C.V.; Saraiva, L.M. Repair of Iron Center Proteins—A Different Class of Hemerythrin-like Proteins. Molecules 2022, 27, 4051. https://0-doi-org.brum.beds.ac.uk/10.3390/molecules27134051
AMA Style
Silva LSO, Matias PM, Romão CV, Saraiva LM. Repair of Iron Center Proteins—A Different Class of Hemerythrin-like Proteins. Molecules. 2022; 27(13):4051. https://0-doi-org.brum.beds.ac.uk/10.3390/molecules27134051
Chicago/Turabian StyleSilva, Liliana S. O., Pedro M. Matias, Célia V. Romão, and Lígia M. Saraiva. 2022. "Repair of Iron Center Proteins—A Different Class of Hemerythrin-like Proteins" Molecules 27, no. 13: 4051. https://0-doi-org.brum.beds.ac.uk/10.3390/molecules27134051