Article

Desorption of Ammonia Adsorbed on Prussian Blue Analogs by Washing with Saturated Ammonium Hydrogen Carbonate Solution

Nanomaterials Research Institute, National Institute of Advanced Industrial Science and Technology (AIST), 1-1-1 Higashi, Tsukuba 305-8565, Japan
*
Author to whom correspondence should be addressed.
Submission received: 15 November 2022 / Revised: 3 December 2022 / Accepted: 5 December 2022 / Published: 13 December 2022
(This article belongs to the Special Issue Feature Papers in Materials Chemistry)

Abstract

:
Prussian blue analogs (PBAs) have been reported as promising ammonia (NH3) adsorbents with a high capacity compared to activated carbon, zeolite, and ion exchange resins. The adsorbed NH3 was desorbed by heating and washing with water or acid. Recently, we demonstrated that desorption was also possible by washing with a saturated ammonium hydrogen carbonate solution (sat. NH4HCO3 aq) and recovered NH3 as an NH4HCO3 solid by introducing CO2 into the washing liquid after desorption. However, this has only been proven for copper ferrocyanide and the relationship between the adsorption/desorption behavior and metal ions in PBAs has not been identified. In this study, we investigated the adsorption/desorption behavior of PBAs that are complexes of first row transition metals with hexacyanometalate anions. Six types of PBAs were tested in this study and copper ferricyanide exhibited the highest desorption/adsorption ratio. X-ray diffraction results revealed high structural stability for cobalt hexacyanocobaltate (CoHCC) and nickel ferricyanide (NiHCF). The Fourier transform infrared spectroscopy results showed that the NH3 adsorbed on the vacancy sites tended to desorb compared to the NH3 adsorbed on the interstitial sites as ammonium ions. Interestingly, the desorption/adsorption ratio exhibited the Irving-Williams order.

1. Introduction

An active nitrogen compound, ammonia (NH3), is widely used as raw material for fertilizers, while its emission into the environment has caused various problems such as eutrophication, acidification, and aerosols (PM2.5) [1,2]. The production of NH3 was estimated to be 182 million metric tons in 2021 [3], most of which was used as a synthetic fertilizer in farms for efficient plant growth [4]. The main production method of NH3, the Haber-Bosch process, requires a temperature of 400–600 °C and pressure of 100–200 bar. NH3 emissions mainly occur in agriculture owing to manure management, evaporation from fertilizers, and grazing. Indeed, 94% of the total NH3 emissions were from agriculture in 2016 [5]. Bio-filters and activated sludge processes, which use bacteria to decompose ammonia into atmospheric nitrogen (N2) usually conduct the detoxification of ammonia. These technologies consume a lot of energy on aeration for biological treatments, only for converting NH3 back to useless N2 [6]. Besides, these detoxification techniques do not treat all the NH3 emitted from agriculture and industry, resulting in the emission of 70 million tons of NH3 per year into the atmosphere [7]. These facts show that if we recycle ammonia, we will solve both pollution and energy issues.
To recycle NH3, novel techniques are needed to collect it and convert it into a reusable form. Existing methods for collecting gaseous NH3 mainly involve water scrubbing and adsorption [8,9,10,11,12]. Water scrubbing takes up space, requires a certain amount of energy for temperature control, and yields a large amount of wastewater. Adsorbents can downsize the NH3 processing system when they have high adsorption capacity.
Prussian blue (PB) and Prussian blue analogs (PBAs) have been reported to adsorb ammonia selectively and exhibit higher adsorption capacities than other ammonia adsorbents [11,13,14]. PB is a mesoporous material that is often used as an adsorbent [15,16,17] and is represented as AyFeIII[FeII(CN)6]x, A = Na+, K+, NH4+, etc. It has been well investigated since it was used as a pigment in the 18th century [18]. Fe3+ and Fe2+ in AyFeIII[FeII(CN)6]x can be substituted into other metals, such as cobalt, copper, and manganese, to yield PBAs exhibiting different adsorption and desorption properties and stabilities [13,19,20,21,22]. There are two types of adsorption sites in PBAs as shown in Figure 1 [13]. One is an interstitial site, which is a confined space where a positive ion is preferentially adsorbed and the other is a vacancy site surrounded by six open metal sites where NH3 and water (H2O) can be adsorbed. Another outstanding property of PBAs is that the desorption of adsorbed NH3 can regenerate them via heating or washing with solutions [13,23,24,25].
If NH3 was desorbed from the PBAs even into a saturated ammonium hydrogen carbonate solution (sat. NH4HCO3 aq), NH3 can be converted to solid ammonium hydrogen carbonate (NH4HCO3). The system uses the characteristic property that NH3 can dissolve even in sat. NH4HCO3 aq. This solution with excess dissolved NH3 yields solid NH4HCO3 when carbon dioxide (CO2) is introduced into the solution because the chemical composition of the system falls within the range of phase separation [26,27]. Recently, our group reported NH3 adsorbed on CuII[FeII(CN)6]0.5 could be desorbed into sat. NH4HCO3 aq [23], and the desorbed NH3 converted into solid NH4HCO3 by blowing CO2 into the solution. However, NH3 desorption into sat. NH4HCO3 aq has been proven only for CuII[FeII(CN)6]0.5, and the relationship between the adsorption/desorption behavior and metal ions in PBAs is not clear. In the case of CuII[FeII(CN)6]0.5, NH3 is adsorbed as NH3 molecules on both the vacancy sites and interstitial sites and as ammonium ions on the interstitial sites. The structure of CuII[FeII(CN)6]0.5 changed upon adsorption and remained unchanged upon desorption. Other PBAs can have more effective NH3 adsorption/desorption behavior for NH3 recovery as NH4HCO3 solids than CuII[FeII(CN)6]0.5. The relationship between the adsorption/desorption behavior and the metal ions in PBAs needs to be clarified to find a PBA with more effective adsorption/desorption characteristics for practical use.
In this study, we investigated the adsorption/desorption behavior of PBAs that are complexes of first row transition metals with hexacyanometalate anions. We tested six types of PBAs: copper hexacyanoferrate (CuHCF), cobalt hexacyanocobaltate (CoHCC), nickel hexacyanoferrate (NiHCF), zinc hexacyanoferrate (ZnHCF), cobalt hexacyanoferrate (CoHCF), and manganese hexacyanoferrate (MnHCF). CuHCF exhibited the highest desorption amount and ratio. Fourier transform infrared spectroscopy (FTIR) showed that the ammonia molecules adsorbed on the vacancy sites tended to desorb compared to the ammonia adsorbed on the interstitial sites as ammonium ions. The desorption/adsorption ratio exhibited the same tendency as that of the Irving-Williams series. The X-ray diffraction (XRD) results showed that structural stability was high for cobalt hexacyanocobaltate (CoHCC) and nickel ferricyanide (NiHCF).

2. Results and Discussion

2.1. The Amount of NH3 Adsorbed and Desorbed

The amount of NH3 adsorbed from gas and desorbed into sat. NH4HCO3 aq., and the desorption ratios against the adsorption amount are listed in Table 1. The CuHCF exhibited the highest adsorption and desorption amounts and desorption ratios. The desorption ratios of CoHCC and NiHCF were smaller than that of CuHCF but promising for practical use. For ZnHCF and CoHCF, NH3 did not desorb significantly. The worst was MnHCF, which exhibited a negative desorption amount, indicating that MnHCF adsorbed ammonium ions in the liquid during washing with sat. NH4HCO3 aq. The desorption amount increased as the adsorption amount increased. However, the desorption amount of CoHCC was higher than that of NiHCF, and its adsorption amount was lower than that of NiHCF.

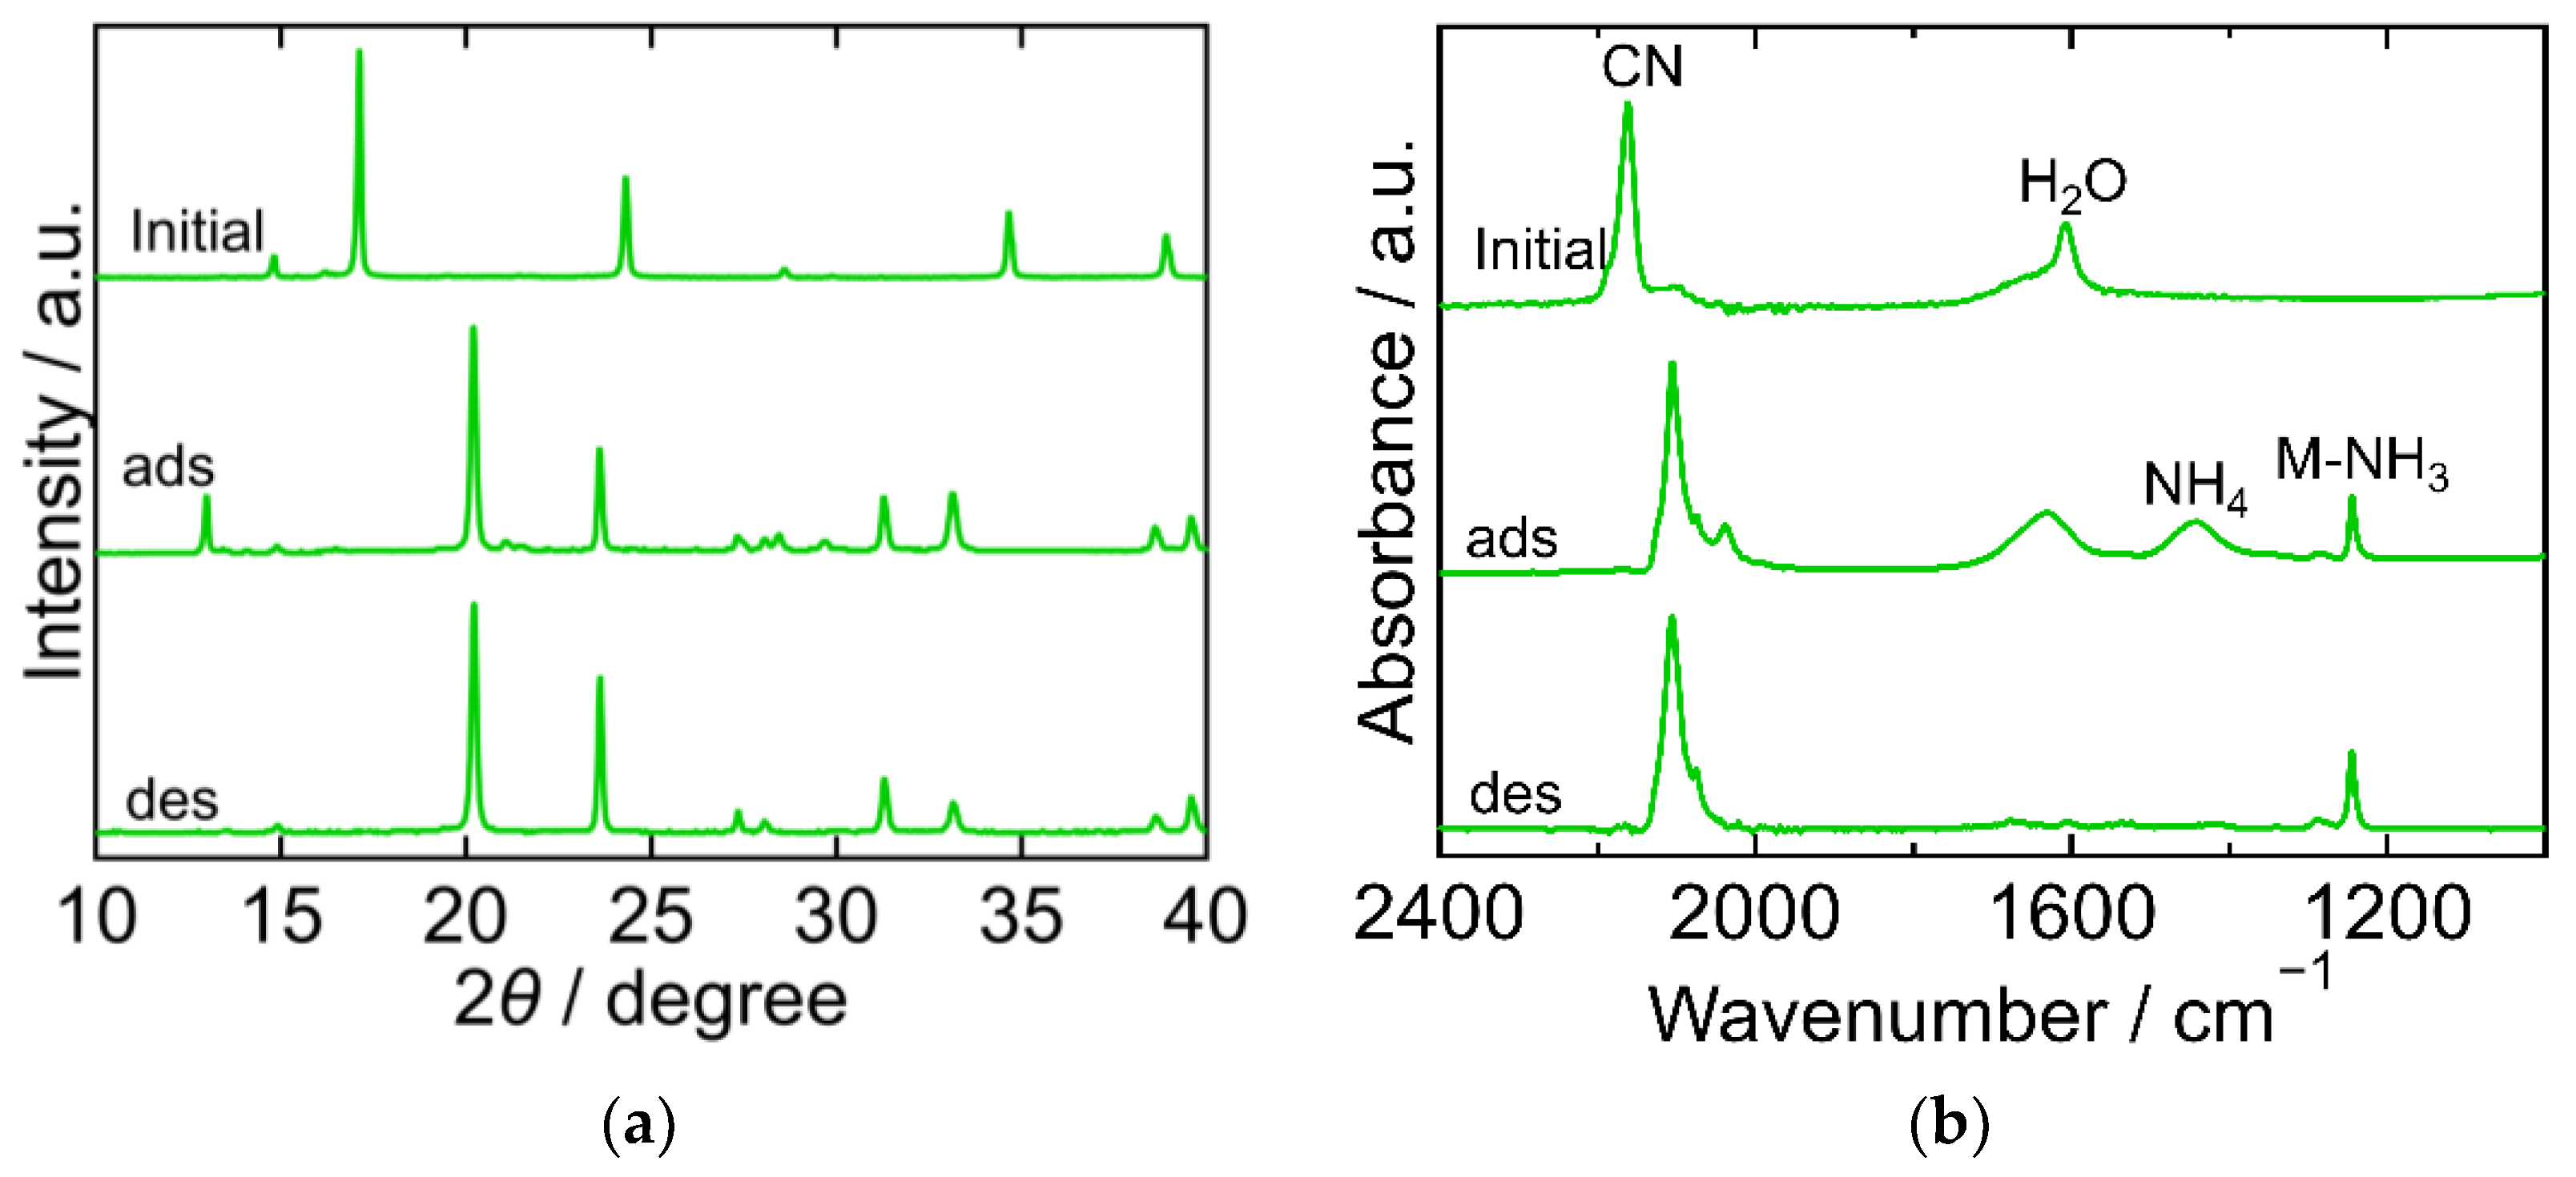
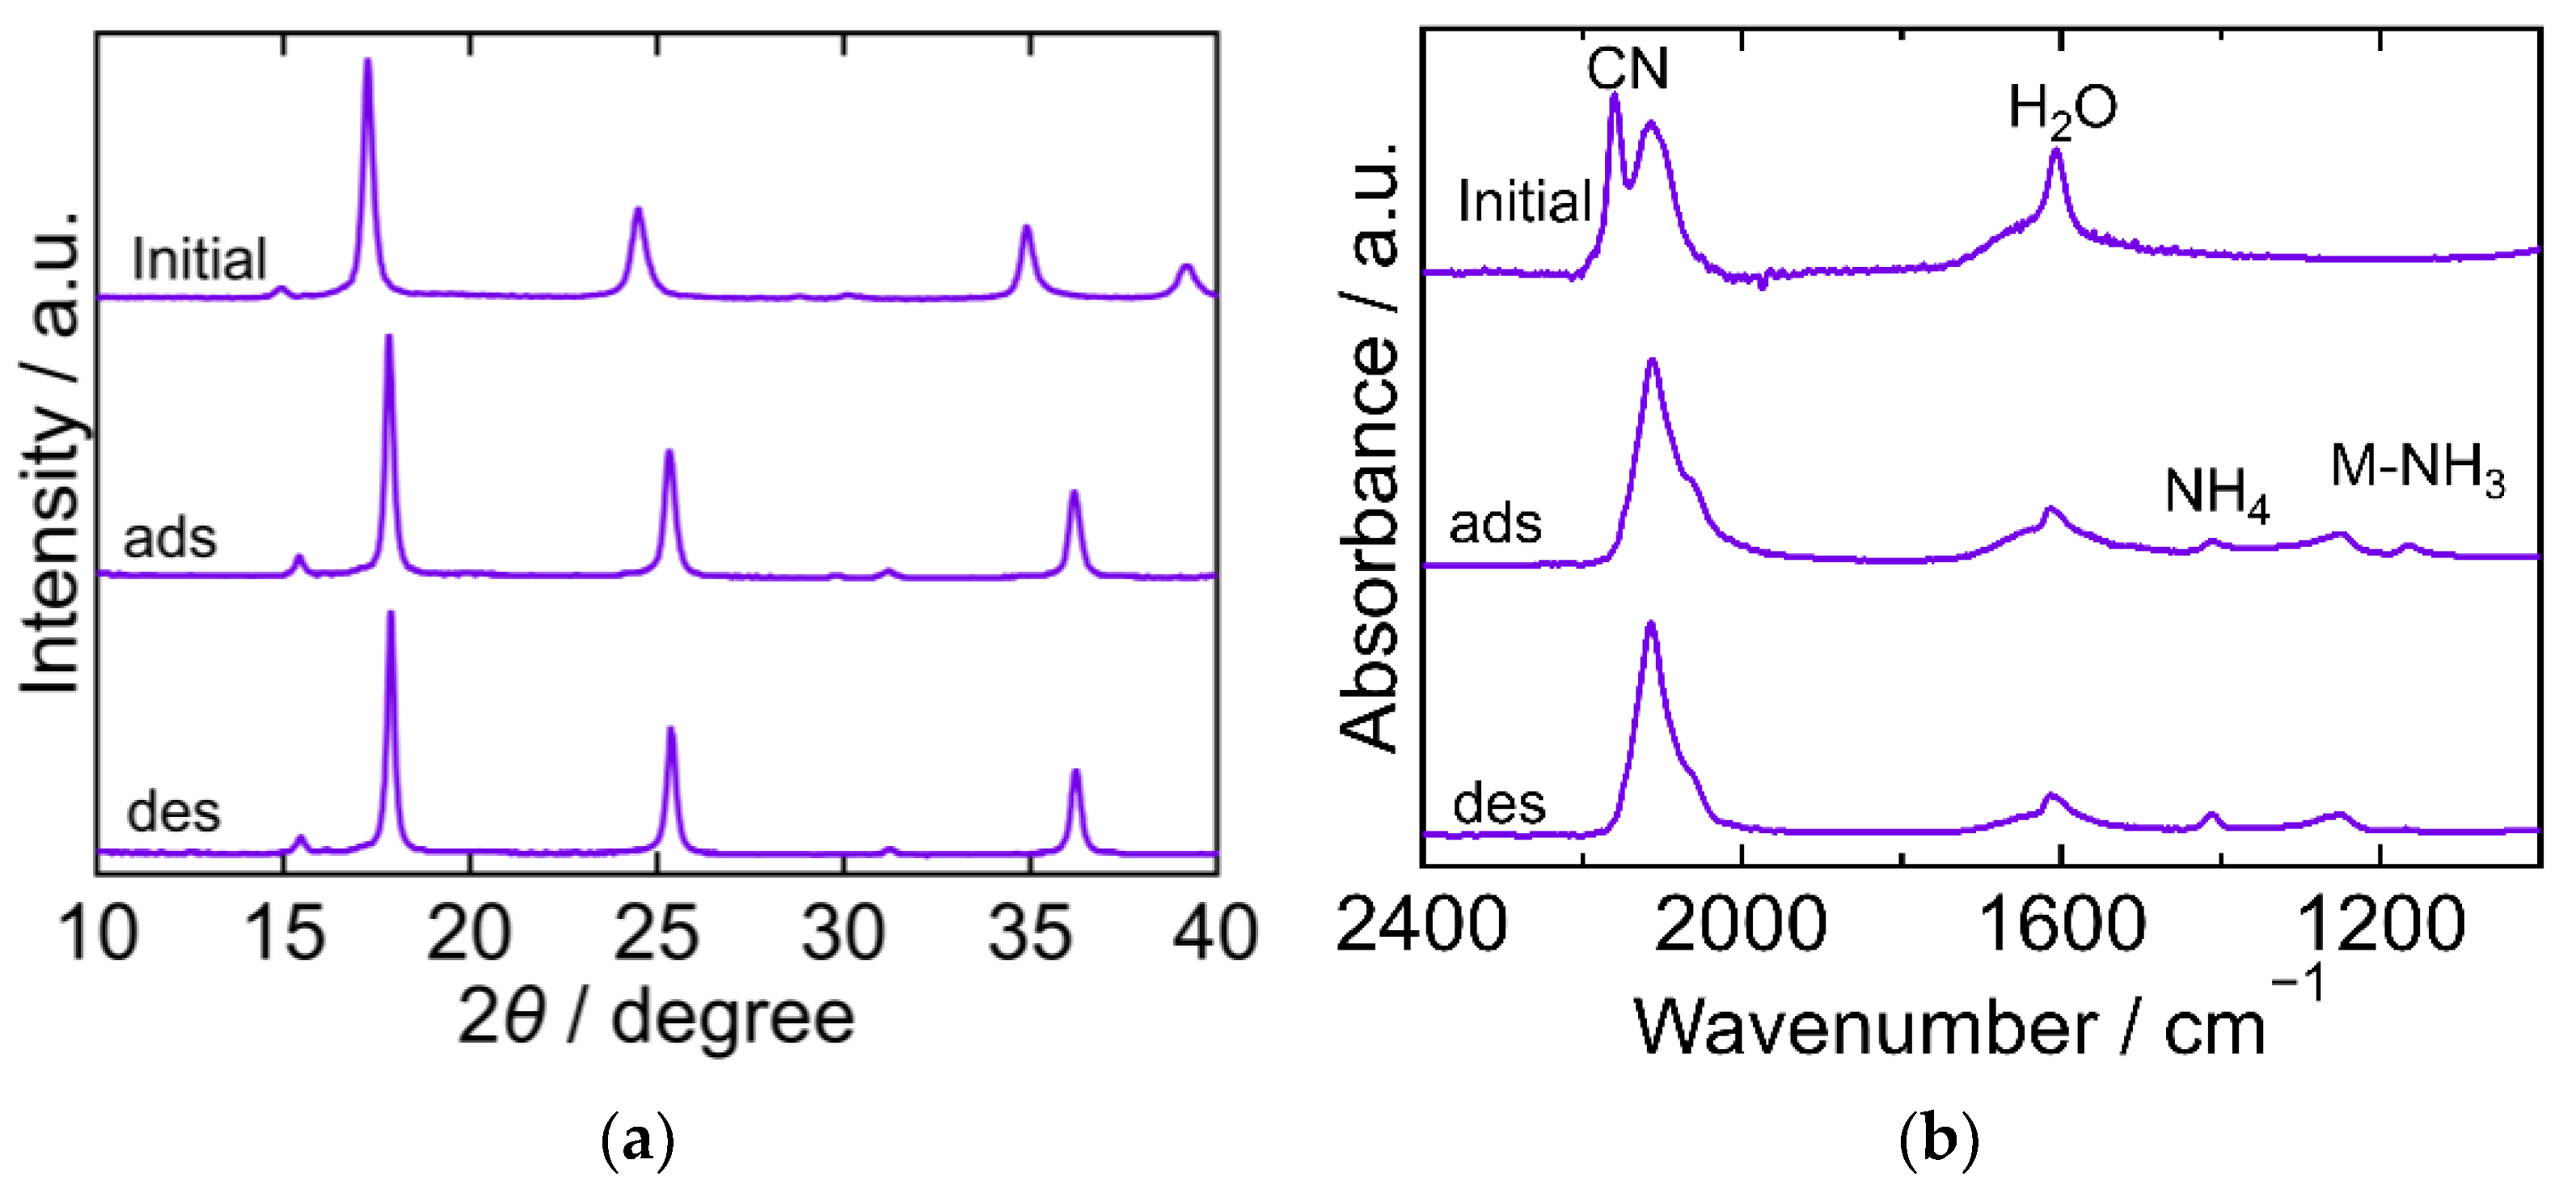
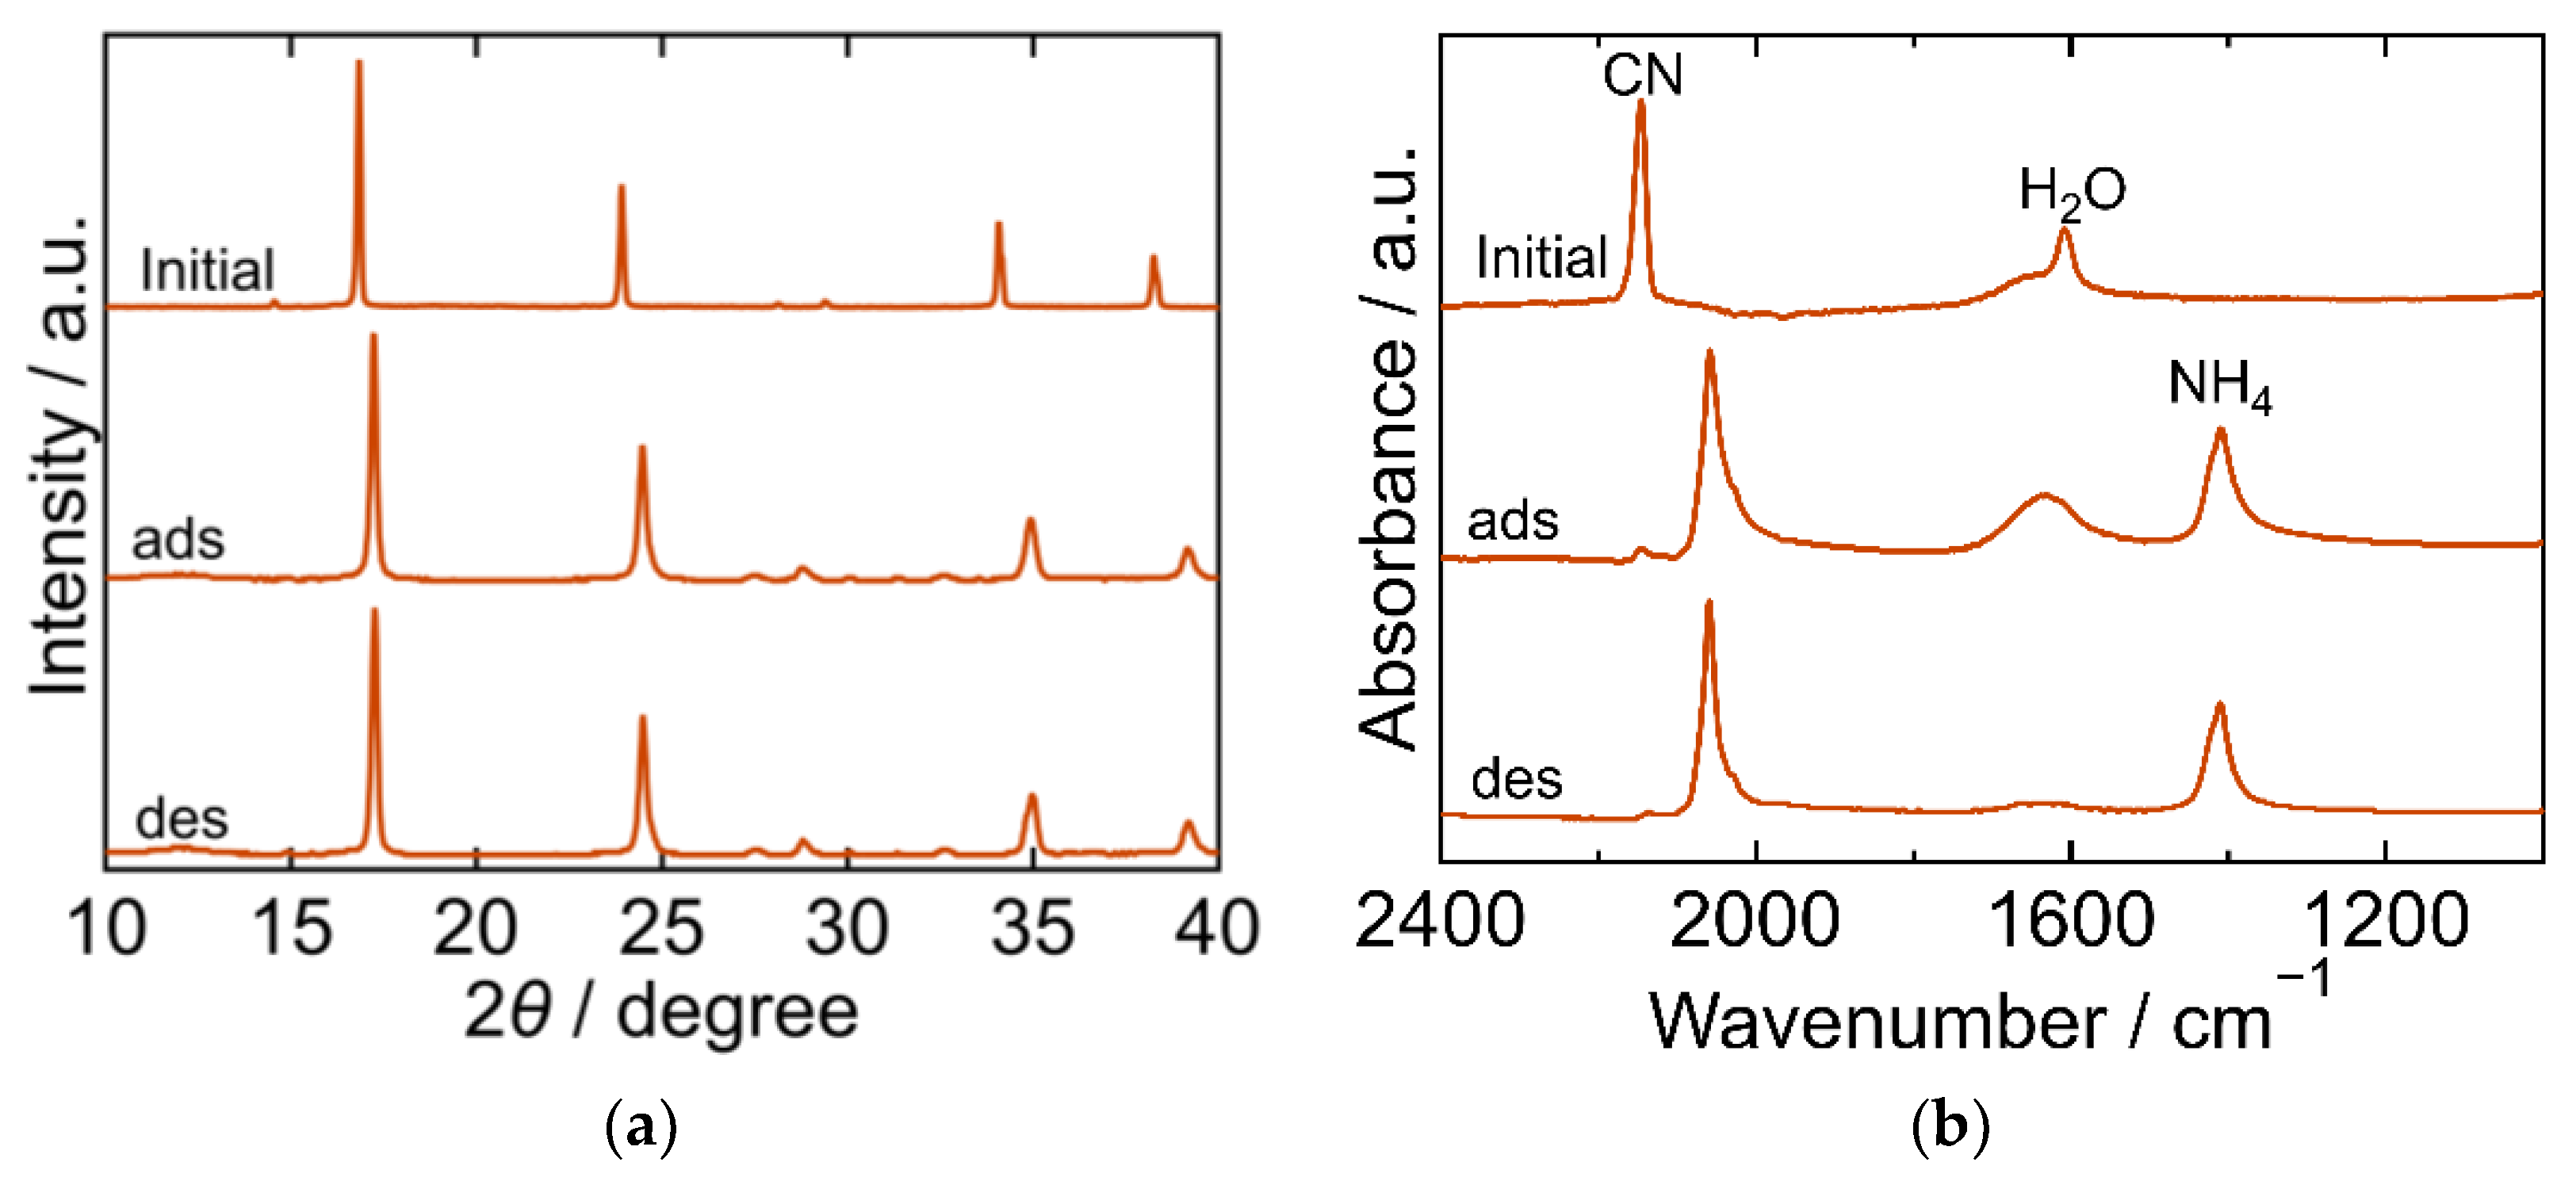
2.2. Charcterization

To study the NH3 adsorption and desorption behavior of the PBAs, X-Ray Diffraction (XRD) and Fourier transform infrared spectroscopy (FTIR) were performed. The XRD results showed the crystal structure of each step during the NH3 adsorption and desorption process. Besides, it also showed the structural stability, which is an important factor for practical use and cycle stability. FTIR spectra contains information on the chemical state of NH3 adsorbed on PBAs and the oxidation number of iron and cobalt from the peak corresponding to the six cyano (CN) groups that coordinate to M’ in AyM[M’(CN)6]x [28] (pp. 110–117). NH3 coordination on a metal ion shifts the NH3 degenerate deformation to a higher wavenumber than that of the free NH3 molecule and is observed at 1370–1000 cm−1 [28] (pp. 1–6). NH4/NH3 degenerate deformation is observed at approximately 1680 cm−1, and NH4 degenerate deformation is observed at approximately 1400 cm−1 [28] (pp. 1–6). The CN stretch mode is observed at 2200–2000 cm−1, and the CN peak shifted to a lower wavenumber as M’ in AyM[M’(CN)6]x has been reduced [28] (pp. 110–117). The H2O bending mode is observed at 1630–1600 cm−1, without any significant difference in the peak positions between the lattice H2O and coordinated H2O [28] (pp. 57–60).
The XRD and FTIR results for CuHCF are shown in Figure 2a,b, respectively, exhibiting different characteristics at each step of the process. The XRD pattern of the initial CuHCF exhibited a cubic crystal structure (space group Fm-3m, a = 10.12 Å, PDF 01-073-9927 [29]). After adsorption, the XRD pattern became complex with peaks corresponding to before and after adsorption. After desorption, the sample showed a peak position comparable to that of copper ferrocyanide, which adsorbed NH3 and was washed with sat. NH4HCO3 aq [23]. This had an orthorhombic crystal structure (space group Pbam, a = 10.80940 Å, b = 3.16230 Å, c = 9.31820 Å, PDF00-052-0356 [29]). The FTIR spectra of the initial CuHCF exhibited peaks derived from a cyano group at 2160 cm−1, and H2O at 1605 cm−1. After adsorption, the CN peak was split into several peaks observed within the range of 2040–2160 cm−1, but at a lower wavenumber than that of the initial CuHCF. A small peak derived from ammonium ions was observed at 1440 cm−1 and a double peak of Cu-NH3 was observed at 1251 and 1227 cm−1. The two peaks were attributed to Cu derived from Cu-NH3. It is considered that there are two types of Co-NH3 interactions because the crystal structure became orthorhombic and, after desorption, CN peaks were observed at a lower wavenumber compared with those of the initial CuHCF and fewer peaks were observed compared with those after adsorption. The CN peak shift to a lower wavenumber after adsorption and desorption compared to the initial CuHCF indicates that the oxidation number of Fe in hexacyanoferrate decreased from three to two upon adsorption of NH3. The Cu-NH3 peak at 1251 cm−1 became smaller than the Cu-NH3 peak at 1227 cm−1 after desorption, whereas the NH4 peak remained almost the same after desorption. This indicates that the coordinated NH3 that resulted in the absorption at 1251 cm−1 was desorbed. The shape of the peak at 1606 cm−1 is different from that at 1605 cm−1 for the initial CuHCF. The H2O peak became smaller after desorption, indicating that lattice H2O or coordinated H2O was desorbed into sat. NH4HCO3 aq. The FTIR spectrum of the sample after desorption was like that of copper ferrocyanide that adsorbed NH3 and was washed with sat. NH4HCO3 aq [23]. This trend was consistent with the XRD results of the same sample.
The XRD and FTIR results for CoHCC are exhibited in Figure 3. The XRD patterns were almost identical at every step in the adsorption and desorption experiments and corresponded to the reported ones, indicating that the crystal structure of CoHCC was face-centered cubic (space group Fm-3m, a = 10.21 Å, PDF 01-072-1431 [29]). The XRD patterns confirm the cycling stability of CoHCC as an adsorbent. In the FTIR spectra, the peaks derived from CN and H2O at 2169 cm−1 and 1606 cm−1, respectively, remained unchanged during the process, indicating that the oxidation number of cobalt in the hexacyanocobaltate group and the chemical state of H2O in CoHCC did not change. After NH3 adsorption, peaks derived from NH4 and Co-NH3 were observed at 1403 cm−1 and 1150 cm−1, respectively. Part of the NH3 adsorbed on CoHCC is supposed to have become ammonium ions, accepting a proton from H2O. After desorption, the Co-NH3 peak was not observed, indicating that the coordinated NH3 desorbed into sat. NH4HCO3 aq.
The XRD and FTIR results for the NiHCF are shown in Figure 4. The peak positions in the XRD patterns were almost identical at every step in the adsorption and desorption experiments and corresponded to the reported ones, indicating that the crystal structure of NiHCF was cubic (space group F-43m, a = 10.229 Å, PDF 00-046-0906 [29]). The unchanged peak position in the patterns at every step indicated the stability of the structure during the adsorption and desorption processes. Interestingly, the peak width of the XRD patterns became narrower after adsorption and desorption than that in the initial samples. This trend indicates that the crystallite size increased after adsorption. In the FTIR spectra, peaks derived from CN, H2O, NH4, Ni-NH3 were observed. The CN peak at 2162 cm−1 in the initial spectra shifted towards a lower wavenumber after adsorption, indicating that the oxidation number of Fe in hexacyanoferrate decreased from three to two upon adsorption of NH3. The H2O peak at 1606 cm−1 became smaller after adsorption and desorption than the initial peak. NH4 and Ni-NH3 peaks were observed after adsorption at 1412 cm−1 and 1159 cm−1, respectively. The Ni-NH3 peak became undetectable after desorption, while the NH4 peak remained.
The XRD and FTIR results for ZnHCF are shown in Figure 5. The XRD pattern of the initial ZnHCF exhibited a cubic framework (space group Fm-3m, a = 10.3392 Å, PDF 01-076-5123) [29]. After adsorption, the XRD pattern was clearly different from the initial one and became comparable to that of the hexagonal framework of ZnII[FeIII(CN)6]0.5 (space group P-3, a = 7.5803 Å, c = 5.7363 Å, a/b = 1, c/b = 0.75674, PDF 01-077-6230 [29]). After desorption, the XRD pattern was almost the same as that after adsorption, but a peak at 2θ = 13° was not observed. The FTIR spectra exhibited peaks corresponding to CN, H2O, NH4, Zn-NH3. The CN peak at 2162 cm−1 in the initial spectra shifted to a lower wavenumber, indicating that Fe was reduced. The NH4 peak and Zn-NH3 peak appeared at 1442 cm−1 and 1445 cm−1, respectively, after adsorption, and only the Zn-NH3 peak remained after desorption. This demonstrates that the coordinated NH3 desorbed into sat. NH4HCO3 aq. The H2O peak at 1607 cm−1 in the initial spectra became relatively symmetric and its position shifted to 1632 cm−1. These changes might result from the degenerated deformation of NH3/NH4 or a change in the chemical state of H2O in ZnHCF. No peak was observed in the range 1600–1632 cm−1 after desorption, indicating that lattice H2O or coordinated H2O was desorbed into sat. NH4HCO3 aq.
The XRD and FTIR results for CoHCF are shown in Figure 6. The XRD pattern of the initial CoHCF exhibited a cubic framework (space group Fm-3m, a = 10.2666 Å, PDF 01-085-2546 [29]). After adsorption, the XRD peak position shifted to a higher 2θ value and corresponded to that of an orthorhombic framework (space group Pmn21, a = 9.933 Å, b = 6.989 Å, c = 7.066 Å, a/b = 1.42123, c/b = 1.01102, PDF 01-075-9531 [29]). The peak position after desorption was almost the same as that after adsorption, demonstrating that the structure did not change owing to desorption. The FTIR spectra exhibited peaks corresponding to CN, H2O, NH4, and Co-NH3. CN peaks were observed at 2159 cm−1 and 2114 cm−1 suggesting the presence of divalent Fe in the initial CoHCF, although it was synthesized from a chemical with trivalent Fe. All the Fe appeared to be divalent both after adsorption and desorption. The CN peak was observed at 2112 cm−1. The H2O peak was observed at 1607 cm−1 in the initial spectra and remained at the same position both after adsorption and desorption. The NH4 peak appeared after adsorption and remained even after desorption. The two peaks that appeared at 1250 cm−1 and 1165 cm−1 were supposedly derived from Co-NH3. The peak at 1165 cm−1 was not observed after desorption. These results indicate that there are two types of Co-NH3 interactions because the crystal structure became orthorhombic. The NH3 from the Co-NH3 interaction that yielded the peak at 1165 cm−1 desorbed.
The XRD and FTIR results for the MnHCF are shown in Figure 7. The XRD pattern of the initial MnHCF exhibited a cubic framework (space group Fm-3m, a = 10.488 Å, PDF 01-074-7327 [29]). After adsorption, the XRD peak shifted to a higher 2θ. The peak position after desorption was almost the same as that after adsorption, demonstrating that the structure did not change owing to desorption. The FTIR spectra exhibited peaks derived from CN, H2O, and NH4. The CN peak at 2144 cm−1 in the initial spectra shifted to a lower wavenumber after adsorption, and its position remained the same after desorption, indicating that Fe was reduced on adsorption. The H2O peak became symmetric after adsorption, and its absorbence decreased after desorption due to H2O desorption into sat. NH4HCO3 aq. The Mn-NH3 peak was not observed at any step during the process, whereas the NH4 peak at 1403 cm−1 appeared after adsorption and remained even after desorption. These results indicated that the adsorbed NH3 did not yield Mn-NH3 and that ammonium ions were not desorbed into sat. NH4HCO3 aq. This is consistent with the result that the desorption of the NH3 from MnHCF was not detected.

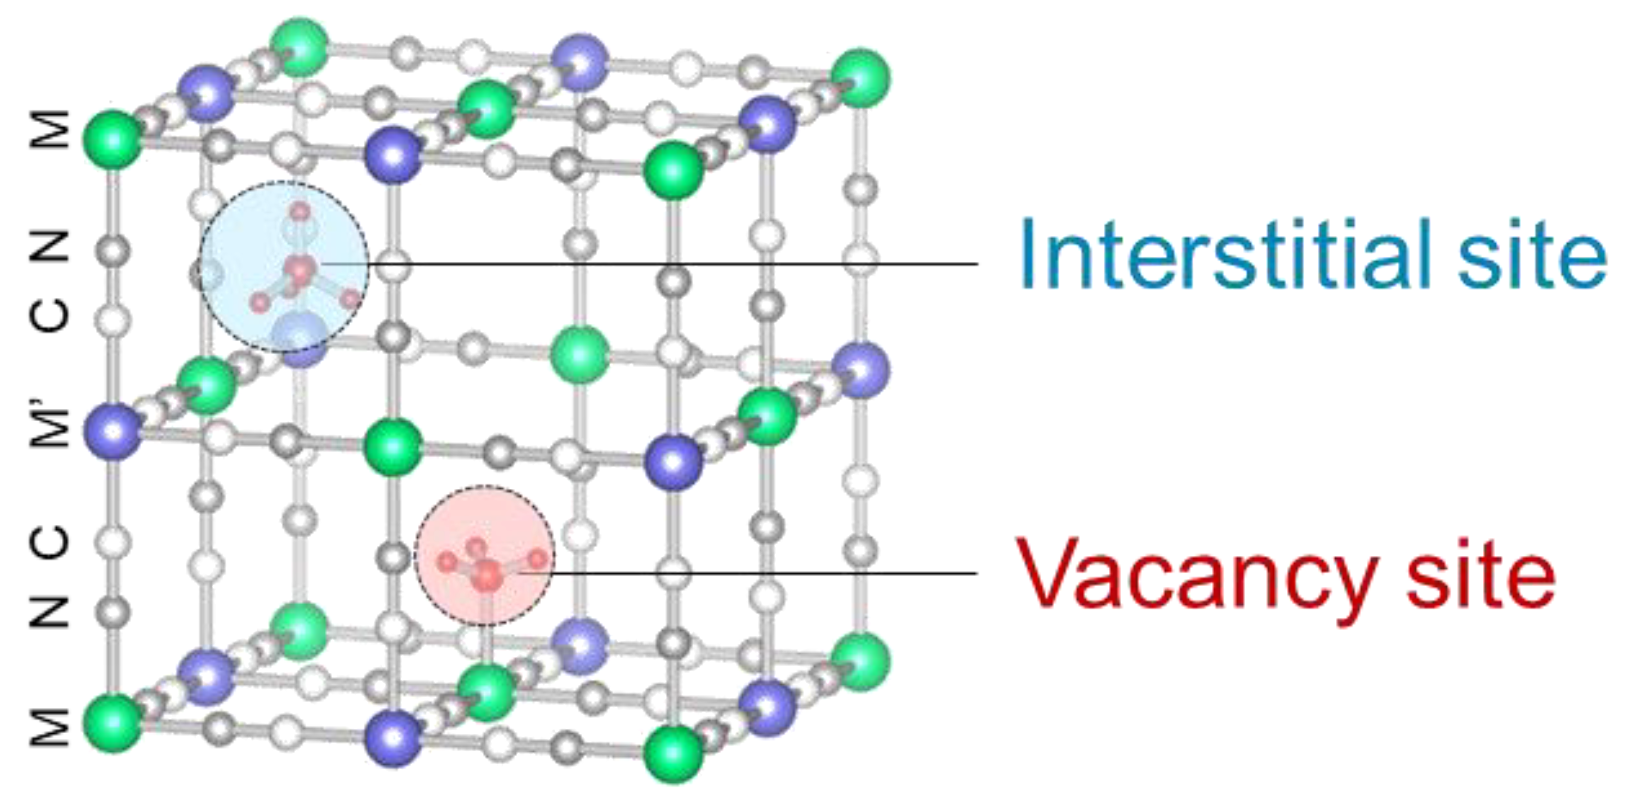
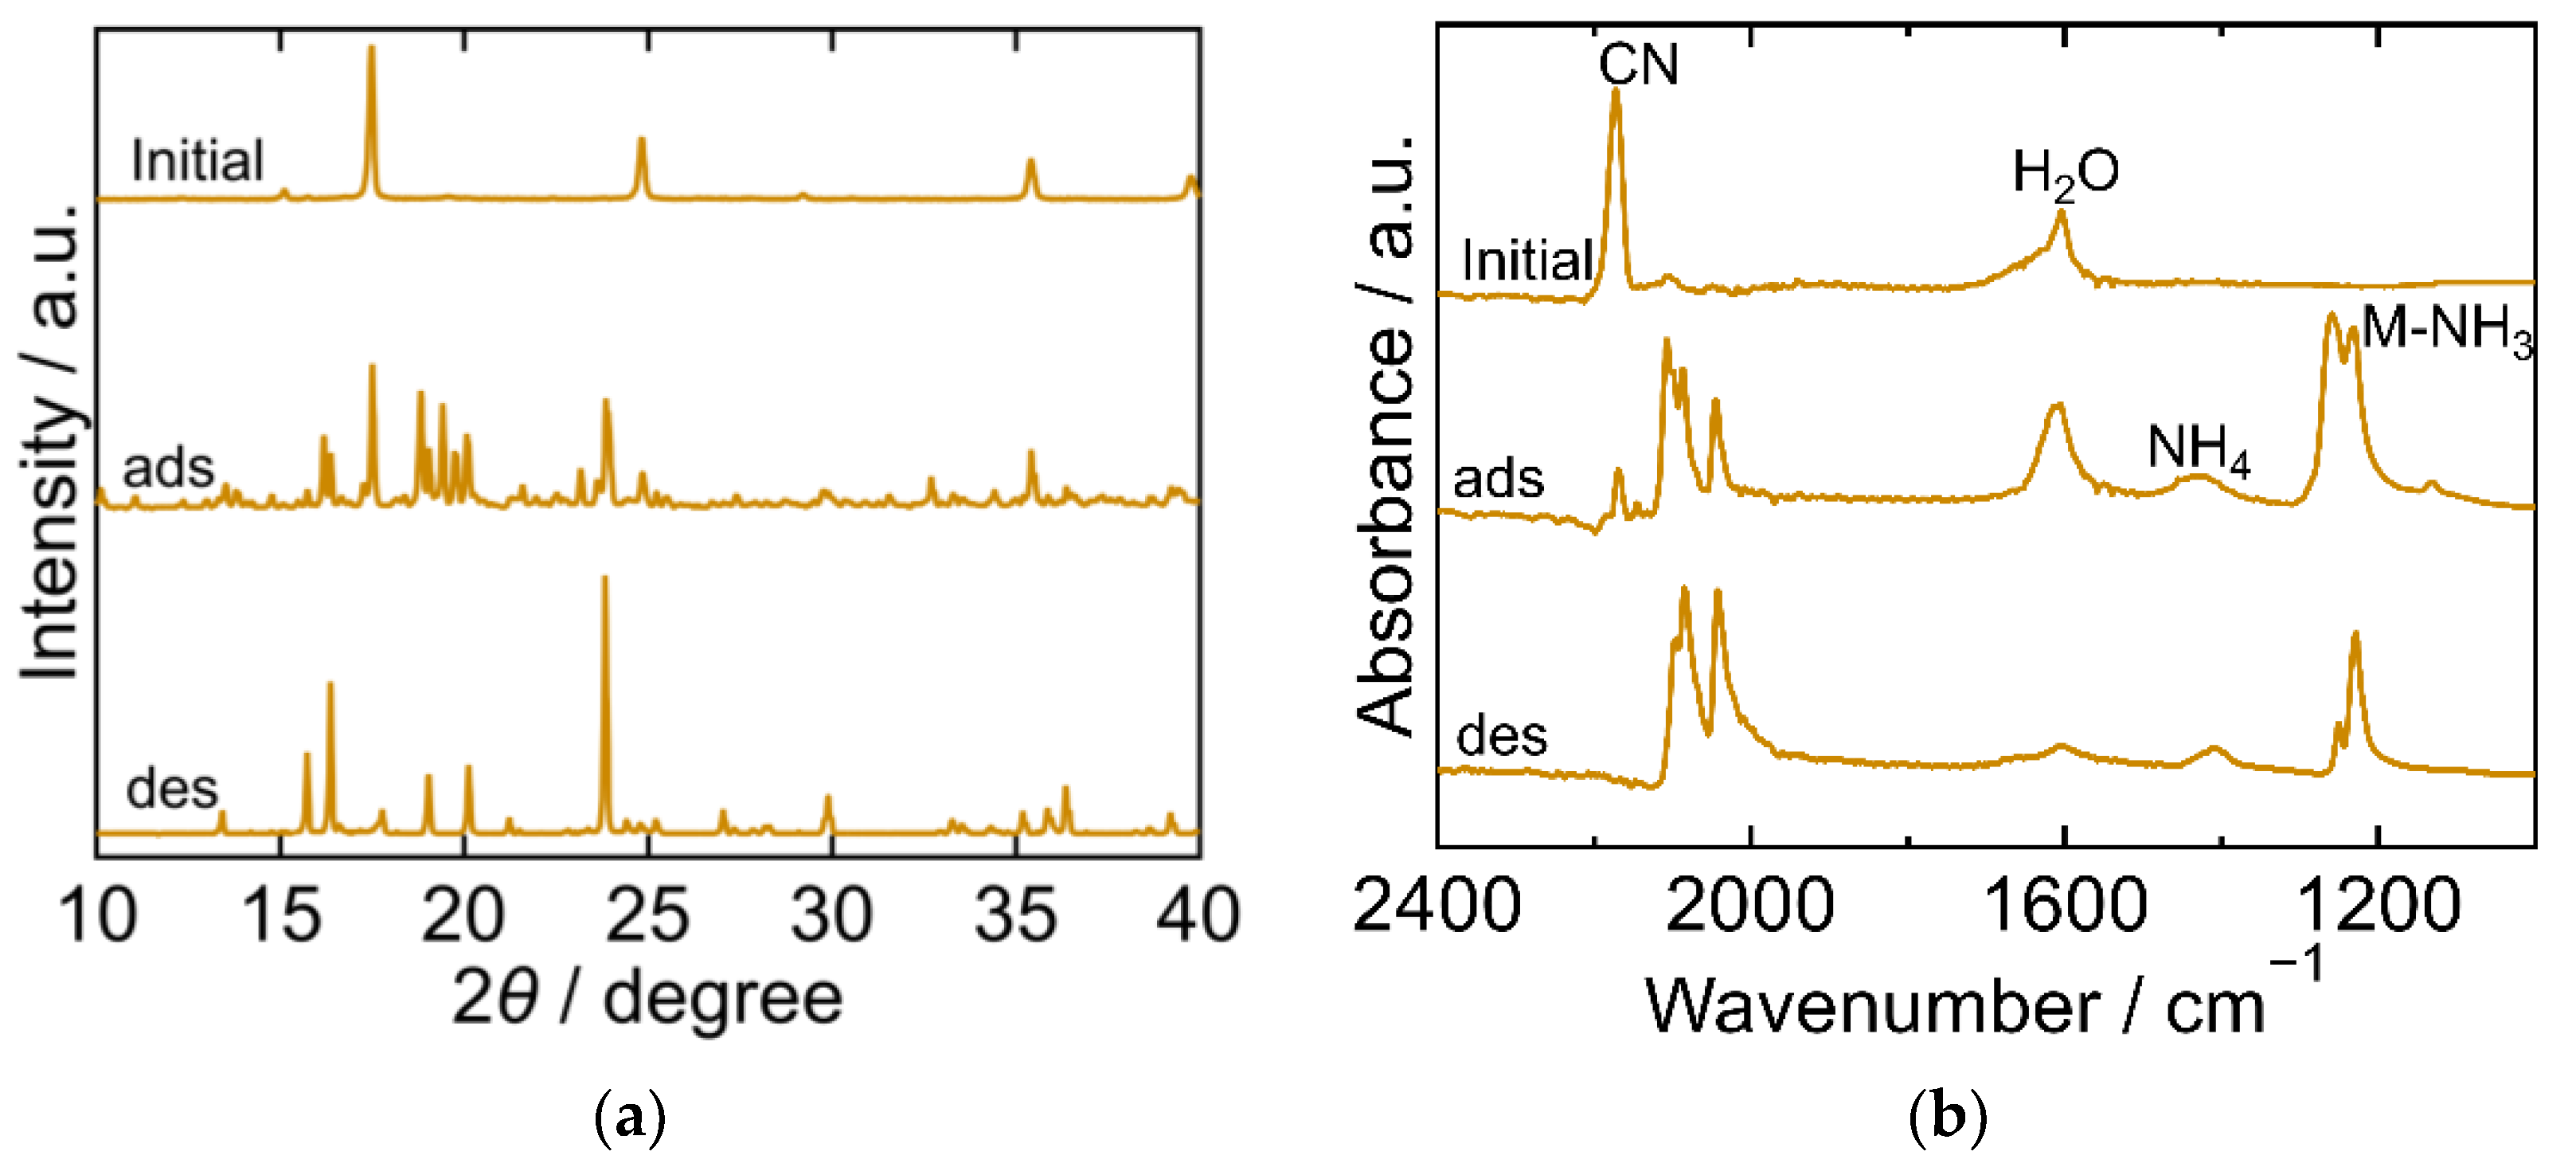
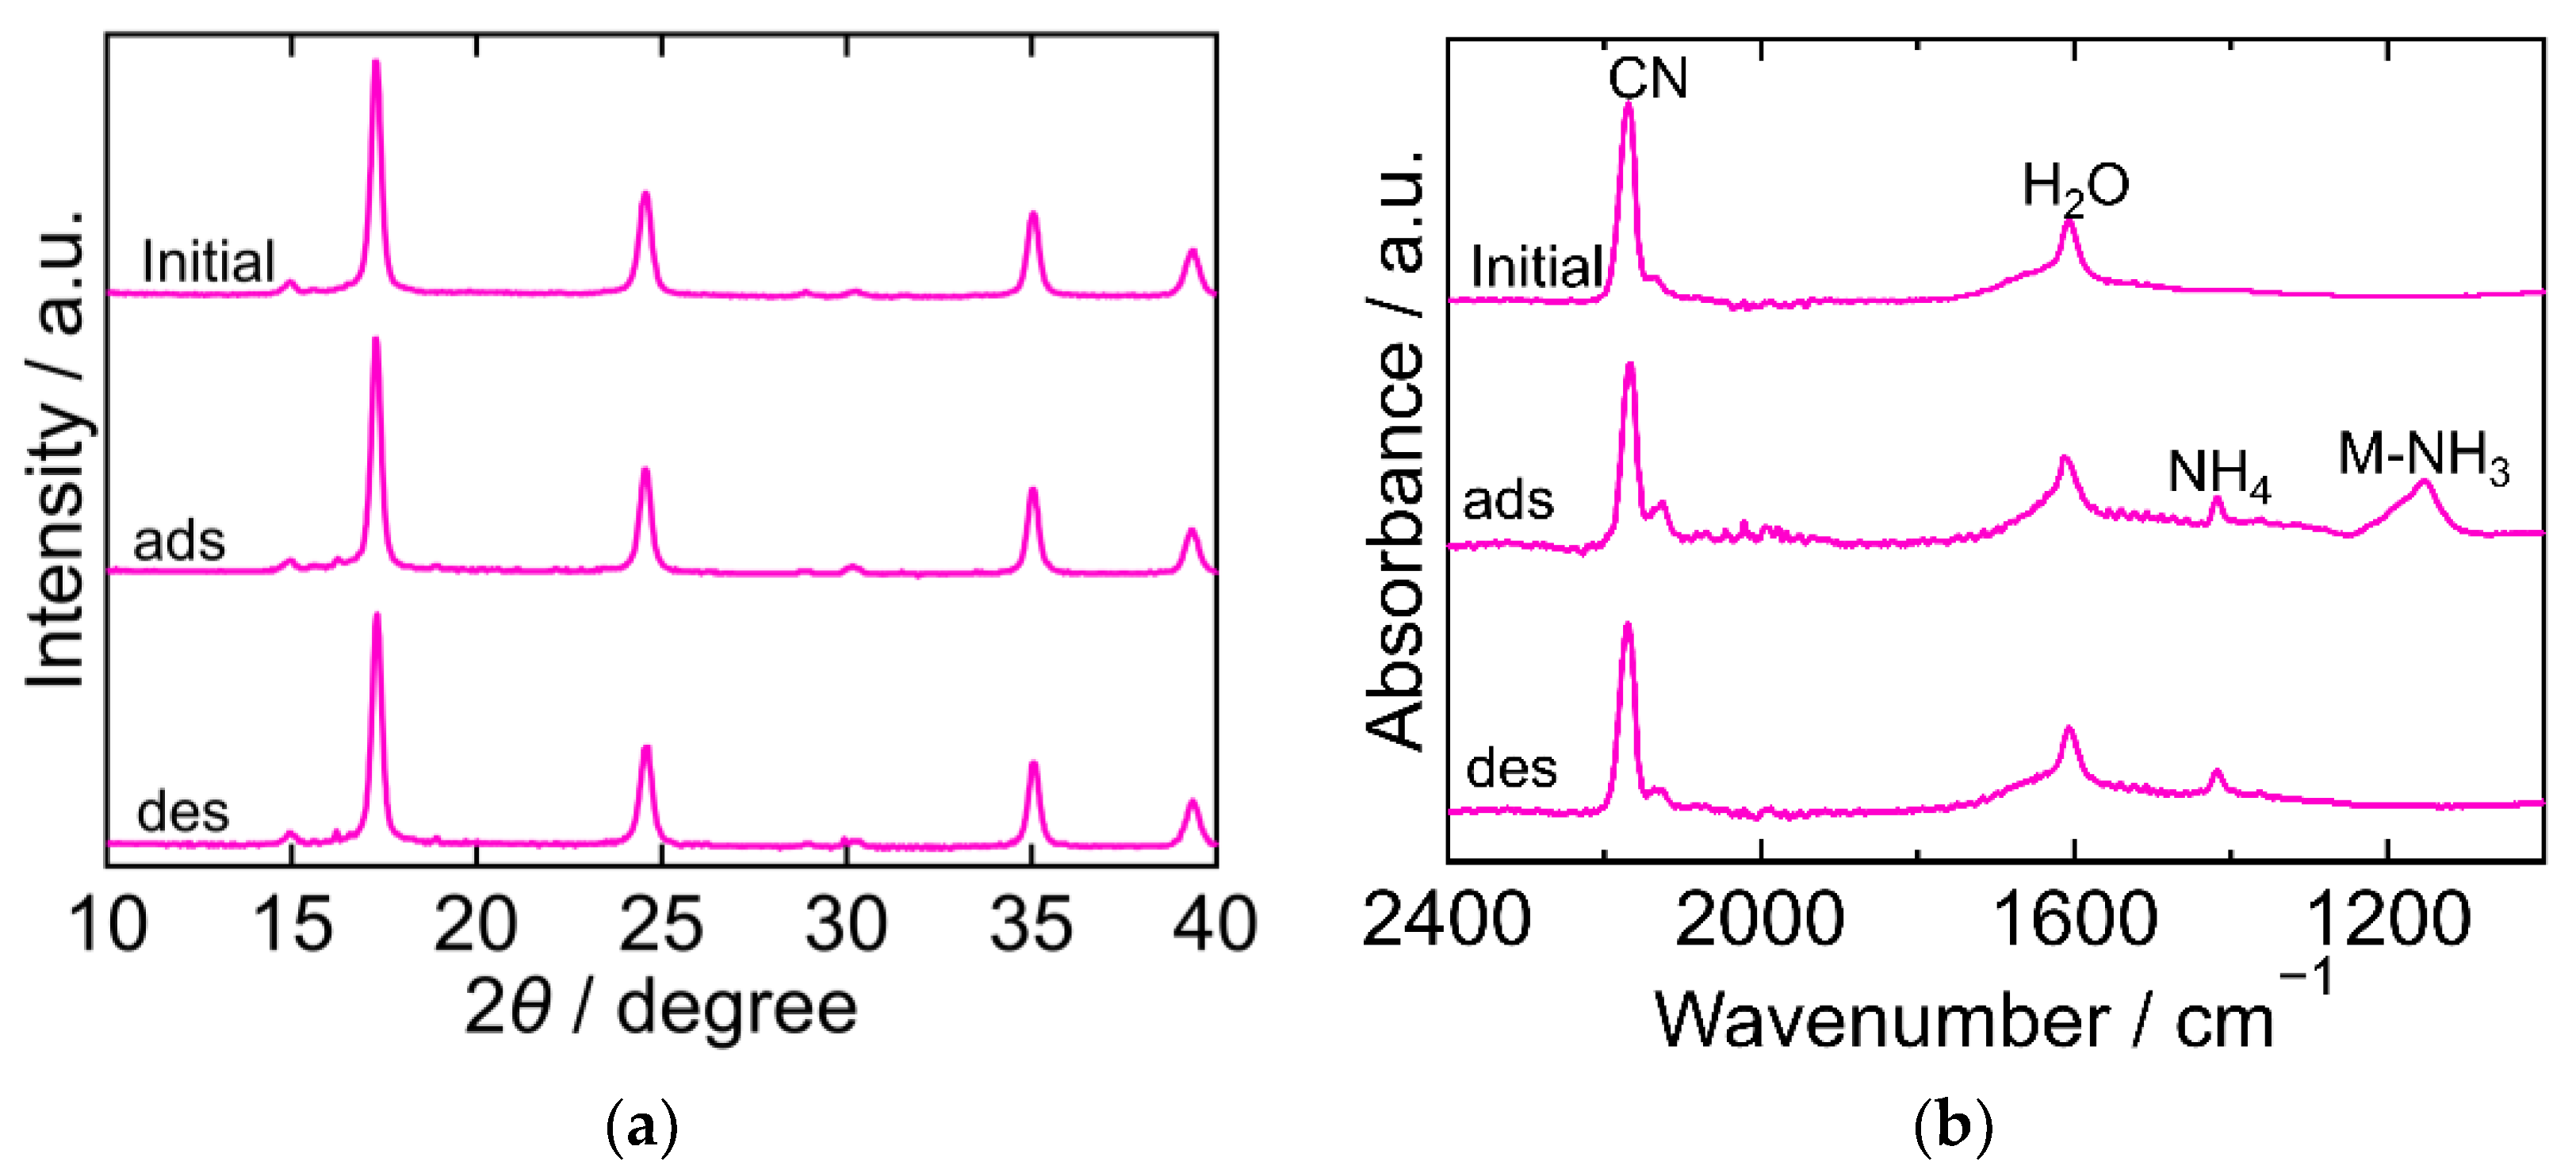
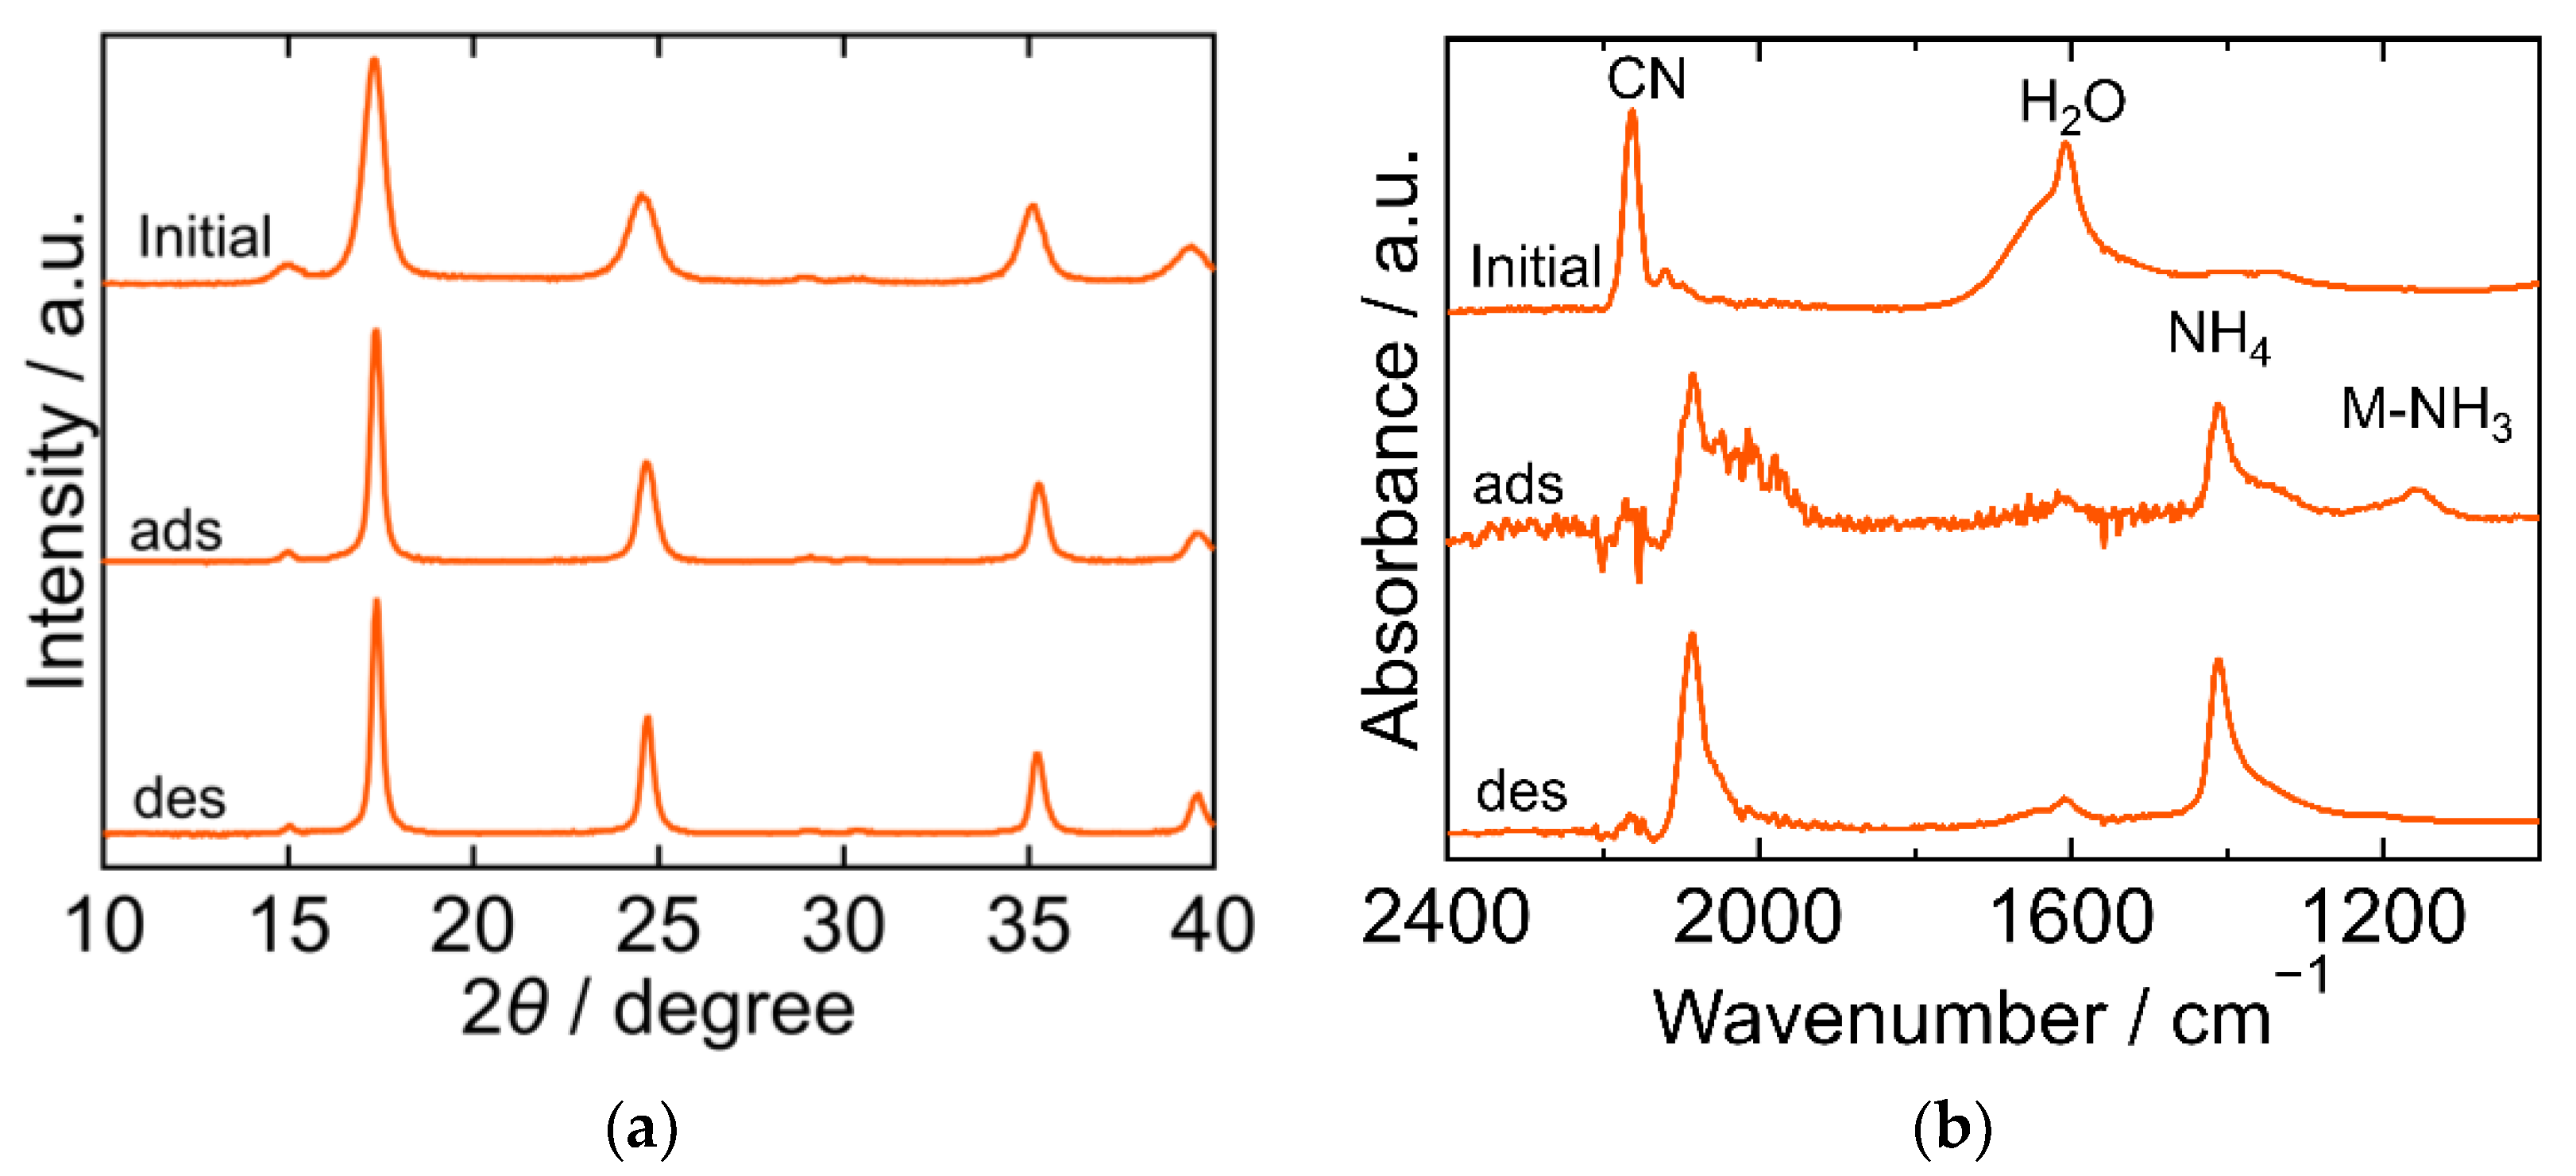
2.3. The Crystal Structure and Chemical State during the Process

Through the characterization of six kinds of PBAs at each step in the adsorption and desorption processes, changes in the crystal structure and chemical state were identified. The XRD patterns showed that the structural stability of CoHCC and NiHCF was high. The structures of CuHCF and ZnHCF changed drastically upon adsorption, possibly because CuHCF and ZnHCF prefer tetrahedral coordination. FTIR results indicated that NH3 adsorbed on PBA can take two states as explained previously [13]. NH3 is adsorbed on M in PBA (AyM[M’(CN)6]x) as follows:
PBA · n H 2 O   + m NH 3     PBA · ( n m ) H 2 O · m NH 3 + m H 2 O .
Then, part of the adsorbed NH3 reacts with H2O in PBA as follows [13]:
PBA · ( n m )   ( H 2 O ) · m NH 3     ( NH 4 ) l PBA · l OH · ( n m l ) H 2 O · ( m l ) NH 3
There was a tendency for the coordinated NH3 observed as an M-NH3 peak at 1370–1000 cm−1 in the FTIR spectra to be desorbed into sat. NH4HCO3 aq, whereas ammonium ions observed as NH4 peaks at approximately 1400 cm−1 usually remained in PBA.
( NH 4 ) l PBA · l OH · ( n m l ) H 2 O · ( m l ) NH 3     ( NH 4 ) l PBA · l OH · ( n m l ) H 2 O · ( m l j ) NH 3 + j NH 3
Coordinated NH3 refers to NH3 molecules adsorbed on vacancy sites, while ammonium ions are trapped on interstitial sites [13]. The results showed that NH3 molecules adsorbed on vacancy sites were more likely to be desorbed into sat. NH4HCO3 aq, whereas ammonium ions in the interstitial sites were not prone to desorption. ZnHCF was an exceptional case in which the ammonium ions in the interstitial sites were desorbed and coordinated NH3 at the vacancy sites remained as follows:
( NH 4 ) l PBA · l OH · ( n m l ) H 2 O · ( m l ) NH 3   PBA · ( n m l ) H 2 O · ( m l ) NH 3 + l NH 3 + l H 2 O .
One possible explanation for this is that the crystal structure of ZnHCF became a hexagonal framework after adsorption.

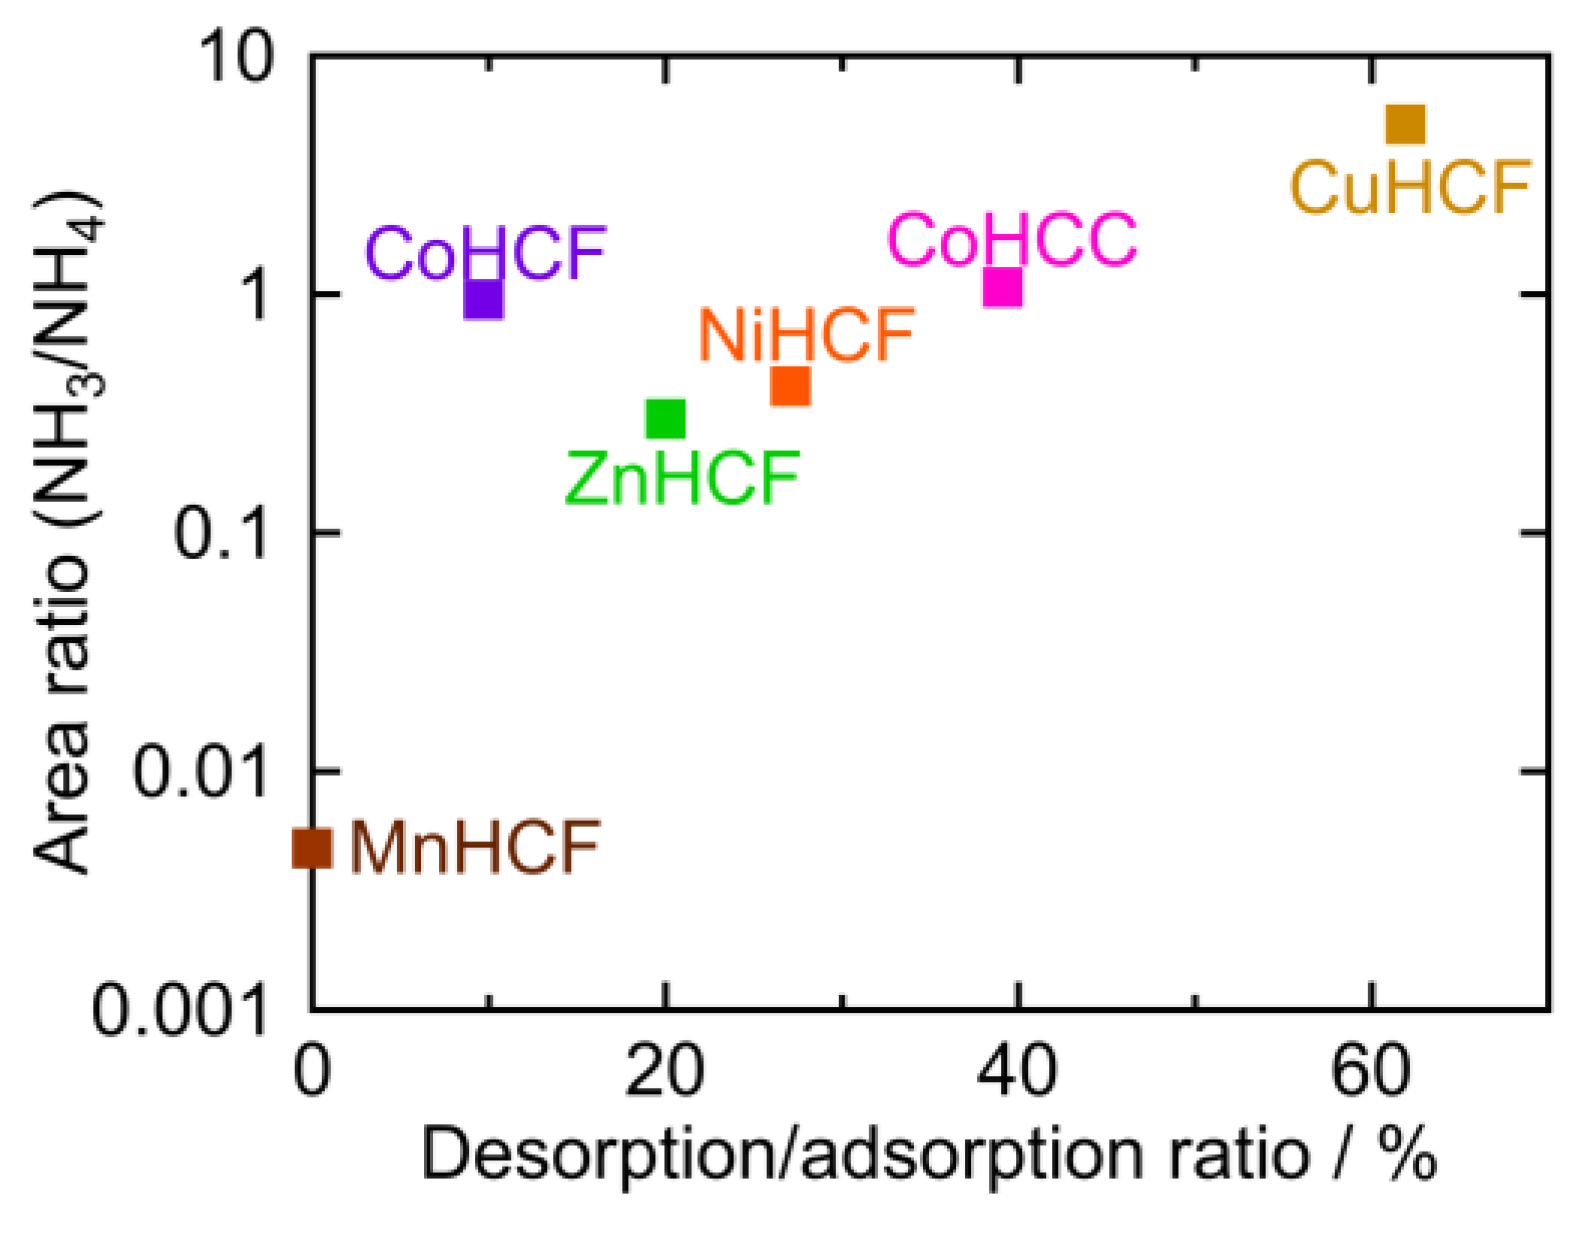
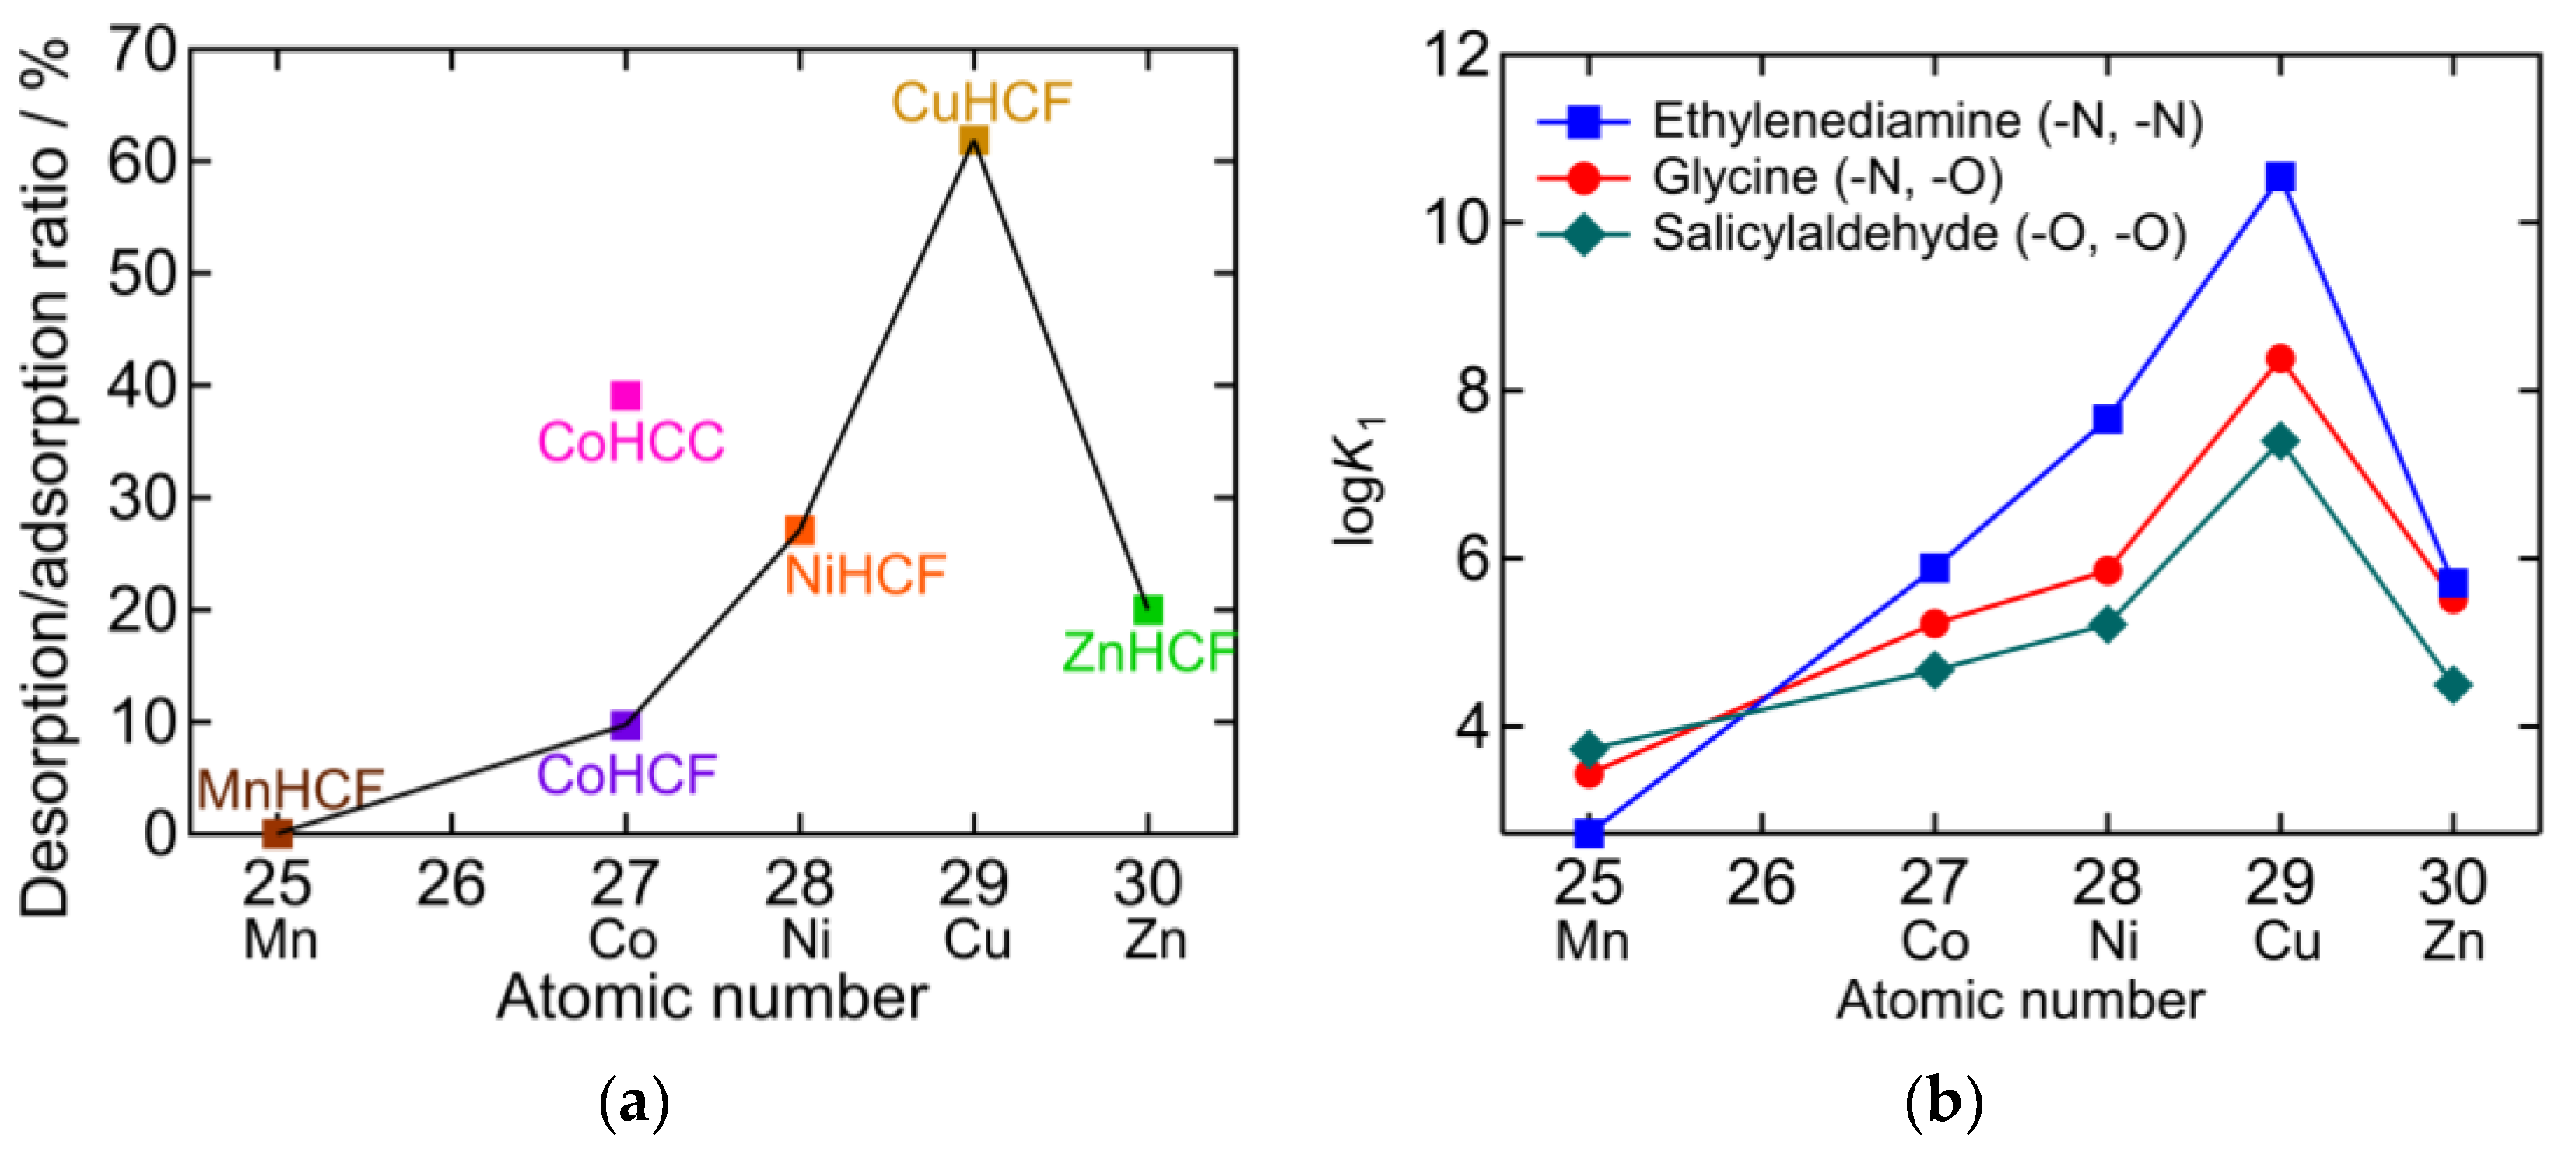
2.4. The Desorption/Adsorption Ratio

The peak area ratios of NH4 and M-NH3 are plotted against the desorption ratio in Table 1 (Figure 8). To calculate the peak area ratio, the baseline was first determined as the line through the two points in the raw data at 1769 cm−1 and 1016 cm −1. The baseline was subtracted from the raw data. The areas of the NH4 peak around 1400 cm−1 and M-NH3 peak at 1370–1000 cm−1 were calculated, and the ratio of the two peaks (NH3/NH4) was derived. This area ratio was plotted on a logarithmic scale because it should be proportional to the equilibrium constant. CuHCF had the highest desorption/adsorption ratio and the highest NH3/NH4 peak area ratio, while MnHCF had the lowest desorption/adsorption and the lowest NH3/NH4 peak area ratio. For other PBAs, the desorption/adsorption ratio was higher if the NH3/NH4 peak area ratio was higher, except in the case of CoHCF. Interestingly, PBA with a higher NH3/NH4 ratio, released NH3 into sat. NH4HCO3 aq. A higher NH3/NH4 ratio indicated a higher affinity for NH3 at the vacancy sites.
In Figure 9a, the desorption/adsorption ratio is plotted against the atomic number M in PBA (AyM[M’(CN)6]x). The desorption/adsorption ratio of hexacyanoferrate (HCF) PBAs obeys the Irving-Williams order [30]. This indicates that there is a relationship between the NH3 adsorption/desorption behavior and the stability of the metal complexes. The higher desorption/adsorption ratio of CoHCC compared to the HCF series suggests that hexacyanocobaltate PBAs may exhibit higher desorption/adsorption ratios. Figure 9b shows the stability constants (K1) of the divalent transition metal chelate complex, which also obey the Irving-Williams order [31,32,33,34,35,36]. The chelates are ethylenediamine (en), glycine (gly), and salicylaldehyde (sald), whose coordination elements are double nitrogen (N), N, oxygen (O), and double O, respectively. K1 becomes larger as N in the chelate increases in the cases of Co2+, Ni2+, Cu2+, and Zn2+. This is consistent with Equation (1), which occurred for CoHCF, CoHCC, NiHCF, CuHCF, and ZnHCF, as shown in Figure 2b, Figure 3b, Figure 4b, Figure 5b and Figure 6b, respectively. In contrast, in the case of Mn, K1 increased as O in the chelate increased. This indicates that Mn2+ has a higher affinity for O than for N. This is consistent with the result that, after adsorption, only the NH4 peak was observed with MnHCF, as shown in Figure 7b. Except for MnHCF, it is favorable for NH3 to be adsorbed on the vacancy sites instead of coordinating with H2O in the gaseous phase. In sat. NH4HCO3 aq, the liquid phase is more favorable for NH3 than being adsorbed at the vacancy site. Therefore, desorption in sat. NH4HCO3 aq is not necessarily an exchange between NH3 and H2O because the H2O peak was unchanged or not observed in the FTIR spectra after desorption.

3. Materials and Methods

3.1. Materials

The chemicals used for synthesis were purchased from Wako Pure Chemical Industries, Ltd. (Osaka, Japan) at the special grade. First grade ammonium hydrogen carbonate for NH3 desorption was purchased from Wako Pure Chemical Industries, Ltd.. Sodium hydrogen sulfate was purchased from Wako Pure Chemical Industries, Ltd., at a special grade. All chemicals were used without further purification.

3.2. Synthesis of PBAs

The chemicals used for the synthesis were dissolved in ultra-pure water in a centrifuge tube. The same volume of the solutions were mixed for the synthesis. CuHCF was synthesized by mixing solutions of 0.6 mol L−1 copper sulfate, and 0.2 mol L−1 potassium ferricyanide. CoHCC was synthesized from solutions of 0.6 mol L−1 of cobalt(II) chloride and 0.2 mol L−1 of potassium hexacyanocobaltate(III). NiHCF was obtained by mixing solutions of 0.6 mol L−1 of nickel(II) nitrate and 0.2 mol L−1 of potassium ferricyanide. ZnHCF was synthesized from 0.6 mol L−1 of zinc sulfate and 0.2 mol L−1 of potassium ferricyanide. CoHCF was obtained from solutions of 0.6 mol L−1 of cobalt(II) chloride and 0.4 mol L−1 of potassium ferricyanide. MnHCF was synthesized from solutions of 0.3 mol L−1 of manganese(II) chloride and 0.3 mol L−1 of potassium ferricyanide. For the PBA-forming reaction, the samples were shaken overnight at 1000 rpm using a SI-300C shaker (AS-ONE Corp., Osaka, Japan). The PBA dispersed in the solution was precipitated by centrifuging the PBA dispersion at 16,000× g for 10 min using a centrifuge (3–30 K, Sigma Laborzentrifugen GmbH, Osterode am Harz, Germany). To rinse the salt impurity from PBA, the supernatant was removed and the same amount of ultrapure water was added again. This process was repeated six times. After the rinsing, the purities of PBAs were higher than 99%, which was confirmed using scanning electron microscope-energy dispersive x-ray spectrometry (SEM-EDX, TM4000Plus, Hitachi High-Tech Corp., Tokyo, Japan) assuming that the possible impurity was a salt. The yield of the synthesized CuHCF, CoHCC, NiHCF, ZnHCF, CoHCF and MnHCF was, respectively 55%, 57%, 64%, 48%, 61% and 44%. After rinsing, the precipitate was dried overnight under vacuum, and subsequently, ground to a powder form.

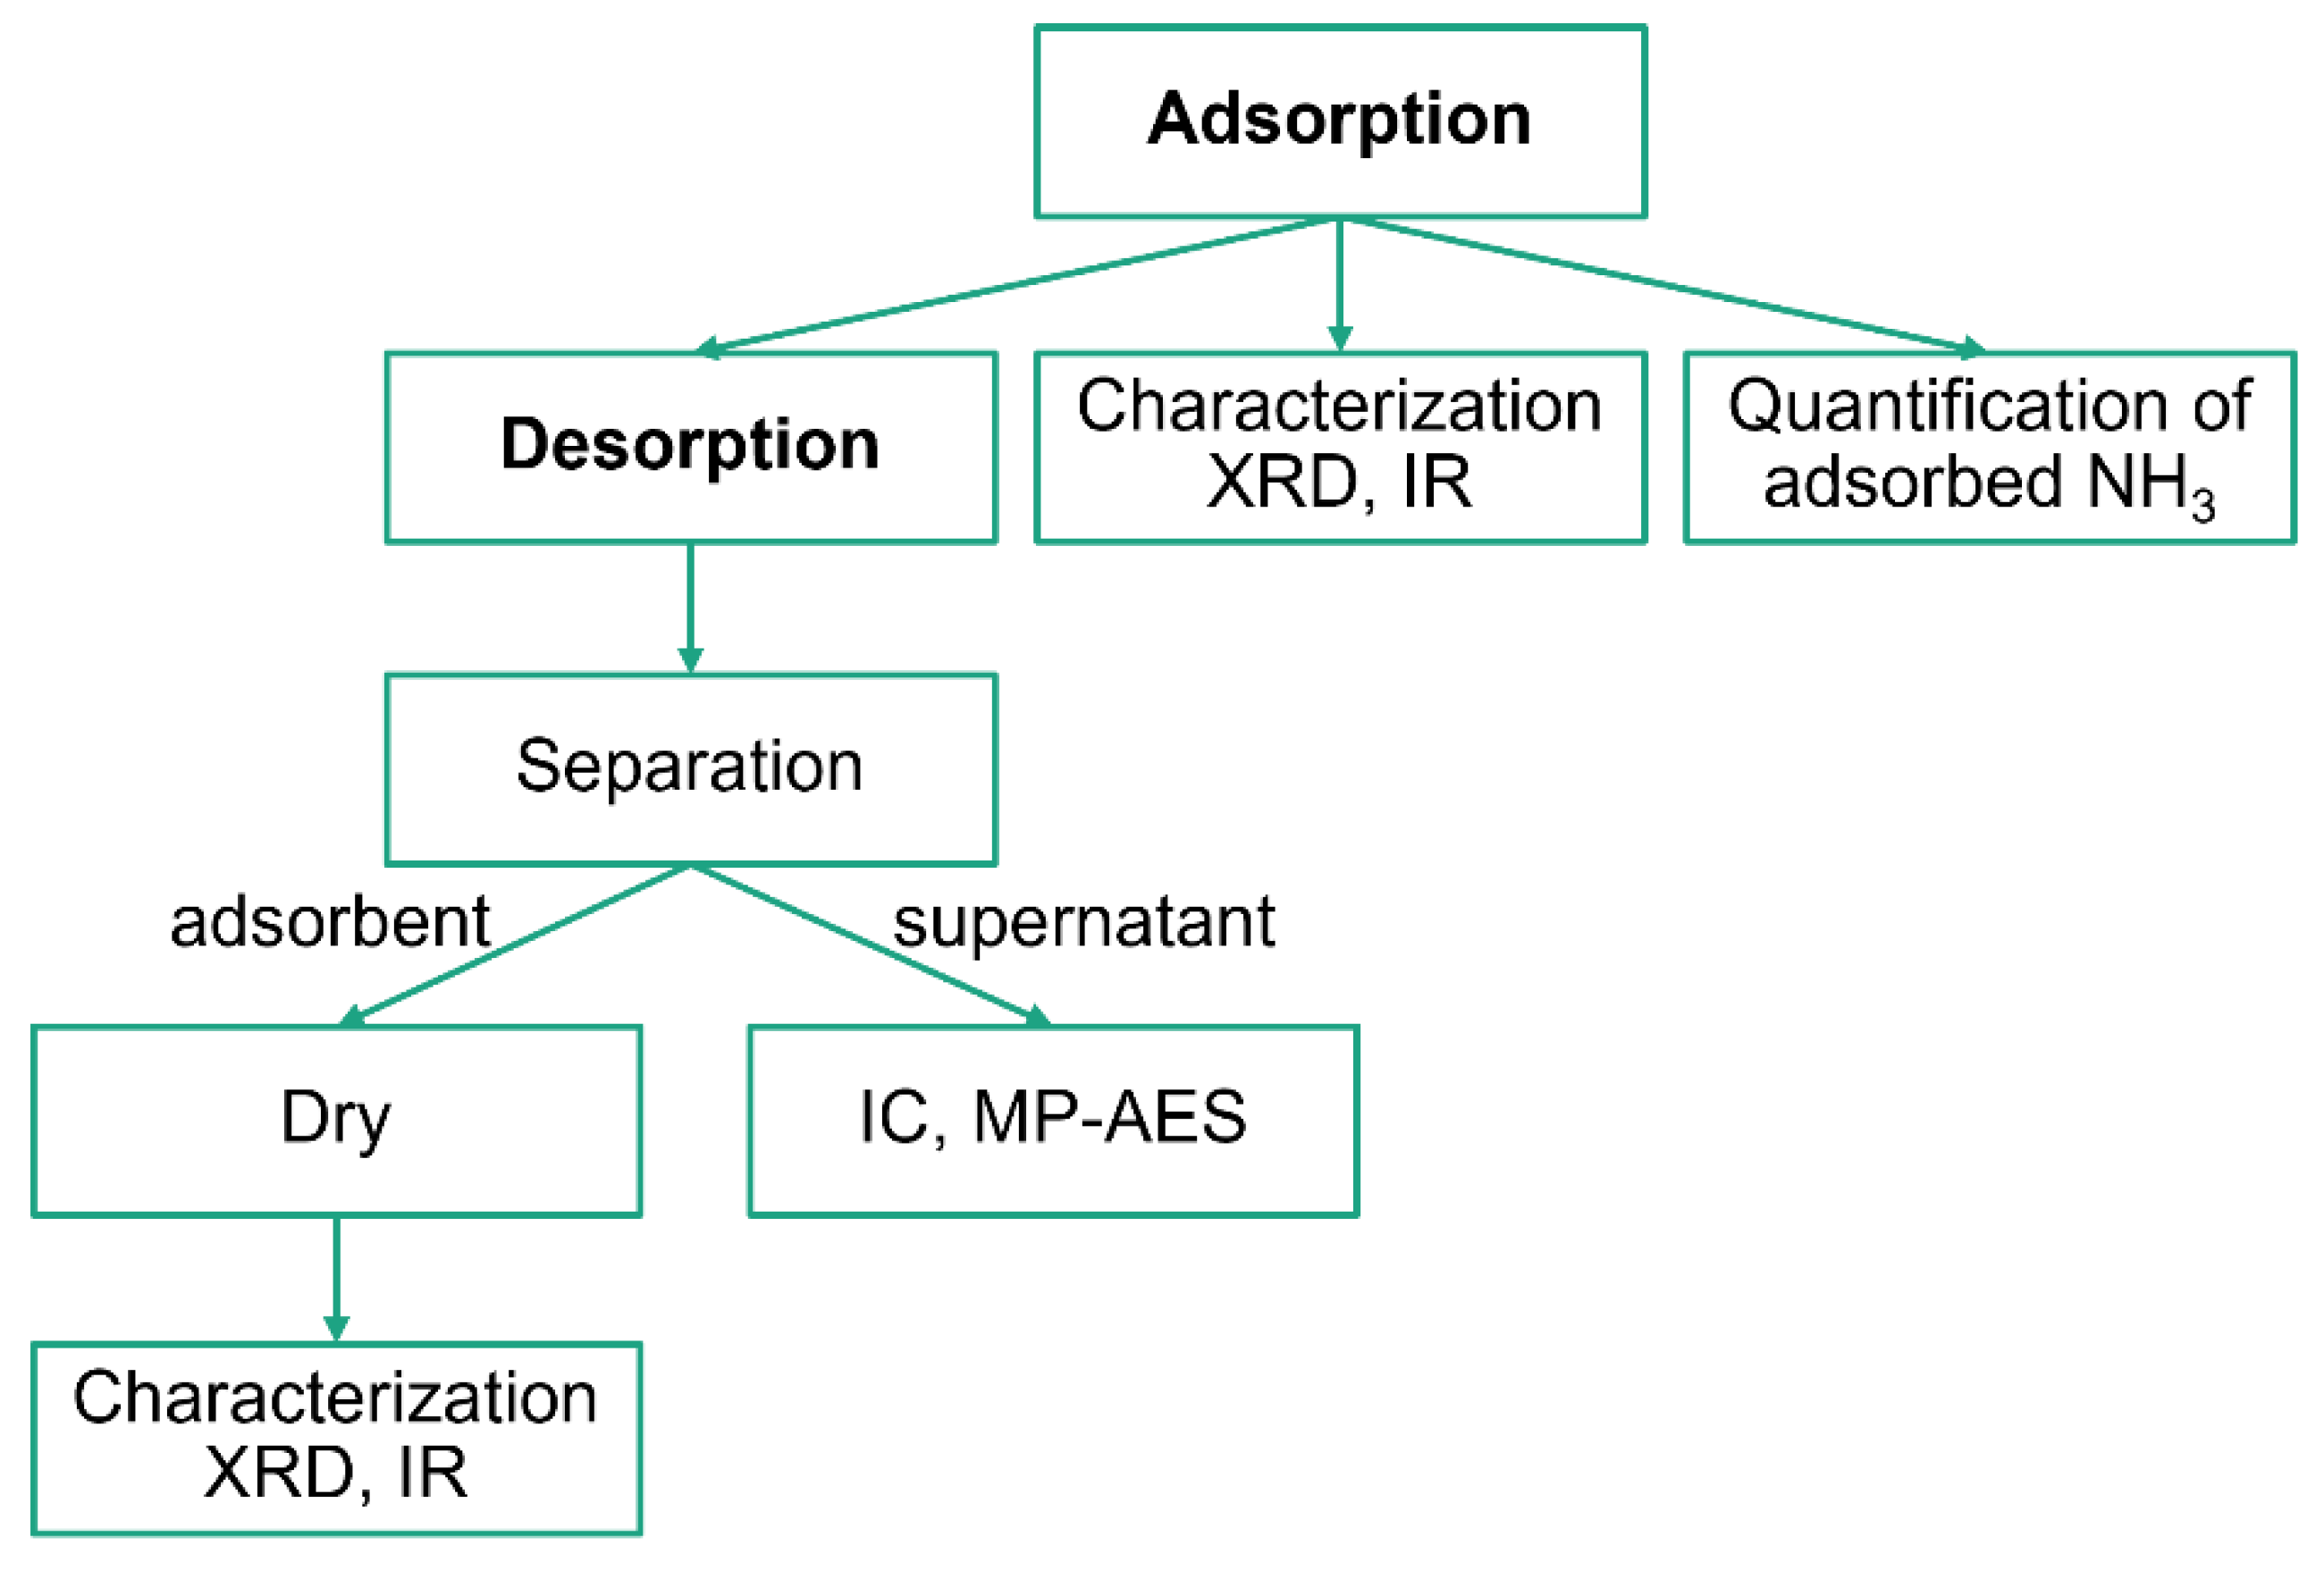
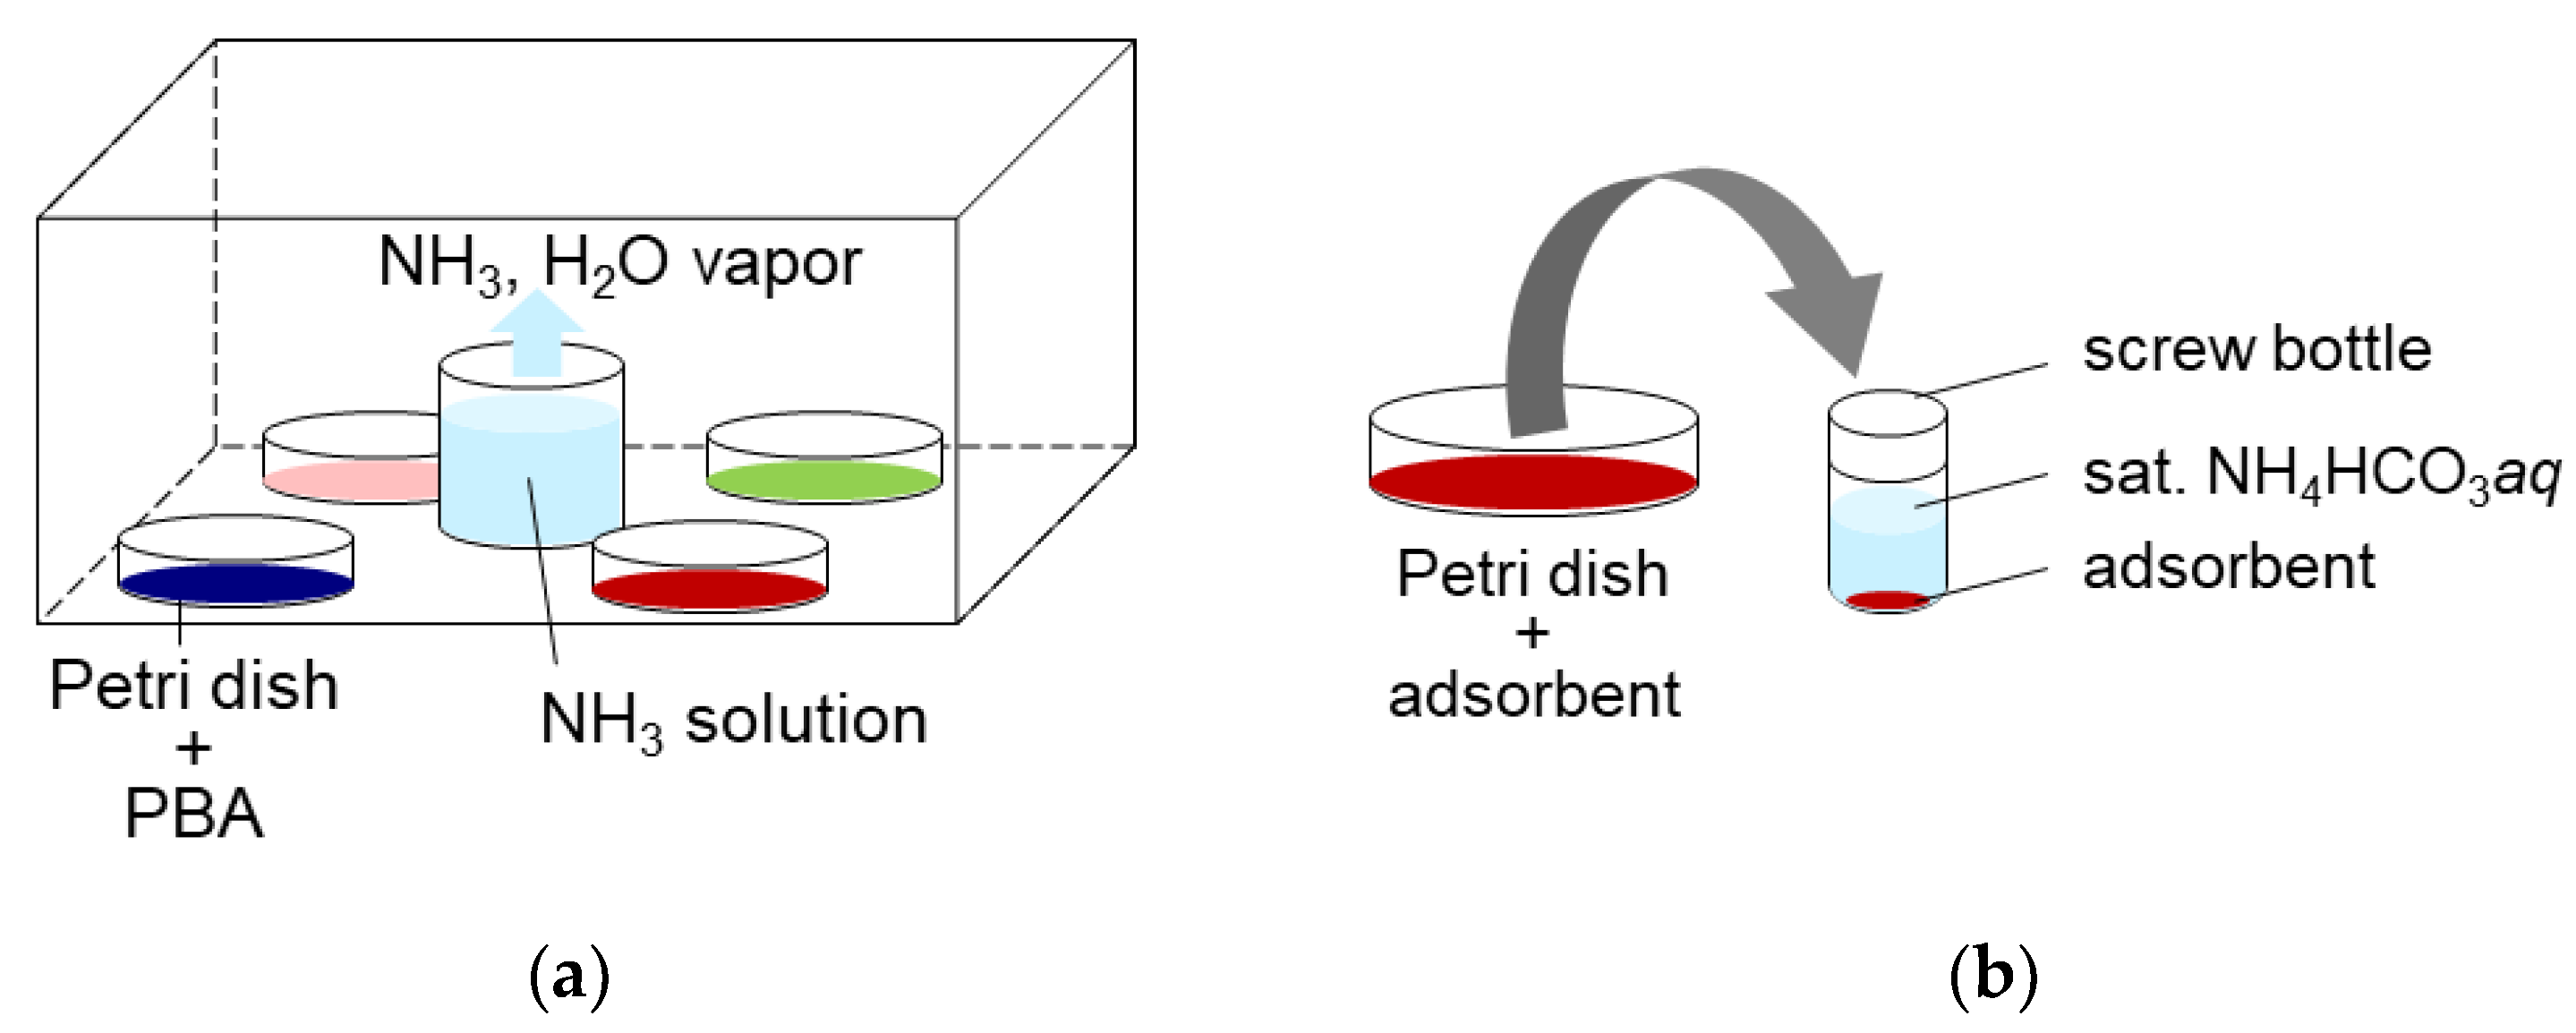
3.3. The Experimantal Scheme of the NH3 Adsorption and Desorption

The experimental scheme is illustrated in Figure 10. The main events were NH3 adsorption and desorption, whereas the other events were analytical experiments. The entire process was conducted at ambient temperature.
For NH3 adsorption, approximately 1 g of each PBA powder was placed in a sealed space with 100 mL of 2.8% ammonia solution, and left for 3.7 days, as shown in Figure 11a. This yielded NH3 and water vapor. The gaseous NH3 concentration was measured several times using gas detection tubes (3HM, GASTEC Co., Ayase, Japan) to confirm whether the system reached equilibrium. The NH3 and H2O concentrations were 17,600 ppmv and 23,000 ppmv, respectively. After adsorption, PBA powder was used for desorption, characterization, and quantification of adsorbed NH3.
For the desorption of NH3 adsorbed on PBAs, approximately 300 mg of PBA powder was placed in a 6 mL screw bottle and sat. NH4HCO3 aq was added at a liquid/solid ratio of 5 (wt./wt.), as shown in Figure 11a. The six screw bottles were shaken for >48 h at 300 rpm using a shaker (SI-300C). The samples were then left on a table until the PBA powder precipitated, and the supernatant became clear. An aliquot of the supernatant was collected and diluted 10,000 times with ultrapure water. The diluted solutions were filtered to remove the remaining PBA powder using a syringe and a PTFE filter with a pore size 0.45 mm. They were then subjected to ion chromatography (IC, Metrohm, Herisau, Switzerland) to measure the concentration of NH4+ and microwave plasma atomic emission spectrometry (MP-AES, Agilent Technologies Japan, Ltd., Hachioji, Japan) to measure dissolved metallic ions from PBA. The supernatant was removed using a pipette, and the precipitate was dried on a filter paper for XRD and FTIR measurements.
The adsorbed NH3 was quantified by acid-washing the adsorbent. After NH3 adsorption, the PBAs were washed with 30 mmol L−1 sodium hydrogen sulfate solution (NaHSO4 aq). Approximately 20 mg of PBA was put into a 50 mL centrifuge tube, and NaHSO4 aq was added at a liquid/solid ratio of 500 (wt./wt.). The PBA in NaHSO4 aq was shaken for more than 24 h at 600 rpm using a shaker (SI-300C). The liquid and the adsorbent were separated by centrifuging at 16,000× g for 5 min. The supernatant was diluted 1000 times with ultrapure water and processed for IC measurements to measure the concentration of NH4+.
The PBAs were characterized at each step of the XRD and ATR-FTIR experiments. PBA powder was ground using an agate mortar and pestle for the measurements. XRD measurements to examine the crystal structure of the PBAs were conducted using an X-ray diffractometer (D8 ADVANCE, Bruker Corp., Billerica, MA, USA) with Cu Kα radiation (λ = 0.154 nm) at 40 kV and 40 mA at ambient temperature. The PBA samples for XRD measurements were evenly applied to a reflection-free sample holder. ATR-FTIR spectra were obtained using a diamond ATR unit (Nicolet iS5; Thermo Fisher Scientific Inc., Waltham, MA, USA).

4. Conclusions

In this study, we tested six types of PBAs to investigate the NH3 adsorption/desorption behavior when the desorption method was washing with sat. NH4HCO3 aq. Sat. NH4HCO3 aq was used as the washing liquid to recover NH3 as solid NH4HCO3 by introducing CO2 into the washing liquid after desorption. In the experiment, the PBAs were left in a sealed space with an NH3 solution for adsorption. Then, the PBAs were washed with sat. NH4HCO3 aq for desorption. The amounts of adsorbed and desorbed NH3 were quantified using IC. The PBAs were analyzed by XRD and FTIR measurements.
The amounts of adsorption and desorption and the desorption/adsorption ratio were the highest for CuHCF. The XRD results showed that the structural stability is higher when the metal ions in PBAs are hexacoordinated rather than tetracoordinated. For practical use as adsorbents, PBAs containing hexacoordinated metal ions are expected to have cyclic stability. Further studies on the adsorption/desorption properties during the second and third cycles are required. The FTIR results indicated that NH3 adsorbed on the vacancy sites could be desorbed by washing with sat. NH4HCO3 aq compared with NH4+ in the interstitial sites. The relationship between the desorption/adsorption ratio and the adsorption sites was discussed based on the peak area ratio of the NH3 peak and NH4 peak observed in the FTIR spectra. The desorption/adsorption ratio increased with the NH3/NH4 peak area ratio. Furthermore, the desorption/adsorption ratio followed the Irving-Williams order. These results indicate the NH3 adsorption/desorption behavior is related to the stability of the metal complexes. Hexacyanocobaltate PBAs are expected to have higher desorption/adsorption ratio compared to ferricyanide PBAs. We have reported that the desorption amount of NH3 from activated carbon, zeolite, and an ion exchange resin were less than 0.5 mmol when 1 g of adsorbents were used for adsorption in 60% NH3 gas and desorption by washing with sat. NH4HCO3 aq [23]. In this study, we have demonstrated that the NH3 adsorption/desorption behavior can be improved by changing metals in PBAs, showing that PBAs are promising NH3 adsorbents for ammonia recovery as an NH4HCO3 solid compared to activated carbon, zeolite, and ion exchange resins. The results obtained in this study will contribute to the development of adsorbents for NH3 recovery as reusable solids.

Author Contributions

Conceptualization, H.U., T.K. and K.M.; methodology, H.U. and Y.M.; validation, H.U., T.K. and K.M.; formal analysis, H.U.; data curation, H.U. and Y.M.; writing—original draft preparation, H.U.; writing—review and editing, H.U., Y.M., T.K. and K.M.; project administration, T.K.; funding acquisition, T.K.; investigation, H.U., Y.M. All authors have read and agreed to the published version of the manuscript.

Funding

This research was funded by the New Energy and Industrial Technology Development Organization (NEDO; grant number JPNP18016).

Institutional Review Board Statement

Not applicable.

Informed Consent Statement

Not applicable.

Data Availability Statement

The data presented in this study are available on request from the corresponding author.

Conflicts of Interest

The authors declare no conflict of interest.

Sample Availability

Samples of the compounds are not available from the authors.

References

  1. Krupa, S. Effects of Atmospheric Ammonia (NH3) on Terrestrial Vegetation: A Review. Environ. Pollut. 2003, 124, 179–221. [Google Scholar] [CrossRef] [PubMed]
  2. Paulot, F.; Jacob, D.J. Hidden Cost of U.S. Agricultural Exports: Particulate Matter from Ammonia Emissions. Environ. Sci. Technol. 2014, 48, 903–908. [Google Scholar] [CrossRef] [PubMed]
  3. National Mineterals Information Center, U.S. Geological Survey NITROGEN (FIXED)—AMMONIA. Miner. Commod. Summ. 2022. Available online: https://pubs.usgs.gov/periodicals/mcs2022/mcs2022-nitrogen.pdf (accessed on 13 November 2022).
  4. Foley, J.A.; Ramankutty, N.; Brauman, K.A.; Cassidy, E.S.; Gerber, J.S.; Johnston, M.; Mueller, N.D.; O’Connell, C.; Ray, D.K.; West, P.C.; et al. Solutions for a Cultivated Planet. Nature 2011, 478, 337–342. [Google Scholar] [CrossRef] [PubMed] [Green Version]
  5. Tista, M.; Gager, M.; Haider, S.; Pucher, I.; Ullrich, B. European Union Emission Inventory Report 1990–2015; European Environment Agency: Copenhagen, Denmark, 2017.
  6. The Nutrient Reduction Technology Cost Task Force A Stakeholder Group of the Chesapeake Bay Program. Nutrient Reduction Technology Cost Estimations for Point Sources in the Chesapeake Bay Watershed; The Nutrient Reduction Technology Cost Task Force: Baltimore, MD, USA, 2002. [Google Scholar]
  7. Fowler, D.; Coyle, M.; Skiba, U.; Sutton, M.A.; Cape, J.N.; Reis, S.; Sheppard, L.J.; Jenkins, A.; Grizzetti, B.; Galloway, J.N.; et al. The Global Nitrogen Cycle in the Twenty-First Century. Philos. Trans. R. Soc. B Biol. Sci. 2013, 368, 20130164. [Google Scholar] [CrossRef] [PubMed] [Green Version]
  8. Tian, X.; Qiu, J.; Wang, Z.; Chen, Y.; Li, Z.; Wang, H.; Zhao, Y.; Wang, J. A Record Ammonia Adsorption by Calcium Chloride Confined in Covalent Organic Frameworks. Chem. Commun. 2022, 58, 1151–1154. [Google Scholar] [CrossRef] [PubMed]
  9. Yang, Y.; Faheem, M.; Wang, L.; Meng, Q.; Sha, H.; Yang, N.; Yuan, Y.; Zhu, G. Surface Pore Engineering of Covalent Organic Frameworks for Ammonia Capture through Synergistic Multivariate and Open Metal Site Approaches. ACS Cent. Sci. 2018, 4, 748–754. [Google Scholar] [CrossRef]
  10. Wonkim, D.; Wonkang, D.; Injung Kang, M.; Lee, J.U.-H.; Ong, J.; Choe, H.; Chae, Y.; Doo, S.; Choi, H.; Yun, C.; et al. Ammonia Capture Hot Paper High Ammonia UptakeofaMetal-Organic Framework Adsorbenti n AW Ide Pressure Range. Angew. Chem. Int. Ed. 2020, 59, 22531–22536. [Google Scholar] [CrossRef]
  11. Rieth, A.J.; Dincă, M. Controlled Gas Uptake in Metal–Organic Frameworks with Record Ammonia Sorption. J. Am. Chem. Soc. 2018, 140, 3461–3466. [Google Scholar] [CrossRef]
  12. Barin, G.; Peterson, G.W.; Crocellà, V.; Xu, J.; Colwell, K.A.; Nandy, A.; Reimer, J.A.; Bordiga, S.; Long, J.R. Highly Effective Ammonia Removal in a Series of Brønsted Acidic Porous Polymers: Investigation of Chemical and Structural Variations. Chem. Sci. 2017, 8, 4399–4409. [Google Scholar] [CrossRef] [Green Version]
  13. Takahashi, A.; Tanaka, H.; Parajuli, D.; Nakamura, T.; Minami, K.; Sugiyama, Y.; Hakuta, Y.; Ohkoshi, S.; Kawamoto, T. Historical Pigment Exhibiting Ammonia Gas Capture beyond Standard Adsorbents with Adsorption Sites of Two Kinds. J. Am. Chem. Soc. 2016, 138, 6376–6379. [Google Scholar] [CrossRef] [PubMed]
  14. Van Humbeck, J.F.; McDonald, T.M.; Jing, X.; Wiers, B.M.; Zhu, G.; Long, J.R. Ammonia Capture in Porous Organic Polymers Densely Functionalized with Brønsted Acid Groups. J. Am. Chem. Soc. 2014, 136, 2432–2440. [Google Scholar] [CrossRef] [PubMed]
  15. Saidi, M.; Ho, P.H.; Yadav, P.; Salles, F.; Charnay, C.; Girard, L.; Boukli-hacene, L.; Trens, P. Carbon Dioxide and Ethanol Vapour. A Comparative Study. Molecules 2021, 26, 7620. [Google Scholar] [CrossRef]
  16. Ge, J.; Ohata, Y.; Ohnishi, T.; Moteki, T.; Ogura, M. Highly Dispersed Co/Zn-Doped Zeolitic Imidazolate Framework-Derived Carbon Nanoparticles with High NO Adsorption Capacity at Low Operating Temperature. Ind. Eng. Chem. Res. 2022, 61, 3601–3609. [Google Scholar] [CrossRef]
  17. Barpaga, D.; Zheng, J.; Mcgrail, B.P.; Motkuri, R.K. Manipulating Pore Topology and Functionality to Promote Fluorocarbon-Based Adsorption Cooling. Acc. Chem. Res. 2021, 55, 649–659. [Google Scholar] [CrossRef] [PubMed]
  18. Kraft, A. On the Discovery and History of Prussian Blue. Bull. Hist. Chem 2008, 33, 61–67. [Google Scholar]
  19. Loos-Neskovic, C.; Dierkes, M.H.; Jackwerth, E.; Fedoroff, M.; Garnier, E. Fixation of Palladium on Insoluble Simple or Complex Cyano Compounds. Hydrometallurgy 1993, 32, 345–363. [Google Scholar] [CrossRef]
  20. Manakasettharn, S.; Takahashi, A.; Kawamoto, T.; Noda, K.; Sugiyama, Y.; Nakamura, T. Differences in NH3 Gas Adsorption Behaviors of Metal-Hexacyanoferrate Nanoparticles (M [FeII(CN)6]·zH2O: M = In3+, Fe3+, and Mn2+). J. Solid State Chem. 2019, 270, 112–117. [Google Scholar] [CrossRef]
  21. Parajuli, D.; Kitajima, A.; Takahashi, A.; Tanaka, H.; Ogawa, H.; Hakuta, Y.; Yoshino, K.; Funahashi, T.; Yamaguchi, M.; Osada, M.; et al. Application of Prussian Blue Nanoparticles for the Radioactive Cs Decontamination in Fukushima Region. J. Environ. Radioact. 2016, 151, 233–237. [Google Scholar] [CrossRef]
  22. Takahashi, A.; Minami, K.; Noda, K.; Sakurai, K.; Kawamoto, T. Trace Ammonia Removal from Air by Selective Adsorbents Reusable with Water. ACS Appl. Mater. Interfaces 2020, 12, 15115–15119. [Google Scholar] [CrossRef]
  23. Usuda, H.; Sakurai, K.; Takahashi, A.; Kawamoto, T.; Minami, K. Ammonium Salt Production in NH3-CO2-H2O System Using a Highly Selective Adsorbent, Copper Hexacyanoferrate. Environ. Pollut. 2021, 288, 117763. [Google Scholar] [CrossRef] [PubMed]
  24. Takahashi, A.; Minami, K.; Noda, K.; Sakurai, K.; Kawamoto, T. Harvesting a Solid Fertilizer Directly from Fetid Air. ACS Sustain. Chem. Eng. 2021, 9, 16865–16869. [Google Scholar] [CrossRef]
  25. Minami, K.; Takahashi, A.; Sakurai, K.; Mikasa, H.; Takasaki, M.; Doshu, N.; Aoyama, K.; Nakamura, T.; Iwai, R.; Kawamoto, T. Apparatus for Ammonia Removal in Livestock Farms Based on Copper Hexacyanoferrate Granules. Biosyst. Eng. 2022, 216, 98–107. [Google Scholar] [CrossRef]
  26. Sutter, D.; Gazzani, M.; Mazzotti, M. Formation of Solids in Ammonia-Based CO2 Capture Processes—Identification of Criticalities through Thermodynamic Analysis of the CO2–NH3–H2O System. Chem. Eng. Sci. 2015, 133, 170–180. [Google Scholar] [CrossRef]
  27. Sutter, D.; Mazzotti, M. Solubility and Growth Kinetics of Ammonium Bicarbonate in Aqueous Solution. Cryst. Growth Des. 2017, 17, 3048–3054. [Google Scholar] [CrossRef]
  28. Nakamoto, K. Infrared and Raman Spectra of Inorganic and Coordination Compounds: Part B: Applications in Coordination, Organometallic, and Bioinorganic Chemistry; John Wiley & Sons, Inc.: Hoboken, NJ, USA, 2008; ISBN 9780471744931. [Google Scholar]
  29. Gates-Rector, S.; Blanton, T. The Powder Diffraction File: A Quality Materials Characterization Database. Powder Diffr. 2019, 34, 352–360. [Google Scholar] [CrossRef] [Green Version]
  30. Irving, H.; Williams, R.J.P. Order of Stability of Metal Complexes. Nature 1948, 162, 746–747. [Google Scholar] [CrossRef]
  31. Yatsimirskii, K.B.; Vasil’ev, V.P. Instability Constants of Complex Compounds; Springer: Berlin/Heidelberg, Germany, 1995; ISBN 978-1-4684-8406-9. [Google Scholar]
  32. Jannik Bjerrum Metal Ammine Formation in Aqueous Solution, Theory of the Reversible Step Reactions. Trans. Faraday Soc. 1941, 47, 297–302.
  33. West, P.C.; Gerber, J.S.; Engstrom, P.M.; Mueller, N.D.; Brauman, K.A.; Carlson, K.M.; Cassidy, E.S.; Johnston, M.; MacDonald, G.K.; Ray, D.K.; et al. Leverage Points for Improving Global Food Security and the Environment. Science 2014, 345, 325–328. [Google Scholar] [CrossRef] [Green Version]
  34. Monk, C.B. Electrolytes in solutions of amino acids part 1v.-dissociation constants of metal complexes of glycine, alanine and glycyl-glycine from ph titrations. Trans. Faraday Soc. 1951, 47, 297–302. [Google Scholar] [CrossRef]
  35. Basolo, F.; Chen, Y.T. Steric Effects and the Stability of Complex Compounds. III. The Chelating Tendencies of N-Alkylglycines and N-Dialkylglycines with Copper(II) and Nickel(II) Ions. J. Am. Chem. Soc. 1954, 76, 953–955. [Google Scholar] [CrossRef]
  36. Mellor, D.P.; Maley, L. Stability Constants of Internal Complexes. Nature 1947, 159, 370. [Google Scholar] [CrossRef]
Figure 1. The crystal structure of PBA with a hexacyanoferrate vacancy at the center. The interstitial sites and vacancy sites are exhibited as red and blue balls, respectively.
Molecules 27 08840 g001
Figure 2. XRD patterns (a) and FTIR spectra (b) of copper hexacyanoferrate (CuHCF). “Initial” sample is literally the sample before adsorption. The samples after adsorption and desorption are denoted by “ads” and “des”, respectively. The measurements were performed at ambient temperature.
Molecules 27 08840 g002
Figure 3. XRD patterns (a) and FTIR spectra (b) of cobalt hexacyanocobaltate (CoHCC). “Initial” sample is literally the sample before adsorption. The samples after adsorption and desorption are denoted by “ads” and “des”, respectively. The measurements were performed at ambient temperature.
Molecules 27 08840 g003
Figure 4. XRD patterns (a) and FTIR spectra (b) of Nickel hexacyanoferrate. “Initial” sample is literally the sample before adsorption. The samples after adsorption and desorption are denoted by “ads” and “des”, respectively. The measurements were performed at ambient temperature.
Molecules 27 08840 g004
Figure 5. XRD patterns (a) and FTIR spectra (b) of zinc hexacyanoferrate (ZnHCF). “Initial” sample is literally the sample before adsorption. The samples after adsorption and desorption are denoted by “ads” and “des”, respectively. The measurements were performed at ambient temperature.
Molecules 27 08840 g005
Figure 6. XRD patterns (a) and FTIR spectra (b) of cobalt hexacyanoferrate (CoHCF). “Initial” sample is literally the sample before adsorption. The samples after adsorption and desorption are denoted by “ads” and “des”, respectively. The measurements were performed at ambient temperature.
Molecules 27 08840 g006
Figure 7. XRD patterns (a) and FTIR spectra (b) of manganese hexacyanoferrate (MnHCF). “Initial” sample is literally the sample before adsorption. The samples after adsorption and desorption are denoted by “ads” and “des”, respectively. The measurements were performed at ambient temperature.
Molecules 27 08840 g007
Figure 8. The area ratio of the M-NH3 and NH4 peak as observed in the FTIR spectra.
Molecules 27 08840 g008
Figure 9. (a) The desorption/adsorption ratio plotted against atomic number of M in PBA (AyM[M’(CN)6]x). Lines connect hexacyanoferrate PBAs showing the same order as the Irving-Williams series [30]. (b) Stability constants of divalent transition metal chelate complex [31,32,33,34,35,36].
Molecules 27 08840 g009
Figure 10. The experimental scheme.
Molecules 27 08840 g010
Figure 11. (a) The adsorption method. (b) The desorption method.
Molecules 27 08840 g011
Table 1. The adsorption and desorption amount of NH3 and the ratio of desorption.
PBAAdsorption Amount
mmol/g
Desorption Amount
mmol/g
Desorption Ratio
%
CuHCF13.28.1961.9
CoHCC4.871.9039.1
NiHCF5.481.4927.1
ZnHCF2.660.5320.0
CoHCF1.470.149.7
MnHCF4.57−0.63−13.9
Publisher’s Note: MDPI stays neutral with regard to jurisdictional claims in published maps and institutional affiliations.

