
Biological and Cheminformatics Studies of Newly Designed Triazole Based Derivatives as Potent Inhibitors against Mushroom Tyrosinase


 ,
,
Abstract
:1. Introduction
2. Results and Discussion
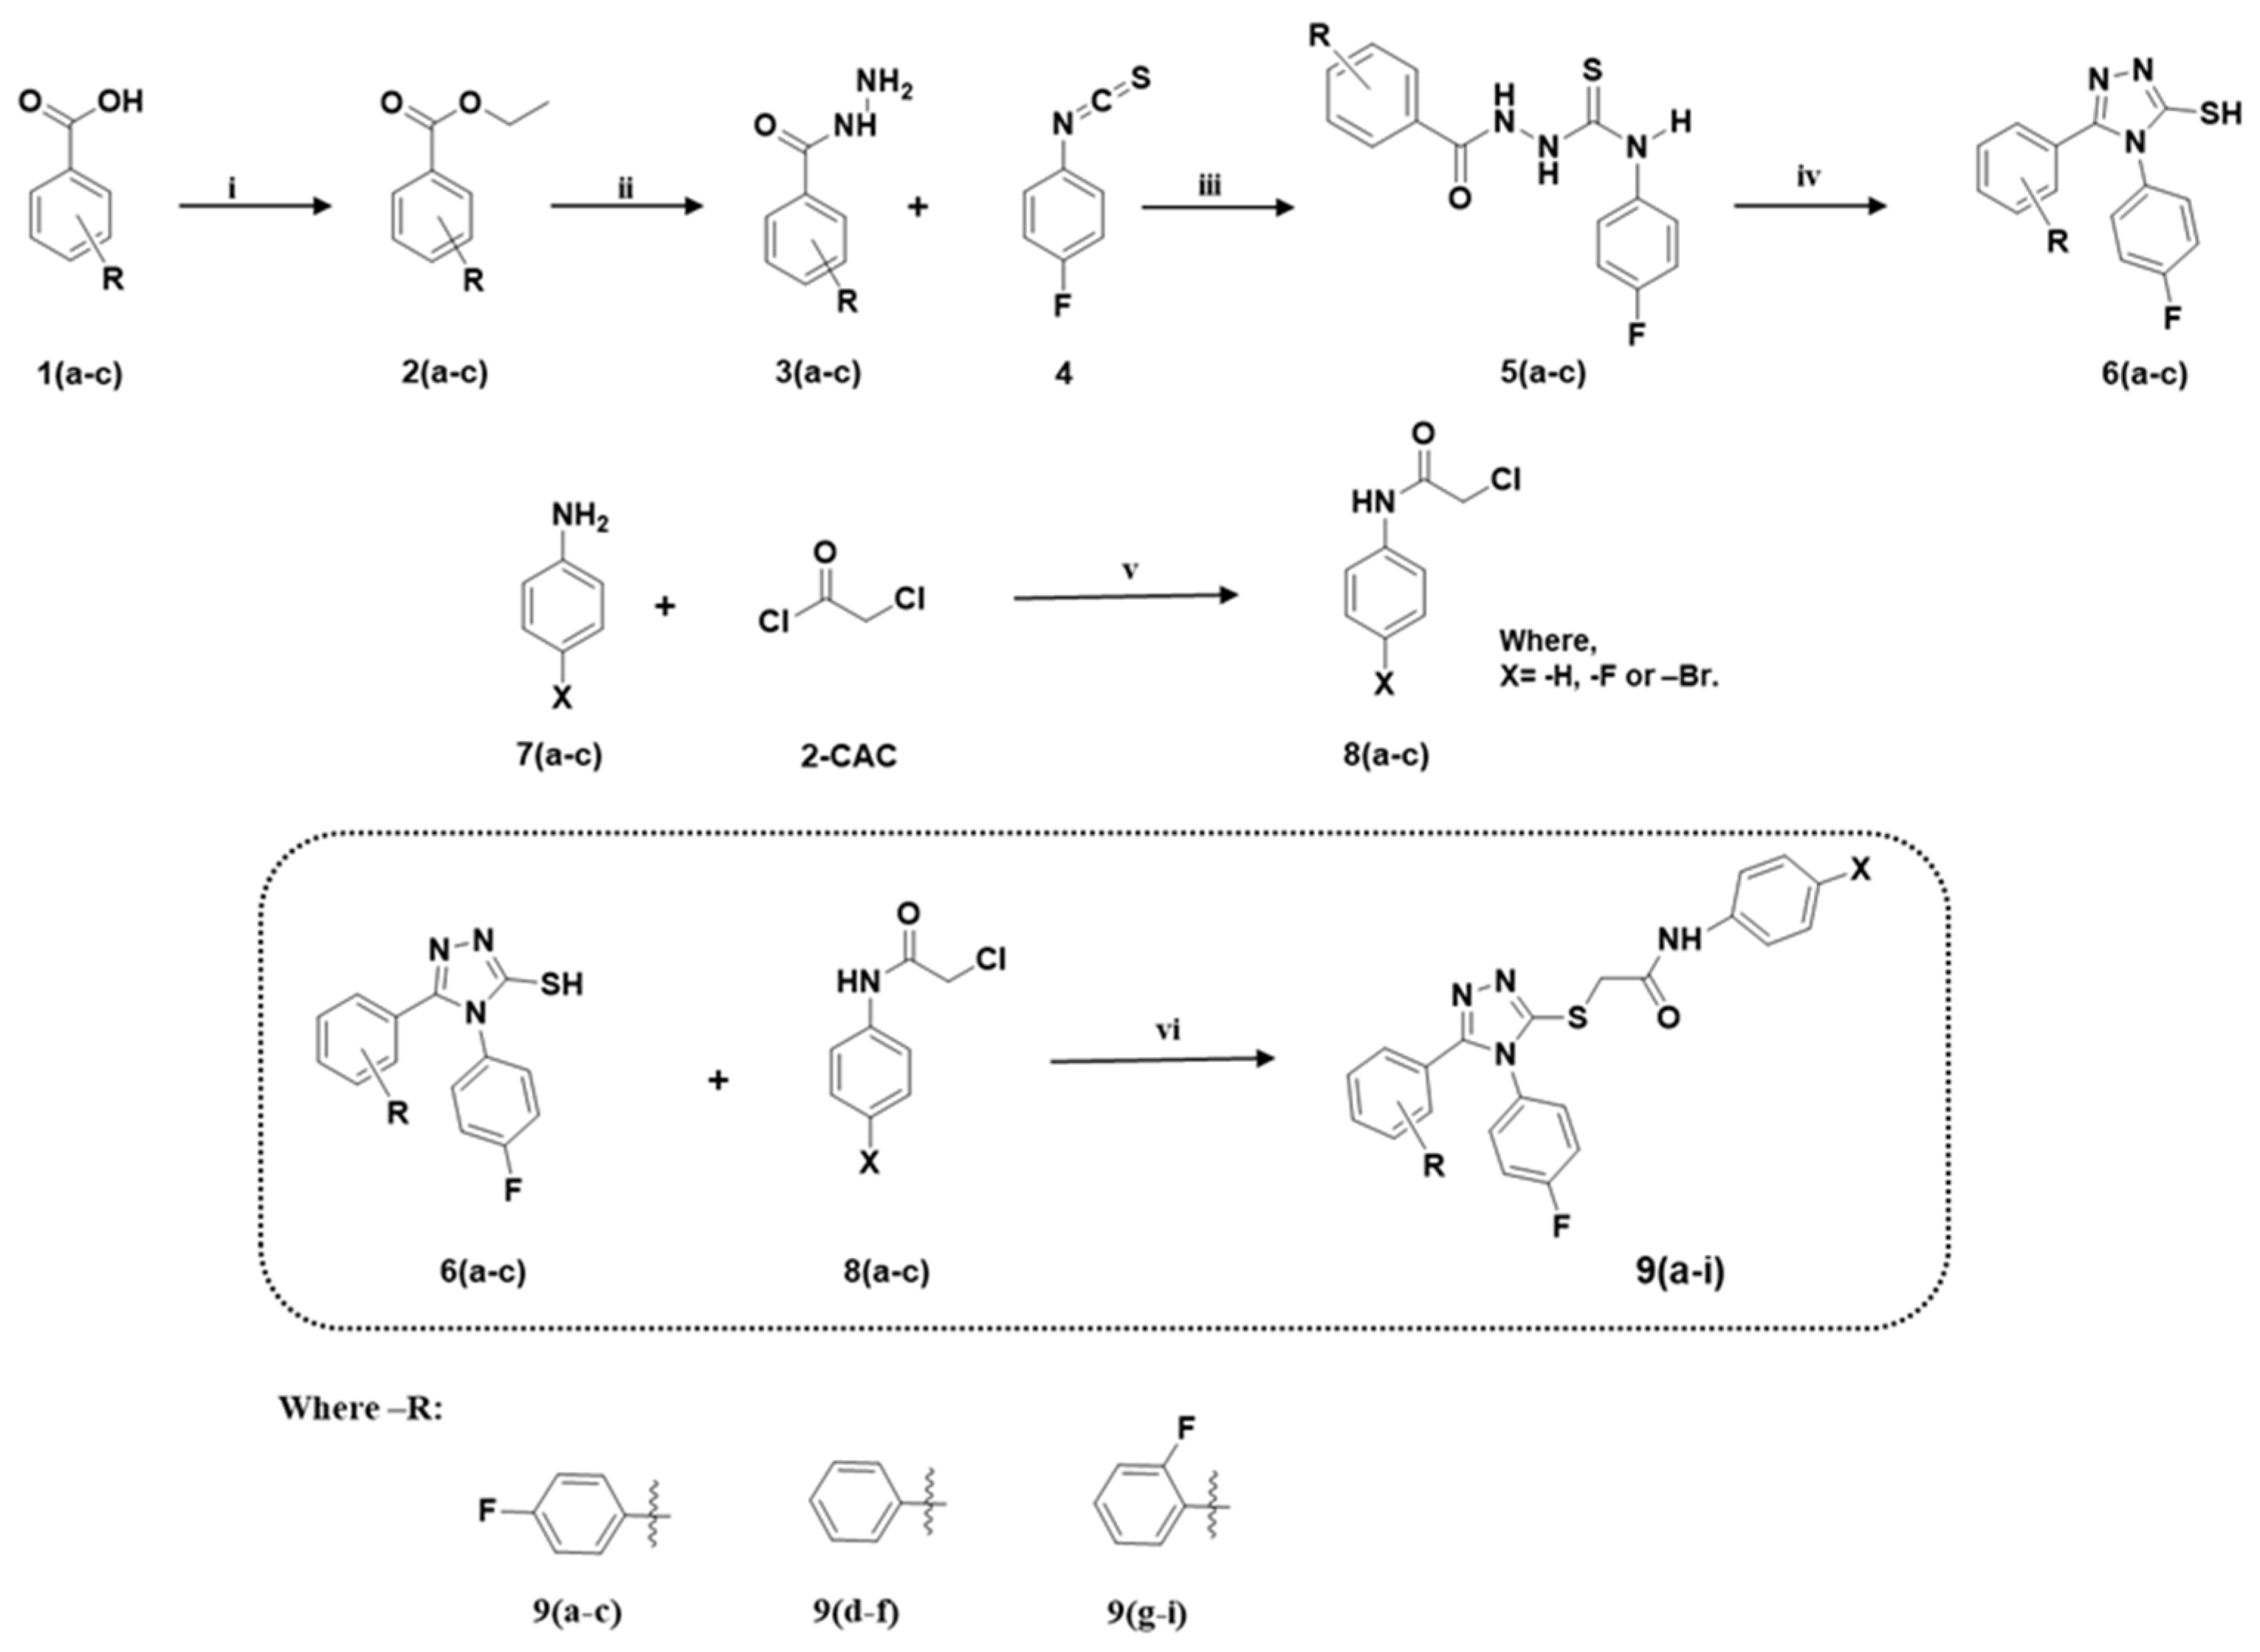
2.1. Synthesis
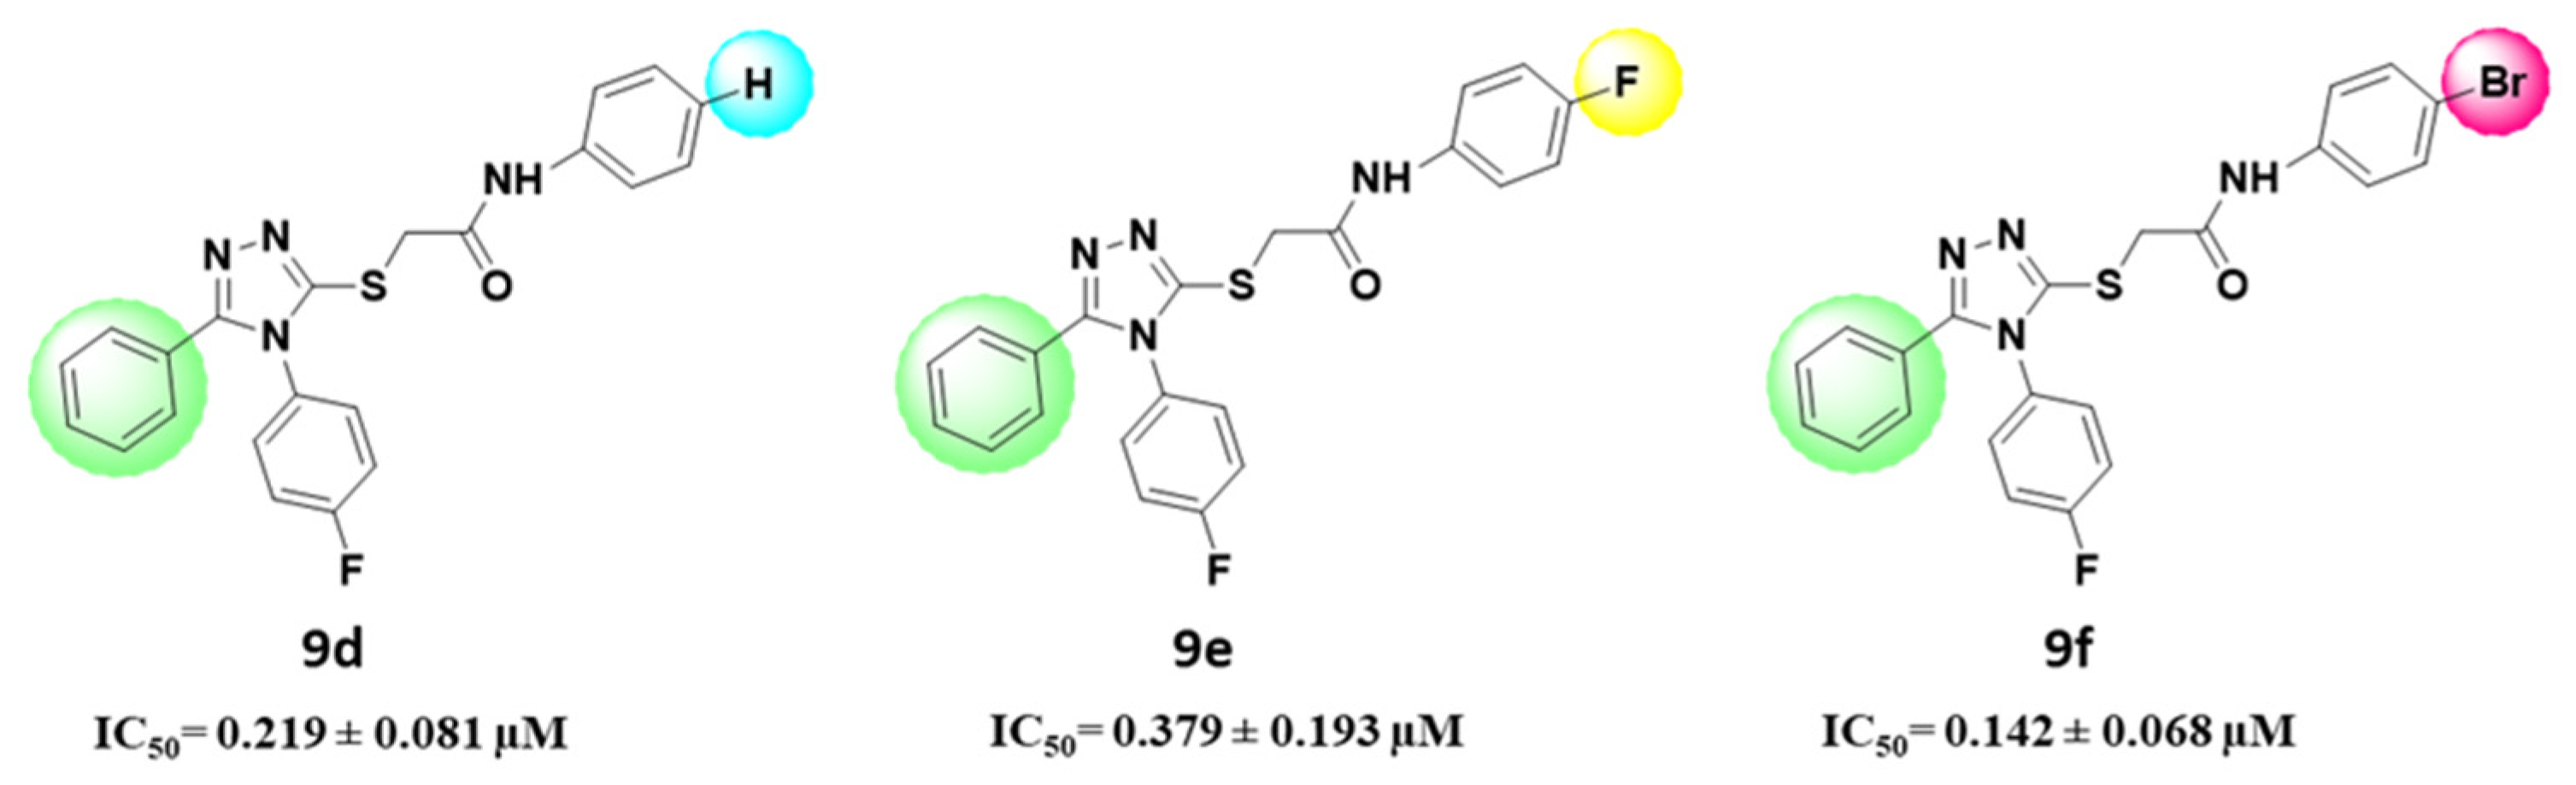
In Vitro Tyrosinase Activity and Structural Activity Relationship (SAR)
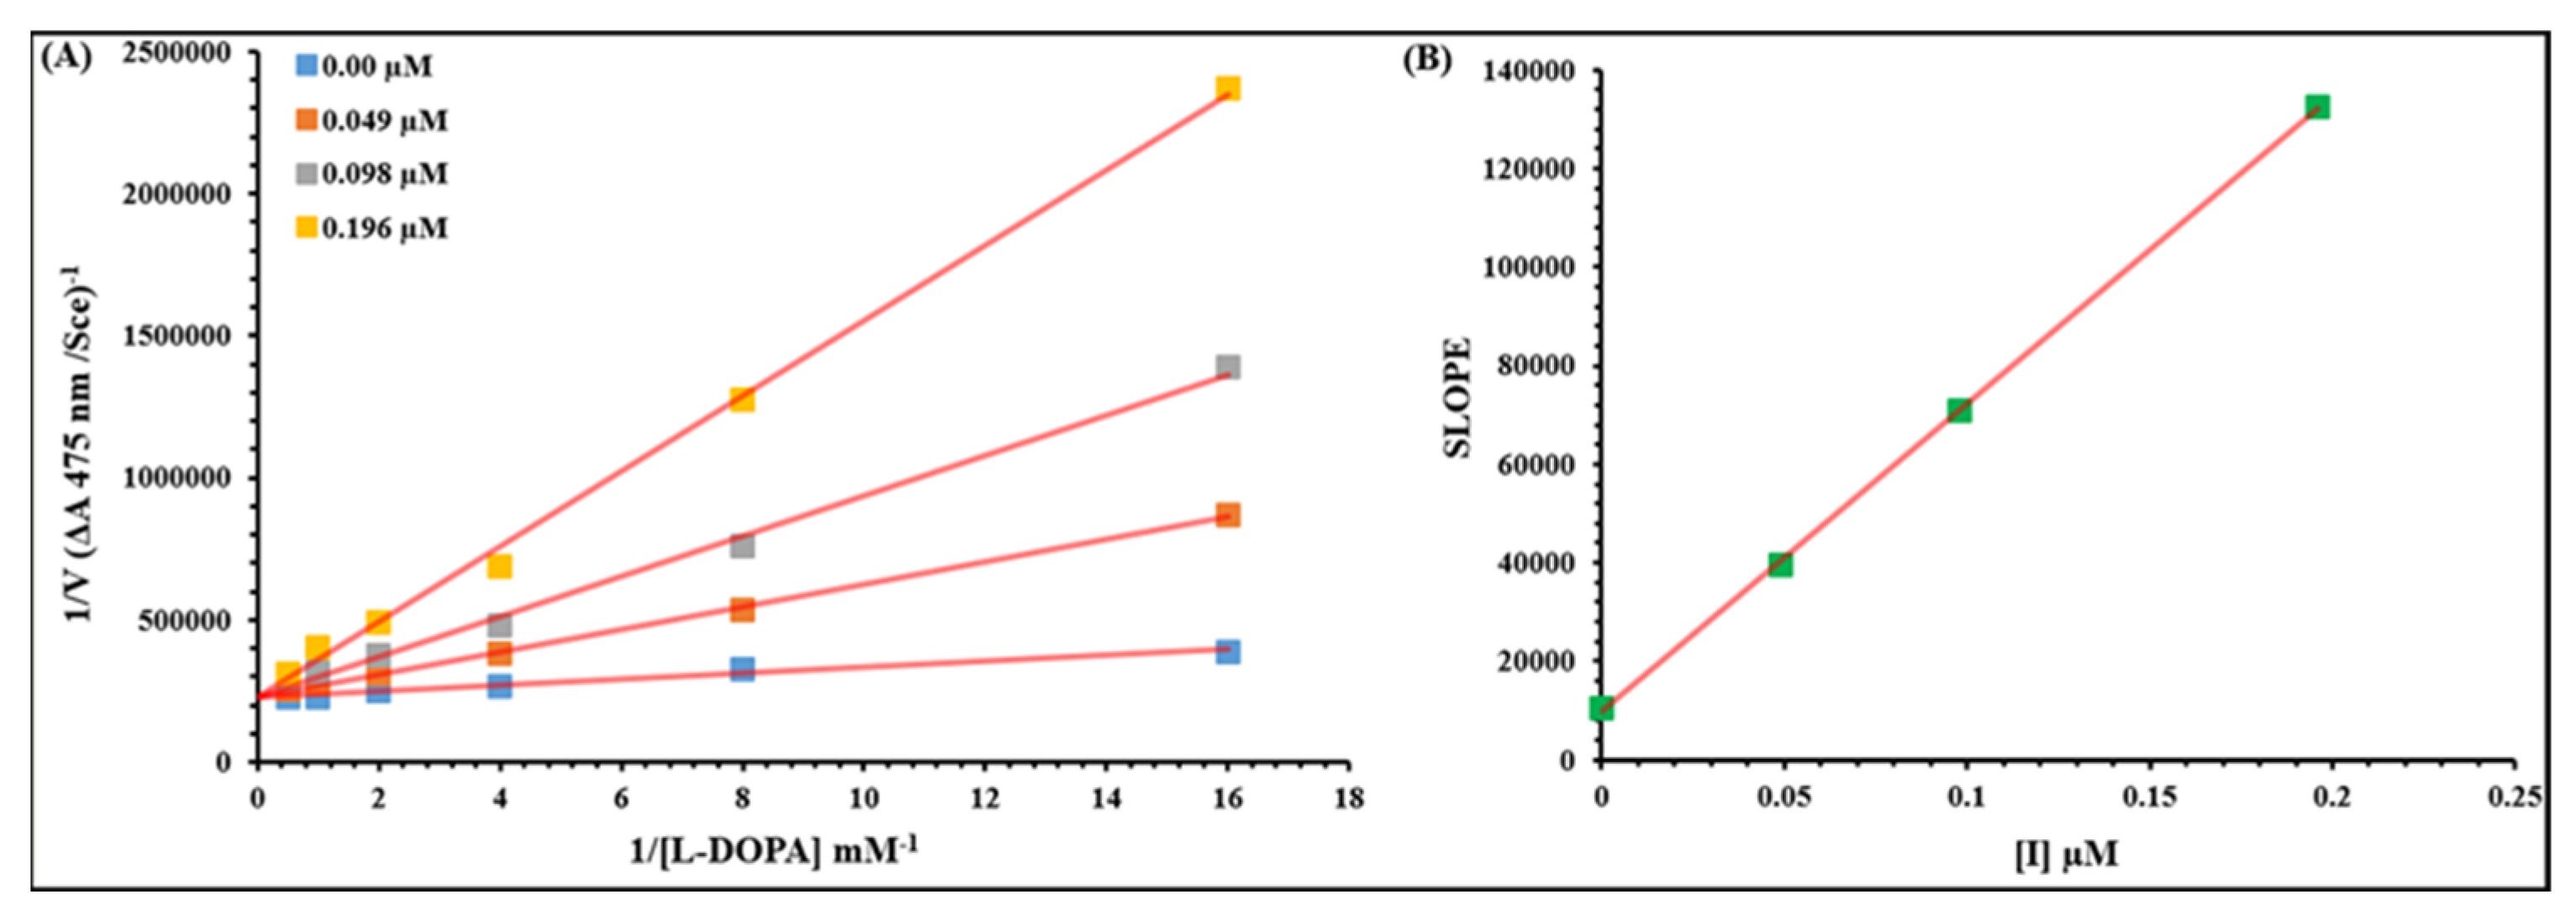
2.2. Kinetic Analysis
2.3. Computational Analysis
2.3.1. Mushroom Tyrosinase Structural Assessment
2.3.2. Chemo-Informatic Properties and Lipinski’s Rule of Five (RO5) Based Evaluation of Ligands
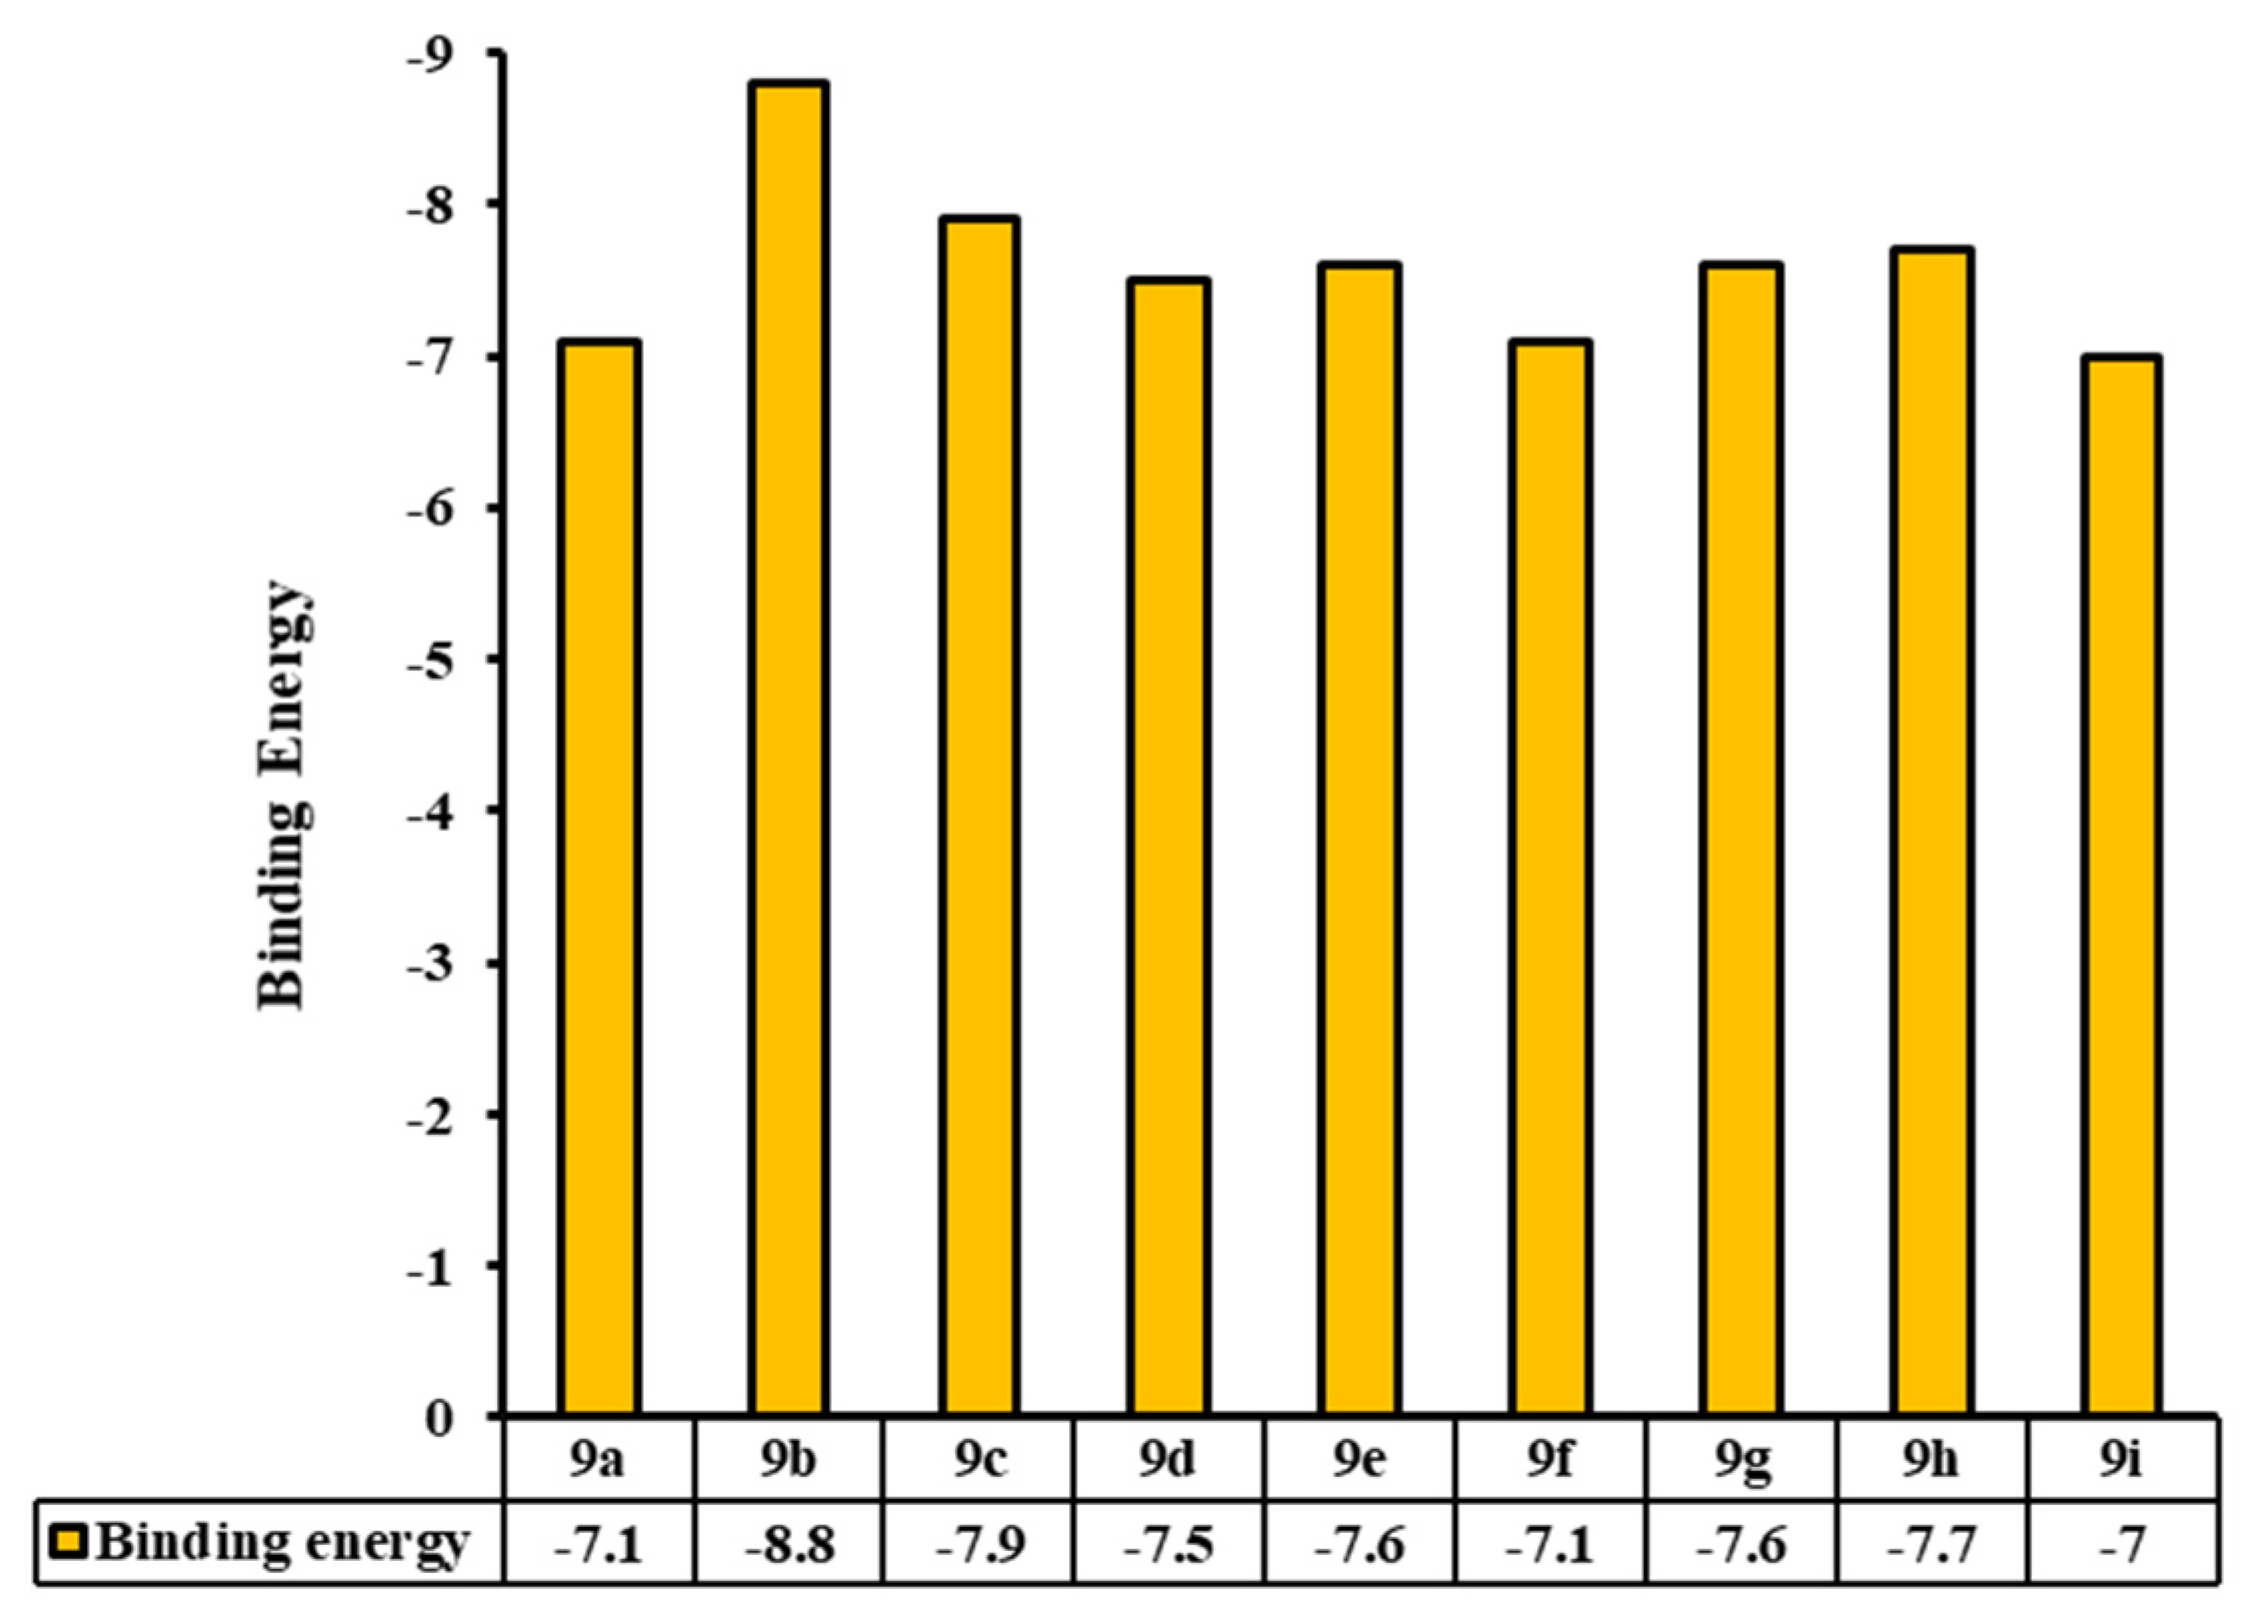
2.3.3. Molecular Docking Analyses
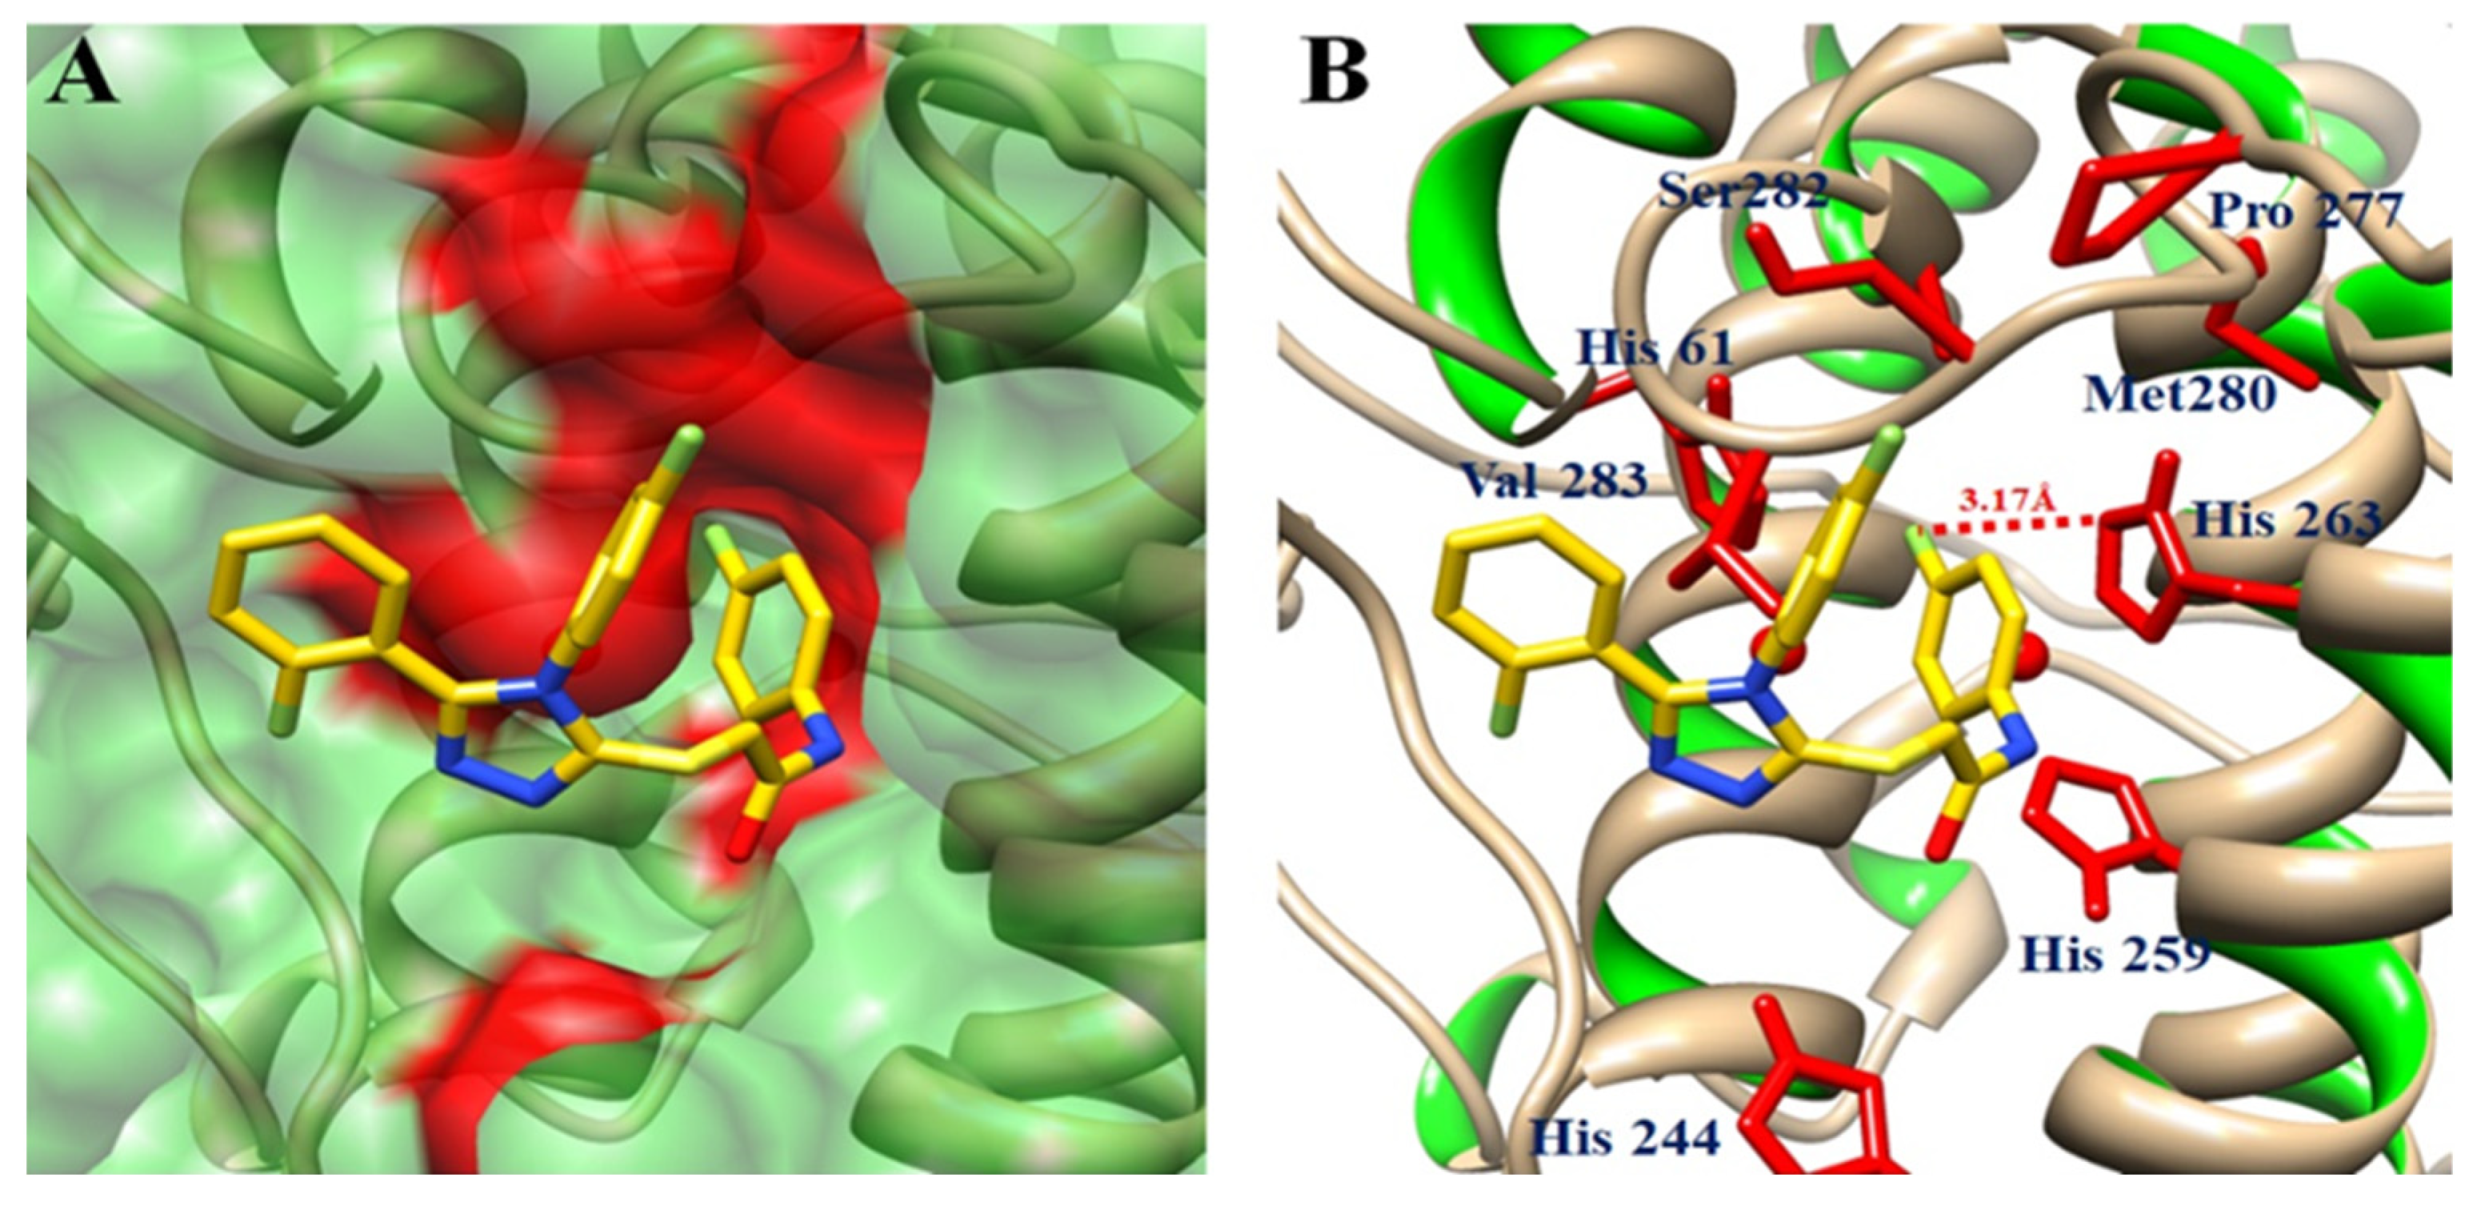
Tyrosinase Binding Pocket Analysis and Ligand Binding Conformations
Hydrogen and Hydrophobic Binding Interaction
3. Materials and Methods
3.1. Chemistry
3.1.1. General Synthetic Procedure for the Key Compounds 2(a–c), 3(a–c), 5(a–c), 6(a–c), 8(a–c), and 9(a–i)
3.1.2. 2-(4,5-Bis(4-fluorophenyl)-4H-1,2,4-triazol-3-ylthio)-N-phenylacetamide (9a)
3.1.3. 2-(4,5-Bis(4-fluorophenyl)-4H-1,2,4-triazol-3-ylthio)-N-(4-fluorophenyl) Acetamide (9b)
3.1.4. 2-(4,5-Bis(4-fluorophenyl)-4H-1,2,4-triazol-3-ylthio)-N-(4-bromophenyl) Acetamide (9c)
3.1.5. 2-(4-(4-Fluorophenyl)-5-phenyl-4H-1,2,4-triazol-3-ylthio)-N-phenylacetamide (9d)
3.1.6. N-(4-fluorophenyl)-2-(4-(4-fluorophenyl)-5-phenyl-4H-1,2,4-triazol-3-ylthio) Acetamide (9e)
3.1.7. N-(4-bromophenyl)-2-(4-(4-fluorophenyl)-5-phenyl-4H-1,2,4-triazol-3-ylthio) Acetamide (9f)
3.1.8. 2-(5-(2-Fluorophenyl)-4-(4-fluorophenyl)-4H-1,2,4-triazol-3-ylthio)-N-phenylacetamide (9g)
3.1.9. N-(4-fluorophenyl)-2-(5-(2-fluorophenyl)-4-(4-fluorophenyl)-4H-1,2,4-triazol-3-ylthio) Acetamide (9h)
3.1.10. N-(4-bromophenyl)-2-(5-(2-fluorophenyl)-4-(4-fluorophenyl)-4H-1,2,4-triazol-3-ylthio) Acetamide (9i)
3.2. In Vitro Methodology
3.2.1. Tyrosinase Assay
3.2.2. Kinetic Analysis
3.3. Computational Methodology
3.3.1. Preparation of Target Protein
3.3.2. In Silico Design of Synthesized Compounds
3.3.3. Molecular Docking
4. Conclusions
Supplementary Materials
Author Contributions
Funding
Institutional Review Board Statement
Informed Consent Statement
Data Availability Statement
Acknowledgments
Conflicts of Interest
Sample Availability
References
- Bonaventure, J.; Domingues, M.J.; Larue, L. Cellular and molecular mechanisms controlling the migration of melanocytes and melanoma cells. Pigment Cell Melanoma Res. 2013, 26, 316–325. [Google Scholar] [CrossRef] [PubMed]
- Borovansky, J.; Riley, P.A. Melanins and Melanosomes: Biosynthesis, Structure, Physiological and Pathological Functions; John Wiley & Sons: Hoboken, NJ, USA, 2011; ISBN 978-3-527-32892-5. [Google Scholar]
- Seiberg, M. Keratinocyte–melanocyte interactions during melanosome transfer. Pigment Cell Res. 2001, 14, 236–242. [Google Scholar] [CrossRef] [PubMed]
- Lin, J.Y.; Fisher, D.E. Melanocyte biology and skin pigmentation. Nature 2007, 445, 843–850. [Google Scholar] [CrossRef] [PubMed]
- Delevoye, C. Melanin transfer: The keratinocytes are more than gluttons. J. Investig. Dermatol. 2014, 134, 877–879. [Google Scholar] [CrossRef] [Green Version]
- Meredith, P.; Riesz, J. Radiative Relaxation Quantum Yields for Synthetic Eumelanin. Photochem. Photobiol. 2004, 79, 211–216. [Google Scholar] [CrossRef]
- Vandamme, M.; Robert, E.; Pesnel, S.; Barbosa, E.; Dozias, S.; Sobilo, J.; Lerondel, S.; Le Pape, A.; Pouvesle, J.M. Antitumor effect of plasma treatment on U87 glioma xenografts: Preliminary results. Plasma. Process Polym. 2010, 7, 264–273. [Google Scholar] [CrossRef]
- Videira, I.F.d.S.; Moura, D.F.L.; Magina, S. Mechanisms regulating melanogenesis. An. Bras. Dermatol. 2013, 88, 76–83. [Google Scholar] [CrossRef] [Green Version]
- Cooksey, C.J.; Garratt, P.J.; Land, E.J.; Pavel, S.; Ramsden, C.A.; Riley, P.A.; Smit, N.P. Evidence of the indirect formation of the catecholic intermediate substrate responsible for the autoactivation kinetics of tyrosinase. J. Biol. Chem. 1997, 272, 26226–26235. [Google Scholar] [CrossRef] [Green Version]
- Hearing, V.J.; Jiménez, M. Analysis of mammalian pigmentation at the molecular level. Pigment Cell Res. 1989, 2, 75–85. [Google Scholar] [CrossRef]
- Fairhead, M.; Thöny-Meyer, L. Bacterial tyrosinases: Old enzymes with new relevance to biotechnology. N. Biotechnol. 2012, 29, 183–191. [Google Scholar] [CrossRef]
- Zolghadri, S.; Bahrami, A.; Hassan Khan, M.T.; Munoz-Munoz, J.; Garcia-Molina, F.; Garcia-Canovas, F.; Saboury, A.A. A comprehensive review on tyrosinase inhibitors. J. Enzyme Inhib. Med. Chem. 2019, 34, 279–309. [Google Scholar] [CrossRef] [Green Version]
- Ashraf, Z.; Rasool, R.; Hassan, M.; Ahsan, H.; Afzal, S.; Afzal, K.; Cho, H.; Kim, S.J. Synthesis, bioevaluation and molecular dynamic simulation studies of dexibuprofen–antioxidant mutual prodrugs. Int. J. Mol. Sci. 2016, 17, 2151. [Google Scholar] [CrossRef] [Green Version]
- Larik, F.A.; Saeed, A.; Channar, P.A.; Muqadar, U.; Abbas, Q.; Hassan, M.; Seo, S.-Y.; Bolte, M. Design, synthesis, kinetic mechanism and molecular docking studies of novel 1-pentanoyl-3-arylthioureas as inhibitors of mushroom tyrosinase and free radical scavengers. Eur. J. Med. Chem. 2017, 141, 273–281. [Google Scholar] [CrossRef]
- Saeed, A.; Mahesar, P.A.; Channar, P.A.; Abbas, Q.; Larik, F.A.; Hassan, M.; Raza, H.; Seo, S.-Y. Synthesis, molecular docking studies of coumarinyl-pyrazolinyl substituted thiazoles as non-competitive inhibitors of mushroom tyrosinase. Bioorg. Chem. 2017, 74, 187–196. [Google Scholar] [CrossRef]
- Hassan, M.; Ashraf, Z.; Abbas, Q.; Raza, H.; Seo, S.-Y. Exploration of novel human tyrosinase inhibitors by molecular modeling, docking and simulation studies. Interdiscip. Sci. 2018, 10, 68–80. [Google Scholar] [CrossRef]
- Demir, E.A.; Colak, A.; Kalfa, A.; Yasar, A.; Bekircan, O.; Akatin, M.Y. Investigation of tyrosinase inhibition by some 1, 2, 4 triazole derivative compounds: In vitro and in silico mechanisms. Turkish J. Biochem. 2019, 44, 473–481. [Google Scholar] [CrossRef]
- Vanjare, B.D.; Mahajan, P.G.; Dige, N.C.; Raza, H.; Hassan, M.; Han, Y.; Kim, S.J.; Seo, S.-Y.; Lee, K.H. Novel 1,2,4-triazole analogues as mushroom tyrosinase inhibitors: Synthesis, kinetic mechanism, cytotoxicity and computational studies. Mol. Divers. 2021, 25, 2089–2106. [Google Scholar] [CrossRef]
- Qamar, R.; Saeed, A.; Larik, F.A.; Abbas, Q.; Hassan, M.; Raza, H.; Seo, S.Y. Novel 1,3-oxazine-tetrazole hybrids as mushroom tyrosinase inhibitors and free radical scavengers: Synthesis, kinetic mechanism, and molecular docking studies. Chem. Biol. Drug Des. 2019, 93, 123–131. [Google Scholar] [CrossRef]
- Kadam, R.; Roy, N. Recent trends in drug-likeness prediction: A comprehensive review of in silico methods. Indian J. Pharm. Sci. 2007, 69, 609. [Google Scholar]
- Bakht, M.A.; Yar, M.S.; Abdel-Hamid, S.G.; Al Qasoumi, S.I.; Samad, A. Molecular properties prediction, synthesis and antimicrobial activity of some newer oxadiazole derivatives. Eur. J. Med. Chem. 2010, 45, 5862–5869. [Google Scholar] [CrossRef]
- Jadhav, P.B.; Yadav, A.R.; Gore, M.G. Concept of drug likeness in pharmaceutical research. Int. J. Pharm. Biol. Sci. 2015, 6, 142–154. [Google Scholar]
- Ghose, A.K.; Herbertz, T.; Hudkins, R.L.; Dorsey, B.D.; Mallamo, J.P. Knowledge-based, central nervous system (CNS) lead selection and lead optimization for CNS drug discovery. ACS Chem. Neurosci. 2012, 3, 50–68. [Google Scholar] [CrossRef] [Green Version]
- Walters, W.P.; Murcko, A.A.; Murcko, M.A. Recognizing molecules with drug-like properties. Curr. Opin. Chem. Biol. 1999, 3, 384–387. [Google Scholar] [CrossRef]
- Hassan, M.; Shahzadi, S.; Seo, S.Y.; Alashwal, H.; Zaki, N.; Moustafa, A.A. Molecular docking and dynamic simulation of AZD3293 and solanezumab effects against BACE1 to treat Alzheimer’s disease. Front. Comput. Neurosci. 2018, 12, 34. [Google Scholar] [CrossRef] [Green Version]
- Hassan, M.; Abbasi, M.A.; Siddiqui, S.Z.; Shahzadi, S.; Raza, H.; Hussain, G.; Shah, S.A.A.; Ashraf, M.; Shahid, M.; Seo, S.-Y. Designing of promising medicinal scaffolds for Alzheimer’s disease through enzyme inhibition, lead optimization, molecular docking and dynamic simulation approaches. Bioorg. Chem. 2019, 91, 103138. [Google Scholar] [CrossRef]
- Yun, H.Y.; Kim, D.H.; Son, S.; Ullah, S.; Kim, S.J.; Kim, Y.; Yoo, J.; Jung, Y.; Chun, P.; Moon, H.R. Design, synthesis, and anti-melanogenic effects of (E)-2-benzoyl-3-(substituted phenyl)acrylonitriles. Drug Des. Dev. Ther. 2015, 9, 4259–4268. [Google Scholar]
- Hassan, M.; Raza, H.; Abbasi, M.A.; Moustafa, A.A.; Seo, S.-Y. The exploration of novel Alzheimer’s therapeutic agents from the pool of FDA approved medicines using drug repositioning, enzyme inhibition and kinetic mechanism approaches. Biomed. Pharmacother. 2019, 109, 2513–2526. [Google Scholar] [CrossRef] [PubMed]
- Hassan, M.; Abbas, Q.; Ashraf, Z.; Moustafa, A.A.; Seo, S.-Y. Pharmacoinformatics exploration of polyphenol oxidases leading to novel inhibitors by virtual screening and molecular dynamic simulation study. Comput. Biol. Chem. 2017, 68, 131–142. [Google Scholar] [CrossRef] [PubMed]
- Dige, N.C.; Mahajan, P.G.; Raza, H.; Hassan, M.; Vanjare, B.D.; Hong, H.; Lee, K.H.; Seo, S.-Y. Ultrasound mediated efficient synthesis of new 4-oxoquinazolin-3(4H)-yl) furan-2-carboxamides as potent tyrosinase inhibitors: Mechanistic approach through chemoinformatics and molecular docking studies. Bioorg. Chem. 2019, 92, 103201. [Google Scholar] [CrossRef] [PubMed]
- Abbas, Q.; Ashraf, Z.; Hassan, M.; Nadeem, H.; Latif, M.; Afzal, S.; Seo, S.-Y. Development of highly potent melanogenesis inhibitor by in vitro, in vivo and computational studies. Drug Des. Dev. 2017, 11, 2029. [Google Scholar] [CrossRef] [Green Version]
- Pettersen, E.F.; Goddard, T.D.; Huang, C.C.; Couch, G.S.; Greenblatt, D.M.; Meng, E.C.; Ferrin, T.E. UCSF Chimera—A visualization system for exploratory research and analysis. J. Comput. Chem. 2004, 25, 1605–1612. [Google Scholar] [CrossRef] [Green Version]
- Lovell, S.C.; Davis, I.W.; Arendall, W.B., III; De Bakker, P.I.; Word, J.M.; Prisant, M.G.; Richardson, J.S.; Richardson, D.C. Structure validation by Cα geometry: ϕ, ψ and Cβ deviation. Proteins Struct. Funct. Genet. 2003, 50, 437–450. [Google Scholar] [CrossRef]
- Davis, I.W.; Leaver-Fay, A.; Chen, V.B.; Block, J.N.; Kapral, G.J.; Wang, X.; Murray, L.W.; Arendall, W.B., III; Snoeyink, J.; Richardson, J.S. MolProbity: All-atom contacts and structure validation for proteins and nucleic acids. Nucleic. Acids. Res. 2007, 35, W375–W383. [Google Scholar] [CrossRef] [Green Version]
- Discovery Studio, Version 2.1; Accelrys: San Diego, CA, USA, 2008.
- Willard, L.; Ranjan, A.; Zhang, H.; Monzavi, H.; Boyko, R.F.; Sykes, B.D.; Wishart, D.S. VADAR: A web server for quantitative evaluation of protein structure quality. Nucleic. Acids Res. 2003, 31, 3316–3319. [Google Scholar] [CrossRef]
- Lipinski, C.A. Lead- and drug-like compounds: The rule-of-five revolution. Drug Discov. Today Technol. 2004, 1, 337–341. [Google Scholar] [CrossRef]
- Dallakyan, S.; Olson, A.J. Small-molecule library screening by docking with PyRx. Methods Mol. Biol. 2015, 1263, 243–350. [Google Scholar]


| Compounds | Tyrosinase Activity IC50 ± SEM (µM) |
|---|---|
| 9a | 0.124 ± 0.077 |
| 9b | N. D |
| 9c | N. D |
| 9d | 0.219 ± 0.081 |
| 9e | 0.379 ± 0.193 |
| 9f | 0.142 ± 0.068 |
| 9g | 0.111 ± 0.021 |
| 9h | 0.098 ± 0.009 |
| 9i | N. D |
| Kojic acid (standard) | 16.832 ± 1.161 |
| Ligands | Mol. Wt. (g/mol) | No. HBA | No. HBD | Mol. LogP (mg/L) | PSA (A2) | Mol. Vol (A3) | BBB Score | Drug-Likeness Score |
|---|---|---|---|---|---|---|---|---|
| 9a | 422 | 4 | 1 | 4.74 | 47 | 372 | 3.57 | 0.23 |
| 9b | 440 | 4 | 1 | 5.00 | 47 | 378 | 3.56 | 0.27 |
| 9c | 500 | 4 | 1 | 5.77 | 47 | 394 | 3.62 | −0.01 |
| 9d | 404 | 4 | 1 | 4.56 | 47 | 366 | 3.59 | 0.10 |
| 9e | 422 | 4 | 1 | 4.81 | 47 | 372 | 3.57 | 0.09 |
| 9f | 482 | 4 | 1 | 5.59 | 47 | 388 | 3.65 | −0.17 |
| 9g | 422 | 4 | 1 | 4.44 | 47 | 371 | 3.57 | 0.20 |
| 9h | 440 | 4 | 1 | 4.70 | 47 | 377 | 3.56 | 0.16 |
| 9i | 500 | 4 | 1 | 5.47 | 47 | 393 | 3.62 | −0.07 |
| 9j | 416 | 5 | 1 | 4.31 | 55 | 391 | 3.22 | −0.47 |
| 9k | 434 | 5 | 1 | 4.57 | 55 | 397 | 3.21 | 0.01 |
| 9l | 494 | 5 | 1 | 5.34 | 55 | 413 | 3.32 | −0.18 |
Publisher’s Note: MDPI stays neutral with regard to jurisdictional claims in published maps and institutional affiliations. |
© 2022 by the authors. Licensee MDPI, Basel, Switzerland. This article is an open access article distributed under the terms and conditions of the Creative Commons Attribution (CC BY) license (https://creativecommons.org/licenses/by/4.0/).
Share and Cite
Hassan, M.; Vanjare, B.D.; Sim, K.-Y.; Raza, H.; Lee, K.H.; Shahzadi, S.; Kloczkowski, A. Biological and Cheminformatics Studies of Newly Designed Triazole Based Derivatives as Potent Inhibitors against Mushroom Tyrosinase. Molecules 2022, 27, 1731. https://0-doi-org.brum.beds.ac.uk/10.3390/molecules27051731
Hassan M, Vanjare BD, Sim K-Y, Raza H, Lee KH, Shahzadi S, Kloczkowski A. Biological and Cheminformatics Studies of Newly Designed Triazole Based Derivatives as Potent Inhibitors against Mushroom Tyrosinase. Molecules. 2022; 27(5):1731. https://0-doi-org.brum.beds.ac.uk/10.3390/molecules27051731
Chicago/Turabian StyleHassan, Mubashir, Balasaheb D. Vanjare, Kyou-Yeong Sim, Hussain Raza, Ki Hwan Lee, Saba Shahzadi, and Andrzej Kloczkowski. 2022. "Biological and Cheminformatics Studies of Newly Designed Triazole Based Derivatives as Potent Inhibitors against Mushroom Tyrosinase" Molecules 27, no. 5: 1731. https://0-doi-org.brum.beds.ac.uk/10.3390/molecules27051731