
Increase in the Intracellular Bulk Water Content in the Early Phase of Cell Death of Keratinocytes, Corneoptosis, as Revealed by 65 GHz Near-Field CMOS Dielectric Sensor

 , and
, and 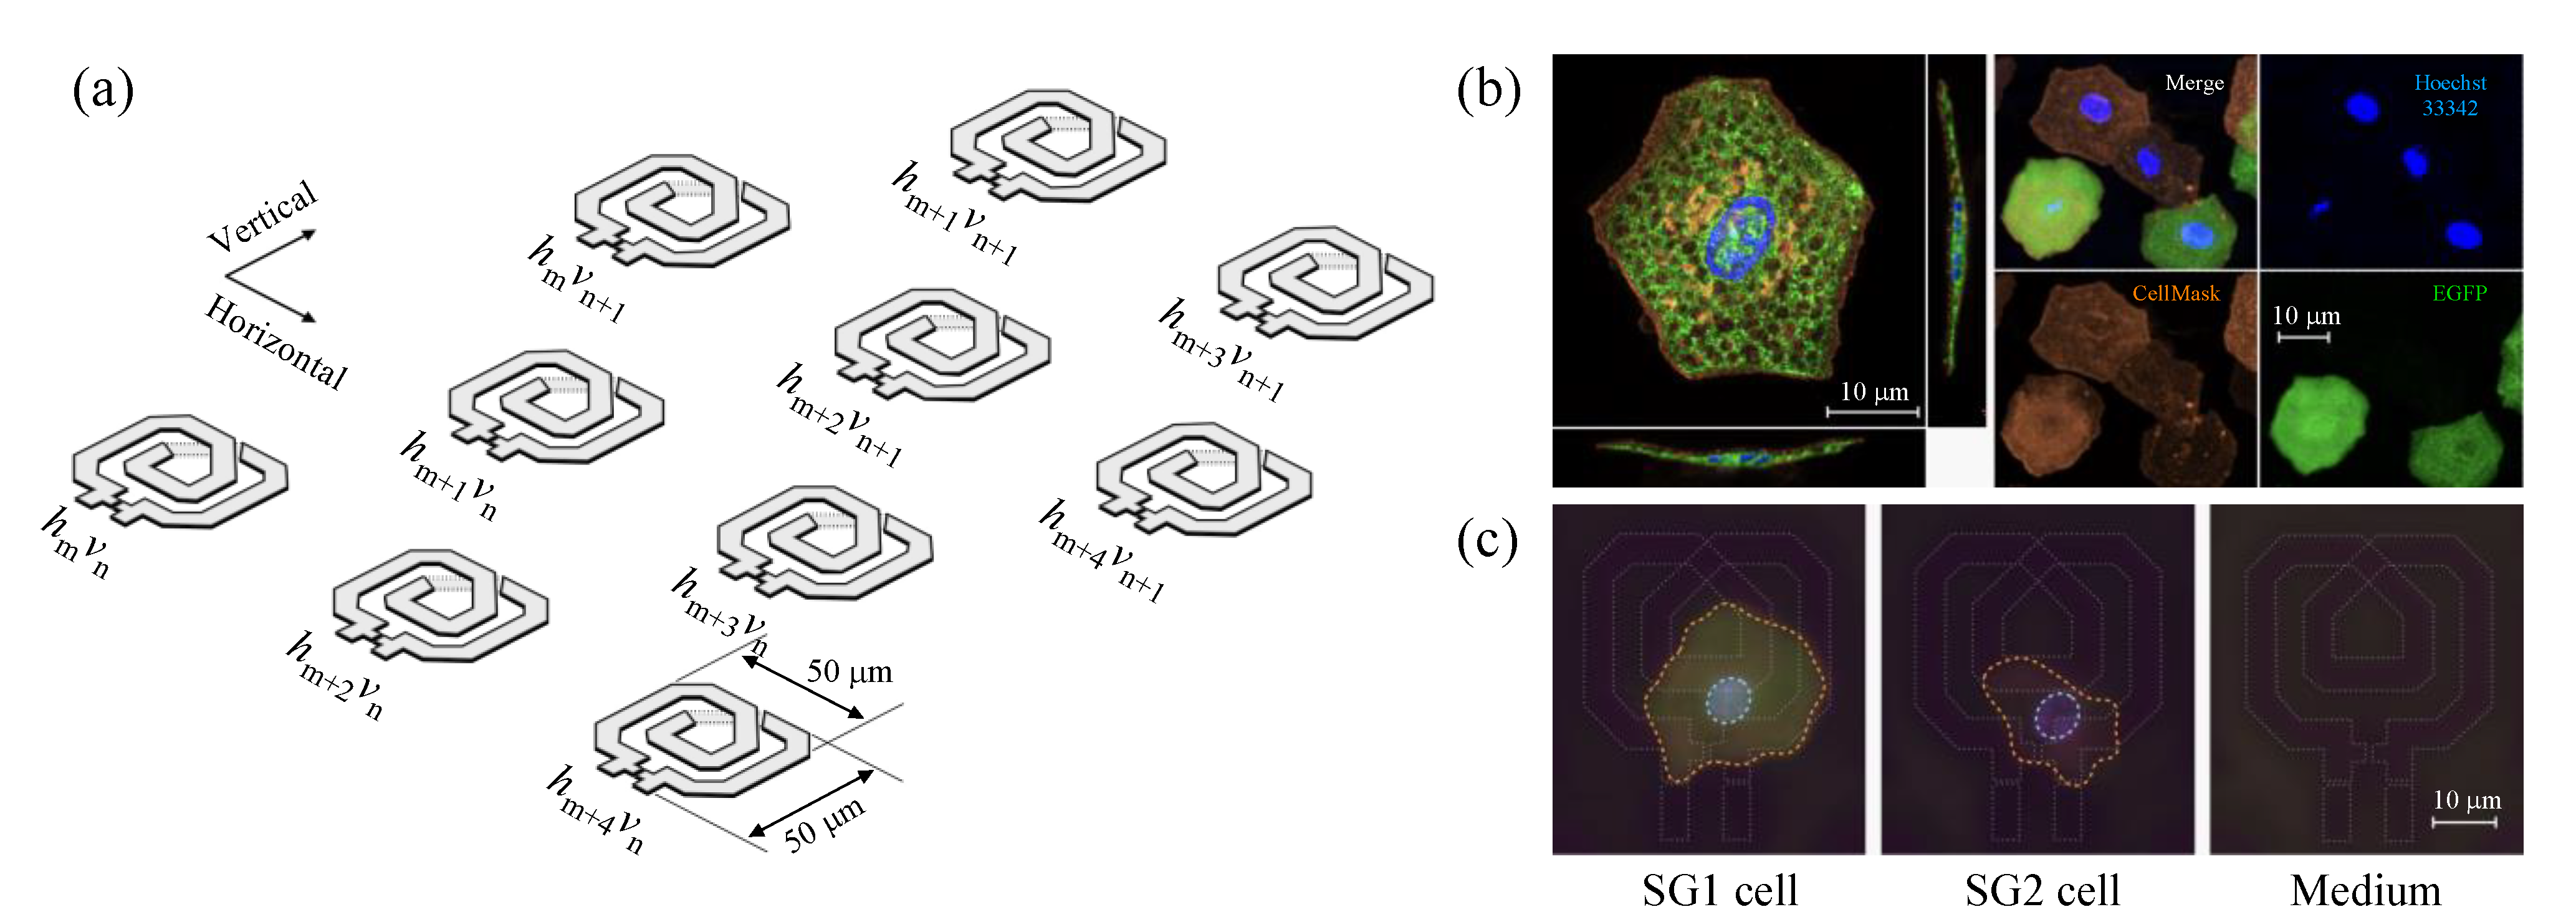
Abstract
:1. Introduction
2. Materials and Methods
2.1. Near-Field CMOS Dielectric Sensor Operating at 65 GHz
2.2. Experimental Setup of Fluorescence Imaging
2.3. Preparation of SG1/SG2 Cell Suspension
2.4. Simultaneous Evaluation of SG1 Cell Death by Dielectric Sensor and Microscopy
3. Results and Discussion
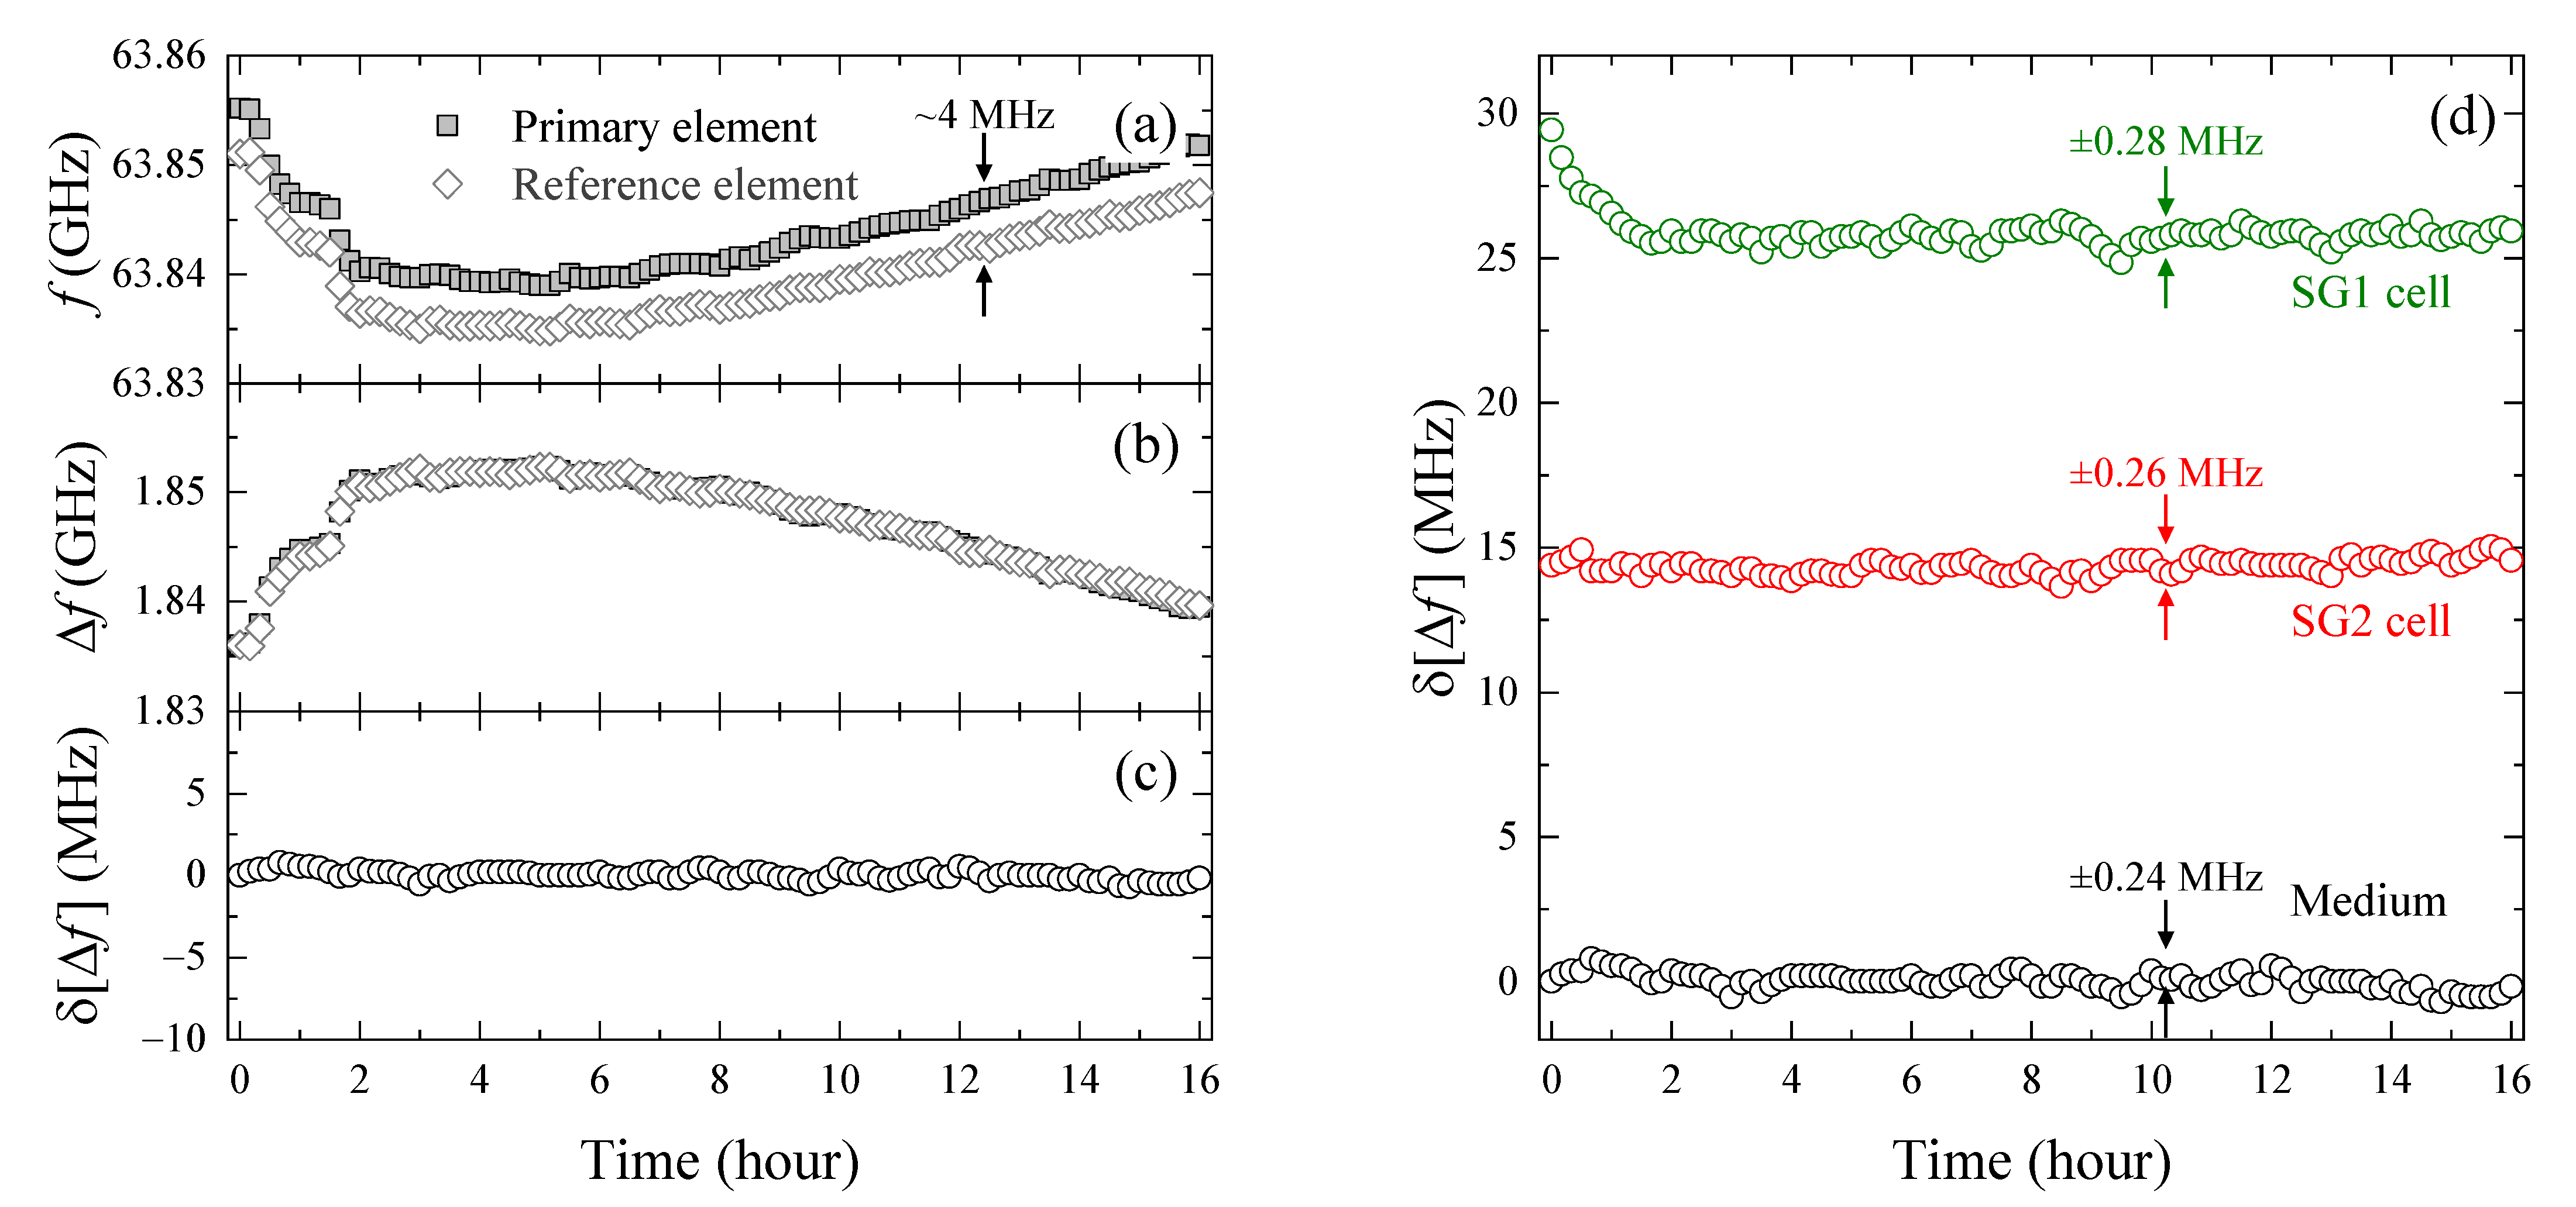
3.1. Establishment of a High-Precision Evaluation for Resonant Frequency Changes
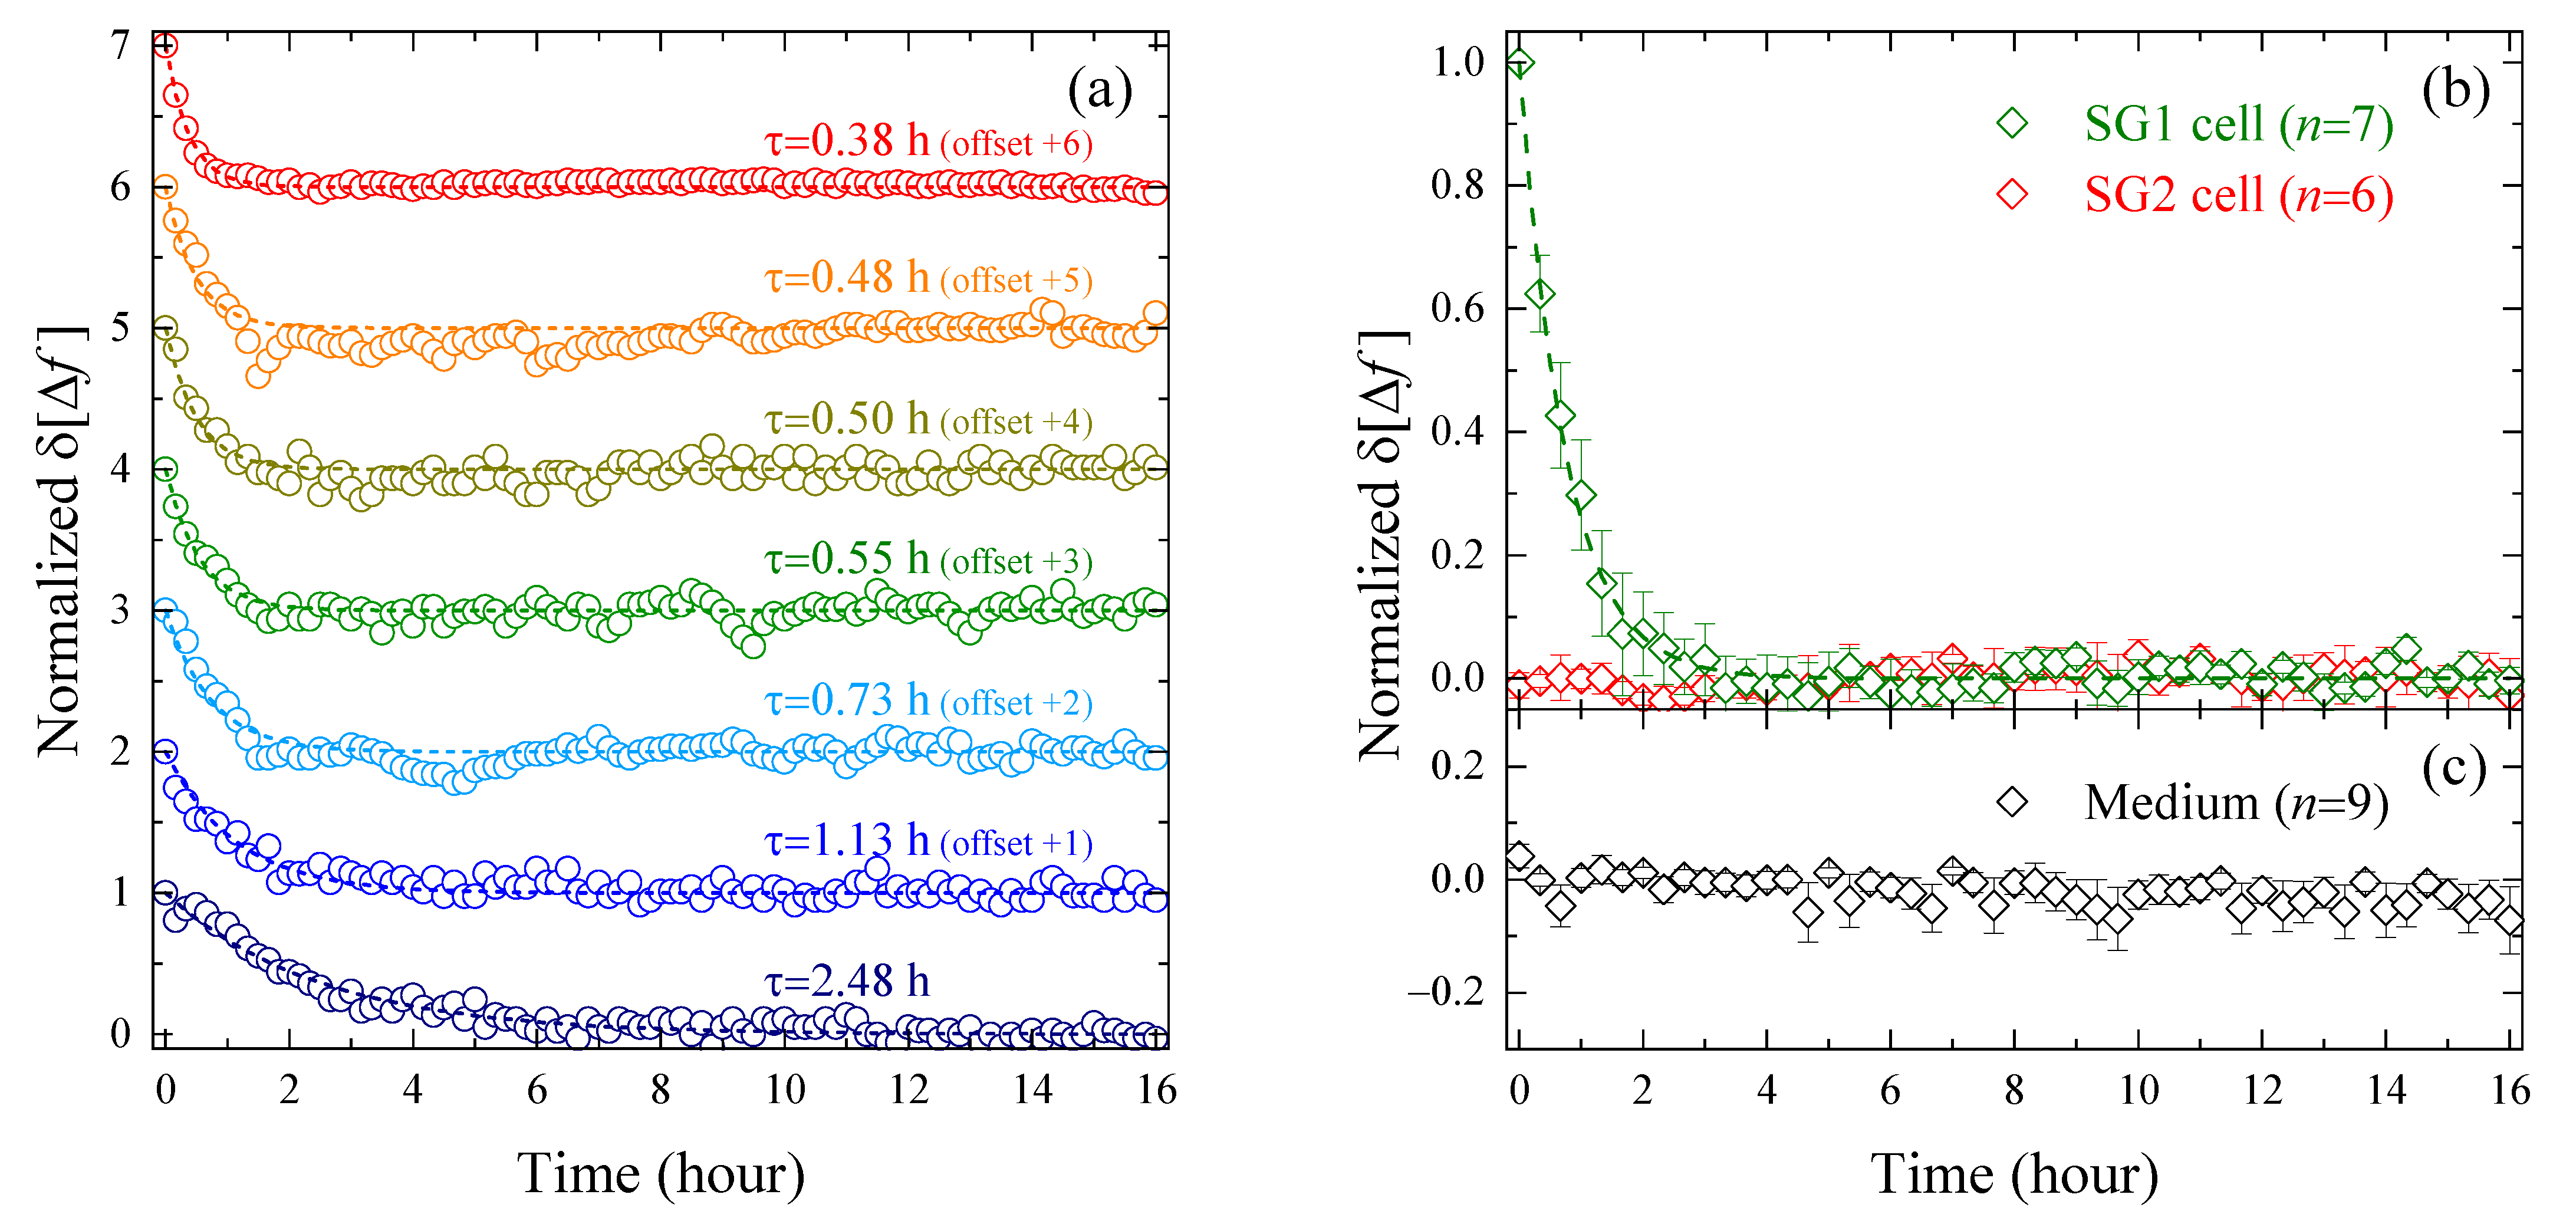
3.2. Evaluation of Intracellular Bulk Water Content Changes during SG1 Cell Death
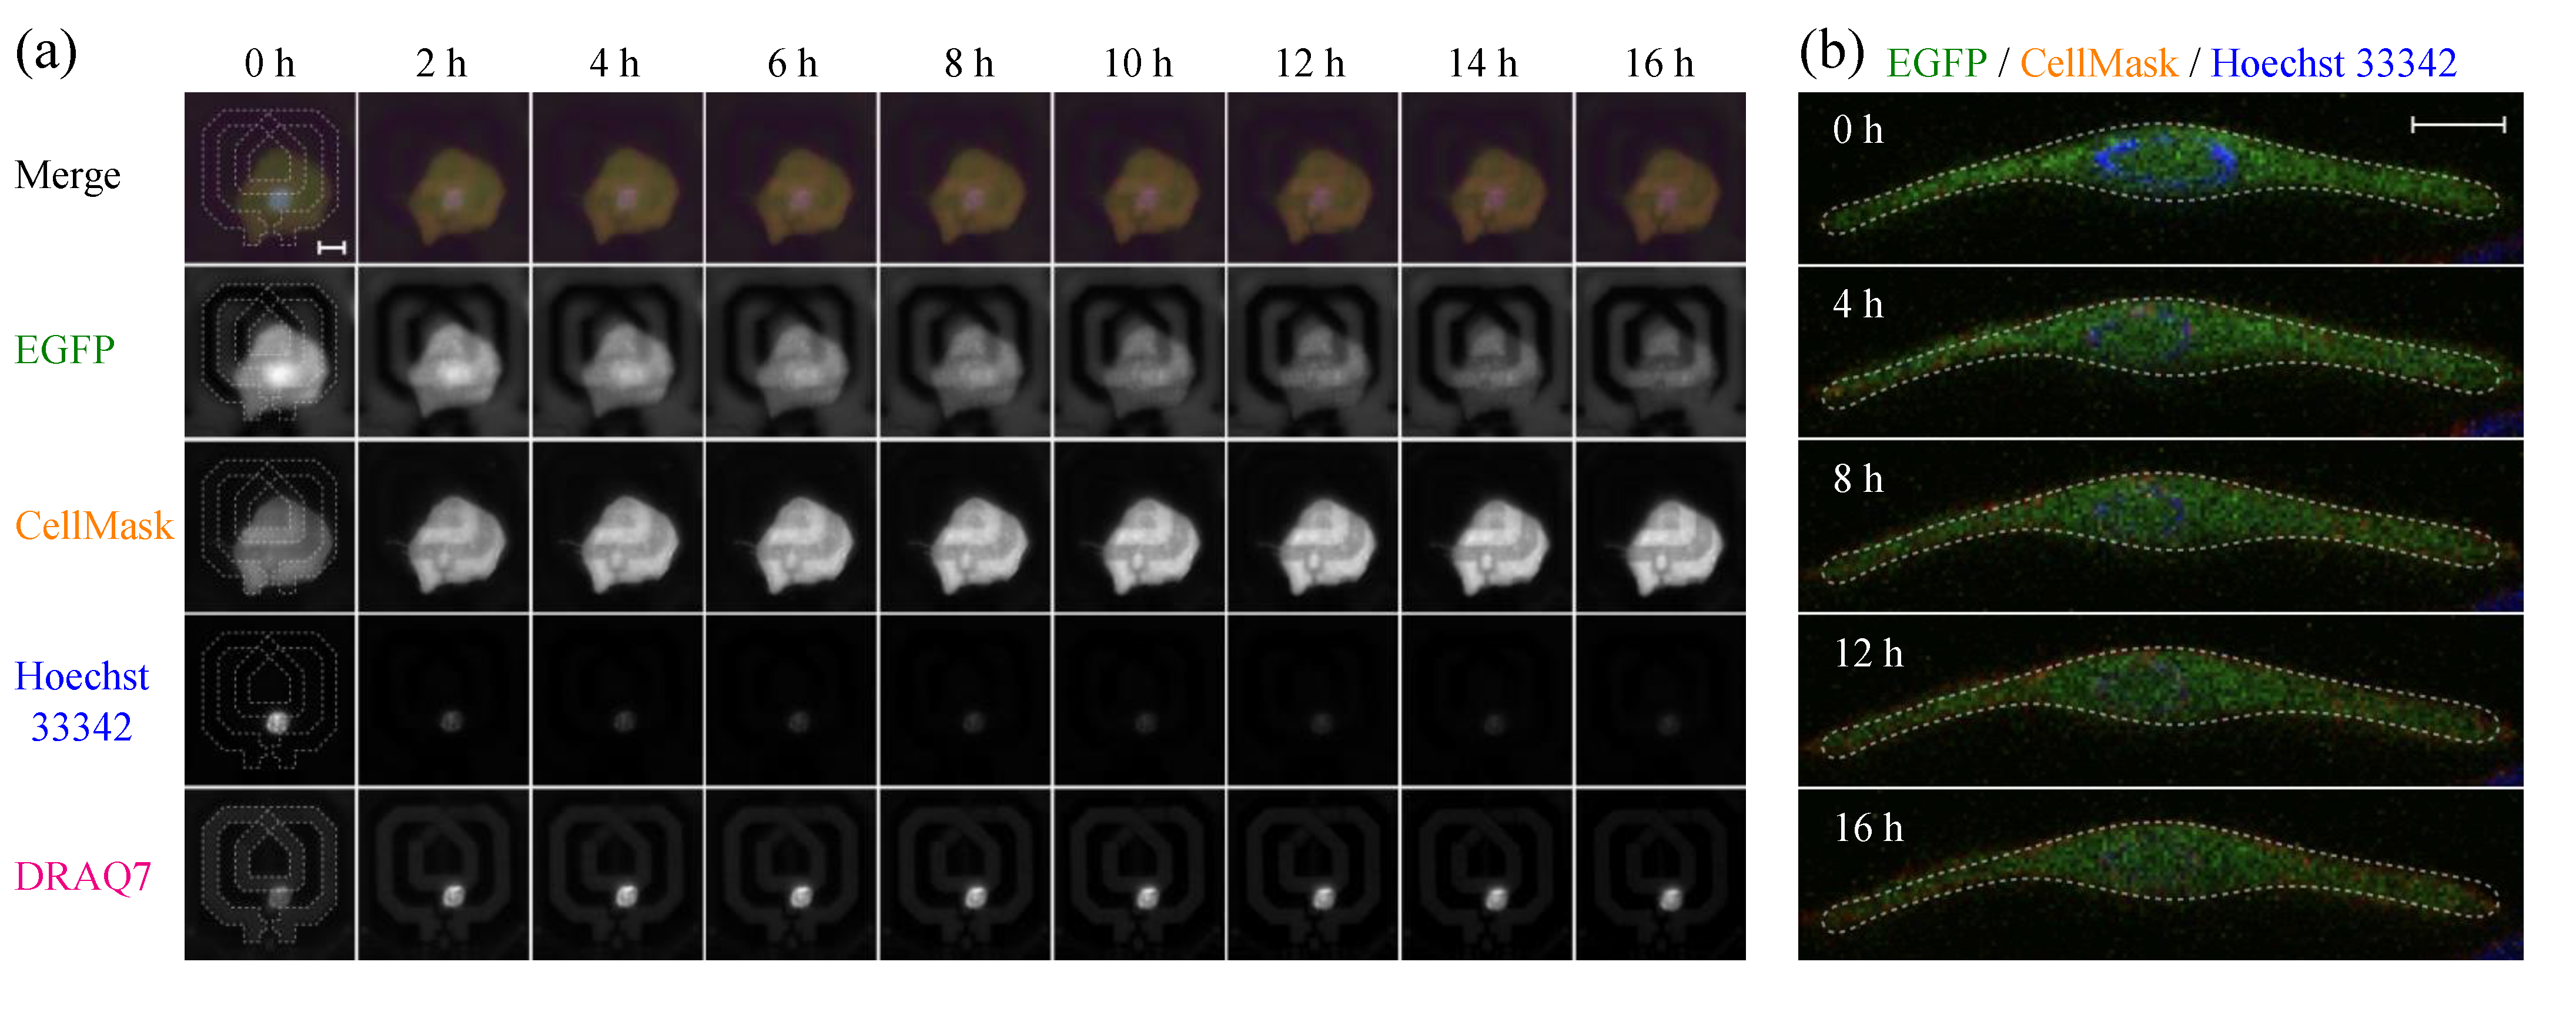
3.3. Comparison of Changes in Intracellular Water and Cell Membrane Permeability
4. Conclusions
Author Contributions
Funding
Institutional Review Board Statement
Informed Consent Statement
Data Availability Statement
Acknowledgments
Conflicts of Interest
Sample Availability
References
- Ball, P. Water as an Active Constituent in Cell Biology. Chem. Rev. 2008, 108, 74–108. [Google Scholar] [CrossRef] [PubMed]
- Chaplin, M. Do We Underestimate the Importance of Water in Cell Biology? Nat. Rev. Mol. Cell Biol. 2006, 7, 861–866. [Google Scholar] [CrossRef] [PubMed]
- Wiggins, P. High and Low Density Water and Resting, Active and Transformed Cells. Cell Biol. Int. 1996, 20, 429–435. [Google Scholar] [CrossRef] [PubMed]
- Häussinger, D. The Role of Cellular Hydration in the Regulation of Cell Function. Biochem. J. 1996, 313, 697–710. [Google Scholar] [CrossRef] [PubMed] [Green Version]
- Davidson, R.M.; Lauritzen, A.; Seneff, S. Biological Water Dynamics and Entropy: A Biophysical Origin of Cancer and Other Diseases. Entropy 2013, 15, 3822–3876. [Google Scholar] [CrossRef] [Green Version]
- Fullerton, G.D.; Cameron, I.L. Water Compartments in Cells. In Methods in Enzymology; Academic Press Inc.: Cambridge, MA, USA, 2007; Volume 428, pp. 1–28. ISBN 9780123739216. [Google Scholar]
- Mentré, P. Water in the Orchestration of the Cell Machinery. Some Misunderstandings: A Short Review. J. Biol. Phys. 2012, 38, 13–26. [Google Scholar] [CrossRef] [Green Version]
- Ford, R.C.; Ruffle, S.V.; Ramirez-Cuesta, A.J.; Michalarias, I.; Beta, I.; Miller, A.; Li, J. Inelastic Incoherent Neutron Scattering Measurements of Intact Cells and Tissues and Detection of Interfacial Water. J. Am. Chem. Soc. 2004, 126, 4682–4688. [Google Scholar] [CrossRef]
- Tehei, M.; Franzetti, B.; Wood, K.; Gabel, F.; Fabiani, E.; Jasnin, M.; Zamponi, M.; Oesterhelt, D.; Zaccai, G.; Ginzburg, M.; et al. Neutron Scattering Reveals Extremely Slow Cell Water in a Dead Sea Organism. Proc. Natl. Acad. Sci. USA 2007, 104, 766–771. [Google Scholar] [CrossRef] [Green Version]
- Stadler, A.M.; Embs, J.P.; Digel, I.; Artmann, G.M.; Unruh, T.; Büldt, G.; Zaccai, G. Cytoplasmic Water and Hydration Layer Dynamics in Human Red Blood Cells. J. Am. Chem. Soc. 2008, 130, 16852–16853. [Google Scholar] [CrossRef]
- Persson, E.; Halle, B. Cell Water Dynamics on Multiple Time Scales. Proc. Natl. Acad. Sci. USA 2008, 105, 6266–6271. [Google Scholar] [CrossRef] [Green Version]
- Sebastiani, F.; Orecchini, A.; Paciaroni, A.; Jasnin, M.; Zaccai, G.; Moulin, M.; Haertlein, M.; de Francesco, A.; Petrillo, C.; Sacchetti, F. Collective THz Dynamics in Living Escherichia Coli Cells. Chem. Phys. 2013, 424, 84–88. [Google Scholar] [CrossRef]
- Martins, M.L.; Dinitzen, A.B.; Mamontov, E.; Rudić, S.; Pereira, J.E.M.; Hartmann-Petersen, R.; Herwig, K.W.; Bordallo, H.N. Water Dynamics in MCF-7 Breast Cancer Cells: A Neutron Scattering Descriptive Study. Sci. Rep. 2019, 9, 8704. [Google Scholar] [CrossRef] [PubMed]
- Martins, M.L.; Bordallo, H.N.; Arrese-Igor, S.; Alegría, A.; Colmenero de Leon, J. Effect of Paclitaxel in the Water Dynamics of MCF-7 Breast Cancer Cells Revealed by Dielectric Spectroscopy. ACS Omega 2020, 5, 18602–18607. [Google Scholar] [CrossRef] [PubMed]
- Shiraga, K.; Ogawa, Y.; Suzuki, T.; Kondo, N.; Irisawa, A.; Imamura, M. Determination of the Complex Dielectric Constant of an Epithelial Cell Monolayer in the Terahertz Region. Appl. Phys. Lett. 2013, 102, 053702. [Google Scholar] [CrossRef] [Green Version]
- Shiraga, K.; Ogawa, Y.; Suzuki, T.; Kondo, N.; Irisawa, A.; Imamura, M. Characterization of Dielectric Responses of Human Cancer Cells in the Terahertz Region. J. Infrared Millim. Terahertz Waves 2014, 35, 493–502. [Google Scholar] [CrossRef] [Green Version]
- Shiraga, K.; Suzuki, T.; Kondo, N.; Tanaka, K.; Ogawa, Y. Hydration State inside HeLa Cell Monolayer Investigated with Terahertz Spectroscopy. Appl. Phys. Lett. 2015, 106, 253701. [Google Scholar] [CrossRef] [Green Version]
- Shiraga, K.; Ogawa, Y.; Kondo, N. Hydrogen Bond Network of Water around Protein Investigated with Terahertz and Infrared Spectroscopy. Biophys. J. 2016, 111, 2629–2641. [Google Scholar] [CrossRef] [Green Version]
- Shiraga, K.; Tanaka, K.; Arikawa, T.; Saito, S.; Ogawa, Y. Reconsideration of the Relaxational and Vibrational Line Shapes of Liquid Water Based on Ultrabroadband Dielectric Spectroscopy. Phys. Chem. Chem. Phys. 2018, 20, 26200–26209. [Google Scholar] [CrossRef]
- Shiraga, K.; Urabe, M.; Matsui, T.; Kikuchi, S.; Ogawa, Y. Highly Precise Characterization of the Hydration State upon Thermal Denaturation of Human Serum Albumin Using a 65 GHz Dielectric Sensor. Phys. Chem. Chem. Phys. 2020, 22, 19468–19479. [Google Scholar] [CrossRef]
- Shiraga, K.; Fujii, Y.; Koreeda, A.; Tanaka, K.; Arikawa, T.; Ogawa, Y. Dynamical Collectivity and Nuclear Quantum Effects on the Intermolecular Stretching Mode of Liquid Water. J. Phys. Chem. B 2021, 125, 1632–1639. [Google Scholar] [CrossRef]
- Mitsunaka, T.; Sato, D.; Ashida, N.; Saito, A.; Iizuka, K.; Suzuki, T.; Ogawa, Y.; Fujishima, M. CMOS Biosensor IC Focusing on Dielectric Relaxations of Biological Water With 120 and 60 GHz Oscillator Arrays. IEEE J. Solid-State Circuits 2016, 51, 2534–2544. [Google Scholar] [CrossRef]
- Matsui, T.; Kadono-Maekubo, N.; Suzuki, Y.; Furuichi, Y.; Shiraga, K.; Sasaki, H.; Ishida, A.; Takahashi, S.; Okada, T.; Toyooka, K.; et al. A Unique Mode of Keratinocyte Death Requires Intracellular Acidification. Proc. Natl. Acad. Sci. USA 2021, 118, e2020722118. [Google Scholar] [CrossRef] [PubMed]
- Moore, J.L.; Greco, V. Functional Cell Death, Corneoptosis, Requires Temporally Controlled Intracellular Acidification. Proc. Natl. Acad. Sci. USA 2021, 118, e2106633118. [Google Scholar] [CrossRef] [PubMed]
- Yokouchi, M.; Atsugi, T.; van Logtestijn, M.; Tanaka, R.J.; Kajimura, M.; Suematsu, M.; Furuse, M.; Amagai, M.; Kubo, A. Epidermal Cell Turnover across Tight Junctions Based on Kelvin’s Tetrakaidecahedron Cell Shape. eLIFE 2016, 5, e19593. [Google Scholar] [CrossRef] [PubMed] [Green Version]
- Buchner, R.; Barthel, J.; Stauber, J. The Dielectric Relaxation of Water between 0 °C and 35 °C. Chem. Phys. Lett. 1999, 306, 57–63. [Google Scholar] [CrossRef]
- Tsao, M.C.; Walthall, B.J.; Ham, R.G. Clonal Growth of Normal Human Epidermal Keratinocytes in a Defined Medium. J. Cell. Physiol. 1982, 110, 219–229. [Google Scholar] [CrossRef]
- Boyce, S.T.; Ham, R.G. Calcium-Regulated Differentiation of Normal Human Epidermal Keratinocytes in Chemically Defined Clonal Culture and Serum-Free Serial Culture. J. Investig. Dermatol. 1983, 81, S33–S40. [Google Scholar] [CrossRef] [Green Version]
- Galluzzi, L.; Vitale, I.; Aaronson, S.A.; Abrams, J.M.; Adam, D.; Agostinis, P.; Alnemri, E.S.; Altucci, L.; Amelio, I.; Andrews, D.W.; et al. Molecular Mechanisms of Cell Death: Recommendations of the Nomenclature Committee on Cell Death 2018. Cell Death Differ. 2018, 25, 486–541. [Google Scholar] [CrossRef]
- Bortner, C.D.; Cidlowski, J.A. Ions, the Movement of Water and the Apoptotic Volume Decrease. Front. Cell Dev. Biol. 2020, 8, 611211. [Google Scholar] [CrossRef]
- McCarthy, J.V.; Cotter, T.G. Cell Shrinkage and Apoptosis: A Role for Potassium and Sodium Ion Efflux. Cell Death Differ. 1997, 4, 756–770. [Google Scholar] [CrossRef] [Green Version]
- Day, R.E.; Kitchen, P.; Owen, D.S.; Bland, C.; Marshall, L.; Conner, A.C.; Bill, R.M.; Conner, M.T. Human Aquaporins: Regulators of Transcellular Water Flow. Biochim. Biophys. Acta (BBA)-Gen. Subj. 2014, 1840, 1492–1506. [Google Scholar] [CrossRef] [PubMed] [Green Version]
- Bragulla, H.H.; Homberger, D.G. Structure and Functions of Keratin Proteins in Simple, Stratified, Keratinized and Cornified Epithelia. J. Anat. 2009, 214, 516–559. [Google Scholar] [CrossRef] [PubMed]
- Candi, E.; Schmidt, R.; Melino, G. The Cornified Envelope: A Model of Cell Death in the Skin. Nat. Rev. Mol. Cell Biol. 2005, 6, 328–340. [Google Scholar] [CrossRef] [PubMed]
- Ben-Naim, A. Molecular Recognition—Viewed through the Eyes of the Solvent. Biophys. Chem. 2002, 101–102, 309–319. [Google Scholar] [CrossRef]
- Li, Z.; Lazaridis, T. The Effect of Water Displacement on Binding Thermodynamics: Concanavalin A. J. Phys. Chem. B 2005, 109, 662–670. [Google Scholar] [CrossRef]
- Grossman, M.; Born, B.; Heyden, M.; Tworowski, D.; Fields, G.B.; Sagi, I.; Havenith, M. Correlated Structural Kinetics and Retarded Solvent Dynamics at the Metalloprotease Active Site. Nat. Struct. Mol. Biol. 2011, 18, 1102–1108. [Google Scholar] [CrossRef] [Green Version]
- Sidhaye, V.K.; Guler, A.D.; Schweitzer, K.S.; D’Alessio, F.; Caterina, M.J.; King, L.S. Transient Receptor Potential Vanilloid 4 Regulates Aquaporin-5 Abundance under Hypotonic Conditions. Proc. Natl. Acad. Sci. USA 2006, 103, 4747–4752. [Google Scholar] [CrossRef] [Green Version]
- Conner, M.T.; Conner, A.C.; Bland, C.E.; Taylor, L.H.J.; Brown, J.E.P.; Parri, H.R.; Bill, R.M. Rapid Aquaporin Translocation Regulates Cellular Water Flow. J. Biol. Chem. 2012, 287, 11516–11525. [Google Scholar] [CrossRef] [Green Version]
- Zaccai, G. Molecular Dynamics in Cells: A Neutron View. Biochim. Biophys. Acta (BBA)-Gen. Subj. 2020, 1864, 129475. [Google Scholar] [CrossRef]


Publisher’s Note: MDPI stays neutral with regard to jurisdictional claims in published maps and institutional affiliations. |
© 2022 by the authors. Licensee MDPI, Basel, Switzerland. This article is an open access article distributed under the terms and conditions of the Creative Commons Attribution (CC BY) license (https://creativecommons.org/licenses/by/4.0/).
Share and Cite
Shiraga, K.; Ogawa, Y.; Kikuchi, S.; Amagai, M.; Matsui, T. Increase in the Intracellular Bulk Water Content in the Early Phase of Cell Death of Keratinocytes, Corneoptosis, as Revealed by 65 GHz Near-Field CMOS Dielectric Sensor. Molecules 2022, 27, 2886. https://0-doi-org.brum.beds.ac.uk/10.3390/molecules27092886
Shiraga K, Ogawa Y, Kikuchi S, Amagai M, Matsui T. Increase in the Intracellular Bulk Water Content in the Early Phase of Cell Death of Keratinocytes, Corneoptosis, as Revealed by 65 GHz Near-Field CMOS Dielectric Sensor. Molecules. 2022; 27(9):2886. https://0-doi-org.brum.beds.ac.uk/10.3390/molecules27092886
Chicago/Turabian StyleShiraga, Keiichiro, Yuichi Ogawa, Shojiro Kikuchi, Masayuki Amagai, and Takeshi Matsui. 2022. "Increase in the Intracellular Bulk Water Content in the Early Phase of Cell Death of Keratinocytes, Corneoptosis, as Revealed by 65 GHz Near-Field CMOS Dielectric Sensor" Molecules 27, no. 9: 2886. https://0-doi-org.brum.beds.ac.uk/10.3390/molecules27092886