1. Introduction
Essential oils (EOs) are the major components of many medicinal and aromatic plants of Lamiaceae. In addition to these main substances, aromatic spices and medicinal plants, such as oregano and marjoram, contain significant amounts of phenolic antioxidants, such as hydroxycinnamic and flavonoid compounds. Thymol and carvacrol are two valuable aromatic monoterpenes with different applications in the food and pharmaceutical industries [
1]. These components have been found mainly in some medicinal and spice plants, such as thyme [
2], oregano [
3], and ajowan [
4] seeds. Today, the production of a large quantity of essential oils as well as phenolic compounds under control conditions is of great interest in the context of their use as spices, food antioxidants, and biopreservatives, as well as food supplements and pharmaceuticals for preventing diseases associated with oxidative stress.
Marjoram (
Origanum majorana) originates from the eastern Mediterranean, whereas Oregano (
O. vulgare L.) occurs naturally in most of Eurasia. Both are perennial species of Lamiaceae, cultivated mostly in Mediterranean regions but also further north. These aromatic plants have been used as spices for special flavoring in foods. The major components of these plants include thymol, carvacrol, and methyleugenol [
5]. Different applications of these components as spices in food technology have been reported for their desirable aroma [
6]. Besides food applications, antioxidant, antifungal, antibacterial, and anti-inflammatory activities of these components that are valuable in the production of drugs have been widely mentioned in the literature [
7]. Therefore, increasing and improving these compounds in oregano has been considered a major goal for many industrial producers.
Light is the essential factor that controls the growth, development, and metabolism of plants, which are affected by irradiance at all stages of growth [
8]. Variable light conditions are important in various latitudes and are related to global climate changes as well. Various wavelengths can influence the metabolism in a complex way and excess irradiation by certain spectra can trigger detrimental oxidative processes in the organism. Therefore, understanding the relationships between the light spectrum and the chemical composition of aromatic constituents in industrially valuable plants is important. In this regard, the use of different light-emitting diode (LED) systems provided new insights into the control of metabolic profiles in medicinal and aromatic plants [
9]. LEDs with different wavelengths and energy density (flounce) of light can provide various environmental conditions that influence plant metabolism. Some LED frequencies can be used as signaling factors to increase the essential oils and polyphenolic compounds content [
10]. The use of LEDs to improve phytochemical composition has been reported in many medicinal and aromatic plants, including
Thymus vulgaris [
11],
Melissa officinalis [
10],
Ocimum basilicum [
12],
Perovskia abrotanoides [
13], and
Mentha longifolia [
14]. However, there are no reports on the effects of LED illumination on phytochemical composition and antioxidant activity in oregano and marjoram.
The goals of this research were to assess the influence of four light spectra: red, blue, blue-red, and white on essential oil yield, chemical composition, phenolic, and flavonoid content, and the antioxidant capacity of these two species based on two antioxidant model systems.
2. Results and Discussion
2.1. Essential Oil Content
Analysis of variance revealed significant differences for oil, phenolic, flavonoid, and antioxidant capacity (
Table 1). The oil content showed a significant variation as a result of the LED treatments. The highest and lowest oil content were obtained in red (OV = 2.89) and white (OM = 0.94) light, respectively. However, the two studied species revealed different responses to light treatments. In O. vulgare, the highest oil content was observed in red light, while the lowest was obtained in blue light (
Figure 1). In O. majorana, the blue-red treatment led to an elevated oil content compared to others (
Figure 1).
Both species revealed different trends in terms of oil content in different spectra (
Figure 1). In the previous research, red and blue-red illumination resulted in a higher increase in oil content than the other light spectra such as
Thymus in red light [
11],
Mentha longifolia [
14], and
Ocimum gratissimum [
15]. However, in another species of Lamiaceae,
Perovskia abrotanoides, the essential oil content increased in response to white light [
13].
The probable mechanism for red light is that it can induce oil biosynthesis through exogenous primary precursors through stimulation. Another possible interpretation is that the wavelength of light might lead to an increase in oil content as a stress condition [
11]. In Lamiaceae, secretory trichomes are the main source of essential oil, thus it can be suggested that light can affect trichome morphology and distribution. Similar effects were also observed in thyme [
11] and
Ocimum [
15]. Secretory tissues in the Lamiaceae family are considered the most important tissue for the accumulation of essential oils. The glandular trichomes are determined as the site of oil production. High energy lights can destroy this trichome structure and lead to the release of oils [
16]. However, trichome morphology and distribution are considered crucial factors affecting oil production [
17]. Finally, most plants can display an acclimation strategy, such as altering their essential oil content to cope with different lighting conditions as the mechanisms of stress response [
10].
2.2. Essential Oil Composition
High variation was observed between treatments. The main oil components in the two studied species were thymol, terpinen-4-ol, sabinene, linalool,
p-cymene, and γ-terpinene (
Table 2). In oregano, the thymol content ranged from 11.91% in control to 48.26% in blue light, while in marjoram it varied from 17.47% in red to 35.06% in blue-red light. In a similar experiment in four Thymus species, Tohidi et al. [
11] revealed that blue light was more effective in increasing the thymol content, similar to the values obtained for oregano. A similar trend was also observed for p-cymene (
Table 2). However, these trends could be variable in different species. In the present investigation, thymol and linalool were decreased in marjoram treated with red light (
Table 2), while Nguyen and Saleh [
18] also revealed an increase in α-pinene, limonene, and carvone in mint under red light. Furthermore, in oregano, blue light led to a decrease in p-cymene and an increase in thymol content. Previous literature also confirmed that blue LED lights can cause oxidative damage in some compounds and their conversion [
18]. For example, in oregano, thymol production is promoted by increased consumption of
p-cymene as a substrate (
Table 2).
The composition can be affected by many environmental factors, including the period of light, the intensity, and the range in the light spectrum [
10]. Most of the detected compounds are monoterpenes. A probable interpretation for the increase in monoterpenes as secondary metabolites is a stress condition causing the plant to produce a greater number of compounds. A lower wavelength spectrum, such as blue light, has higher energy, and consequently, high energy can act as stress for the plant [
10]. According to the energy dissipation mechanism suggested by Selmar and Kirinwächter [
19] and described by Gharibi et al. [
20], the exceeded energy of CO
2 fixation can be applied for the production of specific, nonprimary metabolites, and the high energy wavelength can lead to increased monoterpene production through the mevalonic acid (MVA) and methylerythritol phosphate (MEP) pathways [
10].
Moreover, the production as well as isomer conformation can perform a crucial role in the decrease or increase in the production of a final product through light treatments [
13]. For example, Ahmadi et al. [
10] showed blue-red light as the main treatment to increase the monoterpenes. However, some researchers have reported that chemotypes and plant species are more important factors for oil component variation [
21].
2.3. Total Phenolic and Flavonoid Content
A high variation was obtained between treatments in both species. In oregano, the highest and lowest TPC was under blue (61.26 mg of tannic acid E/g DW) and white (21.74 mg of TAE/g DW) light, respectively. In marjoram, it ranged from 20.50 in blue-red to 65.18 (mg TAE/g DW) in white light. The highest and lowest flavonoid content (TFC) was obtained in blue-red and white light, respectively (
Table 3). Ghaffari et al. [
13] also showed an increase in TFC and TPC in
Perovskia abrotanoides as a result of being affected by blue light. Hinds et al. [
22] revealed an increase in the polyphenolic content of black peppercorns in all the studied lights. Flavonoids and other phenolic compounds can increase in response to stress, and in the present research, blue-red and blue light were more effective in increasing such components in both studied species. Based on a review report, the response of plants can be different for the accumulation of polyphenolic compounds according to species, organ, phenological stage, and light intensities [
23]. Darko et al. [
24] highlighted the role of blue and red light in activating the xanthophyll cycle and inducing stress in plants. Liu et al. [
25] also revealed that blue light can greatly increase the number of phenolic compounds in plants. In particular, it was suggested that blue light mainly increases the content of simple phenols, such as chlorogenic, gallic acid, and flavonoids [
26].
2.4. DPPH Scavenging Activity
The highest antioxidant activity (lowest EC
50) was observed in the DPPH scavenging assay in oregano for white LED light, while for marjoram, it was obtained under blue-red illumination (
Table 3). Tohidi et al. [
11] showed different reactions of species to antioxidant activity. In some cases, blue light increased the antioxidant activity of some plants such as Plectranthus amboinicus [
27]. In our study, the higher total phenolic content was not directly correlated with antiradical activity, suggesting a selective increase in stronger antioxidants under specific conditions.
2.5. Inhibition of β-Carotene Bleaching
A similar trend as the one in the DPPH assay results was also observed in this model (
Figure 2). The presence of different antioxidants can hinder β-carotene bleaching by quenching free radicals in the reaction mixture [
28].
O. vulgare in the control possessed a high inhibition of β-carotene (79.3%). In this method, all extracts showed a greater ability to prevent oxidation of fatty acids than BHT at the same concentration (
Figure 2).
LEDs can be a stressful condition for plants, so in these conditions, reactive oxygen species (ROS) can accumulate in plant organs. Consequently, metabolic activity will be elevated to protect plants against moderate photooxidative stress induced by LEDs [
10,
29]. Based on the previous literature, there are different trends regarding the use of LEDs on antioxidant activity of plants. For example, in lemon balm, blue-red LEDs revealed the highest effect on increasing ROS scavenging [
10], while red light showed an increasing effect on DPPH removal activity in lettuce [
30]. In pea sprouts, blue light led to a significant increase in antioxidant activity [
25].
2.6. Physiological Traits
Chlorophyll a, chlorophyll b, and carotenoids concentrations were elevated under LED lights as compared with a control condition. Additionally, the activity of antioxidant enzymes, including catalase, guaiacol peroxidase, ascorbate peroxidase, as well as proline increased their concentration (
Table 4).
The highest amount of chlorophyll a, chlorophyll b, and carotenoids was calculated in blue light for both species. The treatments of OM-B (0.78 mg g
−1) and OV-V (0.71 mg g
−1) displayed the highest amount in chlorophyll a, respectively. The highest (0.16 mg g
−1) and lowest (0.08 mg g
−1) amount in chlorophyll b were recorded in the OV-B and OM-R treatments, respectively (
Table 4). The evaluation of antioxidant enzymes activity revealed that the highest amount of catalase was reported in OM-B (0.68 units mg
−1 protein) and the lowest in OV-C (0.13 units mg
−1 protein) (
Table 4). In addition, the highest and lowest amount of guaiacol peroxidase were recorded in OV-B and OM-R, respectively. The highest amount of proline was reported in OV-B (0.65 μmolg
−1), while the lowest was in OV-C (0.15 μmolg
−1) (
Table 4). OV-BR (5.13 units mg
−1 protein) and OM-C (1.17 units mg
−1 protein) demonstrated the highest and lowest amount of ascorbate peroxidase, respectively (
Table 4).
Based on previously published literature, antioxidant enzymes increase for the purpose of defending against stress conditions that might be related to different factors like reactive oxygen species (ROS) [
13]. In the present research, some light wavelengths such as the blue one provides a stress condition for plants that leads to the accumulation of more antioxidant enzymes. Another interpretation of such results is the high energy of a lower wavelength might lead to the increase of stress [
13]. A similar trend is also obvious for other pigments such as carotenoids as well as stress related amino acids such as proline.
2.7. Multivariate Analysis
Species, treatment, and components were classified according to the principal component analysis (PCA) (
Figure 3). Accordingly, three groups were obtained. Group 1 consisted of OV (C), OV (W), OM (C), and OM (W); Group 2 included OV (B), OV (R), and OV (BR); whereas OM (B), OM (BR), and OM (R) were classified into the third group. Group 1 included high essential oil samples, while Group 2 possesses a high thymol, carvacrol, and TPC content. Group 3 was marjoram with a high content of linalool, sabinene, terpinen-4-ol, and high TFC content.
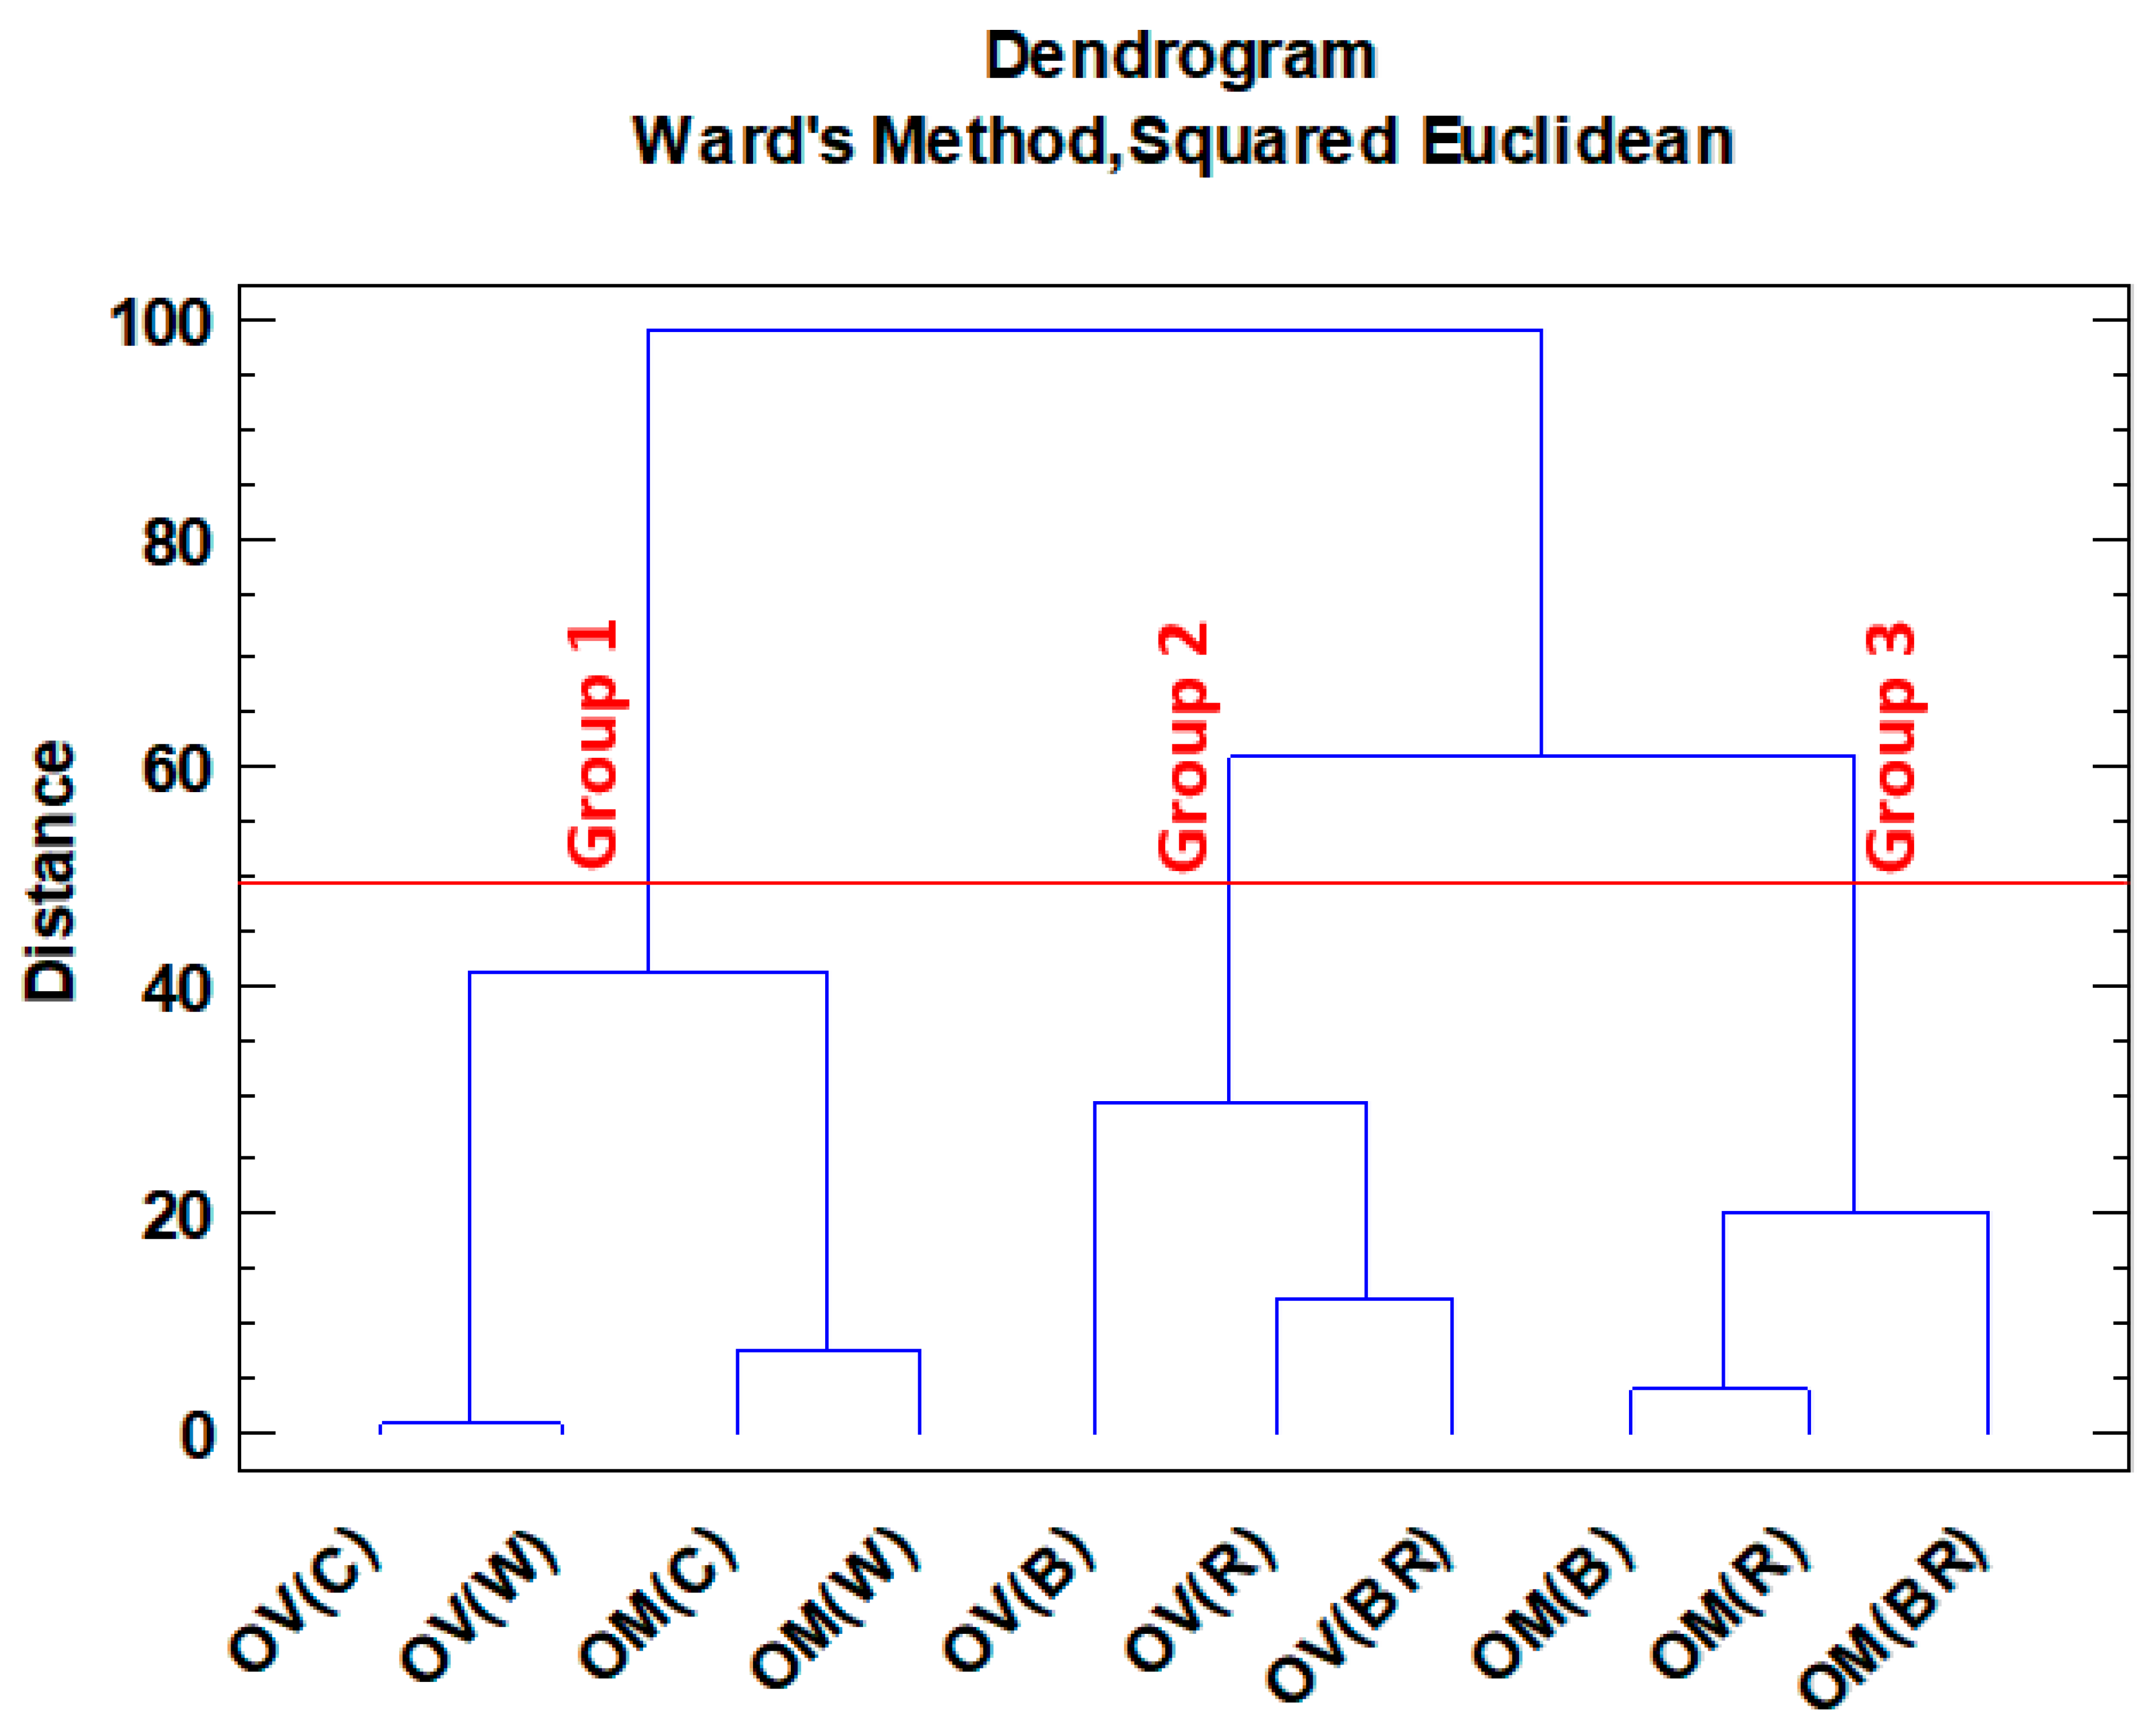
Cluster analysis was also used to classify species and treatments based on the Ward method. This method of analysis also confirms the division obtained in PCA in most cases (
Figure 4). According to clustering, two major groups were obtained. Group 1 included all control and white lights in both species. Group 2 consisted of the other colors that were included in both species. Therefore, it might be concluded that red, blue, and blue-red lights showed different trends for the accumulation of secondary metabolites in the two studied species.
3. Materials and Methods
3.1. Plant Materials and Cultivation
Oregano (
O. vulgare) and marjoram (
O. majorana) seeds were obtained through the medicinal plant collections of the Isfahan University of Technology. Oregano has previously been collected from Tabriz, East Azerbaijan, and Iran, and identified by Dr. Rahimmalek using Flora Iranica [
31]. The voucher specimens were deposited in the Herbarium of Isfahan University of Technology with the code 15225. Marjoram has also been purchased from Pakan Bazr, Company, Isfahan, determined by Dr. Rahimmalek, and deposited in the herbarium with the code 15323.
The seeds were cultivated in 10 kg pots with a mixture of sand and silt loam soil (1:2 v/v). Seeds were sown in greenhouse conditions at 25 °C. The aerial parts were harvested just before flowering and dried in shade at room temperature.
3.2. LED Treatments
The LED chambers were set up according to the Sabzalian et al.’s [
14] procedure. LED sheets with 120 1 W LEDs (0.25 A input current, OSRAM, Germany) were used to provide blue (460–475 nm), white (380–760 nm), red (650–665 nm), and blue-red (70%:30%) light. The temperature was set at 25 °C and the humidity at 60%. The voltage of the arrays was set to reach 300 μmol (photon) m
−2 s
−1 Control plants were kept at greenhouse conditions under ambient exposure to natural light.
3.3. Essential Oil Extraction
The dried leaves were applied for oil extraction, so that the leaves of plants were shade dried at room temperature (20–25 °C) over a period of seven days. For this purpose, 60 g of dried parts were used. Distillation was performed using the Clevenger-type apparatus. Then, 500 mL of distilled water was added and the samples were heated for 5 h. Finally, the oils were collected in a glass container. The oil content was calculated based on the dry matter of each sample in three replicates.
3.4. GC-MS Analysis
An Agilent 7890 gas chromatograph (Agilent Technologies, Palo Alto, CA, USA), with an HP-5MS capillary column (30 m × 0.25 mm, 0.25 μm film thickness) was applied for oil analysis. The conditions were as follows: the initial oven temperature was 60 °C for 4 min and, for the next steps, 260 °C was applied. The injector and detector temperatures were 290 °C and 300 °C, respectively. The carrier gas was helium with a flow rate of 2 mL/min. The gas chromatograph was coupled to an Agilent 5975 C (Agilent Technologies). An ionization voltage of 70 eV and an ion source temperature of 200 °C were applied for the mass spectrometry system.
Compounds were determined in an HP-5MS column using retention indices (RI) of C5–C24 n-alkanes and comparison with those reported in the literature using NIST 08 (National Institute of Standards and Technology, Gaithersburg, MD, USA) and Willey (Chem Station data system, Santa Clara, CA, United States). The Adams (2001) library was also used for determining the components.
3.5. Total Phenolic and Flavonoid Content
Total phenolic content (TPC) presented in the plants was evaluated using the Folin–Ciocalteu method as described by Pinelo et al. [
32]. In brief, 6 g of dried plant material was extracted with 100 mL of 80% MeOH (24 h, shaken 60 r.p.m.). After centrifugation and filtration, the solution was submitted for further analyses.
The aluminum chloride method was applied to determine the total flavonoids content using quercetin as a standard [
33]. The absorbance of the final mixture was measured at 510 nm. TFC was expressed as milligrams of quercetin equivalents per gram of the sample.
3.6. DPPH Scavenging Activity
The procedure of measuring the DPPH radical scavenging activity was used for this assay as previously described in [
34,
35,
36]. For this, the extracts were prepared in the different concentrations of 50, 300, and 500 mg/L in methanol. The absorbance was reported at 517 nm against a blank (plant extract without DPPH) and BHT was applied as standard control for comparison. Finally, by formulating the extract concentrations against the scavenging activity, concentration of the samples was calculated based on EC50.
3.7. Antioxidant Activity Using β-Carotene-Linoleic Acid Model System of β-Carotene-Linoleic Acid
The antioxidant capacity of plant extracts was identified using β-carotene bleaching test [
37]. To start, 10 mg of β-carotene (type I synthetic, Sigma–Aldrich, St. Louis, MO, USA) was dissolved in 10 mL of chloroform. The carotene–chloroform solution (0.2 mL) was added to a boiling flask containing 20 mg of linoleic acid and 200 mg Tween. Chloroform was removed using a rotary evaporator (Buchi 461, Uster, Switzerland) at 40 °C for 5 min and, to the residue, 50 mL of distilled water was added slowly, with vigorous agitation, to form an emulsion. Then, 5 ml of the emulsion was collected in one tube containing 0.2 mL of extracts prepared according to [
38] and the absorbance was calculated at 470 nm against a blank, consisting of an emulsion without β-carotene. The tubes were placed in a 50 °C water bath and the oxidation of the emulsion was evaluated spectrophotometrically at 470 nm. The control samples included 10 mL of water instead of essential oils. Butylated hydroxytoluene (BHT; Sigma–Aldrich), a stable antioxidant, was applied as a synthetic antioxidant. The antioxidant capacity was stated as an inhibition percentage with reference to the control after 60 min of incubation.
3.8. Measurement of Chlorophyll and Carotenoids Concentrations
The amount of chlorophyll and carotenoids was determined according to the method developed by Lichtenthaler and Wellburn [
39]. For this purpose, 0.2 g of fresh leaves were gently mixed with 10 mL of 80% (
v/
v) acetone. The solution was centrifuged (5810R, Eppendorf Refrigerated Centrifuge, Germany) for 10 min at 5000 rpm. Then, the absorbance of the produced extract was recorded at 645, 663, and 470 nm, respectively, using a spectrophotometer (U-1800 UV/VIS, Hitachi, Japan). The concentrations of carotenoids, chlorophyll a, and chlorophyll b were expressed as mg per g of leaf fresh weight.
3.9. Antioxidant Enzyme Activity Assays
Each of the LED Treatment samples (0.1 g) was ground in a mortar and pestle. Then, the powder was homogenized with 1 mL of Na-phosphate buffer (50 mM, pH 7) including 2 mM EDTA, 50 mM Tris−HCl, 2 mM α-dithiothreitol (DTT), 0.2% triton X-100, and 2% polyvinyl pyrrolidone (PVP). The homogenate solution was centrifuged at 15,000× g for 30 min at 4 °C. All stages of the extraction were performed at 4 °C. The supernatant of this extraction solution was used to measure the activities of the following antioxidant enzymes.
3.9.1. GPOX (EC 1.11.1.7)
Guaiacol peroxidase (EC 1.11.1.7) activity was assessed using the method from Askari and Ehsanzadeh [
40]. For this purpose, 3 mL extraction buffer, 3.35 μL guaiacol, and 4.51 μL H
2O
2 (30%) were added to the 50 μL extraction solution to measure guaiacol peroxidase activity. Then, the absorption changes were obtained at 240 nm for 2 min. Guaiacol peroxidase activity was reported as a unit per mg of protein.
3.9.2. APX (EC 1.11.1.11)
Ascorbate peroxidase activity was evaluated with the method described by Nakano and Asada [
41]. Briefly, 3 mL of extraction buffer was mixed with 4.51 μL H
2O
2 (30%), 0.1 mM EDTA, 100 μL of 5 mM ascorbate acid, and 50 μL extract. The decrease in 290 nm was recorded. Ascorbate peroxidase (APX) activity was expressed as unit per mg of protein.
3.9.3. CAT (EC 1.11.1.6)
Examination of catalase activity (EC 1.11.1.6) was performed according to Chance and Maehly’s [
42] method. Firstly, 50 μL extraction solution was mixed with 4.51 μL H
2O
2 (30%) and 3 mL extraction buffer (50 mM potassium phosphate buffer, pH 7.0 at 25 °C). The absorbance reducing data were read at 240 nm for 2 min. Catalase activity was calculated as a unit per mg of protein.
3.10. Proline
The method for proline evaluation was described by Bates et al. [
43]. In the method, 0.2 g of the fresh mature studied leaves were homogenized in 10 mL of 3% sulphosalicylic acid and then the obtained solution was filtered. Next, 2 mL of each solution were mixed with 2 mL glacial acetic acid and 2 mL of ninhydrin reagent. The reaction mixtures were kept for an hour in a water bath and were instantly transferred to the ice bath. After adding 4 mL toluene to each sample and 30 min incubation, their absorbance was recorded at 520 nm. Finally, proline concentration was measured according to the standard curve that was obtained through specified concentrations of this amino acid.
3.11. Statistical Analyses
All the measurements of all the samples were carried out in triplicates. The analysis of variance was carried out using SAS ver. 9.2. LSD test (p < 0.05) to compare treatment means. Multivariate analyses such as principal component analysis (PCA) were also applied for biplot analysis of the components.
4. Conclusions
Today, improving the content and quality of essential oil in medicinal plants is of great importance in the food and pharmaceutical industries as it is related to the change in the nutritional, medicinal, and antioxidant properties of the final products. In addition, there is a growing interest in using greenhouses and indoor facilities instead of the field to grow medicinal species. Under these conditions, LEDs can be used as supplementary light or as the sole source of light to increase photosynthesis and metabolite accumulation. In the present investigation, essential oil content and chemical composition, as well as total polyphenols and antioxidant capacity of oregano and marjoram were studied in the context of their response to different spectra of light-emitting diode illumination. For essential oil content, the two species revealed different trends. However, in oregano, LED illumination caused a dramatic increase in thymol and cymene at the expense of linalool and terpinen-4-ol, which are the main constituents of plants under natural light. Conversely, in marjoram, the contribution of linalool and terpinen-4-ol decreased in favor of thymol and γ-terpinene only under red LEDs, while the composition under other light regimes was less affected. In the present study, blue-red LED light treatments produced the highest amount of the major monoterpene components with high antioxidant capacity in marjoram. So, for marjoram, this might suggest that its antioxidant capacity under light treatment can be related to the essential oil components, especially monoterpenes. However, in oregano, its antioxidant capacity has not been consistently reflected. Regarding nonvolatile antioxidants such as flavonoids, blue-red light was an efficient stimulant of their accumulation, also causing a significant increase in antioxidant potential only in marjoram. Therefore, the results of this research can provide new insights into influencing the essential oil profile of oregano and marjoram as important herb and spice plants. Finally, the results can help growers manipulate the composition and yield of beneficial antioxidant compounds.
Author Contributions
M.R. contributed to the design of the study, data interpretation, and manuscript editing. D.S. performed the experiments, analyzed the data, and wrote the initial draft of the article. M.R.S. designed the research and edited the manuscript. S.G. did the GC-MS and prepared the data. M.R.S. interpreted the data of LED lights. A.M. helped with restructuring and final editing as well as interpretation of antioxidant parts. A.S. helped with GC–MS interpretation as well as editing the final version of the manuscript. All authors have read and agreed to the published version of the manuscript.
Funding
We appreciate Polish National Agency for Academic Exchange (NAWA) Ulam 2021 program under grant number BPN/ULM/2021/1/00250/U/00001 for supporting this study. The APC is financed by Wrocław University of Environmental and Life Sciences.
Institutional Review Board Statement
Not applicable.
Informed Consent Statement
Not applicable.
Data Availability Statement
The data will be available based on request.
Acknowledgments
We appreciate Polish National Agency for Academic Exchange (NAWA) Ulam 2021 program under grant number BPN/ULM/2021/1/00250/U/00001 for supporting this study. We also thank Isfahan University of Technology for providing preliminary materials.
Conflicts of Interest
The authors declare no conflict of interest.
References
- Naghdibadi, H.; Abdollahi, M.; Mehrafarin, A.; Ghorbanpour, M.; Tolyat, M.; Qaderi, A. An overview on two valuable natural and bioactive compounds, thymol and carvacrol, in medicinal plants. J. Med. Plant Res. 2017, 16, 1–32. [Google Scholar]
- Tohidi, B.; Rahimmalek, M.; Trindade, H. Review on essential oil, extracts composition, molecular and phytochemical properties of Thymus species in Iran. Ind. Crops Prod. 2019, 134, 89–99. [Google Scholar] [CrossRef]
- Sakkas, H.; Papadopoulou, C. Antimicrobial activity of basil, oregano, and thyme essential oils. J. Microbiol. Biotechnol. 2017, 27, 429–438. [Google Scholar] [CrossRef] [Green Version]
- Rahimmalek, M.; Heidari, E.F.; Ehtemam, M.H.; Mohammadi, S. Essential oil variation in Iranian Ajowan (Trachyspermum ammi (L.) Sprague) populations collected from different geographical regions in relation to climatic factors. Ind. Crops Prod. 2017, 95, 591–598. [Google Scholar] [CrossRef]
- Zhao, Y.; Yang, Y.H.; Ye, M.; Wang, K.B.; Fan, L.M.; Su, F.W. Chemical composition and antifungal activity of essential oil from Origanum vulgare against Botrytis cinereal. Food Chem. 2021, 365, 130506. [Google Scholar] [CrossRef]
- Rathod, N.B.; Kulawik, P.; Ozogul, F.; Regenstein, J.M.; Ozogul, Y. Biological activity of plant-based carvacrol and thymol and their impact on human health and food quality. Trends Food Sci. Technol. 2021, 116, 733–748. [Google Scholar] [CrossRef]
- Boukhatem, M.N.; Darwish, N.H.; Sudha, T.; Bahlouli, S.; Kellou, D.; Benelmouffok, A.B.; Mousa, S.A. In vitro antifungal and topical anti-inflammatory properties of essential oil from wild-growing thymus vulgaris (Lamiaceae) used for medicinal purposes in algeria: A new source of carvacrol. Sci. Pharm. 2020, 88, 33. [Google Scholar] [CrossRef]
- De Hsie, B.S.; Bueno, A.I.S.; Bertolucci, S.K.V.; de Carvalho, A.A.; da Cunha, S.H.B.; Martins, E.R.; Pinto, J.E.B.P. Study of the influence of wavelengths and intensities of LEDs on the growth, photosynthetic pigment, and volatile compounds production of Lippia rotundifolia Cham in vitro. J. Photochem. Photobiol. B Biol. 2019, 198, 111577. [Google Scholar] [CrossRef]
- Al Murad, M.; Razi, K.; Jeong, B.R.; Muthu Arjuna Samy, P.; Muneer, S. Light emitting diodes (Leds) as agricultural lighting: Impact and its potential on improving physiology, flowering, and secondary metabolites of crops. Sustainability 2021, 13, 1985. [Google Scholar] [CrossRef]
- Ahmadi, T.; Shabani, L.; Sabzalian, M.R. LED light sources improved the essential oil components and antioxidant activity of two genotypes of lemon balm (Melissa officinalis L.). Bot. Stud. 2021, 62, 9. [Google Scholar] [CrossRef]
- Tohidi, B.; Rahimmalek, M.; Arzani, A.; Sabzalian, M.R. Thymol, carvacrol, and antioxidant accumulation in Thymus species in response to different light spectra emitted by light-emitting diodes. Food Chem. 2020, 307, 125521. [Google Scholar] [CrossRef]
- Amaki, W.; Yamazaki, N.; Ichimura, M.; Watanabe, H. Effects of light quality on the growth and essential oil content in sweet basil. Acta. Hortic. 2011, 907, 91–94. [Google Scholar] [CrossRef]
- Ghaffari, Z.; Rahimmalek, M.; Sabzalian, M.R. Variation in the primary and secondary metabolites derived from the isoprenoid pathway in the Perovskia species in response to different wavelengths generated by light emitting diodes (LEDs). Ind. Crops Prod. 2019, 140, 111592. [Google Scholar] [CrossRef]
- Sabzalian, M.R.; Heydarizadeh, P.; Zahedi, M.; Boroomand, A.; Agharokh, M.; Sahba, M.R.; Schoefs, B. High performance of vegetables, flowers, and medicinal plants in a red-blue LED incubator for indoor plant production. Agron. Sustain. Dev. 2014, 34, 879–886. [Google Scholar] [CrossRef] [Green Version]
- Fernandes, V.F.; de Almeida, L.B.; Feijó, E.V.d.S.; Silva, D.D.C.; de Oliveira, R.A.; Mielke, M.S.; Costa, L.C.D.B. Light intensity on growth, leaf micromorphology and essential oil production of Ocimum gratissimum. Rev. Bras. Farmacogn. 2013, 23, 419–424. [Google Scholar] [CrossRef] [Green Version]
- Mashkani, M.R.D.; Larijani, K.; Mehrafarin, A.; Badi, H.N. Changes in the essential oil content and composition of Thymus daenensis Celak. Under diferent drying methods. Ind. Crops Prod. 2018, 112, 389–395. [Google Scholar] [CrossRef]
- Shafiee-Hajiabad, M.; Hardt, M.; Honermeier, B. Comparative investigation about the trichome morphology of Common oregano (Origanum vulgare L. subsp. vulgare) and Greek oregano (Origanum vulgare L. subsp. hirtum). J. Appl. Res. Med. Aromat. Plants 2014, 1, 50–58. [Google Scholar] [CrossRef]
- Nguyen, T.L.; Saleh, M.A. Effect of exposure to light emitted diode (LED) lights on essential oil composition of sweet mint plants. J. Environ. Sci. Health 2019, 54, 435–440. [Google Scholar] [CrossRef]
- Selmar, D.; Kleinwächter, M. Stress enhances the synthesis of secondary plant products: The impact of stress-related over-reduction on the accumulation of natural products. Plant Cell Physiol. 2013, 54, 817–826. [Google Scholar] [CrossRef]
- Gharibi, S.; Tabatabaei, B.E.S.; Saeidi, G.; Talebi, M.; Matkowski, A. The effect of drought stress on polyphenolic compounds and expression of flavonoid biosynthesis related genes in Achillea pachycephala Rech, f. Phytochemistry 2019, 162, 90–98. [Google Scholar] [CrossRef] [PubMed]
- Batista, D.S.; de Castro, K.M.; da Silva, A.R.; Teixeira, M.L.; Sales, T.A.; Soares, L.I.; Otoni, W.C. Light quality affects in vitro growth and essential oil profile in Lippia alba (Verbenaceae). Vitr. Cell. Dev. Biol. Plant. 2016, 52, 276–282. [Google Scholar] [CrossRef]
- Hinds, L.M.; Guclu, G.; Kelebek, H.; Selli, S.; O’Donnell, C.P.; Tiwari, B.K. Effect of ultraviolet light emitting diode treatments on microbial load, phenolic and volatile profile of black peppercorns. LWT 2021, 152, 112133. [Google Scholar] [CrossRef]
- Jung, W.S.; Chung, I.M.; Hwang, M.H.; Kim, S.H.; Yu, C.Y.; Ghimire, B.K. Application of light-emitting diodes for improving the nutritional quality and bioactive compound levels of some crops and medicinal plants. Molecules 2021, 26, 1477. [Google Scholar] [CrossRef] [PubMed]
- Darko, E.; Heydarizadeh, P.; Schoefs, B.; Sabzalian, M.R. Photosynthesis under artificial light: The shift in primary and secondary metabolism. Philos. Trans. R. Soc. Lond. B Biol. Sci. 2014, 369, 20130243. [Google Scholar] [CrossRef] [Green Version]
- Liu, H.; Chen, Y.; Hu, T.; Zhang, S.; Zhang, Y.; Zhao, T.; Yu, H.; Kang, Y. The influence of light-emitting diodes on the phenolic compounds and antioxidant activities in pea sprouts. J. Funct. Foods 2016, 25, 459–465. [Google Scholar] [CrossRef]
- Loi, M.; Villani, A.; Paciolla, F.; Mulè, G.; Paciolla, C. Challenges and opportunities of light-emitting diode (LED) as key to modulate antioxidant compounds in plants. A review. Antioxidants 2020, 10, 42. [Google Scholar] [CrossRef] [PubMed]
- Silva, S.T.; Bertolucci, S.K.V.; da Cunha, S.H.B.; Lazzarini, L.E.S.; Tavares, M.C.; Pinto, J.E.B.P. Effect of light and natural ventilation systems on the growth parameters and carvacrol content in the in vitro cultures of Plectranthus amboinicus (Lour.) Spreng. Plant Cell Tissue Organ Cult. 2017, 129, 501–510. [Google Scholar] [CrossRef]
- Tosun, M.; Ercisli, S.; Sengul, M.; Ozer, H.; Polat, T.; Ozturk, E. Antioxidant properties and total phenolic content of eight Salvia species from Turkey. Biol. Res. 2009, 42, 175–181. [Google Scholar] [CrossRef]
- Samuolienė, G.; Sirtautas, R.; Brazaityte, A.; Virsile, A.; Duchovkis, P. Suplementary red-LED lighting and the changes in phytochemical content of two baby leaf lettuce varieties during three seasons. J. Food Agric. Environ. 2012, 10, 701–706. [Google Scholar]
- Zukauskas, A.; Bliznikas, Z.; Breivė, K.; Novičkovas, A.; Samuolienė, G.; Urbonavičiūtė, A.; Brazaitytė, A.; Jankauskienė, J.; Duchovskis, P. Effect of supplementary pre-harvest LED lighting on the antioxidant properties of lettuce cultivars. Acta Hortic. 2009, 907, 87–90. [Google Scholar] [CrossRef]
- Rechinger, K.H. Flora Iranica. 1963. Available online: https://www.iranicaonline.org/articles/flora-iranica- (accessed on 12 February 2023).
- Pinelo, M.; Rubilar, M.; Sineiro, J.; Nunez, M.J. Extraction of antioxidant phenolics from almond hulls (Prunus amygdalus) and pine sawdust (Pinus pinaster). Food Chem. 2004, 85, 267–273. [Google Scholar] [CrossRef]
- Tohidi, B.; Rahimmalek, M.; Arzani, A. Essential oil composition, total phenolic, flavonoid contents, and antioxidant activity of Thymus species collected from different regions of Iran. Food Chem. 2017, 220, 153–161. [Google Scholar] [CrossRef] [PubMed]
- Vlase, L.; Benedec, D.; Hanganu, D.; Damian, G.; Csillag, I.; Sevastre, B.; Tilea, I. Evaluation of antioxidant and antimicrobial activities and phenolic profile for Hyssopus officinalis, Ocimum basilicum and Teucrium chamaedrys. Molecules 2014, 19, 5490–5507. [Google Scholar] [CrossRef] [Green Version]
- Brand-Williams, W.; Cuvelier, M.; Berset, C. Use of a free radical method to evaluate antioxidant activity. LWT Food Sci. Technol. 1995, 28, 25–30. [Google Scholar] [CrossRef]
- Hudz, N.; Ivanova, R.; Brindza, J.; Grygorieva, O.; Schubertová, Z.; Ivanišová, E. Approaches to the determination of antioxidant activity of extracts from bee bread and safflower leaves and flowers. Potravinarstwo Slovak J. Food Sci. 2017, 11, 480–488. [Google Scholar] [CrossRef] [Green Version]
- Taga, M.S.; Miller, E.E.; Pratt, D.E. Chia seeds as a source of natural lipid antioxidant. J. Am. Oil. Chem. Soc. 1984, 61, 928–931. [Google Scholar] [CrossRef]
- Choi, H.S.; Song, H.S.; Ukeda, H.; Sawamura, M. Radicalscavenging activities of citrus essential oils and their components: Detection using 1,1-diphenyl-2-picrylhydrazyl. J. Agric. Food Chem. 2000, 48, 4156–4161. [Google Scholar] [CrossRef] [PubMed]
- Lichtenthaler, H.K.; Wellburn, A.R. Determination of total carotenoids and chlorophylls a and b of leaf in different solvents. Biochem. Soc. Trans. 1983, 11, 591–592. [Google Scholar] [CrossRef] [Green Version]
- Askari, E.; Ehsanzadeh, P. Drought stress mitigation by foliar application of salicylic acid and their interactive effects on physiological characteristics of fennel (Foeniculum vulgare Mill.) genotypes. Acta Physiol. Plant. 2015, 37, 4. [Google Scholar] [CrossRef]
- Nakano, Y.; Asada, K. Hdrogen peroxide is scavenged by ascorbate-specific peroxidase in spinach chloroplasts. Plant Cell Physiol. 1981, 22, 867–880. [Google Scholar] [CrossRef]
- Chance, B.; Maehly, A.C. Assay of catalase and guaiacol peroxidase. Methods Enzymol. 1955, 2, 764–775. [Google Scholar] [CrossRef]
- Bates, L.S.; Waldran, R.P.; Teare, I.D. Rapid determination of free proline for water studies. Plant Soil. 1973, 9, 205–208. [Google Scholar] [CrossRef]
Figure 1.
Variation of essential oil content in Origanum majorana (OM) and O. vulgare (OV) species grown under different light spectra: C—ambient natural light, B—blue LED, R—red LED, BR—7:3 mix of blue and red LED, W—white LED. The letters on the graph illustrates the mean differences of studied samples in different LED treatments.
Figure 2.
Inhibition of β-carotene bleaching system of Origanum majorana (OM) and O. vulgare (OV) as compared with BHT. The concentration steps were 50, 100, 300, and 500 ppm. C—ambient natural light, B—blue LED, R—red LED, BR—7:3 mix of blue and red LED, W—white LED.
Figure 2.
Inhibition of β-carotene bleaching system of Origanum majorana (OM) and O. vulgare (OV) as compared with BHT. The concentration steps were 50, 100, 300, and 500 ppm. C—ambient natural light, B—blue LED, R—red LED, BR—7:3 mix of blue and red LED, W—white LED.
Figure 3.
Principal component analysis (PCA) of Origanum majorana (OM) and O. vulgare (OV) species grown under different light spectra: C-ambient natural light, B-blue LED, R-red LED, BR-7:3 mix of blue and red LED, W-white LED.
Figure 3.
Principal component analysis (PCA) of Origanum majorana (OM) and O. vulgare (OV) species grown under different light spectra: C-ambient natural light, B-blue LED, R-red LED, BR-7:3 mix of blue and red LED, W-white LED.
Figure 4.
Origanum majorana (OM) and O. vulgare (OV) species grown under different light spectra: C—ambient natural light, B—blue LED, R—red LED, BR—7:3 mix of blue and red LED, W—white LED.
Figure 4.
Origanum majorana (OM) and O. vulgare (OV) species grown under different light spectra: C—ambient natural light, B—blue LED, R—red LED, BR—7:3 mix of blue and red LED, W—white LED.
Table 1.
Analysis of essential oils, total phenolics, total flavonoids, and antioxidant activity in Origanum majorana and O. vulgare under LED treatments.
Table 1.
Analysis of essential oils, total phenolics, total flavonoids, and antioxidant activity in Origanum majorana and O. vulgare under LED treatments.
| Source of Variation | DF | Mean Squares |
|---|
| Essential Oil | Total Phenolics | Total Flavonoids | EC50 | β-Carotene-Linoleic Acid |
|---|
| LED | 4 | 3.62 ** | 848.10 ** | 10.33 ** | 143.564 ** | 15.426 ** |
| Rep (LED) | 10 | 0.023 * | 0.084 ** | 0.056 * | 979 * | 148 * |
| Species | 1 | 29.80 ** | 125.50 ** | 8.26 ** | 150.070 ** | 12.736 ** |
| Species x LED | 4 | 4.20 ** | 288.76 ** | 2.18 ** | 287.053 ** | 16.478 ** |
| Error | 10 | 0.005 | 0.013 | 0.007 | 28.62 | 24.51 |
Table 2.
Proportion of volatile compounds (%) of essential oils of Origanum majorana (OM) and O. vulgare (OV) species grown under different light spectra: C—ambient natural light, B—blue LED, R—red LED, BR—7:3 mix of blue and red LED, W—white LED. RIexp—experimental retention index; RIlit—literature (NIST17) retention index. Bolded are major compounds.
| Composition (%) | RIexp | RIlit. | OV-C | OV-B | OV-R | OV-BR | OV-W | OM-C | OM-B | OM-R | OM-BR | OM-W | Identification |
|---|
| α-thujene | 928 | 929 | 0.6 ± 0.08 | 1.31 ± 0.02 | 0.84 ± 0.01 | 0.90 ± 0.01 | 0.48 ± 0.03 | 0.56 ± 0.04 | 0.13 ± 0.01 | 0.39 ± 0.02 | 2.09 ± 0.01 | 1.69 ± 0.03 | IS, KI, MS |
| α-pinene | 939 | 937 | 0.61 ± 0.01 | 2.02 ± 0.03 | 0.88 ± 0.02 | 0.98 ± 0.01 | 0.56 ± 0.02 | 0.68 ± 0.01 | 0.31 ± 0.03 | 0.46 ± 0.01 | 2.28 ± 0.02 | 0.38 ± 0.01 | IS, KI, MS |
| sabinene | 975 | 974 | 6.17 ± 0.05 | 5.62 ± 0.04 | 3.42 ± 0.03 | 3.61 ± 0.03 | 3.98 ± 0.02 | 8.00 ± 0.05 | 4.82 ± 0.02 | 4.81 ± 0.06 | 4.56 ± 0.08 | 6.05 ± 0.07 | IS, KI, MS |
| β-pinene | 976 | 979 | 1.37 ± 0.01 | 0.29 ± 0.01 | 0.69 ± 0.01 | 0.46 ± 0.01 | 0.78 ± 0.02 | 0.58 ± 0.01 | 1.32 ± 0.01 | 1.07 ± 0.02 | 0.78 ± 0.01 | 0.47 ± 0.02 | IS, KI, MS |
| β-myrcene | 992 | 991 | 0.43 ± 0.01 | 0.92 ± 0.02 | 1.47 ± 0.03 | 1.67 ± 0.07 | 1.05 ± 0.01 | 3.27 ± 0.01 | 2.17 ± 0.04 | 1.96 ± 0.01 | 1.14 ± 0.09 | 1.60 ± 0.01 | IS, KI, MS |
| α-terpinene | 1018 | 1017 | 4.6 ± 0.02 | 2.16 ± 0.01 | 1.59 ± 0.01 | 1.29 ± 0.02 | 2.10 ± 0.01 | 3.75 ± 0.03 | 6.87 ± 0.06 | 7.63 ± 0.03 | 1.41 ± 0.01 | 9.52 ± 0.06 | IS, KI, MS |
| β-phellandrene | 1026 | 1029 | 0.34 ± 0.01 | 0.2 ± 0.01 | 0.29 ± 0.06 | 0.32 ± 0.01 | 0.08 ± 0.02 | 0.93 ± 0.01 | 0.41 ± 0.01 | 0.30 ± 0.01 | 0.25 ± 0.03 | 0.83 ± 0.01 | IS, KI, MS |
| p-cymene | 1026 | 1024 | 7.39 ± 0.02 | 5.17 ± 0.03 | 18.24 ± 0.02 | 27.54 ± 0.01 | 25.48 ± 0.2 | 12.88 ± 0.1 | 4.64 ± 0.05 | 4.84 ± 0.02 | 11.59 ± 0.06 | 6.44 ± 0.04 | IS, KI, MS |
| limonene | 1029 | 1030 | 1.53 ± 0.01 | 0.61 ± 0.01 | 1.20 ± 0.01 | 1.14 ± 0.02 | 0.26 ± 0.01 | 3.05 ± 0.01 | 1.19 ± 0.01 | 1.18 ± 0.04 | 0.30 ± 0.02 | 2.52 ± 0.03 | IS, KI, MS |
| γ-terpinene | 1063 | 1060 | 8.61 ± 0.02 | 6.75 ± 0.01 | 12.70 ± 0.4 | 8.09 ± 0.5 | 9.25 ± 0.07 | 2.12 ± 0.01 | 3.30 ± 0.06 | 4.51 ± 0.04 | 9.37 ± 0.05 | 2.41 ± 0.06 | IS, KI, MS |
| fenchone | 1082 | 1086 | 2.52 ± 0.01 | 2.93 ± 0.03 | 1.09 ± 0.03 | 1.86 ± 0.01 | 1.35 ± 0.01 | 2.00 ± 0.01 | 4.40 ± 0.03 | 3.10 ± 0.01 | 3.71 ± 0.01 | 1.04 ± 0.02 | IS, KI, MS |
| terpinolene | 1085 | 1088 | 1.52 ± 0.01 | 1.85 ± 0.01 | 0.96 ± 0.01 | 0.97 ± 0.03 | 0.89 ± 0.01 | 0.86 ± 0.01 | 3.25 ± 0.01 | 2.44 ± 0.01 | 0.91 ± 0.01 | 1.62 ± 0.01 | IS, KI, MS |
| linalool | 1097 | 1099 | 20.11 ± 0.2 | 0.38 ± 0.01 | 12.04 ± 0.2 | 5.64 ± 0.1 | 10.69 ± 0.3 | 22.42 ± 0.2 | 18.82 ± 0.2 | 19.48 ± 0.4 | 7.92 ± 0.3 | 13.75 ± 0.2 | IS, KI, MS |
| fenchol | 1110 | 1113 | 0.89 ± 0.01 | 0.74 ± 0.01 | 0.63 ± 0.01 | 0.59 ± 0.01 | 0.58 ± 0.01 | 0.61 ± 0.01 | 1.34 ± 0.01 | 1.16 ± 0.01 | 0.51 ± 0.01 | 1.64 ± 0.04 | IS, KI, MS |
| α-campholenal | 1123 | 1125 | 0.92 ± 0.02 | 0.85 ± 0.01 | 0.58 ± 0.01 | 1.03 ± 0.01 | 0.93 ± 0.01 | 1.82 ± 0.02 | 1.22 ± 0.01 | 0.94 ± 0.01 | 1.75 ± 0.01 | 0.59 ± 0.01 | KI, MS |
| terpinen-4-ol | 1178 | 1182 | 19.02 ± 0.1 | 1.93 ± 0.08 | 7.40 ± 0.07 | 3.81 ± 0.02 | 6.95 ± 0.08 | 8.70 ± 0.07 | 11.42 ± 0.09 | 13.39 ± 0.1 | 2.83 ± 0.04 | 12.11 ± 0.09 | IS, KI, MS |
| α-terpineol | 1192 | 1189 | 2.67 ± 0.01 | 2.93 ± 0.02 | 1.20 ± 0.03 | 2.54 ± 0.01 | 2.18 ± 0.03 | 2.40 ± 0.01 | 1.03 ± 0.01 | 2.21 ± 0.06 | 3.53 ± 0.02 | 5.94 ± 0.01 | IS, KI, MS |
| geraniol | 1256 | 1255 | 0.2 ± 0.01 | 1.1 ± 0.01 | 1.09 ± 0.01 | 1.12 ± 0.01 | 1.13 ± 0.01 | 0.42 ± 0.01 | 2.17 ± 0.01 | 1.54 ± 0.01 | 0.38 ± 0.01 | 1.76 ± 0.01 | IS, KI, MS |
| linalyl acetate | 1254 | 1257 | 1.21 ± 0.01 | 2.59 ± 0.01 | 1.34 ± 0.01 | 1.52 ± 0.03 | 1.50 ± 0.01 | 1.24 ± 0.03 | 2.47 ± 0.05 | 1.73 ± 0.01 | 2.03 ± 0.04 | 2.21 ± 0.04 | IS, KI, MS |
| bornyl acetate | 1279 | 1285 | 0.32 ± 0.01 | 1.12 ± 0.01 | 0.47 ± 0.01 | 0.35 ± 0.01 | 0.22 ± 0.02 | 0.63 ± 0.01 | 1.66 ± 0.01 | 1.31 ± 0.01 | 0.38 ± 0.01 | 1.06 ± 0.01 | IS, KI, MS |
| thymol | 1293 | 1291 | 11.91 ± 0.2 | 48.26 ± 0.5 | 19.99 ± 0.4 | 21.64 ± 0.3 | 23.19 ± 0.6 | 18.48 ± 0.6 | 20.38 ± 0.7 | 17.47 ± 0.3 | 35.06 ± 0.7 | 20.16 ± 0.5 | IS, KI, MS |
| carvacrol | 1300 | 1299 | 3.74 ± 0.1 | 4.37 ± 0.09 | 8.33 ± 0.07 | 9.13 ± 0.08 | 3.56 ± 0.05 | 0.70 ± 0.03 | 5.07 ± 0.06 | 5.23 ± 0.07 | 3.23 ± 0.06 | 2.63 ± 0.05 | IS, KI, MS |
| β-caryophyllene | 1419 | 1419 | 1.75 ± 0.03 | 2.81 ± 0.01 | 1.43 ± 0.01 | 1.41 ± 0.01 | 0.51 ± 0.01 | 3.03 ± 0.01 | 1.32 ± 0.03 | 1.31 ± 0.01 | 0.80 ± 0.01 | 2.16 ± 0.03 | IS, KI, MS |
| aromadendrene | 1438 | 1440 | 0.2 ± 0.01 | 0.5 ± 0.01 | 0.25 ± 0.02 | 0.08 ± 0.01 | 0.20 ± 0.02 | 0.25 ± 0.01 | 0.31 ± 0.01 | 0.19 ± 0.02 | 0.51 ± 0.05 | 0.38 ± 0.01 | KI, MS |
| α-humulene | 1451 | 1454 | 0.42 ± 0.01 | 1.21 ± 0.02 | 0.58 ± 0.01 | 0.90 ± 0.02 | 0.57 ± 0.01 | 0.32 ± 0.03 | 0.59 ± 0.03 | 0.40 ± 0.01 | 2.09 ± 0.02 | 0.97 ± 0.01 | IS, KI, MS |
Table 3.
Effects of LED illumination on total phenolics, total flavonoids, and DPPH scavenging activity in Origanum majorana and O. vulgare.
Table 3.
Effects of LED illumination on total phenolics, total flavonoids, and DPPH scavenging activity in Origanum majorana and O. vulgare.
| LED | Species | Total Phenolics
(mg TAE/g DW) | Total Flavonoids
(mg QUE/g DW) | EC50
(μg/mL) |
|---|
| Control | O. majorana | 34.12 ± 0.04 g | 3.01 ± 0.01 e | 1032.9 ± 0.1 b |
| O. vulgare | 31.74 ± 0.02 h | 1.89 ± 0.01 g | 371.80 ± 0.4 j |
| White | O. majorana | 65.18 ± 0.01 a | 1.92 ± 0.02 g | 975.73 ± 0.5 c |
| O. vulgare | 39.35 ± 0.03 f | 1.73 ± 0.01 h | 455.6 ± 0.6 i |
| Blue | O. majorana | 53.17 ± 0.05 c | 4.11 ± 0.01 b | 886.77 ± 0.2 d |
| O. vulgare | 61.26 ± 0.01 b | 2.16 ± 0.03 f | 1160.3 ± 0.1 a |
| RED | O. majorana | 51.05 ± 0.07 d | 3.29 ± 0.02 d | 782.03 ± 0.1 e |
| O. vulgare | 43.28 ± 0.04 e | 3.76 ± 0.01 c | 704.73 ± 0.3 g |
| Blue-Red | O. majorana | 26.50 ± 0.01 i | 6.51 ± 0.02 a | 477.3 ± 0.6 h |
| O. vulgare | 33.94 ± 0.08 g | 4.06 ± 0.01 b | 755.0 ± 0.2 f |
Table 4.
Effects of LED illumination on traits on Origanum majorana (OM) and O. vulgare (OV) species grown under different light spectra.
Table 4.
Effects of LED illumination on traits on Origanum majorana (OM) and O. vulgare (OV) species grown under different light spectra.
| Proline (μmol g−1) | Catalase (Units mg−1 Protein) | Ascorbate Peroxidase (Units mg−1 Protein) | Guaiacol Peroxidase (Units mg−1 Protein) | Carotenoids Concentration (mg g−1) | Chlorophyll b Concentration (mg g−1) | Chlorophyll a Concentration (mg g−1) | Treatments |
|---|
| 0.15 ± 0.02 | 0.13 ± 0.01 | 2.14 ± 0.01 | 0.11 ± 0.04 | 0.12 ± 0.01 | 0.08 ± 0.03 | 0.23 ± 0.05 | OV-C |
| 0.65 ± 0.01 | 0.61 ± 0.03 | 3.24 ± 0.02 | 1.01 ± 0.01 | 0.22 ± 0.04 | 0.16 ± 0.01 | 0.71 ± 0.01 | OV-B |
| 0.25 ± 0.02 | 0.22 ± 0.01 | 5.01 ± 0.04 | 0.22 ± 0.06 | 0.11 ± 0.02 | 0.09 ± 0.06 | 0.32 ± 0.05 | OV-R |
| 0.56 ± 0.1 | 0.52 ± 0.01 | 5.13 ± 0.03 | 0.72 ± 0.01 | 0.13 ± 0.01 | 0.13 ± 0.04 | 0.62 ± 0.02 | OV-BR |
| 0.37 ± 0.04 | 0.35 ± 0.02 | 4.16 ± 0.01 | 0.43 ± 0.01 | 0.18 ± 0.04 | 0.11 ± 0.02 | 0.45 ± 0.01 | OV-W |
| 0.23 ± 0.03 | 0.19 ± 0.01 | 1.17 ± 0.01 | 0.19 ± 0.02 | 0.13 ± 0.1 | 0.07 ± 0.01 | 0.29 ± 0.03 | OM-C |
| 0.64 ± 0.01 | 0.68 ± 0.05 | 3.21 ± 0.02 | 0.91 ± 0.02 | 0.20 ± 0.06 | 0.14 ± 0.02 | 0.78 ± 0.02 | OM-B |
| 0.16 ± 0.02 | 0.14 ± 0.04 | 2.02 ± 0.06 | 0.12 ± 0.03 | 0.12 ± 0.1 | 0.08 ± 0.04 | 0.24 ± 0.01 | OM-R |
| 0.48 ± 0.01 | 0.49 ± 0.01 | 2.11 ± 0.1 | 0.63 ± 0.01 | 0.14 ± 0.05 | 0.12 ± 0.01 | 0.59 ± 0.01 | OM-BR |
| 0.21 ± 0.01 | 0.29 ± 0.02 | 1.94 ± 0.03 | 0.29 ± 0.02 | 0.16 ± 0.02 | 0.10 ± 0.05 | 0.39 ± 0.04 | OM-W |
| Disclaimer/Publisher’s Note: The statements, opinions and data contained in all publications are solely those of the individual author(s) and contributor(s) and not of MDPI and/or the editor(s). MDPI and/or the editor(s) disclaim responsibility for any injury to people or property resulting from any ideas, methods, instructions or products referred to in the content. |
© 2023 by the authors. Licensee MDPI, Basel, Switzerland. This article is an open access article distributed under the terms and conditions of the Creative Commons Attribution (CC BY) license (https://creativecommons.org/licenses/by/4.0/).


 ,
, 


