Development of a Multivariate Predictive Dissolution Model for Tablets Coated with Cellulose Ester Blends

 ,
,
Abstract
:
1. Introduction
2. Materials and Methods
2.1. Materials
2.2. Methods
2.2.1. Preparation of Core Tablets
2.2.2. Coating Process
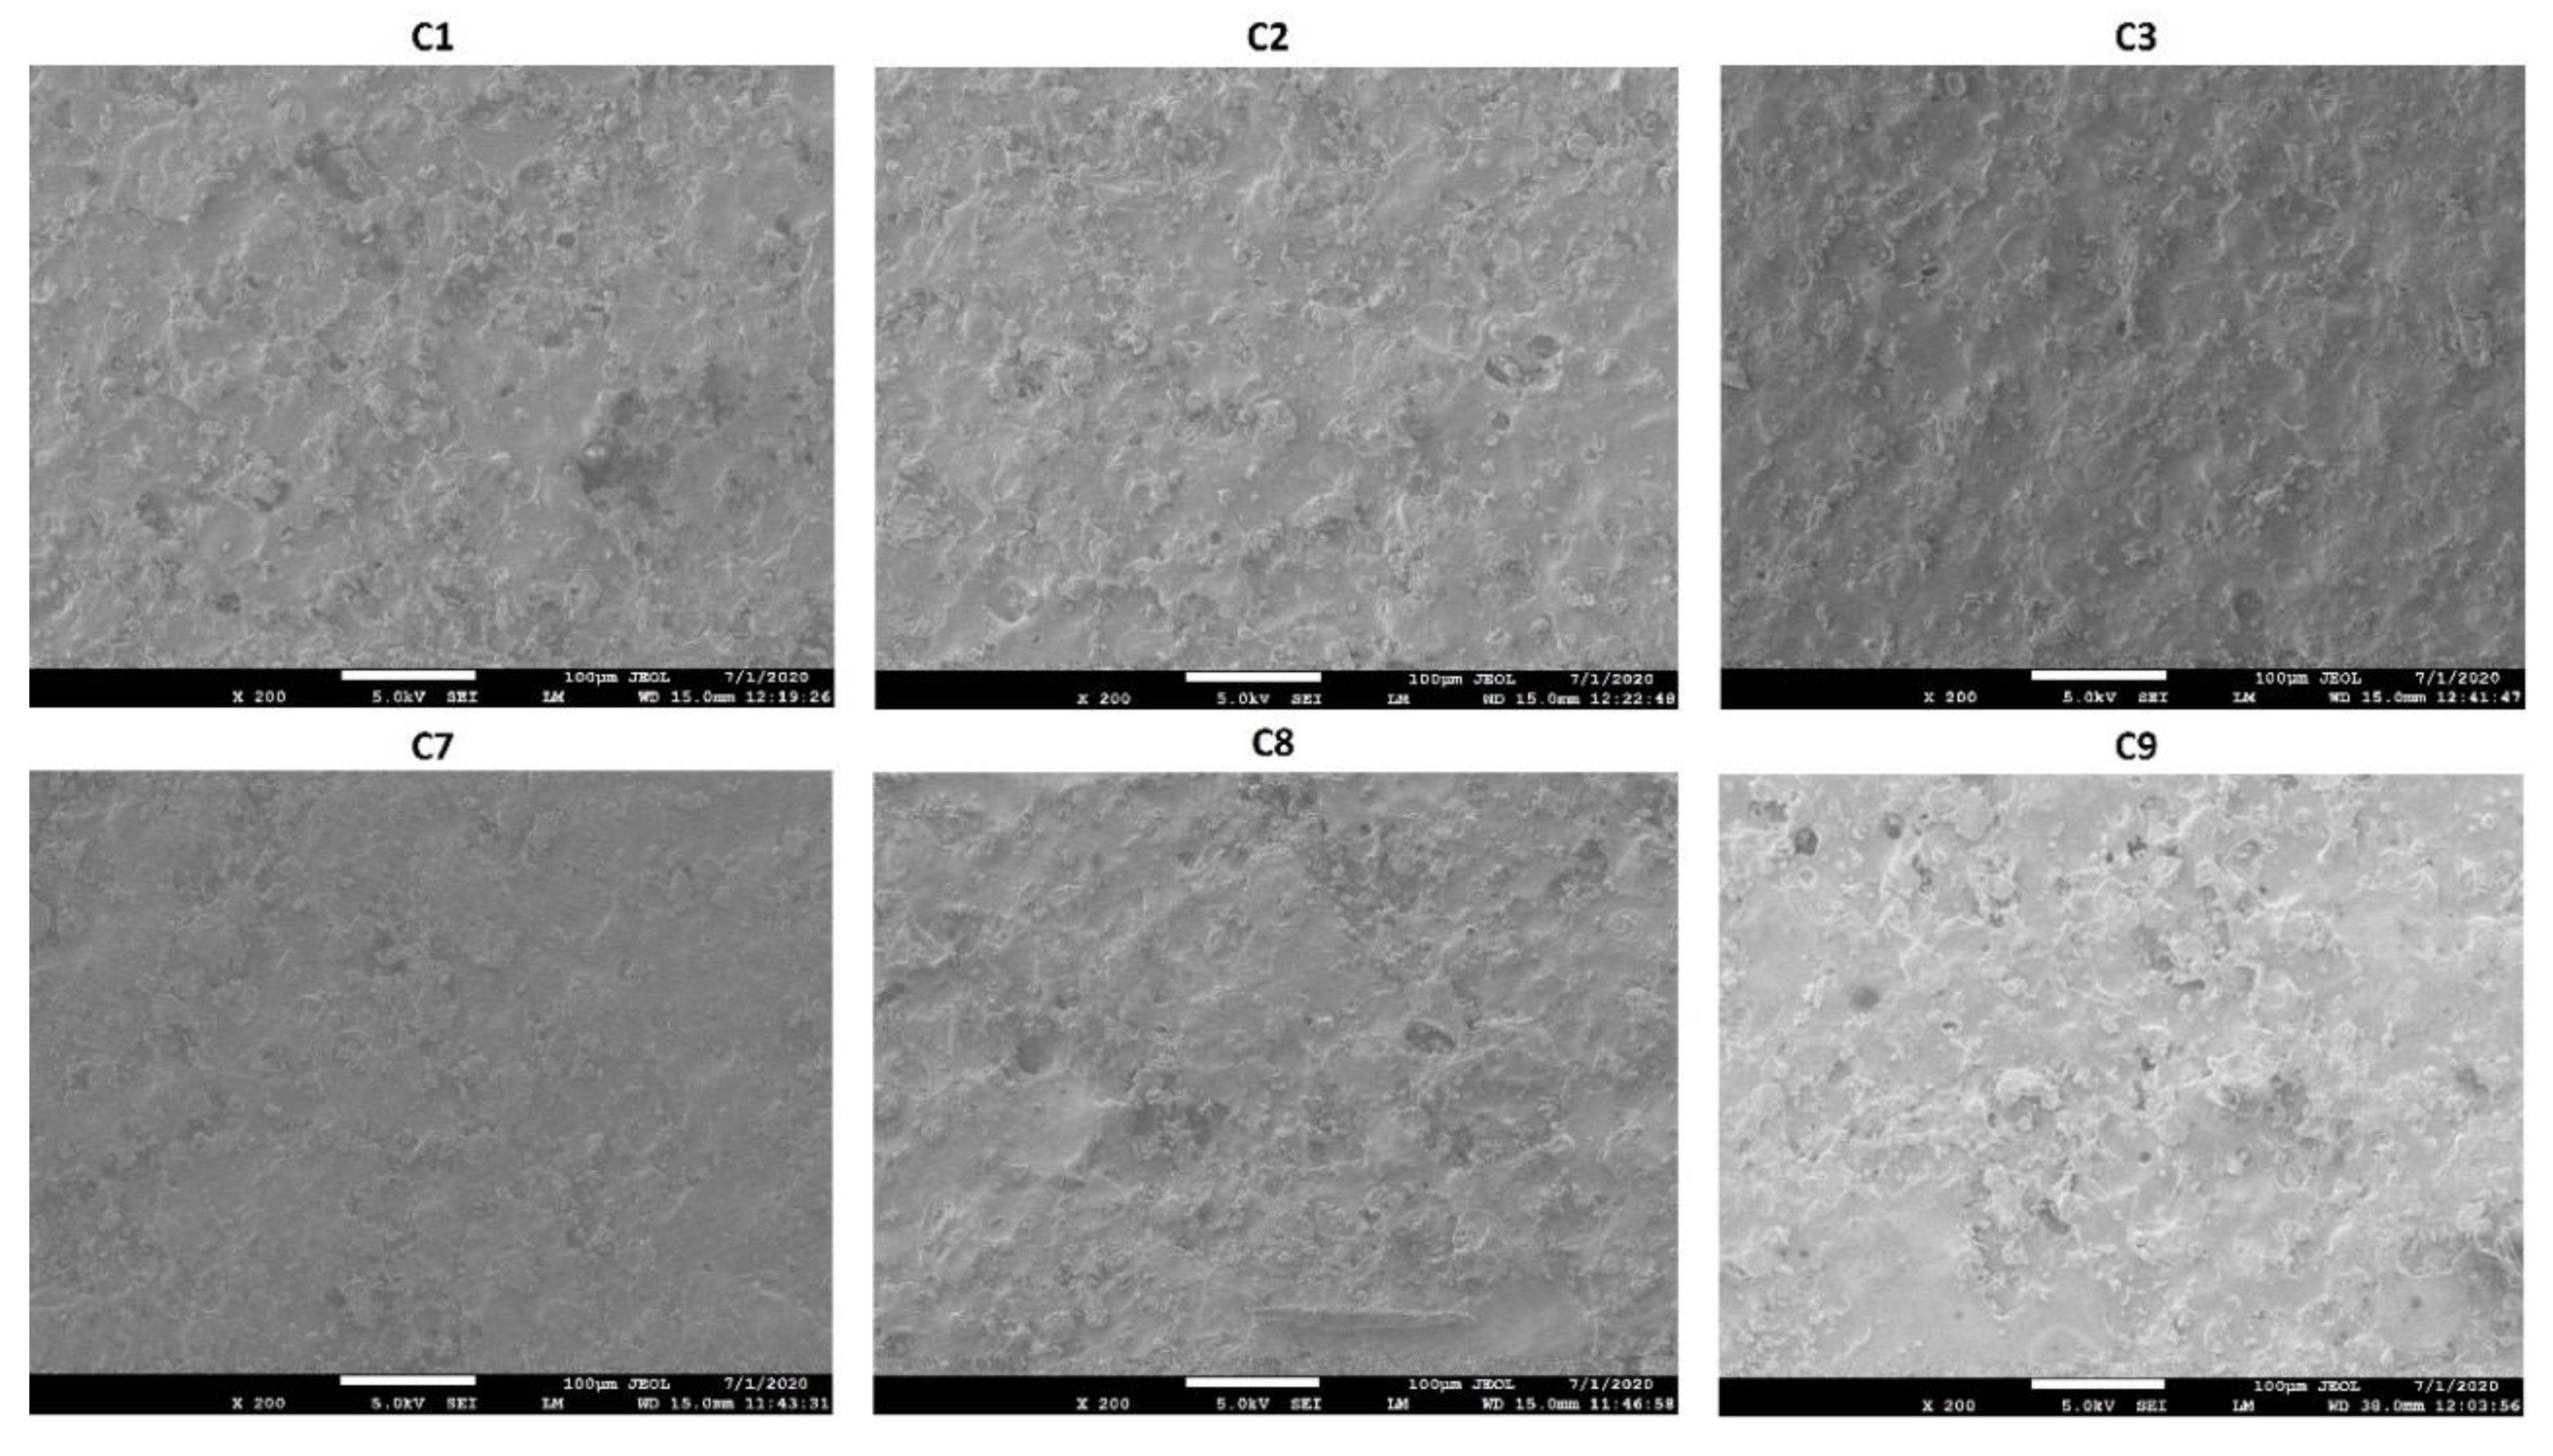
2.2.3. Scanning Electron Microscopy
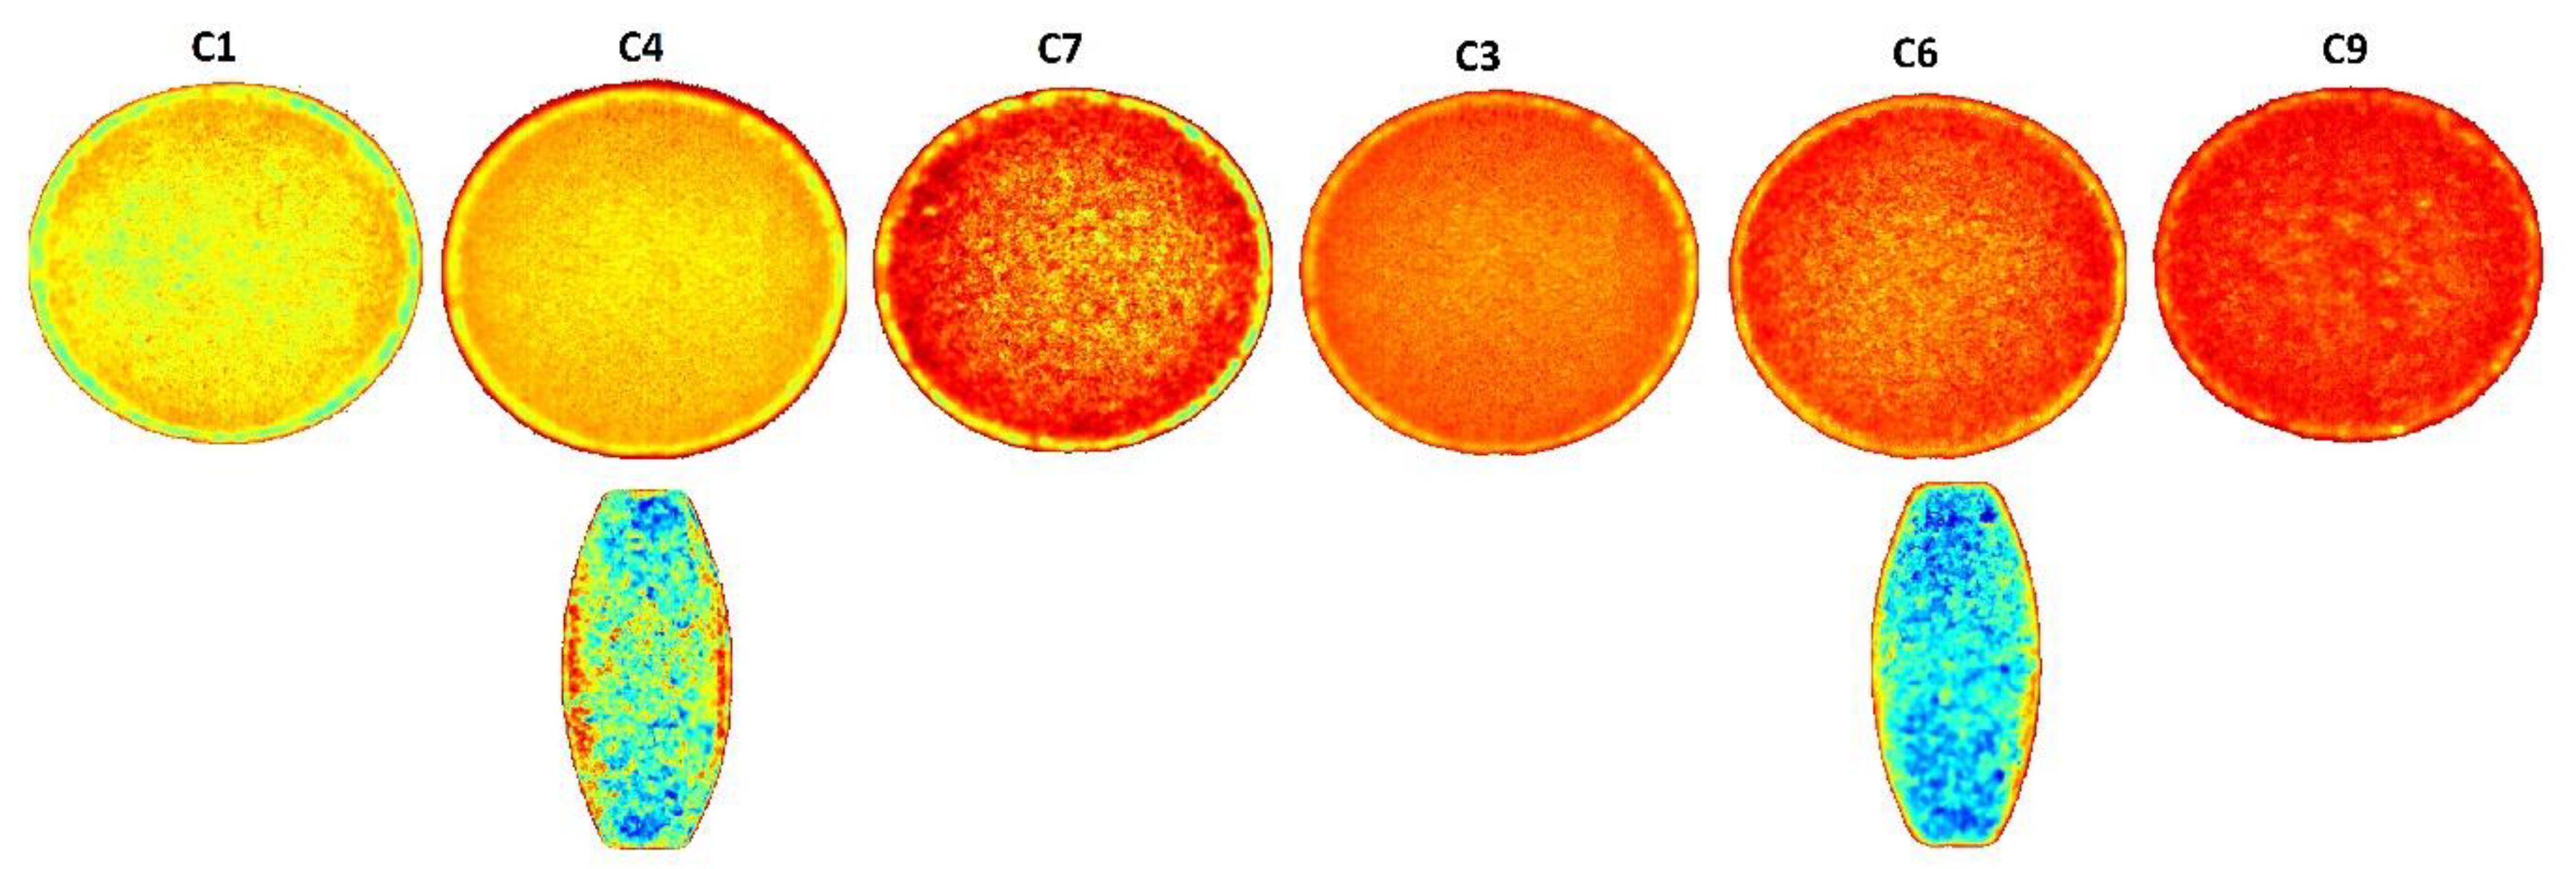
2.2.4. Near Infrared Hyperspectroscopy
2.2.5. Near Infrared Spectroscopy
2.2.6. HPLC Method
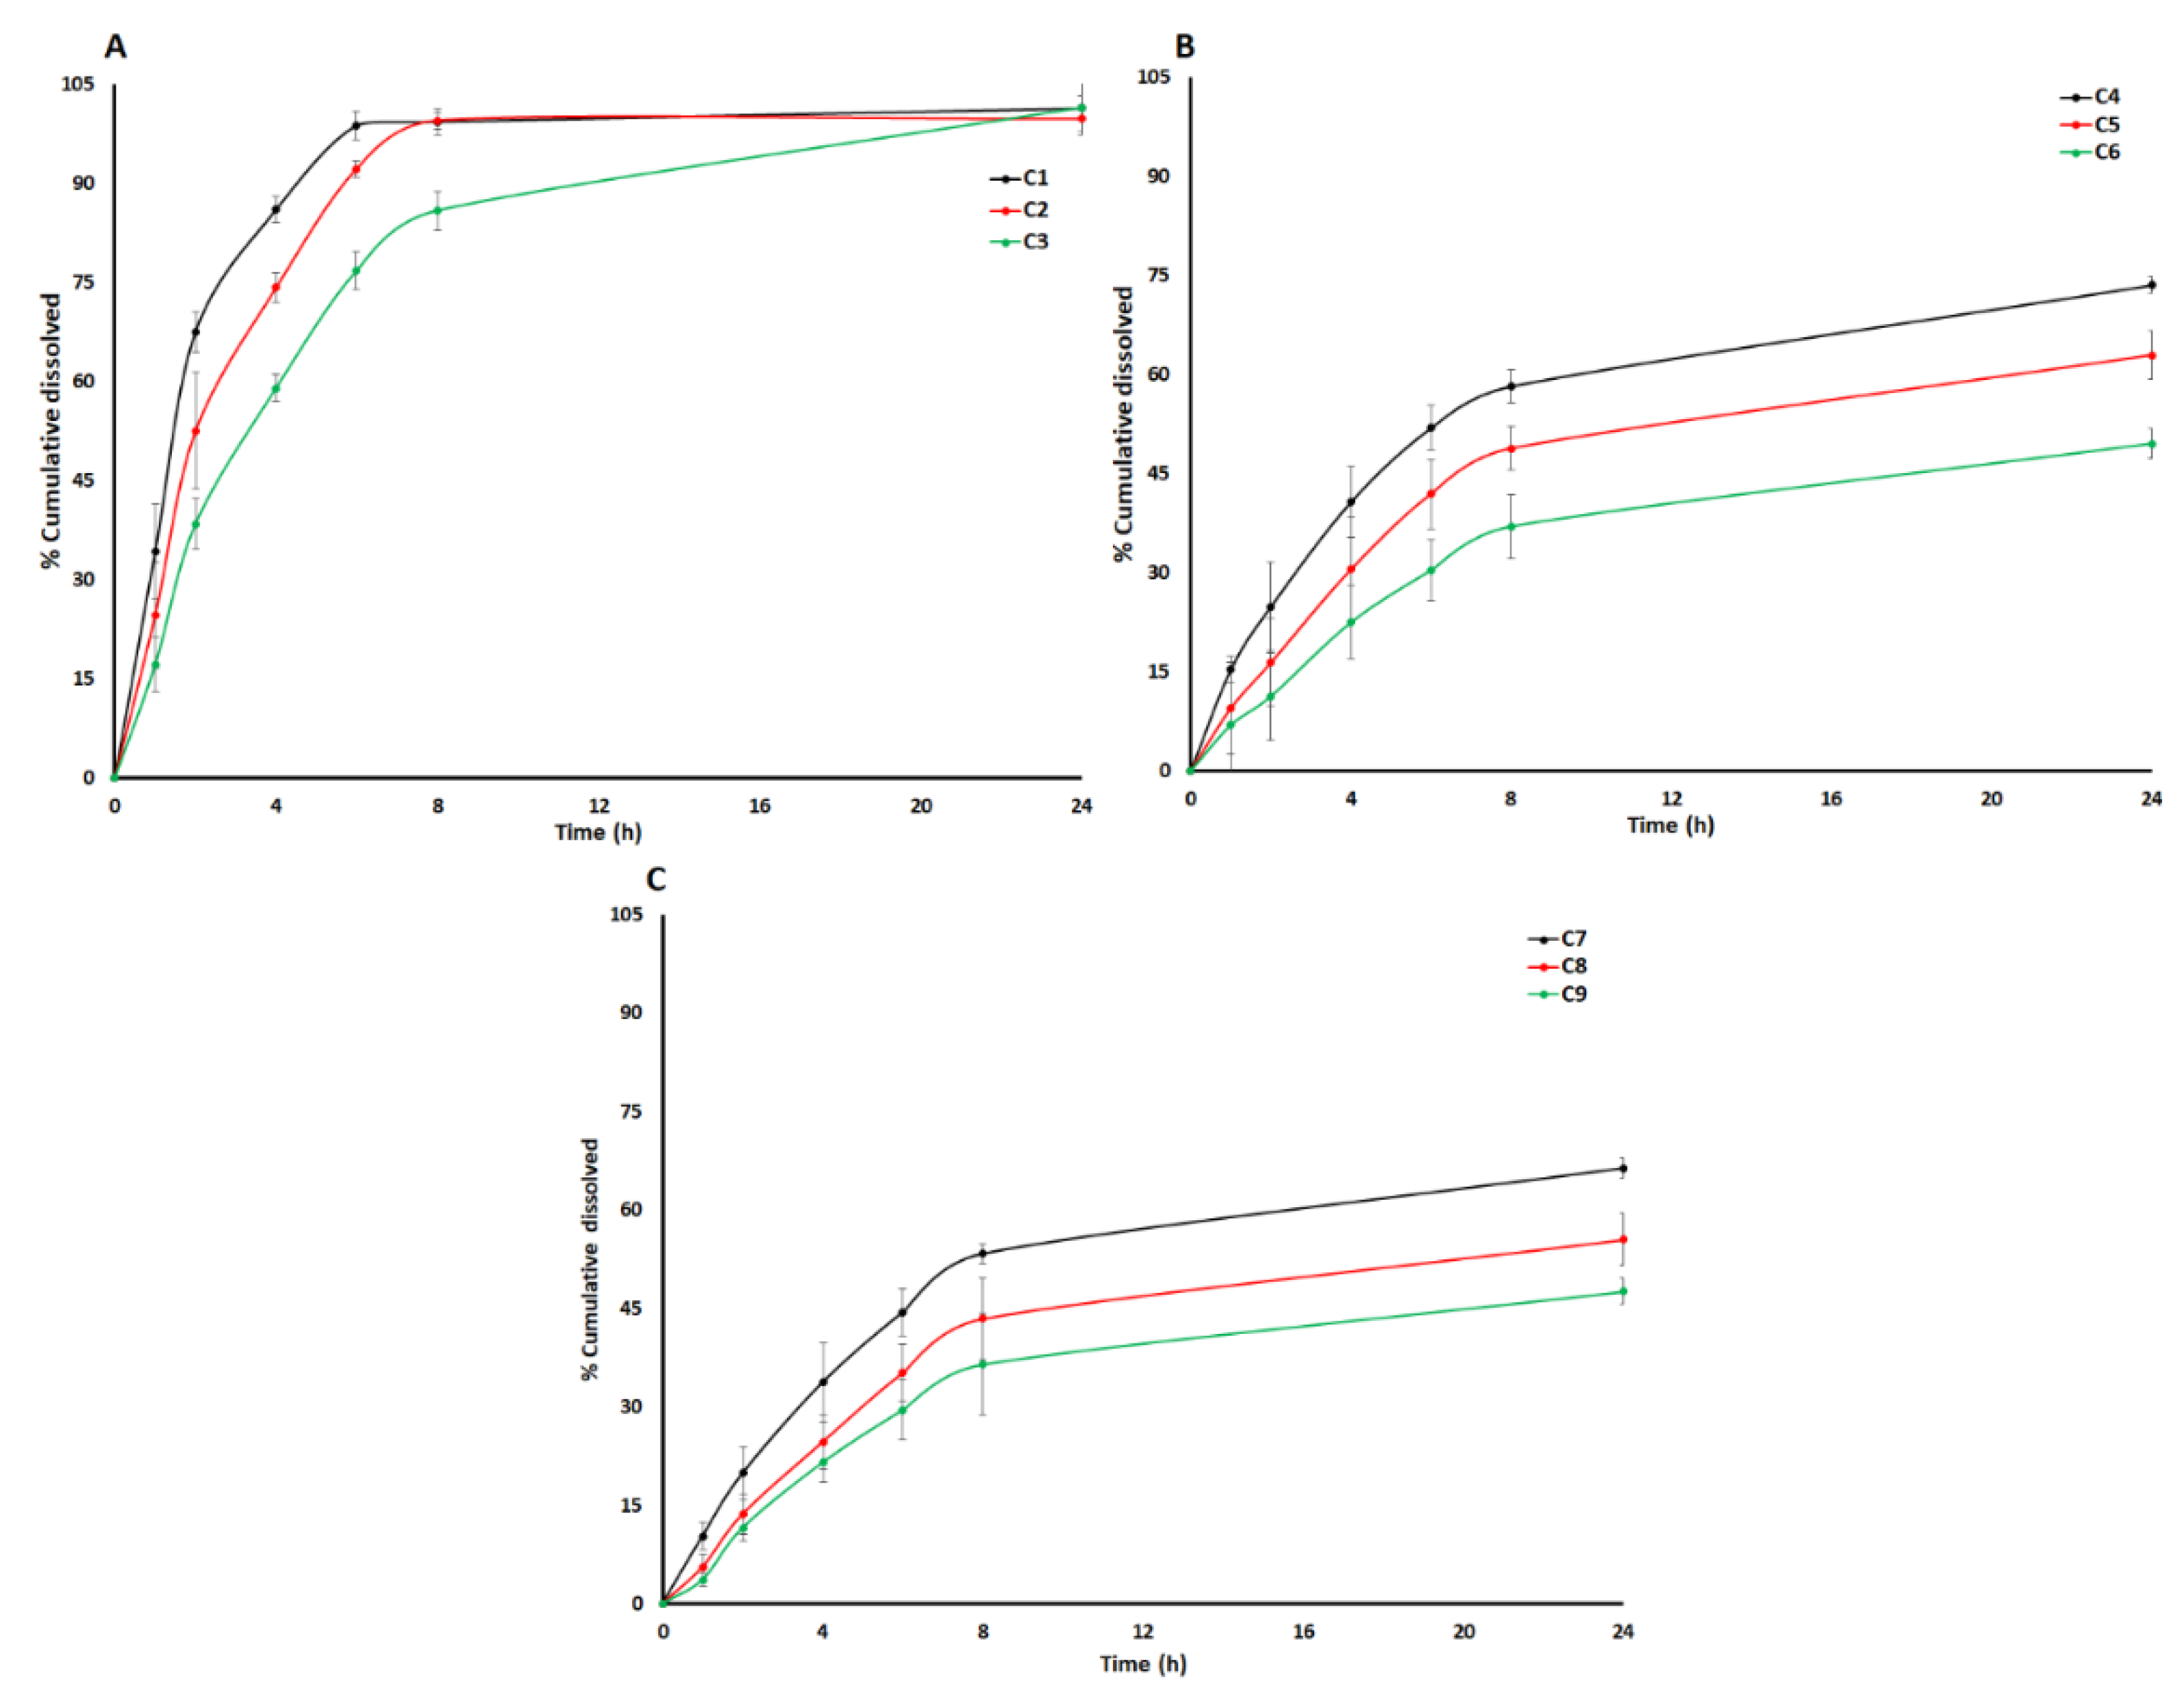
2.2.7. Dissolution
2.2.8. Statistical Analysis
3. Results
3.1. Film Characterization
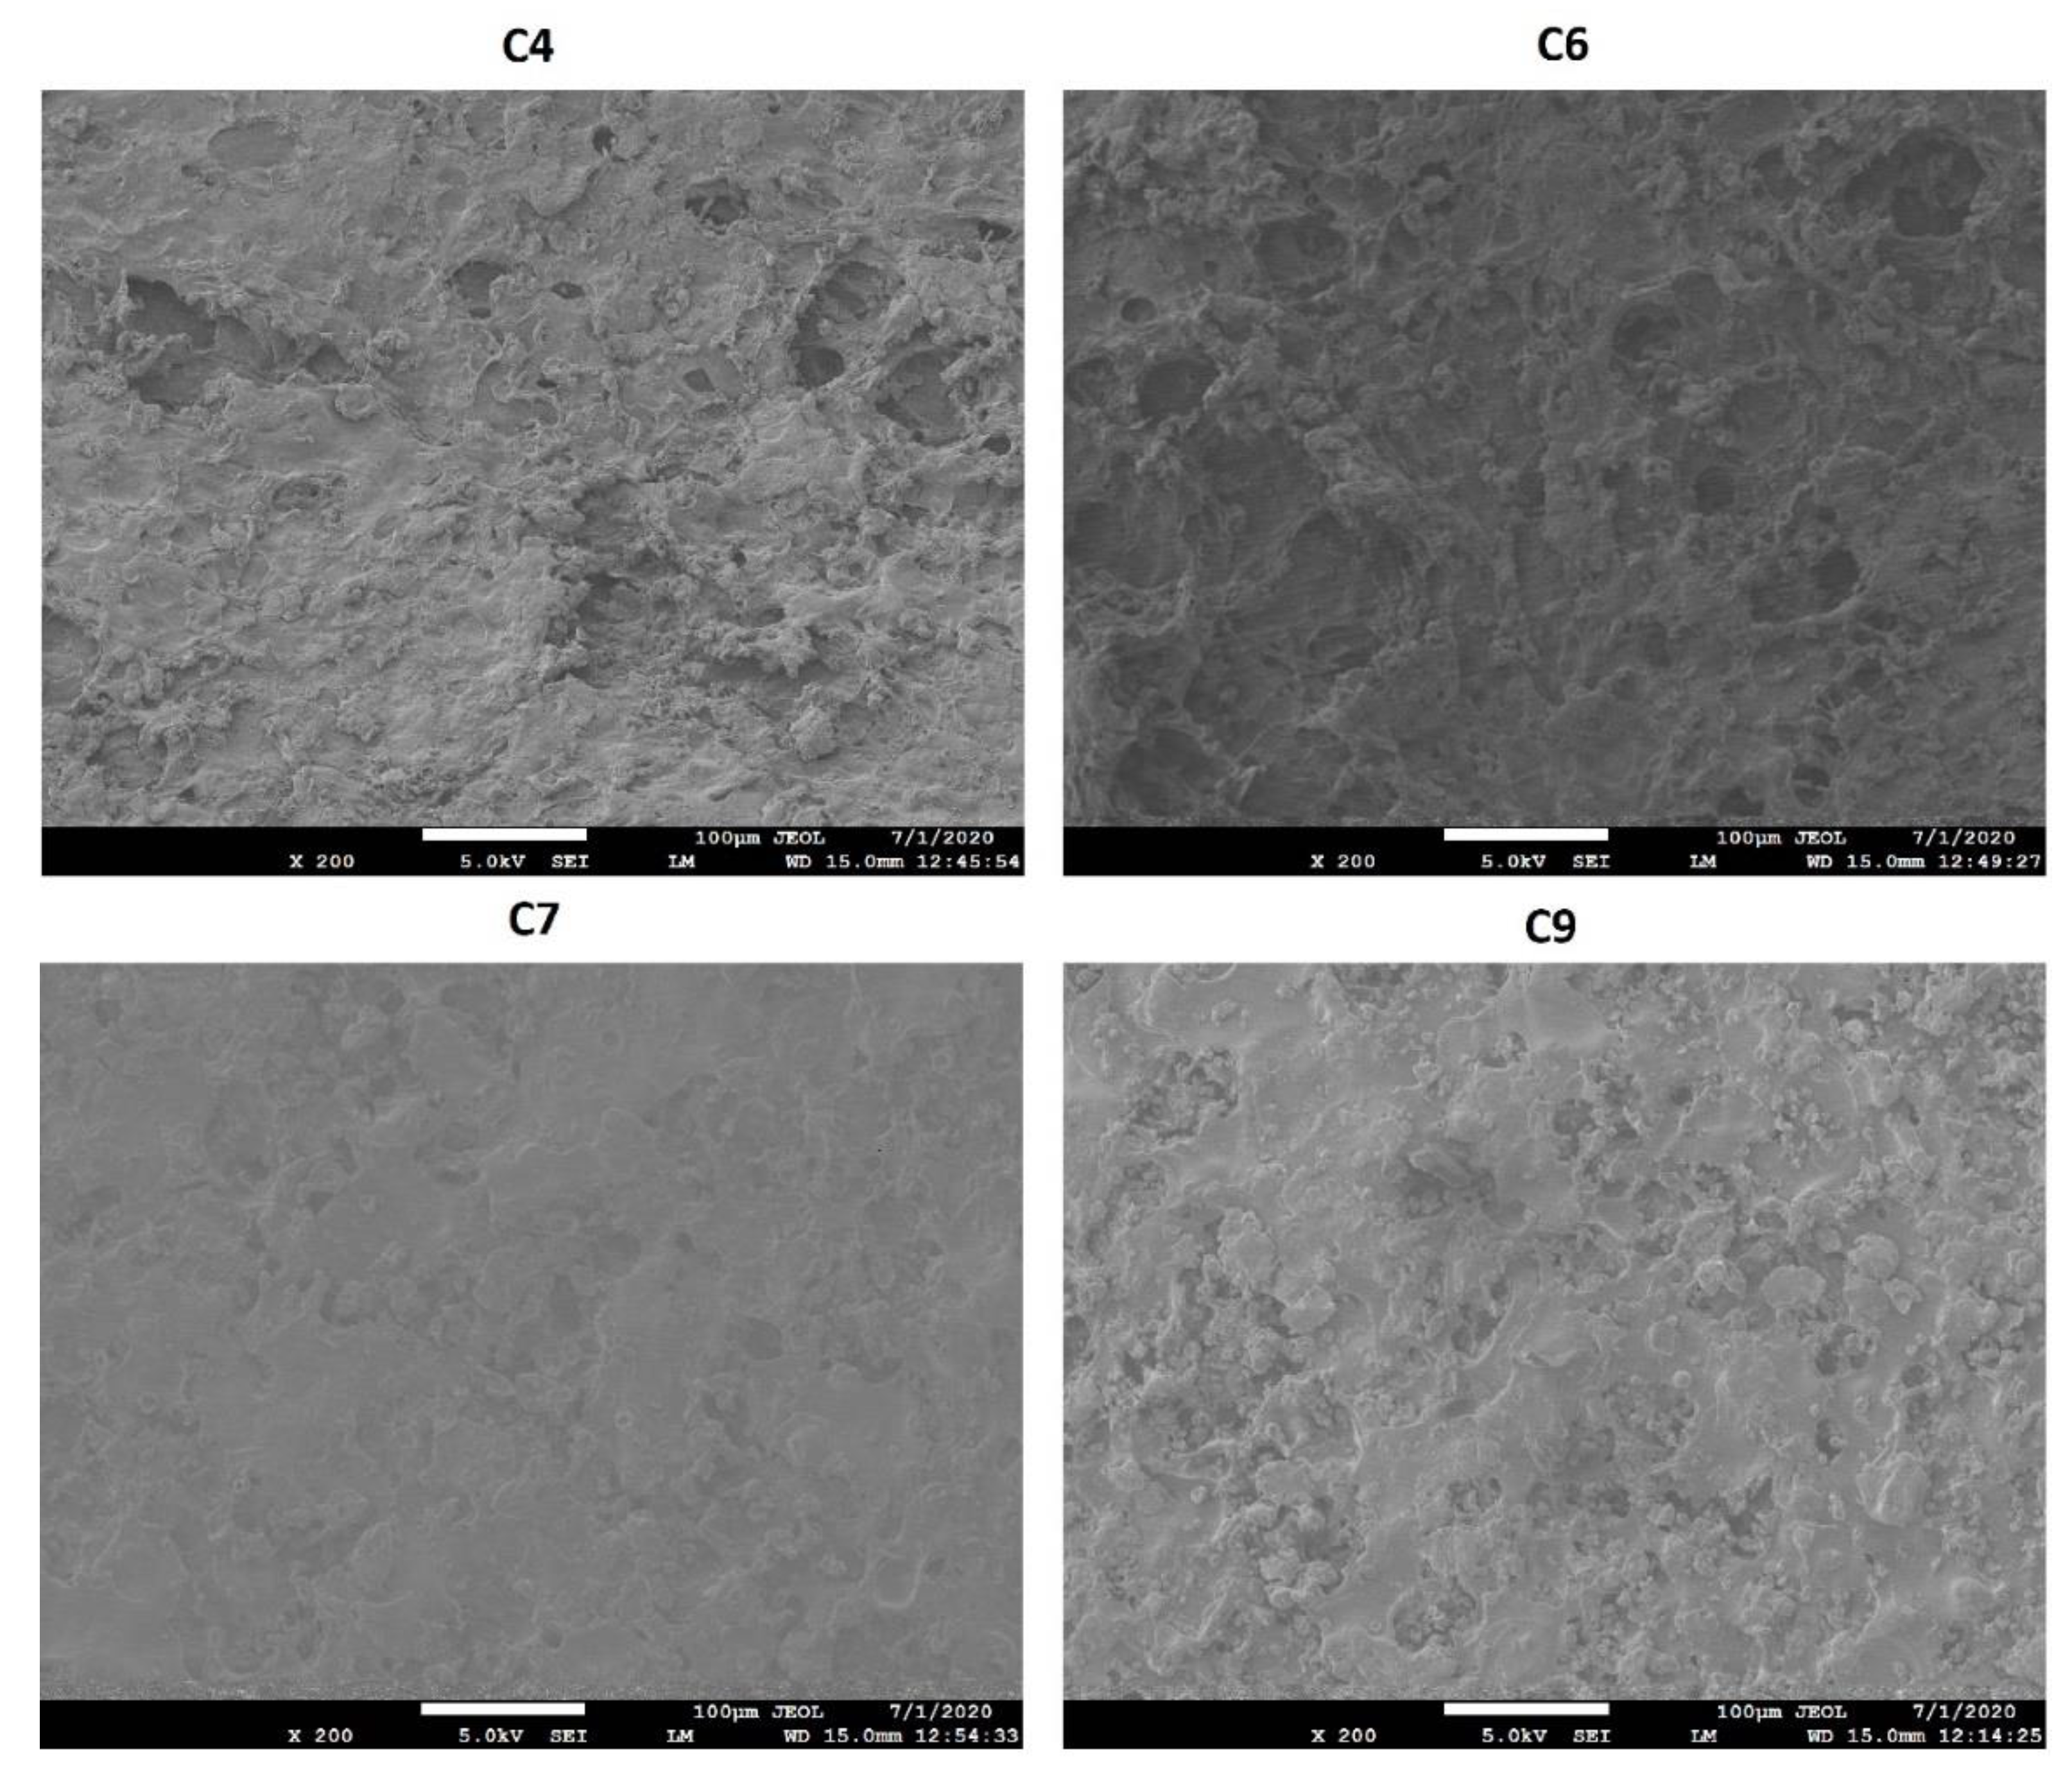
3.1.1. Surface Morphology
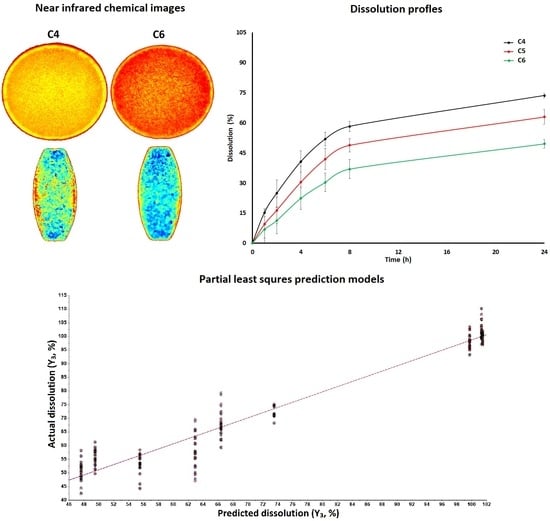
3.1.2. Near Infrared Hyperspectroscopy
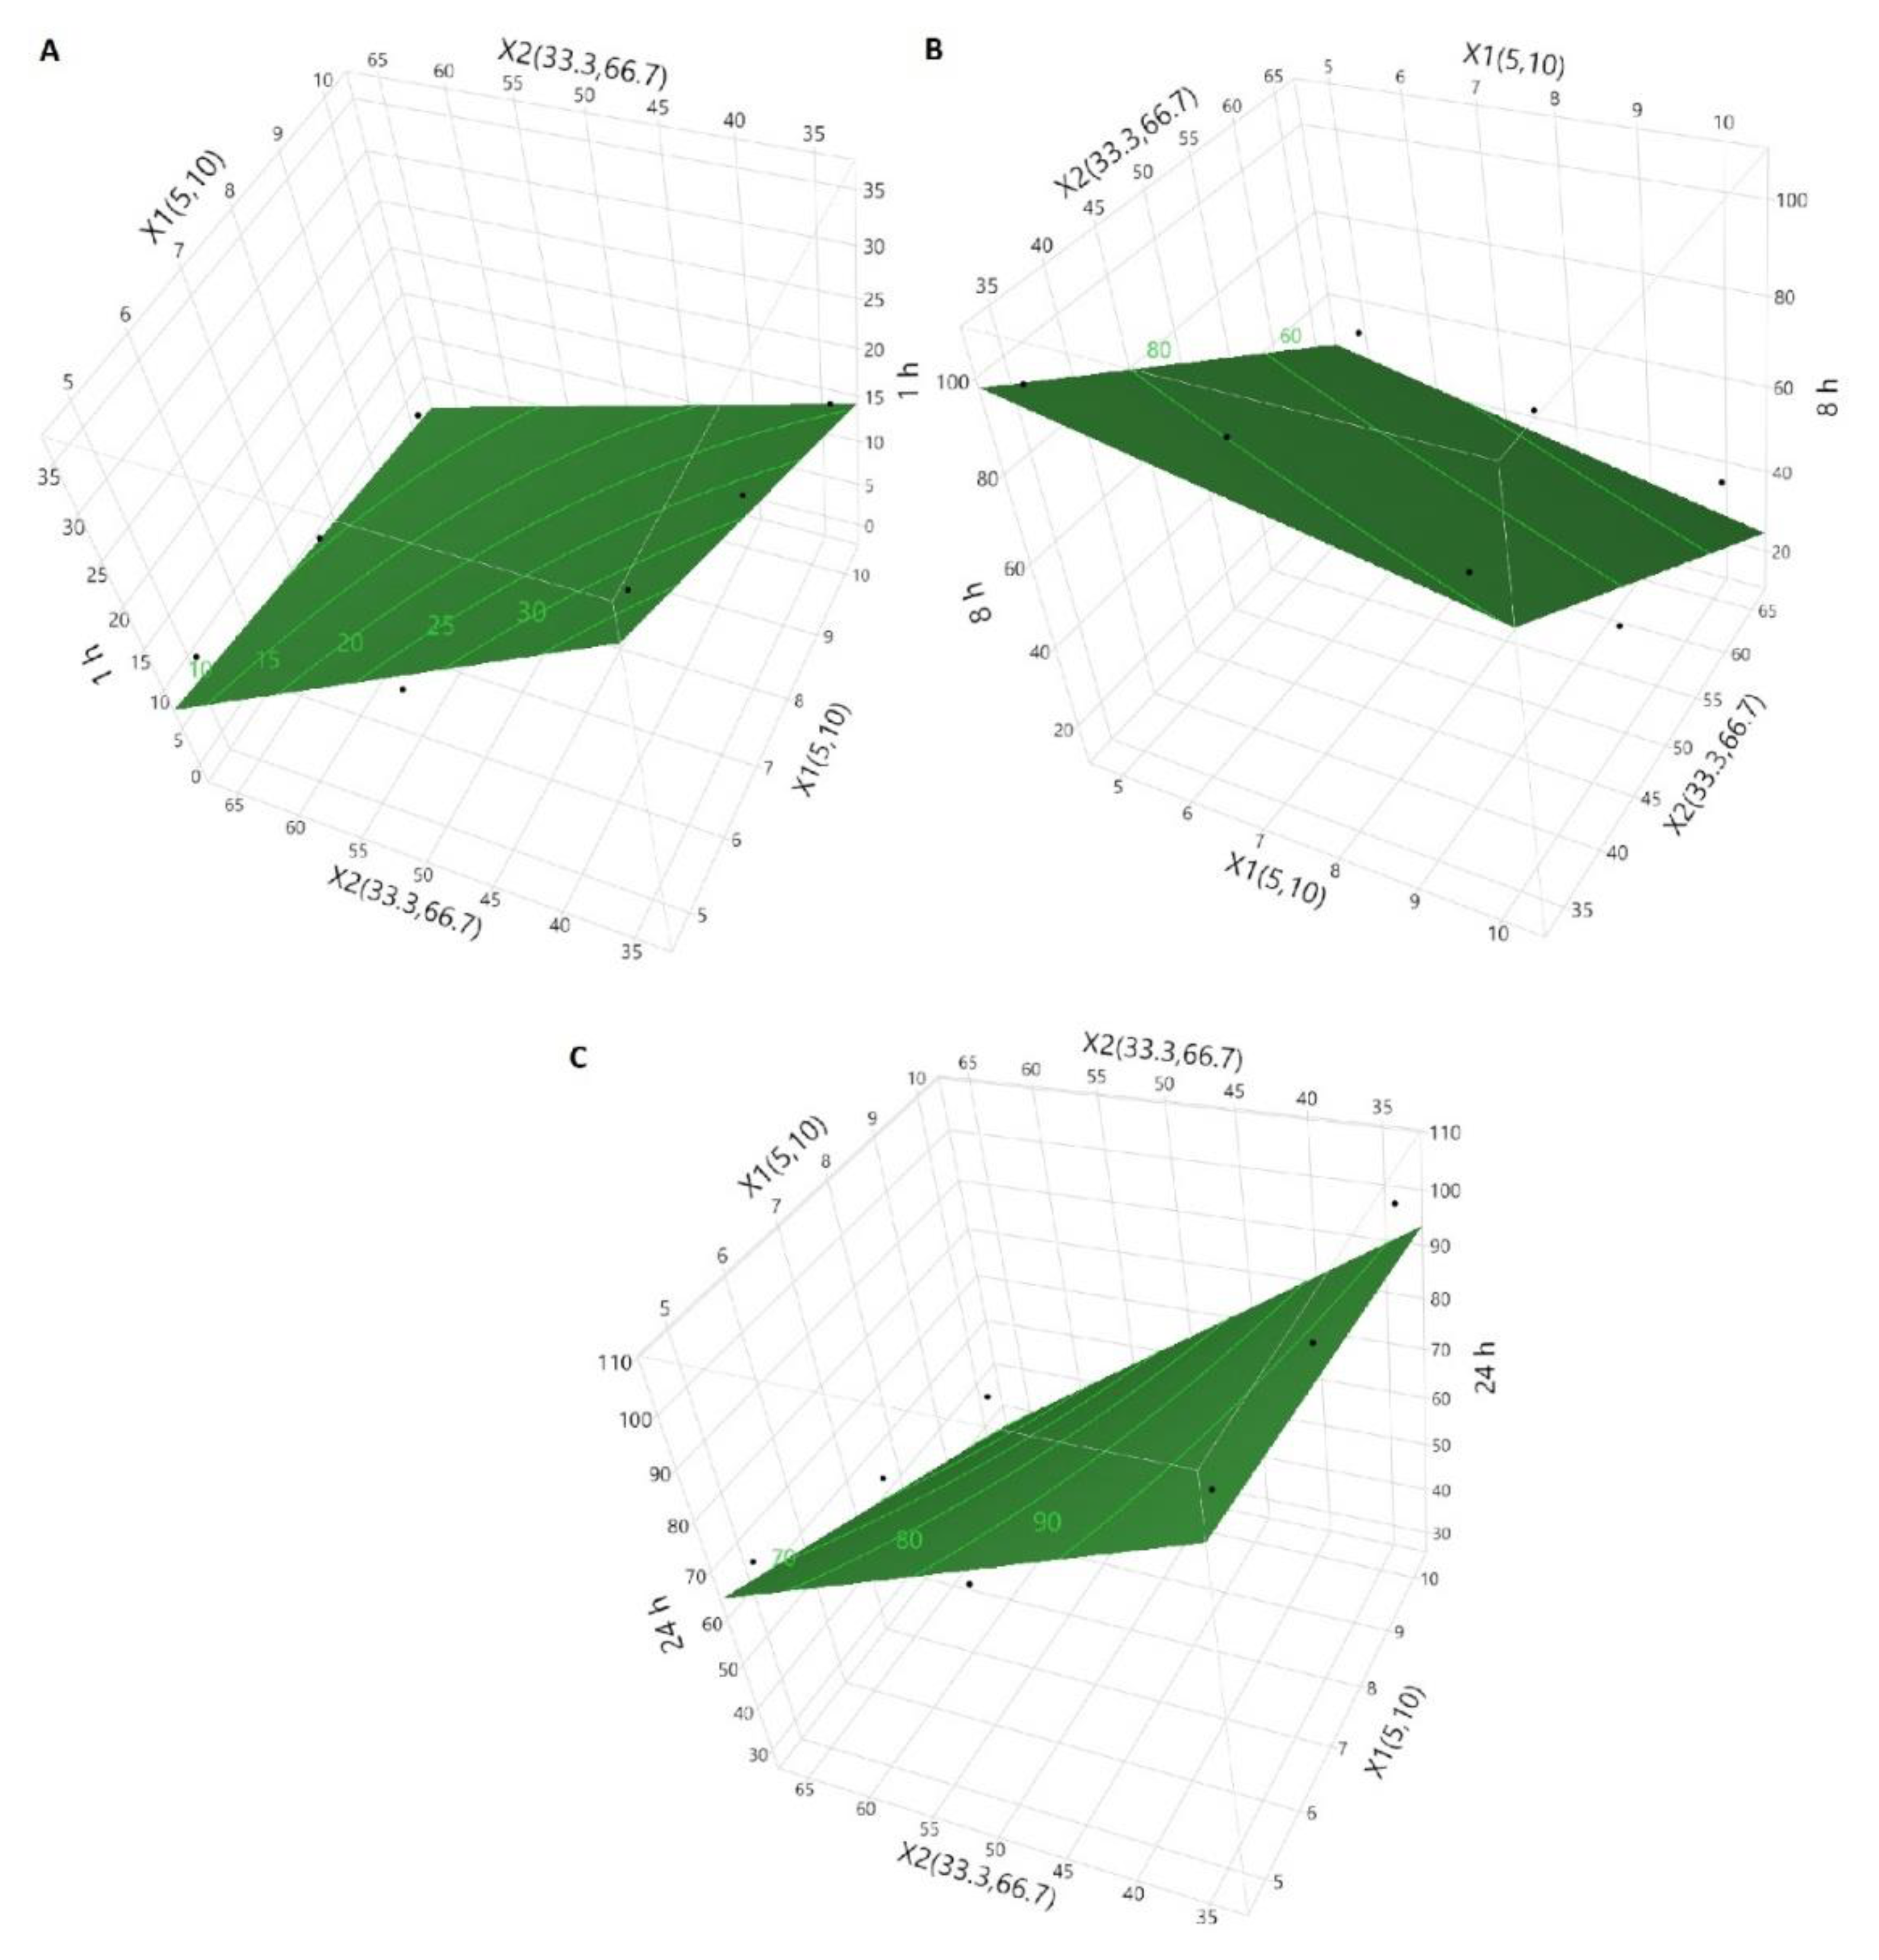
3.2. Dissolution Models by Design of Experiment Approach
3.3. Dissolution Models by Chemometric Approach
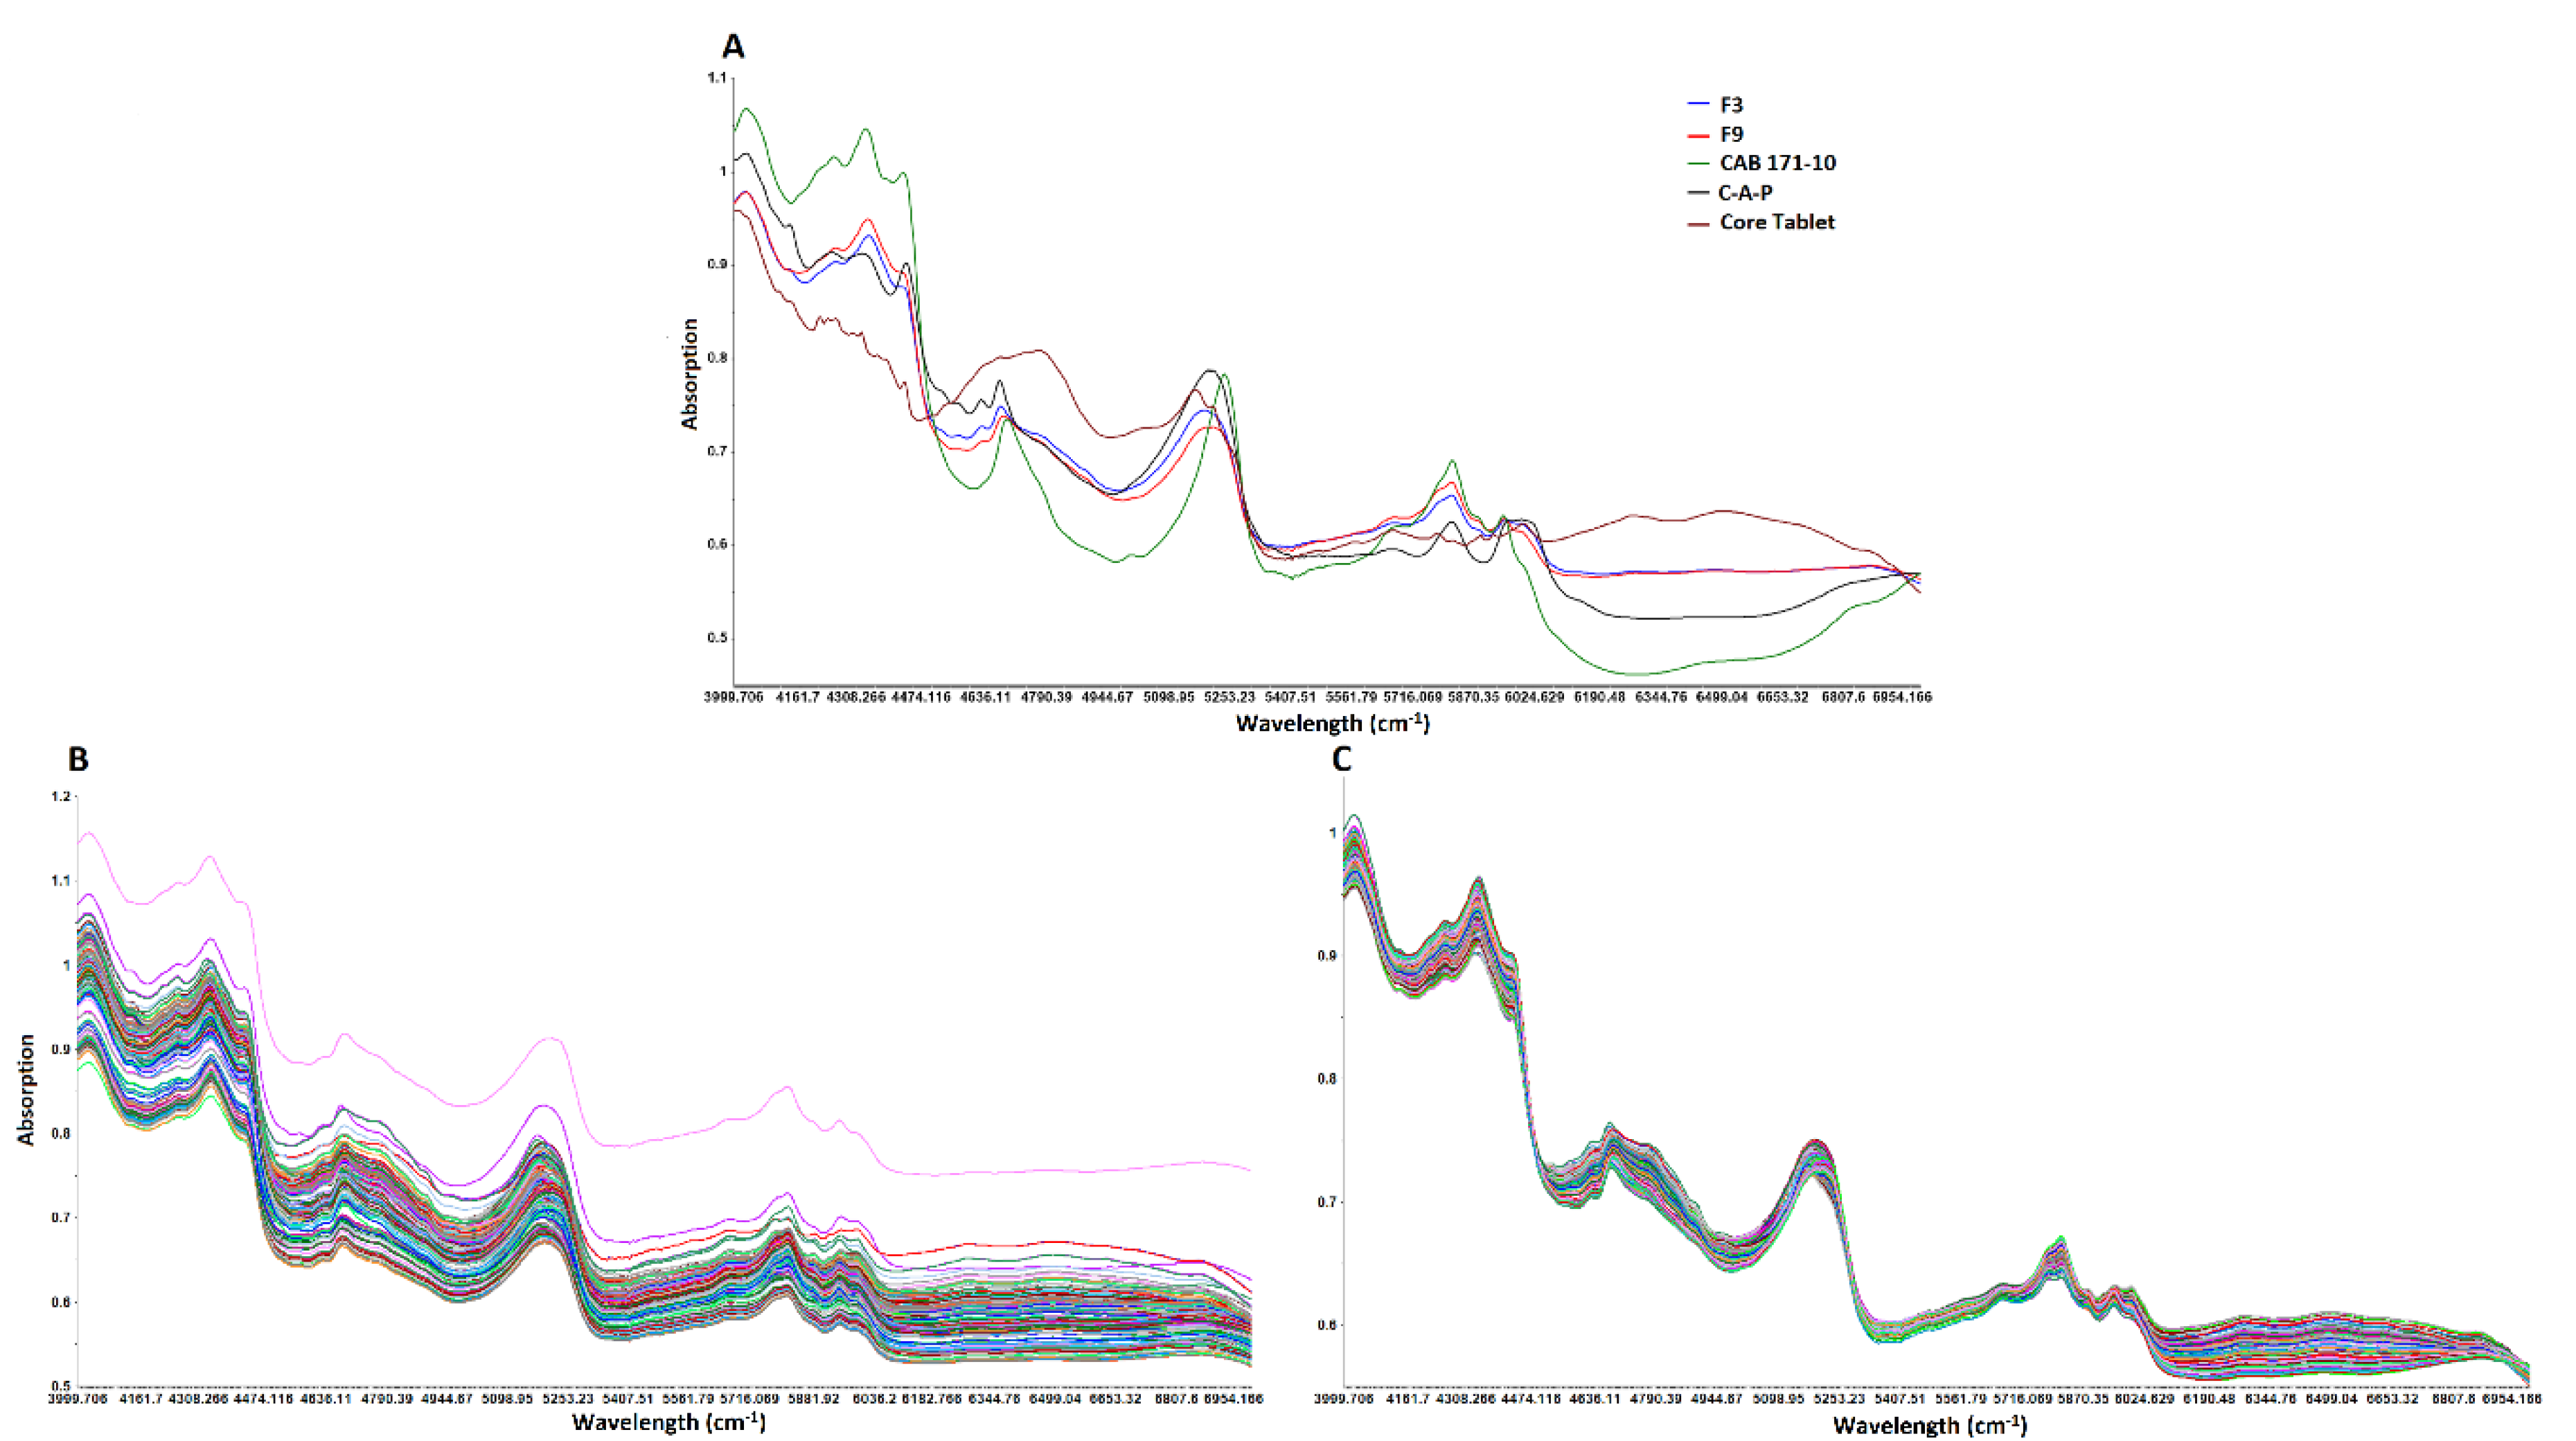
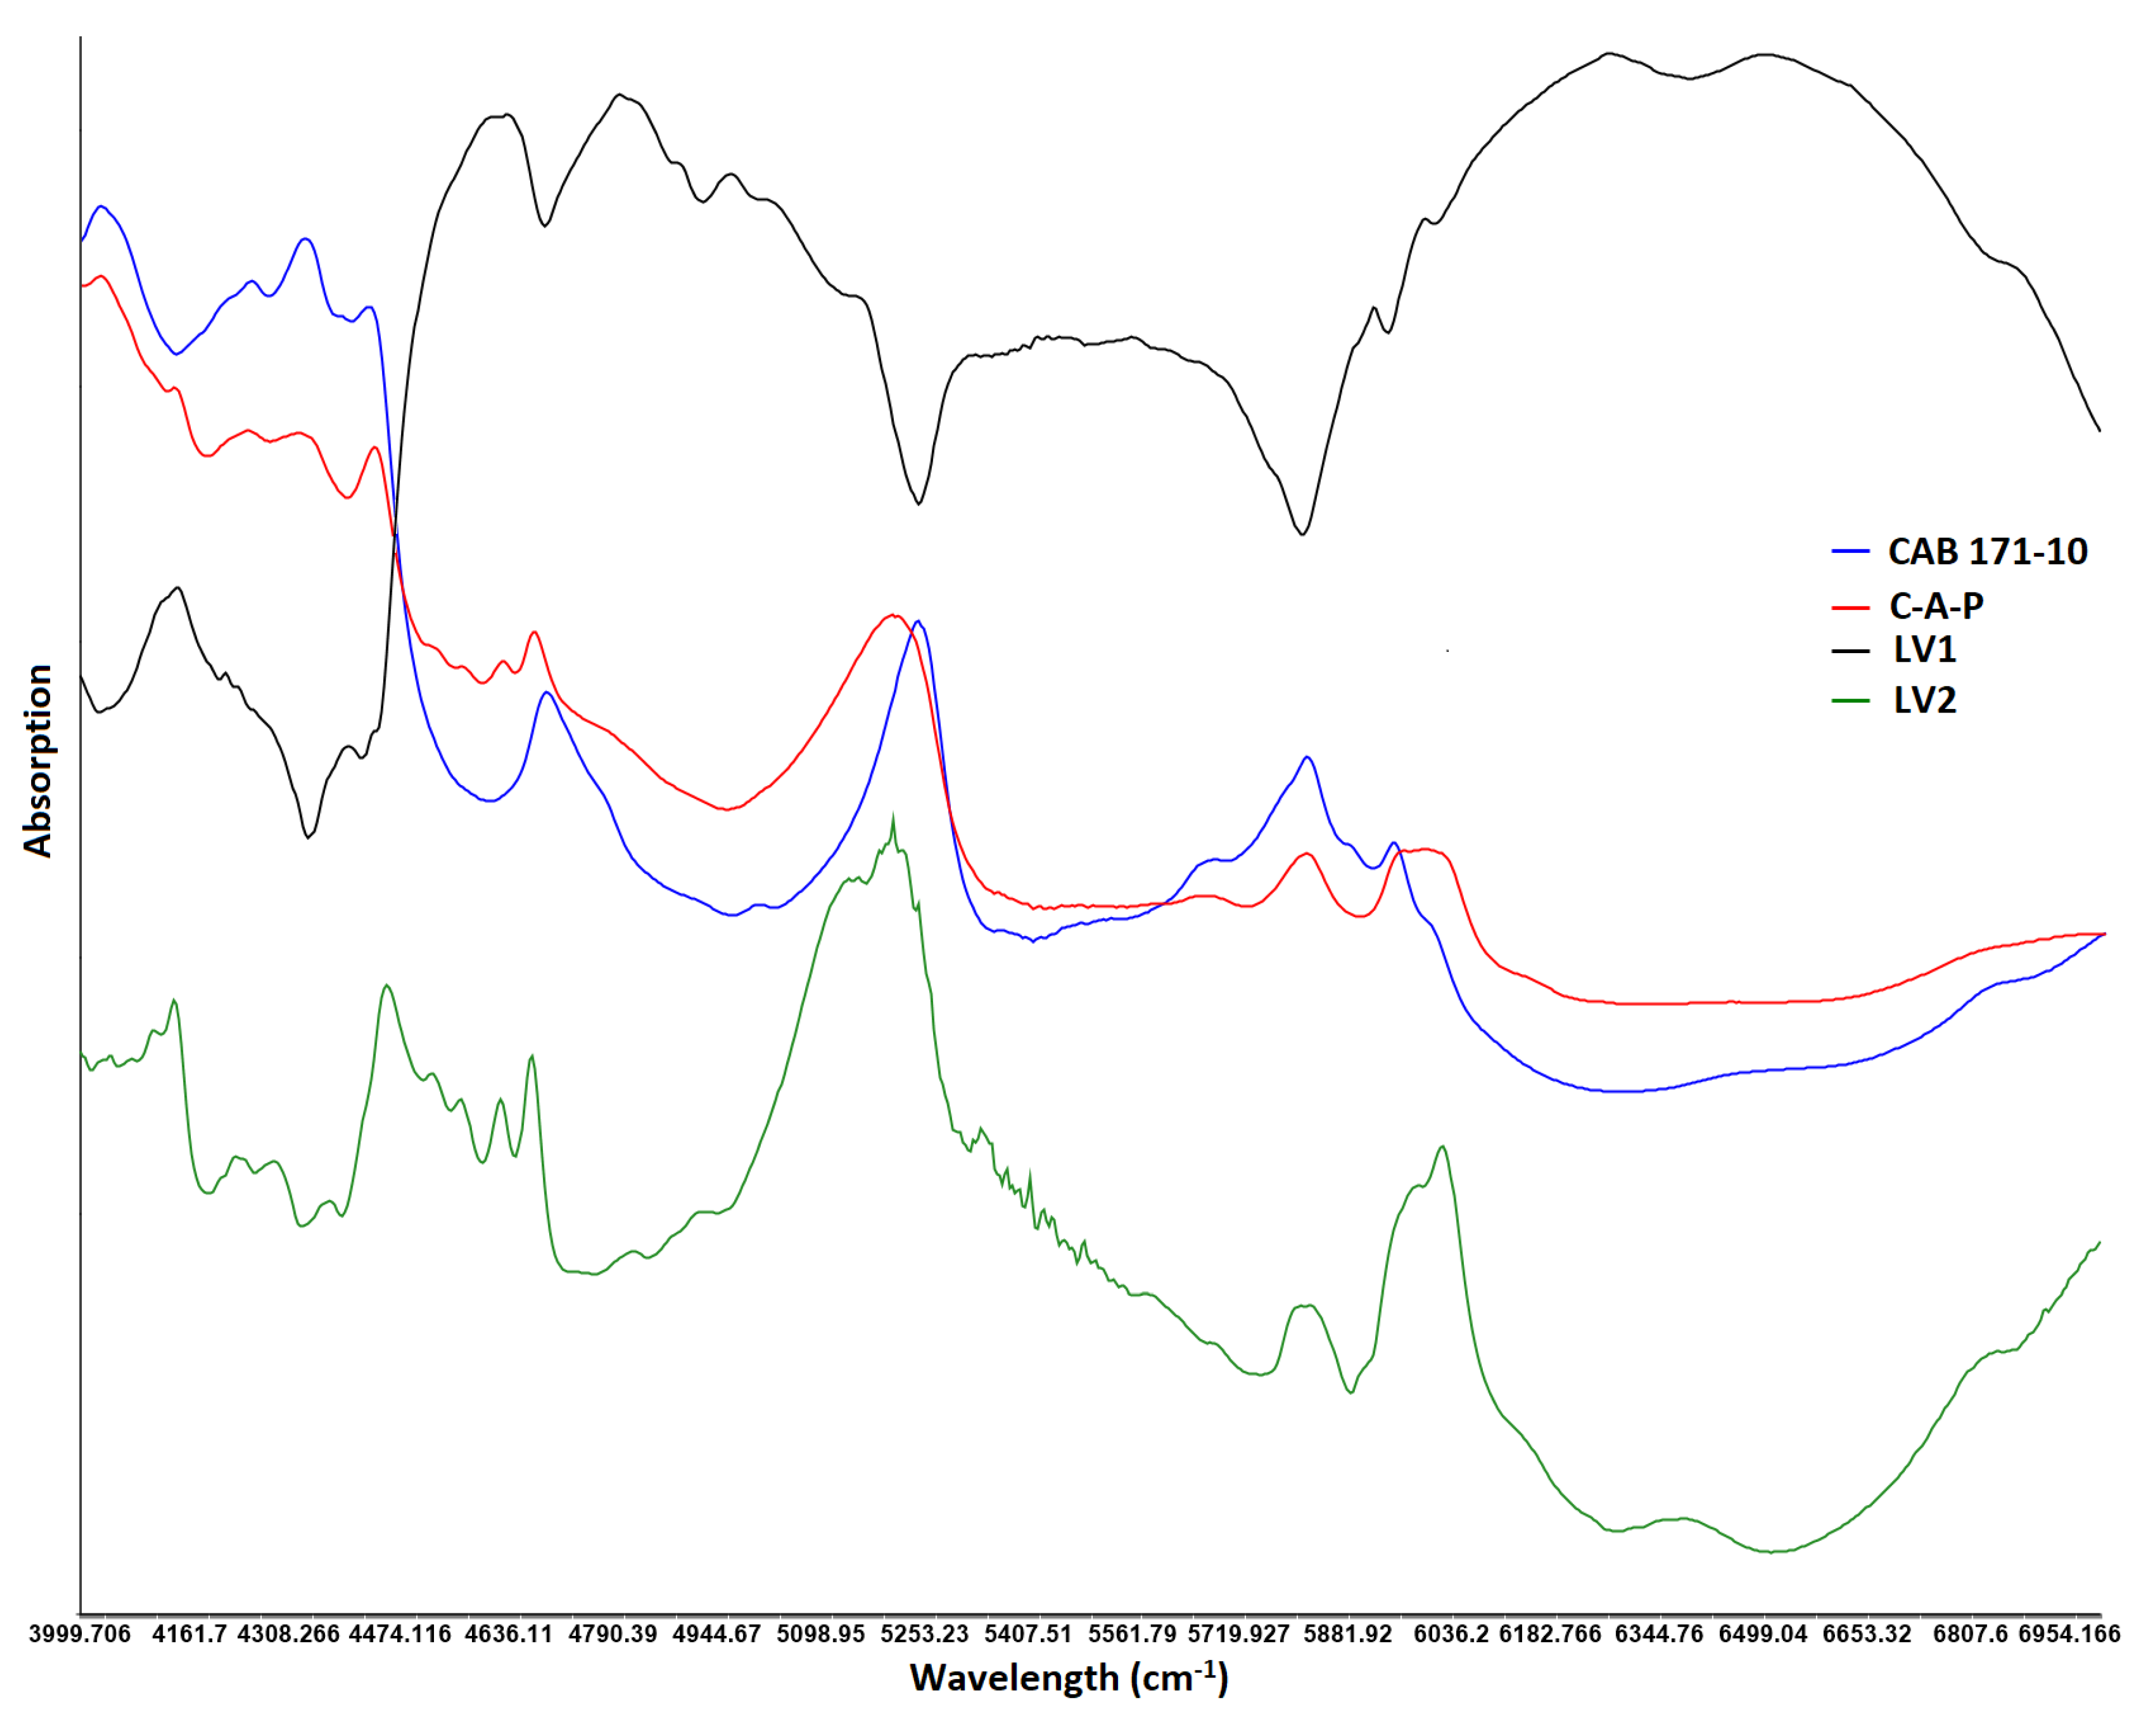
3.3.1. NIR Spectra
3.3.2. Data Pretreatment, Outlier and Number of Latent Variables
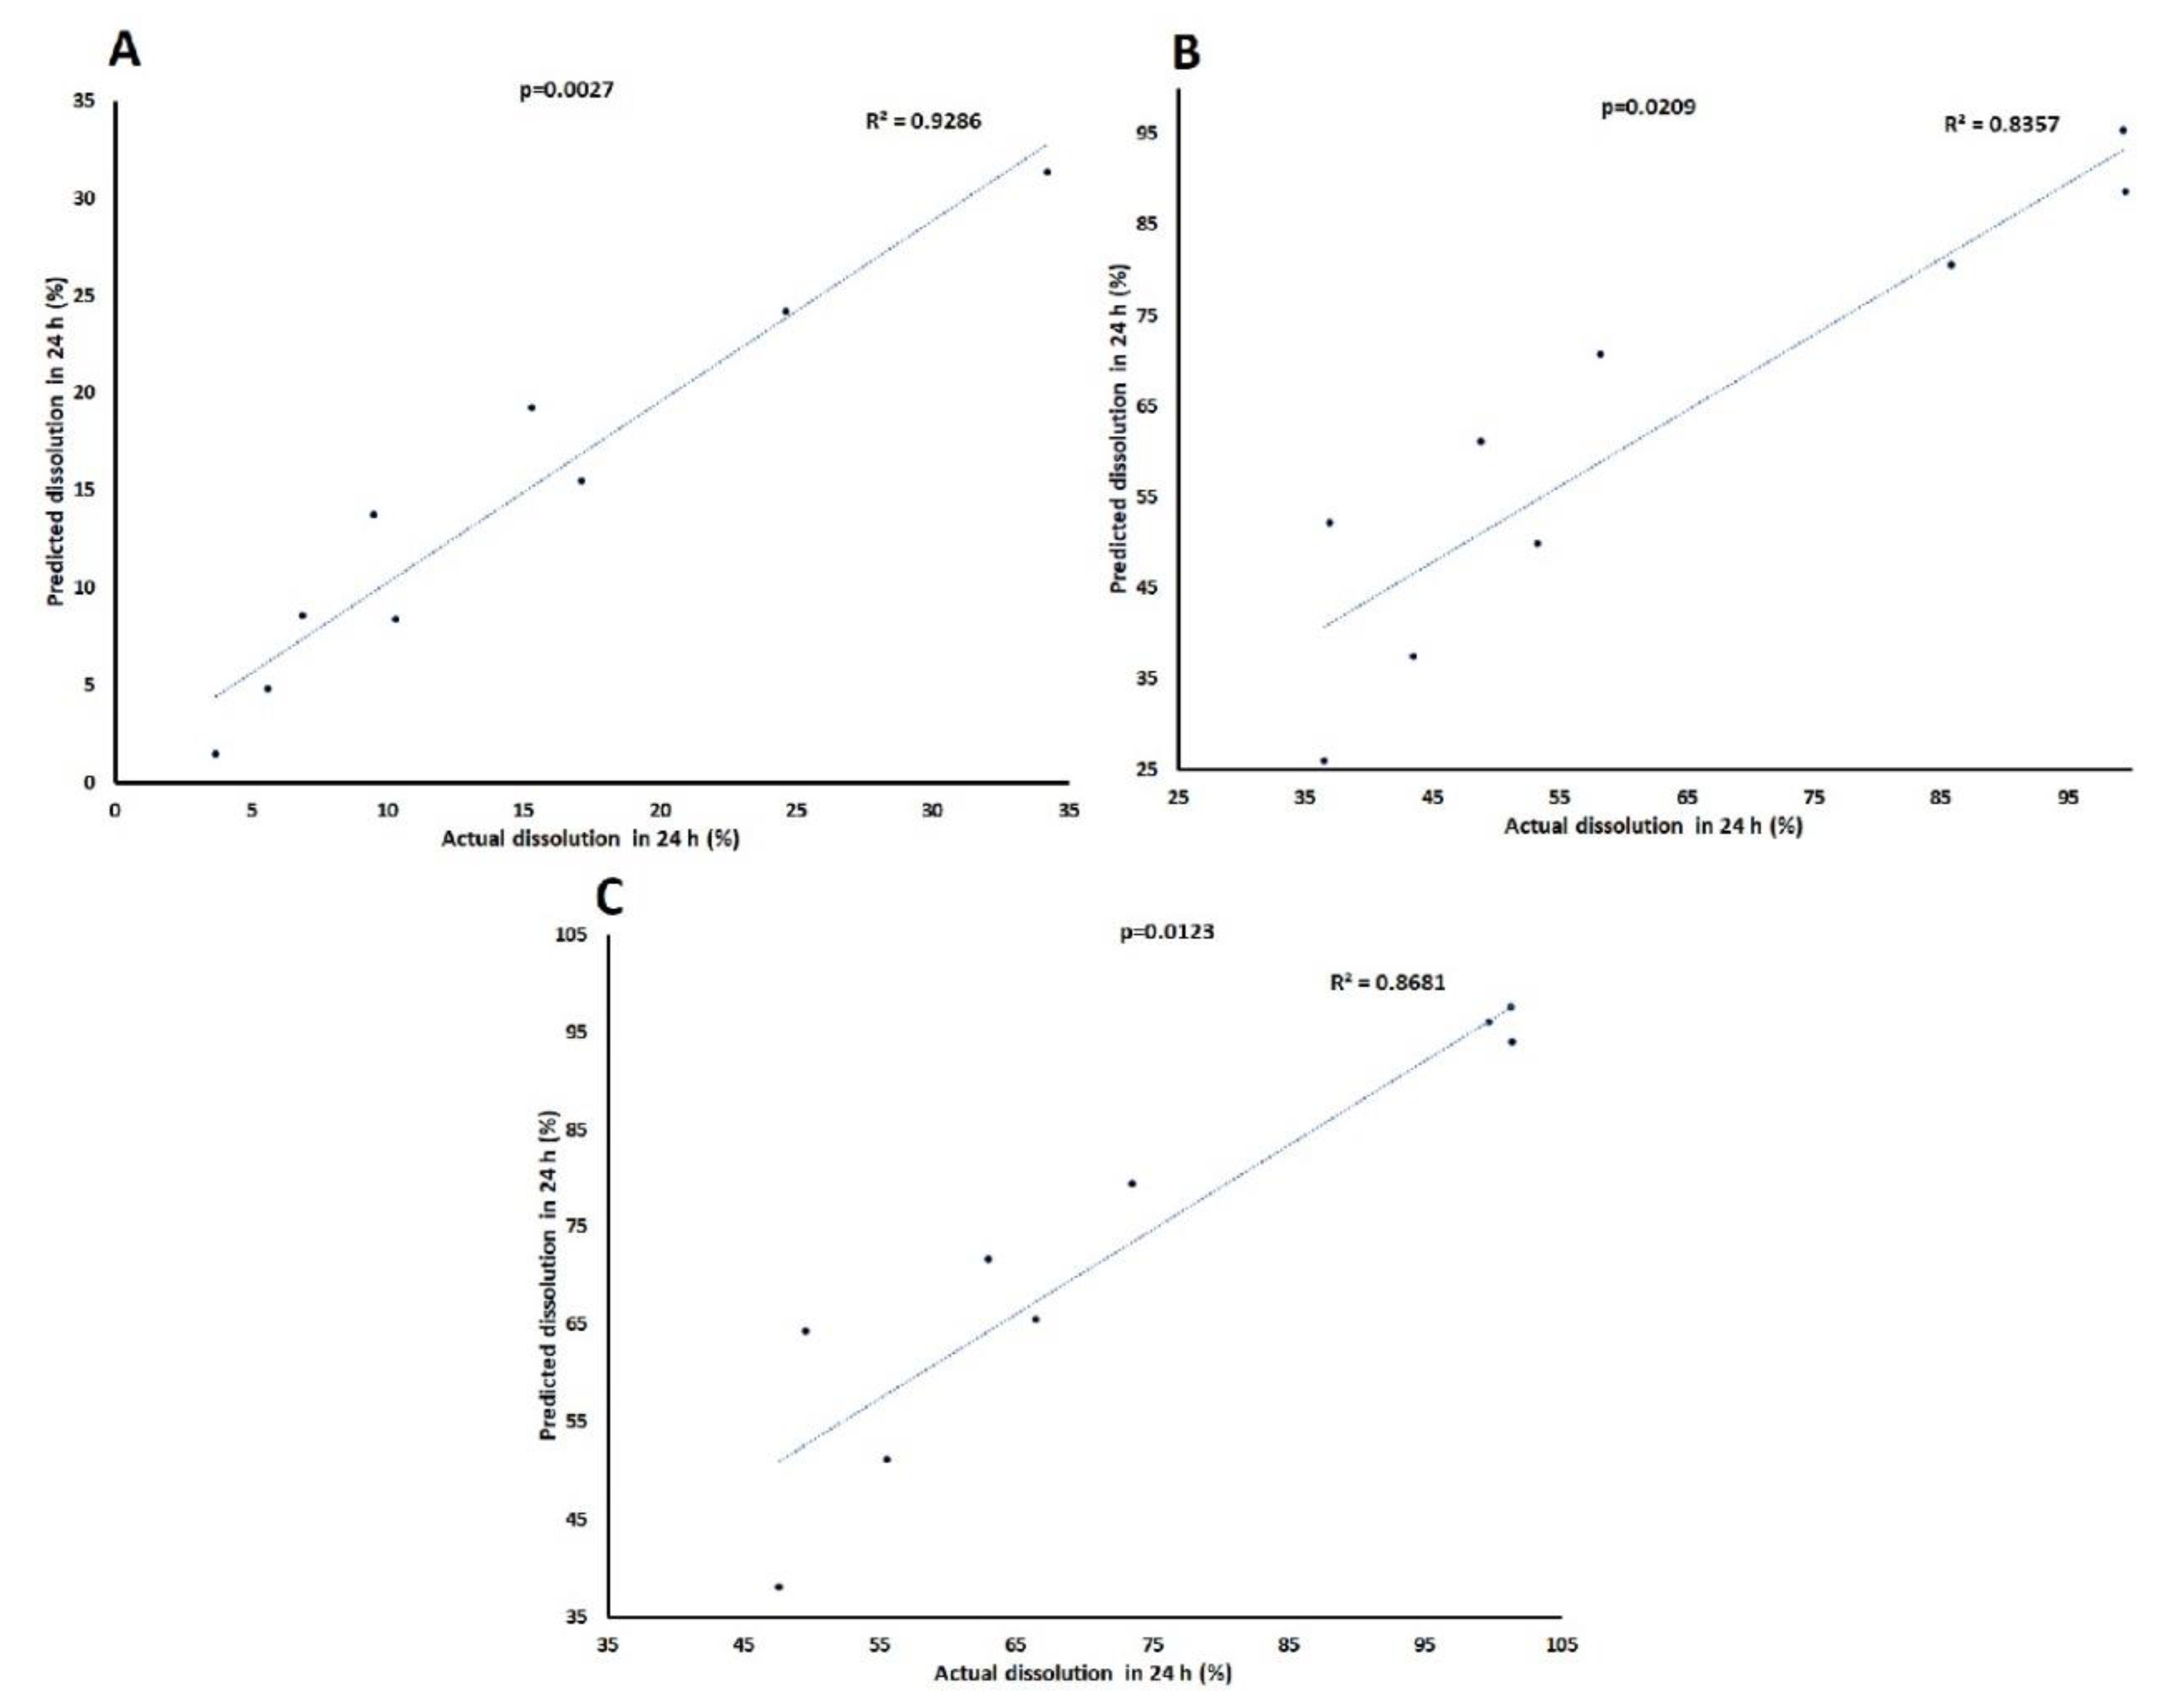
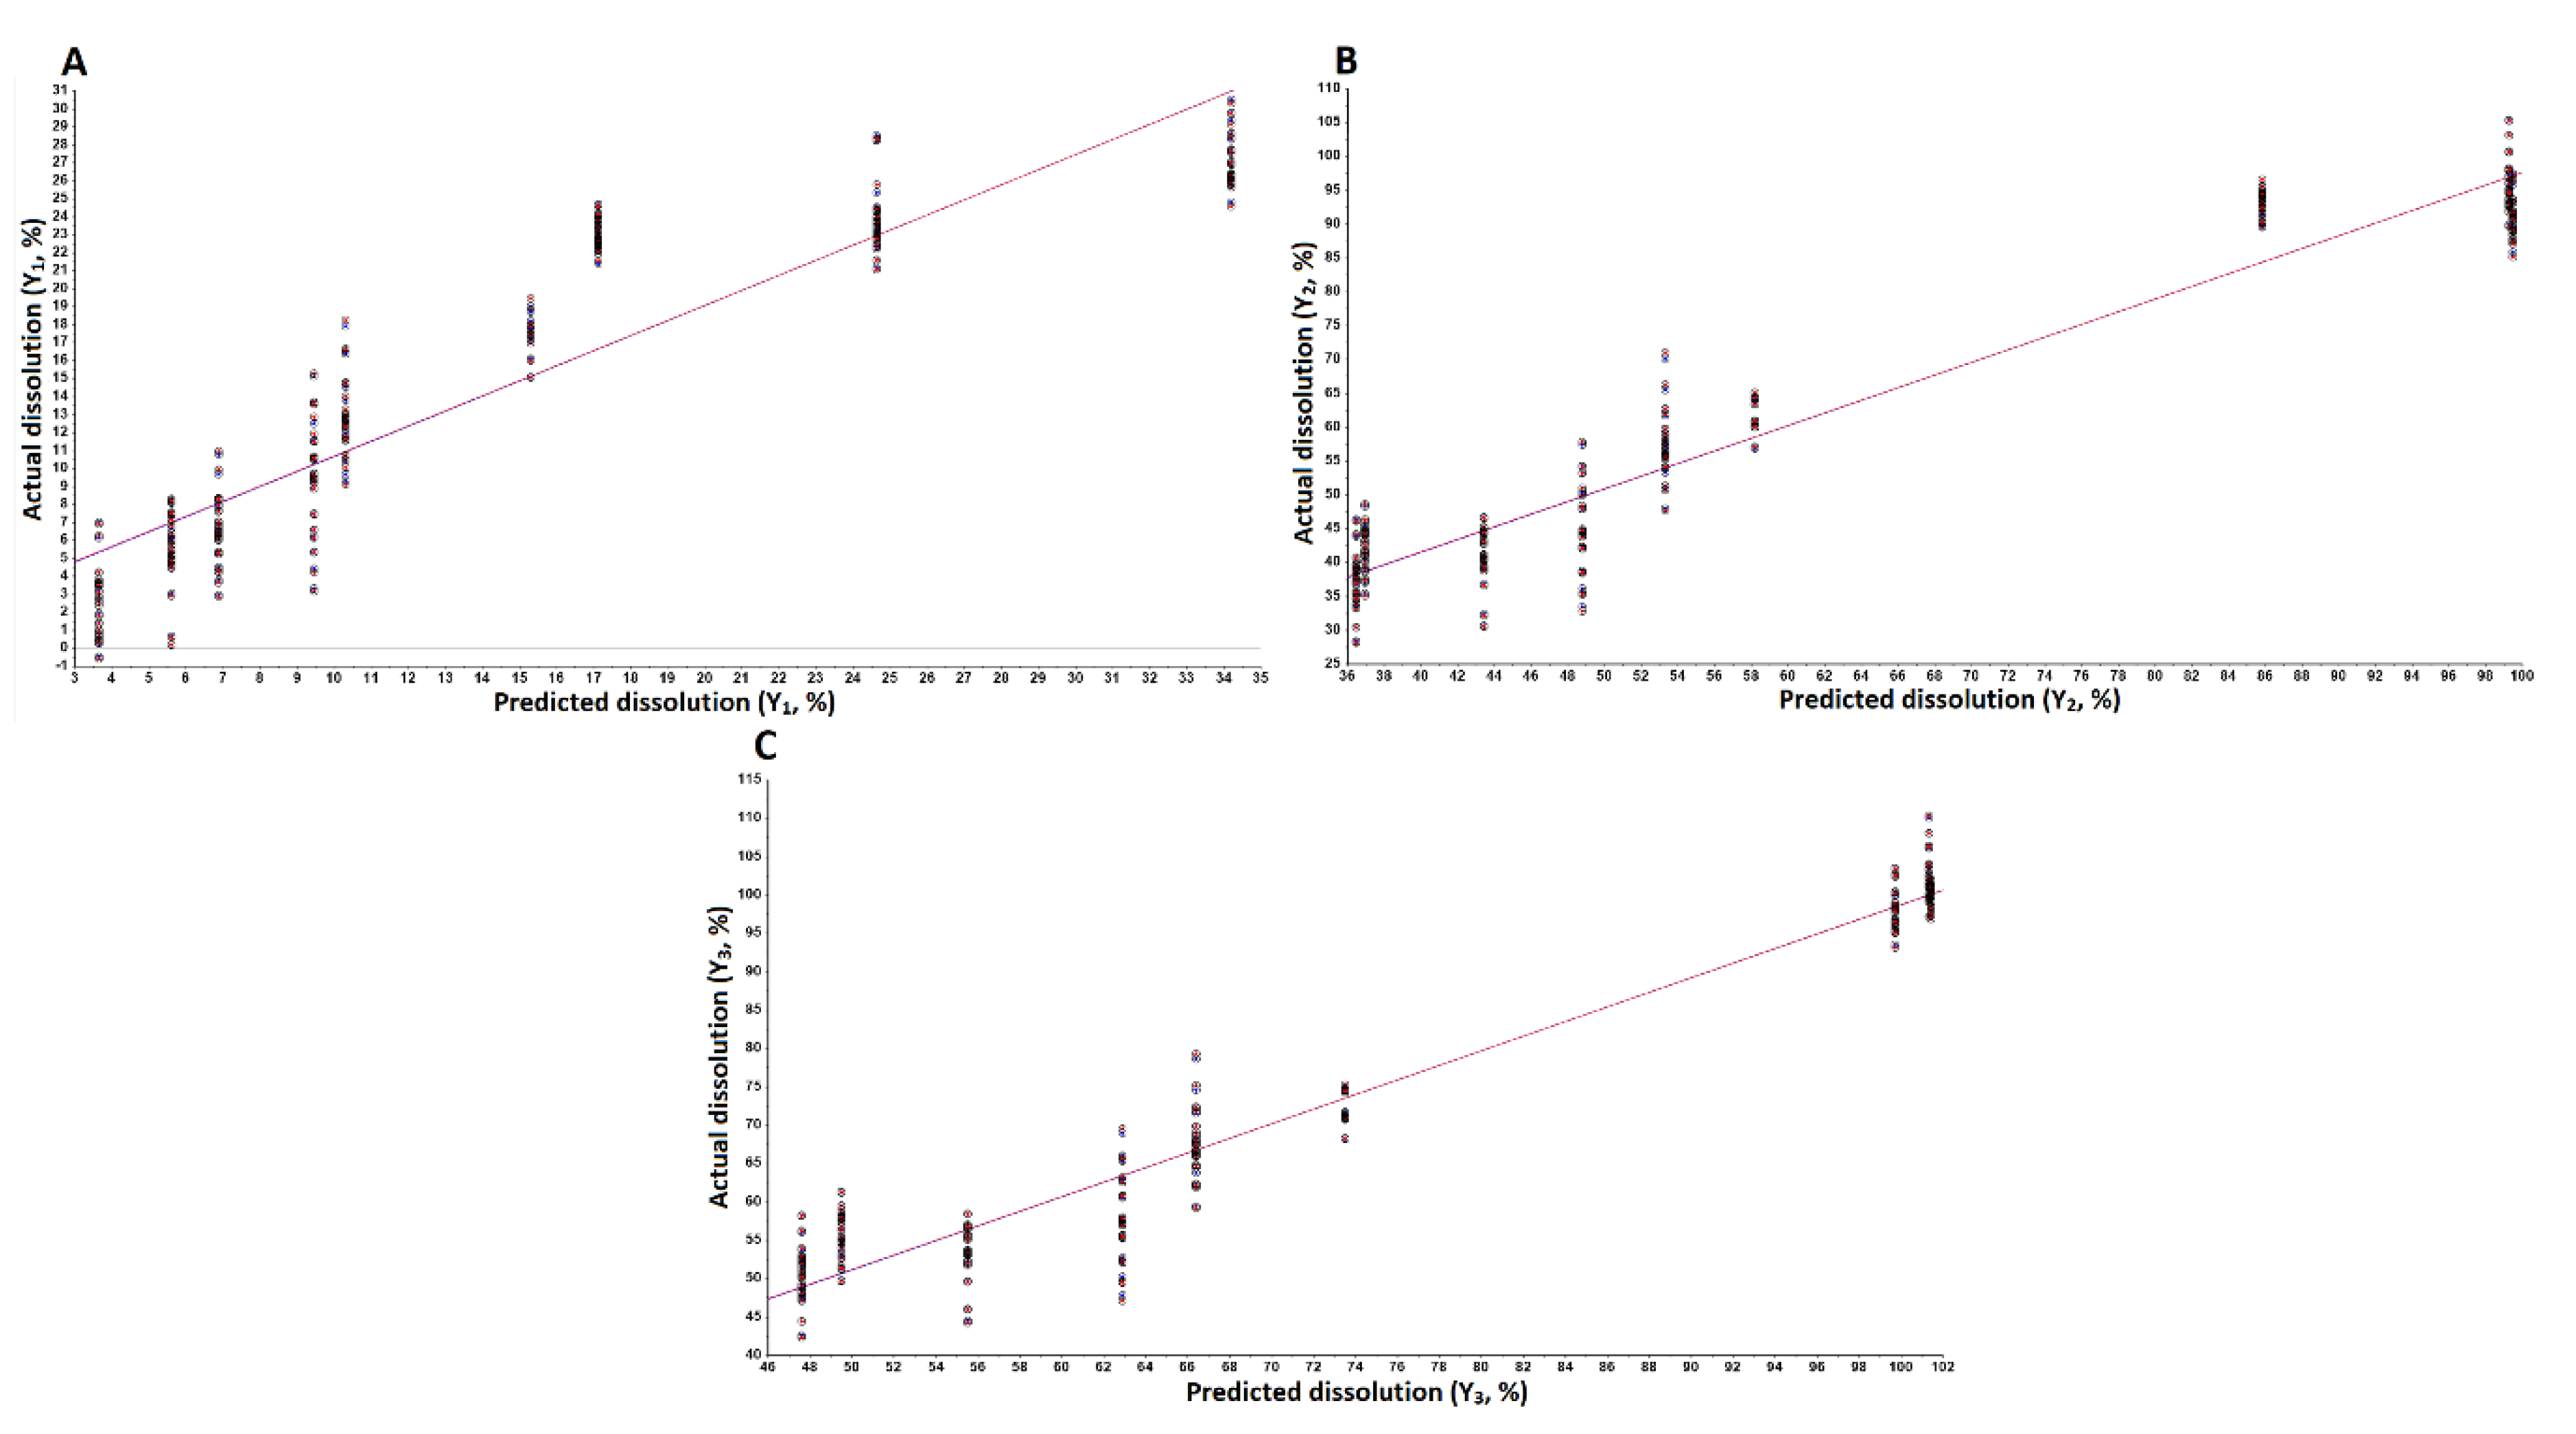
3.3.3. Models Development and Validation
4. Conclusions
Author Contributions
Funding
Acknowledgments
Conflicts of Interest
References
- Dickinson, P.A.; Lee, W.W.; Stott, P.W.; Townsend, A.I.; Smart, J.P.; Ghahramani, P.; Hammett, T.; Billett, L.; Behn, S.; Gibb, R.C.; et al. Clinical relevance of dissolution testing in quality by design. AAPS J. 2008, 380–390. [Google Scholar] [CrossRef] [Green Version]
- Graffner, C. Regulatory aspects of drug dissolution from a European perspective. Eur. J. Pharm. Sci. 2006, 29, 288–293. [Google Scholar] [CrossRef]
- Maher, E.M.; Ali, A.M.A.; Salem, H.F.; Abdelrahman, A.A. In Vitro/In Vivo evaluation of an optimized fast dissolving oral film containing olanzapine co-amorphous dispersion with selected carboxylic acids. Drug Deliv. 2016, 23, 3088–3100. [Google Scholar] [CrossRef] [PubMed] [Green Version]
- Kim, T.H.; Shin, S.; Jeong, S.W.; Lee, J.B.; Shin, B.S. Physiologically Relevant In Vitro-In Vivo Correlation (IVIVC) Approach for Sildenafil with Site-Dependent Dissolution. Pharmaceutics 2019, 11, 251. [Google Scholar] [CrossRef] [PubMed] [Green Version]
- Dharani, S.; Barakh Ali, S.F.; Afrooz, H.; Khan, M.A.; Rahman, Z. Development and Validation of a Discriminatory Dissolution Method for Rifaximin Products. J. Pharm. Sci. 2019, 108, 2112–2118. [Google Scholar] [CrossRef]
- Nokhodchi, A.; Raja, S.; Patel, P.; Asare-Addo, K. The role of oral controlled release matrix tablets in drug delivery systems. Bioimpacts 2012, 2, 175–187. [Google Scholar]
- Korang-Yeboah, M.; Rahman, Z.; Shah, D.A.; Khan, M.A. Spectroscopic-Based Chemometric Models for Quantifying Low Levels of Solid-State Transitions in Extended Release Theophylline Formulations. J. Pharm. Sci. 2016, 105, 97–105. [Google Scholar] [CrossRef]
- Zahoor, F.D.; Mader, K.T.; Timmins, P.; Brown, J.; Sammon, C. Investigation of Within-Tablet Dynamics for Extended Release of a Poorly Soluble Basic Drug from Hydrophilic Matrix Tablets Using ATR-FTIR Imaging. Mol. Pharm. 2020, 17, 1090–1099. [Google Scholar] [CrossRef]
- Xu, H.; Liu, L.; Li, X.; Ma, J.; Liu, R.; Wang, S. Extended tacrolimus release via the combination of lipid-based solid dispersion and HPMC hydrogel matrix tablets. Asian J. Pharm. Sci. 2019, 14, 445–454. [Google Scholar] [CrossRef] [PubMed]
- Hu, M.; Zhu, Z.; Wu, Y.; Meng, Q.; Luo, J.; Wang, H. Exploring the Potential of Hydrophilic Matrix Combined with Insoluble Film Coating: Preparation and Evaluation of Ambroxol Hydrochloride Extended Release Tablets. AAPS PharmSciTech 2020, 21, 93. [Google Scholar] [CrossRef]
- Ibrahim, M.; Sarhan, H.A.; Naguib, Y.W.; Abdelkader, H. Design, characterization and in vivo evaluation of modified release baclofen floating coated beads. Int. J. Pharm. 2020, 582, 119344. [Google Scholar] [CrossRef] [PubMed]
- Wang, B.; Friess, W. Formation of mannitol core microparticles for sustained release with lipid coating in a mini fluid bed system. Eur. J. Pharm. Biopharm. 2017, 120, 126–132. [Google Scholar] [CrossRef] [PubMed]
- Mitra, S.; Maity, S.; Sa, B. Effect of different cross-linking methods and processing parameters on drug release from hydrogel beads. Int. J. Biol. Macromol. 2015, 74, 489–497. [Google Scholar] [CrossRef] [PubMed]
- Tsunematsu, H.; Hifumi, H.; Kitamura, R.; Hirai, D.; Takeuchi, M.; Ohara, M.; Itai, S.; Iwao, Y. Analysis of available surface area can predict the long-term dissolution profile of tablets using short-term stability studies. Int. J. Pharm. 2020, 586, 119504. [Google Scholar] [CrossRef]
- Cid, A.G.; Rigo, M.V.R.; Palena, M.C.; Gonzo, E.E.; Jimenez-Kairuz, A.F.; Bermúdez, J.M. Dual Release Model to Evaluate Dissolution Profiles from Swellable Drug Polyelectrolyte Matrices. Curr. Drug Deliv. 2020, 17, 511–522. [Google Scholar] [CrossRef]
- Huang, K.; Cao, Y.; Wang, B.; Li, H.; Wang, J.; Lin, W.; Mu, C.; Liao, D. Homogeneous Preparation of Cellulose Acetate Propionate (CAP) and Cellulose Acetate Butyrate (CAB) from Sugarcane Bagasse Cellulose in Ionic Liquid. J. Agric. Food Chem. 2011, 59, 5376–5381. [Google Scholar] [CrossRef] [PubMed]
- Available online: https://www.accessdata.fda.gov/scripts/cder/iig/index.cfm?event=BasicSearch.pageFDAInactiveingredientsdatabase (accessed on 24 August 2020).
- USP42-NF37—Cellaburate; U.S. Pharmacopeia, United States Pharmacopeial Convention: North Bethesda, MD, USA, 2019; p. 5648.
- Amanat, S.; Taymouri, S.; Varshosaz, J.; Minaiyan, M.; Talebi, A. Carboxymethyl cellulose-based wafer enriched with resveratrol-loaded nanoparticles for enhanced wound healing. Drug Deliv. Trans. Res. 2020, 10, 1241–1254. [Google Scholar] [CrossRef] [PubMed]
- Porcu, E.P.; Salis, A.; Rassu, G.; Maestri, M.; Galafassi, J.; Bruni, G.; Giunchedi, P.; Gavini, E. Engineered polymeric microspheres obtained by multi-step method as potential systems for transarterial embolization and intraoperative imaging of HCC: Preliminary evaluation. Eur. J. Pharm. Biopharm. 2017, 117, 160–167. [Google Scholar] [CrossRef]
- Baldelli, A.; Boraey, M.A.; Nobes, D.S.; Vehring, R. Analysis of the Particle Formation Process of Structured Microparticles. Mol. Pharm. 2015, 12, 2562–2573. [Google Scholar] [CrossRef]
- Nour, S.A.; Abdelmalak, N.S.; Naguib, M.J. Bumadizone calcium dihydrate microspheres compressed tablets for colon targeting: Formulation, optimization and in vivo evaluation in rabbits. Drug Deliv. 2015, 22, 286–297. [Google Scholar] [CrossRef] [PubMed] [Green Version]
- Yehia, S.A.; Elshafeey, A.H.; Sayed, I.; Shehata, A.H. Optimization of budesonide compression-coated tablets for colonic delivery. AAPS PharmSciTech 2009, 10, 147–157. [Google Scholar] [CrossRef] [PubMed] [Green Version]
- Banala, V.T.; Srinivasan, B.; Rajamanickam, D.; Basappa Veerbadraiah, B.; Varadarajan, M. Statistical optimization and in vitro evaluation of metformin hydrochloride asymmetric membrane capsules prepared by a novel semiautomatic manufacturing approach. ISRN Pharm. 2013, 2013, 719196. [Google Scholar] [CrossRef]
- Umamaheshwari, R.B.; Jain, S.; Jain, N.K. A new approach in gastroretentive drug delivery system using cholestyramine. Drug Deliv. 2003, 10, 151–160. [Google Scholar] [CrossRef] [PubMed]
- McClelland, G.A.; Sutton, S.C.; Engle, K.; Zentner, G.M. The solubility-modulated osmotic pump: In vitro/in vivo release of diltiazem hydrochloride. Pharm. Res. 1991, 8, 88–92. [Google Scholar] [CrossRef]
- Barakh Ali, F.B.; Afrooz, H.; Hampel, R.; Mohamed, E.M.; Bhattacharya, R.; Cook, P.; Khan, M.A.; Rahman, Z. Blend of cellulose ester and enteric polymers for delayed and enteric coating of core tablets of hydrophilic and hydrophobic drugs. Int. J. Pharm. 2019, 567, 118462. [Google Scholar]
- Radtke, J.; Wiedey, R.; Kleinebudde, P. Effect of coating time on inter- and intra-tablet coating uniformity. Eur. J. Pharm. Sci. 2019, 137, 104970. [Google Scholar] [CrossRef]
- Silva, B.S.; Santangelo, M.; Colbert, M.J.; Fauteux-Lefebvre, C.; Bartlett, J.A.; Lapointe-Garant, P.P.; Gosselin, R. Building Process Understanding of Fluid Bed Taste Mask Coating of Microspheres. AAPS PharmSciTech 2019, 20, 173. [Google Scholar] [CrossRef]
- Rahman, Z.; Xu, X.; Katragadda, U.; Krishnaiah, Y.S.; Yu, L.; Khan, M.A. Quality by design approach for understanding the critical quality attributes of cyclosporine ophthalmic emulsion. Mol. Pharm. 2014, 11, 787–799. [Google Scholar] [CrossRef]
- Dharani, S.; Barakh Ali, S.F.; Afrooz, H.; Khan, M.A.; Rahman, Z. Univariate and Multivariate Models for Determination of Prasugrel Base in the Formulation of Prasugrel Hydrochloride Using XRPD Method. J. Pharm. Sci. 2019, 108, 3575–3581. [Google Scholar] [CrossRef]
- Barakh Ali, S.F.; Dharani, S.; Afrooz, H.; Mohamed, E.M.; Cook, P.; Khan, M.A.; Rahman, Z. Development of Abuse-Deterrent Formulations Using Sucrose Acetate Isobutyrate. AAPS PharmSciTech 2020, 21, 99. [Google Scholar] [CrossRef]
- Dharani, S.; Barakh Ali, S.F.; Afrooz, H.; Mohamed, E.M.; Cook, P.; Khan, M.A.; Rahman, Z. Development of Methamphetamine Abuse-Deterrent Formulations Using Sucrose Acetate Isobutyrate. J. Pharm. Sci. 2020, 109, 1338–1346. [Google Scholar] [CrossRef] [PubMed]
- Barakh Ali, S.F.; Rahman, Z.; Dharani, S.; Afrooz, H.; Khan, M.A. Chemometric Models for Quantification of Carbamazepine Anhydrous and Dihydrate Forms in the Formulation. J. Pharm. Sci. 2019, 108, 1211–1219. [Google Scholar] [CrossRef] [PubMed]
- ICH Harmonized Tripartite Guideline—Validation of Analytical Procedures: Text and Methodology Q2 (R1). November 2005. Available online: https://somatek.com/wp-content/uploads/2014/06/sk140605h.pdf (accessed on 24 August 2020).
- Spencer, J.A.; Gao, Z.; Moore, T.; Buhse, L.F.; Taday, P.F.; Newnham, D.A.; Shen, Y.; Potieri, A.; Husain, A. Delayed release tablet dissolution related to coating thickness by terahertz pulsed image mapping. J. Pharm. Sci. 2008, 97, 1543–1550. [Google Scholar] [CrossRef] [PubMed]
- Gupta, A.; Peck, G.E.; Miller, R.W.; Morris, K.R. Real-time near-infrared monitoring of content uniformity, moisture content, compact density, tensile strength, and Young’s modulus of roller compacted powder blends. J. Pharm. Sci. 2005, 94, 1589–1597. [Google Scholar] [CrossRef]
- Kirsch, J.D.; Drennen, J.K. Determination of film-coated tablet parameters by nearinfrared spectroscopy. J. Pharm. Biomed. Anal. 1995, 13, 1273–1281. [Google Scholar] [CrossRef]


| Independent Variables | Level | ||
|---|---|---|---|
| Low | Medium | High | |
| Coating (X1, %) | 5.0 | 7.5 | 10.0 |
| CAB 171-15 (X2, %) | 33.3 | 50.0 | 66.7 |
| Formulation | X1 (%) | X2 (%) | Actual Coating Gain (%) |
| C1 | 5 | 33.3 | 5.2 |
| C2 | 7.5 | 33.3 | 7.7 |
| C3 | 10 | 33.3 | 10.8 |
| C4 | 5 | 50.0 | 5.3 |
| C5 | 7.5. | 50.0 | 7.9 |
| C6 | 10 | 50.0 | 10.3 |
| C7 | 5 | 66.7 | 4.5 |
| C8 | 7.5 | 66.7 | 7.2 |
| C9 | 10 | 66.7 | 9.7 |
| Response | Model | Sample No. | Slope | Offset | Correlation | R2 | RMSEC (P) 1 | SEC (P) 2 | Bias |
|---|---|---|---|---|---|---|---|---|---|
| Y1 | Calibration | 170 | 0.84 | 2.26 | 0.916 | 0.839 | 3.87 | 3.88 | 2.97 × 10⁻⁶ |
| Validation | 170 | 0.84 | 2.31 | 0.913 | 0.834 | 3.95 | 3.96 | 0.03 | |
| Y2 | Calibration | 170 | 0.93 | 4.4 | 0.964 | 0.929 | 6.58 | 6.59 | 7.74 × 10⁻⁶ |
| Validation | 170 | 0.93 | 4.63 | 0.962 | 0.927 | 6.75 | 6.77 | 0.09 | |
| Y3 | Calibration | 170 | 0.95 | 3.58 | 0.974 | 0.949 | 4.85 | 4.87 | 0 |
| Validation | 170 | 0.95 | 3.98 | 0.973 | 0.948 | 4.97 | 4.99 | 0.06 |
Publisher’s Note: MDPI stays neutral with regard to jurisdictional claims in published maps and institutional affiliations. |
© 2020 by the authors. Licensee MDPI, Basel, Switzerland. This article is an open access article distributed under the terms and conditions of the Creative Commons Attribution (CC BY) license (http://creativecommons.org/licenses/by/4.0/).
Share and Cite
Mohamed, E.M.; Khuroo, T.; Afrooz, H.; Dharani, S.; Sediri, K.; Cook, P.; Arunagiri, R.; Khan, M.A.; Rahman, Z. Development of a Multivariate Predictive Dissolution Model for Tablets Coated with Cellulose Ester Blends. Pharmaceuticals 2020, 13, 311. https://0-doi-org.brum.beds.ac.uk/10.3390/ph13100311
Mohamed EM, Khuroo T, Afrooz H, Dharani S, Sediri K, Cook P, Arunagiri R, Khan MA, Rahman Z. Development of a Multivariate Predictive Dissolution Model for Tablets Coated with Cellulose Ester Blends. Pharmaceuticals. 2020; 13(10):311. https://0-doi-org.brum.beds.ac.uk/10.3390/ph13100311
Chicago/Turabian StyleMohamed, Eman M., Tahir Khuroo, Hamideh Afrooz, Sathish Dharani, Khaldia Sediri, Phillip Cook, Rajendran Arunagiri, Mansoor A. Khan, and Ziyaur Rahman. 2020. "Development of a Multivariate Predictive Dissolution Model for Tablets Coated with Cellulose Ester Blends" Pharmaceuticals 13, no. 10: 311. https://0-doi-org.brum.beds.ac.uk/10.3390/ph13100311