
Mannosylated Polymeric Ligands for Targeted Delivery of Antibacterials and Their Adjuvants to Macrophages for the Enhancement of the Drug Efficiency
 , , , ,
Abstract
: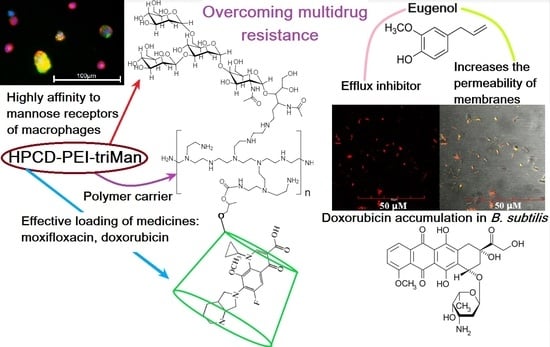
1. Introduction
2. Results and Discussion
2.1. Synthesis and Physico-Chemical Characteristics of Mannosylated Conjugates
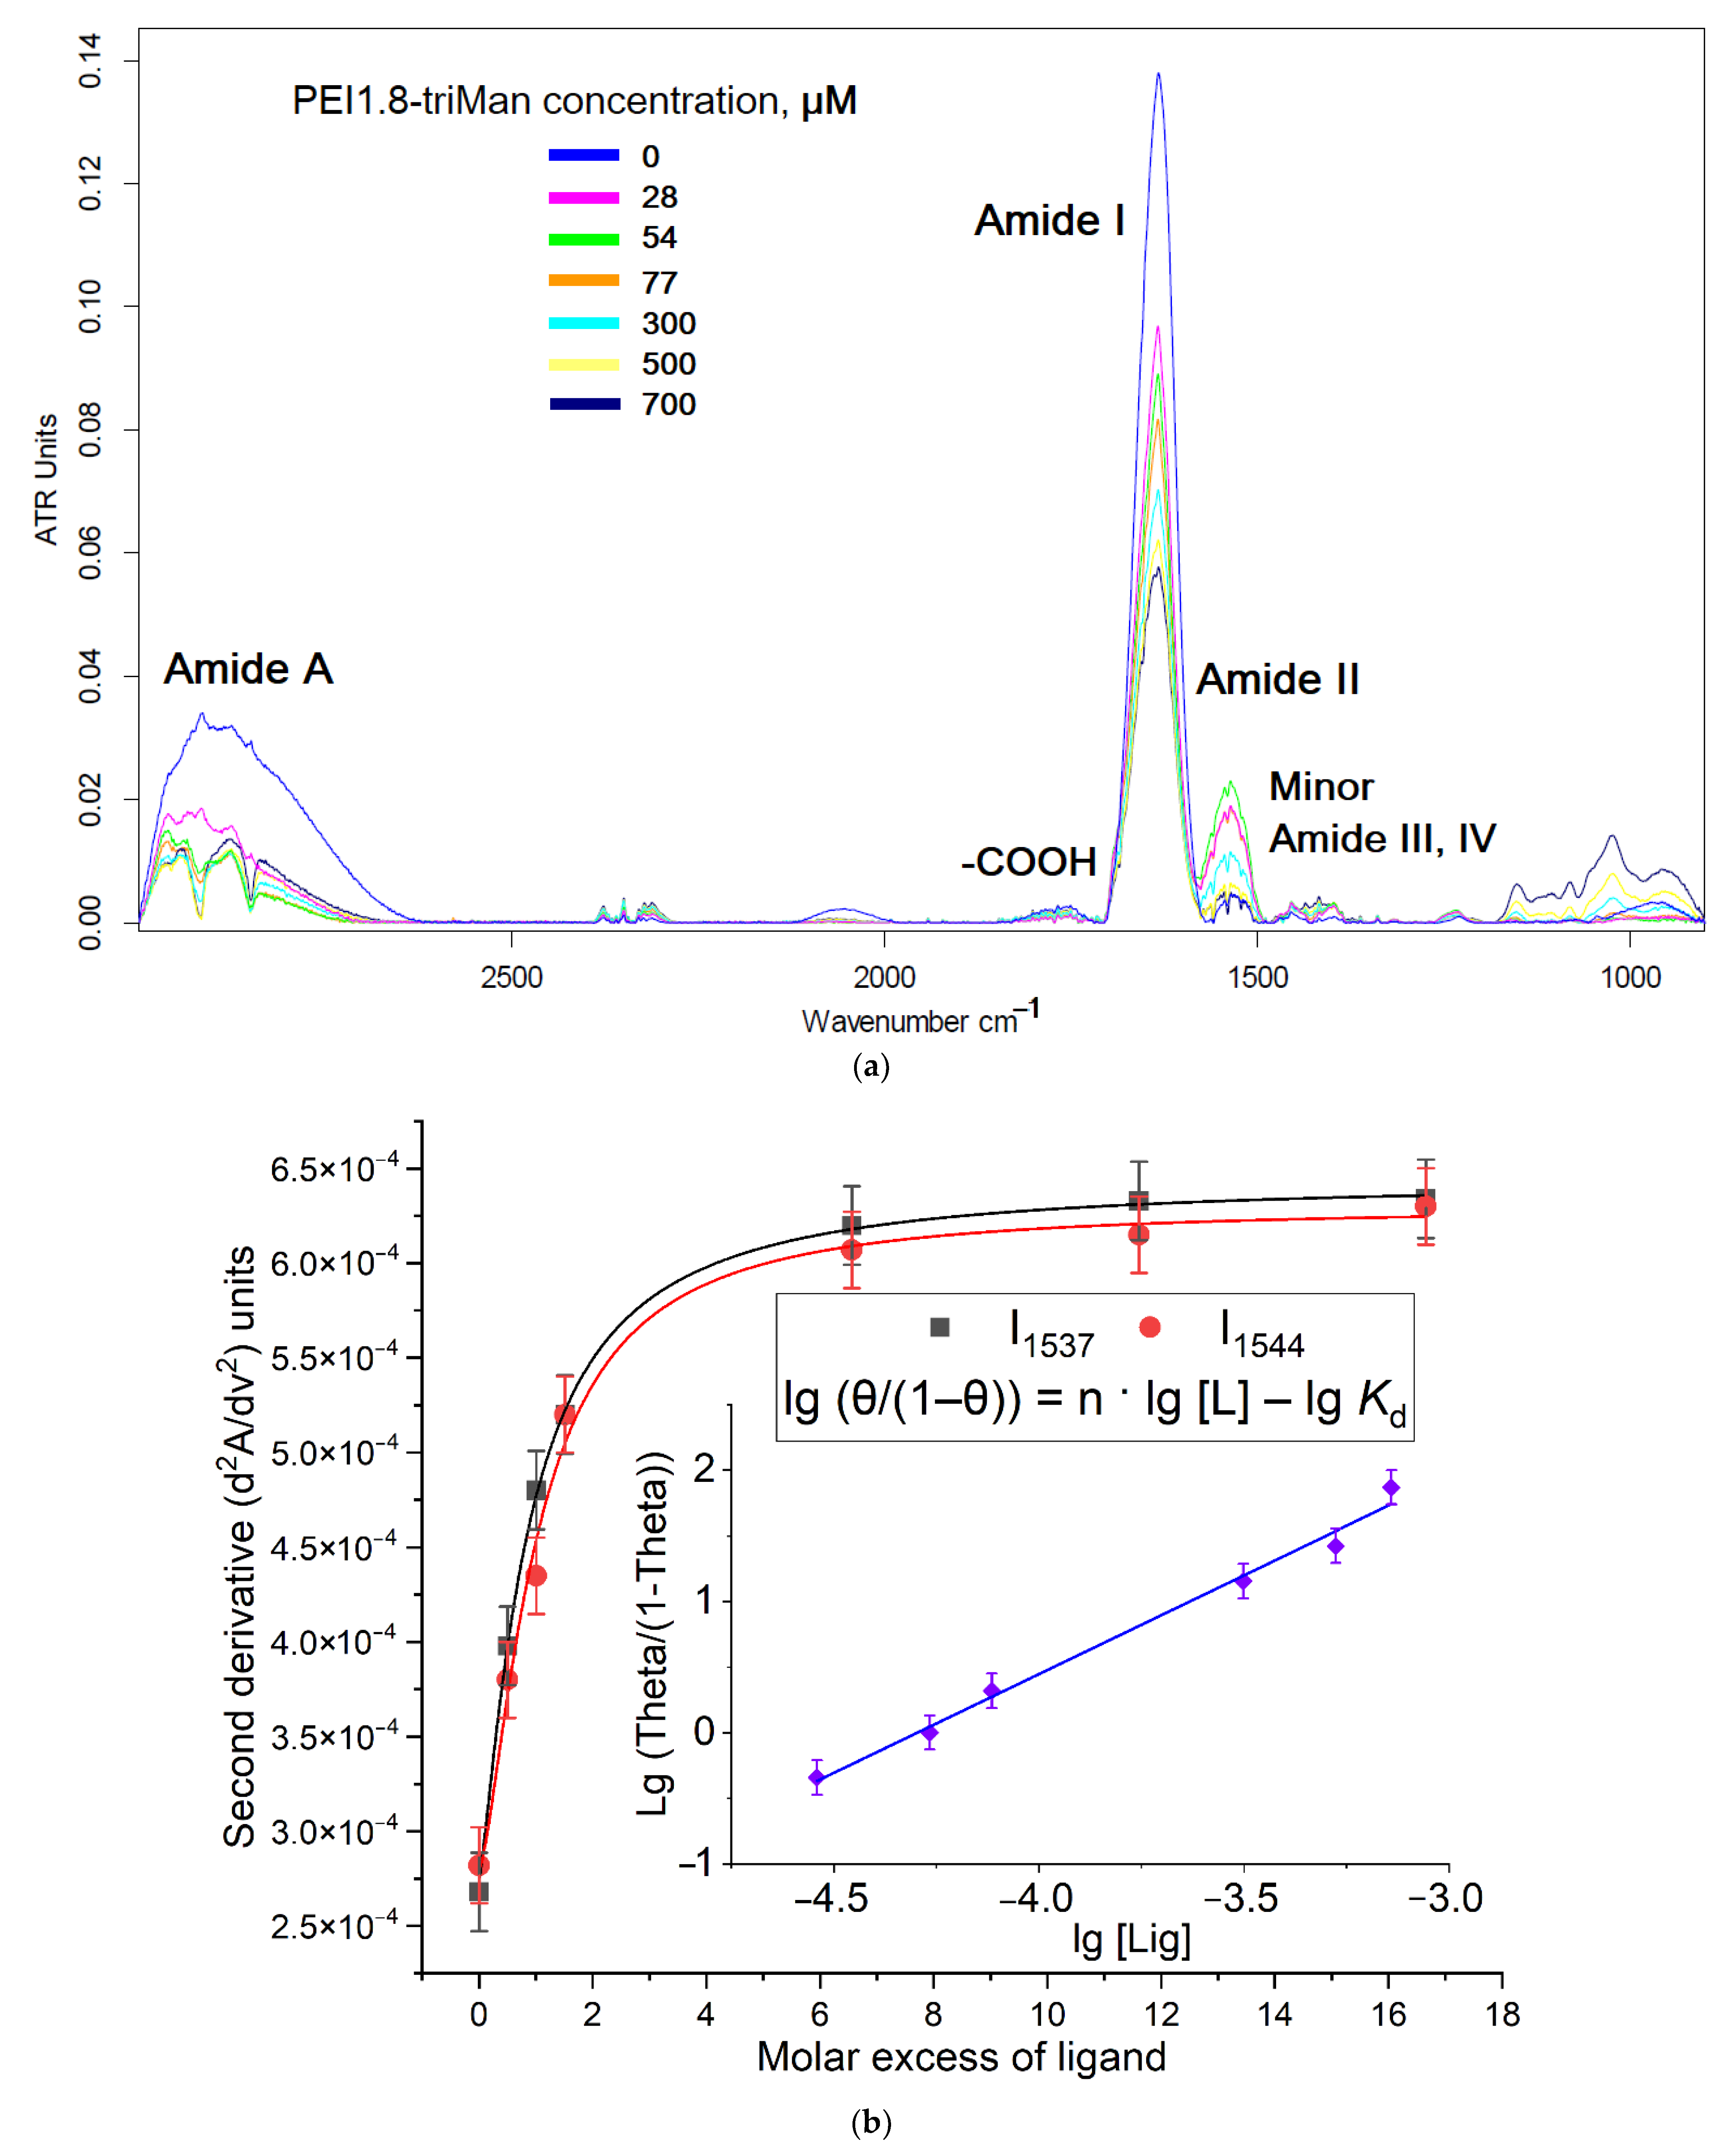
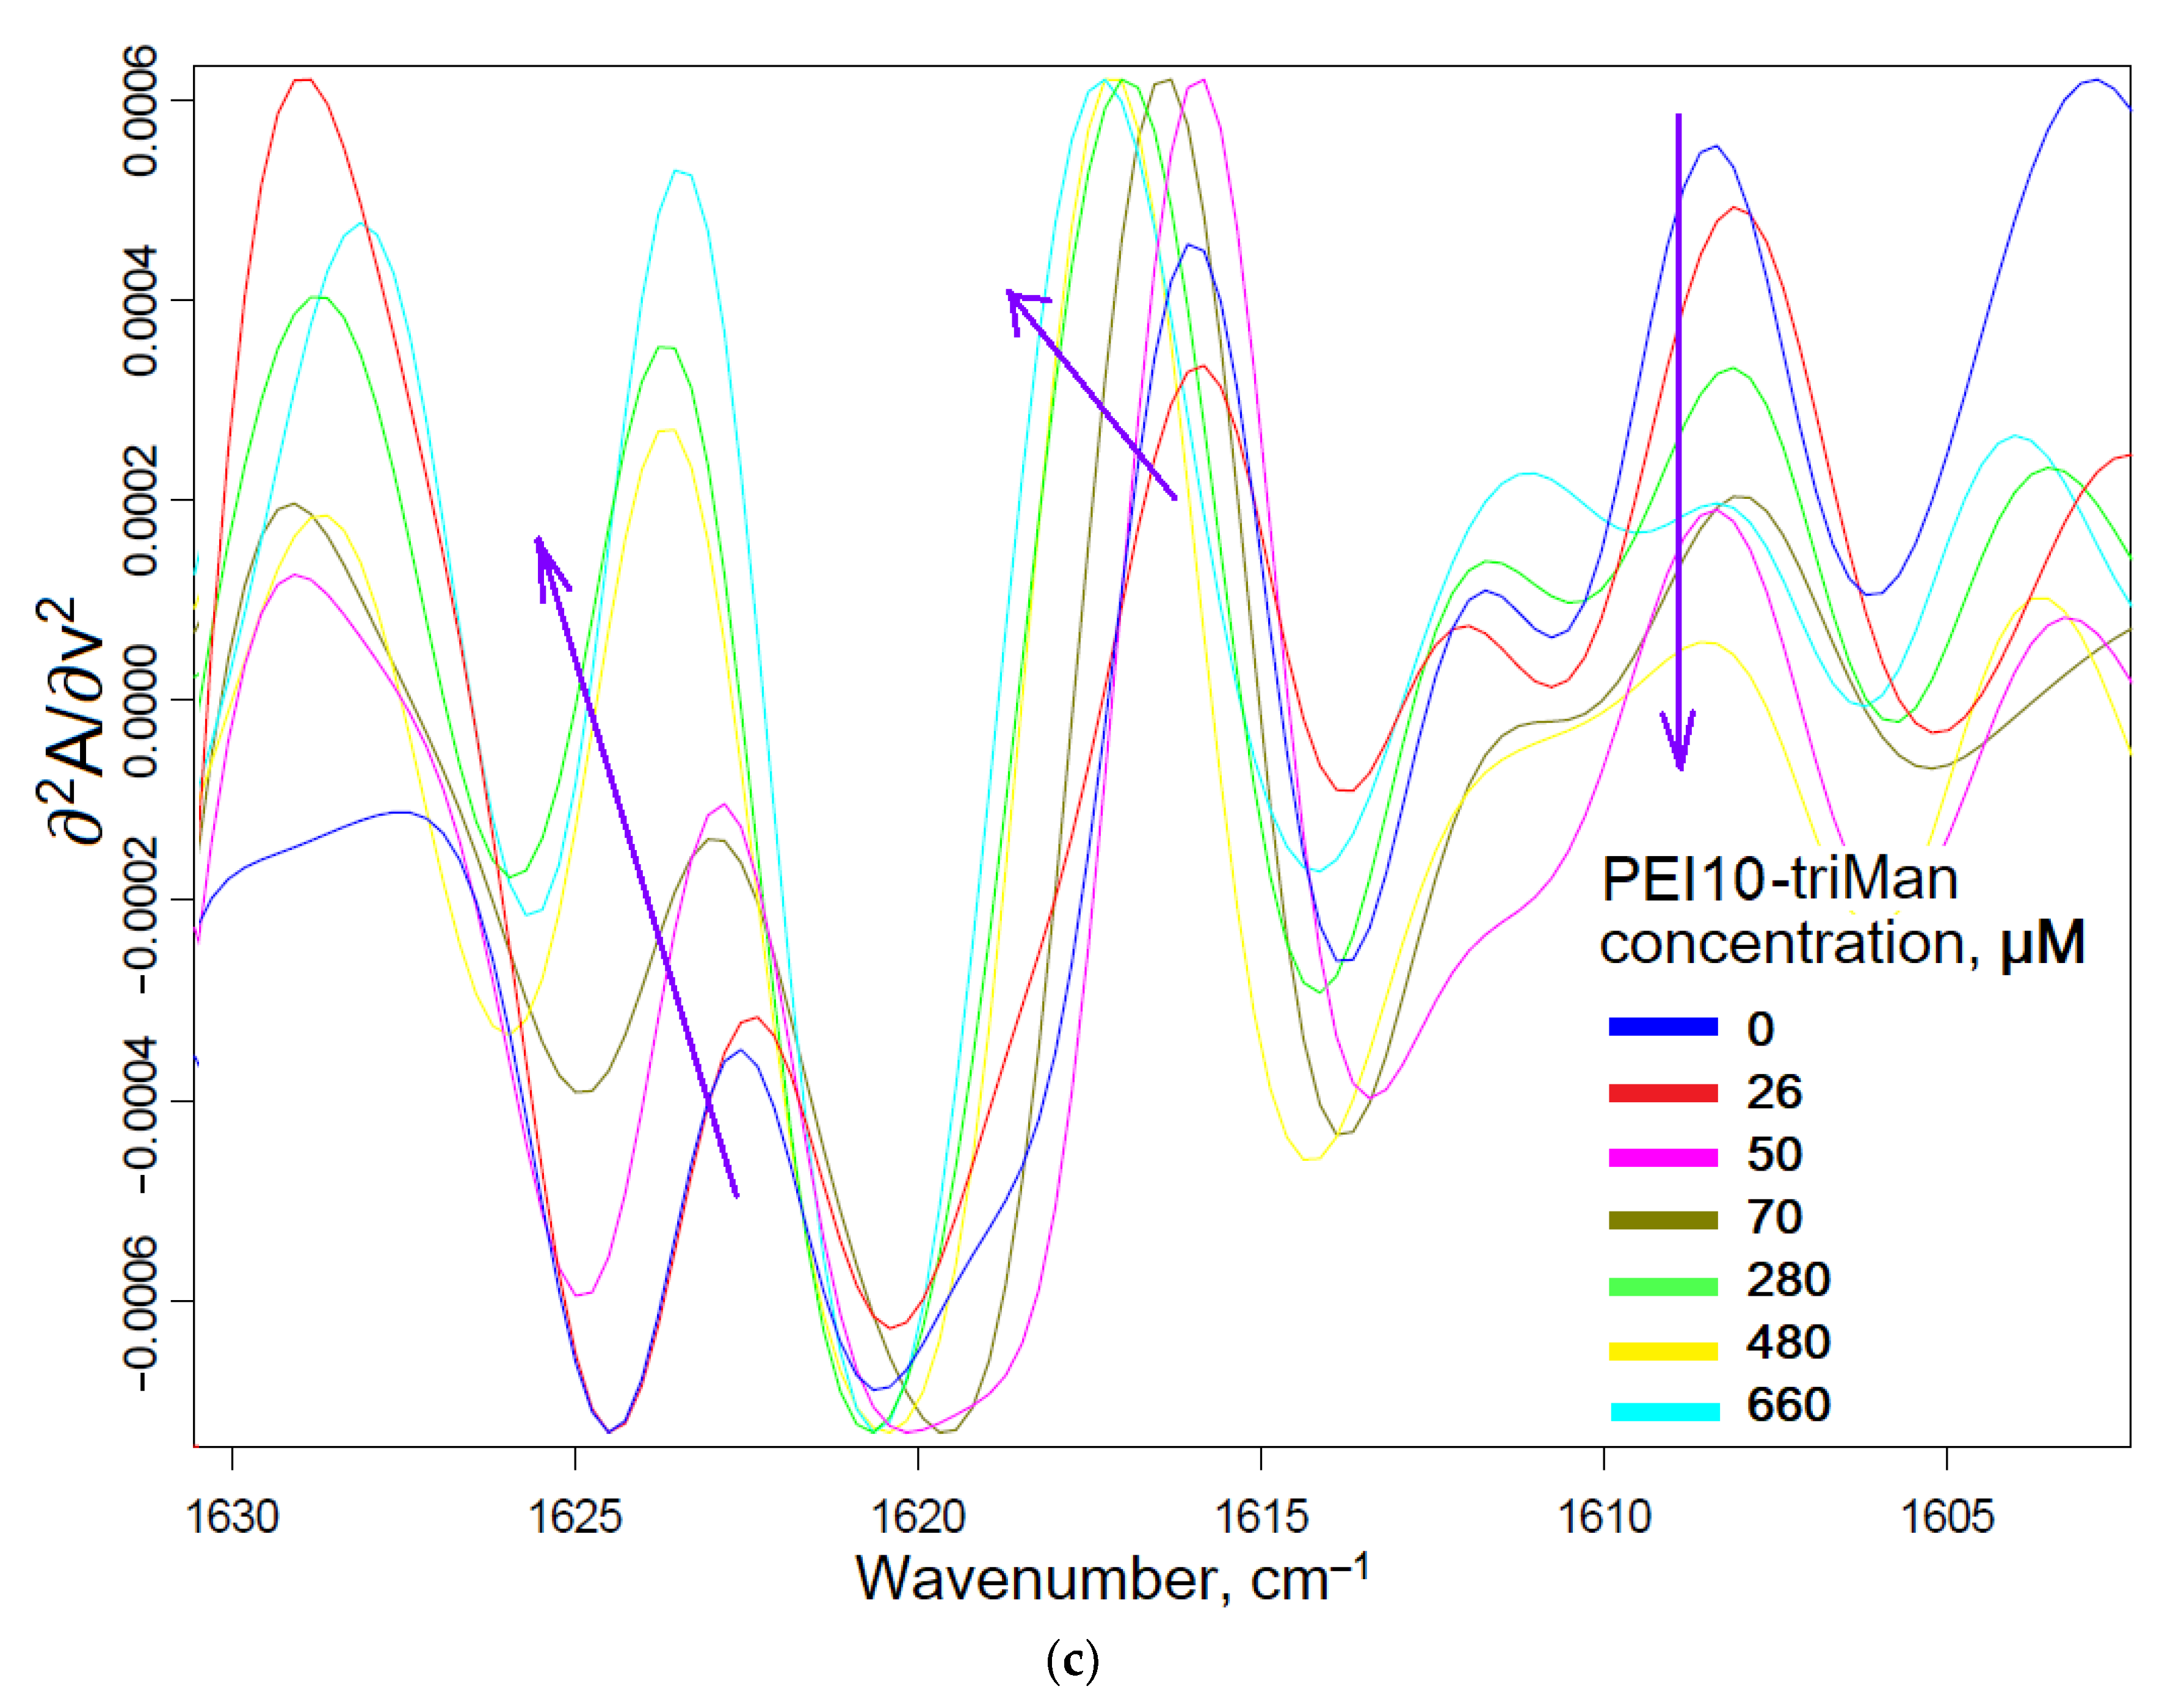
2.1.1. FTIR Spectroscopy
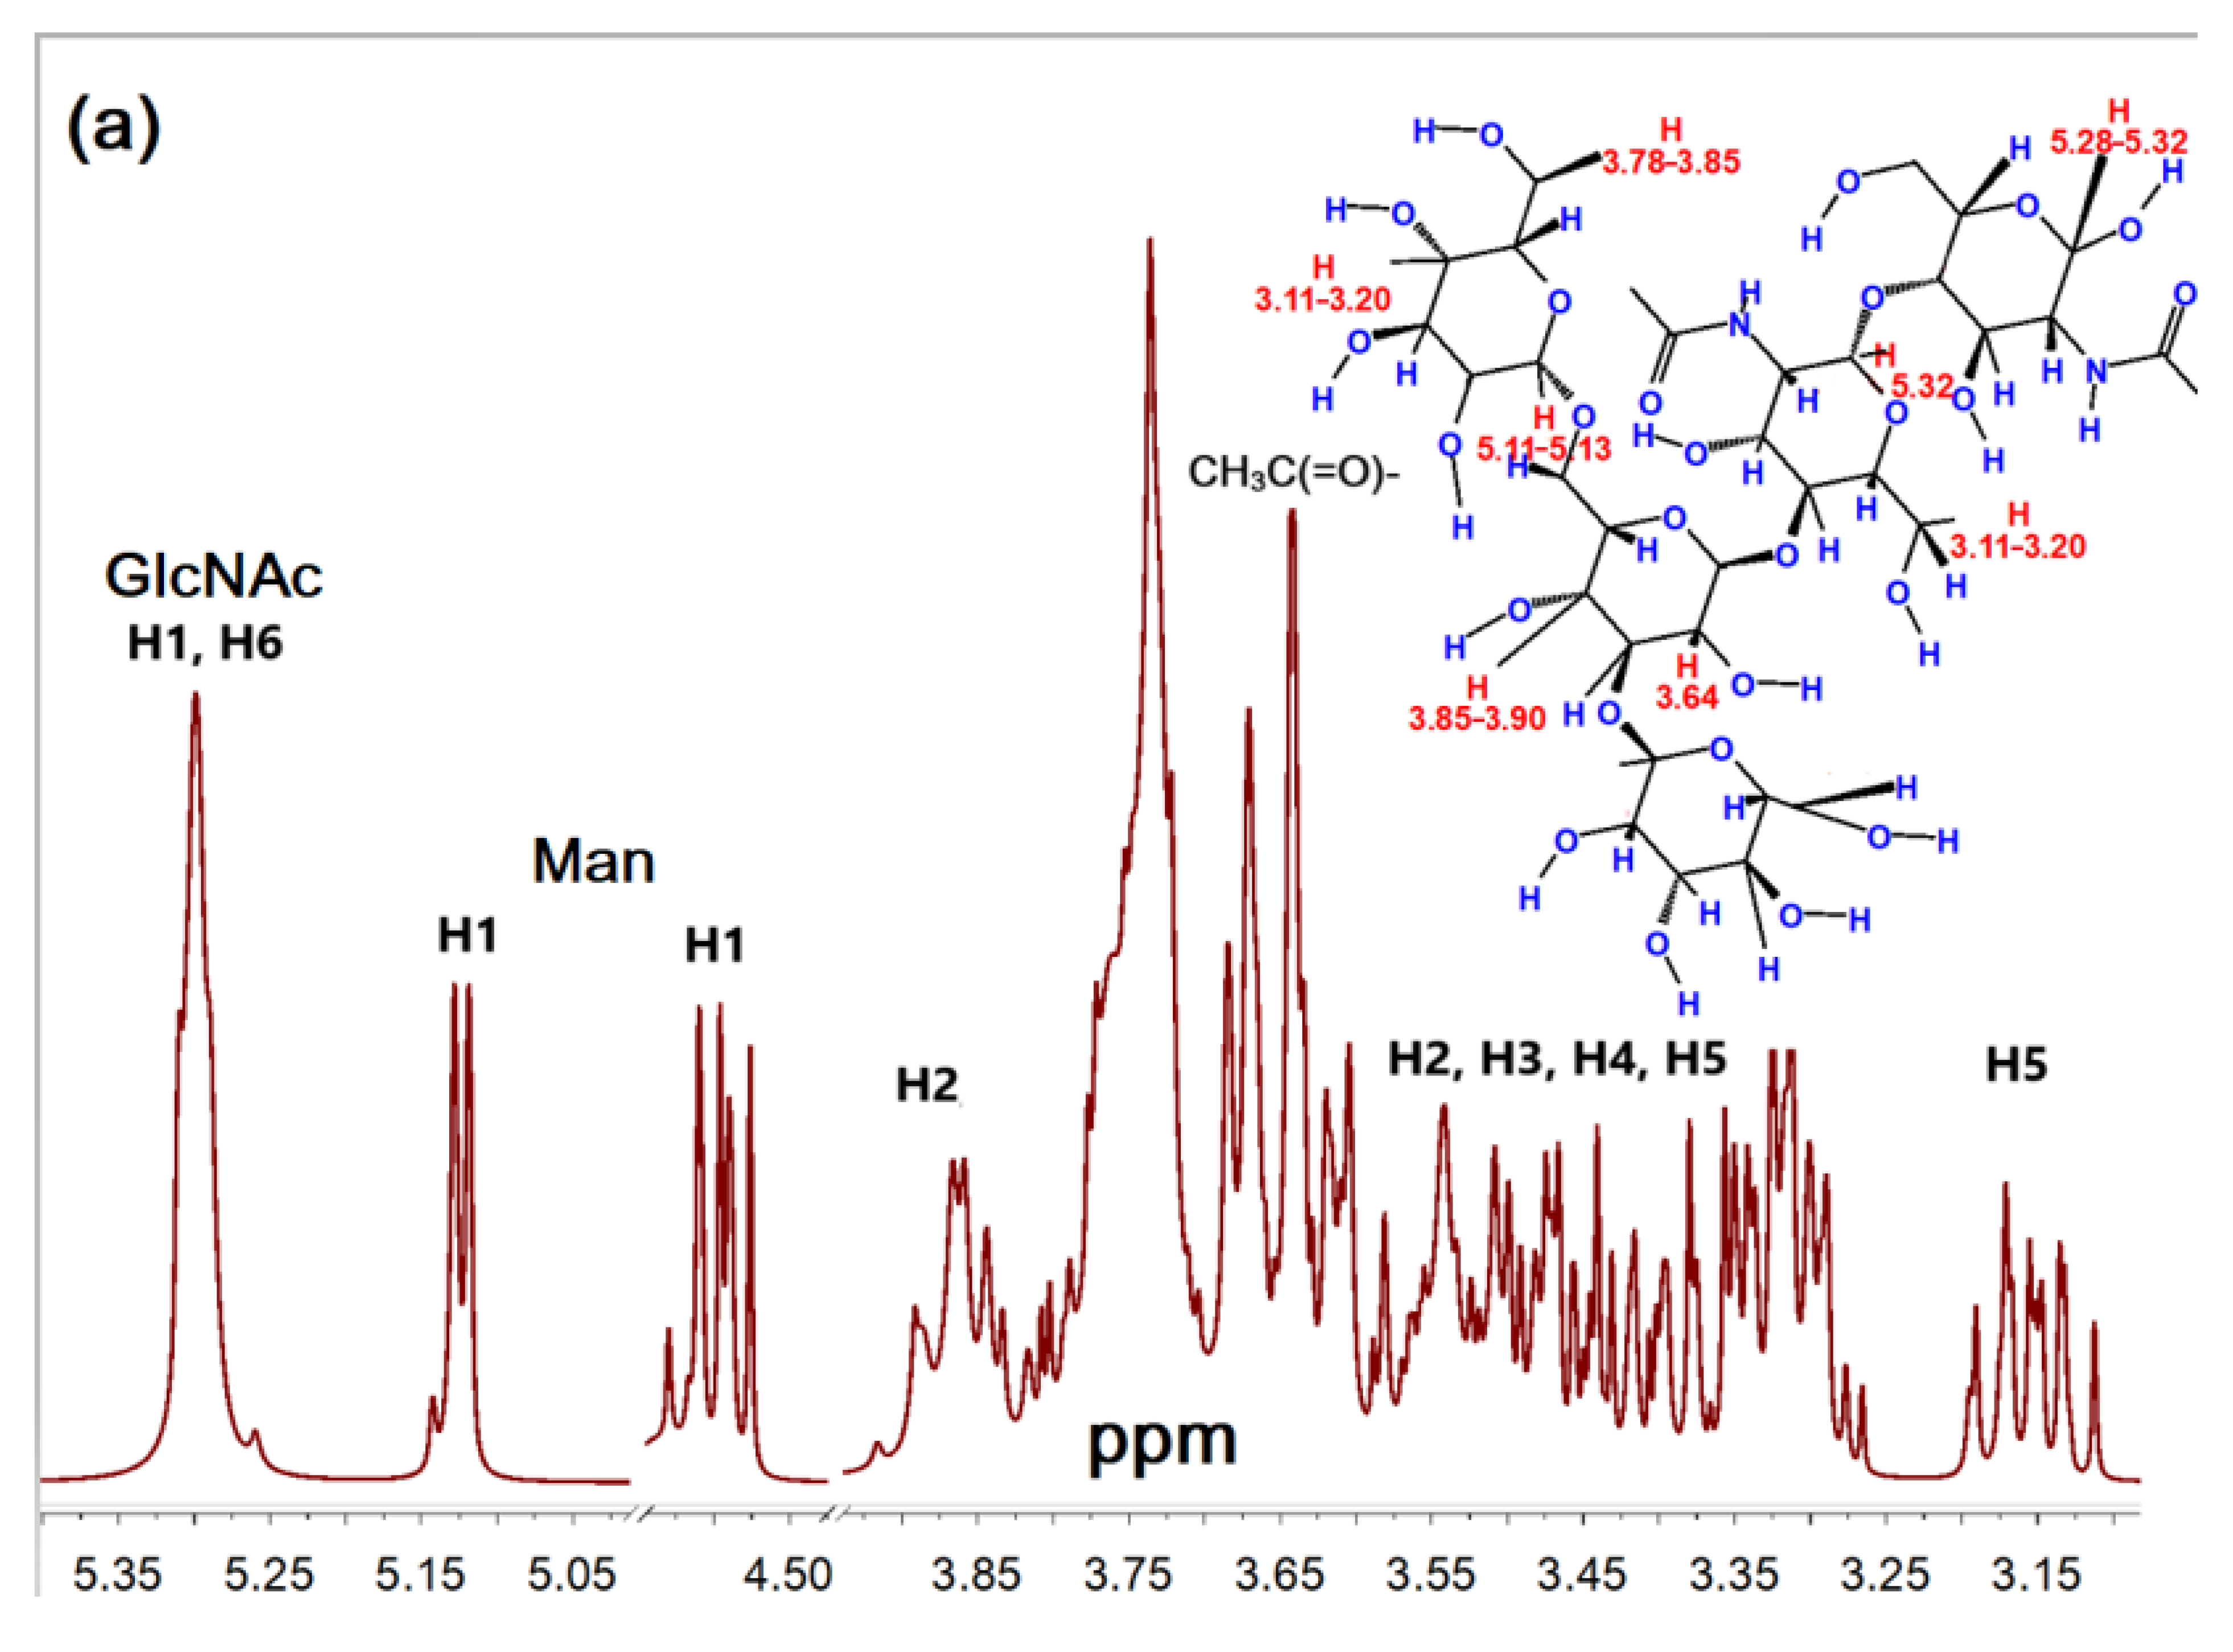
2.1.2. NMR Spectroscopy
2.1.3. Physico-Chemical Properties of Mannosylated Ligands
2.2. Conjugates’ Specificity to the Mannose Receptors on the ConA Model
2.3. Moxifloxacin Loading into Molecular Containers
2.3.1. FTIR Spectroscopy of MF and MF Conjugate
2.3.2. NMR Spectroscopy of MF and MF Conjugate
2.4. Drugs Interaction with Bacteria
2.4.1. Antibacterial Activity of MF against B. subtilis
2.4.2. Confocal Laser Scanning Microscopy (CLSM)
- (1)
- Control Dox to study the penetration and accumulation of free matter in cells;
- (2)
- Dox in a polymer ligand to study the effect of polymer on the adsorption efficiency on the cells and penetration of Dox;
- (3)
- Dox in a polymer ligand with grafted CD tori to clarify the role of CD tori in the creation of defects in the membrane and increased Dox (LC) capacity;
- (4)
- Dox with EG as an agent enhancing the membrane permeability and efflux inhibitor;
- (5)
- Dox with preincubated EG only as efflux inhibitor so as to exclude the effect of adjuvant on the membrane permeability due to the desorption of EG;
- (6)
- Combined formulation Dox + ligand with grafted CD tori + EG.
2.4.3. Fluorescent Determination of MF and EG Adsorbed and Absorbed by Cells
2.5. Drug Delivery System Interactions with Macrophages
3. Materials and Methods
3.1. Reagents
3.2. Synthesis and Purification of Mannosylated Conjugates
3.3. FTIR Spectroscopy
3.4. NMR Spectroscopy
3.5. Dynamic Light Scattering (DLS)
3.6. Mathematical Calculations and Equations
- (1)
- Calculation of the dissociation constants ConA ligand. Consider the equilibrium: ConA + n ligand ↔ ConA nligand, where Kd = [ligand]n · [ConA]/[ConA nligand].
- (2)
- First, fitting of the curves of change of the analytical signal ξ (peak intensity or peak position in FTIR native or second-derivative spectra) versus concentration of the ligand was carried out using the Hill equations: (1) ξ = ξ∞ · [ligand]n/([ligand]n + Kn), where ξ∞—horizontal asymptote; (2) ξ = ξ0 + (ξ∞ − ξ0) · [ligand]n/([ligand]n + Kn). Second, calculation of n and Kd values was performed by Hill’s linearization in n-binding site model: lg (θ/(1 − θ)) = n · lg [L] − lg Kd, where θ = | (ξ − ξ0)/(ξ∞ − ξ0) | is a fraction of the bound substance. n in Hill equation—number of ligand molecules per one ConA subunit.
- (3)
- Calculation of the dissociation constants drug ligand. Consider the equilibrium: drug + ligand ↔ drug ligand, where Kd = [ligand] [drug]/[drug ligand]. The calculations were performed similarly to the above point with the difference in calculating the number of drug molecules (MF) per conjugate (ligand) molecule. The number of MF molecules retained by one conjugate molecule in CD tori (NCD) is assumed to be equal to 90% of the total number of CD tori. The number of MF molecules held by one conjugate molecule by a polymer matrix (Npolymer) is calculated based on the drug: ligand ratio, when the degree of binding θ is 95%, minus the drug molecules in the CD tori.
- (4)
- Calculations for the following items are performed when Cligand_total = 0.0001 M, CMF_total = 0.001 M.
- (5)
- (6)
- (7)
- Statistical analysis of obtained data was carried out using the Student’s t-test Origin 2022 software (OriginLab Corporation). Values are presented as the mean SD of three experiments.
3.7. Confocal Laser Scanning Microscopy
3.8. Determination of MF and EG Concentrations Absorbed and Adsorbed by Cells
- First, 2 mL of cell suspension (5 × 10⁶ CFU/mL) was added to 2 cuvettes, and then, 20 mL of 10% SDS was added to the first one. Optical absorption at 600 nm as a correlate of CFU and membrane integrity was measured for two hours. Relative to the control solution, the CFU change did not exceed 10% of the initial value (Figure S8b).
- FTIR spectroscopy data. The experiment consisted of incubating cells with Dox with and without the addition of SDS, then separating the supernatant and cells and determining the integrity of the membrane; then, Dox content was determined. The observed parameter is the intensity and positions of the characteristic peaks of the aromatic system of doxorubicin. In the case of a significant effect of SDS on membrane permeability, changes in peak intensity would be observed in the IR spectrum.
3.9. Antibacterial Activity of MF in Free, Complex, and Enhanced with Adjuvants Forms
3.10. Experiments with Macrophages
3.10.1. Cell Lines and Modelling
3.10.2. Phagocytosis Assay
3.10.3. Cytometry
3.10.4. Immunocytochemistry
4. Conclusions
Supplementary Materials
Author Contributions
Funding
Institutional Review Board Statement
Informed Consent Statement
Data Availability Statement
Acknowledgments
Conflicts of Interest
Abbreviations
References
- Zamora-Mora, V.; Fernández-Gutiérrez, M.; González-Gómez, Á.; Sanz, B.; Román, J.S.; Goya, G.F.; Hernández, R.; Mijangos, C. Chitosan Nanoparticles for Combined Drug Delivery and Magnetic Hyperthermia: From Preparation to in Vitro Studies. Carbohydr. Polym. 2017, 157, 361–370. [Google Scholar] [CrossRef] [PubMed]
- Atkinson, R.L.; Blank, R.C.; Loper, J.F.; Schumacher, D.; Lutes, R.A. Combined Drug Treatment of Obesity. Obes. Res. 1995, 3 (Suppl. 4), 497S–500S. [Google Scholar] [CrossRef] [PubMed]
- Jain, K.; Kesharwani, P.; Gupta, U.; Jain, N.K. A Review of Glycosylated Carriers for Drug Delivery. Biomaterials 2012, 33, 4166–4186. [Google Scholar] [CrossRef] [PubMed]
- Jain, N.K.; Mishra, V.; Mehra, N.K. Targeted Drug Delivery to Macrophages. Expert Opin. Drug Deliv. 2013, 10, 353–367. [Google Scholar] [CrossRef] [PubMed]
- Stebbins, N.D.; Ouimet, M.A.; Uhrich, K.E. Antibiotic-Containing Polymers for Localized, Sustained Drug Delivery. Adv. Drug Deliv. Rev. 2014, 78, 77–87. [Google Scholar] [CrossRef]
- Tao, F.; Ma, S.; Tao, H.; Jin, L.; Luo, Y.; Zheng, J.; Xiang, W.; Deng, H. Chitosan-Based Drug Delivery Systems: From Synthesis Strategy to Osteomyelitis Treatment—A Review. Carbohydr. Polym. 2021, 251, 117063. [Google Scholar] [CrossRef]
- Mavromoustakos, T.; Tzakos, A.G. Supramolecules in Drug Discovery and Drug Delivery; Humana Press: Totowa, NJ, USA, 2021; ISBN 9781071609194. [Google Scholar]
- Le-Deygen, I.M.; Skuredina, A.A.; Kudryashova, E.V. Drug Delivery Systems for Fluoroquinolones: New Prospects in Tuberculosis Treatment. Russ. J. Bioorg. Chem. 2017, 43, 487–501. [Google Scholar] [CrossRef]
- Neyfakh, A.A.; Bidnenko, V.E.; Chen, L.B. Efflux-Mediated Multidrug Resistance in Bacillus Subtilis: Similarities and Dissimilarities with the Mammalian System. Proc. Natl. Acad. Sci. USA 1991, 88, 4781–4785. [Google Scholar] [CrossRef]
- Macêdo, N.S.; Silveira, Z.D.S.; Patrícia, P.; Cordeiro, M.; Douglas, H.; Coutinho, M.; Pinto, J.; Júnior, S.; José, L.; Júnior, Q.; et al. Inhibition of Staphylococcus Aureus Efflux Pump by O-Eugenol and Its Toxicity in Drosophila Melanogaster Animal Model. BioMed Res. Int. 2022, 2022, 1440996. [Google Scholar] [CrossRef]
- Muniz, D.F.; dos Santos Barbosa, C.R.; de Menezes, I.R.A.; de Sousa, E.O.; Pereira, R.L.S.; Júnior, J.T.C.; Pereira, P.S.; de Matos, Y.M.L.S.; da Costa, R.H.S.; de Morais Oliveira-Tintino, C.D.; et al. In Vitro and in Silico Inhibitory Effects of Synthetic and Natural Eugenol Derivatives against the NorA Efflux Pump in Staphylococcus Aureus. Food Chem. 2021, 337, 127776. [Google Scholar] [CrossRef]
- Van Bambeke, F.; Balzi, E.; Tulkens, P.M. Antibiotic Efflux Pumps. Biochem. Pharmacol. 2000, 60, 457–470. [Google Scholar] [CrossRef]
- Li, X.Z.; Nikaido, H. Efflux-Mediated Drug Resistance in Bacteria. Drugs 2004, 64, 159–204. [Google Scholar] [CrossRef] [PubMed]
- Chen, X.Y.; Qian, F.; Wang, Y.Y.; Liu, Y.; Sun, Y.; Bin Zha, W.; Hao, K.; Zhou, F.; Wang, G.J.; Zhang, J.W. Ginsenoside 20(S)-Rh2 Promotes Cellular Pharmacokinetics and Intracellular Antibacterial Activity of Levofloxacin against Staphylococcus Aureus through Drug Efflux Inhibition and Subcellular Stabilization. Acta Pharmacol. Sin. 2021, 42, 1930–1941. [Google Scholar] [CrossRef] [PubMed]
- Keith, J.W.; Pamer, E.G. Enlisting Commensal Microbes to Resist Antibiotic-Resistant Pathogens. J. Exp. Med. 2019, 216, 10–19. [Google Scholar] [CrossRef]
- Hortle, E.; Oehlers, S.H. Host-Directed Therapies Targeting the Tuberculosis Granuloma Stroma. Pathog. Dis. 2020, 78, ftaa015. [Google Scholar] [CrossRef]
- Hemaiswarya, S.; Doble, M. Synergistic Interaction of Eugenol with Antibiotics against Gram Negative Bacteria. Phytomedicine 2009, 16, 997–1005. [Google Scholar] [CrossRef]
- Kayaci, F.; Ertas, Y.; Uyar, T. Enhanced Thermal Stability of Eugenol by Cyclodextrin Inclusion Complex Encapsulated in Electrospun Polymeric Nanofibers. J. Agric. Food Chem. 2013, 61, 8156–8165. [Google Scholar] [CrossRef]
- Ulanowska, M.; Olas, B. Biological Properties and Prospects for the Application of Eugenol—A Review. Int. J. Mol. Sci. 2021, 22, 3671. [Google Scholar] [CrossRef]
- Tadtong, S.; Watthanachaiyingcharoen, R.; Kamkaen, N. Antimicrobial Constituents and Synergism Effect of the Essential Oils from Cymbopogon Citratus and Alpinia Galanga. Nat. Prod. Commun. 2014, 9, 277–280. [Google Scholar] [CrossRef]
- Cardoso, N.N.R.; Alviano, C.S.; Blank, A.F.; Romanos, M.T.V.; Fonseca, B.B.; Rozental, S.; Rodrigues, I.A.; Alviano, D.S. Synergism Effect of the Essential Oil from Ocimum Basilicum Var. Maria Bonita and Its Major Components with Fluconazole and Its Influence on Ergosterol Biosynthesis. Evid.-Based Complement. Altern. Med. 2016, 2016, 5647182. [Google Scholar] [CrossRef] [Green Version]
- Jafri, H.; Banerjee, G.; Khan, M.S.A.; Ahmad, I.; Abulreesh, H.H.; Althubiani, A.S. Synergistic Interaction of Eugenol and Antimicrobial Drugs in Eradication of Single and Mixed Biofilms of Candida Albicans and Streptococcus Mutans. AMB Express 2020, 10, 185. [Google Scholar] [CrossRef] [PubMed]
- Zlotnikov, I.D.; Belogurova, N.G.; Krylov, S.S.; Semenova, M.N.; Semenov, V.V.; Kudryashova, E.V. Plant Alkylbenzenes and Terpenoids in the Form of Cyclodextrin Inclusion Complexes as Antibacterial Agents and Levofloxacin Synergists. Pharmaceuticals 2022, 15, 861. [Google Scholar] [CrossRef] [PubMed]
- Boire, N.A.; Riedel, S.; Parrish, N.M. Essential Oils and Future Antibiotics: New Weapons against Emerging ‘Superbugs’? J. Anc. Dis. Prev. Rem. 2013, 1, 105. [Google Scholar] [CrossRef]
- Zlotnikov, I.D.; Kudryashova, E.V. Spectroscopy Approach for Highly—Efficient Screening of Lectin—Ligand Interactions in Application for Mannose Receptor and Molecular Containers for Antibacterial Drugs. Pharmaceuticals 2022, 15, 625. [Google Scholar] [CrossRef]
- Herman, A.; Tambor, K.; Herman, A. Linalool Affects the Antimicrobial Efficacy of Essential Oils. Curr. Microbiol. 2016, 72, 165–172. [Google Scholar] [CrossRef]
- Lichtenstein, E.P.; Liang, T.T.; Schulz, K.R.; Schnoes, H.K.; Carter, G.T. Insecticidal and Synergistic Components Isolated from Dill Plants. J. Agric. Food Chem. 1974, 22, 658–664. [Google Scholar] [CrossRef]
- Samet, A.V.; Shevchenko, O.G.; Rusak, V.V.; Chartov, E.M.; Myshlyavtsev, A.B.; Rusanov, D.A.; Semenova, M.N.; Semenov, V.V. Antioxidant Activity of Natural Allylpolyalkoxybenzene Plant Essential Oil Constituents. J. Nat. Prod. 2019, 82, 1451–1458. [Google Scholar] [CrossRef]
- Jiso, A.; Khemawoot, P.; Techapichetvanich, P.; Soopairin, S.; Phoemsap, K.; Damrongsakul, P.; Wongwiwatthananukit, S.; Vivithanaporn, P. Drug-Herb Interactions among Thai Herbs and Anticancer Drugs: A Scoping Review. Pharmaceuticals 2022, 15, 146. [Google Scholar] [CrossRef]
- Peyron, P.; Vaubourgeix, J.; Poquet, Y.; Levillain, F.; Botanch, C.; Bardou, F.; Daffé, M.; Emile, J.F.; Marchou, B.; Cardona, P.J.; et al. Foamy Macrophages from Tuberculous Patients’ Granulomas Constitute a Nutrient-Rich Reservoir for M. Tuberculosis Persistence. PLoS Pathog. 2008, 4, e1000204. [Google Scholar] [CrossRef]
- Sharma, R.; O’Sullivan, K.M.; Holdsworth, S.R.; Bardin, P.G.; King, P.T. Visualizing Macrophage Extracellular Traps Using Confocal Microscopy. J. Vis. Exp. 2017, 2017, e56459. [Google Scholar] [CrossRef]
- Bowdish, D.M.E.; Sakamoto, K.; Kim, M.J.; Kroos, M.; Mukhopadhyay, S.; Leifer, C.A.; Tryggvason, K.; Gordon, S.; Russell, D.G. MARCO, TLR2, and CD14 Are Required for Macrophage Cytokine Responses to Mycobacterial Trehalose Dimycolate and Mycobacterium Tuberculosis. PLoS Pathog. 2009, 5, e1000474. [Google Scholar] [CrossRef] [PubMed]
- Ercoli, G.; Fernandes, V.E.; Chung, W.Y.; Wanford, J.J.; Thomson, S.; Bayliss, C.D.; Straatman, K.; Crocker, P.R.; Dennison, A.; Martinez-Pomares, L.; et al. Intracellular Replication of Streptococcus Pneumoniae inside Splenic Macrophages Serves as a Reservoir for Septicaemia. Nat. Microbiol. 2018, 3, 600–610. [Google Scholar] [CrossRef] [PubMed]
- Gordon, S. The Role of the Macrophage in Immune Regulation. Res. Immunol. 1998, 149, 685–688. [Google Scholar] [CrossRef]
- Valledor, A.F.; Comalada, M.; Santamaría-Babi, L.F.; Lloberas, J.; Celada, A. Macrophage Proinflammatory Activation and Deactivation. A Question of Balance. Adv. Immunol. 2010, 108, 1–20. [Google Scholar] [CrossRef] [PubMed]
- Brundu, S.F.A. Polarization and Repolarization of Macrophages. J. Clin. Cell. Immunol. 2015, 6, 2. [Google Scholar] [CrossRef]
- Cassetta, L.; Pollard, J.W. Repolarizing Macrophages Improves Breast Cancer Therapy. Cell Res. 2017, 27, 963–964. [Google Scholar] [CrossRef]
- Kaku, Y.; Imaoka, H.; Morimatsu, Y.; Komohara, Y.; Ohnishi, K.; Oda, H.; Takenaka, S.; Matsuoka, M.; Kawayama, T.; Takeya, M.; et al. Overexpression of CD163, CD204 and CD206 on Alveolar Macrophages in the Lungs of Patients with Severe Chronic Obstructive Pulmonary Disease. PLoS ONE 2014, 9, e87400. [Google Scholar] [CrossRef]
- East, L.; Isacke, C.M. The Mannose Receptor Family. Biochim. Biophys. Acta Gen. Subj. 2002, 1572, 364–386. [Google Scholar] [CrossRef]
- Feinberg, H.; Jégouzo, S.A.F.; Lasanajak, Y.; Smith, D.F.; Drickamer, K.; Weis, W.I.; Taylor, M.E. Structural Analysis of Carbohydrate Binding by the Macrophage Mannose Receptor CD206. J. Biol. Chem. 2021, 296, 100368. [Google Scholar] [CrossRef]
- Filatova, L.Y.; Klyachko, N.L.; Kudryashova, E.V. Targeted Delivery of Anti-Tuberculosis Drugs to Macrophages: Targeting Mannose Receptors. Russ. Chem. Rev. 2018, 87, 374–391. [Google Scholar] [CrossRef]
- Zlotnikov, I.D.; Kudryashova, E.V. Mannose Receptors of Alveolar Macrophages as a Target for the Addressed Delivery of Medicines to the Lungs. Russ. J. Bioorg. Chem. 2022, 48, 46–75. [Google Scholar] [CrossRef]
- Zlotnikov, I.D.; Kudryashova, E.V. Computer Simulation of the Receptor–Ligand Interactions of Mannose Receptor CD206 in Comparison with the Lectin Concanavalin A Model. Biochemistry 2022, 87, 54–69. [Google Scholar] [CrossRef] [PubMed]
- Zlotnikov, I.D.; Vanichkin, D.A.; Kudryashova, E.V. Methods for Determining the Parameters of Receptor-Ligand Interactions on the Model of Concanavalin A and Mannosylated Chitosans Promising Carriers for Drug Delivery to Alveolar Macrophages. Biotekhnologiya 2021, 37, 28–40. [Google Scholar] [CrossRef]
- Van Landschoot, A.; Loontiens, F.G.; De Bruyne, C.K. Binding of Manno-oligosaccharides to Concanavalin A: Substitution Titration with a Fluorescent-Indicator Ligand. Eur. J. Biochem. 1980, 103, 307–312. [Google Scholar] [CrossRef] [PubMed]
- Naismith, J.H.; Field, R.A. Structural Basis of Trimannoside Recognition by Concanavalin A. J. Biol. Chem. 1996, 271, 972–976. [Google Scholar] [CrossRef]
- Mislovičová, D.; Masárová, J.; Švitel, J.; Mendichi, R.; Šoltés, L.; Gemeiner, P.; Danielsson, B. Neoglycoconjugates of Mannan with Bovine Serum Albumin and Their Interaction with Lectin Concanavalin A. Bioconjug. Chem. 2002, 13, 136–142. [Google Scholar] [CrossRef]
- Mandal, D.K.; Kishore, N.; Brewer, C.F. Thermodynamics of Lectin-Carbohydrate Interactions. Titration Microcalorimetry Measurements of the Binding of N-Linked Carbohydrates and Ovalbumin to Concanavalin A. Biochemistry 1994, 33, 1149–1156. [Google Scholar] [CrossRef]
- Chen, P.; Zhang, X.; Jia, L.; Prud’Homme, R.K.; Szekely, Z.; Sinko, P.J. Optimal Structural Design of Mannosylated Nanocarriers for Macrophage Targeting. J. Control. Release 2014, 194, 341–349. [Google Scholar] [CrossRef]
- Nimje, N.; Agarwal, A.; Saraogi, G.K.; Lariya, N.; Rai, G.; Agrawal, H.; Agrawal, G.P. Mannosylated Nanoparticulate Carriers of Rifabutin for Alveolar Targeting. J. Drug Target. 2009, 17, 777–787. [Google Scholar] [CrossRef]
- Nahar, M.; Dubey, V.; Mishra, D.; Mishra, P.K.; Dube, A.; Jain, N.K. In Vitro Evaluation of Surface Functionalized Gelatin Nanoparticles for Macrophage Targeting in the Therapy of Visceral Leishmaniasis. J. Drug Target. 2010, 18, 93–105. [Google Scholar] [CrossRef]
- Skuredina, A.A.; Tychinina, A.S.; Le-Deygen, I.M.; Belogurova, N.G.; Kudryashova, E.V. Regulation of Properties of Lipid Membranes by Interaction with 2-Hydroxypropyl β-Cyclodextrin: Molecular Details. Russ. J. Bioorg. Chem. 2020, 46, 692–701. [Google Scholar] [CrossRef]
- Vyas, S.P.; Khatri, K. Liposome-Based Drug Delivery to Alveolar Macrophages. Expert Opin. Drug Deliv. 2007, 4, 95–99. [Google Scholar] [CrossRef] [PubMed]
- Kelly, C.; Jefferies, C.; Cryan, S.-A. Targeted Liposomal Drug Delivery to Monocytes and Macrophages. J. Drug Deliv. 2011, 2011, 727241. [Google Scholar] [CrossRef]
- Alizadeh, D.; Zhang, L.; Hwang, J.; Schluep, T.; Badie, B. Tumor-Associated Macrophages Are Predominant Carriers of Cyclodextrin-Based Nanoparticles into Gliomas. Nanomed. Nanotechnol. Biol. Med. 2010, 6, 382–390. [Google Scholar] [CrossRef] [PubMed]
- Rodríguez-Lavado, J.; De La Mata, M.; Jiménez-Blanco, J.L.; García-Moreno, M.I.; Benito, J.M.; Díaz-Quintana, A.; Sánchez-Alcázar, J.A.; Higaki, K.; Nanba, E.; Ohno, K.; et al. Targeted Delivery of Pharmacological Chaperones for Gaucher Disease to Macrophages by a Mannosylated Cyclodextrin Carrier. Org. Biomol. Chem. 2014, 12, 2289–2301. [Google Scholar] [CrossRef] [PubMed]
- Mahor, S.; Dash, B.C.; O’Connor, S.; Pandit, A. Mannosylated Polyethyleneimine-Hyaluronan Nanohybrids for Targeted Gene Delivery to Macrophage-like Cell Lines. Bioconjug. Chem. 2012, 23, 1138–1148. [Google Scholar] [CrossRef] [PubMed]
- Bendas, G.; Krause, A.; Schmidt, R.; Vogel, J.; Ulrich Rothe Selectins as New Targets for Immunoliposome-Mediated Drug Delivery. A Potential Way of Anti-Inflammatory Therapy. Pharm. Acta Helv. 1998, 73, 19–26. [Google Scholar] [CrossRef]
- Raviv, L.; Jaron-Mendelson, M.; David, A. Mannosylated Polyion Complexes for in Vivo Gene Delivery into CD11c+ Dendritic Cells. Mol. Pharm. 2015, 12, 453–462. [Google Scholar] [CrossRef]
- Lopukhov, A.V.; Yang, Z.; Haney, M.J.; Bronich, T.K.; Sokolsky-Papkov, M.; Batrakova, E.V.; Klyachko, N.L.; Kabanov, A.V. Mannosylated Cationic Copolymers for Gene Delivery to Macrophages. Macromol. Biosci. 2021, 21, 2000371. [Google Scholar] [CrossRef]
- Kunjachan, S.; Gupta, S.; Dwivedi, A.K.; Dube, A.; Chourasia, M.K. Chitosan-Based Macrophage-Mediated Drug Targeting for the Treatment of Experimental Visceral Leishmaniasis. J. Microencapsul. 2011, 28, 301–310. [Google Scholar] [CrossRef]
- Jiang, H.L.; Kim, Y.K.; Arote, R.; Jere, D.; Quan, J.S.; Yu, J.H.; Choi, Y.J.; Nah, J.W.; Cho, M.H.; Cho, C.S. Mannosylated Chitosan-Graft-Polyethylenimine as a Gene Carrier for Raw 264.7 Cell Targeting. Int. J. Pharm. 2009, 375, 133–139. [Google Scholar] [CrossRef]
- Yu, W.; Liu, C.; Liu, Y.; Zhang, N.; Xu, W. Mannan-Modified Solid Lipid Nanoparticles for Targeted Gene Delivery to Alveolar Macrophages. Pharm. Res. 2010, 27, 1584–1596. [Google Scholar] [CrossRef] [PubMed]
- Titov, D.V.; Gening, M.L.; Tsvetkov, Y.E.; Nifantiev, N.E. Conjugates of Cyclooligosaccharide Scaffolds and Carbohydrate Ligands: Methods for Synthesis and the Interaction with Lectins. Russ. J. Bioorg. Chem. 2013, 39, 451–487. [Google Scholar] [CrossRef] [PubMed]
- Yang, C.; Li, H.; Goh, S.H.; Li, J. Cationic Star Polymers Consisting of α-Cyclodextrin Core and Oligoethylenimine Arms as Nonviral Gene Delivery Vectors. Biomaterials 2007, 28, 3245–3254. [Google Scholar] [CrossRef] [PubMed]
- Samal, S.K.; Dash, M.; Van Vlierberghe, S.; Kaplan, D.L.; Chiellini, E.; van Blitterswijk, C.; Moroni, L.; Dubruel, P. Cationic Polymers and Their Therapeutic Potential. Chem. Soc. Rev. 2012, 41, 7147–7194. [Google Scholar] [CrossRef]
- Chaubey, P.; Mishra, B.; Mudavath, S.L.; Patel, R.R.; Chaurasia, S.; Sundar, S.; Suvarna, V.; Monteiro, M. Mannose-Conjugated Curcumin-Chitosan Nanoparticles: Efficacy and Toxicity Assessments against Leishmania Donovani. Int. J. Biol. Macromol. 2018, 111, 109–120. [Google Scholar] [CrossRef]
- Freichels, H.; Wagner, M.; Okwieka, P.; Meyer, R.G.; Mailänder, V.; Landfester, K.; Musyanovych, A. (Oligo)Mannose Functionalized Hydroxyethyl Starch Nanocapsules: En Route to Drug Delivery Systems with Targeting Properties. J. Mater. Chem. B 2013, 1, 4338–4348. [Google Scholar] [CrossRef]
- Yao, W.; Jiao, Y.; Luo, J.; Du, M.; Zong, L. Practical Synthesis and Characterization of Mannose-Modified Chitosan. Int. J. Biol. Macromol. 2012, 50, 821–825. [Google Scholar] [CrossRef]
- Wang, S.K.; Liang, P.H.; Astronomo, R.D.; Hsu, T.L.; Hsieh, S.L.; Burton, D.R.; Wong, C.H. Targeting the Carbohydrates on HIV-1: Interaction of Oligomannose Dendrons with Human Monoclonal Antibody 2G12 and DC-SIGN. Proc. Natl. Acad. Sci. USA 2008, 105, 3690–3695. [Google Scholar] [CrossRef]
- Ikehara, Y.; Shiuchi, N.; Kabata-Ikehara, S.; Nakanishi, H.; Yokoyama, N.; Takagi, H.; Nagata, T.; Koide, Y.; Kuzushima, K.; Takahashi, T.; et al. Effective Induction of Anti-Tumor Immune Responses with Oligomannose-Coated Liposome Targeting to Intraperitoneal Phagocytic Cells. Cancer Lett. 2008, 260, 137–145. [Google Scholar] [CrossRef]
- Ito, M.; Murakami, K.; Yoshino, M. Antioxidant Action of Eugenol Compounds: Role of Metal Ion in the Inhibition of Lipid Peroxidation. Food Chem. Toxicol. 2005, 43, 461–466. [Google Scholar] [CrossRef] [PubMed]
- Ali, S.M.; Khan, A.A.; Ahmed, I.; Musaddiq, M.; Ahmed, K.S.; Polasa, H.; Rao, L.V.; Habibullah, C.M.; Sechi, L.A.; Ahmed, N. Antimicrobial Activities of Eugenol and Cinnamaldehyde against the Human Gastric Pathogen Helicobacter Pylori. Ann. Clin. Microbiol. Antimicrob. 2005, 4, 20. [Google Scholar] [CrossRef] [PubMed]
- Joardar, A.; Meher, G.; Bag, B.P.; Chakraborty, H. Host-Guest Complexation of Eugenol in Cyclodextrins for Enhancing Bioavailability. J. Mol. Liq. 2020, 319, 114336. [Google Scholar] [CrossRef]
- Leite, A.M.; Lima, E.D.O.; De Souza, E.L.; Diniz, M.D.F.F.M.; Trajano, V.N.; De Medeiros, I.A. Inhibitory Effect of β-Pinene, α-Pinene and Eugenol on the Growth of Potential Infectious Endocarditis Causing Gram-Positive Bacteria. Rev. Bras. Ciencias Farm. J. Pharm. Sci. 2007, 43, 121–126. [Google Scholar] [CrossRef]
- Cotmore, J.M.; Burke, A.; Lee, N.H.; Shapiro, I.M. Respiratory Inhibition of Isolated Rat Liver Mitochondria by Eugenol. Arch. Oral Biol. 1979, 24, 565–568. [Google Scholar] [CrossRef]
- Bucak, C.D.; Kürekci, C.; Dinç, C.Ö. Carrying System Formula for Eugenol Encapsulation: Glycodendritic Polyamine Dextran-G2.5, Synthesis and in Vitro Antibacterial Activity. Polym. Bull. 2021, 78, 601–620. [Google Scholar] [CrossRef]
- Pramod, K.; Ansari, S.H.; Ali, J. Eugenol: A Natural Compound with Versatile Pharmacological Actions. Nat. Prod. Commun. 2010, 5, 1999–2006. [Google Scholar] [CrossRef]
- Wang, T.; Li, B.; Si, H.; Lin, L.; Chen, L. Release Characteristics and Antibacterial Activity of Solid State Eugenol/β-Cyclodextrin Inclusion Complex. J. Incl. Phenom. Macrocycl. Chem. 2011, 71, 207–213. [Google Scholar] [CrossRef]
- Garg, A.; Gupta, B.; Prakash, R.; Singh, S. Preparation and Characterization of Hydroxypropyl-β-Cyclodextrin Inclusion Complex of Eugenol: Differential Pulse Voltammetry and 1H-NMR. Chem. Pharm. Bull. 2010, 58, 1313–1319. [Google Scholar] [CrossRef]
- Valdivieso-Ugarte, M.; Gomez-Llorente, C.; Plaza-Díaz, J.; Gil, Á. Antimicrobial, Antioxidant, and Immunomodulatory Properties of Essential Oils: A Systematic Review. Nutrients 2019, 11, 2786. [Google Scholar] [CrossRef] [Green Version]
- Gao, J.Q.; Zhao, Q.Q.; Lv, T.F.; Shuai, W.P.; Zhou, J.; Tang, G.P.; Liang, W.Q.; Tabata, Y.; Hu, Y.L. Gene-Carried Chitosan-Linked-PEI Induced High Gene Transfection Efficiency with Low Toxicity and Significant Tumor-Suppressive Activity. Int. J. Pharm. 2010, 387, 286–294. [Google Scholar] [CrossRef] [PubMed]
- Tang, G.P.; Guo, H.Y.; Alexis, F.; Wang, X.; Zeng, S.; Lim, T.M.; Ding, J.; Yang, Y.Y.; Wang, S. Low Molecular Weight Polyethylenimines Linked by β-Cyclodextrin for Gene Transfer into the Nervous System. J. Gene Med. 2006, 8, 736–744. [Google Scholar] [CrossRef] [PubMed]
- Ruan, G.X.; Chen, Y.Z.; Yao, X.L.; Du, A.; Tang, G.P.; Shen, Y.Q.; Tabata, Y.; Gao, J.Q. Macrophage Mannose Receptor-Specific Gene Delivery Vehicle for Macrophage Engineering. Acta Biomater. 2014, 10, 1847–1855. [Google Scholar] [CrossRef] [PubMed]
- Taguchi, T.; Kitajima, K.; Niimi, T.; Muto, Y.; Yokoyama, S.; Inoue, S.; Inoue, Y. Complete assignments of 13C NMR resonances to all the carbon atoms of the trimannosido-di-N-acetylchitobiosyl structure in a pentaantennary decasaccharide glycopeptide. Carbohydr. Res. 1995, 275, 185–191. [Google Scholar] [CrossRef]
- Skuredina, A.A.; Tychinina, A.S.; Le-Deygen, I.M.; Golyshev, S.A.; Belogurova, N.G.; Kudryashova, E.V. The Formation of Quasi-Regular Polymeric Network of Cross-Linked Sulfobutyl Ether Derivative of β-Cyclodextrin Synthesized with Moxifloxacin as a Template. React. Funct. Polym. 2021, 159, 104811. [Google Scholar] [CrossRef]
- Mi, R.P.; Ki, O.H.; In, K.H.; Myung, H.C.; Jae, W.N.; Yun, J.C.; Chong, S.C. Degradable Polyethylenimine-Alt-Poly(Ethylene Glycol) Copolymers as Novel Gene Carriers. J. Control. Release 2005, 105, 367–380. [Google Scholar] [CrossRef]
- Legal, J.M.; Manfait, M.; Theophanides, T. Applications of FTIR Spectroscopy in Structural Studies of Cells and Bacteria. J. Mol. Struct. 1991, 242, 397–407. [Google Scholar] [CrossRef]
- Szabó, Z.I.; Deme, R.; Mucsi, Z.; Rusu, A.; Mare, A.D.; Fiser, B.; Toma, F.; Sipos, E.; Tóth, G. Equilibrium, Structural and Antibacterial Characterization of Moxifloxacin-β-Cyclodextrin Complex. J. Mol. Struct. 2018, 1166, 228–236. [Google Scholar] [CrossRef]
- Cameron, K.S.; Fletcher, D.; Fielding, L. An NMR Study of Cyclodextrin Complexes of the Steroidal Neuromuscular Blocker Drug Rocuronium Bromide. Magn. Reson. Chem. 2002, 40, 251–260. [Google Scholar] [CrossRef]
- Honary, S.; Zahir, F. Effect of Zeta Potential on the Properties of Nano-Drug Delivery Systems—A Review (Part 1). Trop. J. Pharm. Res. 2013, 12, 255–264. [Google Scholar] [CrossRef]
- Griesser, J.; Burtscher, S.; Köllner, S.; Nardin, I.; Prüfert, F.; Bernkop-Schnürch, A. Zeta Potential Changing Self-Emulsifying Drug Delivery Systems Containing Phosphorylated Polysaccharides. Eur. J. Pharm. Biopharm. 2017, 119, 264–270. [Google Scholar] [CrossRef] [PubMed]
- Weis, W.I.; Drickamer, K. Structural Basis of Recognition Lectin-Carb Ohydrate. Anna Rev. Biochen. 1996, 65, 441–473. [Google Scholar] [CrossRef] [PubMed]
- Ghotbi, Z.; Haddadi, A.; Hamdy, S.; Hung, R.W.; Samuel, J.; Lavasanifar, A. Active Targeting of Dendritic Cells with Mannan-Decorated PLGA Nanoparticles. J. Drug Target. 2011, 19, 281–292. [Google Scholar] [CrossRef] [PubMed]
- Dam, T.K.; Roy, R.; Das, S.K.; Oscarson, S.; Brewer, C.F. Binding of Multivalent Carbohydrates to Concanavalin A and Dioclea Grandiflora Lectin. Thermodynamic Analysis of the ‘Multivalency Effect’. J. Biol. Chem. 2000, 275, 14223–14230. [Google Scholar] [CrossRef] [PubMed]
- Kaushik, S.; Mohanty, D.; Surolia, A. The Role of Metal Ions in Substrate Recognition and Stability of Concanavalin A: A Molecular Dynamics Study. Biophys. J. 2009, 96, 21–34. [Google Scholar] [CrossRef]
- Pflumm, M.N.; Wang, J.L.; Edelman, G.M. Conformational Changes in Concanavalin A. J. Biol. Chem. 1971, 246, 4369–4370. [Google Scholar] [CrossRef]
- Loontiens, F.G.; Clegg, R.M.; Van Landschoot, A. Some Physicochemical Aspects of Oligosaccharide Binding to Concanavalin A and Wheat Germ Agglutinin. J. Biosci. 1983, 5, 105–120. [Google Scholar] [CrossRef]
- Bryce, R.A.; Hillier, I.H.; Naismith, J.H. Carbohydrate-Protein Recognition: Molecular Dynamics Simulations and Free Energy Analysis of Oligosaccharide Binding to Concanavalin A. Biophys. J. 2001, 81, 1373–1388. [Google Scholar] [CrossRef]
- Satoh, T.; Suzuki, K.; Yamaguchi, T.; Kato, K. Structural Basis for Disparate Sugar-Binding Specificities in the Homologous Cargo Receptors ERGIC-53 and VIP36. PLoS ONE 2014, 9, e87963. [Google Scholar] [CrossRef]
- Le-Deygen, I.M.; Mamaeva, P.V.; Skuredina, A.A.; Kudryashova, E.V. A Spectral Approach to Study Interaction between Chitosan Modified with Mannose and Concavalin A for the Creation of Address Delivery Systems of Antituberculosis Drugs. Moscow Univ. Chem. Bull. 2020, 75, 213–217. [Google Scholar] [CrossRef]
- Díaz-Moscoso, A.; Guilloteau, N.; Bienvenu, C.; Méndez-Ardoy, A.; Jiménez Blanco, J.L.; Benito, J.M.; Le Gourriérec, L.; Di Giorgio, C.; Vierling, P.; Defaye, J.; et al. Mannosyl-Coated Nanocomplexes from Amphiphilic Cyclodextrins and PDNA for Site-Specific Gene Delivery. Biomaterials 2011, 32, 7263–7273. [Google Scholar] [CrossRef] [PubMed]
- Weatherman, R.V.; Kiessling, L.L. Fluorescence Anisotropy Assays Reveal Affinities of C- and O-Glycosides for Concanavalin A. J. Org. Chem. 1996, 61, 534–538. [Google Scholar] [CrossRef] [PubMed]
- Novak, U.; Grdadolnik, J. The Hydration of Concanavalin A Studied by Infrared Spectroscopy. J. Mol. Struct. 2017, 1135, 138–143. [Google Scholar] [CrossRef]
- Ogura, K.; Kobayashi, M.; Nakayama, M.; Miho, Y. In-Situ FTIR Studies on the Electrochemical Oxidation of Histidine and Tyrosine. J. Electroanal. Chem. 1999, 463, 218–223. [Google Scholar] [CrossRef]
- Skuredina, A.A.; Le-Deygen, I.M.; Belogurova, N.G.; Kudryashova, E.V. Effect of Cross-Linking on the Inclusion Complex Formation of Derivatized β-Cyclodextrins with Small-Molecule Drug Moxifloxacin. Carbohydr. Res. 2020, 498, 108183. [Google Scholar] [CrossRef]
- Skuredina, A.A.; Le-Deygen, I.M.; Uporov, I.V.; Kudryashova, E.V. A Study of the Physicochemical Properties and Structure of Moxifloxacin Complex with Methyl-β-Cyclodextrin. Colloid J. 2017, 79, 668–676. [Google Scholar] [CrossRef]
- Sukhoverkov, K.V.; Le-Deygen, I.M.; Egorov, A.M.; Kudryashova, E.V. Physicochemical Properties of the Inclusion Complex of Moxifloxacin with Hydroxypropyl-β-Cyclodextrin Synthesized by RESS. Russ. J. Phys. Chem. B 2018, 12, 1193–1204. [Google Scholar] [CrossRef]
- Elshafie, H.S.; Sakr, S.H.; Sadeek, S.A.; Camele, I. Biological Investigations and Spectroscopic Studies of New Moxifloxacin/Glycine-Metal Complexes. Chem. Biodivers. 2019, 16, e1800633. [Google Scholar] [CrossRef]
- Al Omari, M.M.H.; Jaafari, D.S.; Al-Sou’od, K.A.; Badwan, A.A. Moxifloxacin hydrochloride. Profiles Drug Subst. Excip. Relat. Methodol. 2014, 39, 299–431. [Google Scholar]
- Jelić, R.; Tomović, M.; Stojanović, S.; Joksović, L.; Jakovljević, I.; Djurdjević, P. Study of Inclusion Complex of β-Cyclodextrin and Levofloxacin and Its Effect on the Solution Equilibria between Gadolinium(III) Ion and Levofloxacin. Monatshefte Chem. 2015, 146, 1621–1630. [Google Scholar] [CrossRef]
- Chen, M.; Diao, G.; Zhang, E. Study of Inclusion Complex of β-Cyclodextrin and Nitrobenzene. Chemosphere 2006, 63, 522–529. [Google Scholar] [CrossRef] [PubMed]
- Banjare, M.K.; Behera, K.; Banjare, R.K.; Pandey, S.; Ghosh, K.K. Inclusion Complexation of Imidazolium-Based Ionic Liquid and β-Cyclodextrin: A Detailed Spectroscopic Investigation. J. Mol. Liq. 2020, 302, 112530. [Google Scholar] [CrossRef]
- Fernandes, C.M.; Carvalho, R.A.; Pereira da Costa, S.; Veiga, F.J.B. Multimodal Molecular Encapsulation of Nicardipine Hydrochloride by β-Cyclodextrin, Hydroxypropyl-β-Cyclodextrin and Triacetyl-β-Cyclodextrin in Solution. Structural Studies by 1H NMR and ROESY Experiments. Eur. J. Pharm. Sci. 2003, 18, 285–296. [Google Scholar] [CrossRef]
- Kost, B.; Brzeziński, M.; Zimnicka, M.; Socka, M.; Wielgus, E.; Słowianek, M.; Biela, T. PLA Stereocomplexed Microspheres Modified with Methyl-β-Cyclodextrin as an Atropine Delivery System. Synthesis and Characterization. Mater. Today Commun. 2020, 25, 101605. [Google Scholar] [CrossRef]
- Le-Deygen, I.M.; Skuredina, A.A.; Uporov, I.V.; Kudryashova, E.V. Thermodynamics and Molecular Insight in Guest–Host Complexes of Fluoroquinolones with β-Cyclodextrin Derivatives, as Revealed by ATR-FTIR Spectroscopy and Molecular Modeling Experiments. Anal. Bioanal. Chem. 2017, 409, 6451–6462. [Google Scholar] [CrossRef]
- Wang, B.; Ye, Z.; Tang, Y.; Liu, H.; Lin, Q.; Chen, H.; Nan, K. Loading of Antibiotics into Polyelectrolyte Multilayers after Self-Assembly and Tunable Release by Catechol Reaction. J. Phys. Chem. C 2016, 120, 6145–6155. [Google Scholar] [CrossRef]
- Deygen, I.M.; Kudryashova, E.V. New Versatile Approach for Analysis of PEG Content in Conjugates and Complexes with Biomacromolecules Based on FTIR Spectroscopy. Colloids Surf. B Biointerfaces 2016, 141, 36–43. [Google Scholar] [CrossRef] [PubMed]
- Corte, L.; Tiecco, M.; Roscini, L.; Germani, R.; Cardinali, G. FTIR Analysis of the Metabolomic Stress Response Induced by N-Alkyltropinium Bromide Surfactants in the Yeasts Saccharomyces Cerevisiae and Candida Albicans. Colloids Surf. B Biointerfaces 2014, 116, 761–771. [Google Scholar] [CrossRef] [PubMed]


| Ligand | Chemical Designation | Molecular Weight, kDa | Molar Ratio * | Hydrodynamic Size **, nm | Zeta Potential **, mV | Polydispersity Index ** |
|---|---|---|---|---|---|---|
| 1 | amCD-triMan | 2.1 | 1:1 | <5 | −2 ± 1 | - |
| 2a | PEI1.8-triMan | 15 ± 5 | 1:15 | 6 ± 1 | −1.1 ± 0.5 | 0.30 |
| 2b | HPCD-PEI1.8-triMan | 23 ± 8 | 5:1:15 | 17 ± 4 | −2.1 ± 0.4 | 0.28 |
| 3a | PEI10-triMan | 45 ± 10 | 1:40 | 8 ± 1 | +20 ± 3 | 0.5 |
| 3b | HPCD-PEI10-triMan | 60 ± 7 | 10:1:40 | 48 ± 7 | +5 ± 2 | 0.2 |
| Ligand | Chemical Designation | n | −lg Kd (ConA·nLigand) |
|---|---|---|---|
| 1 | amCD-triMan | 1.0 ± 0.2 | 4.1 ± 0.8 |
| 2a | PEI1.8-triMan | 1.5 ± 0.1 | 6.5 ± 0.4 |
| 2b | HPCD-PEI1.8-triMan | 1.2 ± 0.2 | 6.0 ± 0.2 |
| 3a | PEI10-triMan | 1.1 ± 0.2 | 5.5 ± 0.7 |
| 3b | HPCD-PEI10-triMan | 0.9 ± 0.2 | 4.4 ± 0.3 |
| Ligand | −lg Kd (MF–Ligand) | NCD or Npolymer | EE, % | LC, % |
|---|---|---|---|---|
| 1 | 4.0 ± 0.2 | 1–CD | 9 ± 1 | 20 ± 3 |
| 2a | 3.3 ± 0.3 | (4 ± 1)–polymer | 24 ± 3 | 11 ± 2 |
| 3a | 3.8 ± 0.4 | (17 ± 2)–polymer | 84 ± 6 | 15 ± 3 |
| MF Proton Number (Assignment) | 1 H-Chemical Shifts, ppm | ||
|---|---|---|---|
| MF Free (Figure 6a) | MF + PEI1.8-triMan (Figure 6b) | MF + HPCD-PEI1.8-triMan (Figure 6c) | |
| 48 (aromatic) | 8.56 | 8.38 | 8.51 |
| 49 (aromatic) | 6.89 and 6.85 | 7.25 and 7.22 | 7.30 and 7.27 |
| 38 (cyclopropane) | 3.34 | 3.31 | 3.30 |
| 34, 33 (pyrrolidine) | 4.08 and 3.76 | 3.9 and 3.73 | 3.99 and 3.75 (overlapped) |
| 35, 32 (pyrrolidine) | 4.00 and 3.70 | 3.65 (overlapped) and 3.53 | 3.88 and 3.51 |
| 31 (pyrrolidine–piperidine) | 3.89 | 3.81 | 3.71 |
| 50, 51, 52 (–OCH3) | 3.50 | 3.39 (overlapped) | 3.45 |
| 46, 47 (piperidine) | 3.03 | 2.99 | 3.01 |
| 30 (pyrrolidine–piperidine) | 2.75 | 2.74 | 2.74 and 2.63 |
| 36, 37 (piperidine) | 1.84–1.87 | 1.80 and 1.75 | 1.81 |
| 39, 40 (piperidine) | 1.75–1.80 | NI * | NI |
| 43, 45 (cyclopropane) | 0.99–1.05 | 0.90 | 0.78 |
| 42, 44 (cyclopropane) | 0.88 and 1.21 | 1.07 | 1.02–1.04 |
| Time | PEI10-triMan 0.5 mg/mL + MF 47 μM | PEI10-triMan 0.5 mg/mL + MF 47 μM + EG 6 mM | |||||||
|---|---|---|---|---|---|---|---|---|---|
| C in Solution | C Adsorbed on the Cell Wall Surface | C Absorbed Inside the Cell | C in Solution | C Adsorbed on the Cell Wall Surface | C Absorbed Inside the Cell | ||||
| MF, μM | MF, μM | EG, mM | MF, μM | EG, mM | MF, μM | EG, mM | |||
| 0 min | 47 | 0 | 0 | 47 | 6 | 0 | 0 | 0 | 0 |
| 15 min | 29 ± 3 | 15 ± 3 | 2.8 ± 0.3 | 15 ± 2 | 0.20 ± 0.05 | 27 ± 3 | 5.8 ± 0.3 | 4.4 ± 0.2 | 0.030 ± 0.005 |
| 45 min | 15 ± 2 | 30 ± 4 | 1.6 ± 0.2 | 10 ± 1 | 0.10 ± 0.02 | 34 ± 4 | 5.9 ± 0.3 | 3.3 ± 0.2 | 0.029 ± 0.006 |
| 2 h | 10 ± 2 | 35 ± 4 | 1.2 ± 0.2 | 12 ± 1 | 0.10 ± 0.02 | 32 ± 4 | 5.9 ± 0.1 | 3.1 ± 0.2 | 0.026 ± 0.004 |
| 14 h | 12 ± 2 | 33 ± 4 | 1.7 ± 0.3 | 6 ± 1 | 0.010 ± 0.005 | 40 ± 5 | 6.0 ± 0.1 | 0.5 ± 0.1 | 0.0010 ± 0.0005 |
Publisher’s Note: MDPI stays neutral with regard to jurisdictional claims in published maps and institutional affiliations. |
© 2022 by the authors. Licensee MDPI, Basel, Switzerland. This article is an open access article distributed under the terms and conditions of the Creative Commons Attribution (CC BY) license (https://creativecommons.org/licenses/by/4.0/).
Share and Cite
Zlotnikov, I.D.; Ezhov, A.A.; Petrov, R.A.; Vigovskiy, M.A.; Grigorieva, O.A.; Belogurova, N.G.; Kudryashova, E.V. Mannosylated Polymeric Ligands for Targeted Delivery of Antibacterials and Their Adjuvants to Macrophages for the Enhancement of the Drug Efficiency. Pharmaceuticals 2022, 15, 1172. https://0-doi-org.brum.beds.ac.uk/10.3390/ph15101172
Zlotnikov ID, Ezhov AA, Petrov RA, Vigovskiy MA, Grigorieva OA, Belogurova NG, Kudryashova EV. Mannosylated Polymeric Ligands for Targeted Delivery of Antibacterials and Their Adjuvants to Macrophages for the Enhancement of the Drug Efficiency. Pharmaceuticals. 2022; 15(10):1172. https://0-doi-org.brum.beds.ac.uk/10.3390/ph15101172
Chicago/Turabian StyleZlotnikov, Igor D., Alexander A. Ezhov, Rostislav A. Petrov, Maksim A. Vigovskiy, Olga A. Grigorieva, Natalya G. Belogurova, and Elena V. Kudryashova. 2022. "Mannosylated Polymeric Ligands for Targeted Delivery of Antibacterials and Their Adjuvants to Macrophages for the Enhancement of the Drug Efficiency" Pharmaceuticals 15, no. 10: 1172. https://0-doi-org.brum.beds.ac.uk/10.3390/ph15101172