
Analytical Performance Evaluation of New DESI Enhancements for Targeted Drug Quantification in Tissue Sections

 , , ,
, , , 
 and
and 
Abstract
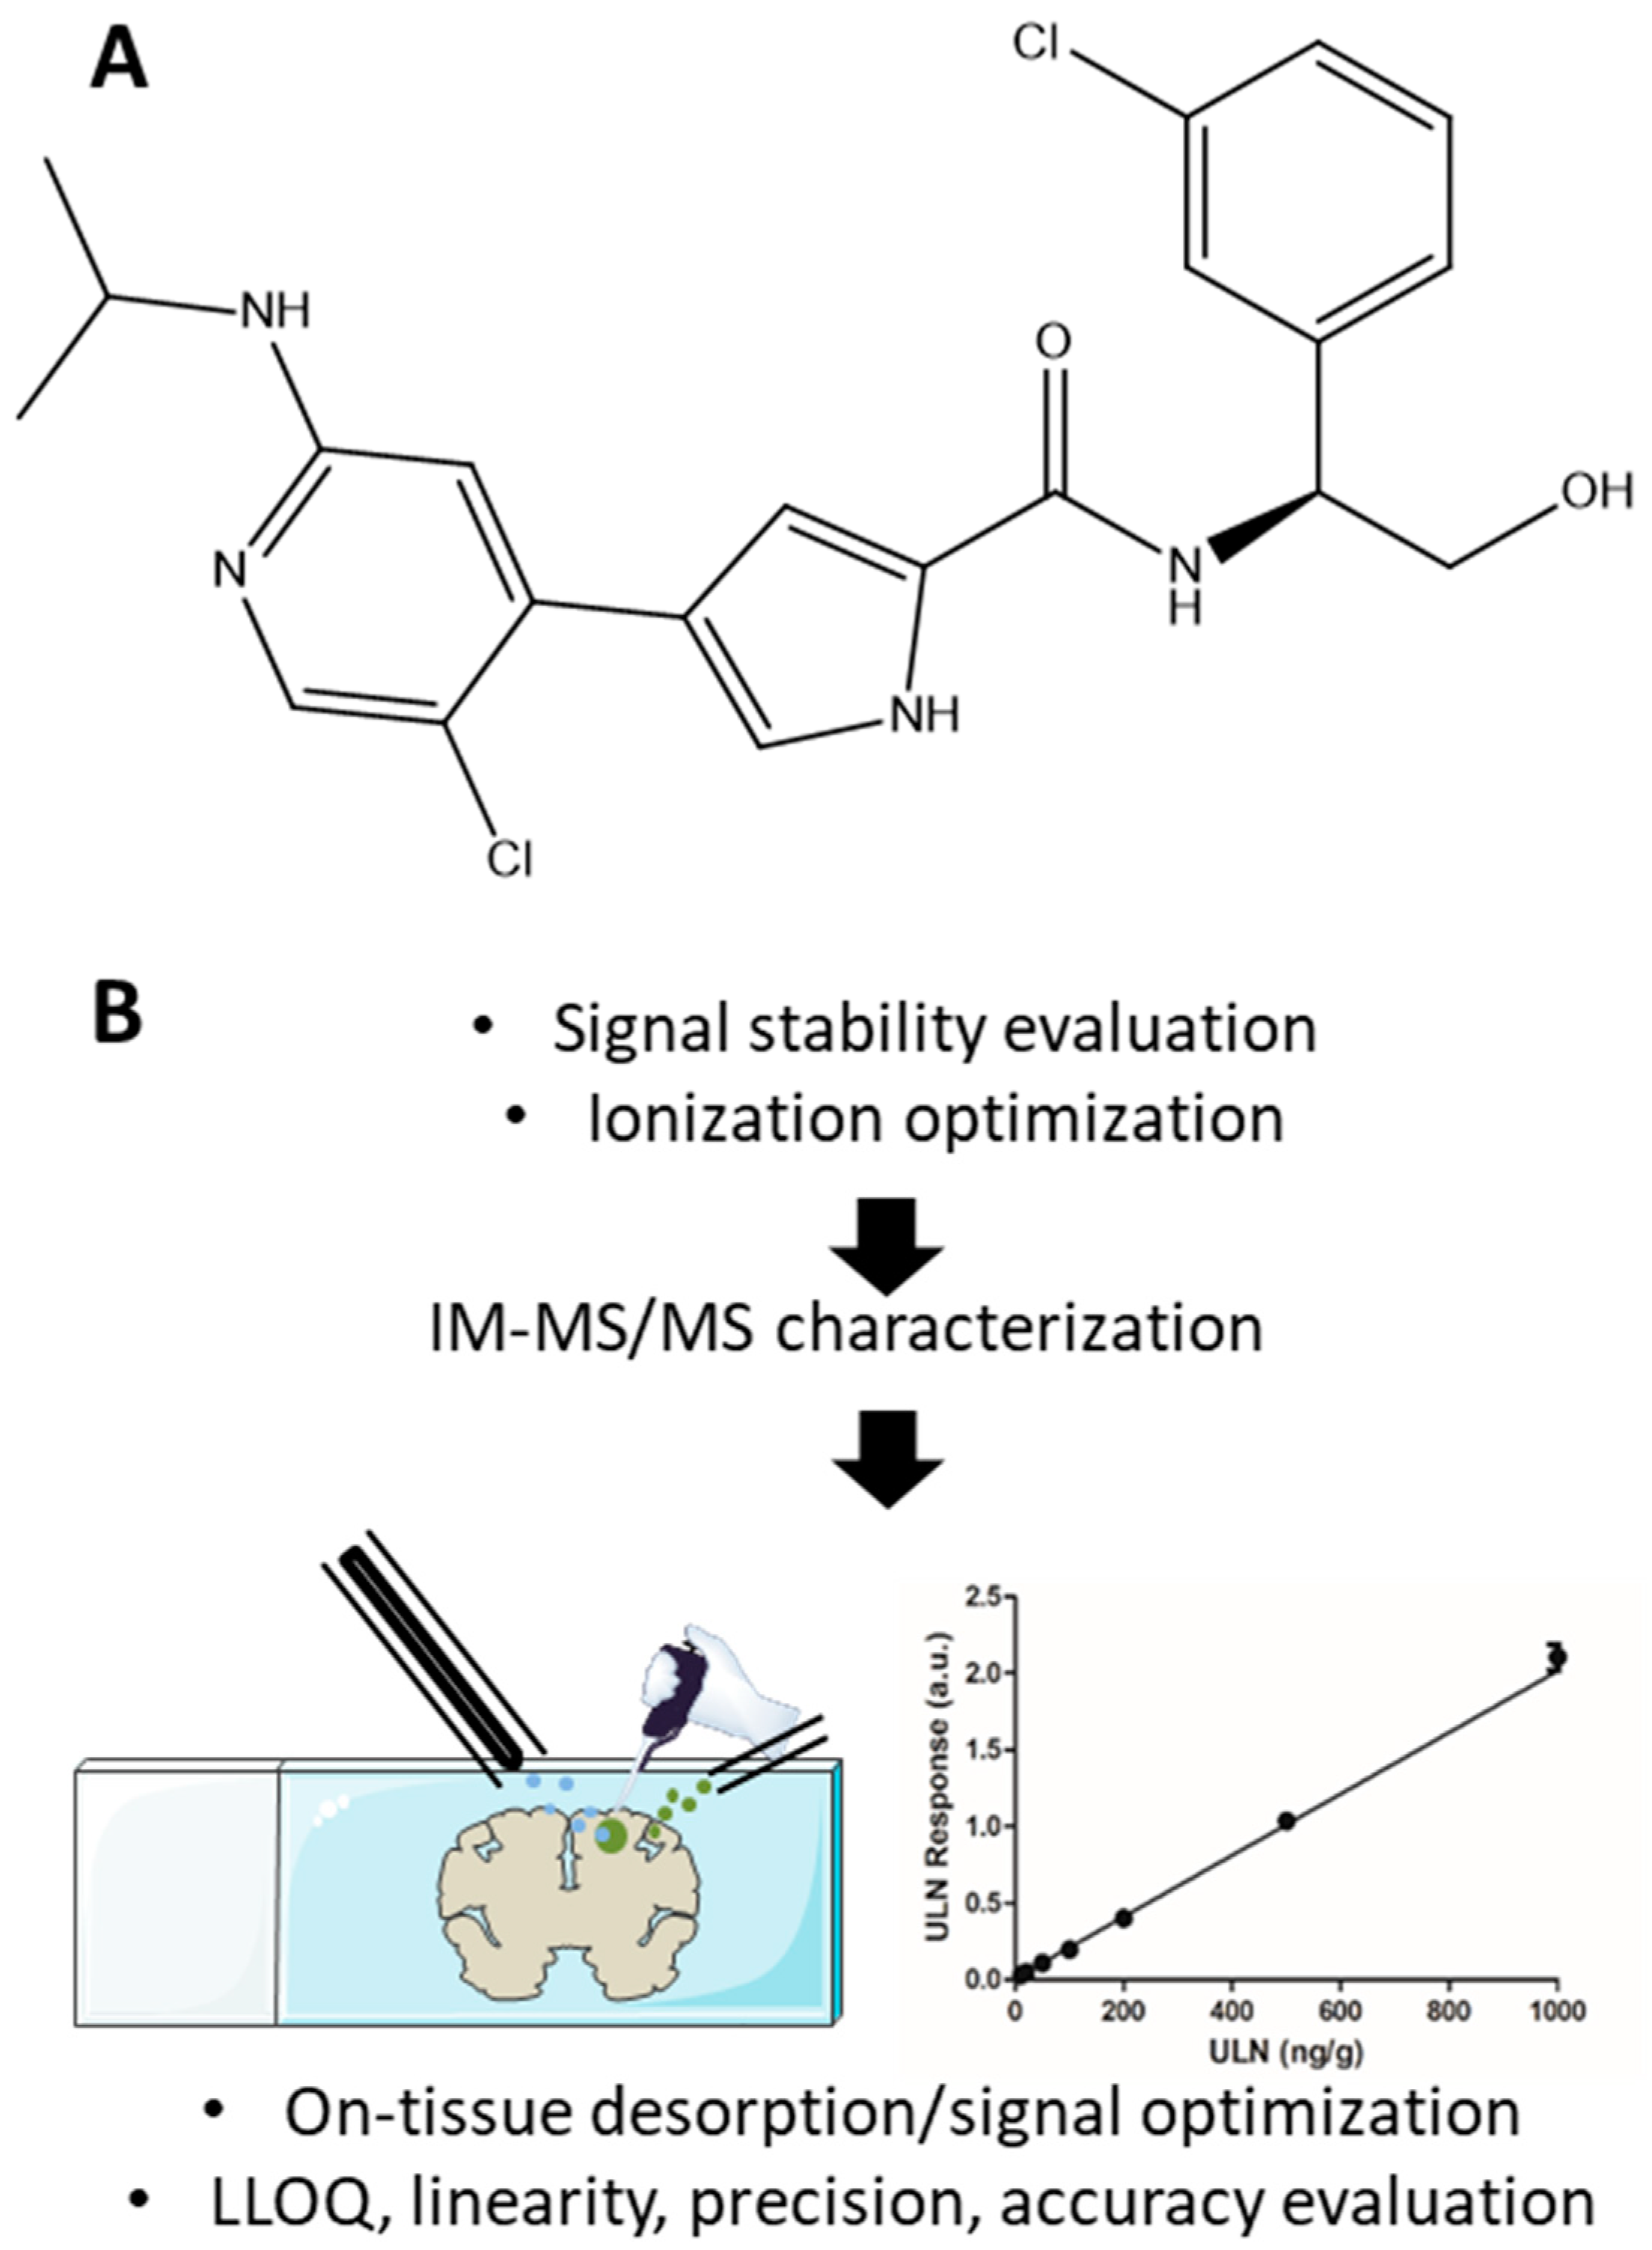
:1. Introduction
2. Results
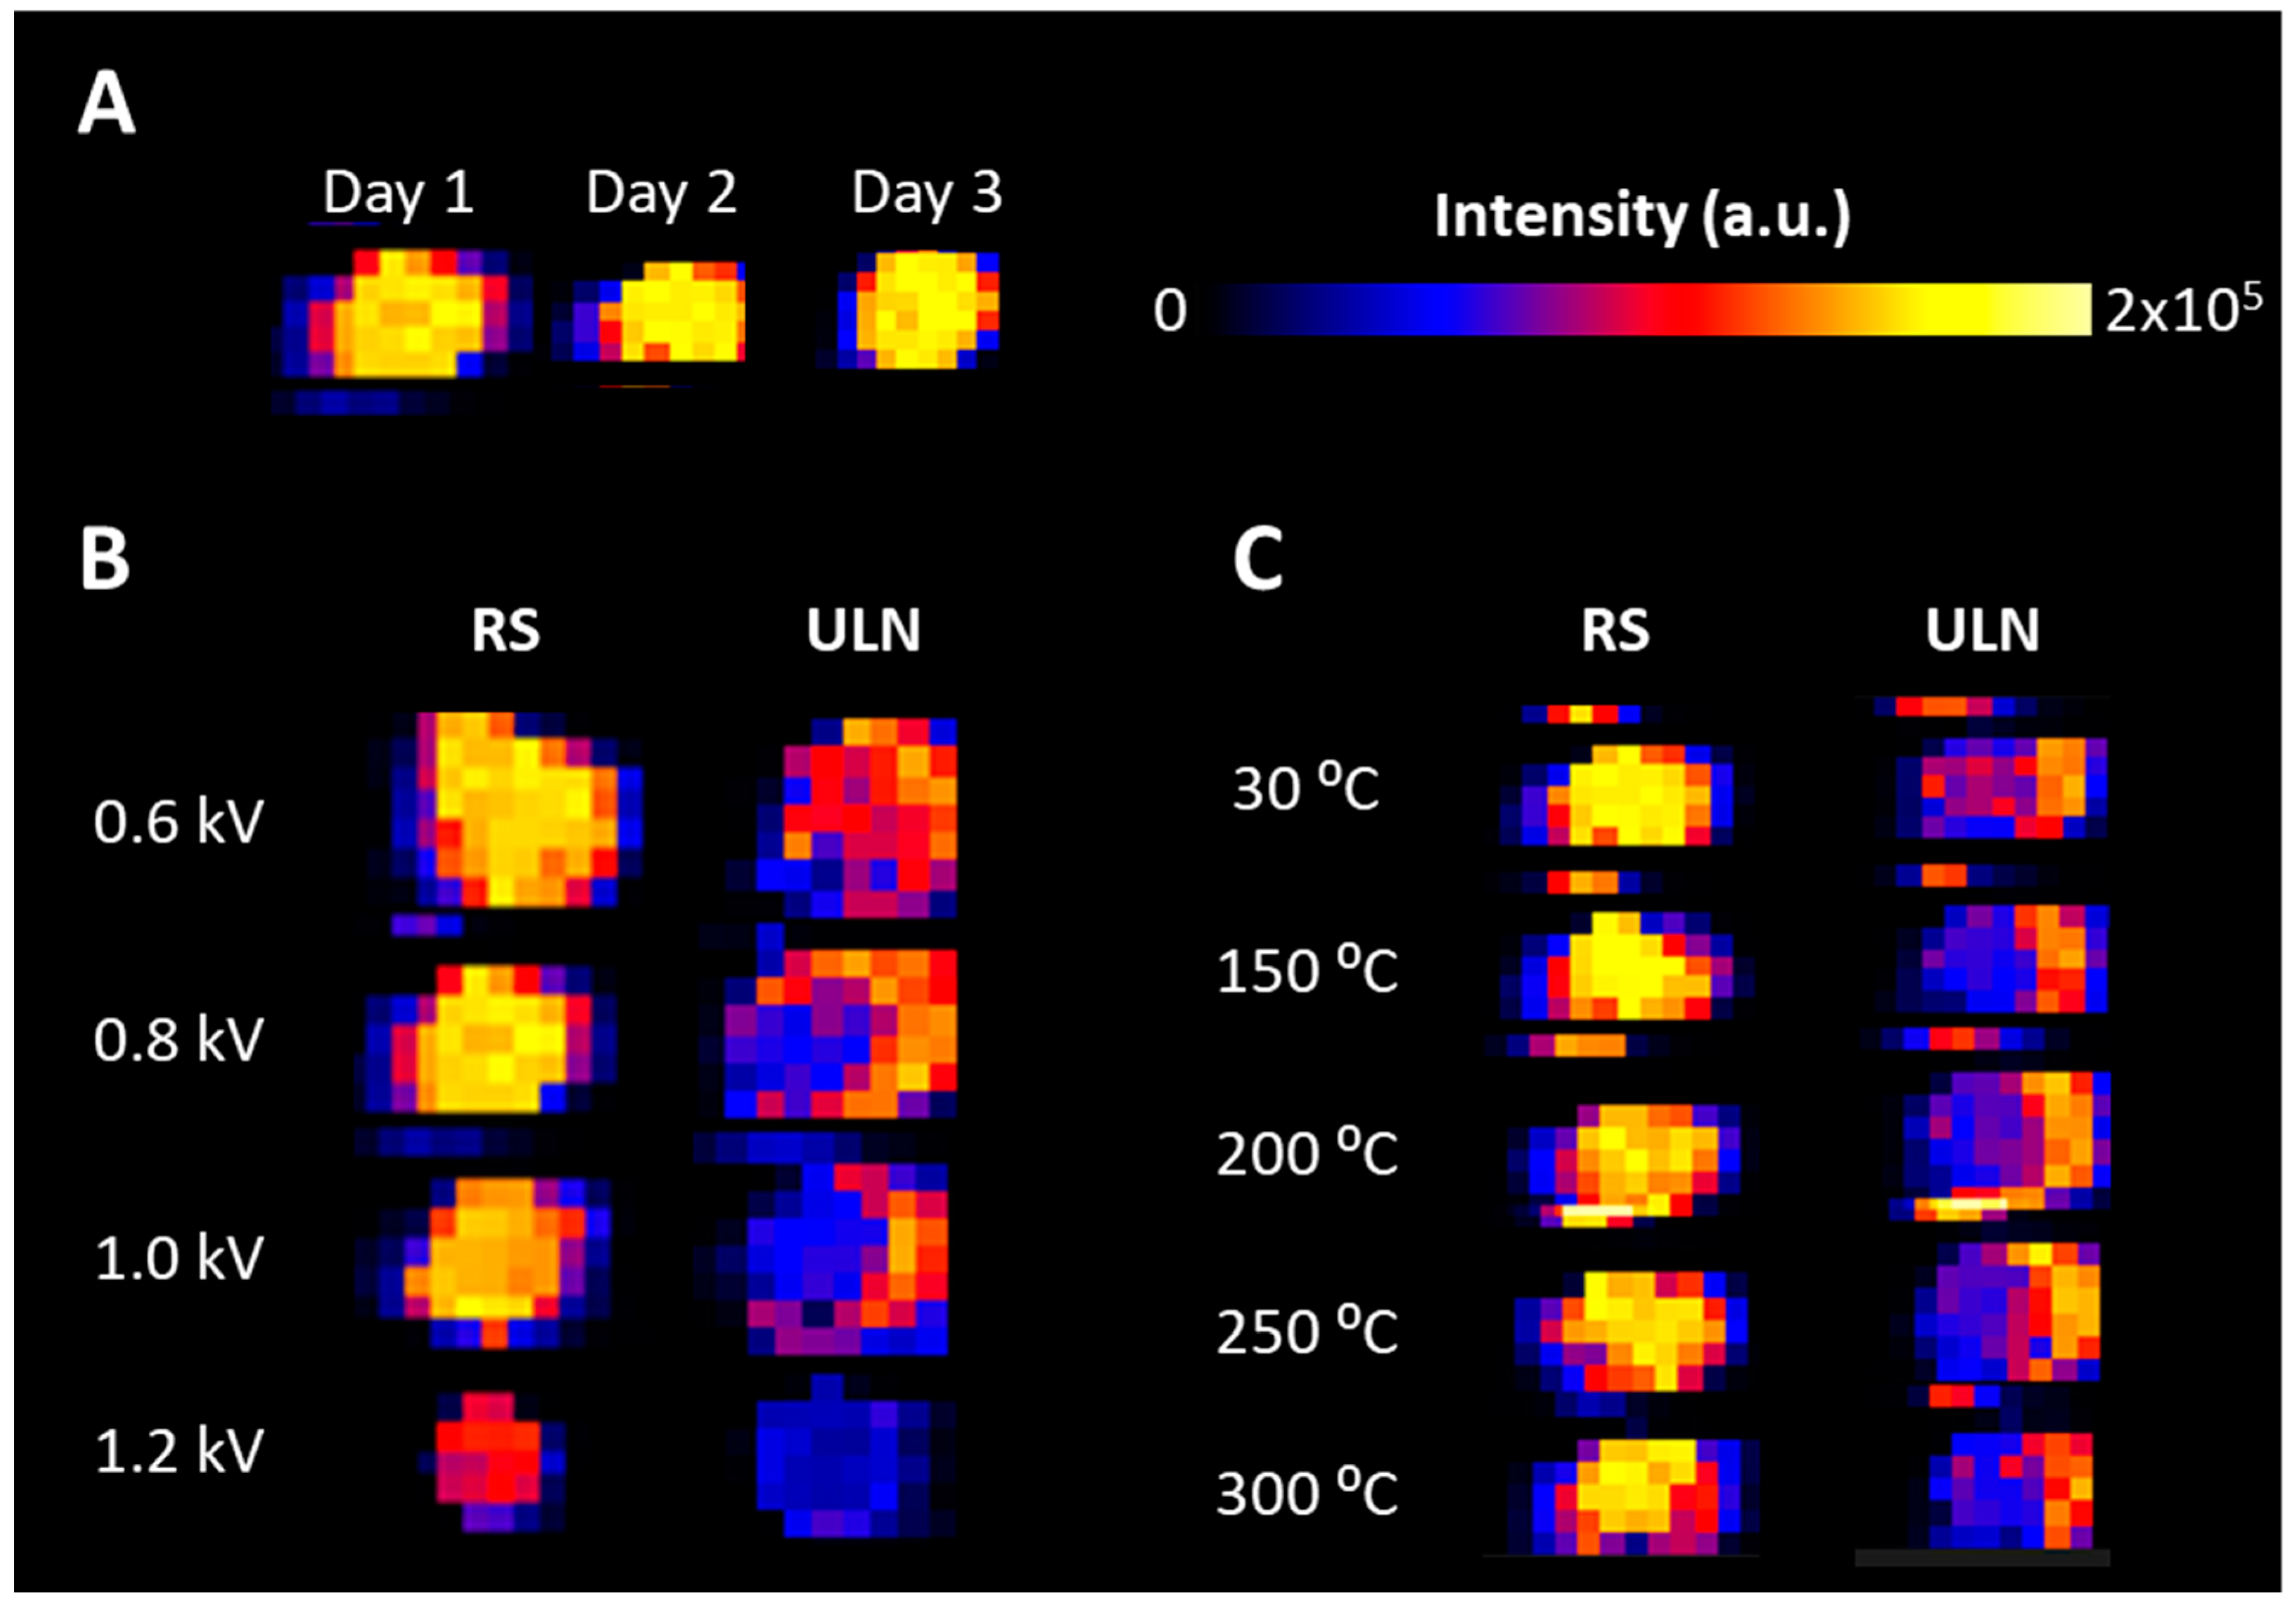
2.1. Cone Voltage and Ion Transfer Tube Temperature Optimization
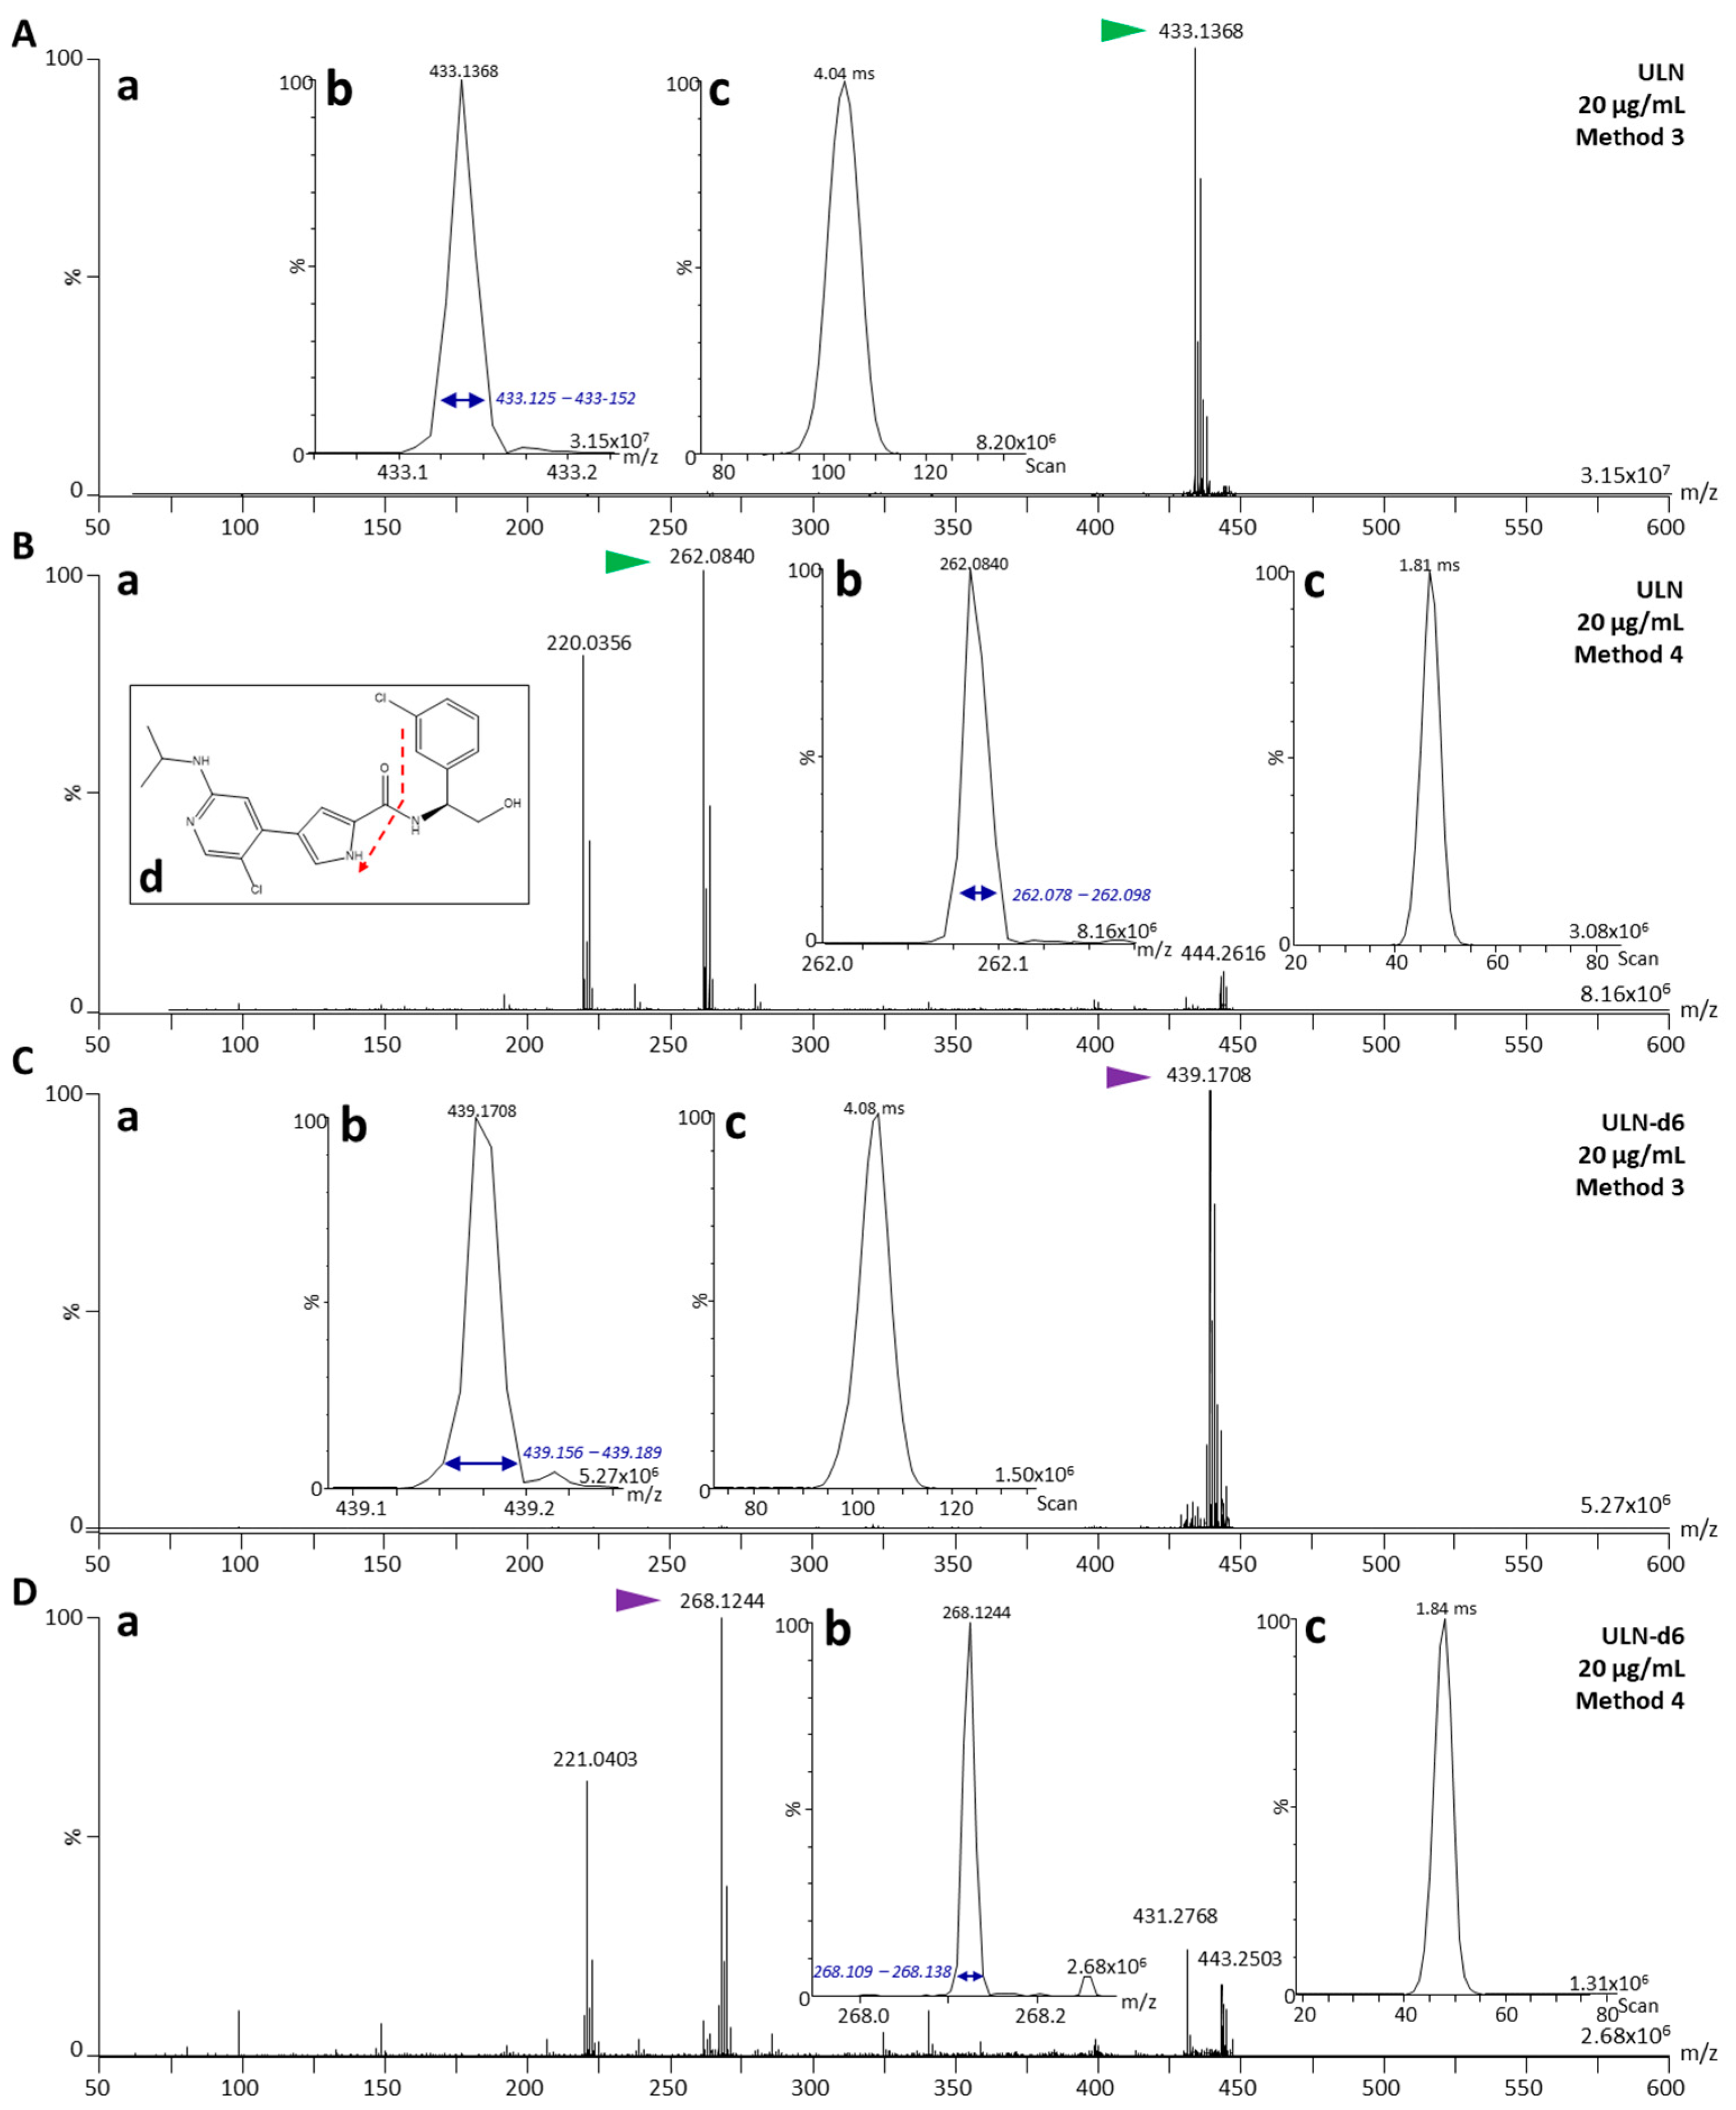
2.2. Fragmentation Characterization of ULN and ULN-d6
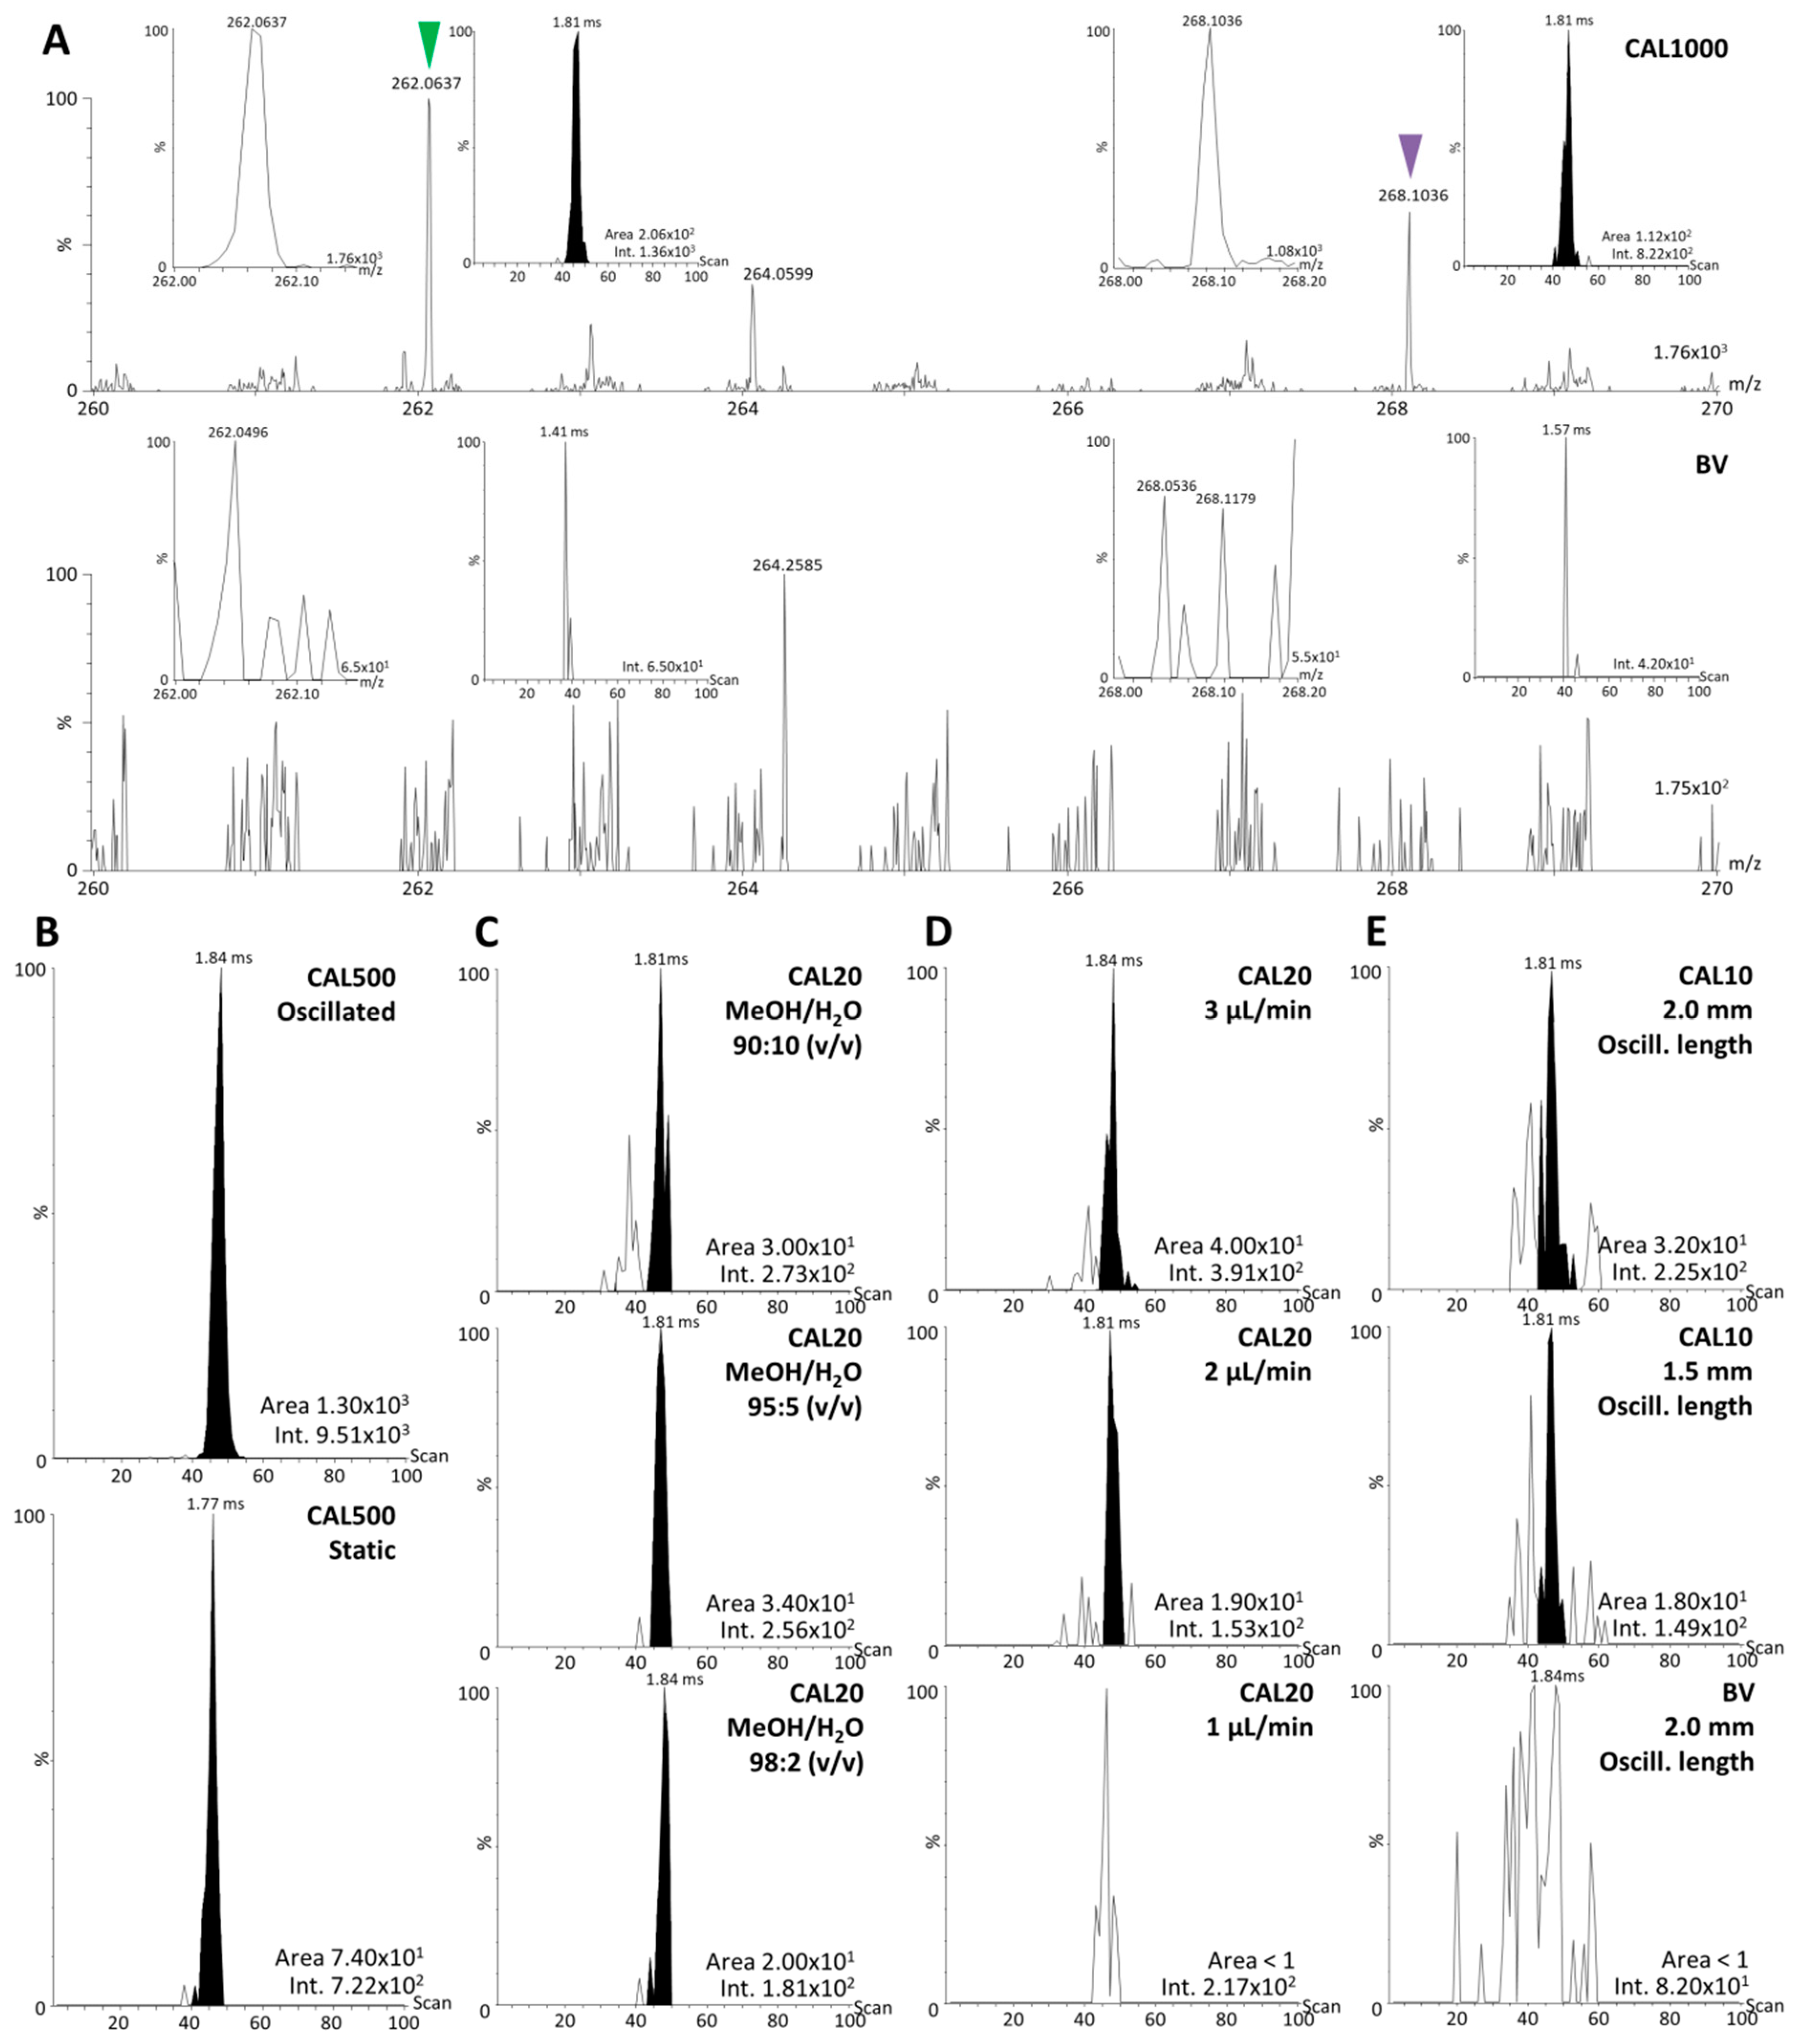
2.3. Signal Determination and Optimization on Tissue Sections
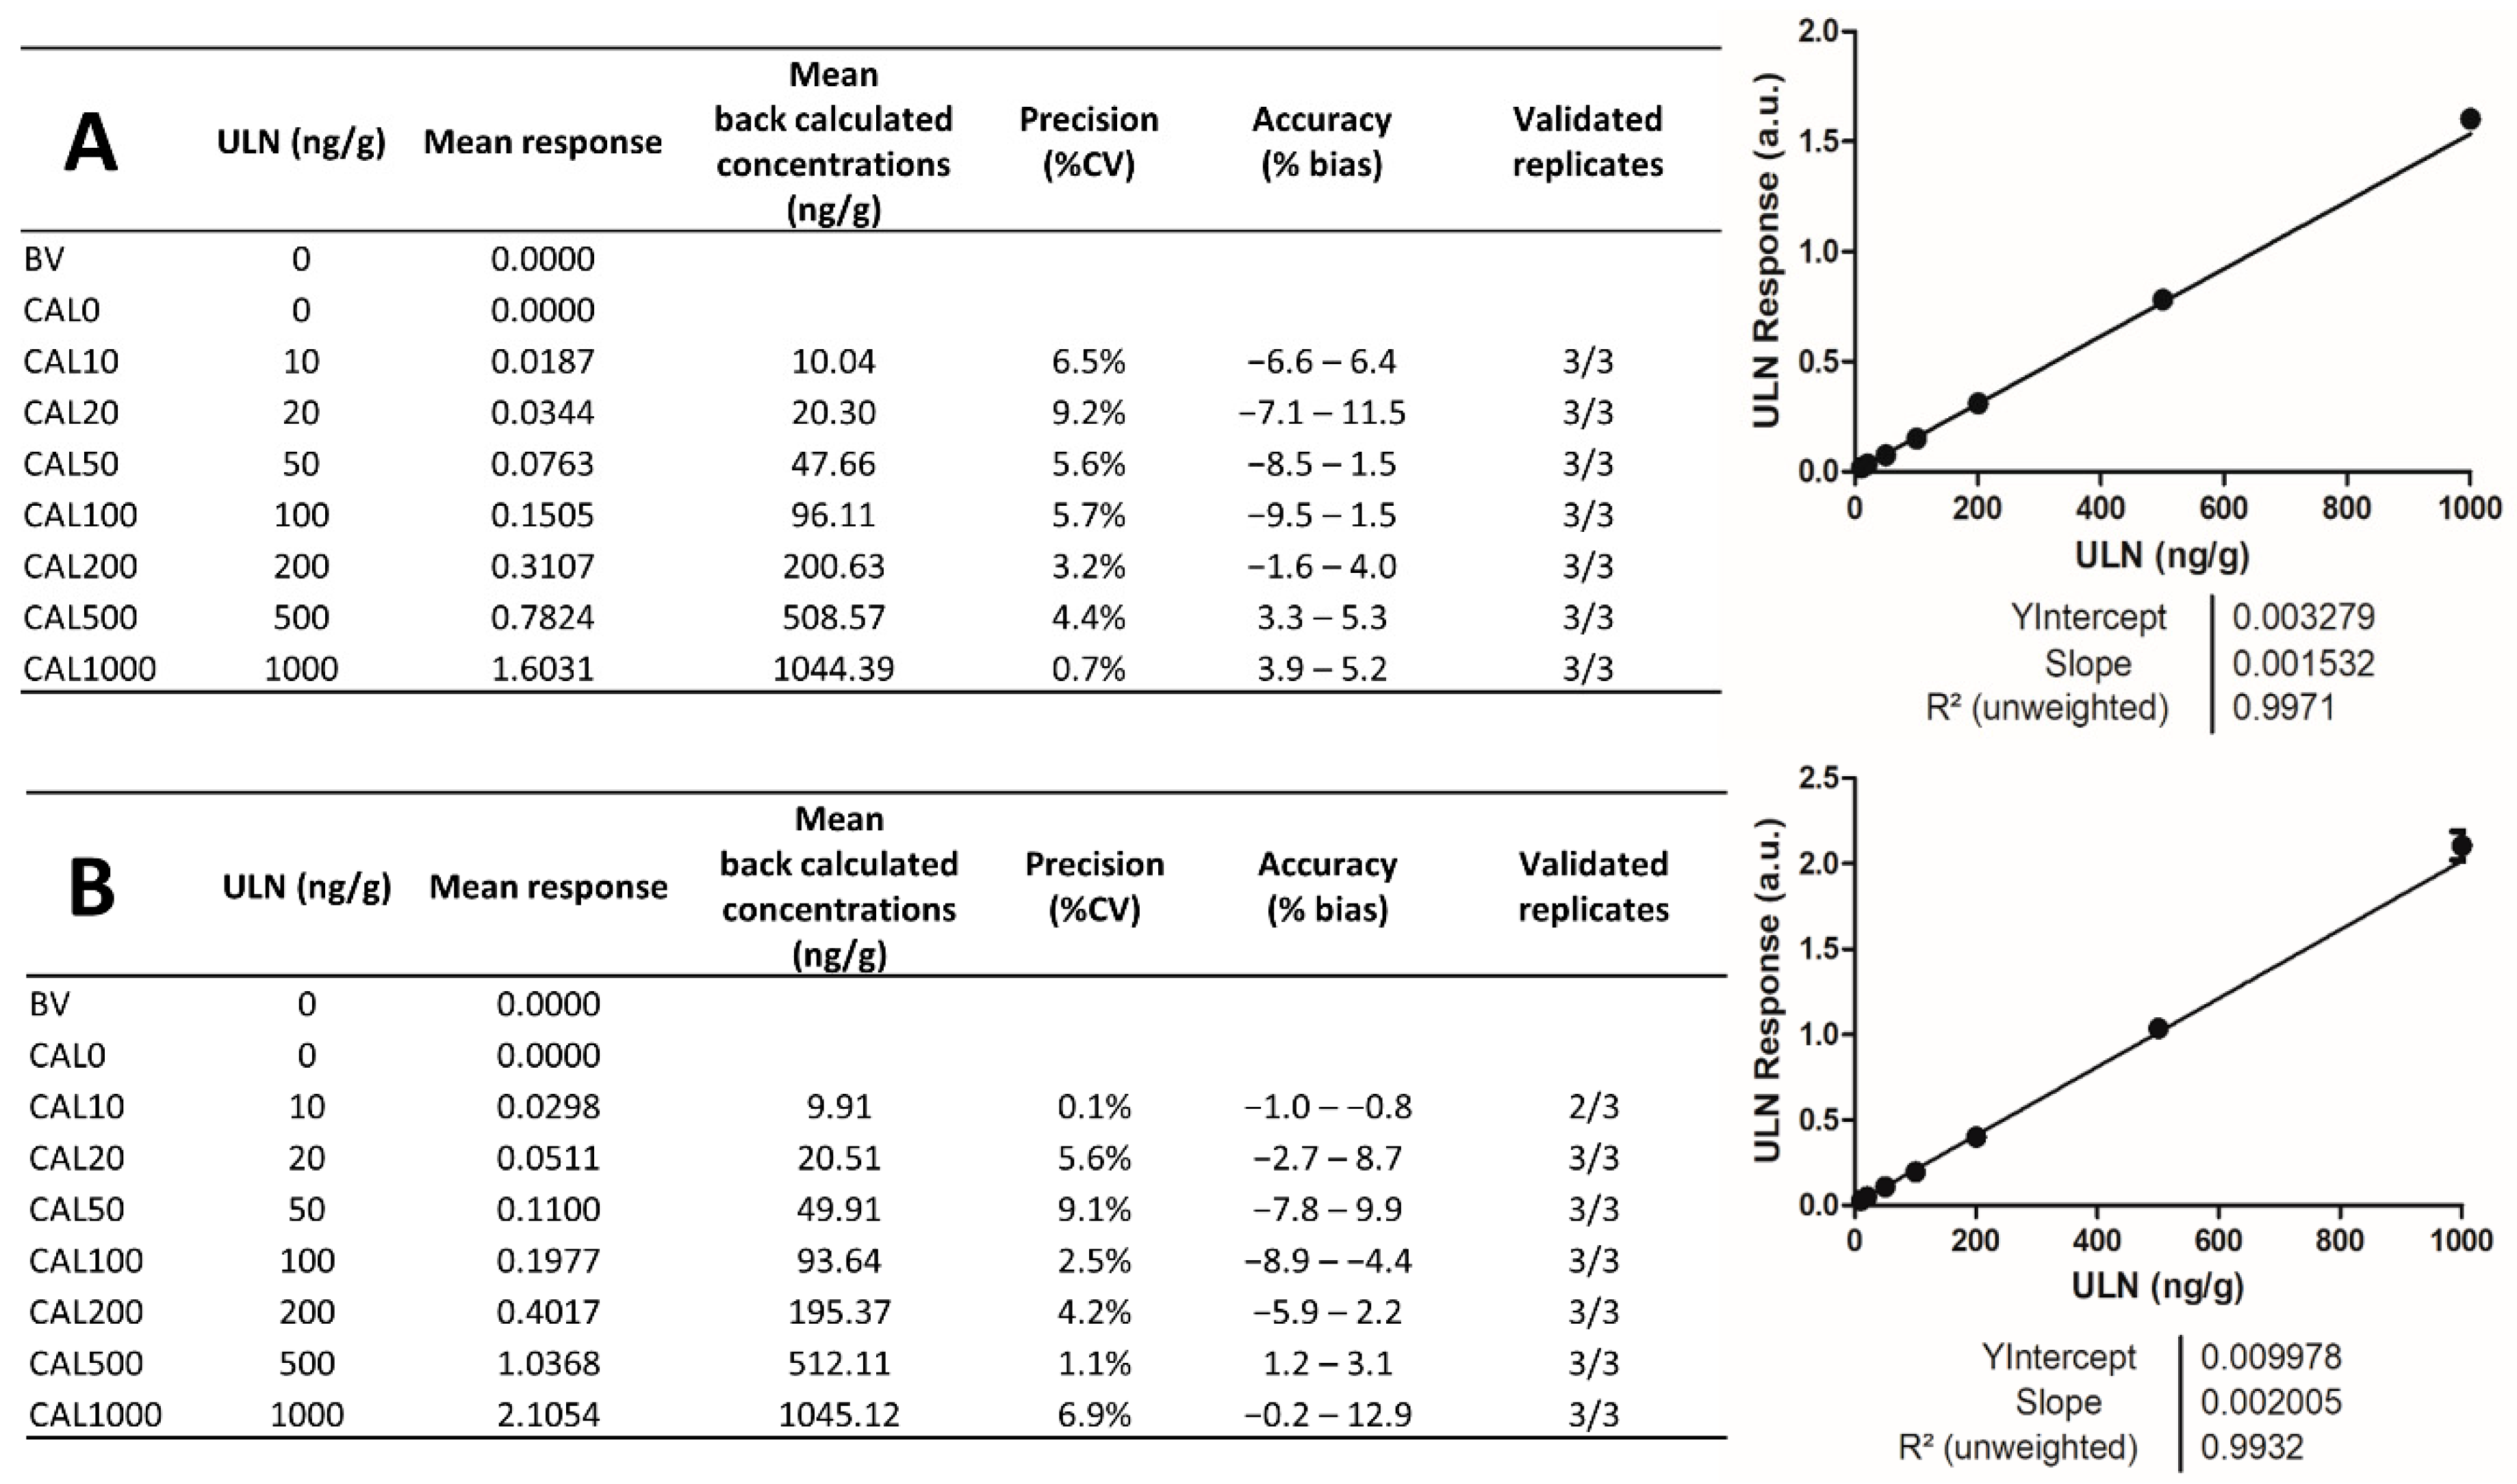
2.4. Analytical Batches for Calibration
3. Discussion
4. Material and Methods
4.1. Chemicals
4.2. Standard and Internal Standard Solution Preparation
4.3. Deposition of Rhodamine C, Leucine Enkephaline, and Stock Solutions of Ulixertinib on Aquarray Superhydrophilic Glass Slides and Array Design
4.4. Tissue Sectioning
4.5. Standard Deposition on Tissue Sections
4.6. Mass Spectrometric Analyses
4.7. Desorption Pattern and Mass Spectrometric Signal Evaluation
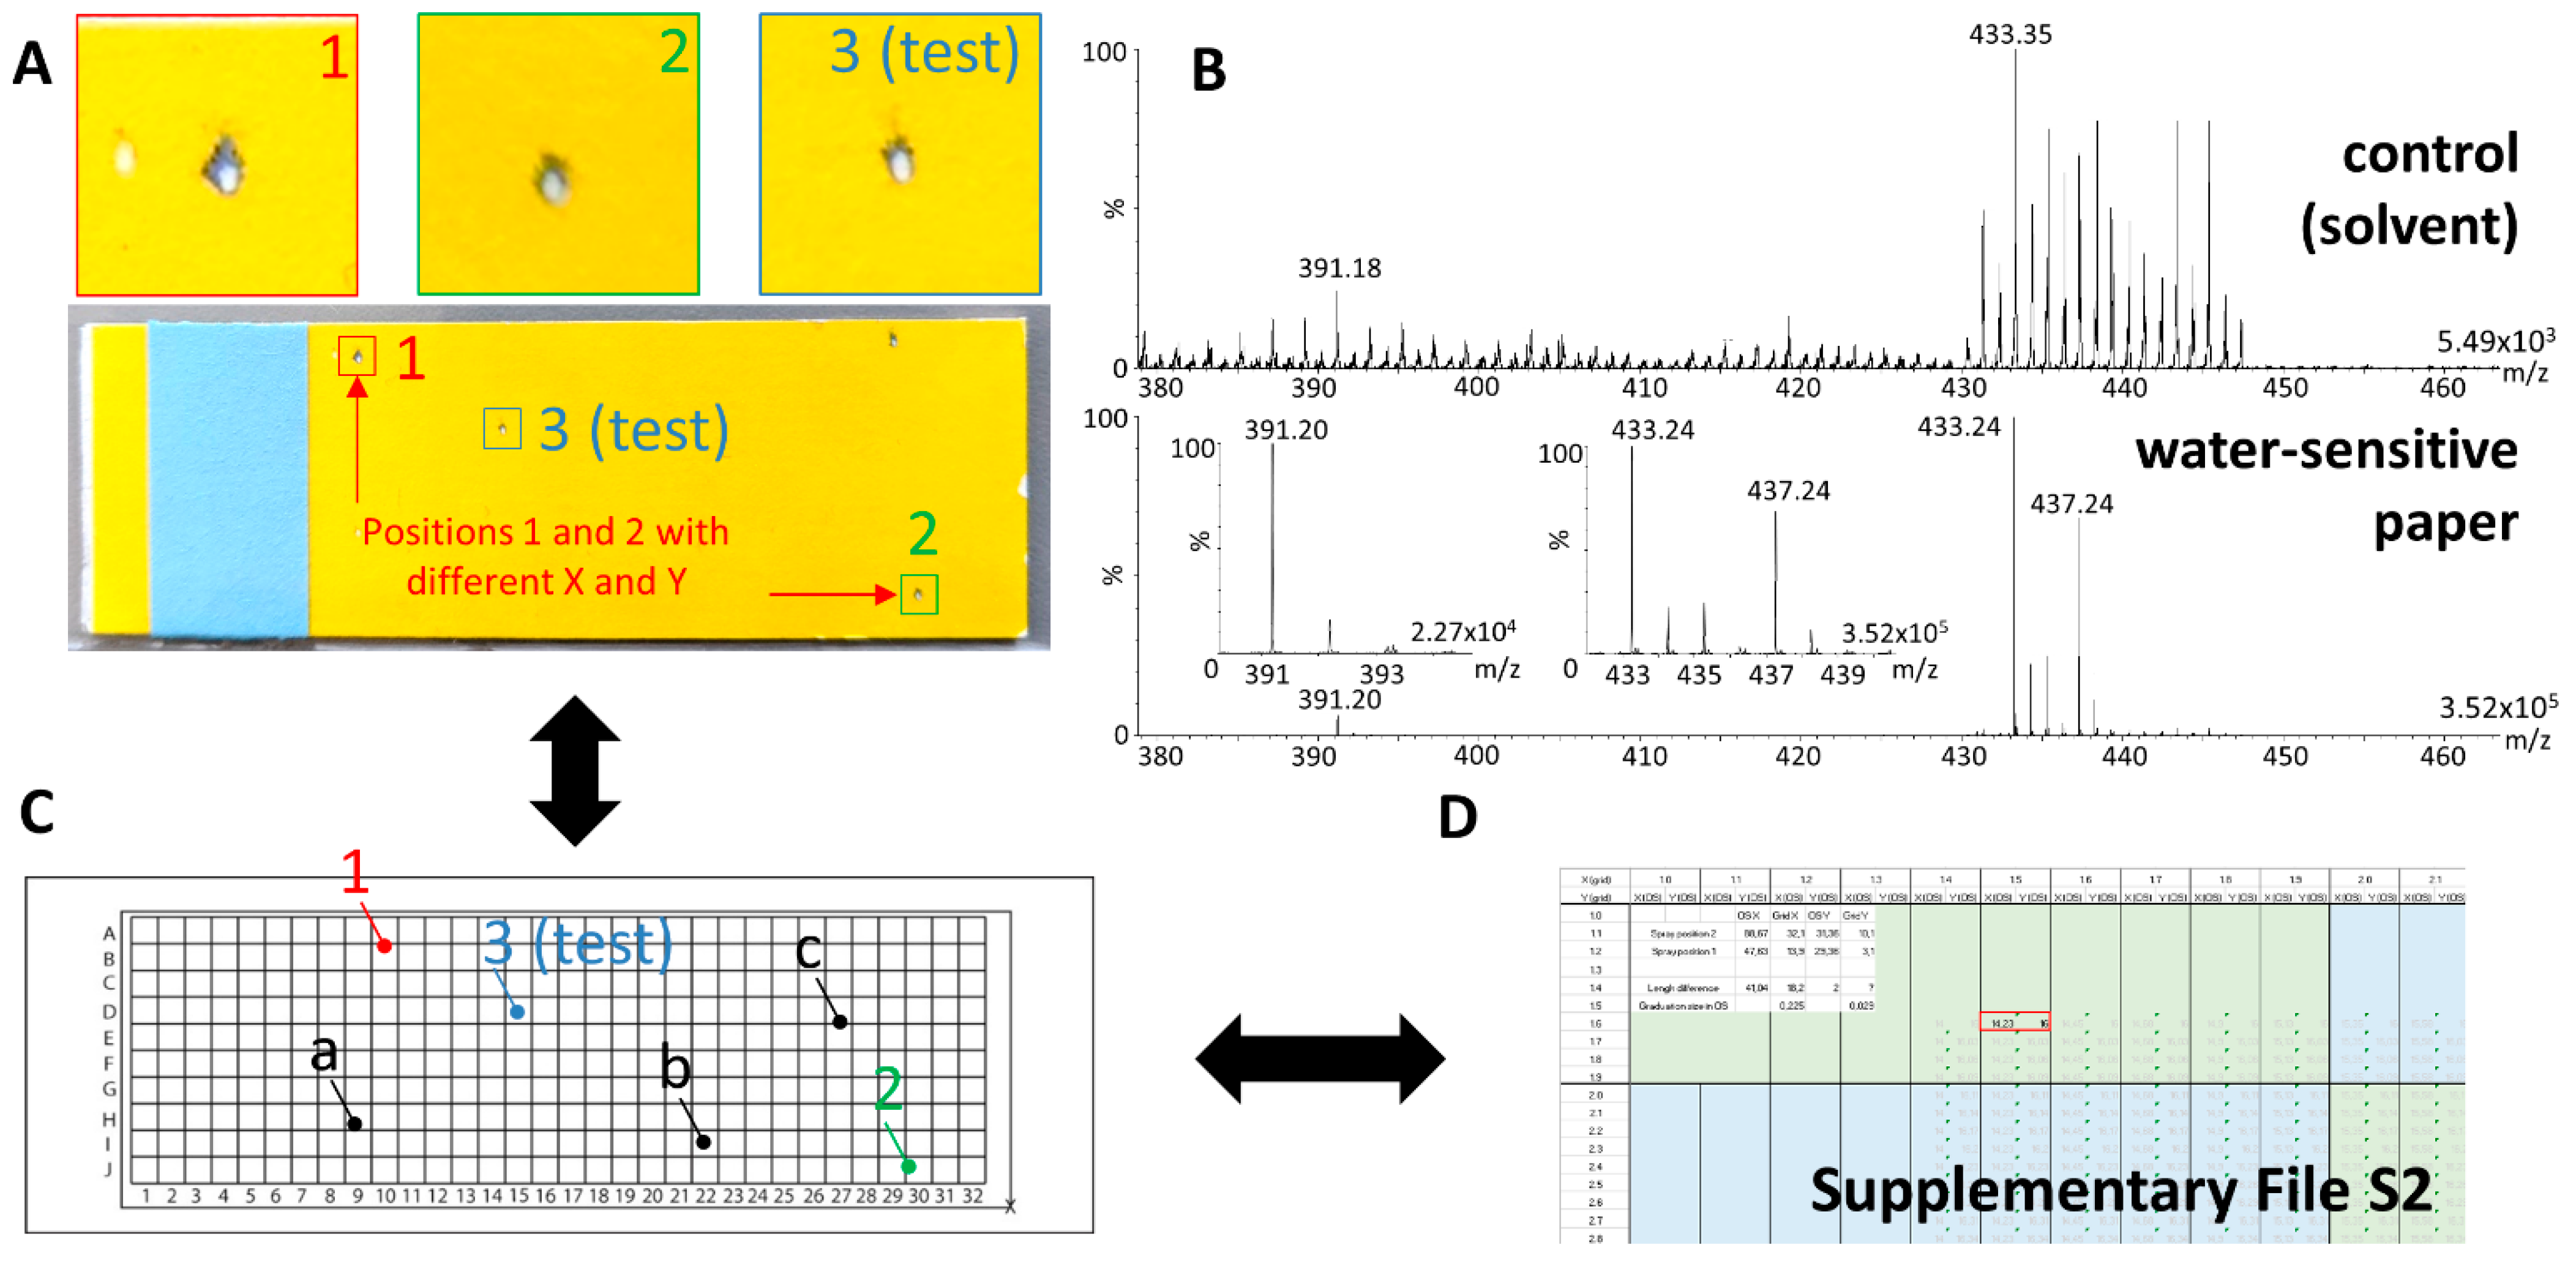
4.8. Localization of x-y Positions in Omnispray
4.9. Data Processing
5. Conclusions
Supplementary Materials
Author Contributions
Funding
Institutional Review Board Statement
Informed Consent Statement
Data Availability Statement
Acknowledgments
Conflicts of Interest
References
- Fresnais, M.; Burhenne, J.; Haefeli, W.E.; Longuespee, R. Desorption/Ionization-MS Methods for Drug Quantification in Biological Matrices and Their Validation Following Regulatory Guidance. Anal. Chem. 2021, 93, 7152–7163. [Google Scholar] [CrossRef]
- Fresnais, M.; Muck, A.; Majewsky, M.; Statz, B.; Krausert, S.; Benzel, J.; Castel, D.; Le Dret, L.; Pfister, S.; Haefeli, W.E.; et al. Rapid and Sensitive Drug Quantification in Tissue Sections Using Matrix Assisted Laser Desorption Ionization-Ion Mobility-Mass Spectrometry Profiling. J. Am. Soc. Mass Spectrom. 2020, 31, 742–751. [Google Scholar] [CrossRef] [PubMed]
- Trim, P.J.; Henson, C.M.; Avery, J.L.; McEwen, A.; Snel, M.F.; Claude, E.; Marshall, P.S.; West, A.; Princivalle, A.P.; Clench, M.R. Matrix-assisted laser desorption/ionization-ion mobility separation-mass spectrometry imaging of vinblastine in whole body tissue sections. Anal. Chem. 2008, 80, 8628–8634. [Google Scholar] [CrossRef] [PubMed]
- Spraggins, J.M.; Djambazova, K.V.; Rivera, E.S.; Migas, L.G.; Neumann, E.K.; Fuetterer, A.; Suetering, J.; Goedecke, N.; Ly, A.; Van de Plas, R.; et al. High-Performance Molecular Imaging with MALDI Trapped Ion-Mobility Time-of-Flight (timsTOF) Mass Spectrometry. Anal. Chem. 2019, 91, 14552–14560. [Google Scholar] [CrossRef] [PubMed]
- Mims, D.; Hercules, D. Quantification of bile acids directly from plasma by MALDI-TOF-MS. Anal. Bioanal. Chem. 2004, 378, 1322–1326. [Google Scholar] [CrossRef]
- Qi, Y.; Muller, M.; Stokes, C.S.; Volmer, D.A. Rapid Quantification of 25-Hydroxyvitamin D3 in Human Serum by Matrix-Assisted Laser Desorption/Ionization Mass Spectrometry. J. Am. Soc. Mass Spectrom. 2018, 29, 1456–1462. [Google Scholar] [CrossRef]
- van Kampen, J.J.; Reedijk, M.L.; Burgers, P.C.; Dekker, L.J.; Hartwig, N.G.; van der Ende, I.E.; de Groot, R.; Osterhaus, A.D.; Burger, D.M.; Luider, T.M.; et al. Ultra-fast analysis of plasma and intracellular levels of HIV protease inhibitors in children: A clinical application of MALDI mass spectrometry. PLoS ONE 2010, 5, e11409. [Google Scholar] [CrossRef]
- Cabrales-Rico, A.; de la Torre, B.G.; Garay, H.E.; Machado, Y.J.; Gomez, J.A.; Audain, E.; Morales, O.; Besada, V.; Marcelo, J.L.; Reyes, V.; et al. Bio-analytical method based on MALDI-MS analysis for the quantification of CIGB-300 anti-tumor peptide in human plasma. J. Pharm. Biomed. Anal. 2015, 105, 107–114. [Google Scholar] [CrossRef]
- Meesters, R.J.; den Boer, E.; Mathot, R.A.; de Jonge, R.; van Klaveren, R.J.; Lindemans, J.; Luider, T.M. Ultrafast selective quantification of methotrexate in human plasma by high-throughput MALDI-isotope dilution mass spectrometry. Bioanalysis 2011, 3, 1369–1378. [Google Scholar] [CrossRef]
- Rossi, A.; Castrati, L.; Colombo, P.; Flammini, L.; Barocelli, E.; Bettini, R.; Elviri, L. Development and validation of a DESI-HRMS/MS method for the fast profiling of esomeprazole and its metabolites in rat plasma: A pharmacokinetic study. Drug Test. Anal. 2016, 8, 208–213. [Google Scholar] [CrossRef]
- Fresnais, M.; Roth, A.; Foerster, K.I.; Jager, D.; Pfister, S.M.; Haefeli, W.E.; Burhenne, J.; Longuespee, R. Rapid and Sensitive Quantification of Osimertinib in Human Plasma Using a Fully Validated MALDI-IM-MS/MS Assay. Cancers 2020, 12, 1897. [Google Scholar] [CrossRef] [PubMed]
- Swales, J.G.; Strittmatter, N.; Tucker, J.W.; Clench, M.R.; Webborn, P.J.H.; Goodwin, R.J.A. Spatial Quantitation of Drugs in tissues using Liquid Extraction Surface Analysis Mass Spectrometry Imaging. Sci. Rep. 2016, 6, 37648. [Google Scholar] [CrossRef] [PubMed]
- Schulz, S.; Becker, M.; Groseclose, M.R.; Schadt, S.; Hopf, C. Advanced MALDI mass spectrometry imaging in pharmaceutical research and drug development. Curr. Opin. Biotechnol. 2019, 55, 51–59. [Google Scholar] [CrossRef]
- Karlsson, O.; Hanrieder, J. Imaging mass spectrometry in drug development and toxicology. Arch. Toxicol. 2017, 91, 2283–2294. [Google Scholar] [CrossRef] [PubMed] [Green Version]
- Rao, T.; Shao, Y.; Hamada, N.; Li, Y.; Ye, H.; Kang, D.; Shen, B.; Li, X.; Yin, X.; Zhu, Z.; et al. Pharmacokinetic study based on a matrix-assisted laser desorption/ionization quadrupole ion trap time-of-flight imaging mass microscope combined with a novel relative exposure approach: A case of octreotide in mouse target tissues. Anal. Chim. Acta 2017, 952, 71–80. [Google Scholar] [CrossRef] [PubMed]
- Sun, N.; Fernandez, I.E.; Wei, M.; Wu, Y.; Aichler, M.; Eickelberg, O.; Walch, A. Pharmacokinetic and pharmacometabolomic study of pirfenidone in normal mouse tissues using high mass resolution MALDI-FTICR-mass spectrometry imaging. Histochem. Cell Biol. 2016, 145, 201–211. [Google Scholar] [CrossRef]
- Bonnel, D.; Legouffe, R.; Eriksson, A.H.; Mortensen, R.W.; Pamelard, F.; Stauber, J.; Nielsen, K.T. MALDI imaging facilitates new topical drug development process by determining quantitative skin distribution profiles. Anal. Bioanal. Chem. 2018, 410, 2815–2828. [Google Scholar] [CrossRef]
- Zecchi, R.; Trevisani, M.; Pittelli, M.; Pedretti, P.; Manni, M.E.; Pieraccini, G.; Pioselli, B.; Amadei, F.; Moneti, G.; Catinella, S. Impact of drug administration route on drug delivery and distribution into the lung: An imaging mass spectrometry approach. Eur. J. Mass Spectrom. 2013, 19, 475–482. [Google Scholar] [CrossRef]
- Bruinen, A.L.; van Oevelen, C.; Eijkel, G.B.; Van Heerden, M.; Cuyckens, F.; Heeren, R.M. Mass Spectrometry Imaging of Drug Related Crystal-Like Structures in Formalin-Fixed Frozen and Paraffin-Embedded Rabbit Kidney Tissue Sections. J. Am. Soc. Mass Spectrom. 2016, 27, 117–123. [Google Scholar] [CrossRef] [Green Version]
- Lenz, B.; Brink, A.; Siam, M.; De Paepe, A.; Bassett, S.; Eichinger-Chapelon, A.; Maliver, P.; Neff, R.; Niederhauser, U.; Steinhuber, B.; et al. Application of Imaging Techniques to Cases of Drug-Induced Crystal Nephropathy in Preclinical Studies. Toxicol. Sci. 2018, 163, 409–419. [Google Scholar] [CrossRef]
- Munteanu, B.; Meyer, B.; von Reitzenstein, C.; Burgermeister, E.; Bog, S.; Pahl, A.; Ebert, M.P.; Hopf, C. Label-free in situ monitoring of histone deacetylase drug target engagement by matrix-assisted laser desorption ionization-mass spectrometry biotyping and imaging. Anal. Chem. 2014, 86, 4642–4647. [Google Scholar] [CrossRef] [PubMed]
- Sorensen, I.S.; Janfelt, C.; Nielsen, M.M.B.; Mortensen, R.W.; Knudsen, N.O.; Eriksson, A.H.; Pedersen, A.J.; Nielsen, K.T. Combination of MALDI-MSI and cassette dosing for evaluation of drug distribution in human skin explant. Anal. Bioanal. Chem. 2017, 409, 4993–5005. [Google Scholar] [CrossRef] [PubMed]
- Giordano, S.; Morosi, L.; Veglianese, P.; Licandro, S.A.; Frapolli, R.; Zucchetti, M.; Cappelletti, G.; Falciola, L.; Pifferi, V.; Visentin, S.; et al. 3D Mass Spectrometry Imaging Reveals a Very Heterogeneous Drug Distribution in Tumors. Sci. Rep. 2016, 6, 37027. [Google Scholar] [CrossRef] [PubMed]
- Giordano, S.; Zucchetti, M.; Decio, A.; Cesca, M.; Nerini, I.F.; Maiezza, M.; Ferrari, M.; Licandro, S.A.; Frapolli, R.; Giavazzi, R.; et al. Heterogeneity of paclitaxel distribution in different tumor models assessed by MALDI mass spectrometry imaging. Sci. Rep. 2016, 6, 39284. [Google Scholar] [CrossRef] [PubMed] [Green Version]
- Tanaka, Y.; Hirata, M.; Shinonome, S.; Torii, M.; Nezasa, K.I.; Tanaka, H. Distribution analysis of epertinib in brain metastasis of HER2-positive breast cancer by imaging mass spectrometry and prospect for antitumor activity. Sci. Rep. 2018, 8, 343. [Google Scholar] [CrossRef] [Green Version]
- Rao, T.; Shen, B.; Zhu, Z.; Shao, Y.; Kang, D.; Li, X.; Yin, X.; Li, H.; Xie, L.; Wang, G.; et al. Optimization and evaluation of MALDI TOF mass spectrometric imaging for quantification of orally dosed octreotide in mouse tissues. Talanta 2017, 165, 128–135. [Google Scholar] [CrossRef]
- Aikawa, H.; Hayashi, M.; Ryu, S.; Yamashita, M.; Ohtsuka, N.; Nishidate, M.; Fujiwara, Y.; Hamada, A. Visualizing spatial distribution of alectinib in murine brain using quantitative mass spectrometry imaging. Sci. Rep. 2016, 6, 23749. [Google Scholar] [CrossRef] [Green Version]
- Chumbley, C.W.; Reyzer, M.L.; Allen, J.L.; Marriner, G.A.; Via, L.E.; Barry, C.E., 3rd; Caprioli, R.M. Absolute Quantitative MALDI Imaging Mass Spectrometry: A Case of Rifampicin in Liver Tissues. Anal. Chem. 2016, 88, 2392–2398. [Google Scholar] [CrossRef] [Green Version]
- Buck, A.; Halbritter, S.; Spath, C.; Feuchtinger, A.; Aichler, M.; Zitzelsberger, H.; Janssen, K.P.; Walch, A. Distribution and quantification of irinotecan and its active metabolite SN-38 in colon cancer murine model systems using MALDI MSI. Anal. Bioanal. Chem. 2015, 407, 2107–2116. [Google Scholar] [CrossRef]
- Takai, N.; Tanaka, Y.; Saji, H. Quantification of small molecule drugs in biological tissue sections by imaging mass spectrometry using surrogate tissue-based calibration standards. Mass Spectrom. 2014, 3, A0025. [Google Scholar] [CrossRef] [Green Version]
- Hamm, G.; Bonnel, D.; Legouffe, R.; Pamelard, F.; Delbos, J.M.; Bouzom, F.; Stauber, J. Quantitative mass spectrometry imaging of propranolol and olanzapine using tissue extinction calculation as normalization factor. J. Proteom. 2012, 75, 4952–4961. [Google Scholar] [CrossRef] [PubMed]
- Lagarrigue, M.; Lavigne, R.; Tabet, E.; Genet, V.; Thome, J.P.; Rondel, K.; Guevel, B.; Multigner, L.; Samson, M.; Pineau, C. Localization and in situ absolute quantification of chlordecone in the mouse liver by MALDI imaging. Anal. Chem. 2014, 86, 5775–5783. [Google Scholar] [CrossRef] [PubMed]
- Boudon, S.M.; Morandi, G.; Prideaux, B.; Staab, D.; Junker, U.; Odermatt, A.; Stoeckli, M.; Bauer, D. Evaluation of sparfloxacin distribution by mass spectrometry imaging in a phototoxicity model. J. Am. Soc. Mass Spectrom. 2014, 25, 1803–1809. [Google Scholar] [CrossRef] [PubMed]
- Prideaux, B.; Dartois, V.; Staab, D.; Weiner, D.M.; Goh, A.; Via, L.E.; Barry, C.E., 3rd; Stoeckli, M. High-sensitivity MALDI-MRM-MS imaging of moxifloxacin distribution in tuberculosis-infected rabbit lungs and granulomatous lesions. Anal. Chem. 2011, 83, 2112–2118. [Google Scholar] [CrossRef] [Green Version]
- Brignole-Baudouin, F.; Desbenoit, N.; Hamm, G.; Liang, H.; Both, J.P.; Brunelle, A.; Fournier, I.; Guerineau, V.; Legouffe, R.; Stauber, J.; et al. A new safety concern for glaucoma treatment demonstrated by mass spectrometry imaging of benzalkonium chloride distribution in the eye, an experimental study in rabbits. PLoS ONE 2012, 7, e50180. [Google Scholar] [CrossRef]
- Lamont, L.; Hadavi, D.; Viehmann, B.; Flinders, B.; Heeren, R.M.A.; Vreeken, R.J.; Siegel, T.P. Quantitative mass spectrometry imaging of drugs and metabolites: A multiplatform comparison. Anal. Bioanal. Chem. 2021, 413, 2779–2791. [Google Scholar] [CrossRef]
- Huizing, L.R.S.; McDuffie, J.; Cuyckens, F.; van Heerden, M.; Koudriakova, T.; Heeren, R.M.A.; Vreeken, R.J. Quantitative Mass Spectrometry Imaging to Study Drug Distribution in the Intestine Following Oral Dosing. Anal. Chem. 2021, 93, 2144–2151. [Google Scholar] [CrossRef]
- Kallback, P.; Vallianatou, T.; Nilsson, A.; Shariatgorji, R.; Schintu, N.; Pereira, M.; Barre, F.; Wadensten, H.; Svenningsson, P.; Andren, P.E. Cross-validated Matrix-Assisted Laser Desorption/Ionization Mass Spectrometry Imaging Quantitation Protocol for a Pharmaceutical Drug and Its Drug-Target Effects in the Brain Using Time-of-Flight and Fourier Transform Ion Cyclotron Resonance Analyzers. Anal. Chem. 2020, 92, 14676–14684. [Google Scholar] [CrossRef]
- Kokesch-Himmelreich, J.; Treu, A.; Race, A.M.; Walter, K.; Holscher, C.; Rompp, A. Do Anti-tuberculosis Drugs Reach Their Target? Horizontal line High-Resolution Matrix-Assisted Laser Desorption/Ionization Mass Spectrometry Imaging Provides Information on Drug Penetration into Necrotic Granulomas. Anal. Chem. 2022, 94, 5483–5492. [Google Scholar] [CrossRef]
- Dannhorn, A.; Kazanc, E.; Hamm, G.; Swales, J.G.; Strittmatter, N.; Maglennon, G.; Goodwin, R.J.A.; Takats, Z. Correlating Mass Spectrometry Imaging and Liquid Chromatography-Tandem Mass Spectrometry for Tissue-Based Pharmacokinetic Studies. Metabolites 2022, 12, 261. [Google Scholar] [CrossRef]
- Fresnais, M.; Yildirim, E.; Karabulut, S.; Jager, D.; Zornig, I.; Benzel, J.; Pajtler, K.W.; Pfister, S.M.; Burhenne, J.; Haefeli, W.E.; et al. Rapid MALDI-MS Assays for Drug Quantification in Biological Matrices: Lessons Learned, New Developments, and Future Perspectives. Molecules 2021, 26, 1281. [Google Scholar] [CrossRef]
- Taylor, A.J.; Dexter, A.; Bunch, J. Exploring Ion Suppression in Mass Spectrometry Imaging of a Heterogeneous Tissue. Anal. Chem. 2018, 90, 5637–5645. [Google Scholar] [CrossRef]
- Yarger, T.J.; Yuill, E.M.; Baker, L.A. Probe-Substrate Distance Control in Desorption Electrospray Ionization. J. Am. Soc. Mass Spectrom. 2018, 29, 558–565. [Google Scholar] [CrossRef] [PubMed]
- Tillner, J.; Wu, V.; Jones, E.A.; Pringle, S.D.; Karancsi, T.; Dannhorn, A.; Veselkov, K.; McKenzie, J.S.; Takats, Z. Faster, More Reproducible DESI-MS for Biological Tissue Imaging. J. Am. Soc. Mass Spectrom. 2017, 28, 2090–2098. [Google Scholar] [CrossRef] [Green Version]
- Roach, P.J.; Laskin, J.; Laskin, A. Nanospray desorption electrospray ionization: An ambient method for liquid-extraction surface sampling in mass spectrometry. Analyst 2010, 135, 2233–2236. [Google Scholar] [CrossRef]
- Fresnais, M.; Haefeli, W.E.; Burhenne, J.; Longuespee, R. Advances in Clinical Pharmacology: Rapid Detection of Small Molecules in Solid Samples at Atmospheric Pressure Using Desorption Electrospray Ionization. Omics A J. Integr. Biol. 2020, 24, 53–54. [Google Scholar] [CrossRef] [PubMed]
- Fresnais, M.; Haefeli, W.E.; Burhenne, J.; Longuespee, R. Rapid drug detection in whole blood droplets using a desorption electrospray ionization static profiling approach—A proof-of-concept. Rapid Commun. Mass Spectrom. RCM 2020, 34, e8614. [Google Scholar] [CrossRef] [PubMed] [Green Version]
- Fresnais, M.; Karabulut, S.; Abou Zeed, Y.; Ungermann, J.; Benzel, J.; Pajtler, K.W.; Pfister, S.M.; Haefeli, W.E.; Burhenne, J.; Longuespee, R. Important Requirements for the Selection of Internal Standards during the Development of Desorption/Ionization Assays for Drug Quantification in Biological Matrices-A Practical Example. Molecules 2022, 27, 690. [Google Scholar] [CrossRef] [PubMed]
- ICH. International Council for Harmonisation of Technical Requirements for Pharmaceuticals for Human Use, ICH Harmonised Guidelines M10—Bioanalytical Method Validation (Draft Version). Available online: https://www.ema.europa.eu/en/documents/scientific-guideline/draft-ich-guideline-m10-bioanalytical-method-validation-step-2b_en.pdf (accessed on 7 December 2021).
- FDA. US Food and Drug Administration, Bioanalytical Method Validation—Guidance for Industry. Available online: https://www.fda.gov/files/drugs/published/Bioanalytical-Method-Validation-Guidance-for-Industry.pdf (accessed on 7 December 2021).
- EMA. European Medicines Agency, Guideline of Bioanalytical Method Validation. Available online: https://www.ema.europa.eu/en/documents/scientific-guideline/guideline-bioanalytical-method-validation_en.pdf (accessed on 7 December 2021).
- Gabelica, V.; Shvartsburg, A.A.; Afonso, C.; Barran, P.; Benesch, J.L.P.; Bleiholder, C.; Bowers, M.T.; Bilbao, A.; Bush, M.F.; Campbell, J.L.; et al. Recommendations for reporting ion mobility Mass Spectrometry measurements. Mass Spectrom. Rev. 2019, 38, 291–320. [Google Scholar] [CrossRef] [PubMed] [Green Version]


| Calibration Point | ULN CAL Solution Concentration (ng/mL) | ULN CAL Concentration in Dilution Mix (ng/mL) | ULN CAL Concentration in Tissue (ng/g) |
|---|---|---|---|
| CAL1000 | 2000 | 70.700 | 1000 |
| CAL500 | 1000 | 35.300 | 500 |
| CAL200 | 400 | 14.140 | 200 |
| CAL100 | 200 | 7.070 | 100 |
| CAL50 | 100 | 3.530 | 50 |
| CAL20 | 40 | 1.410 | 20 |
| CAL10 | 20 | 0.705 | 10 |
| CAL0 | 0 | 0 | 0 |
| Blind value (BV) | 0 | 0 | 0 |
| Methods | Quadrupole | Collision Energy (eV) | Ion Mobility | Target ion ULN (m/z) | Internal Standard | Target ion IS/Control (m/z) |
|---|---|---|---|---|---|---|
| 3 | m/z 433 | 0 | ✓ | 433 | ULN-d6 | 439/443 (rhodamine C from red marker) |
| 4 | m/z 433 | 32 | ✓ | 262 | ULN-d6 | 268 |
Publisher’s Note: MDPI stays neutral with regard to jurisdictional claims in published maps and institutional affiliations. |
© 2022 by the authors. Licensee MDPI, Basel, Switzerland. This article is an open access article distributed under the terms and conditions of the Creative Commons Attribution (CC BY) license (https://creativecommons.org/licenses/by/4.0/).
Share and Cite
Fresnais, M.; Liang, S.; Breitkopf, M.; Lindner, J.R.; Claude, E.; Pringle, S.; Levkin, P.A.; Demir, K.; Benzel, J.; Sundheimer, J.; et al. Analytical Performance Evaluation of New DESI Enhancements for Targeted Drug Quantification in Tissue Sections. Pharmaceuticals 2022, 15, 694. https://0-doi-org.brum.beds.ac.uk/10.3390/ph15060694
Fresnais M, Liang S, Breitkopf M, Lindner JR, Claude E, Pringle S, Levkin PA, Demir K, Benzel J, Sundheimer J, et al. Analytical Performance Evaluation of New DESI Enhancements for Targeted Drug Quantification in Tissue Sections. Pharmaceuticals. 2022; 15(6):694. https://0-doi-org.brum.beds.ac.uk/10.3390/ph15060694
Chicago/Turabian StyleFresnais, Margaux, Siwen Liang, Marius Breitkopf, Joshua Raoul Lindner, Emmanuelle Claude, Steven Pringle, Pavel A. Levkin, Konstantin Demir, Julia Benzel, Julia Sundheimer, and et al. 2022. "Analytical Performance Evaluation of New DESI Enhancements for Targeted Drug Quantification in Tissue Sections" Pharmaceuticals 15, no. 6: 694. https://0-doi-org.brum.beds.ac.uk/10.3390/ph15060694