
Shaping the Future of Obesity Treatment: In Silico Multi-Modeling of IP6K1 Inhibitors for Obesity and Metabolic Dysfunction
 ,
, 
Abstract
: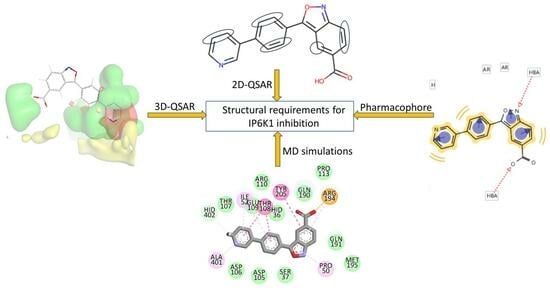
1. Introduction
2. Results and Discussions
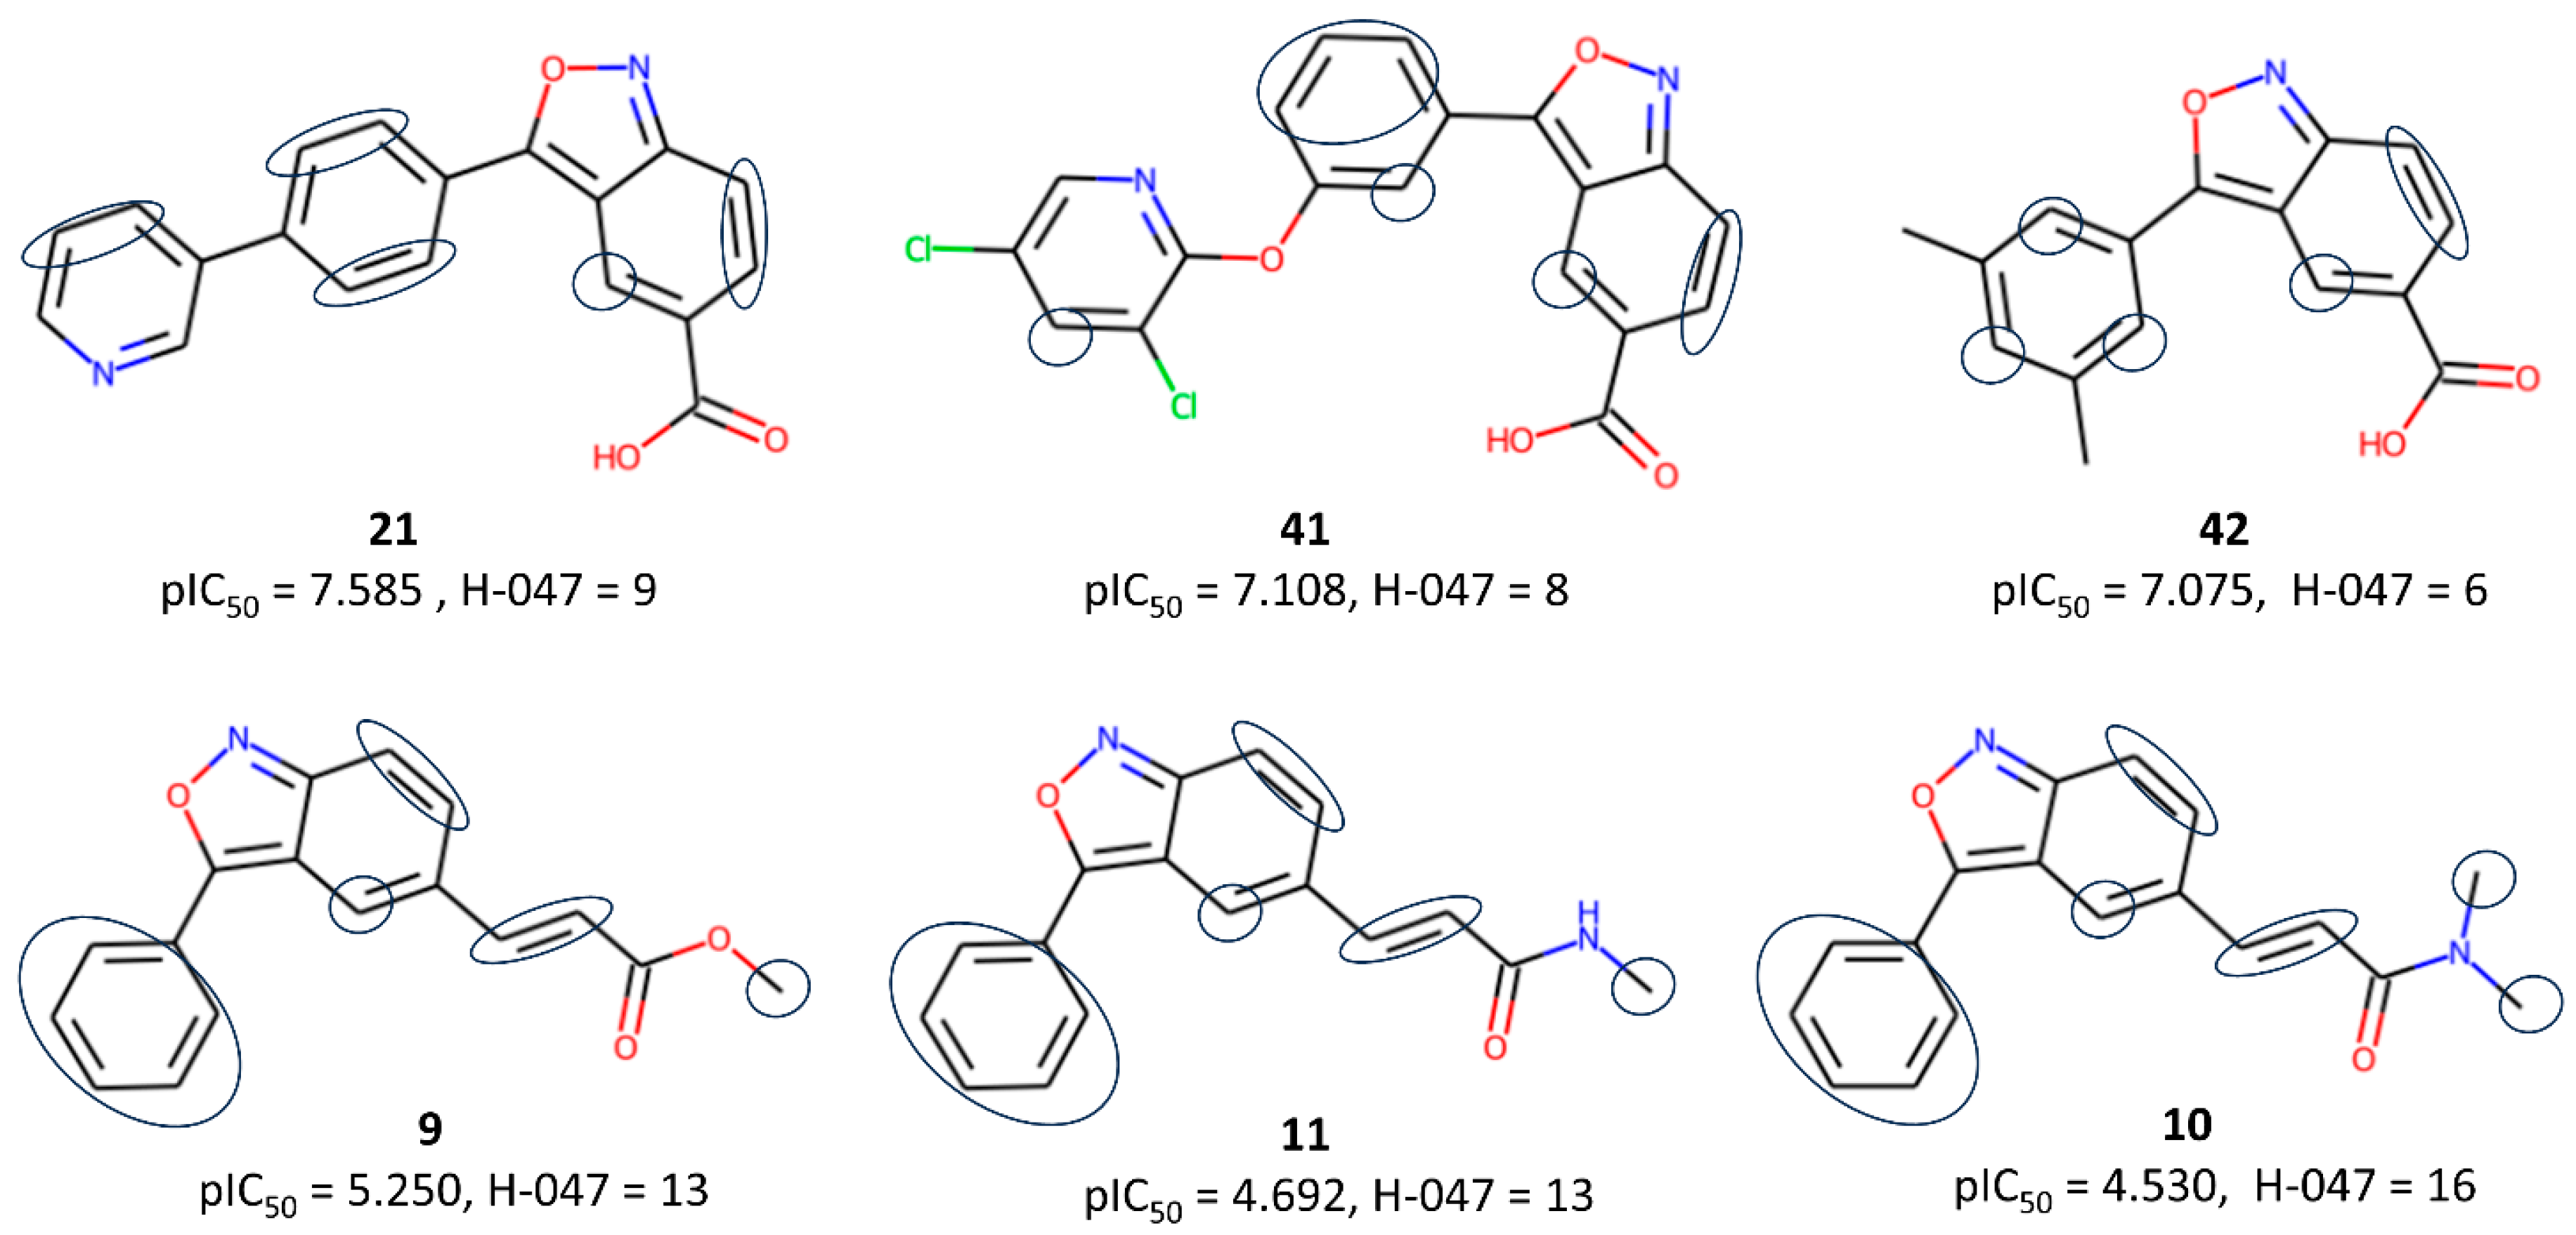
2.1. The 2D-QSAR Modeling
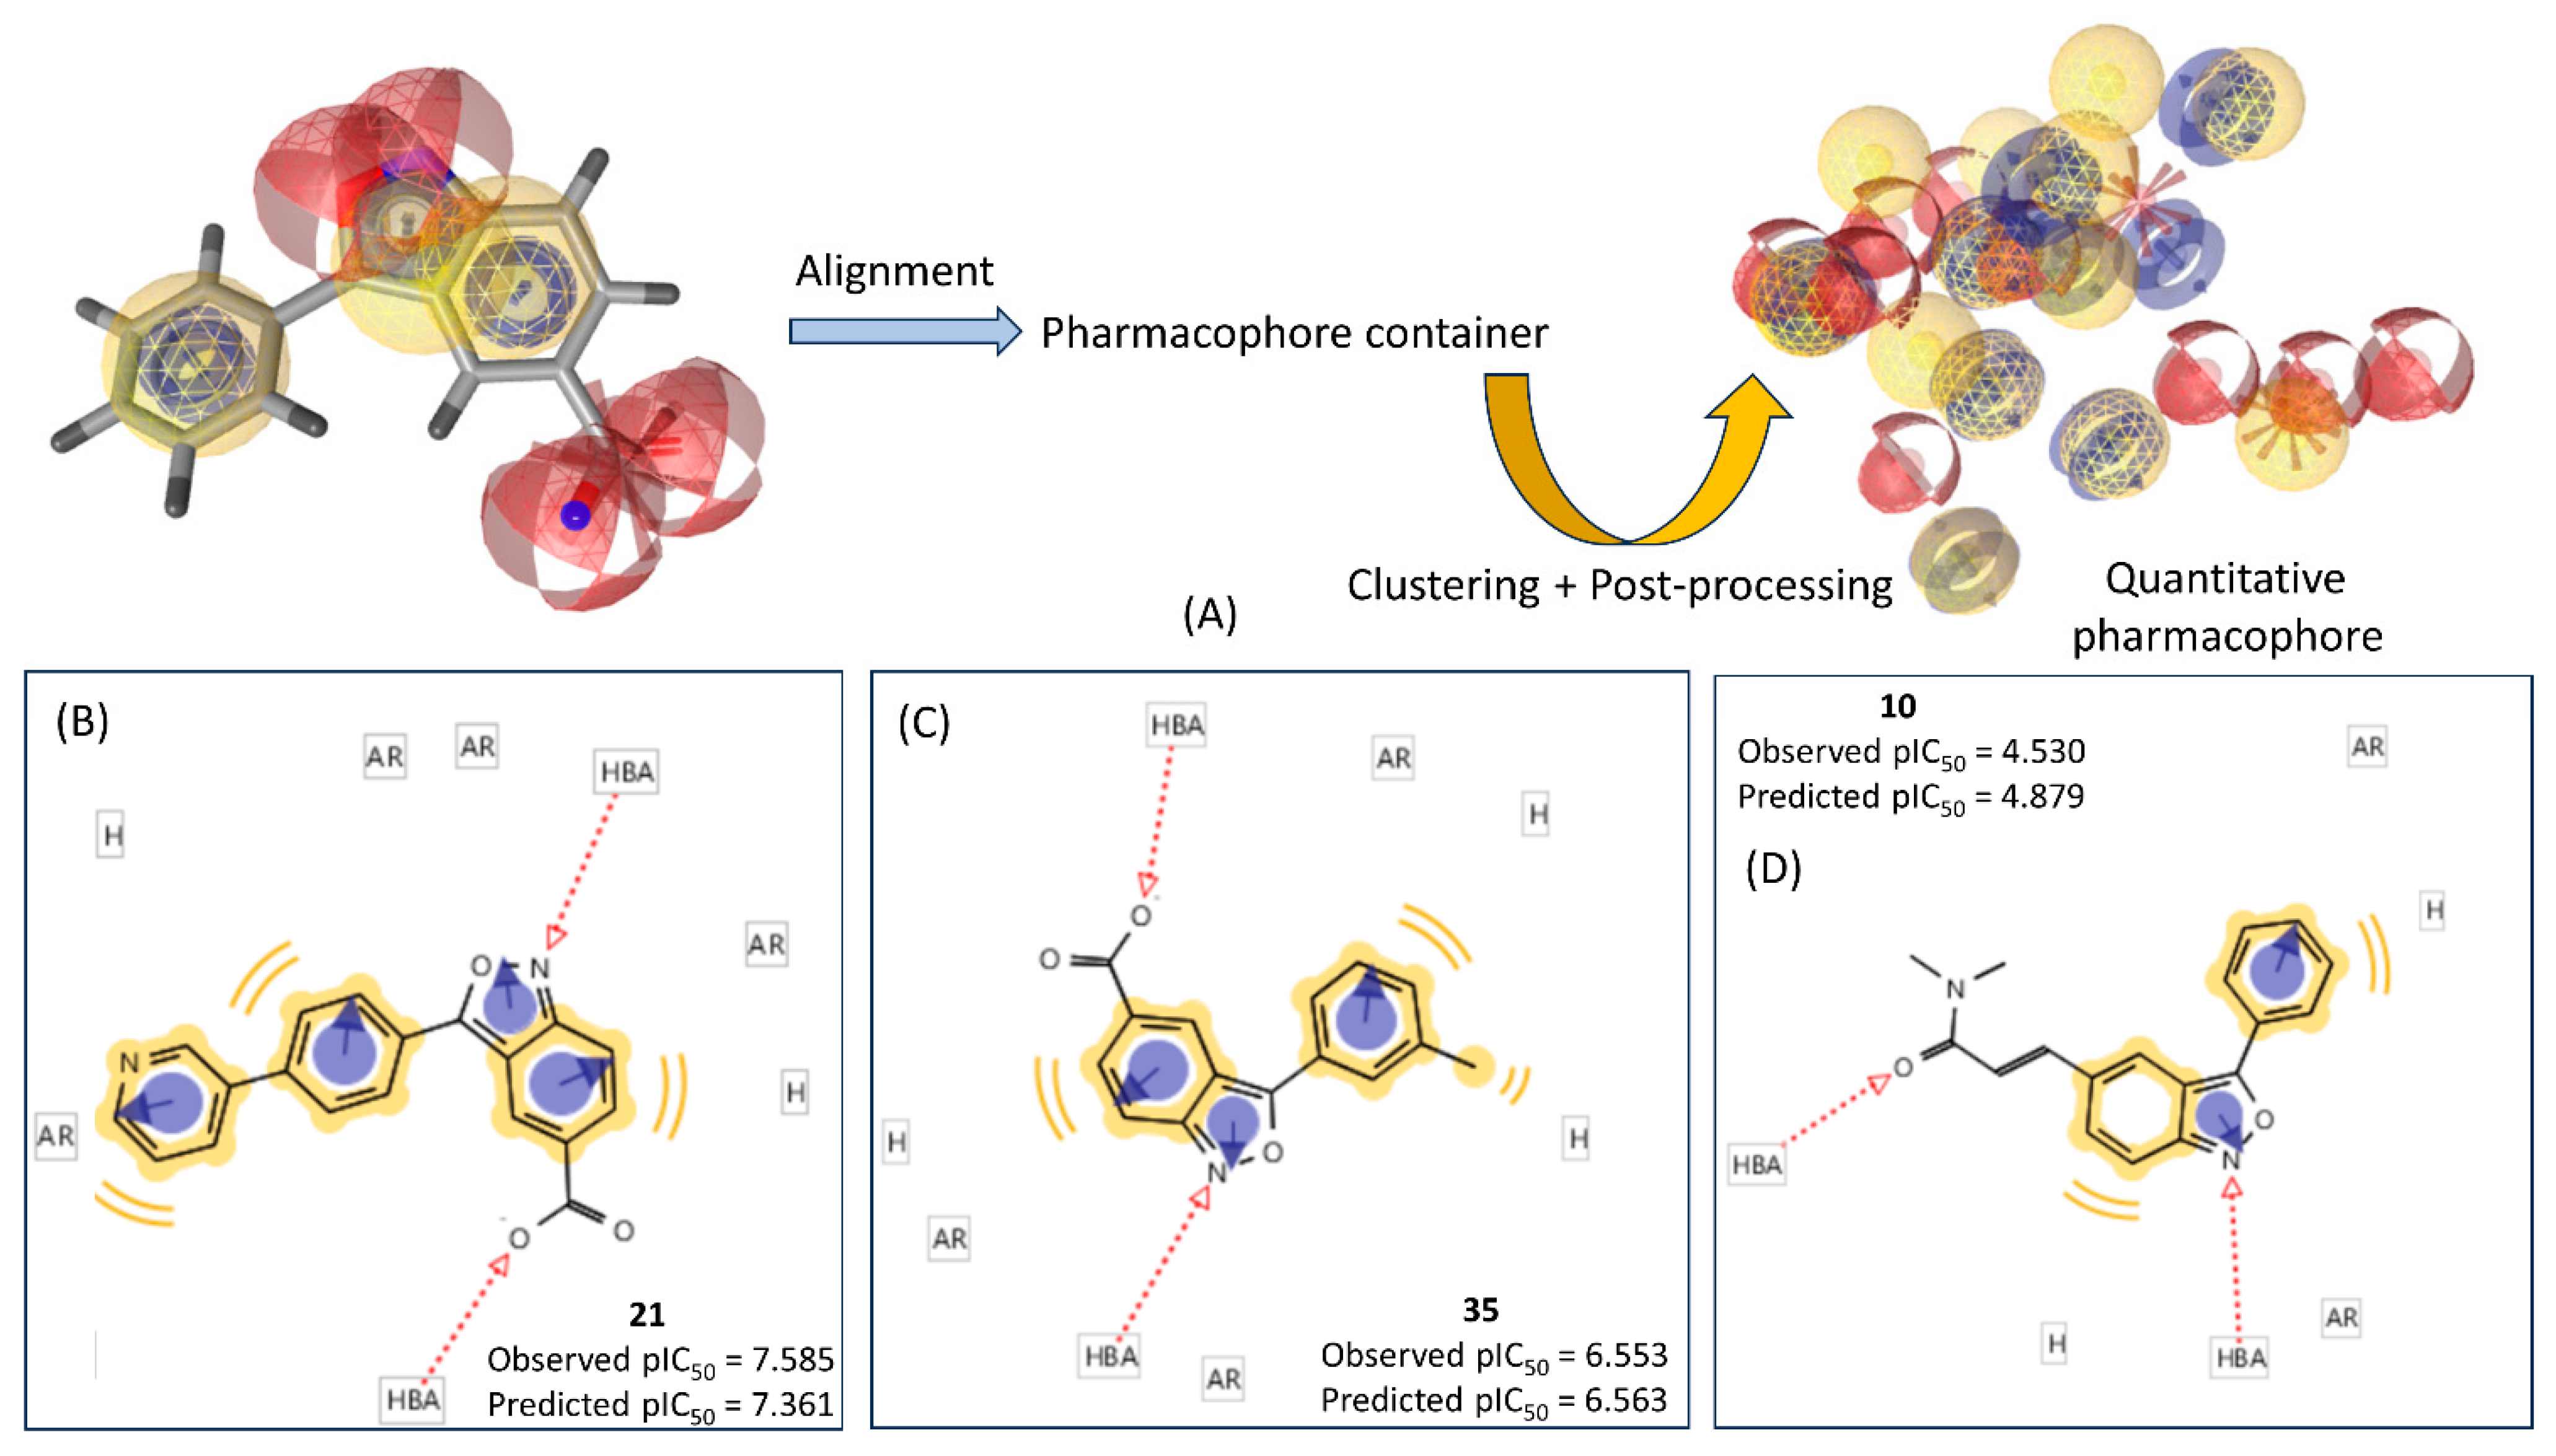
2.2. Ligand-Based Pharmacophore Mapping
2.3. The 3D-QSAR Analysis
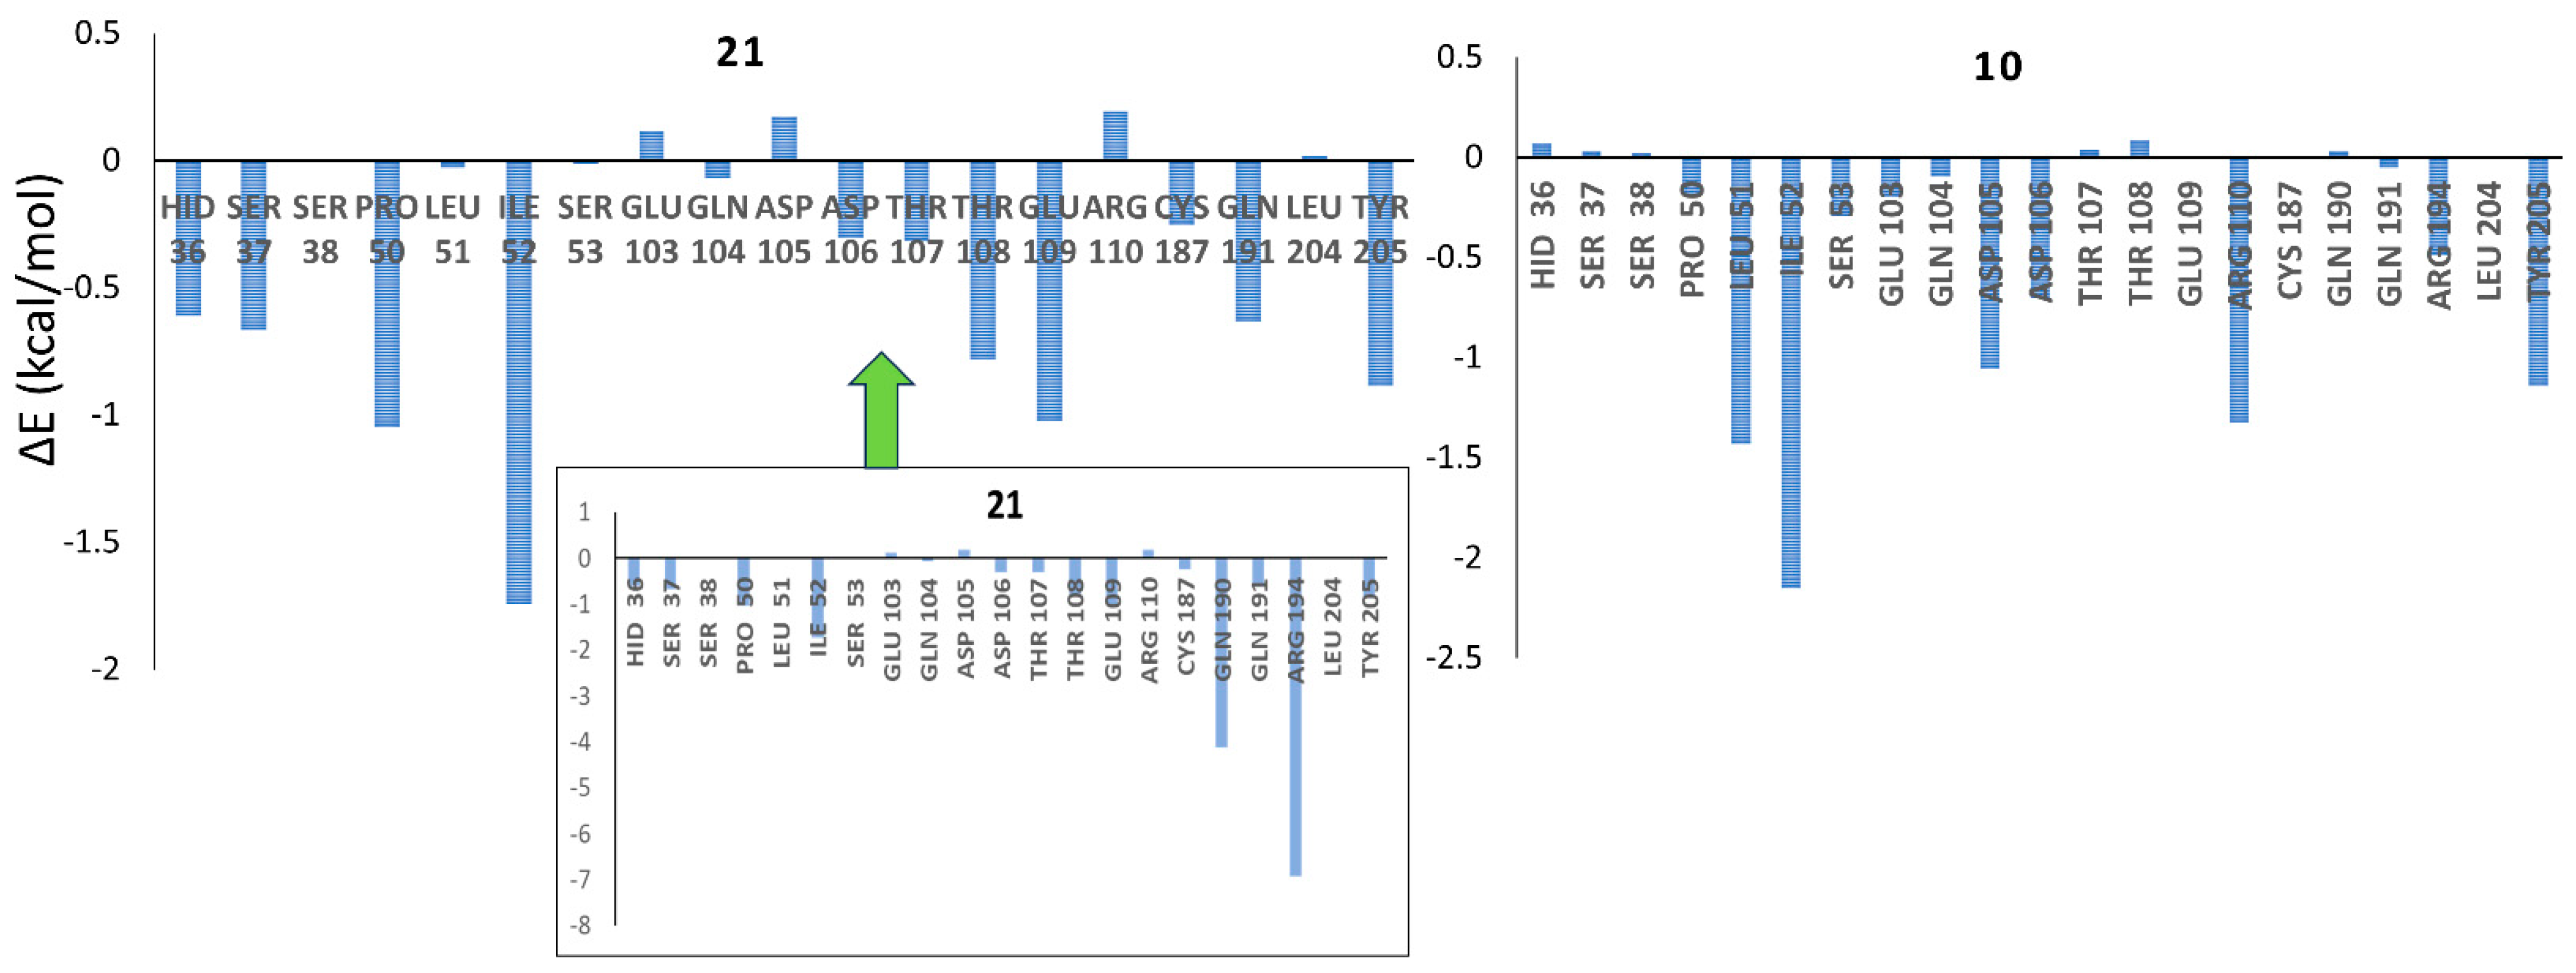
2.4. Homology Modeling of IP6K1 and MD Simulations
3. Materials and Methods
3.1. Dataset Collection and Preparation
3.2. The 2D-QSAR Modeling
3.2.1. Descriptor Calculation
3.2.2. Dataset Division and Model Development
- (a)
- (SFS-QSAR-tool_v2: This tool offers a graphical user interface for developing linear, interpretable 2D-QSAR models. It uses the sequential forward selection (SFS) technique, which is based on the code available in the Mlxtend library (http://rasbt.github.io/mlxtend/, accessed on 12 September 2023). SFS is a non-stochastic feature selection strategy that resources various scoring functions and cross-validation strategies for selecting the most significant features for the 2D-QSAR models. In this work, four different scoring functions were employed, including the coefficient of determination (R2), the negative mean absolute error (NMAE), the negative mean Poisson deviance (NMPD), and the negative mean gamma deviance (NMGD). For each scoring function, models were generated both with no cross-validation and with 5-fold cross-validation, resulting in a total of eight (=4 × 2) models.
- (b)
- Genetic-Algorithm v.4.1_2 (https://dtclab.webs.com/software-tools, accessed on 14 September 2023): This software generates linear interpretable MLR models using a stochastic genetic algorithm (GA) technique. The details of this methodology have been described elsewhere [35]. During the data processing, the correlation and variance cut-offs were set at 0.99 and 0.0001, respectively, to include a significant number of descriptors in the model development while excluding constant and highly correlated descriptors.
3.2.3. Evaluation of the Models
3.3. Ligand-Based Pharmacophore Modeling
3.4. The 3D-QSAR Modeling
3.5. Homology Modeling
3.6. Molecular Docking Analysis
3.7. Molecular Dynamics Simulations
4. Conclusions
Supplementary Materials
Author Contributions
Funding
Institutional Review Board Statement
Informed Consent Statement
Data Availability Statement
Conflicts of Interest
References
- Twig, G.; Yaniv, G.; Levine, H.; Leiba, A.; Goldberger, N.; Derazne, E.; Ben-Ami Shor, D.; Tzur, D.; Afek, A.; Shamiss, A.; et al. Body-Mass Index in 2.3 Million Adolescents and Cardiovascular Death in Adulthood. N. Engl. J. Med. 2016, 374, 2430–2440. [Google Scholar] [CrossRef]
- Müller, T.D.; Blüher, M.; Tschöp, M.H.; DiMarchi, R.D. Anti-obesity drug discovery: Advances and challenges. Nat. Rev. Drug Discov. 2021, 21, 201–223. [Google Scholar] [CrossRef]
- Blüher, M. Obesity: Global epidemiology and pathogenesis. Nat. Rev. Endocrinol. 2019, 15, 288–298. [Google Scholar] [CrossRef]
- Srivastava, G.; Apovian, C. Future Pharmacotherapy for Obesity: New Anti-obesity Drugs on the Horizon. Curr. Obes. Rep. 2018, 7, 147–161. [Google Scholar] [CrossRef]
- Safaei, M.; Sundararajan, E.A.; Driss, M.; Boulila, W.; Shapi’I, A. A systematic literature review on obesity: Understanding the causes & consequences of obesity and reviewing various machine learning approaches used to predict obesity. Comput. Biol. Med. 2021, 136, 104754. [Google Scholar] [CrossRef]
- Wadden, T.A.; Berkowitz, R.I.; Sarwer, D.B.; Prus-Wisniewski, R.; Steinberg, C. Benefits of Lifestyle Modification in the Pharmacologic Treatment of Obesity. Arch. Intern. Med. 2001, 161, 218–227. [Google Scholar] [CrossRef]
- Kim, G.W.; Lin, J.E.; Blomain, E.S.; Waldman, S.A. Antiobesity Pharmacotherapy: New Drugs and Emerging Targets. Clin. Pharmacol. Ther. 2013, 95, 53–66. [Google Scholar] [CrossRef]
- Vilar-Gomez, E.; Martinez-Perez, Y.; Calzadilla-Bertot, L.; Torres-Gonzalez, A.; Gra-Oramas, B.; Gonzalez-Fabian, L.; Friedman, S.L.; Diago, M.; Romero-Gomez, M. Weight Loss Through Lifestyle Modification Significantly Reduces Features of Nonalcoholic Steatohepatitis. Gastroenterology 2015, 149, 367–378.e5. [Google Scholar] [CrossRef] [PubMed]
- Wing, R.R.; Lang, W.; Wadden, T.A.; Safford, M.; Knowler, W.C.; Bertoni, A.G.; Hill, J.O.; Brancati, F.L.; Peters, A.; Wagenknecht, L.; et al. Benefits of Modest Weight Loss in Improving Cardiovascular Risk Factors in Overweight and Obese Individuals With Type 2 Diabetes. Diabetes Care 2011, 34, 1481–1486. [Google Scholar] [CrossRef] [PubMed]
- Williams, D.M.; Nawaz, A.; Evans, M. Drug Therapy in Obesity: A Review of Current and Emerging Treatments. Diabetes Ther. 2020, 11, 1199–1216. [Google Scholar] [CrossRef] [PubMed]
- Cridland, C.; Gillaspy, G. Inositol Pyrophosphate Pathways and Mechanisms: What Can We Learn from Plants? Molecules 2020, 25, 2789. [Google Scholar] [CrossRef]
- Li, H.; Datunashvili, M.; Reyes, R.C.; Voglmaier, S.M. Inositol hexakisphosphate kinases differentially regulate trafficking of vesicular glutamate transporters 1 and 2. Front. Cell. Neurosci. 2022, 16, 926794. [Google Scholar] [CrossRef]
- Moritoh, Y.; Abe, S.-I.; Akiyama, H.; Kobayashi, A.; Koyama, R.; Hara, R.; Kasai, S.; Watanabe, M. The enzymatic activity of inositol hexakisphosphate kinase controls circulating phosphate in mammals. Nat. Commun. 2021, 12, 4847. [Google Scholar] [CrossRef] [PubMed]
- Illies, C.; Gromada, J.; Fiume, R.; Leibiger, B.; Yu, J.; Juhl, K.; Yang, S.-N.; Barma, D.K.; Falck, J.R.; Saiardi, A.; et al. Requirement of Inositol Pyrophosphates for Full Exocytotic Capacity in Pancreatic β Cells. Science 2007, 318, 1299–1302. [Google Scholar] [CrossRef] [PubMed]
- Wilson, M.S.C.; Livermore, T.M.; Saiardi, A. Inositol pyrophosphates: Between signalling and metabolism. Biochem. J. 2013, 452, 369–379. [Google Scholar] [CrossRef] [PubMed]
- Liao, G.; Ye, W.; Heitmann, T.; Ernst, G.; DePasquale, M.; Xu, L.; Wormald, M.; Hu, X.; Ferrer, M.; Harmel, R.K.; et al. Identification of Small-Molecule Inhibitors of Human Inositol Hexakisphosphate Kinases by High-Throughput Screening. ACS Pharmacol. Transl. Sci. 2021, 4, 780–789. [Google Scholar] [CrossRef] [PubMed]
- Zhu, Q.; Ghoshal, S.; Tyagi, R.; Chakraborty, A. Global IP6K1 deletion enhances temperature modulated energy expenditure which reduces carbohydrate and fat induced weight gain. Mol. Metab. 2016, 6, 73–85. [Google Scholar] [CrossRef]
- Mukherjee, S.; Chakraborty, M.; Ulmasov, B.; McCommis, K.; Zhang, J.; Carpenter, D.; Msengi, E.N.; Haubner, J.; Guo, C.; Pike, D.P.; et al. Pleiotropic actions of IP6K1 mediate hepatic metabolic dysfunction to promote nonalcoholic fatty liver disease and steatohepatitis. Mol. Metab. 2021, 54, 101364. [Google Scholar] [CrossRef] [PubMed]
- Rao, F.; Xu, J.; Fu, C.; Cha, J.Y.; Gadalla, M.M.; Xu, R.; Barrow, J.C.; Snyder, S.H. Inositol pyrophosphates promote tumor growth and metastasis by antagonizing liver kinase B1. Proc. Natl. Acad. Sci. USA 2015, 112, 1773–1778. [Google Scholar] [CrossRef] [PubMed]
- Chakraborty, A. The inositol pyrophosphate pathway in health and diseases. Biol. Rev. 2017, 93, 1203–1227. [Google Scholar] [CrossRef]
- Moritoh, Y.; Oka, M.; Yasuhara, Y.; Hozumi, H.; Iwachidow, K.; Fuse, H.; Tozawa, R. Inositol Hexakisphosphate Kinase 3 Regulates Metabolism and Lifespan in Mice. Sci. Rep. 2016, 6, 32072. [Google Scholar] [CrossRef]
- Mousavi, H. A comprehensive survey upon diverse and prolific applications of chitosan-based catalytic systems in one-pot multi-component synthesis of heterocyclic rings. Int. J. Biol. Macromol. 2021, 186, 1003–1166. [Google Scholar] [CrossRef] [PubMed]
- Kumar, A.; Singh, A.K.; Singh, H.; Vijayan, V.; Kumar, D.; Naik, J.; Thareja, S.; Yadav, J.P.; Pathak, P.; Grishina, M.; et al. Nitrogen Containing Heterocycles as Anticancer Agents: A Medicinal Chemistry Perspective. Pharmaceuticals 2023, 16, 299. [Google Scholar] [CrossRef] [PubMed]
- Hu, S.; Chen, J.; Cao, J.-X.; Zhang, S.-S.; Gu, S.-X.; Chen, F.-E. Quinolines and isoquinolines as HIV-1 inhibitors: Chemical structures, action targets, and biological activities. Bioorg. Chem. 2023, 136, 106549. [Google Scholar] [CrossRef] [PubMed]
- De, S.; Aamna, B.; Sahu, R.; Parida, S.; Behera, S.K.; Dan, A.K. Seeking heterocyclic scaffolds as antivirals against dengue virus. Eur. J. Med. Chem. 2022, 240, 114576. [Google Scholar] [CrossRef] [PubMed]
- Zhou, Y.; Mukherjee, S.; Huang, D.; Chakraborty, M.; Gu, C.; Zong, G.; Stashko, M.A.; Pearce, K.H.; Shears, S.B.; Chakraborty, A.; et al. Development of Novel IP6K Inhibitors for the Treatment of Obesity and Obesity-Induced Metabolic Dysfunctions. J. Med. Chem. 2022, 65, 6869–6887. [Google Scholar] [CrossRef] [PubMed]
- Vemula, D.; Jayasurya, P.; Sushmitha, V.; Kumar, Y.N.; Bhandari, V. CADD, AI and ML in drug discovery: A comprehensive review. Eur. J. Pharm. Sci. 2023, 181, 106324. [Google Scholar] [CrossRef] [PubMed]
- Sabe, V.T.; Ntombela, T.; Jhamba, L.A.; Maguire, G.E.M.; Govender, T.; Naicker, T.; Kruger, H.G. Current trends in computer aided drug design and a highlight of drugs discovered via computational techniques: A review. Eur. J. Med. Chem. 2021, 224, 113705. [Google Scholar] [CrossRef]
- Mousavi, H.; Zeynizadeh, B.; Rimaz, M. Green and efficient one-pot three-component synthesis of novel drug-like furo[2,3-d]pyrimidines as potential active site inhibitors and putative allosteric hotspots modulators of both SARS-CoV-2 MPro and PLPro. Bioorg. Chem. 2023, 135, 106390. [Google Scholar] [CrossRef]
- Cox, P.B.; Gupta, R. Contemporary Computational Applications and Tools in Drug Discovery. ACS Med. Chem. Lett. 2022, 13, 1016–1029. [Google Scholar] [CrossRef]
- Bassani, D.; Moro, S. Past, Present, and Future Perspectives on Computer-Aided Drug Design Methodologies. Molecules 2023, 28, 3906. [Google Scholar] [CrossRef]
- Mauri, A. AlvaDesc: A Tool to Calculate and Analyze Molecular Descriptors and Fingerprints. In Ecotoxicological QSARs; Roy, K., Ed.; Methods in Pharmacology and Toxicology; Humana: New York, NY, USA, 2020; pp. 801–820. [Google Scholar] [CrossRef]
- Sushko, I.; Novotarskyi, S.; Körner, R.; Pandey, A.K.; Rupp, M.; Teetz, W.; Brandmaier, S.; Abdelaziz, A.; Prokopenko, V.V.; Tanchuk, V.Y.; et al. Online chemical modeling environment (OCHEM): Web platform for data storage, model development and publishing of chemical information. J. Comput. Aided Mol. Des. 2011, 25, 533–554. [Google Scholar] [CrossRef] [PubMed]
- Halder, A.K.; Delgado, A.H.S.; Cordeiro, M.N.D.S. First multi-target QSAR model for predicting the cytotoxicity of acrylic acid-based dental monomers. Dent. Mater. 2022, 38, 333–346. [Google Scholar] [CrossRef]
- Ambure, P.; Aher, R.B.; Gajewicz, A.; Puzyn, T.; Roy, K. “NanoBRIDGES” software: Open access tools to perform QSAR and nano-QSAR modeling. Chemom. Intell. Lab. Syst. 2015, 147, 1–13. [Google Scholar] [CrossRef]
- Tetko, I.V.; Tanchuk, V.Y.; Villa, A.E.P. Prediction ofn-Octanol/Water Partition Coefficients from PHYSPROP Database Using Artificial Neural Networks and E-State Indices. J. Chem. Inf. Comput. Sci. 2001, 41, 1407–1421. [Google Scholar] [CrossRef]
- Golbraikh, A.; Tropsha, A. Beware of q2! J. Mol. Graph. Model. 2002, 20, 269–276. [Google Scholar] [CrossRef]
- Gramatica, P. Principles of QSAR models validation: Internal and external. QSAR Comb. Sci. 2007, 26, 694–701. [Google Scholar] [CrossRef]
- Yoo, W.; Mayberry, R.; Bae, S.; Singh, K.; He, Q.P.; Lillard, J.W., Jr. A Study of Effects of MultiCollinearity in the Multivariable Analysis. Int. J. Appl. Sci. Technol. 2014, 4, 9–19. [Google Scholar]
- Ojha, P.K.; Roy, K. Comparative QSARs for antimalarial endochins: Importance of descriptor-thinning and noise reduction prior to feature selection. Chemom. Intell. Lab. Syst. 2011, 109, 146–161. [Google Scholar] [CrossRef]
- Gajewicz-Skretna, A.; Wyrzykowska, E.; Gromelski, M. Quantitative multi-species toxicity modeling: Does a multi-species, machine learning model provide better performance than a single-species model for the evaluation of acute aquatic toxicity by organic pollutants? Sci. Total Environ. 2023, 861, 160590. [Google Scholar] [CrossRef]
- Kohlbacher, S.M.; Langer, T.; Seidel, T. QPHAR: Quantitative pharmacophore activity relationship: Method and validation. J. Cheminform. 2021, 13, 57. [Google Scholar] [CrossRef]
- Mitra, S.; Halder, A.K.; Ghosh, N.; Mandal, S.C.; Cordeiro, M.N.D.S. Multi-model in silico characterization of 3-benzamidobenzoic acid derivatives as partial agonists of Farnesoid X receptor in the management of NAFLD. Comput. Biol. Med. 2023, 157, 106789. [Google Scholar] [CrossRef]
- Kohlbacher, S.M.; Schmid, M.; Seidel, T.; Langer, T. Applications of the Novel Quantitative Pharmacophore Activity Relationship Method QPhAR in Virtual Screening and Lead-Optimisation. Pharmaceuticals 2022, 15, 1122. [Google Scholar] [CrossRef]
- Tosco, P.; Balle, T.; Shiri, F. Open3DALIGN: An open-source software aimed at unsupervised ligand alignment. J. Comput. Aided Mol. Des. 2011, 25, 777–783. [Google Scholar] [CrossRef] [PubMed]
- Tosco, P.; Balle, T. Open3DQSAR: A new open-source software aimed at high-throughput chemometric analysis of molecular interaction fields. J. Mol. Model. 2010, 17, 201–208. [Google Scholar] [CrossRef]
- Sar, S.; Mitra, S.; Panda, P.; Mandal, S.C.; Ghosh, N.; Halder, A.K.; Cordeiro, M.N.D.S. In Silico Modeling and Structural Analysis of Soluble Epoxide Hydrolase Inhibitors for Enhanced Therapeutic Design. Molecules 2023, 28, 6379. [Google Scholar] [CrossRef]
- UniProt Consortium. UniProt: A worldwide hub of protein knowledge. Nucleic Acids Res. 2019, 47, D506–D515. [Google Scholar] [CrossRef]
- Williams, C.J.; Headd, J.J.; Moriarty, N.W.; Prisant, M.G.; Videau, L.L.; Deis, L.N.; Verma, V.; Keedy, D.A.; Hintze, B.J.; Chen, V.B.; et al. MolProbity: More and better reference data for improved all-atom structure validation. Protein Sci. 2018, 27, 293–315. [Google Scholar] [CrossRef] [PubMed]
- Davis, I.W.; Murray, L.W.; Richardson, J.S.; Richardson, D.C. MOLPROBITY: Structure validation and all-atom contact analysis for nucleic acids and their complexes. Nucleic Acids Res. 2004, 32, W615–W619. [Google Scholar] [CrossRef] [PubMed]
- Waterhouse, A.; Bertoni, M.; Bienert, S.; Studer, G.; Tauriello, G.; Gumienny, R.; Heer, F.T.; De Beer, T.A.P.; Rempfer, C.; Bordoli, L.; et al. SWISS-MODEL: Homology modelling of protein structures and complexes. Nucleic Acids Res. 2018, 46, W296–W303. [Google Scholar] [CrossRef]
- Schwede, T.; Kopp, J.; Guex, N.; Peitsch, M.C. SWISS-MODEL: An automated protein homology-modeling server. Nucleic Acids Res. 2003, 31, 3381–3385. [Google Scholar] [CrossRef]
- Salomon-Ferrer, R.; Case, D.A.; Walker, R.C. An overview of the Amber biomolecular simulation package. WIREs Comput. Mol. Sci. 2012, 3, 198–210. [Google Scholar] [CrossRef]
- Nurisso, A.; Daina, A.; Walker, R.C. A Practical Introduction to Molecular Dynamics Simulations: Applications to Homology Modeling. In Homology Modeling; Orry, A., Abagyan, R., Eds.; Humana Press: New York, NY, USA, 2012; pp. 137–173. [Google Scholar] [CrossRef]
- Liu, Y.; Grimm, M.; Dai, W.-T.; Hou, M.-C.; Xiao, Z.-X.; Cao, Y. CB-Dock: A web server for cavity detection-guided protein–ligand blind docking. Acta Pharmacol. Sin. 2020, 41, 138–144. [Google Scholar] [CrossRef]
- Liu, Y.; Yang, X.; Gan, J.; Chen, S.; Xiao, Z.-X.; Cao, Y. CB-Dock2: Improved protein–ligand blind docking by integrating cavity detection, docking and homologous template fitting. Nucleic Acids Res. 2022, 50, W159–W164. [Google Scholar] [CrossRef]
- Trott, O.; Olson, A.J. AutoDock Vina: Improving the speed and accuracy of docking with a new scoring function, efficient optimization, and multithreading. J. Comput. Chem. 2010, 31, 455–461. [Google Scholar] [CrossRef]
- Ghosh, A.; Panda, P.; Halder, A.K.; Cordeiro, M.N.D.S. In silico characterization of aryl benzoyl hydrazide derivatives as potential inhibitors of RdRp enzyme of H5N1 influenza virus. Front. Pharmacol. 2022, 13, 1004255. [Google Scholar] [CrossRef]
- Halder, A.K.; Cordeiro, M.N.D.S. Multi-Target In Silico Prediction of Inhibitors for Mitogen-Activated Protein Kinase-Interacting Kinases. Biomolecules 2021, 11, 1670. [Google Scholar] [CrossRef]
- Dolinsky, T.J.; Czodrowski, P.; Li, H.; Nielsen, J.E.; Jensen, J.H.; Klebe, G.; Baker, N.A. PDB2PQR: Expanding and upgrading automated preparation of biomolecular structures for molecular simulations. Nucleic Acids Res. 2007, 35, W522–W525. [Google Scholar] [CrossRef] [PubMed]
- Roe, D.R.; Cheatham, T.E., III. PTRAJ and CPPTRAJ: Software for Processing and Analysis of Molecular Dynamics Trajectory Data. J. Chem. Theory Comput. 2013, 9, 3084–3095. [Google Scholar] [CrossRef] [PubMed]
- Srinivasan, J.; Cheatham, T.E.; Cieplak, P.; Kollman, P.A.; Case, D.A. Continuum Solvent Studies of the Stability of DNA, RNA, and Phosphoramidate—DNA Helices. J. Am. Chem. Soc. 1998, 120, 9401–9409. [Google Scholar] [CrossRef]
- Yang, H.; Lou, C.; Sun, L.; Li, J.; Cai, Y.; Wang, Z.; Li, W.; Liu, G.; Tang, Y. admetSAR 2.0: Web-service for prediction and optimization of chemical ADMET properties. Bioinformatics 2019, 35, 1067–1069. [Google Scholar] [CrossRef] [PubMed]
- Daina, A.; Michielin, O.; Zoete, V. SwissADME: A free web tool to evaluate pharmacokinetics, drug-likeness and medicinal chemistry friendliness of small molecules. Sci. Rep. 2017, 7, 42717. [Google Scholar] [CrossRef] [PubMed]
- Reutlinger, M.; Koch, C.P.; Reker, D.; Todoroff, N.; Schneider, P.; Rodrigues, T.; Schneider, G. Chemically Advanced Template Search (CATS) for Scaffold-Hopping and Prospective Target Prediction for ‘Orphan’ Molecules. Mol. Inform. 2013, 32, 133–138. [Google Scholar] [CrossRef] [PubMed]


| Model a | Score b | CV c | Interpretable Descriptors d | Modela | All Descriptors | ||||
|---|---|---|---|---|---|---|---|---|---|
| Q2LOO | R2Pred | Average | Q2LOO | R2Pred | Average | ||||
| M01 | R2 | none | 0.733 | 0.427 | 0.580 | M10 | 0.812 | 0.688 | 0.750 |
| M02 | NMAE | none | 0.654 | 0.799 | 0.727 | M11 | 0.820 | 0.868 | 0.844 |
| M03 | NMPD | none | 0.733 | 0.427 | 0.580 | M12 | 0.812 | 0.688 | 0.750 |
| M04 | NMGD | none | 0.427 | 0.427 | 0.427 | M13 | 0.829 | 0.405 | 0.617 |
| M05 | R2 | 5 | 0.671 | 0.680 | 0.676 | M14 | 0.704 | 0.526 | 0.615 |
| M06 | NMAE | 5 | 0.662 | 0.253 | 0.458 | M15 | 0.839 | 0.870 | 0.855 |
| M07 | NMPD | 5 | −0.898 | 0.605 | −0.147 | M16 | 0.823 | 0.849 | 0.836 |
| M08 | NMGD | 5 | −0.898 | 0.605 | −0.147 | M17 | 0.823 | 0.849 | 0.836 |
| M09 | GA-LDA | na | 0.800 | 0.785 | 0.793 | M18 | 0.840 | 0.801 | 0.821 |
| Equation | Statistical Results |
|---|---|
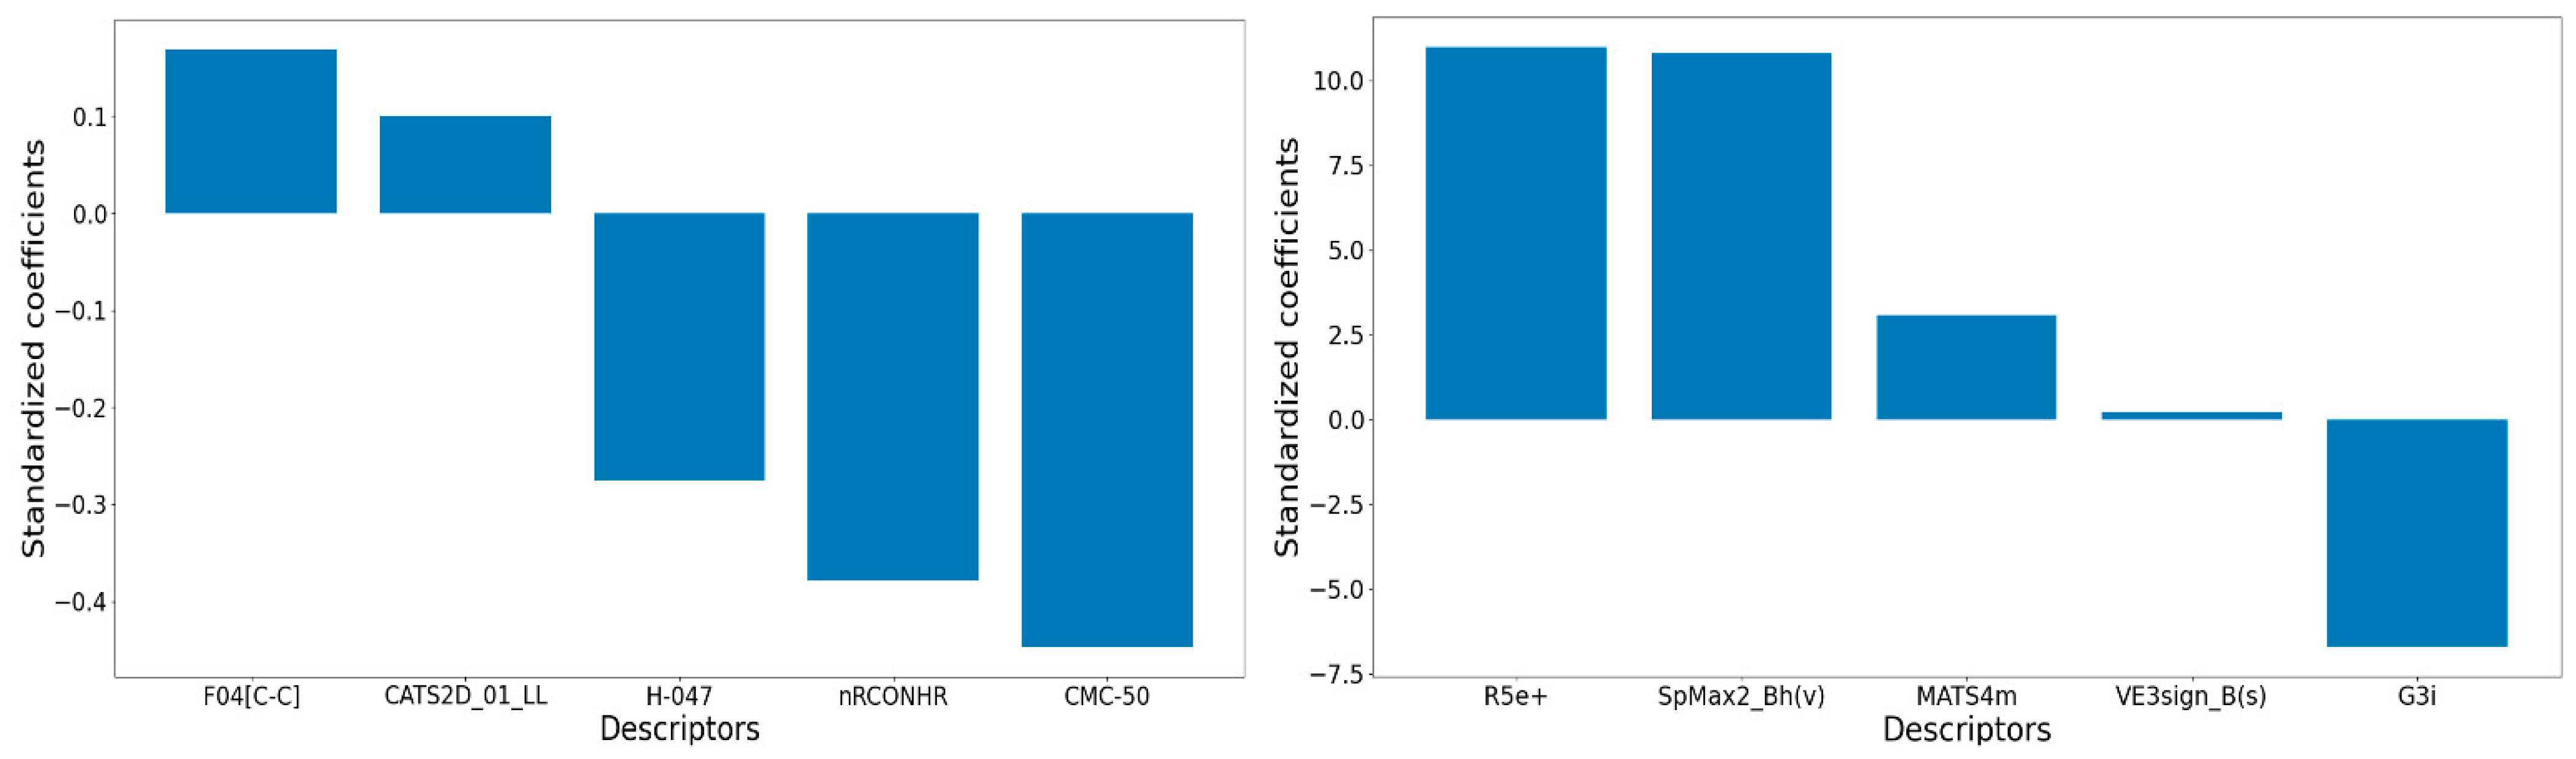
| Model M09 (Interpretable descriptors) pIC50 = +0.169(±0.028) F04[C-C] −0.447(±0.139) CMC-50 −0.378(±0.131) nRCONHR −0.275(±0.029) H-047 +0.1(±0.031) CATS2D_01_LL + 5.125(±0.485) | Ntraining = 29, R2 = 0.857, R2adj = 0.826, Q2LOO = 0.800, MAE = 0.201, rm2LOO = 0.724, ∆rm2LOO = 0.088 Ntest = 7, R2Pred/Q2F1 = 0.785, Q2F2 = 0.765, RMSEP = 0.309, rm2test = 0.706, ∆rm2test = 0.125 |
| Model M15 (All descriptors) pIC50 = +0.223(±0.083) VE3sign_B(s) +3.079(±0.574) MATS4m +10.797(±1.593) SpMax2_Bh(v) −6.694(±1.071) G3i +10.984(±3.07) R5e+ −33.064(±6.179) | Ntraining = 29, R2 = 0.890, R2adj = 0.866, Q2LOO = 0.839, MAE = 0.181, rm2LOO = 0.772, ∆rm2LOO = 0.117 Ntest = 7, R2Pred/Q2F1 = 0.870, Q2F2 = 0.858, RMSEP = 0.240, rm2test = 0.740, ∆rm2test = 0.120 |
| Descriptor | Definition | Category |
|---|---|---|
| R5e+ | R maximal autocorrelation of lag 5 weighted by Sanderson electronegativity | GETAWAY |
| SpMax2_Bh(v) | Largest eigenvalue n. 2 of Burden matrix weighted by van der Waals volume | Burden eigenvalues |
| G3i | Third-component symmetry directional WHIM index weighted by ionization potential | WHIM |
| MATS4m | Moran autocorrelation of lag 4 weighted by mass | 2D autocorrelations |
| VE3sign_B(s) | Logarithmic coefficient sum of the last eigenvector from Burden matrix weighted by I-State | 2D matrix-based |
| Parameter | Training | Test |
|---|---|---|
| N | 26 | 10 |
| R2 | 0.845 | |
| RMSE | 0.309 | |
| ME | 0.248 | |
| SE | 0.183 | |
| R2Pred | 0.565 | |
| R2Preda | 0.716 |
| Parameter b | FFD-SEL | UVE-PLS |
|---|---|---|
| Ntraining | 29 | 29 |
| NCb | 4 | 3 |
| R2 (SDEC) | 0.912 (0.176) | 0.856 (0.224) |
| F | 62.157 | 33.847 |
| Q2LOO (SDEP) | 0.637 (0.357) | 0.370 (0.471) |
| Q2LTO (SDEP) | 0.626 (0.363) | 0.361 (0.474) |
| Q2LMO (SDEP) | 0.573 (0.387) | 0.311 (0.492) |
| Ntest | 7 | 7 |
| R2Pred (SDEP) | 0.747 (0.564) | 0.668 (0.646) |
| Q2s | 0.428 | --- |
| Complexes | ΔEvdW | ΔEelec | ΔGgas | ΔGpolar | ΔGnon-polar | ΔGsolvation | T∆S | ΔGbind(T) |
|---|---|---|---|---|---|---|---|---|
| 21 | −42.45 | −125.22 | −167.67 | +133.91 | −5.78 | +128.13 | −21.20 | −18.35 |
| 10 | −38.26 | −5.73 | −43.99 | +18.32 | −4.25 | +14.07 | −24.26 | −5.67 |
Disclaimer/Publisher’s Note: The statements, opinions and data contained in all publications are solely those of the individual author(s) and contributor(s) and not of MDPI and/or the editor(s). MDPI and/or the editor(s) disclaim responsibility for any injury to people or property resulting from any ideas, methods, instructions or products referred to in the content. |
© 2024 by the authors. Licensee MDPI, Basel, Switzerland. This article is an open access article distributed under the terms and conditions of the Creative Commons Attribution (CC BY) license (https://creativecommons.org/licenses/by/4.0/).
Share and Cite
Mondal, I.; Halder, A.K.; Pattanayak, N.; Mandal, S.K.; Cordeiro, M.N.D.S. Shaping the Future of Obesity Treatment: In Silico Multi-Modeling of IP6K1 Inhibitors for Obesity and Metabolic Dysfunction. Pharmaceuticals 2024, 17, 263. https://0-doi-org.brum.beds.ac.uk/10.3390/ph17020263
Mondal I, Halder AK, Pattanayak N, Mandal SK, Cordeiro MNDS. Shaping the Future of Obesity Treatment: In Silico Multi-Modeling of IP6K1 Inhibitors for Obesity and Metabolic Dysfunction. Pharmaceuticals. 2024; 17(2):263. https://0-doi-org.brum.beds.ac.uk/10.3390/ph17020263
Chicago/Turabian StyleMondal, Ismail, Amit Kumar Halder, Nirupam Pattanayak, Sudip Kumar Mandal, and Maria Natalia D. S. Cordeiro. 2024. "Shaping the Future of Obesity Treatment: In Silico Multi-Modeling of IP6K1 Inhibitors for Obesity and Metabolic Dysfunction" Pharmaceuticals 17, no. 2: 263. https://0-doi-org.brum.beds.ac.uk/10.3390/ph17020263